1. Introduction
Regardless of the energy sources taken into account, there will always be controversy regarding the viability of a particular solution. Nevertheless, if we discuss the renewables sector, one of the biggest challenges is probably related to the intermittency of the natural sources that may significantly fluctuate over various time intervals and geographical areas. The coastal areas represent one of the best regions for the implementation of renewable projects, given the possibility of accessing multiple sources of energy. For example, they are suitable for the development of wave farms [
1], provide the conditions for the implementation of large offshore wind projects [
2] or the possibility of using solar power to support the tourism industry [
3]. More than this, it is considered viable to develop mixed projects that combine conventional energy sources (such as oil, coal or natural gas) with renewable ones, or to capture two renewable sources from a single location. The combination of wind and solar seems to be the most frequent one; this being the case of Hassan et al. [
4], who combined these two resources with a diesel power source for some rural areas in Iraq; or as in Santos et al. [
5], where the impact of the two resources was evaluated for Brazil (onshore). As for the offshore areas, the wind and wave resources are strongly related, this aspect being reflected in Rusu and Onea [
6] from a global perspective.
In the case of marine areas, it is expected to obtain more promising results from the development of the mixed wind-wave projects, taking into account that the offshore wind sector is a mature one, while the wave sector has the potential to obtain similar performance [
7,
8]. From this perspective, in the work of Perez-Collazo et al. [
9] a comprehensive evaluation of the most relevant concepts was provided, highlighting at the same time the advantages emerging from a joint project, such as cost reductions, strong synergies, shared logistics, better predictability or coastal protection opportunities. Some other works are dedicated to the development of the wind-wave concepts, that are basically using the wind turbine supporting structure (monopile or semi-submersible platform) in order to add a wave energy converter (WEC). This is the case of Kamarlouei et al. [
10], who developed and tested a 1:27 prototype model, or that of Hu et al. [
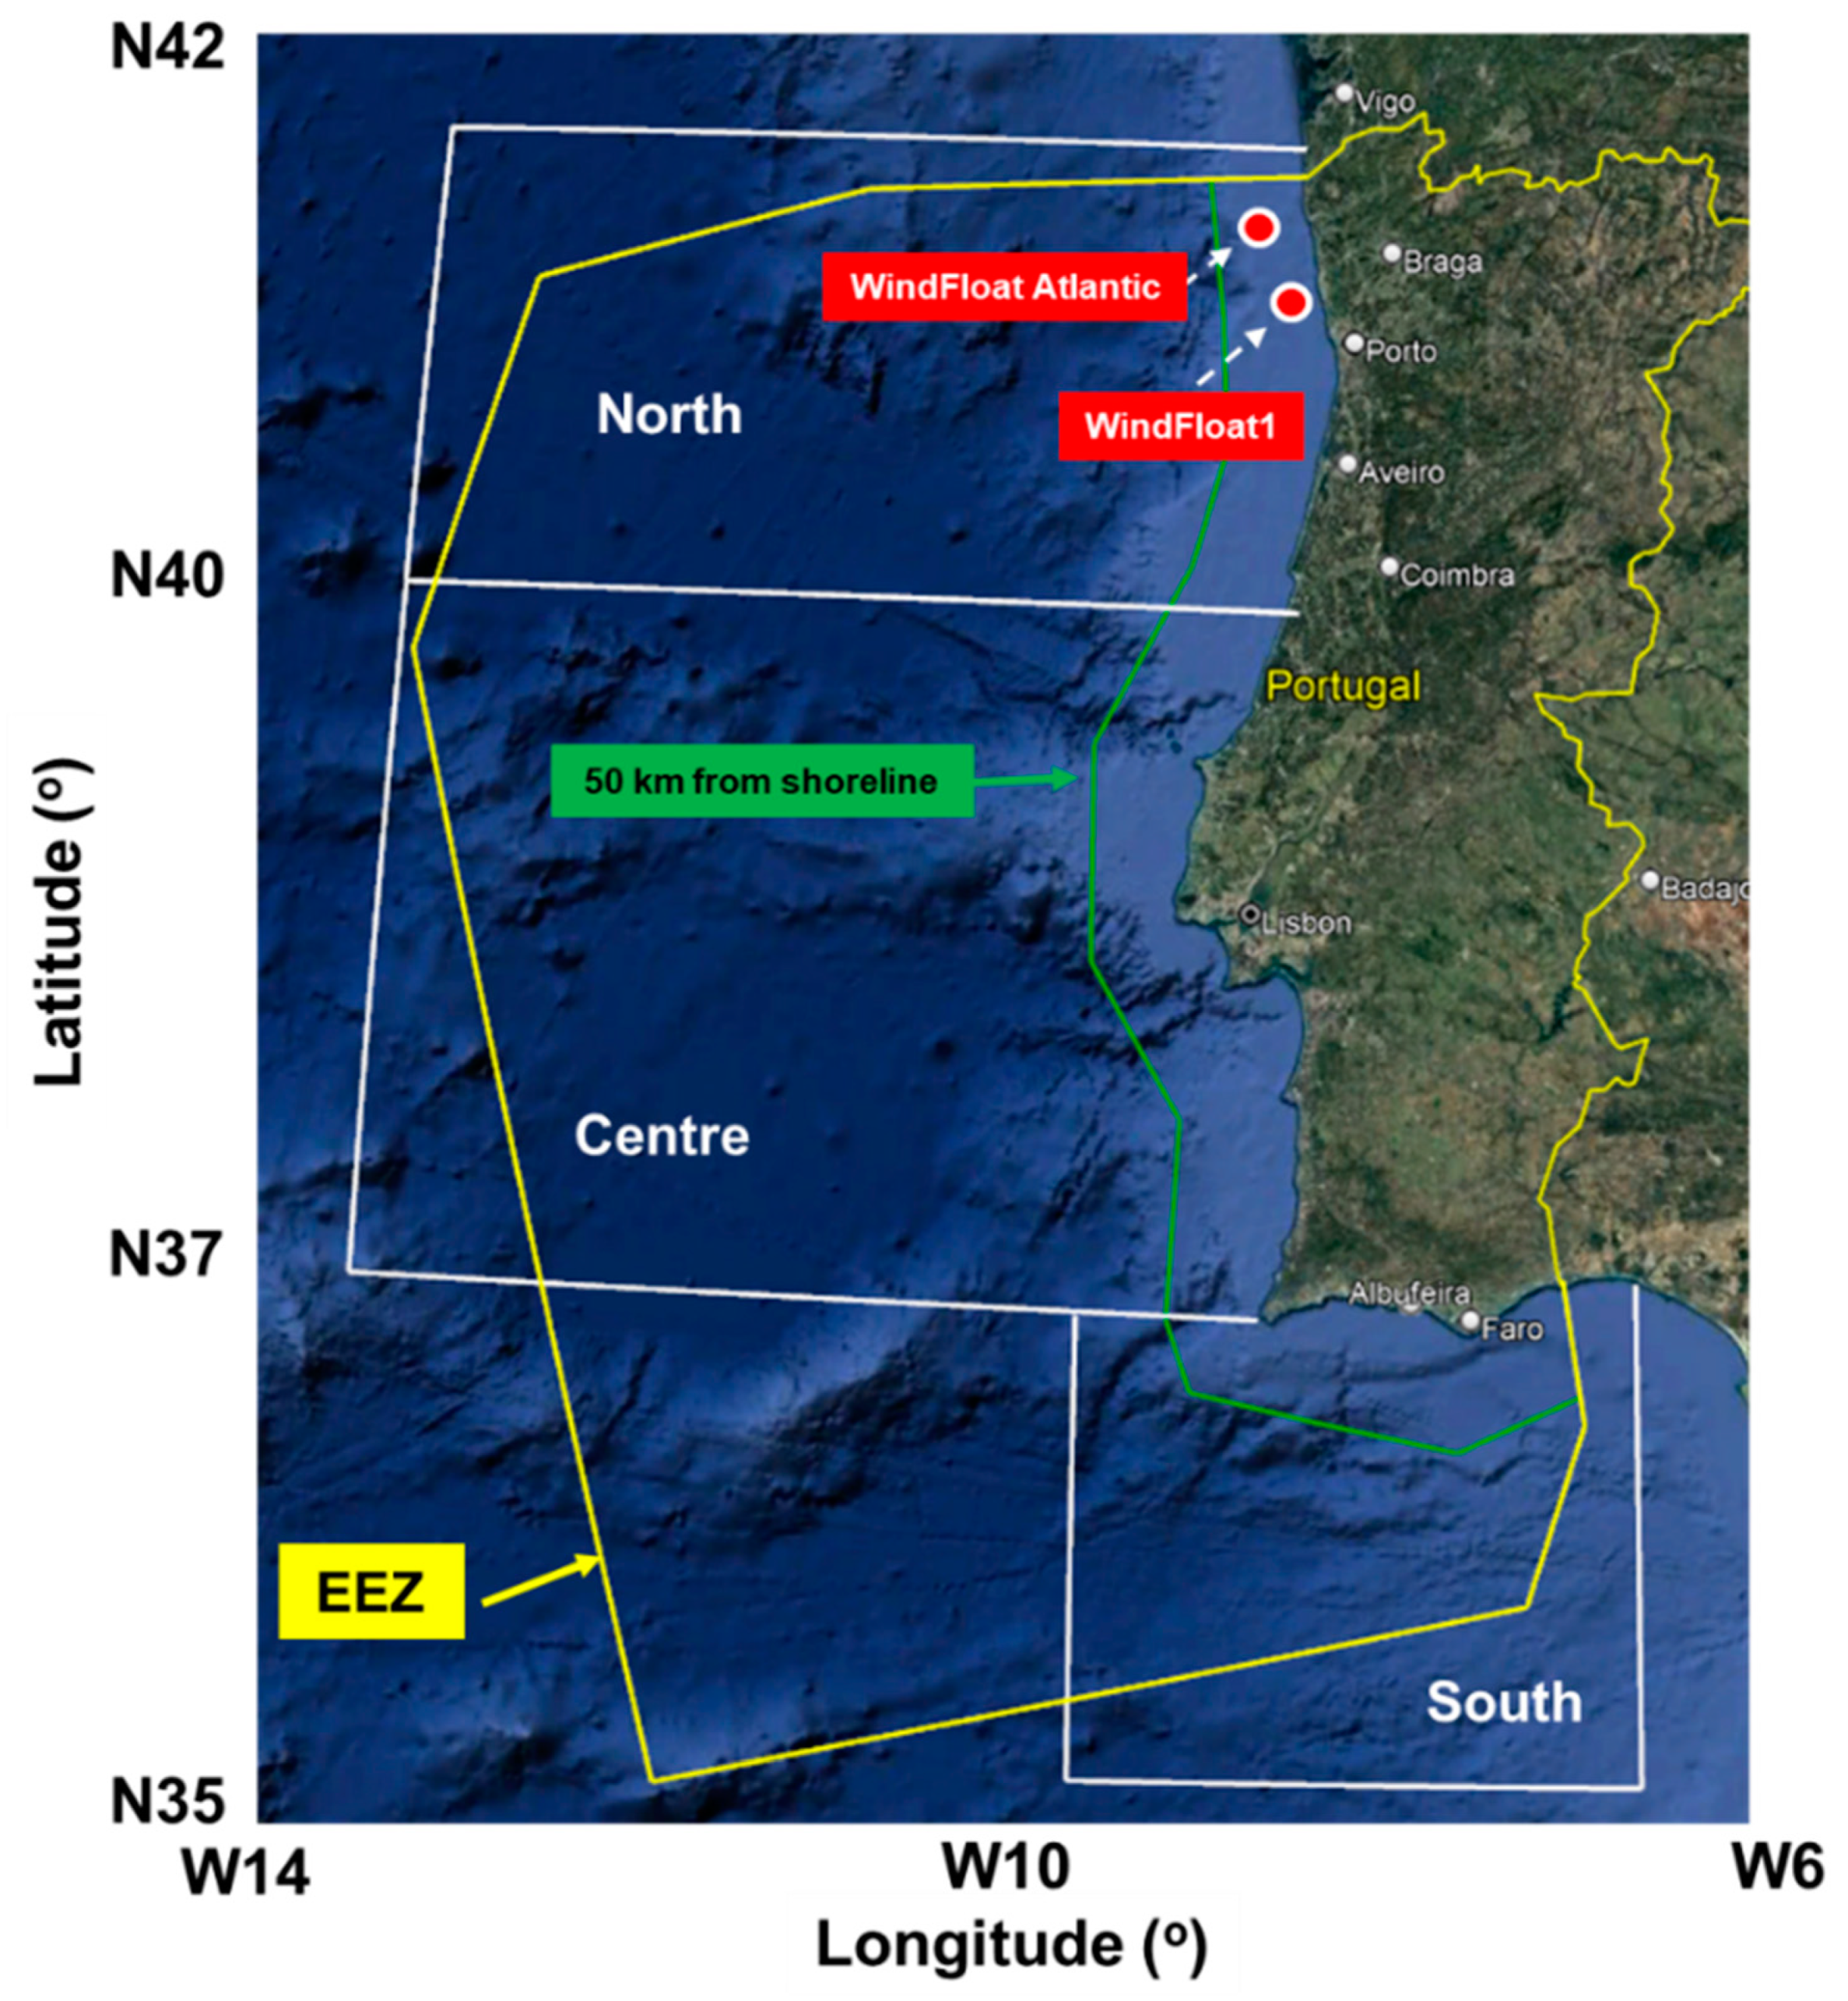
11] which involved the numerical analysis of a large scale WindFloat system coupled to several WEC configurations. The WindFloat concept is designed around a floating triangular platform capable of supporting a wind turbine designed to operate in offshore areas. This project is operational [
12], being implemented in several European sites, such as Kincardine (UK)—50 MW capacity; Erebus (UK)—96 MW; Golfe du Lion (FR)—30 MW; WindFloat Atlantic (PT)—25 MW; WindFloat1 (PT)—2 MW, decommissioned in 2016.
During recent years, the idea of using floating solar panels has gained attention. As mentioned in Hooper et al. [
13], several marine designs were proposed, from which we can mention circular structures, hydro-elastic membranes, pontoons or light structures. It is important to mention that due to the natural cooling, a solar panel located at sea may increase its electricity production by 13% compared to a similar one located onshore. There are projects already being developed in shallow waters in the Maldives, North Sea or Abu Dhabi, that are expected to gradually expand to offshore areas [
14].
More ambitious projects are targeting the developments of hybrid offshore renewable solutions that combine solar, wind and wave resources. This is the aim of the EU-SCORES (European Scalable Offshore Renewable Energy Sources) project [
15], that involves several partners from Europe (for example TU Delft) and has a budget of EUR 45 million. According to the authors, the purpose of this proposal is to accelerate the energy transition in the EU (European Union) community and also to connect the academic and industrial partners involved in the renewable sector. The idea of using these three resources is not new, having already been discussed for some other coastal areas, such as in the US [
16] or already tested by the start-up Sinn Power [
17].
The target area considered in this work is related to the continental part of the Portuguese coastal environment facing the North Atlantic Ocean. By looking at the existing literature, we note that the previous works are in general dedicated to the assessment of a single marine resource (solar, wind or wave power). Nevertheless, a good starting point in the assessment of multiple sources is provided in Costoya et al. [
18] that focused on the analysis of the offshore wind and solar energy for the entire Iberian Peninsula. Based on the data related to the CORDEX (Coordinated Regional Climate Downscaling Experiment) and ERA5 (ECMWF Reanalysis 5th Generation) projects, it was possible to provide a complete picture of the local resources for the time interval 2000–2040. In this case, it was found that wind power of 1200 W/m
2 may be expected in the northern part of this peninsula, while for the solar energy, more energetic resources are expected in the south-western part (≈210 W/m
2). The synergy between wind and solar resources was also evaluated, by defining various indicators such as the stability index, energy classification or risk index. At this point, we can mention that in the above work no restrictions were taken into account (e.g., water depth or Exclusive Economic Zone—EEZ) and the performance of a particular generator was not considered. In the work of Onea and Rusu [
19], several scenarios that involve a hybrid wind-wave farm operating in the northern part of the Portuguese continental area (near Porto) were developed. Various aspects were taken into account, starting from the assessment of the natural resources, expected electricity production of some wind/wave generators and finally evaluating also the expected coastal protection induced by such a project. In terms of the capacity factor, the wind turbines present values in the range 26.7–46%, compared to a maximum capacity factor of 29% associated with the wave systems (Wave Dragon). In Fortes et al. [
20], the possible benefits coming from the integration of multiple renewable sources into the Portuguese power sector were evaluated. This work involves several representative concentration pathway (RCP) scenarios that extend until the year 2050, with only the wind resources from the marine areas being considered. Based on these results, it was found that in the medium and long term the offshore wind will be positively affected, being capable of compensating for the expected decline of the Portuguese hydropower and solar photovoltaic (PV) sector. The increase in future wind energy is in line with recent studies that highlighted this tendency for some other European regions, such as the Baltic Sea, that may become a representative hot-spot for the offshore wind sector [
21].
Although the Portuguese environment seems to have significant solar, wind and wave conditions, little attention was given to the synergy between these three marine resources, more important studies being focused on the wind and solar combination for the onshore area. This is the case of Couto and Estanqueiro [
22], that considered combining the existing wind power plants with PV systems, a higher complementarity being noted in the central and northern part of Portugal. According to these results, the onshore area of Portugal is suitable for the development of large-scale hybrid projects. In a similar way, Jerez et al. [
23] performed an analysis for the entire Iberian Peninsula, concluding that the entire onshore area has strong potential for the development of hybrid solar-wind projects. The complementarity analysis of the natural resources represents a relatively new topic as we can see from Jurasz et al. [
24], with more important progress being associated with the interval 2009–2018. From all the studies, only in Kies et al. [
25] was the idea of using the solar, wind and wave power considered in order to cover the energy balance from the Iberian Peninsula. For this geographical area, a significant part of the complementarity analysis is dedicated to the analysis of the solar-wind resources associated with the onshore area of Spain. Definitely, there is interest in the Portuguese marine energy sector, considering that there are plans to develop hybrid wind-wave farms near the locations of Aguçadoura and Viana do Castelo (north of Porto) that may include wave capacities of 10 MW. These investments are made through the EU-SCORES project [
26] that will also include an offshore solar-wind project near Belgium, from which 3 MW will be a PV system. Therefore, the present work aims to provide a better understanding of the correlation between these three marine resources, by using relevant thresholds for the performances of the converters.
In this context, the following research questions will be addressed:
- (a)
Provide a complete picture of the solar-wind-wave resource complementarity in the Portuguese nearshore;
- (b)
Identify some suitable hot-spots for the development of hybrid marine renewable projects;
- (c)
Establish the performances of some renewable generators (solar, wind and waves) operating in the Portuguese nearshore area.
3. Results
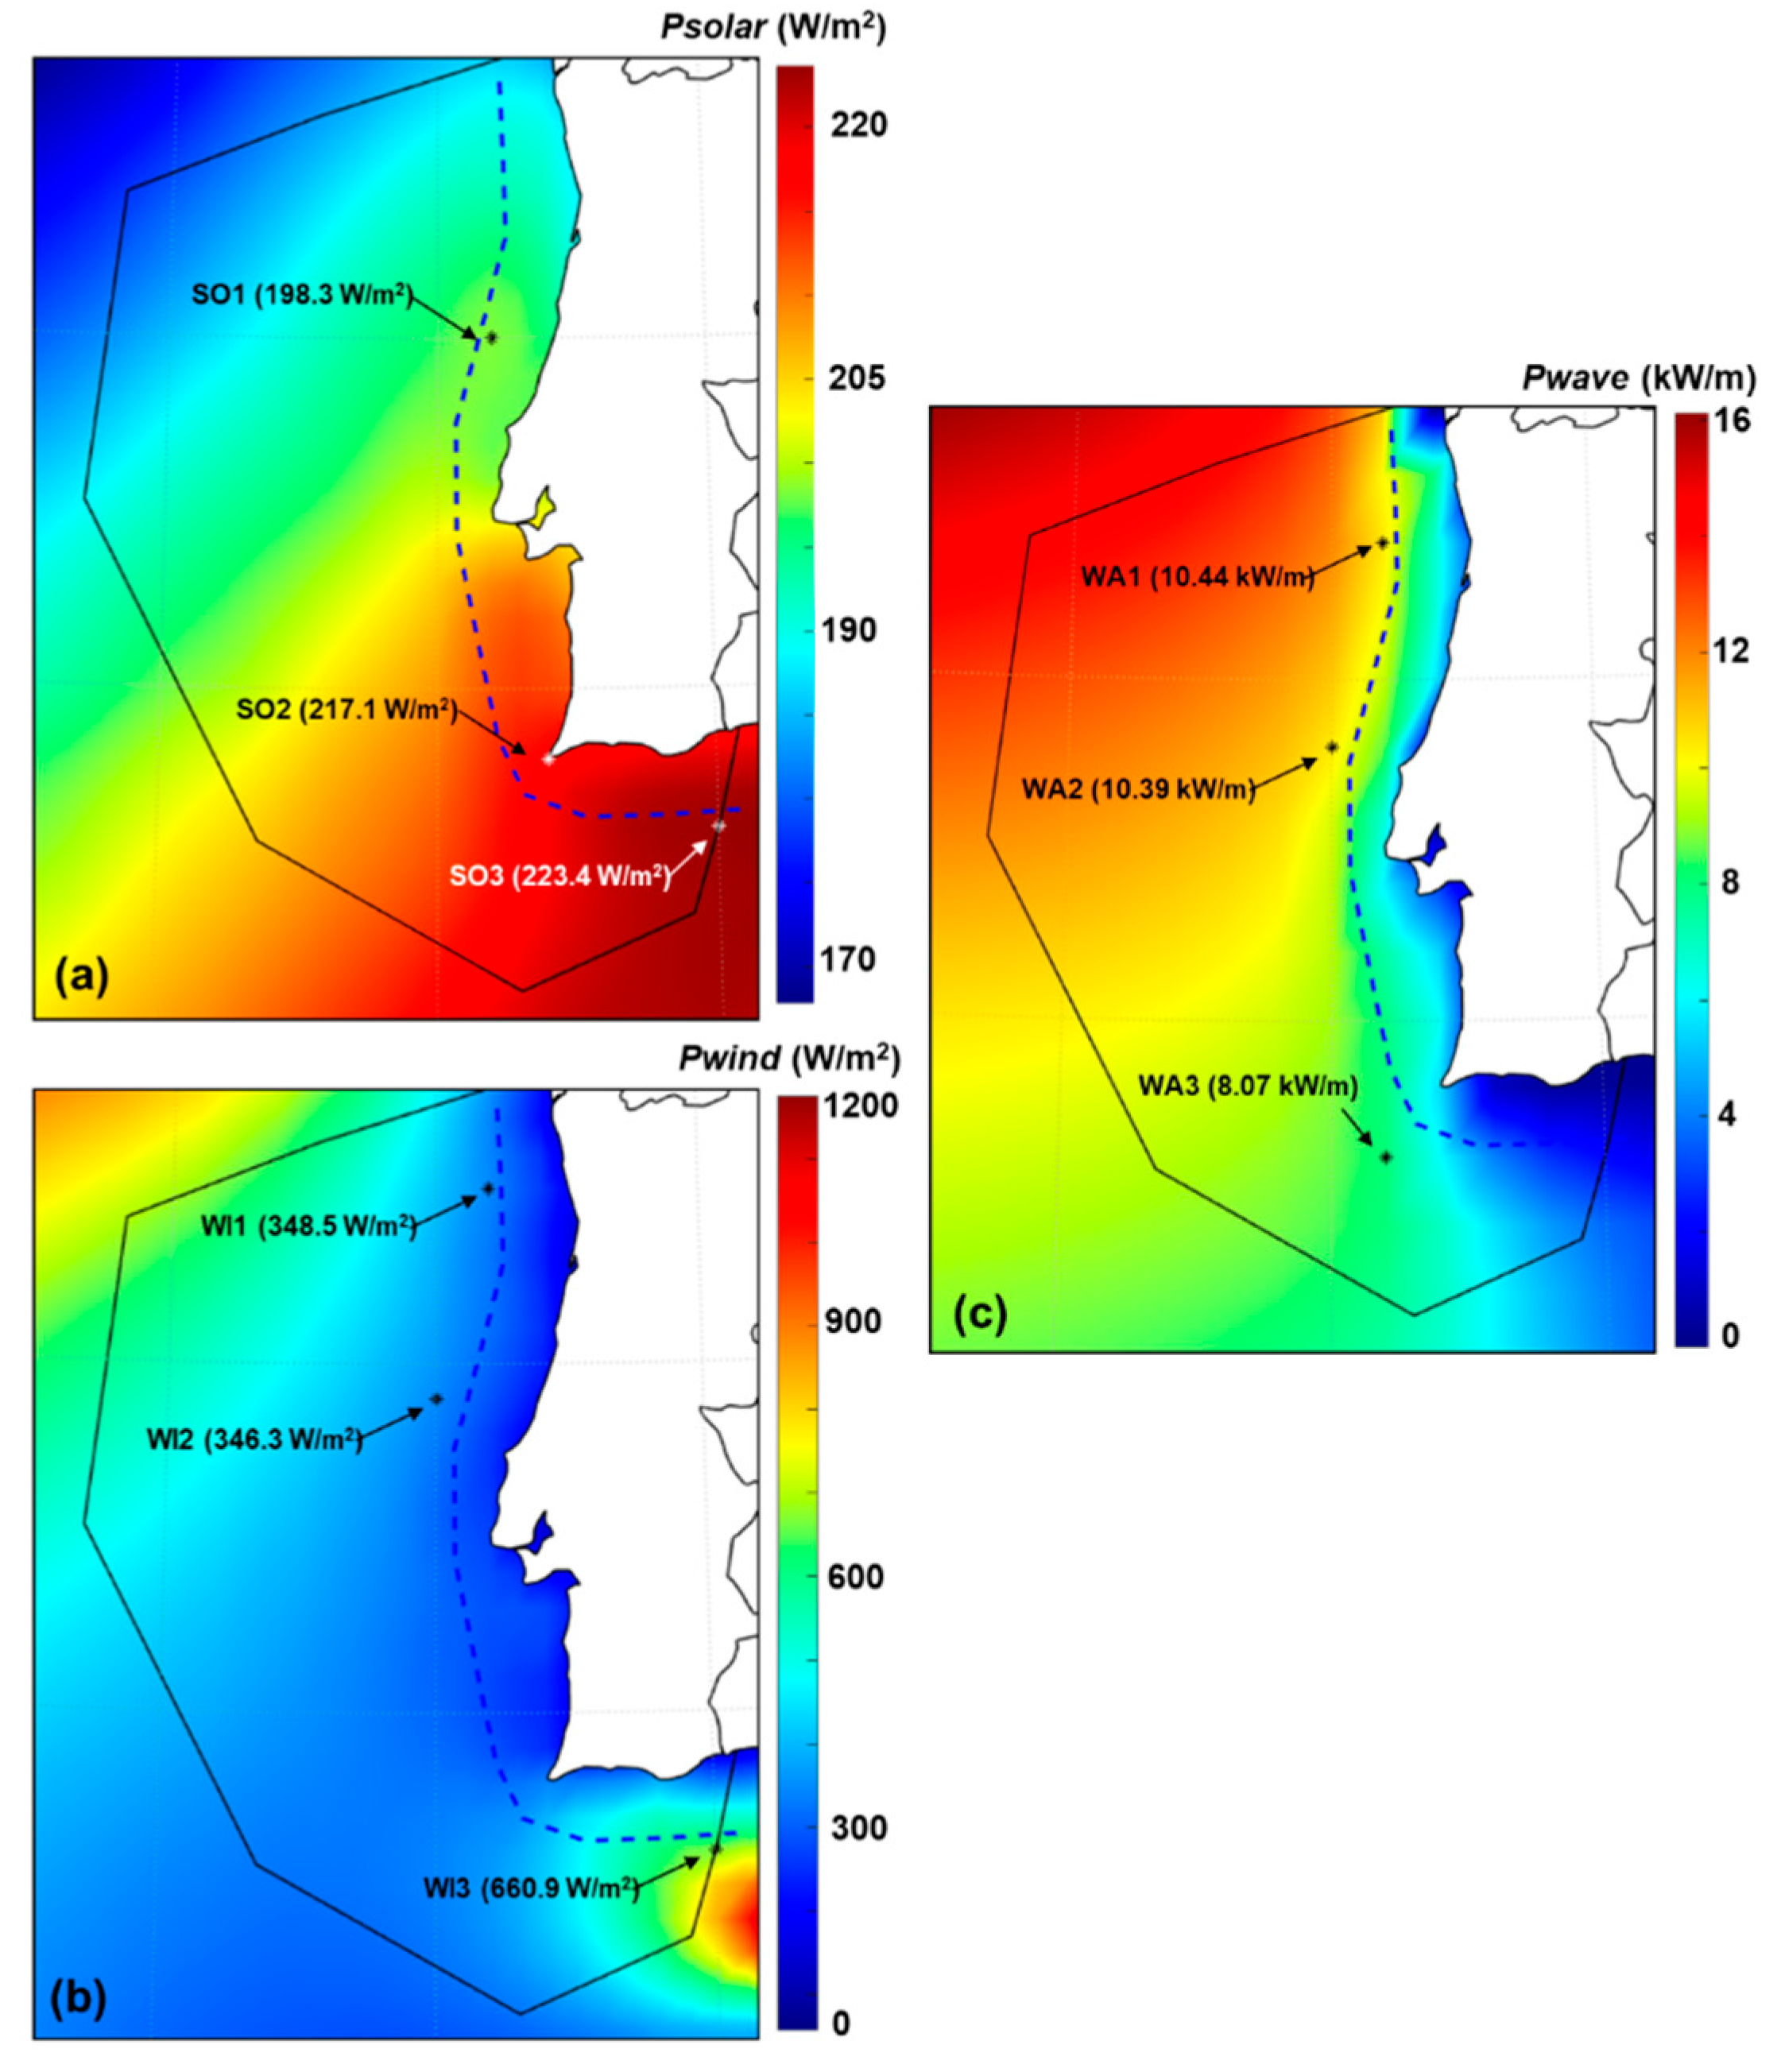
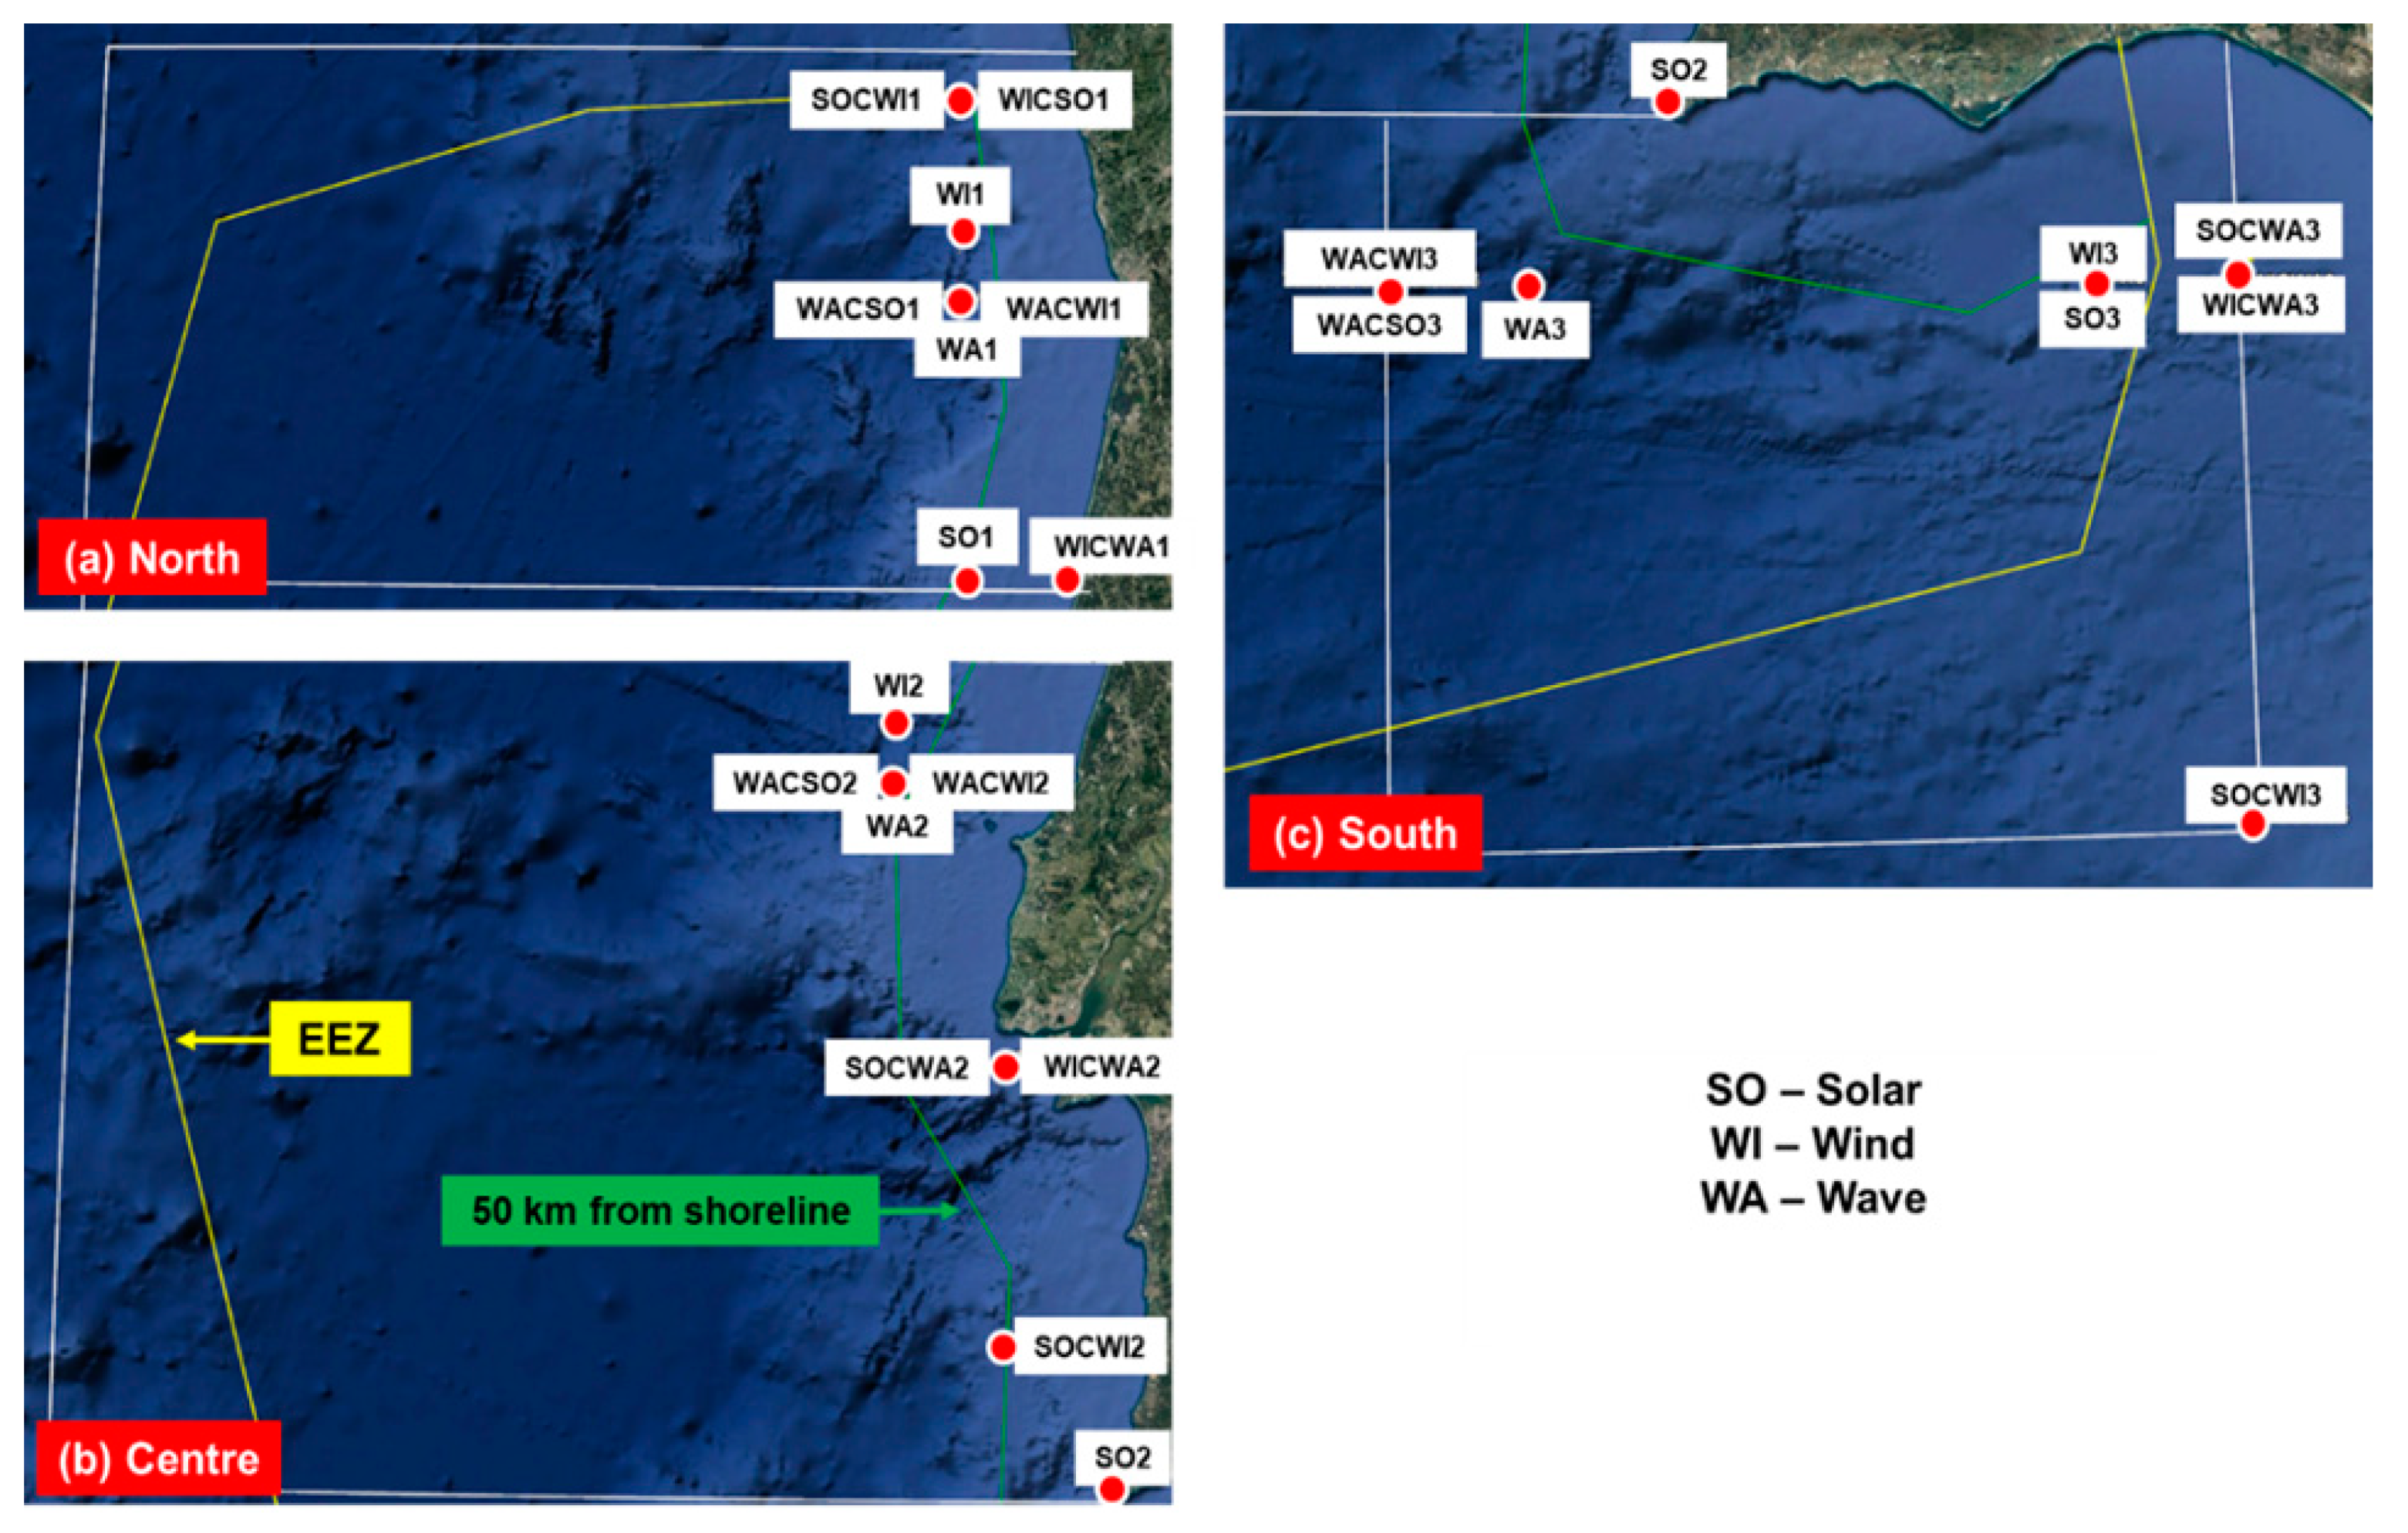
Figure 5 presents the spatial distribution of the natural resources for the entire Portuguese EEZ. The first parameter taken into account is the solar power (
Figure 5a), where the values oscillated between 165 and 220 W/m
2, higher resources being noted in the southern part of the Iberian Peninsula. For each coastal sector (north, center and south) indicated in
Figure 1, some grid points where the energy level was higher are highlighted. These were located in the range of 0–50 km (see dashed line) distance from the shore. The point SO1 (solar 1) was associated with the northern sector and presented a value of 198.3 W/m
2. From this, the solar power increased to 217. 1 W/m
2 (SO2—center) and up to 223.4 W/m
2 in the case of SO3 (south). In the case of wind power (
Figure 5b), the amount of energy was higher compared to solar, a maximum of 348 W/m
2 (north), 346.3 W/m
2 (center) and 660.9 W/m
2 (south) being expected. It is important to mention that the location of the maximum values for solar and wind power from the southern sector was identical (≈7.5° W/36.5° N).
For the wave power (
Figure 5c), the northern and center sectors were defined by a significant decrease in energy near the 50 km isoline, while the southern sector may be associated with lower wave resources that can go up to 8.07 kW/m (WA3). A maximum value of 10.44 kW/m was related to the point WA1, although for the northern sector the average values can go up to 16 kW/m as we reach the western boundary of the EEZ. Near the 50 km isoline, the values associated with the northern and center sectors were quite similar, gradually decreasing as they enter the shallow water areas.
The complementarity distribution between the solar, wind and wave resources is presented in
Figure 6,
Figure 7 and
Figure 8, considering the thresholds associated with the case studies CS1 and CS2, respectively. For solar power, the 5th percentile value related to the Portuguese EEZ was considered to be close to 134 W/m
2.
Figure 6 presents the distribution of the SOCWI/WICSO indicators for the entire Portuguese EEZ, including the 50 km isoline. In the case of the SOCWI index, a maximum of 0.3 (CS1) was associated with the center of the target area, while the southern part of the Iberian Peninsula (Algarve region) was defined by values that could go down to 0.15 (CS1) or 0.22 (CS2), respectively. From the distribution of the WICSO values, we noted that a solar project combined to a wind farm could be successfully implemented up to 50 km from the coastline, especially in the coastal areas facing the North Atlantic (west side). In this case, the values were close to 0.15/0.20 depending on the scenario taken into account, reaching a maximum of 0.4 near the north-western and south-eastern corners of the EEZ.
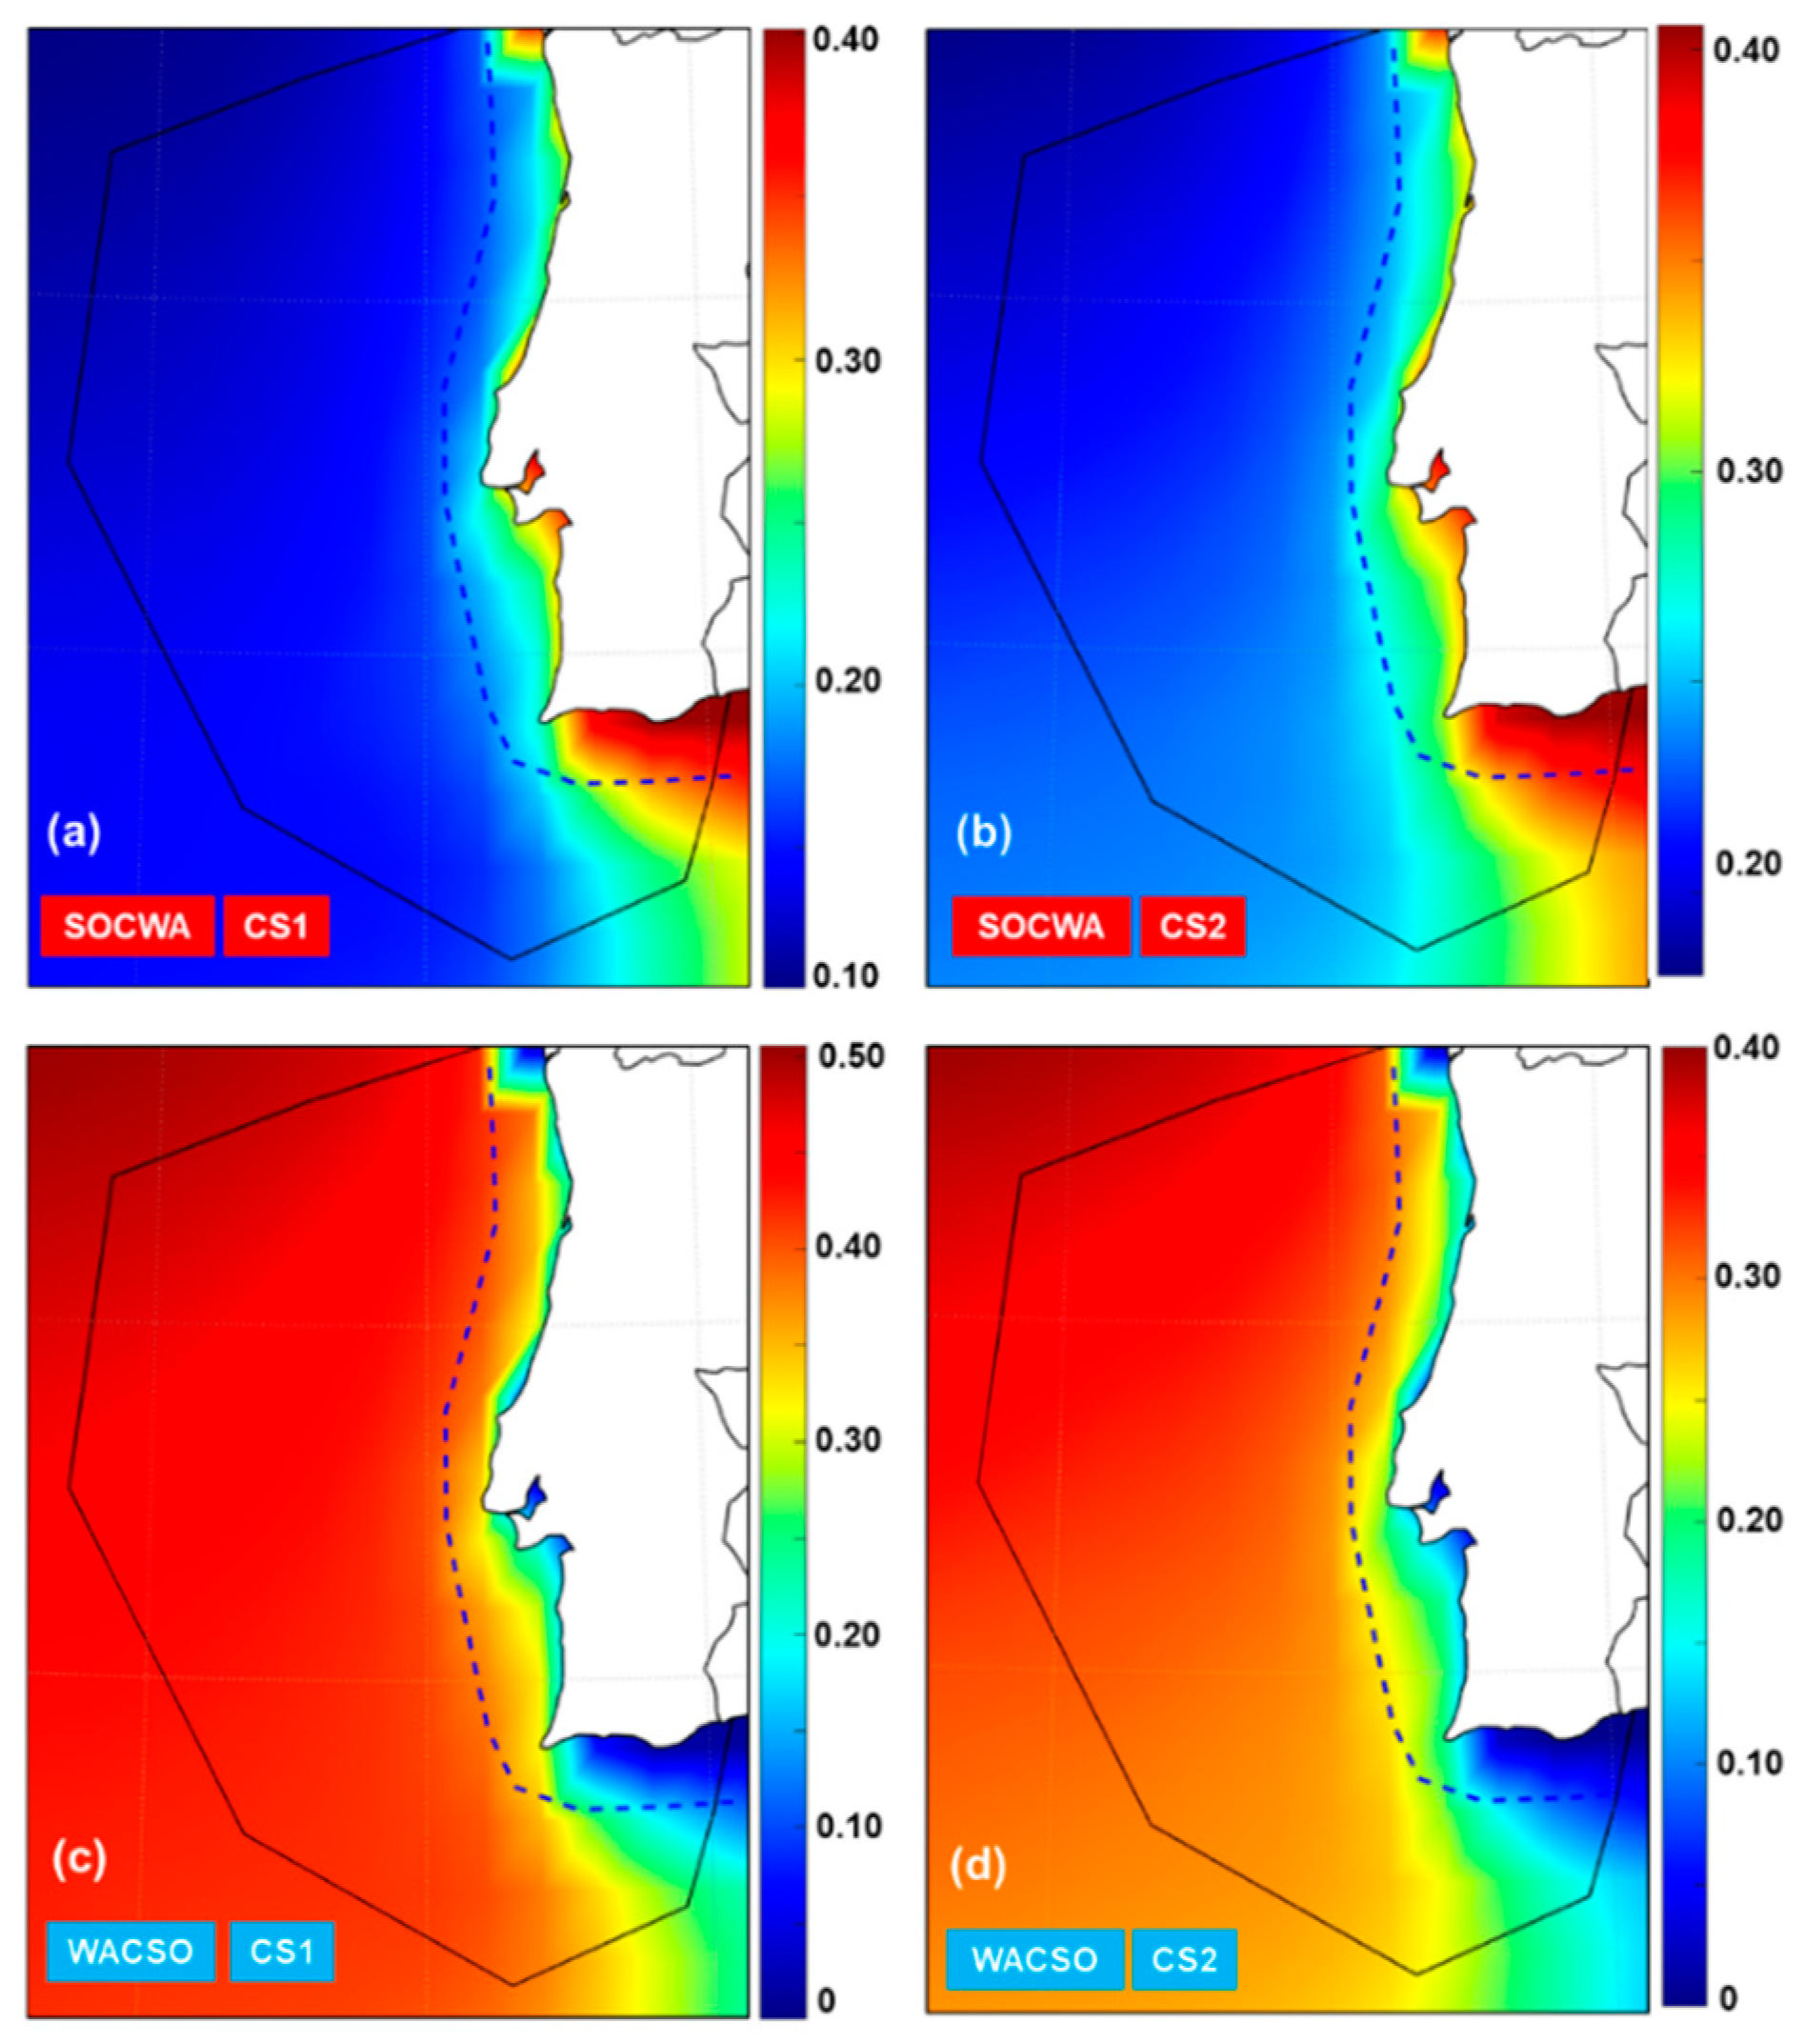
Figure 7 illustrates the solar-wave complementarity. Based on the distribution of the SOCWA index (
Figure 7a,b), it was observed that a successful hybrid project could be implemented outside the 50 km isoline (values << 0.20), preferably in the northern sector, an aspect that was better highlighted by case study CS2. For the Algarve region, maximums of 0.4 were observed in both case studies, suggesting that only a floating solar project would be more competitive. In the case of WACSO values, only a wave farm project is recommended outside the 50 km isoline (values ≥ 0.40), while a joint wave-solar project may present some interest for the southern sector (values ≤ 0.10).
Maybe, the most interesting results are related to the WICWA index (
Figure 8a,b), highlighting that a wind-wave project built around the wind sector, could be successfully implemented for most of the Portuguese EEZ (values ≤ 0.15), excepting the Algarve region (south) where the wind component alone would be more promising. The WACWI values (
Figure 8c,d) are in general above 0.30, lower values (>0.10) being expected in the eastern part of the Algarve region.
Based on the information provided in the previous spatial maps, the locations of the highest values associated with the natural resources and solar-wind-wave complementarity are identified in
Figure 9.
Most of the points are grouped along the 50 km isoline; it should be noted that several indicators share the same location. For example, in the case of the north sector the SOCWI/WICSO share the same locations, a similar situation being expected for the WACSO/WACWI/WA indicators. As for the central sector, these indicators are grouped as WACSO/WACWI/WA or SOCWA/WICWA, respectively. The best sites, in terms of wind and solar power, are located in opposite areas (north and south extremities). For the southern sector, only a wave farm is recommended for the site marked by WACWI/WACSO values, while a wind-solar project may be successfully implemented on the eastern part of the EEZ, close to the 50 km isoline.
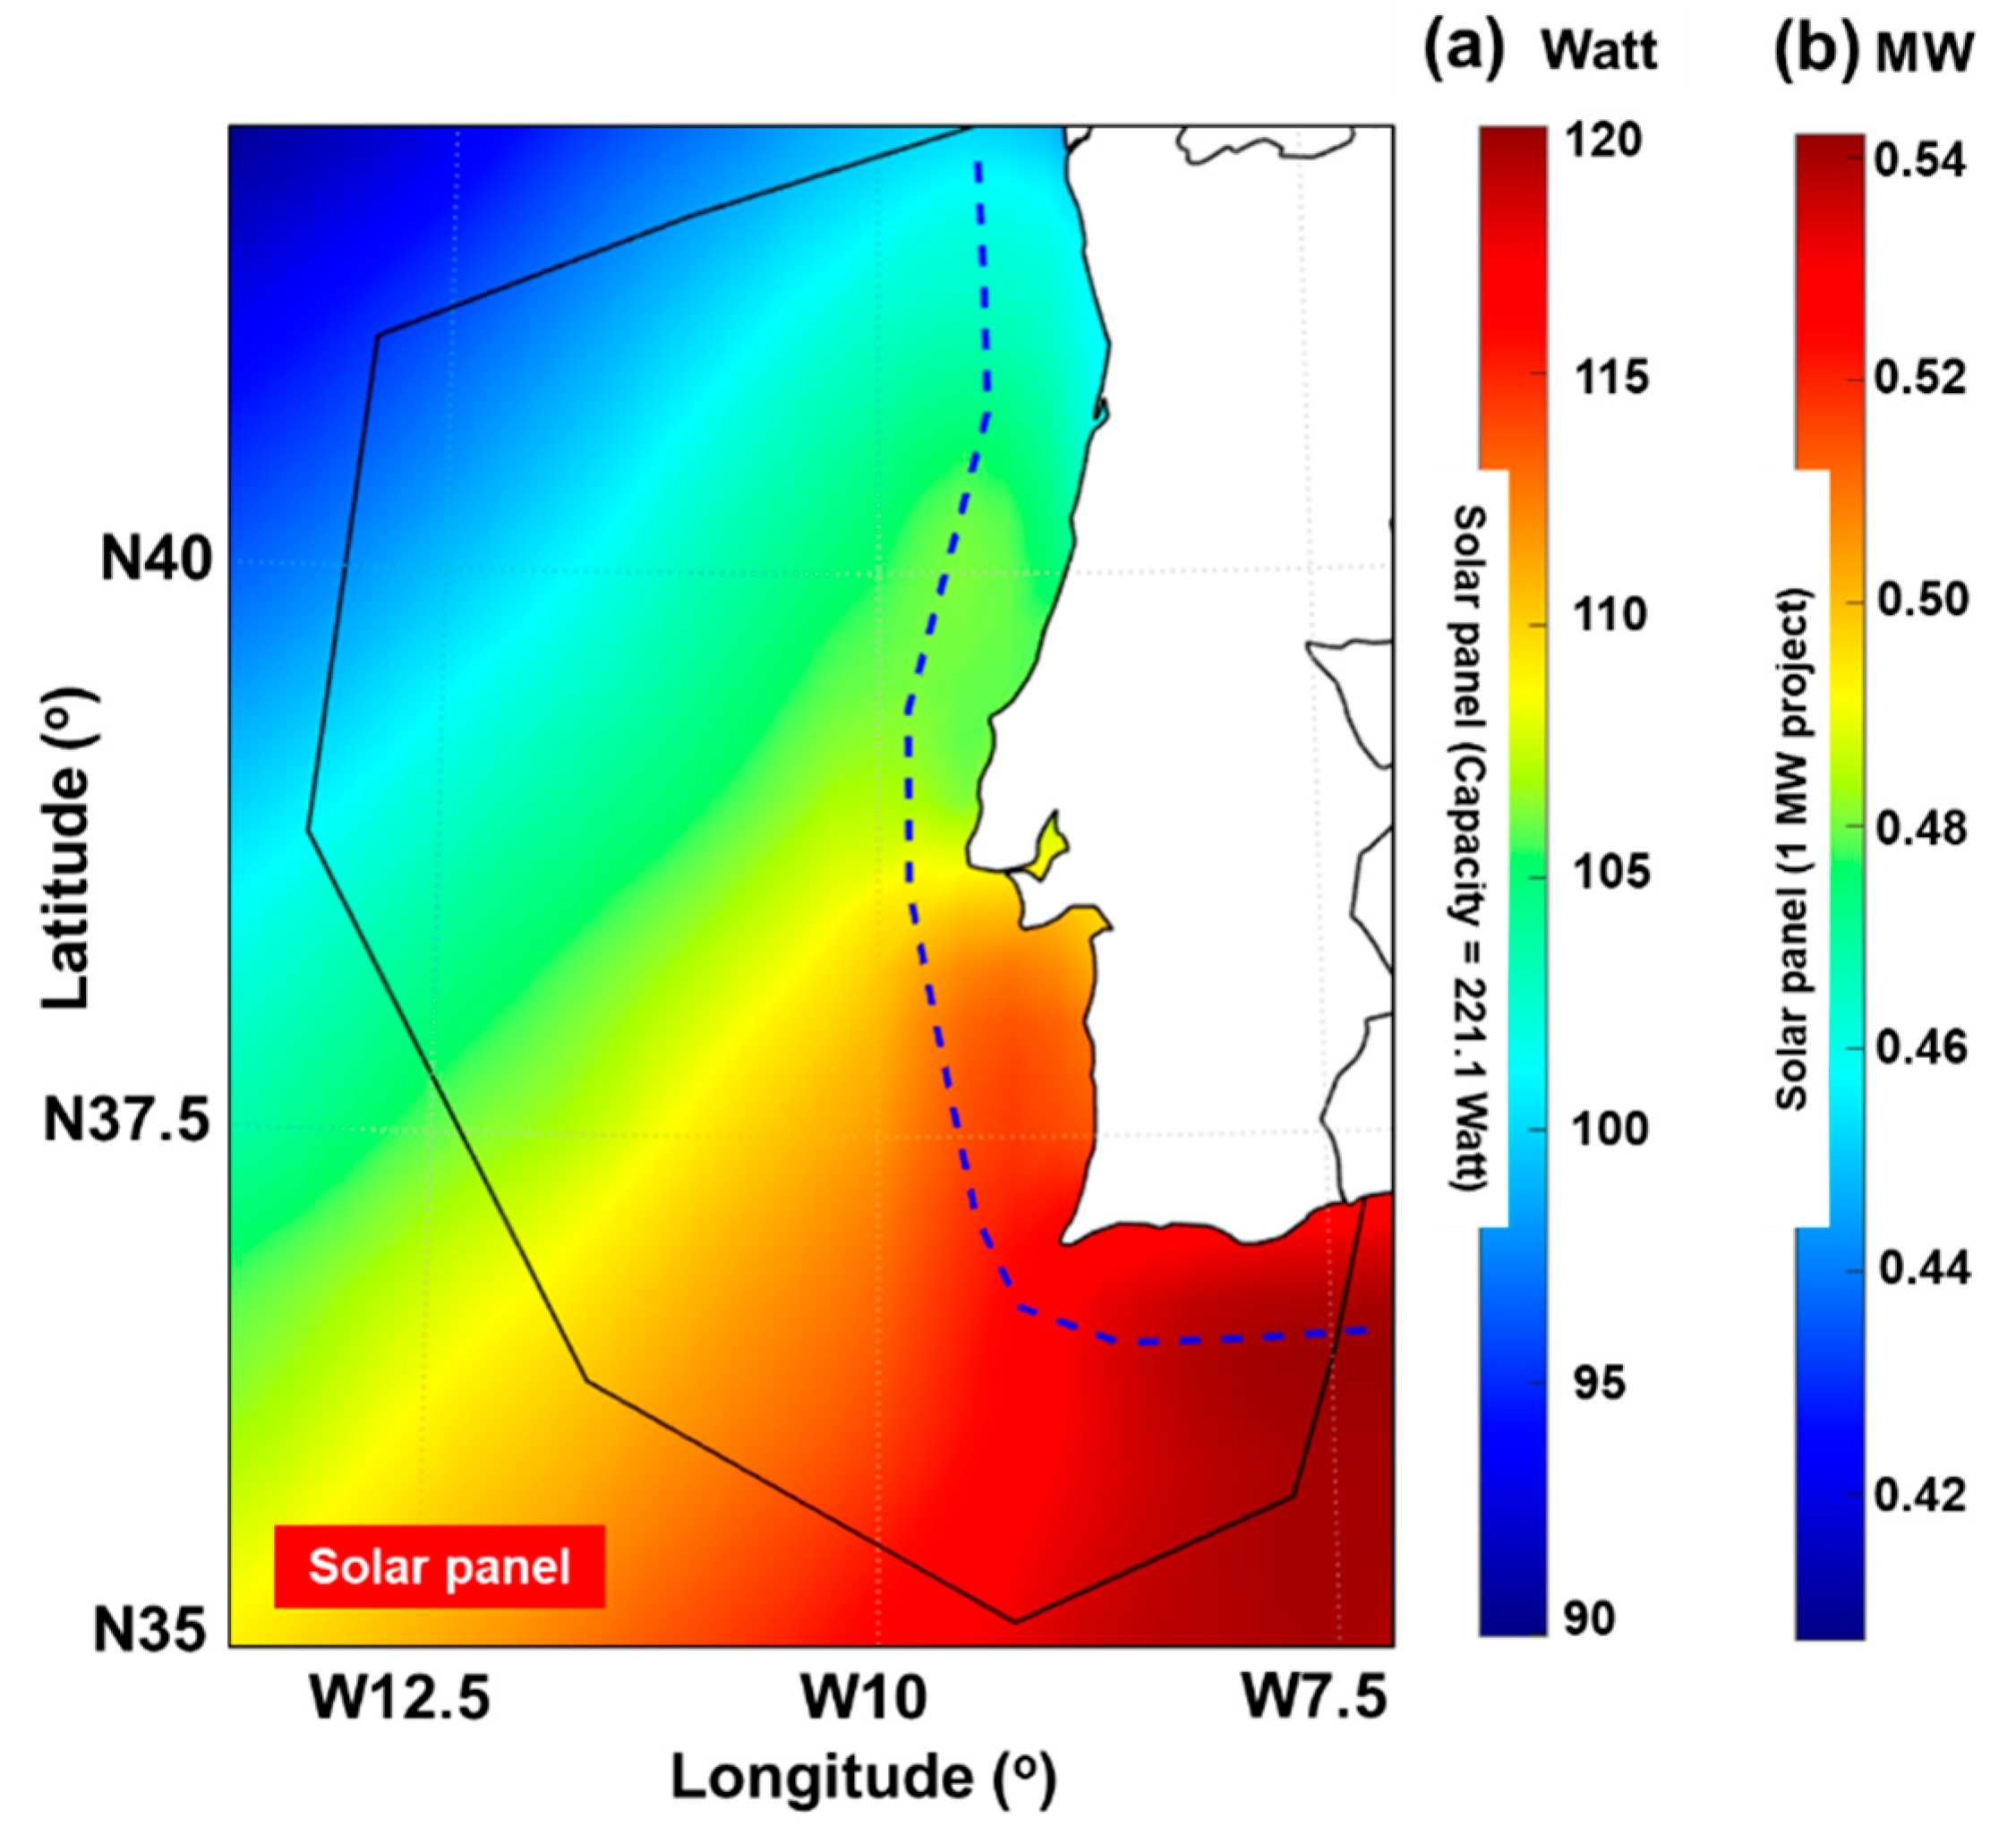
As a next step, the expected power output related to each system (solar, wind and wave) was computed. The performance of a single unit rated at 221.1 Watt and covering a surface area (2 m
2) is provided in
Figure 10a, while the legend associated with
Figure 10b is related to the expected performances of a 1 MW project (≈4523 panels/0.009 km
2). Taking into account that the inter-turbine spacing between offshore turbines may vary from 5 to 20 rotor diameters [
41], it appears that the proposed scenario is feasible. As expected, better performances were associated with the southern sector where a maximum power output of 120 W (*single unit)/0.54 MW (**1 MW project) may be expected. These values gradually decreased as we went to the northern sector (offshore), reaching minimums of 90 W* and 0.42 MW**, respectively.
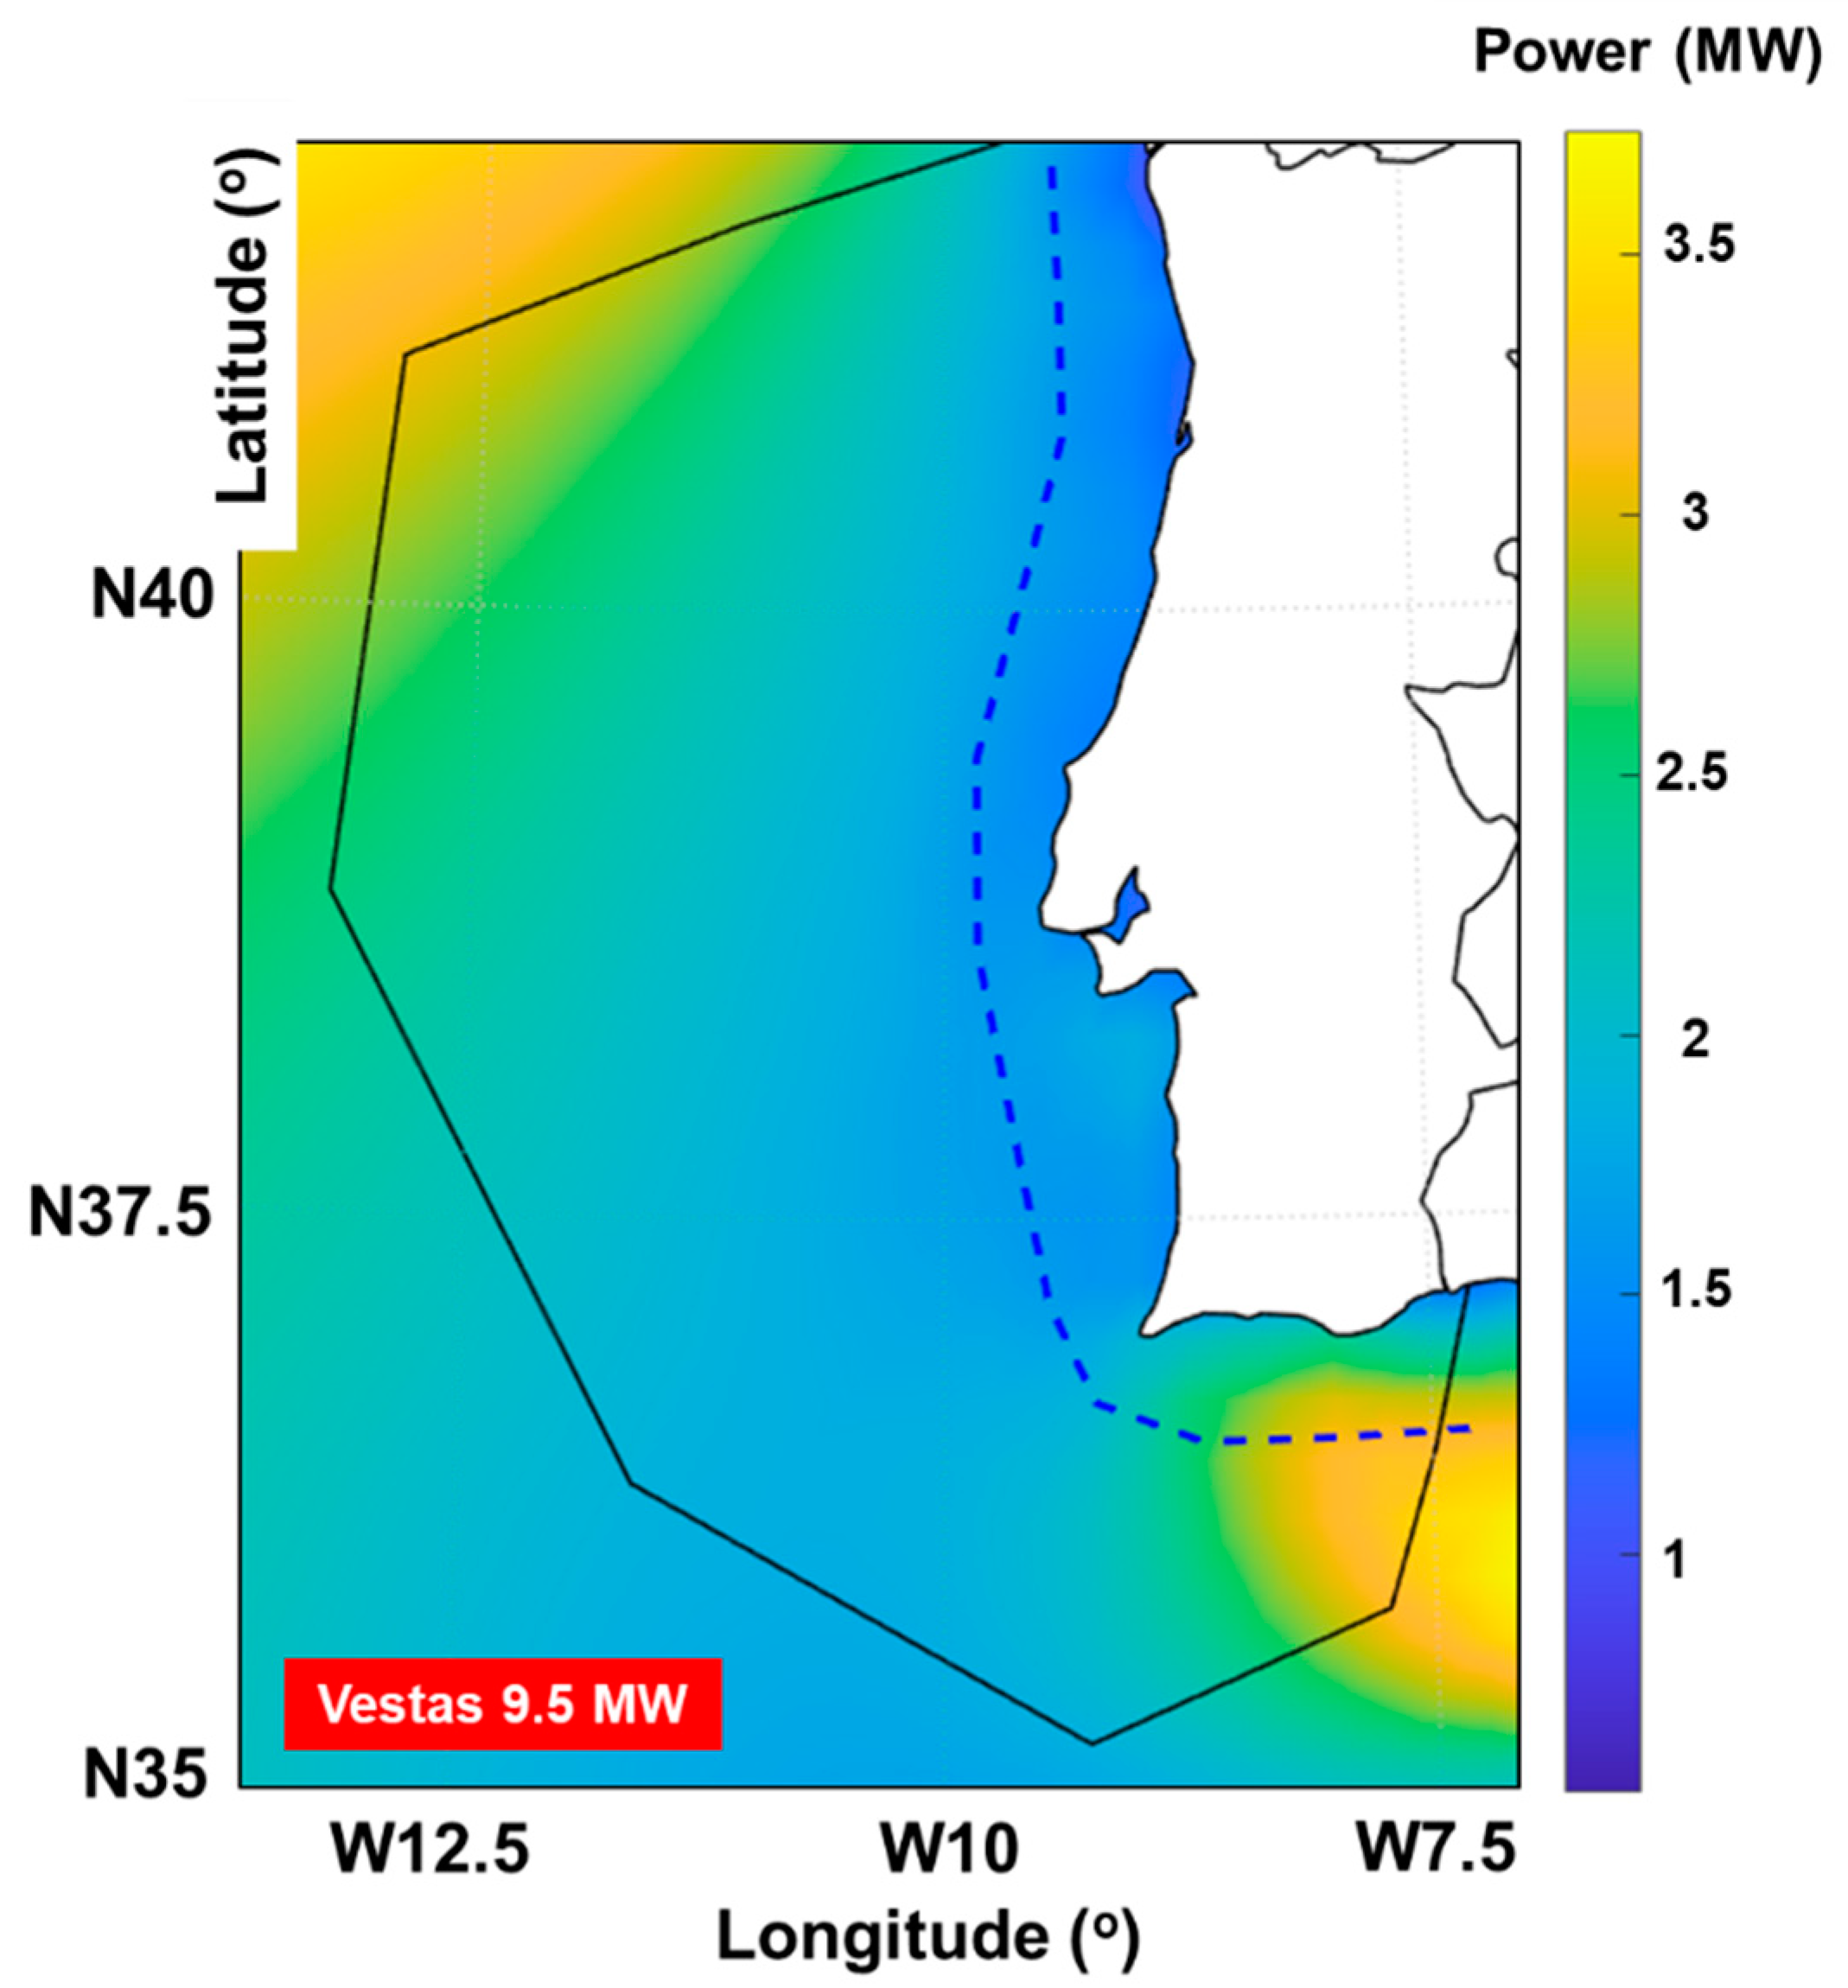
Based on the information associated with the power curve of the Vestas Offshore V164-9.5 MW (described in
Figure 3),
Figure 11 provides the expected power output of this system, by considering a reference hub height of 100 m. Maximum values of 3.5–4 MW are indicated for the northwestern and southeastern regions, while close to the 50 km isoline, the values are close to 1.5 MW, associated with an average capacity factor of 16%. For the southern area (Algarve region), the capacity factor may increase up to 31% near the 50 km isoline.
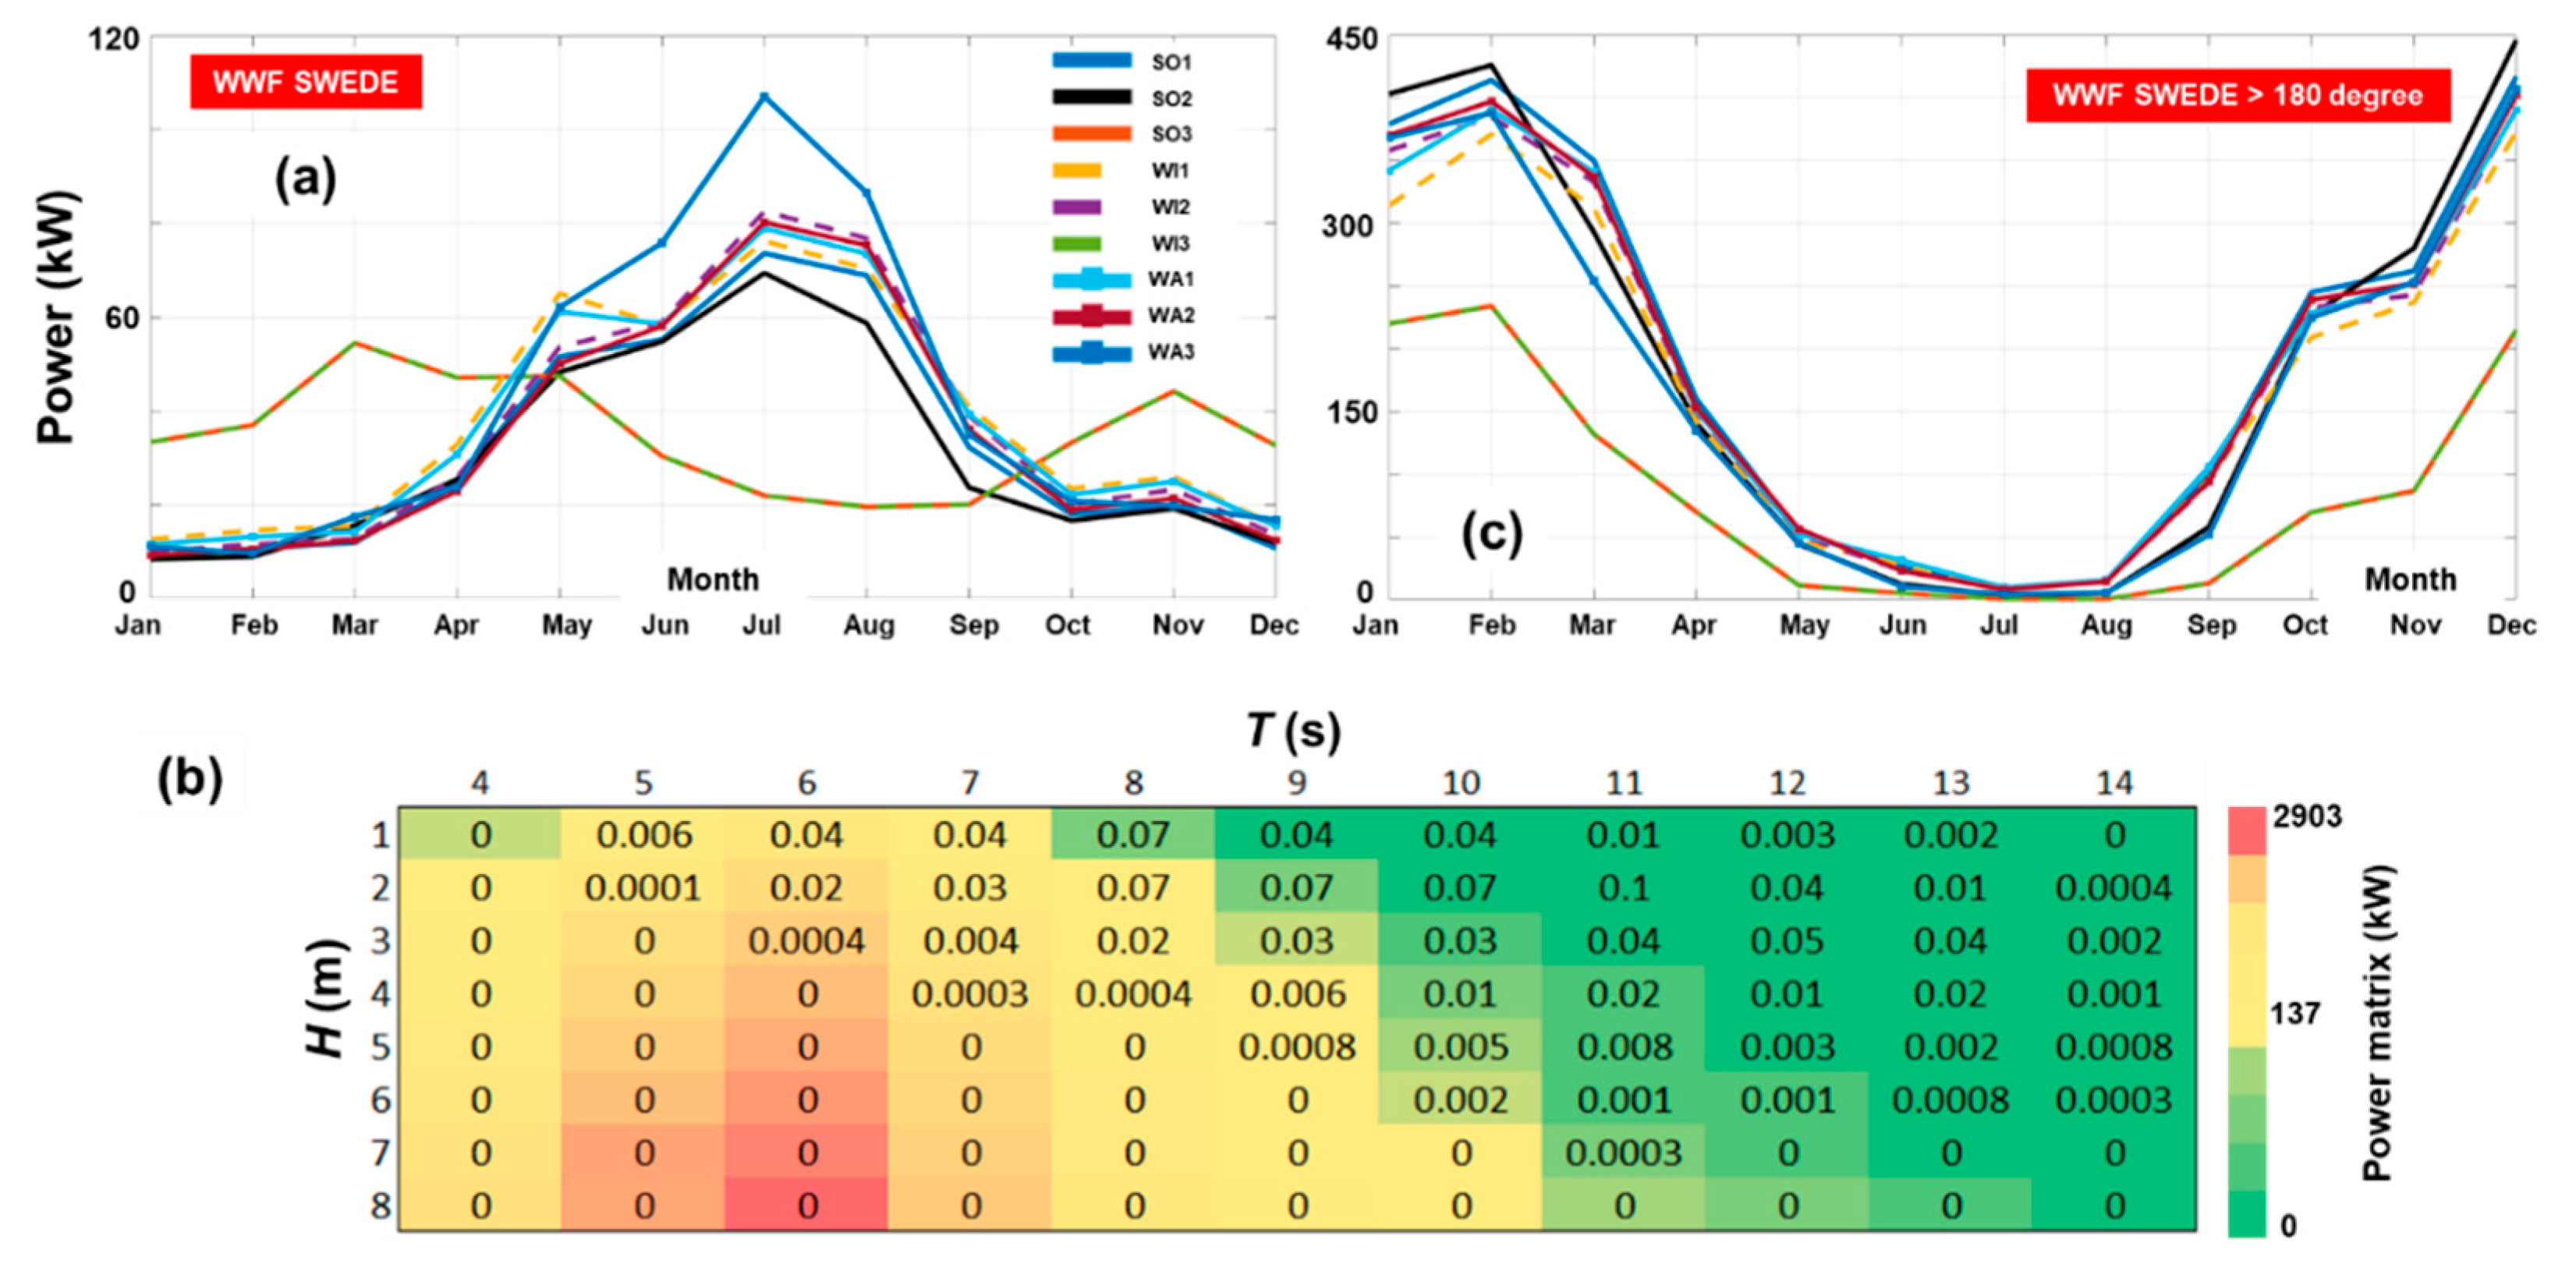
The expected power output of the SWEDE wave generator is indicated in
Figure 12a, considering, this time, the reference sites SO, WI and WA, as indicated in
Figure 9. We can see that better results are expected during the summertime, when a maximum of 107 W is related to July. In this case, the maximum capacity factor of this system is close to 4%, which is quite small for a renewable system.
Figure 12b provides a possible explanation of this performance, by considering a winter month (December, in this case). By looking at the power matrix of the SWEDE system (colored scale) and at the bivariate distribution of the
Hs and
Te values (as percentages) we notice that the proposed WEC never generates power from the area where the rated power output (2903 kW) is located. In the case of the wave conditions, a distribution of 10% was noted for the bin 2 m/11 s, that would have no contribution to the total power output.
A characteristic of a WEC system is that it can be adjusted for a particular wave climate in order to obtain better performance [
42,
43]. Since no optimization studies were proposed for the SWEDE system, we considered flipping the power matrix of this WEC around its main diagonal, in order to provide a better fit with the local sea state distribution. The results obtained are presented in
Figure 12c, where we noted that the general pattern changed, with better performances being noted during the wintertime (e.g., 446 kW in December). Even after the flipping of the power matrix, the increase in power was not very high, being associated this time with a maximum capacity factor of 15.3% which looked more promising compared to other WECs [
44]. During the interval July–August, the modified WEC is expected to have no power output, which would make it less attractive for the implementation of a wave farm.
4. Discussion
The reanalysis data represent one way to assess the distribution of the natural resources over large geographical regions. In this connection, the ERA5 data is frequently used to assess the marine conditions from the vicinity of the Iberian Peninsula. In Costoya et al. [
18], a total of 27 years of ERA5 solar/wind data were used to validate the data related to the CORDEX project that were further used to assess the near-future expectations for the interval 2000–2040. By looking at the distribution of the annual solar power (mean values), similar values were noted with the present work, with a maximum of 210 W/m
2 near the Algarve region. In terms of the wind power, a similar spatial pattern was observed with a maximum of 1200 W/m
2, the authors highlighting the northern part of the Iberian Peninsula as presenting more consistent resources. Nevertheless, the work of Costoya et al. [
18] was dedicated only to the western part of the Iberian Peninsula, and missed the southern part (Algarve sector) that seems to present important solar and wind resources. Some other works based on the ERA5 data, where complementarity between multiple sources of marine data can be found, are: Kardakaris et al. [
36]—wind and wave (Greek Seas) or de Souza Nascimento [
32]—wind and solar (Brazil offshore). If we are discussing the Iberian Peninsula, it is worth mentioning the work of Lopez et al. [
45], where a combined analysis of solar and wind power was made for the Asturias region (Spain). Along with the assessment of the natural resources, the performances of some PV panels were considered, the rated power being in the range 280–325 W. In Campos and Guedes Soares [
46], a detailed investigation of the Portuguese offshore wind resources was performed for the time interval 2009–2013, based on a mesoscale atmospheric model that had a better grid resolution (0.081° × 0.097°) than in the present work. For that study, the wind power (
U80 values) rose to 900 W/m
2 in the northern part, compared to a maximum of 800 W/m
2 noted in the present work (for the same region). Another important difference is related to the southern area (Algarve), where the compared study indicated this region as being less energetic (compared to the north) with values that did not exceed 500 W/m
2. In this work, in the southern extremity, a hot-spot was observed in terms of wind power that affects the local distribution (
Pwind = 1200 W/m
2); in the absence of this extreme value the expected wind power field was located in the range 300–500 W/m
2. In future work, this aspect needs to be investigated in order to highlight the seasonal and inter-annual fluctuations of the wind conditions.
The complementarity analysis represents an important objective of the present work and therefore for the wind and wave conditions, several thresholds were considered based on some previous published studies [
35,
36]. By looking at the Greek Seas (the CS1 scenario), the WACWI index may reach a maximum value of 0.5, compared to only 0.1 that is associated with the WICWA. Compared to these values, the two indices are rated above 0.3 for the current work, regardless of the scenarios taken into account. In the work of Wen et al. [
35] associated with scenario CS2, the WICWA index processed for the southern coast of China could go up to 0.6, while for the more dominant WACWI index, the values were located below 0.2.
Regarding the performance of the solar-wind-wave generator, probably the most interesting results are related to the SWEDE wave generator, which can be considered to be very low. Probably, this should be expected from a WEC system that was only tested in the wave tank (regular waves). More than this, even the authors of the provided study [
38] admitted that the proposed WEC solution would not make a great contribution to the reduction of the levelized cost of energy (LCOE), since the wave generators would generate a lower amount of energy compared to a wind turbine. Per total, it can be considered that the SWEDE system has poor performance, regardless of the scenario taken into account (original and flipped matrix). According to the information provided in
Figure 12b, we note that the peak values of this WEC need to be located in the range 8–11 s (for
Te) and more important in the interval 1–3 m (for
Hs). The SWEDE concept is defined by a single peak value, which could be considered a drawback compared to other wave generators. For example, by looking at the power matrices of some other WECs [
40], we find that the peak value is distributed over a range of
Hs/
Te bins, this being the case of Pelamis, AquaBuoy or Wave Dragon. Since the points SO, WI and WA are located relatively close to the shoreline area, the wave power will be significantly reduced, which brings into discussion their viability for a wave project, especially for the center and southern sectors. By carrying out a simple optimization study, it was noted that it is possible to slightly increase the power output, but during the summertime there would be no significant power output. Therefore, a combination of the initial power matrix and the optimized one should be considered, or eventually to develop more sophisticated systems in which SWEDE could adjust its performance in a dynamic way [
47]. At this moment, in order to accelerate the implementation of a hybrid wind-wave project, it would probably be much better to consider an existing wave generator, around which can be developed a wave farm.
5. Conclusions
The Iberian Peninsula represents an important coastal area that can be used for the development of marine renewable projects, especially in the case of the Portuguese EEZ. Coincidence (or not), the Portuguese nearshore area was selected for the development of the first commercial wave farm (Aguçadoura project—Pelamis device) and also the testing of the WindFloat demonstration project in 2011. Motivated by these aspects and by the fact that Portugal has important solar resources, the aim of the present work was to provide an overview of the expected benefits coming from the implementation of the solar, wind and wave energy for this coastal environment. Only 10 years of ERA5 data (from 2012 to 2021) were considered for the assessment, but nevertheless, we need to take into account that these are related to hourly values (24 data per day) and cover several parameters, such as surface solar radiation downwards, wind speed (assembled from u and v components), wave height and period.
In terms of the natural resources, the results indicate that the southern part of the Portuguese EEZ (Algarve) represent the first option for the implementation of a floating solar project, especially in the areas that do not exceed the 50 km isoline. In terms of the wind power, better resources were noted in the northwestern part of the EEZ, with a local hot-spot also in the southern part of the Iberian Peninsula, but outside the Portuguese EEZ. Nevertheless, in future works, a more detailed investigation needs to be carried out in order to confirm this pattern, eventually by using a wind dataset defined by higher spatial resolution. The wave power gradually decays from north to south, and also from the 50 km isoline to the nearshore, which was expected due to the decrease in water depth. Several complementarity indices were considered in order to highlight the connection between the solar-wind-wave resources, and the expected opportunities for the implementation of hybrid projects. Based on these results, some important sites were identified in the vicinity of the 50 km isoline, which represent a viable distance from the shore at which a marine project can be developed.
From the performances of the renewable generators, it was found that the proposed SWEDE wave converter related to the WindFloat platform would not be recommended for the Portuguese coastal area since the power output would be quite low. At this point, the Vestas V164 wind system would make a significant contribution with an annual output of 2–2.5 MW expected for most of the Portuguese environment. Compared to the rated power of this system (9.5 MW), the capacity factor can be considered to be quite low (e.g., 26%). A floating solar farm could be easily integrated into an existing offshore wind farm layout, with a 1 MW capacity facility expected to cover at least 0.009 km2 (according to this work). A maximum power output of 0.54 MW may be expected for the southern sector, that could be translated to an electricity production of 1188 MWh/year, assuming that the PV system will operate for at least 6 h per day.
The complementarity of marine resources is a relatively new topic and various approaches have been considered. The thresholds associated with the solar, wind and wave parameters are defined in different ways, involving either the annual average values of a particular resource or a general cut-in limit related to various wind and wave generators. The use of local statistical information can be considered to be quite limited, since the energy level significantly varies on different coastal and geographical areas, and therefore a direct comparison would be pointless. Since the aim of these studies is to see how a renewable project would perform in this coastal environment, probably the best approach is to consider the characteristics of the marine generators, by also including some performance thresholds related to the rated power of a particular generator. Nevertheless, the work is ongoing and future improvements may occur as the marine systems become more competitive. A significant issue that should be further considered in selecting the location of a marine energy project is related to the extreme events expected in that coastal environment. This is because, in many cases, the coastal areas with high waves and wind resources are very often subjected to extreme environmental conditions that can put the systems in danger. Furthermore, in the context of climate change, the intensity and frequency of extreme events is expected to increase and the marine energy farms should be prepared to face such harsh conditions.
Finally, we need to mention that the idea of developing mixed solar, wind and wave projects in marine areas is starting to gain momentum, going even further to proposals that involve projects capturing all three resources in a consistent way. Based on the know-how already accumulated, the Portuguese nearshore area may be recommended for the developments of such complex projects.


