1. Introduction
There are many horizontal axis wind and current turbine rotor performance evaluation studies, in terms of both experimental measurements and full-scale trials. Typical examples on experimental lab-scale and full-scale studies include the study by Bahaj et al. [
1], which produced a completed set of experimental testing data for a unidirectional-bladed tidal turbine rotor model with a controllable pitch, and Butterfield et al. [
2] at the NERL, who contributed a set of measurement data from a full-scale trial of a wind turbine rotor. Even though many experimental tests have been recorded in the literature, current experimental data is inadequate due to the complexity of the turbine geometry and the combination operating condition of numerous variables. Experimental tests are still required to produce physical measurement data that can be used for numerical code validation and as a design reference. Increasingly more experimental studies are being presented to address the issue of a lack of measurement data. More examples of experimental research at the model scale include Liu et al. [
3] and Alamian et al. [
4].
Even though many turbine-rotor experimental studies exist in the literature, few research studies have addressed the accuracy and reliability issue of the testing apparatus due to the fast model speed at a high shaft revolution speed. To the authors’ knowledge, the present study is the first attempt to improve the accuracy and reliability of data acquisition of fluid-structure-induced vibration of a turbine rotor model under a fast travelling speed and high shaft rotational speed.
This experimental study was carried out based on a testing program conducted previously by Liu et al. [
3]. In this program, an instrumented rotor testing apparatus was designed and built to measure the hydrodynamic performance of horizontal axis turbine rotors, and can be used for either propulsion testing via propellers or renewable energy performance measurement via tidal turbine rotors. A series of seven metal rotors and two plastic rotors were first tested using this testing apparatus. It was found in that testing program that the testing apparatus showed substantial vibration when the carriage speed was over 2 m/s and hence it limited the inflow (carriage) speed beyond 2 m/s [
3].
Both the previous testing [
3] and the testing of the current work were conducted at the Towing Tank at Australia Maritime College, University of Tasmania. To test the rotors, a testing apparatus, the so-called “opensboat” (
Figure 1), was designed and built using a Kempf & Remmers (K&R) propeller dynamometer as the key load measuring unit. As the tidal turbine-measured torque on the rotor shaft is quite small, the smallest K&R dynamometer available, R31 K&R, was chosen. This dynamometer has a capacity of 4 Nm torque and 100 N thrust or drag. Referring to bi-directional current turbine rotor testing [
3], the same thrust capacity but a smaller torque capability of 2 Nm is ideal for the experiment condition to fit the controller ampere rating, shaft speed, and carriage speed (inflow speed) of the towing tank.
Based on the previous bi-directional current turbine rotor testing program [
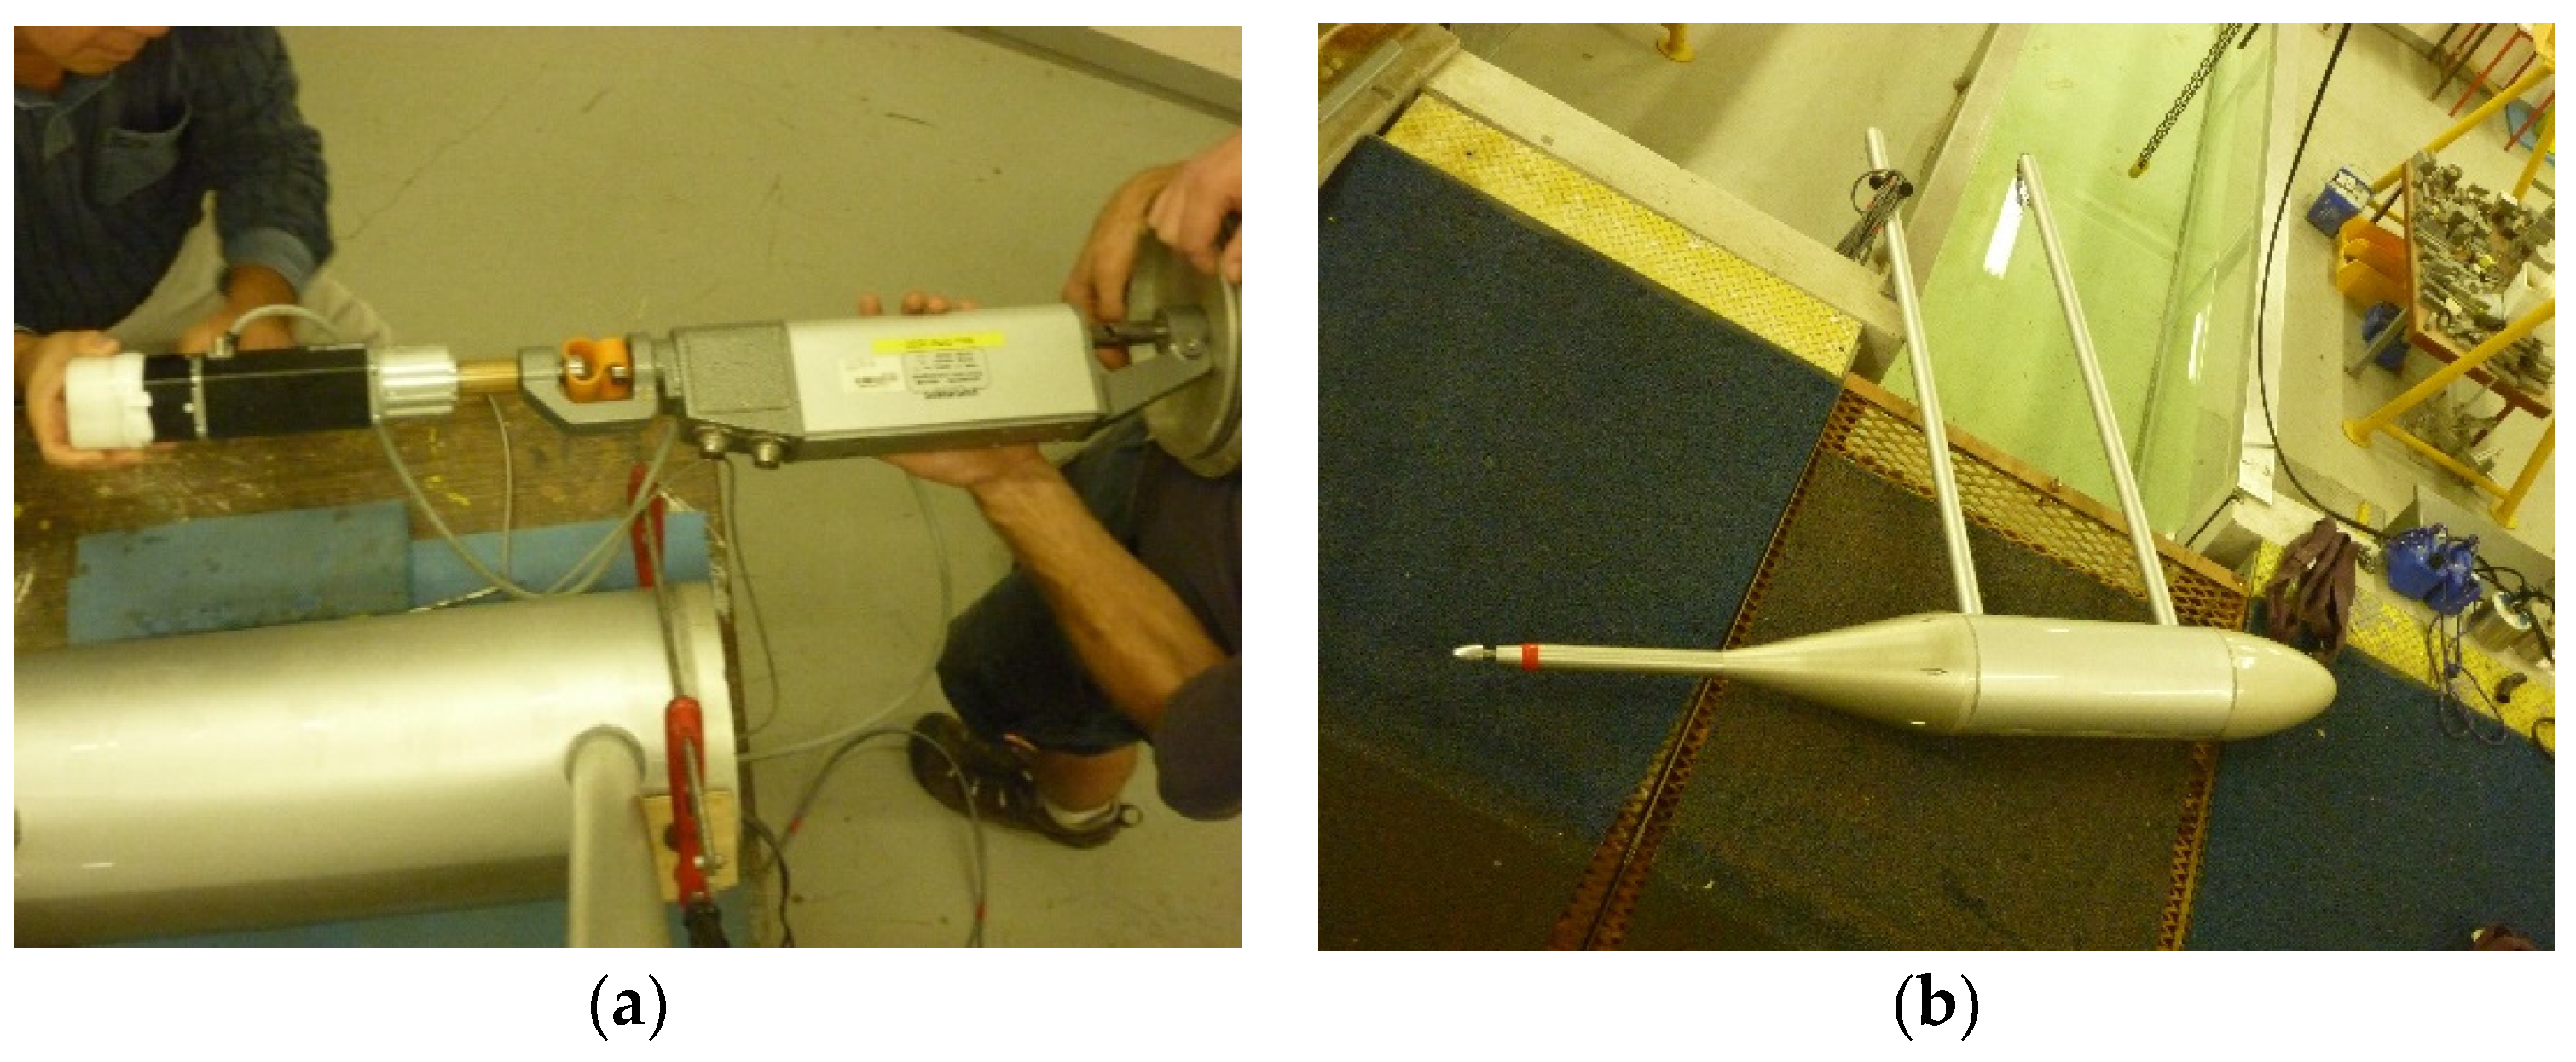
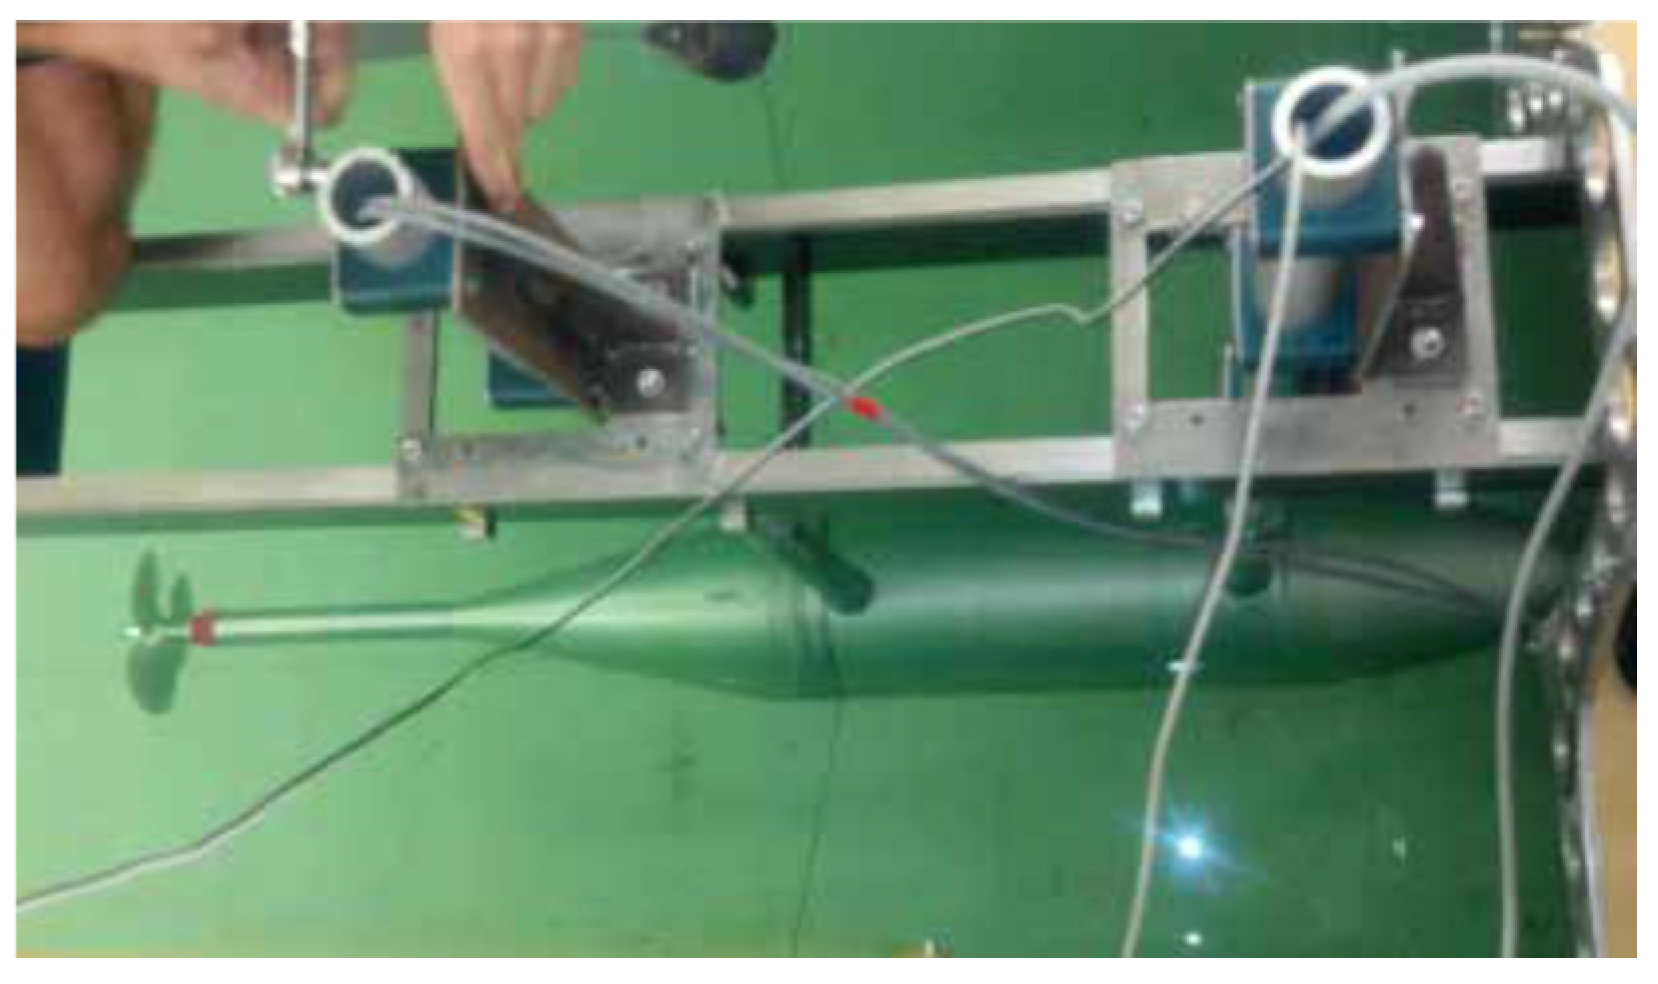
3], the experiment on bidirectional turbine rotors in this study was conducted in an AMC towing tank. The rotors were designed and built for a dual-mode device that can be used either for propulsion or power generation. The internal assembly of the apparatus is shown in
Figure 1a. In this assembly, a nylon seat (in white at the left end of the apparatus) is attached to provide a flatting mount to the torque and trust retainer, and the retainer is attached to the motor (the black part next to the while nylon seat), universal shaft coupling (the thin shaft part with pink joint), and a K&R propeller dynamometer (the long part in at the right end. The completed assembly with only two cylindrical struts is shown in
Figure 1b.
2. Materials and Methods
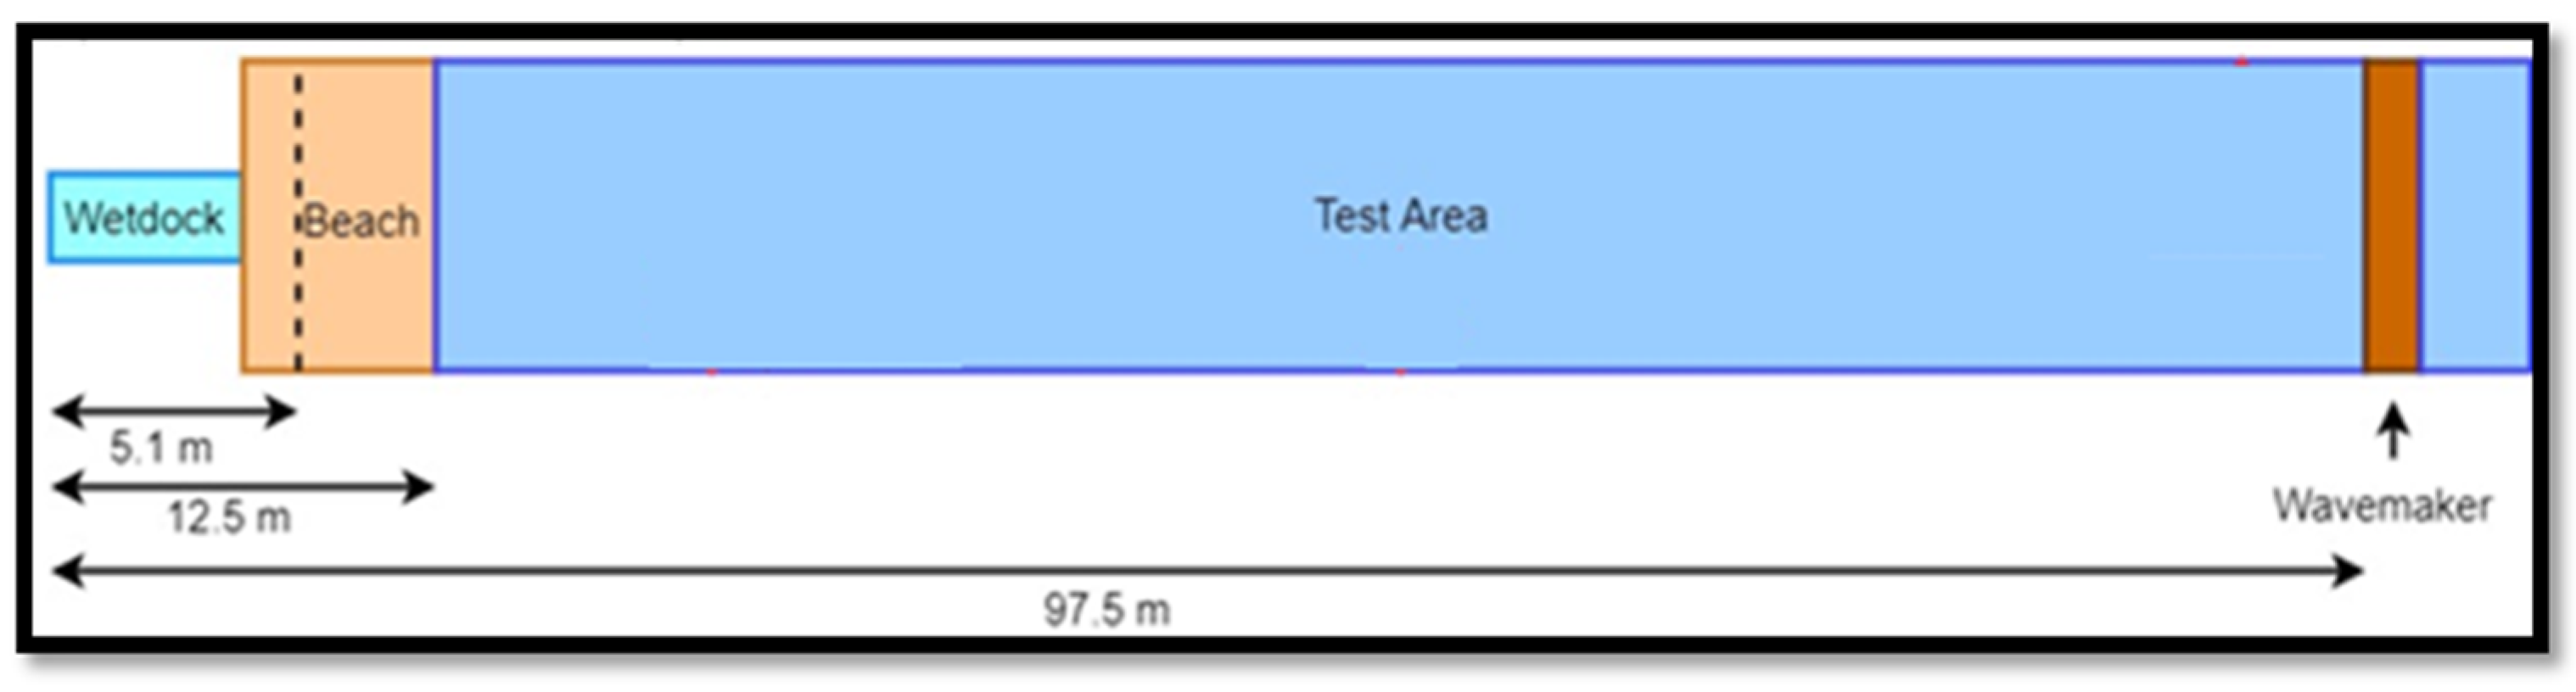
The AMC towing tank is the largest and only commercially operating facility of its type in Australasia with a 100 m long, 3.55 m wide, and 1.5 m deep water tank (
Figure 2). A carriage was installed with a rail mechanism to tow structures at a maximum carriage speed of 4.6 m/s. It is used to measure the resistance of objects moving in water, such as ship hulls, submersibles, offshore oil rigs, and submarines. The AMC towing tank is also equipped with a metal beach to reduce wave reflection with a less than 5% reflection coefficient. Tow tank testing required operating condition [
5] that met the reflection coefficient provided by Jamieson and Mansard [
6].
It was discovered in the previous experimental work [
3] that when using this apparatus, substantial vibration and transverse oscillation occurred when the carriage speed was more than 2 m/s. The carriage speed was initially set to 1 m/s and no obvious vibration was noticed [
3].
In this study, it was found that vibration consists of transverse oscillation of the apparatus body and vibration due to the fundamental frequency of the apparatus body.
To reduce the vibration and oscillation, we decided to strengthen the transverse strength of the apparatus body by adding strut support. The vibration recording was performed by using an accelerometer, which was installed in the opensboat body.
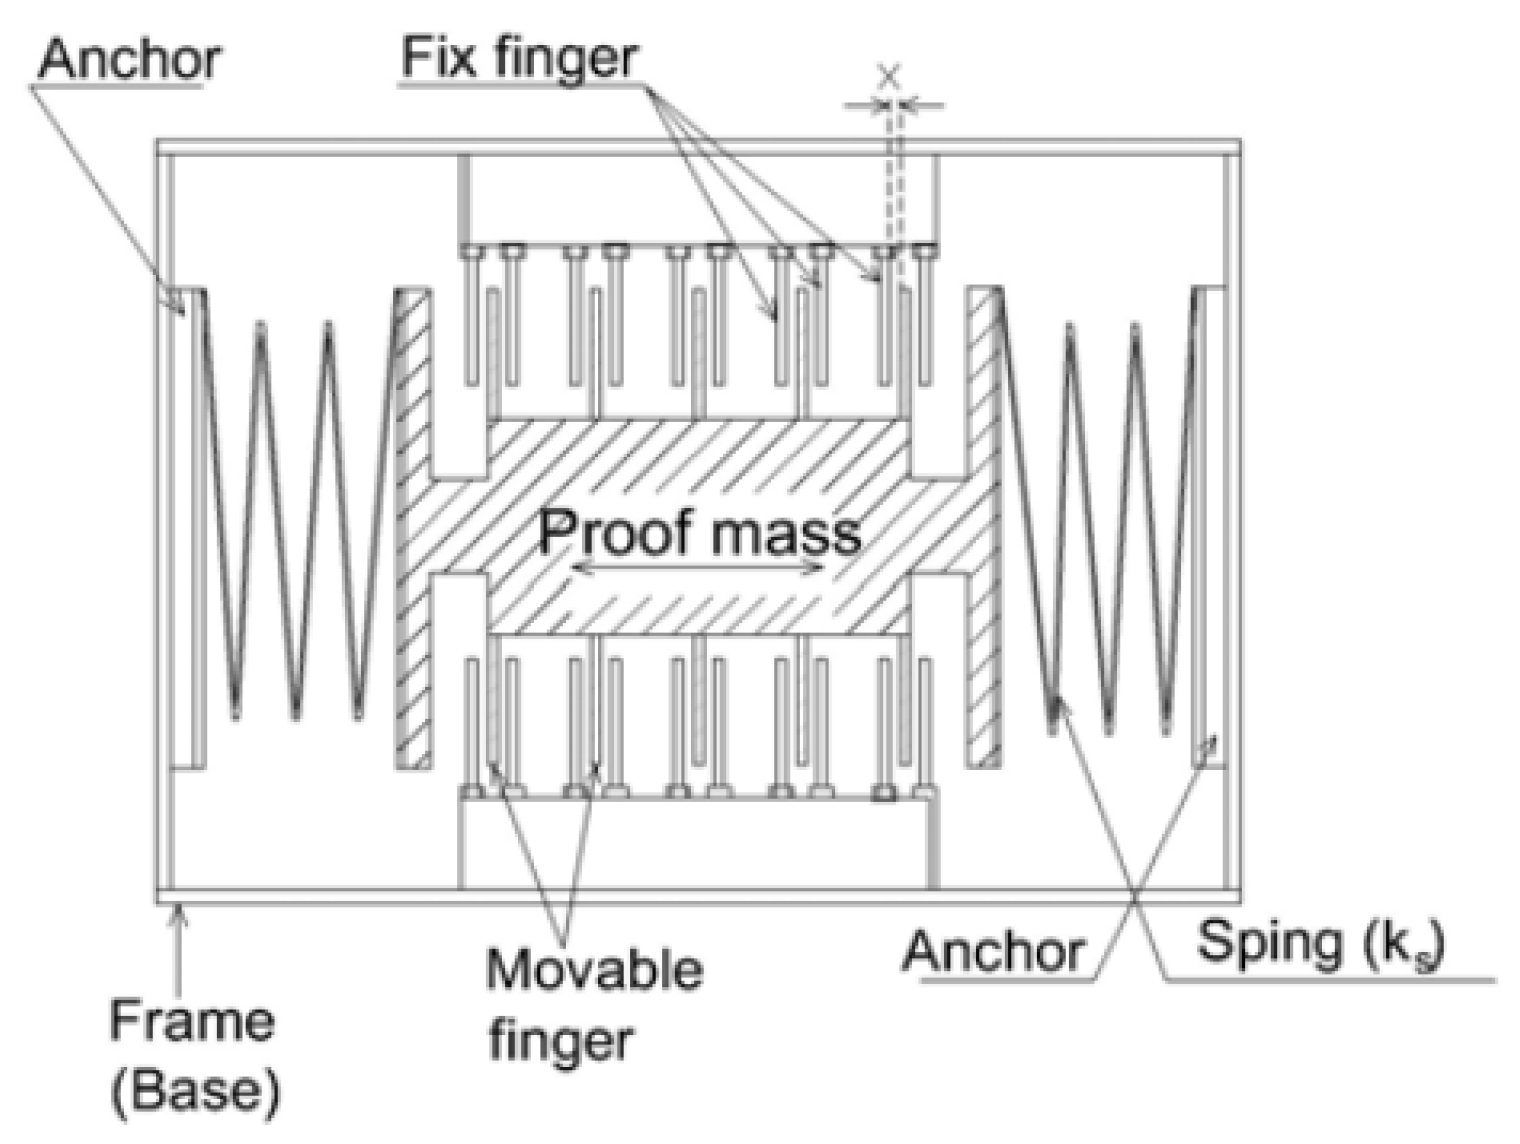
An accelerometer is a device that measures an object’s proper acceleration. Proper acceleration [
7] is the acceleration of a body in its own instantaneous rest frame, which is not the same as acceleration in a regular coordinate system. To measure vibration, a microelectromechanical system (MEMS) accelerometer was introduced (see
Figure 3). To measure and analyze vibration, a vibration transducer was required. By measuring the displacement, velocity, acceleration, acoustic, magnetic, and optical properties of specific points, the vibration results can be measured with different types of sensors based on different operating principles.
An MEMS accelerometer was operated based on the piezoelectric effect, which stresses a microscopic crystal using accelerative force and a capacitive operating principle, which changes the capacitance with microscopic seismic mass movement. The capacitive type is more widely used due to the minimal power required, excellent sensitivity, and large output signal.
This type of sensor works on the principle of capacitance variation between a set of sensing electrodes and reference (fixed) electrodes. The capacitance between two parallel plates is represented by ‘A’, as the area of each plate, and ‘d’, as the separation between the plates [
8].
To verify the effect of vibration or opensboat body oscillation on open water rotor performance, as planned in this study, we assessed the improvement of the reduced vibration on the opensboat and hence the improvement in the measured tidal turbine rotor power generation performance along with the drag on the rotors, at various tip speed ratios. The instrumented opensboat was used to test the rotors of 3 different expanded area ratios (3 solidities), with or without strut support. A comparison of the effect of vibration reduction on the improvement of the hydrodynamic performance was conducted and the comparative performance (power and drag coefficients) was then presented. At the same time, an accelerometer was installed to record the vibration of the opensboat, as benchmark vibration data. A propeller dynamometer that has thrust and torque sensors was used to record the measured thrust and torque. The torque coefficient, thrust coefficient, and propeller efficiency were calculated first and converted to a power coefficient and drag coefficient based on the raw data captured and obtained from the K&R dyno using the Texas Instrumentation Data Acquisition system and a dedicated desktop computer using an automated and Excel file programmed with macros. The conversion equations and procedure were taken from Liu and Bose [
9]. The obtained hydrodynamic performance data were then evaluated and compared, and are presented in the next section.
3. Results
3.1. Rotor Series
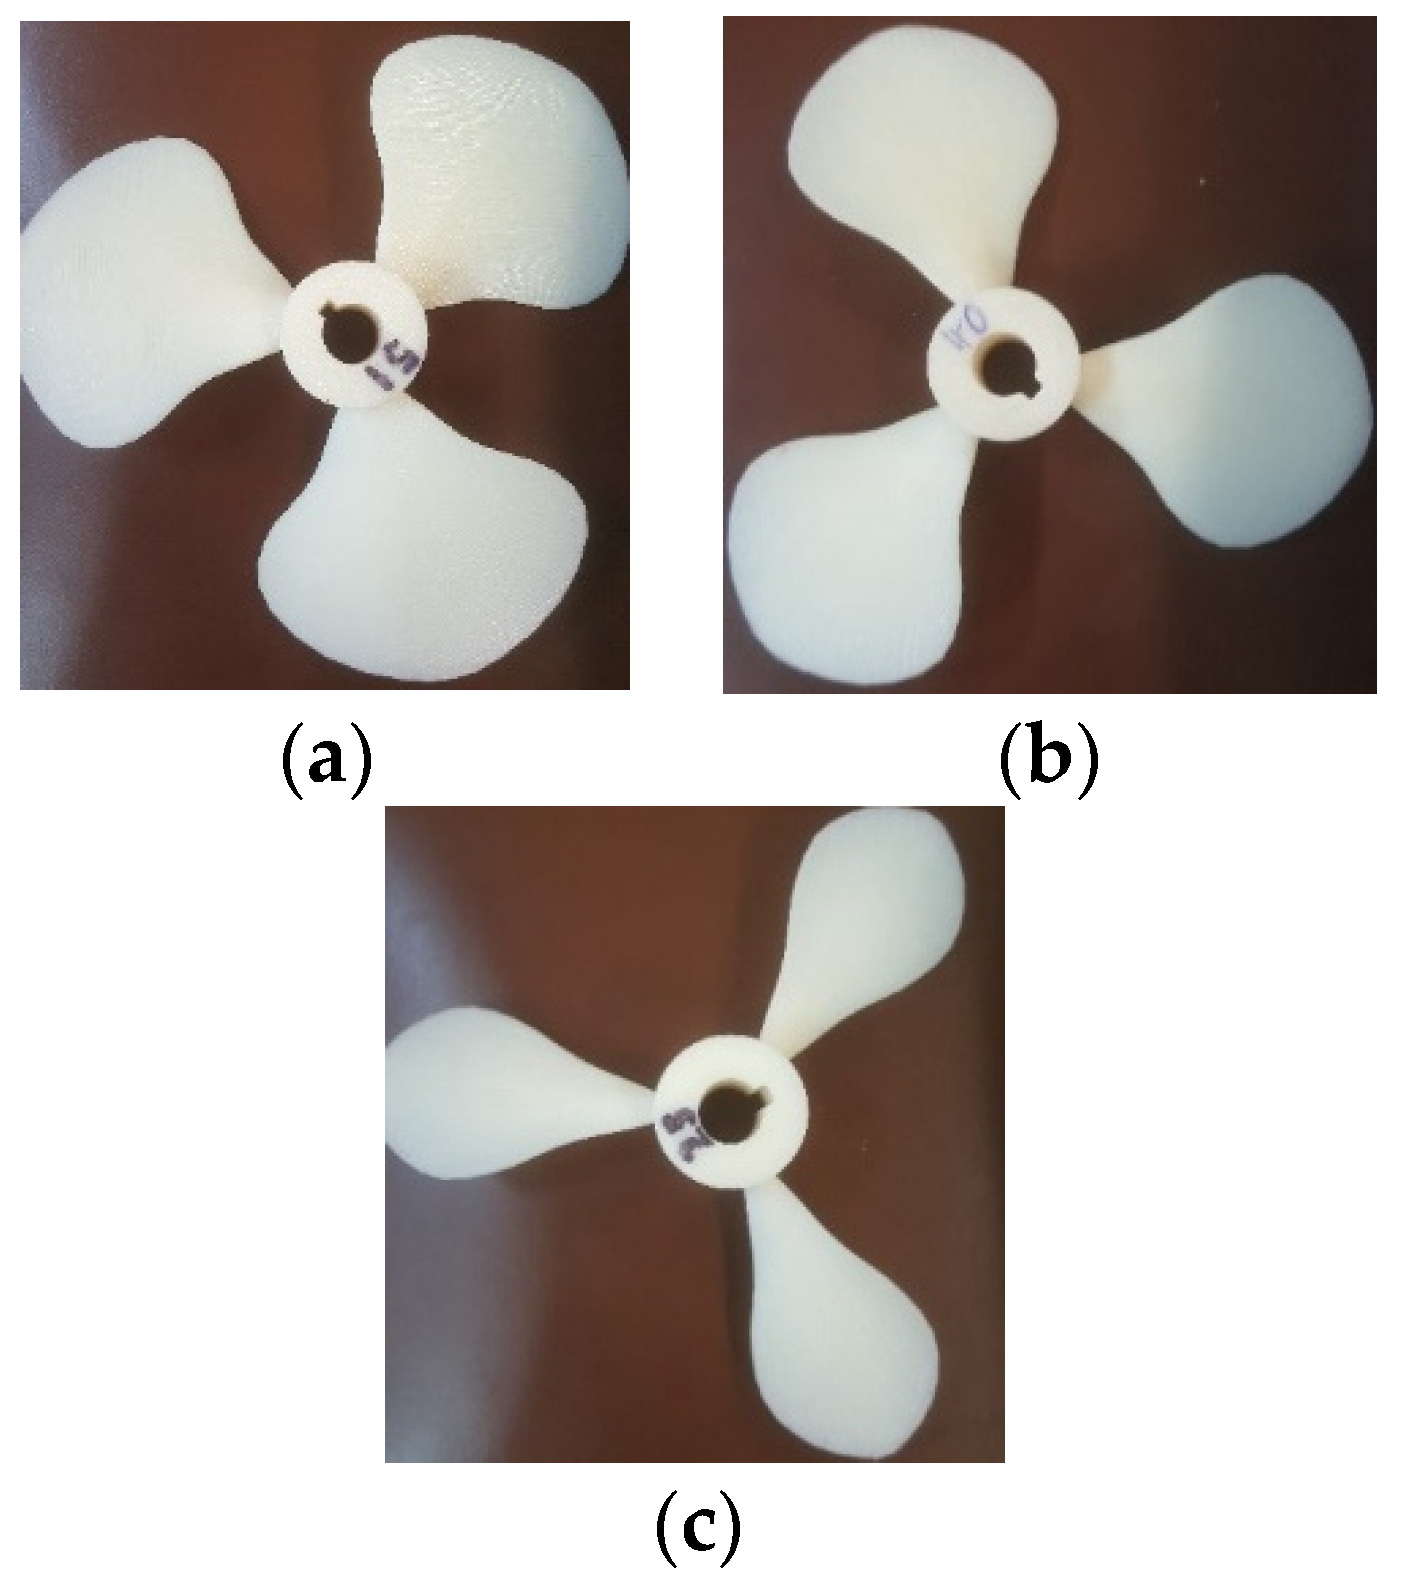
For testing vibration, a series of model turbine rotors were designed and built for the “opensboat”. Three-dimensional printed three-blade rotors with different blade area ratios (EAR) but the same pitch ratio and distribution and the same rotor diameter were tested using the opensboat. The material of the rotors printed by a 3D printer is ABS (Acrylonitrile Butadiene Styrene) plastic [
10]. Acrylonitrile butadiene styrene is easy to fabricate and machine.
Table 1 shows the properties of the rotor material. It is a low-cost engineering plastic that is suitable for structural applications due to its strength stiffness, impact resistance, and machinability. It is often used in food handling, oil and gas, aircraft, aerospace, and defense industries.
These three rotors were all tested with or without struts.
Figure 4 shows the three rotors that were made and tested in the testing program of this study.
The diameter of the rotors was 0.18 m with a varied expanded area ratio as indicted in the table. All other geometry properties, such as the pitch and pitch distribution, hub- diameter ratio, skew and skew distribution, rake and rake distribution, and blade sectional offsets, were the same as the rotors in Liu et al. [
3], who described these properties in detail.
3.2. Experiment Equipment and Apparatus
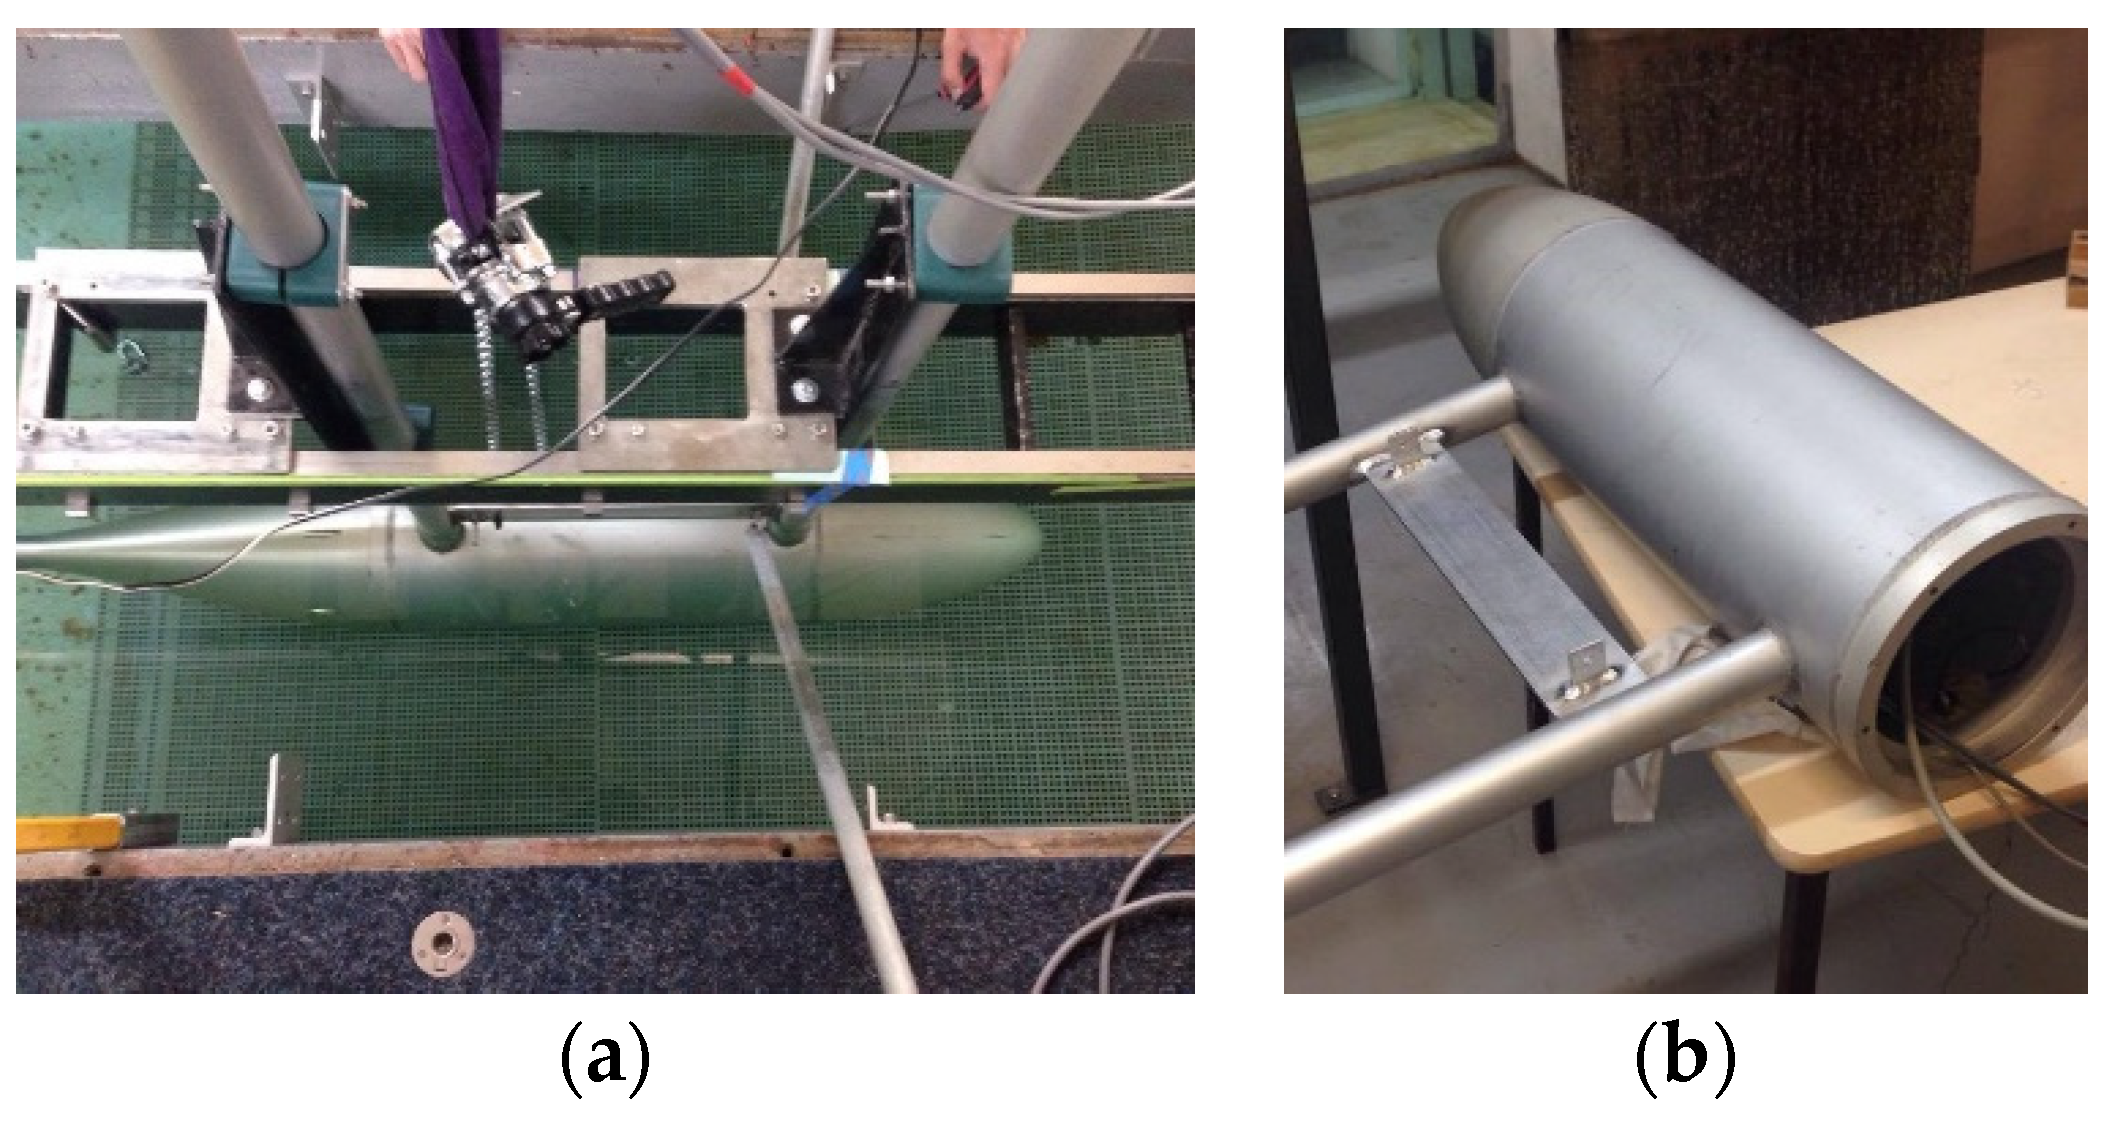
The original design consists of a hollow bullet-shaped body with two hollow aluminum pipes that are connected to the moving carriage on the tow tank (
Figure 5). In
Figure 5, the opensboat assembly is shown (under water with the rotor outside the assembly). The opensboat is mounted on the tow tank carriage (i.e., the two-beam with webbing structure) via two structs (seen as two open tubes). The waterproof tubes also conduct the data and power/controller cables.
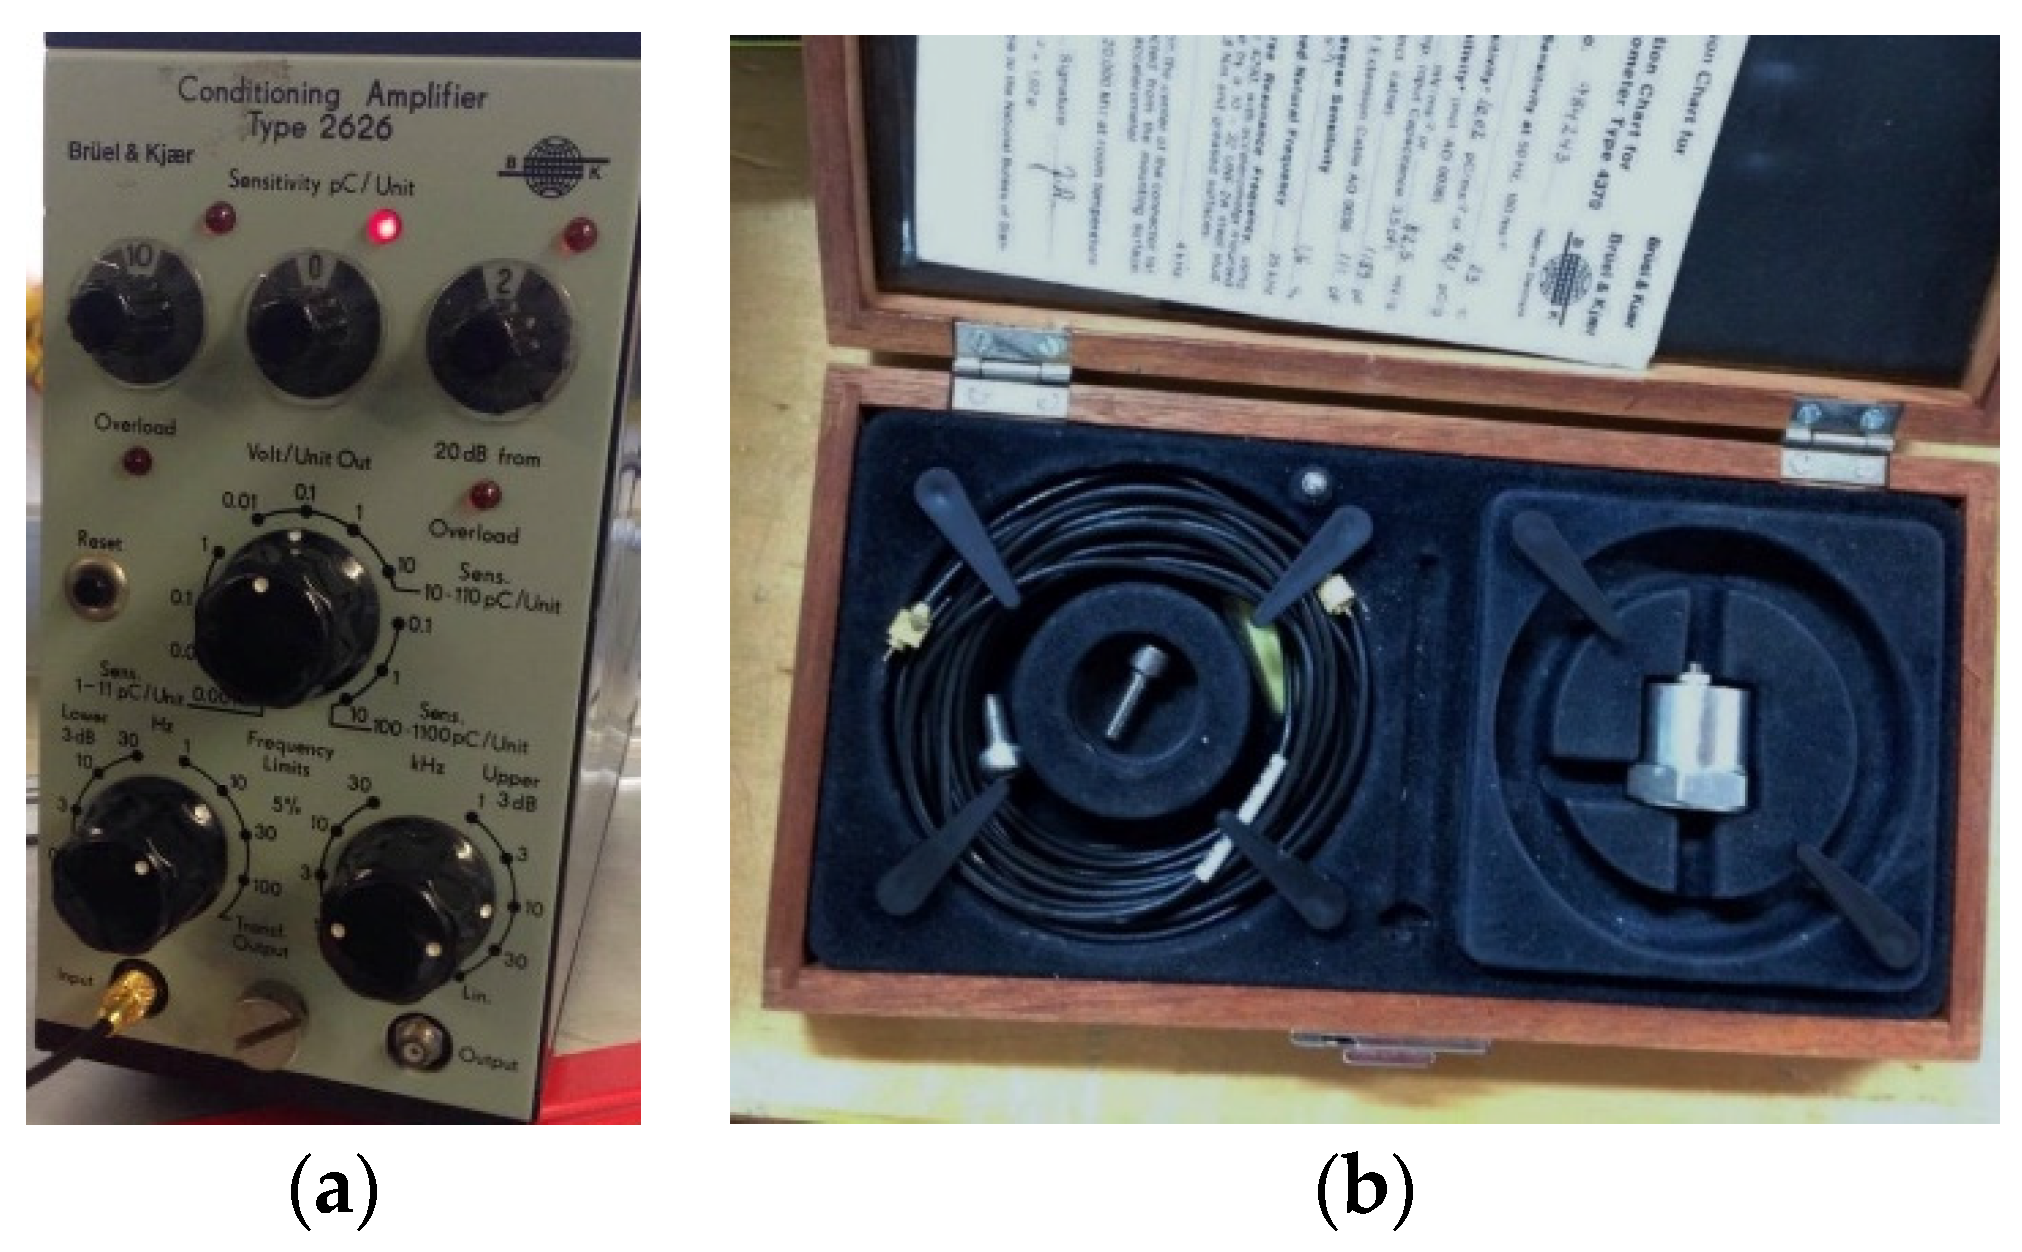
After a series of discussions and considerations, the opensboat was altered by wielding an aluminum plate with four brackets in between the hollow pipe to allow the opensboat to connect with another four metal struts with a ball joint in the carriage to prevent opensboat transverse oscillation while the rotor was being tested. An MEMS accelerometer Bruel & Kjeer Type 4370 was installed in the interior wall of the opensboat body with industrial plasticine to capture the vibration of the opensboat as a benchmark to ensure the strut can provide enough stability while testing is in operation (
Figure 6).
In
Figure 6a, a thin tube is welded/added to each side of the opensboat shell. Two thin tubes (only one seen on each side) with one end being welded to the shell and the other end shown in
Figure 6a is mounted on the carriage to strengthen the stability and rigidity in the sway direction. The total number of enforcement structs is four.
Figure 6b shows that a strengthening bracket is welded between the original struts to increase the stability and rigidity in the surge direction.
An BG 65 PI Motor, K&R R31 propeller dynamometer, and flood sensor (
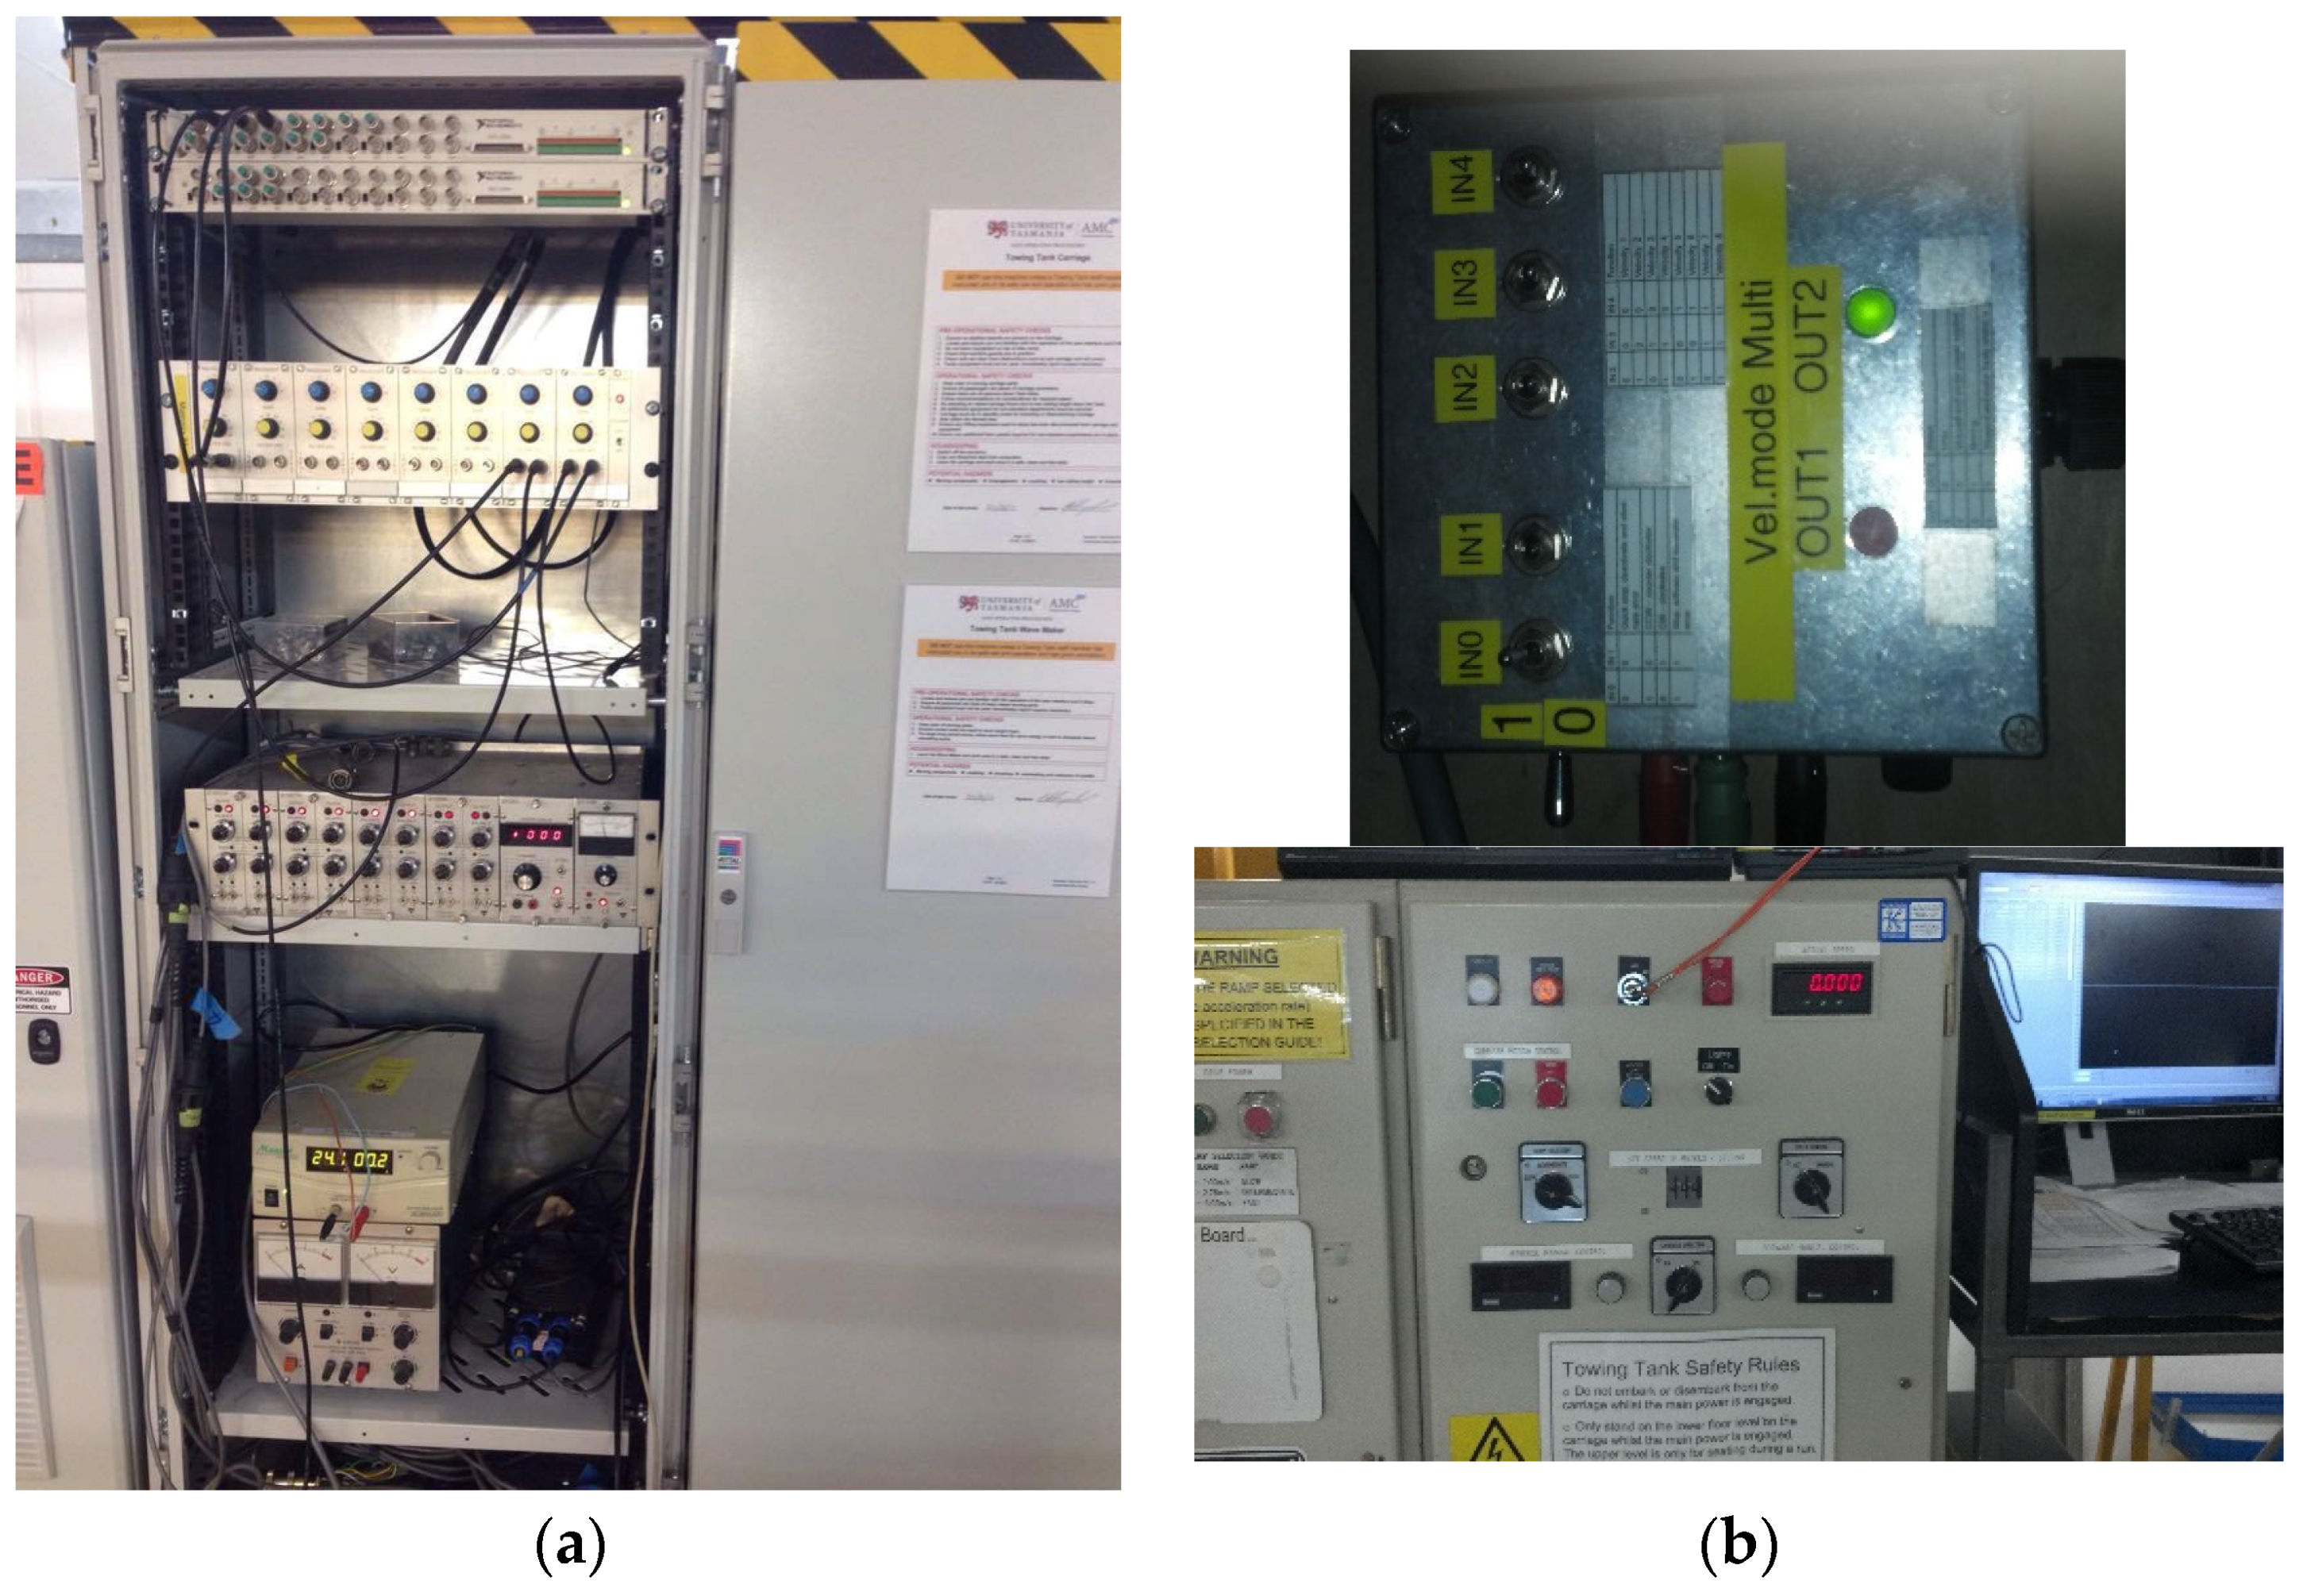
Figure 7) were assembled and installed in the opensboat body. All the cables that carry signals were placed in the hollow pipes to the NI (National Instrumentation) signal filter and an amplifier to the computer.
The signal of the accelerometer is sent to an amplifier via a 3 m long cable. The accelerometer was then connected to the National Instrument (NI) filter to filtrate un-necessary noise and then to the computer (
Figure 8a).
A binary box is installed to control the motor rotational speed. The motor has a gearbox ratio of 3:1 and the motor limit is 2500 rpm, so the maximum allowable rotor rotational speed is 833 rpm. However, at a much lower carriage speed, i.e., very slow inflow speeds, the motor can reach 3100 rpm (
Figure 8b). The control panel on the carriage for testing operation is also shown in
Figure 8b.
Four clamps with an M6 bolt and nuts were installed to hold the two pipes of the opensboat on the carriage. A chain with a hook and sprocket with a metal bar were also used to jack the opensboat to an arm-reachable distance to allow rotor replacement during the test. The shaft was immersed at a depth of 0.75 m, which is half of the towing tank depth, to reduce the free surface and bottom effect [
3].
3.3. Vibration Analysis
As mentioned, during the previous testing, substantial transverse oscillation occurred in the opensboat when the carriage exceeded 1.5 m/s. This was verified in the current experiment.
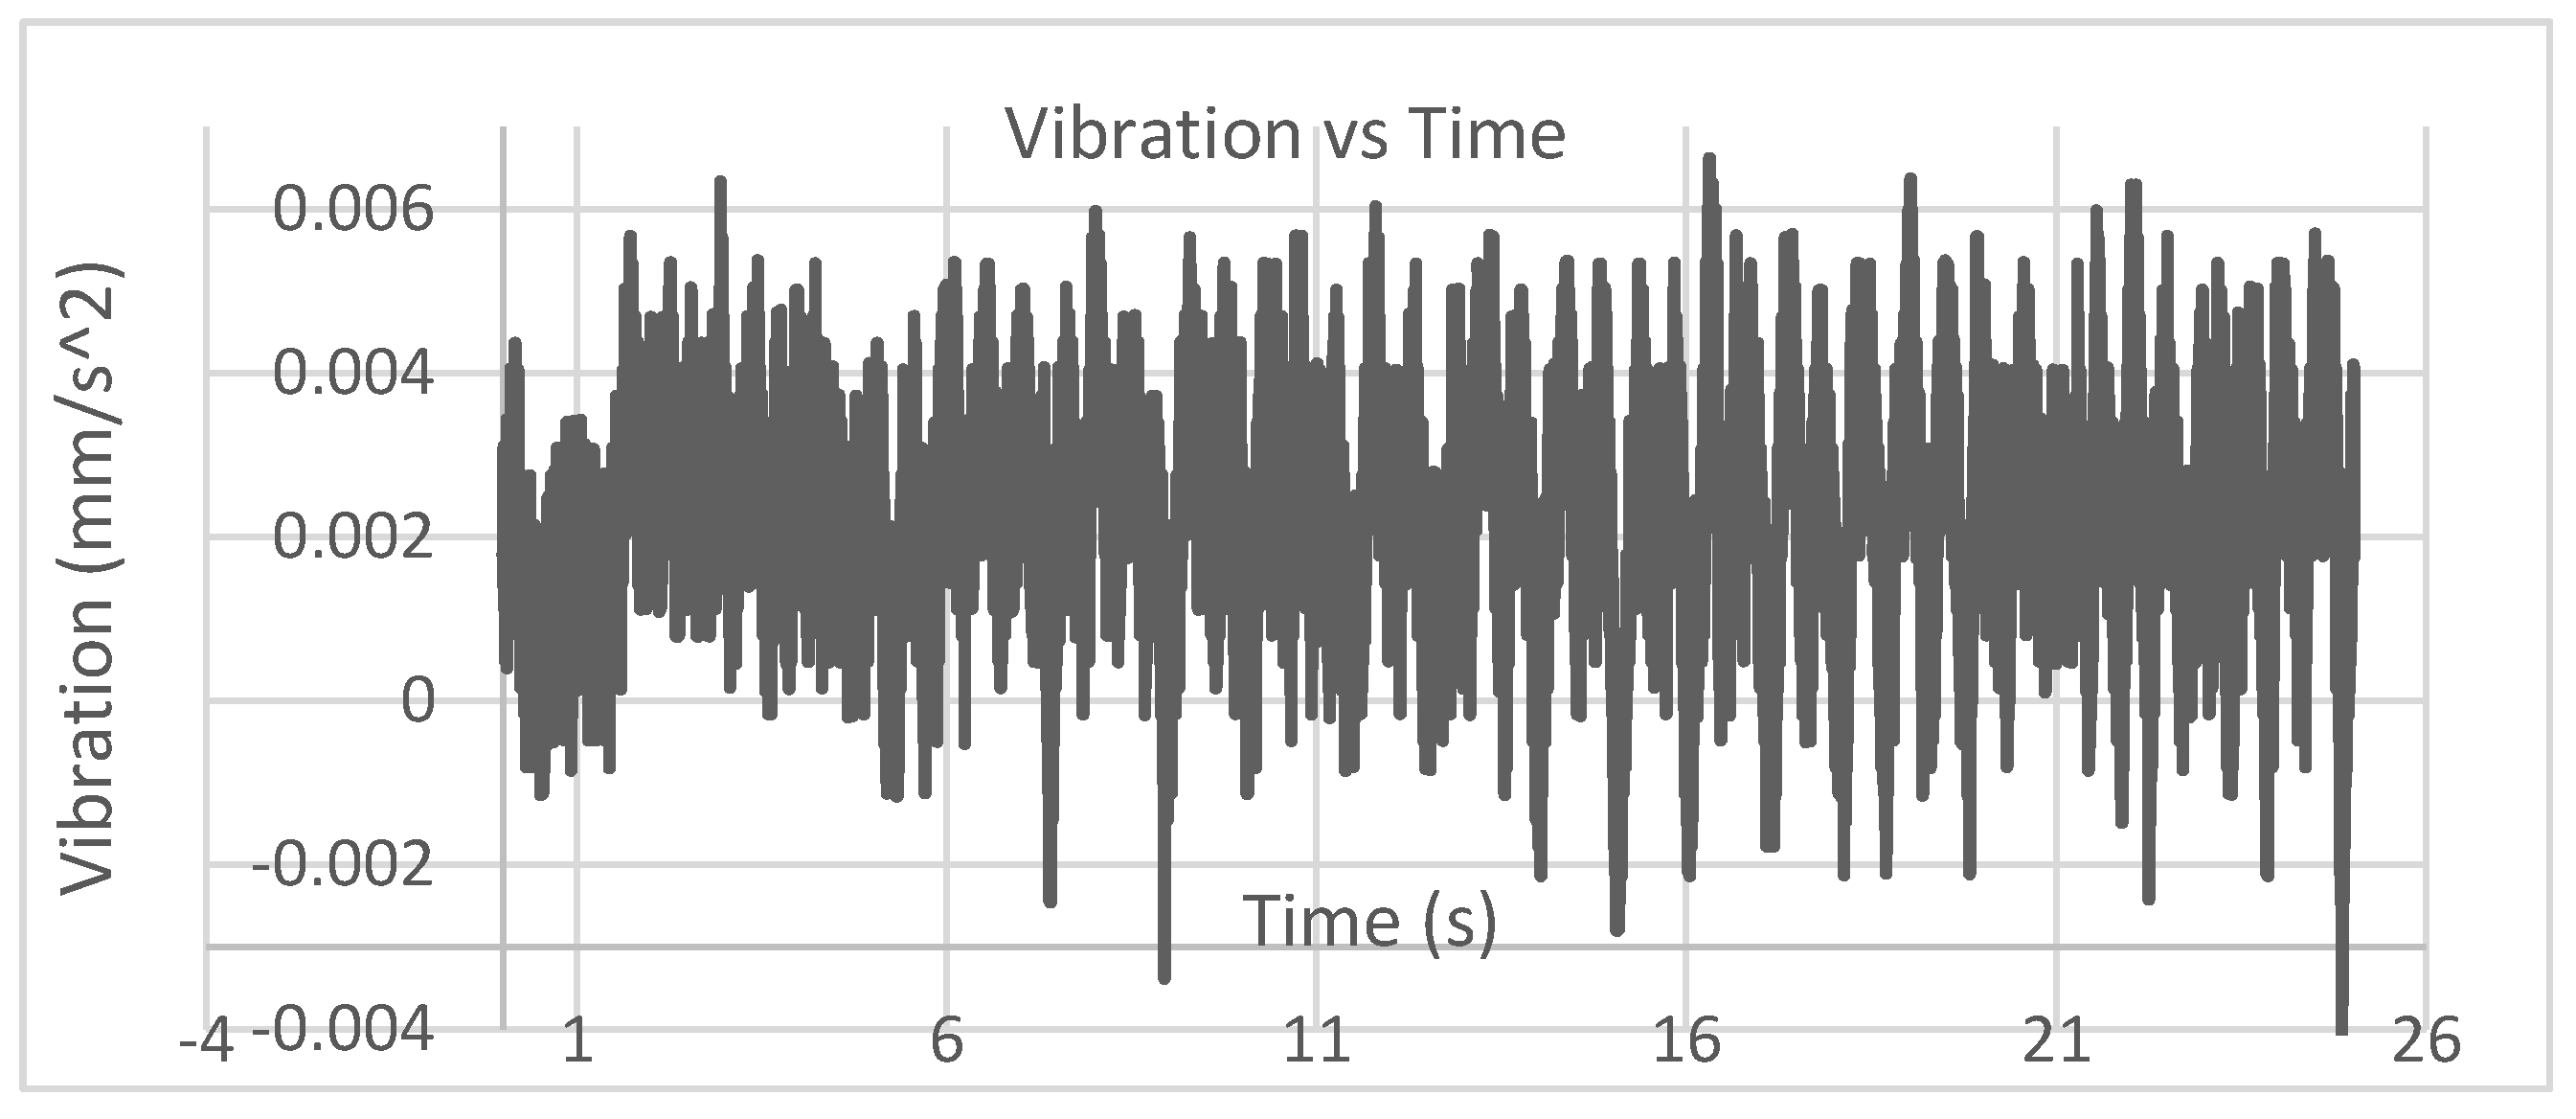
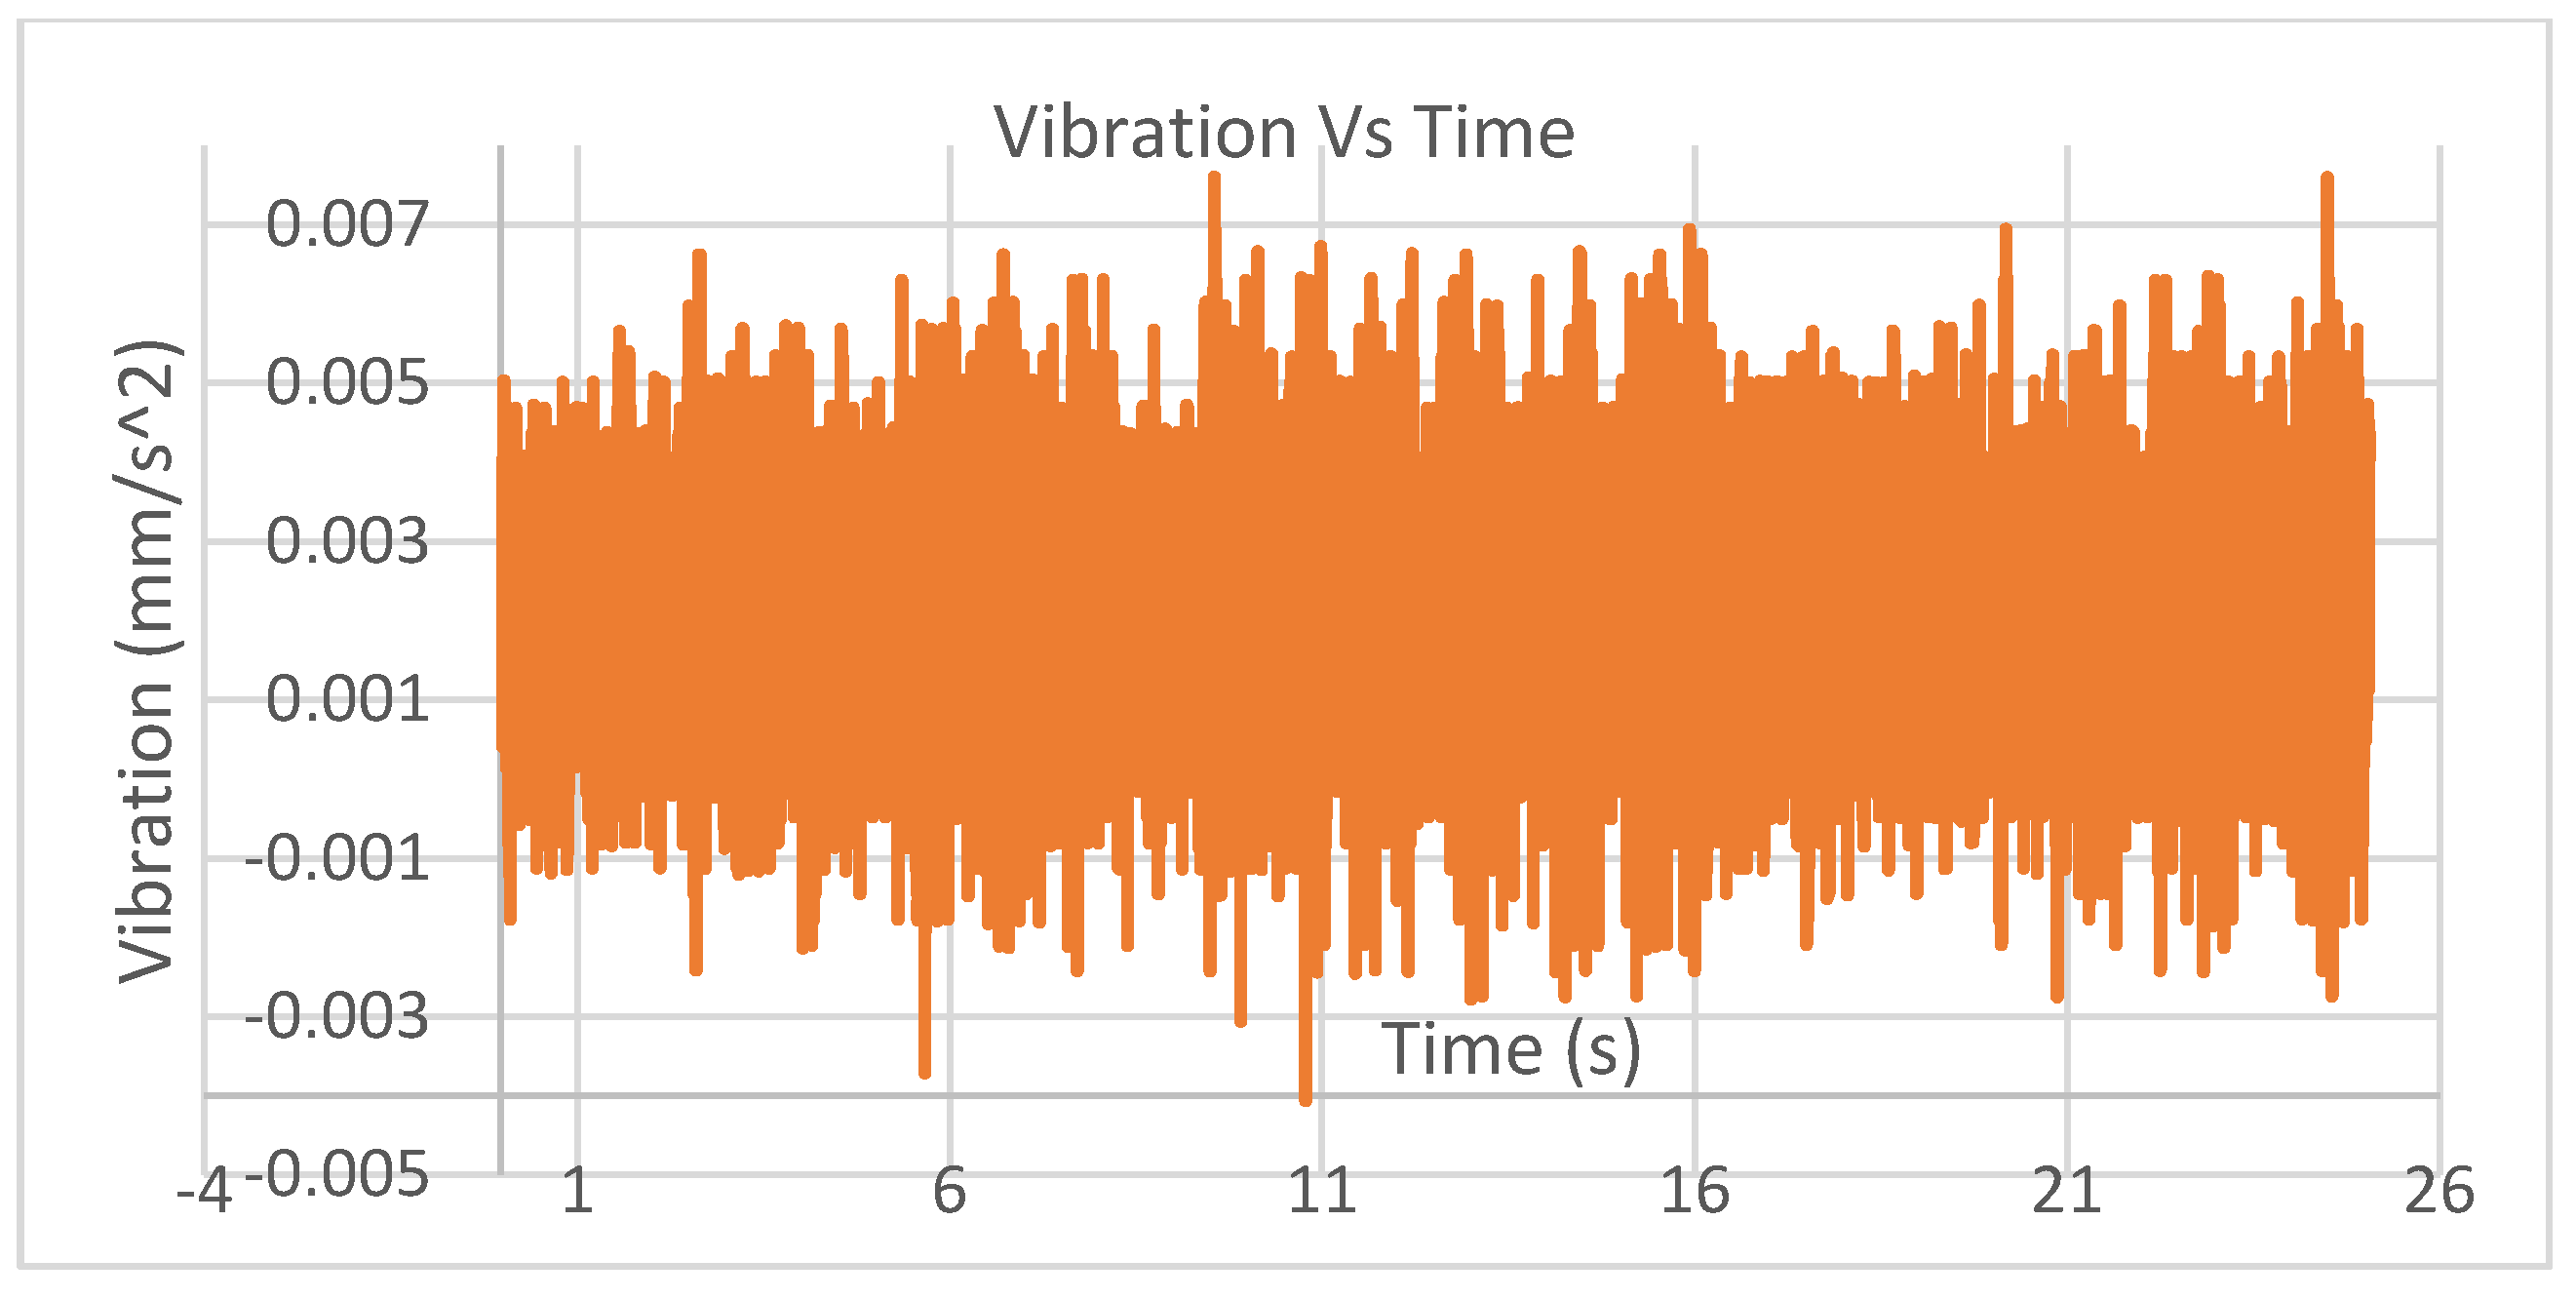
The key data that need to be obtained in the current study is the observation and measurement that contains hydrodynamics and vibration. During the tank testing, data run 67 (with strut) and run 262 (without strut) for the same carriage speed of 2 m/s and same motor rotational speed of 2105 rpm were obtained, compared, and presented.
As the results show, the maximum vibration increased by 0.001 mm/s
2, and vibration also occurred more frequently after the strut was applied (comparing
Figure 9 and
Figure 10), which means the struts worked effectively. At the same time, based on the observation, the oscillation of the opensboat body decreased to an unnoticeable level. This is because the struts resist the oscillation of the opensboat body in the transverse direction, and the body accelerates and decelerates in a shorter period (shorter oscillation period), which causes the accelerometer to capture higher acceleration, i.e., the increased resisting force with struts, not the magnitude of locational transformation.
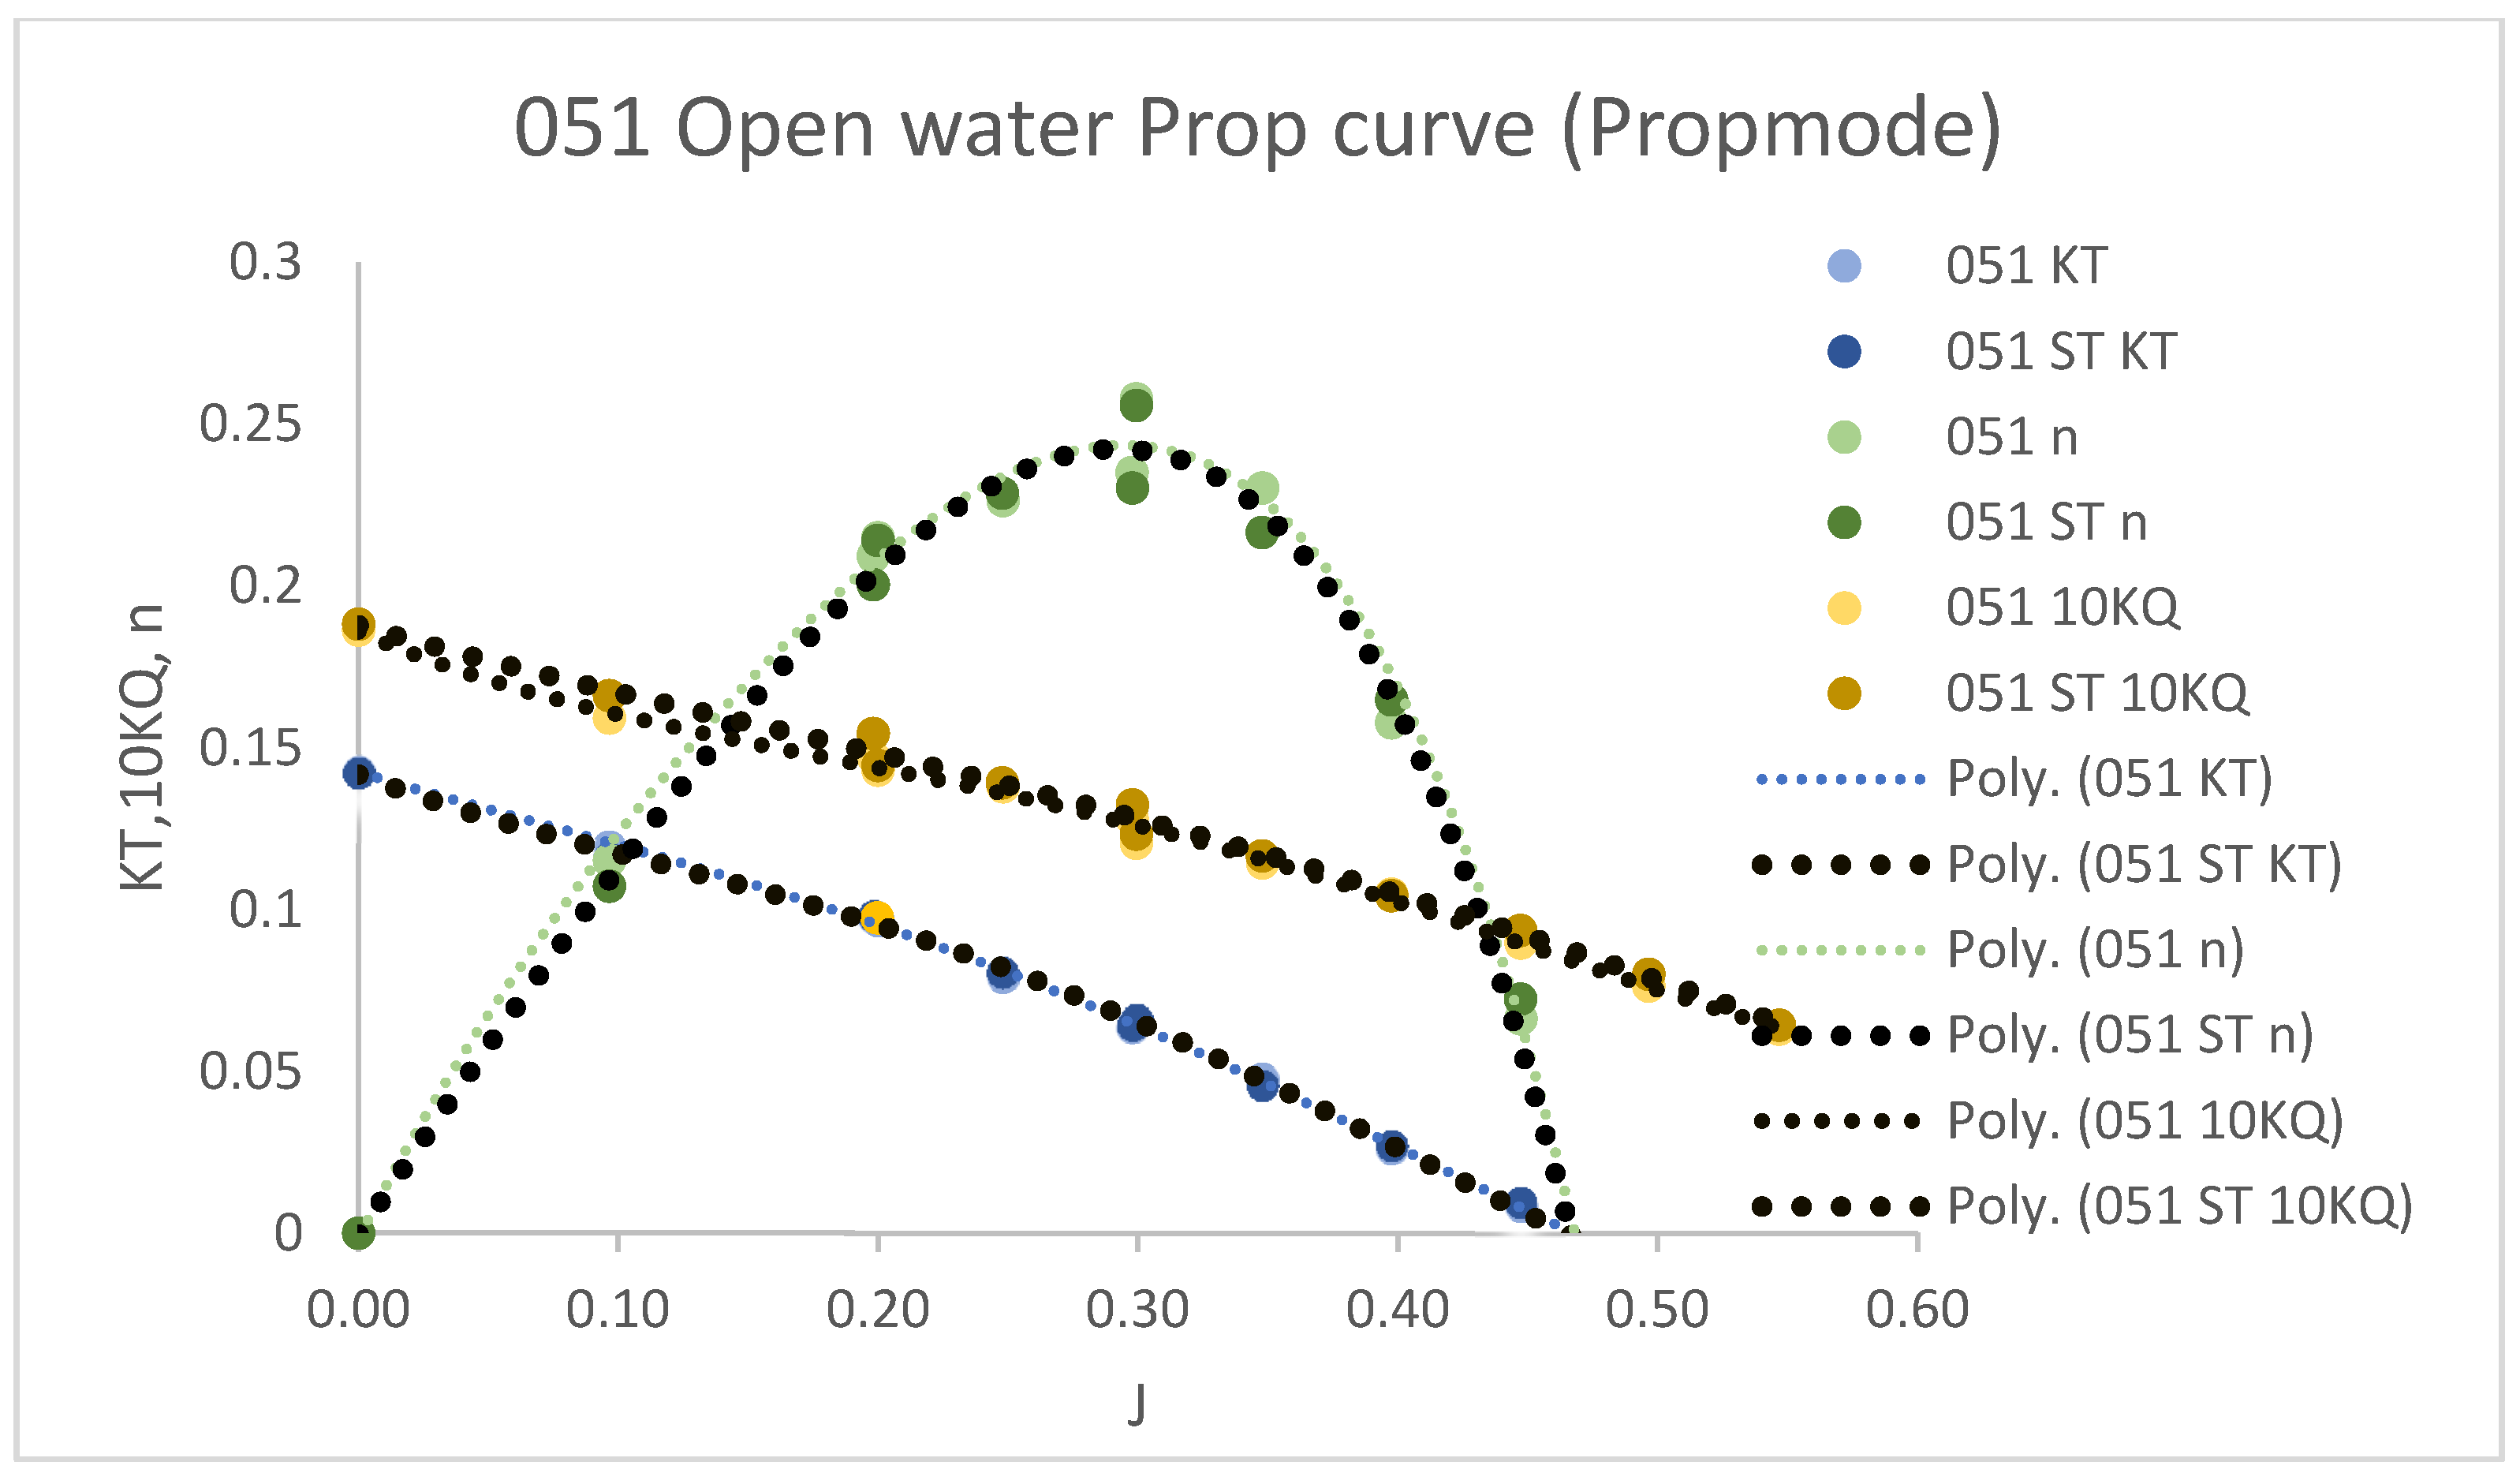
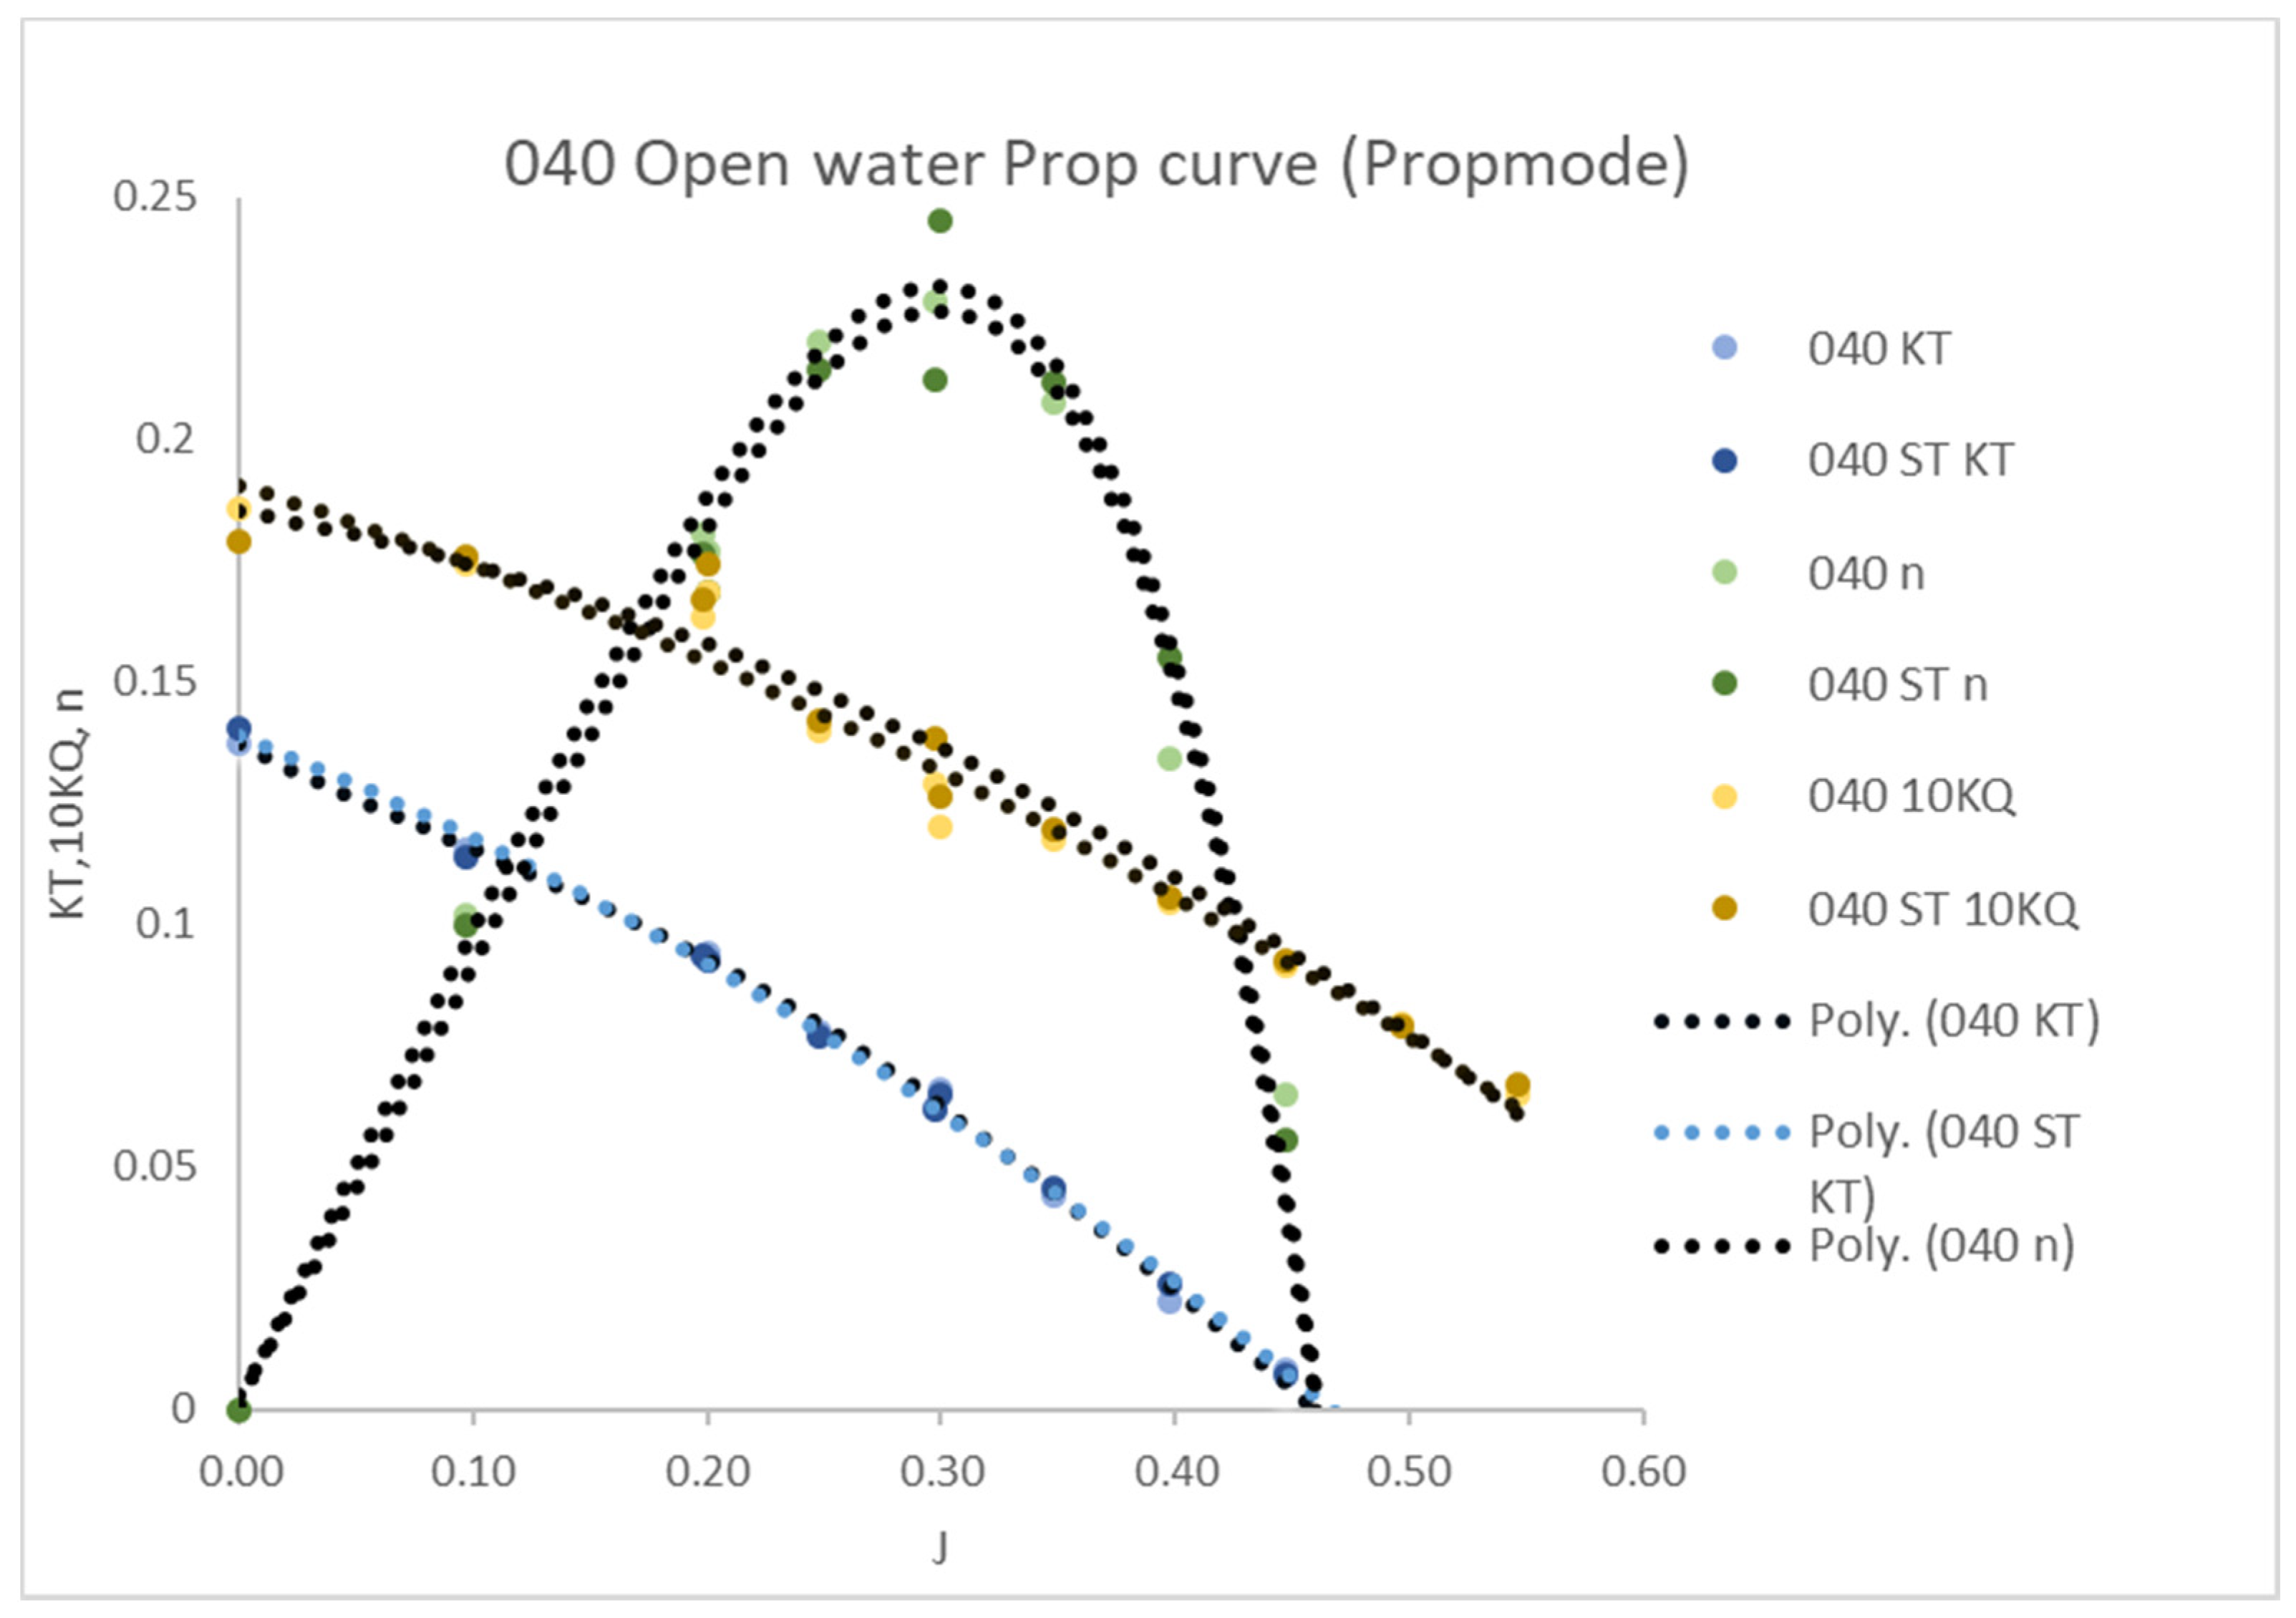
To identify the effect of vibration on the rotor, a graph of an open water propeller propulsion curve was plotted (
Figure 11 and
Figure 12). The results of the 50% and 40% solidity rotors show no significant difference between the strut and no-strut conditions. This is because the testing of the rotors occurred under low carriage speed conditions. This indicates that reducing vibration for the propulsion test will not substantially improve the measured accuracy and performance when the carriage speed is very slow (less than 1 m/s) for the propulsion mode.
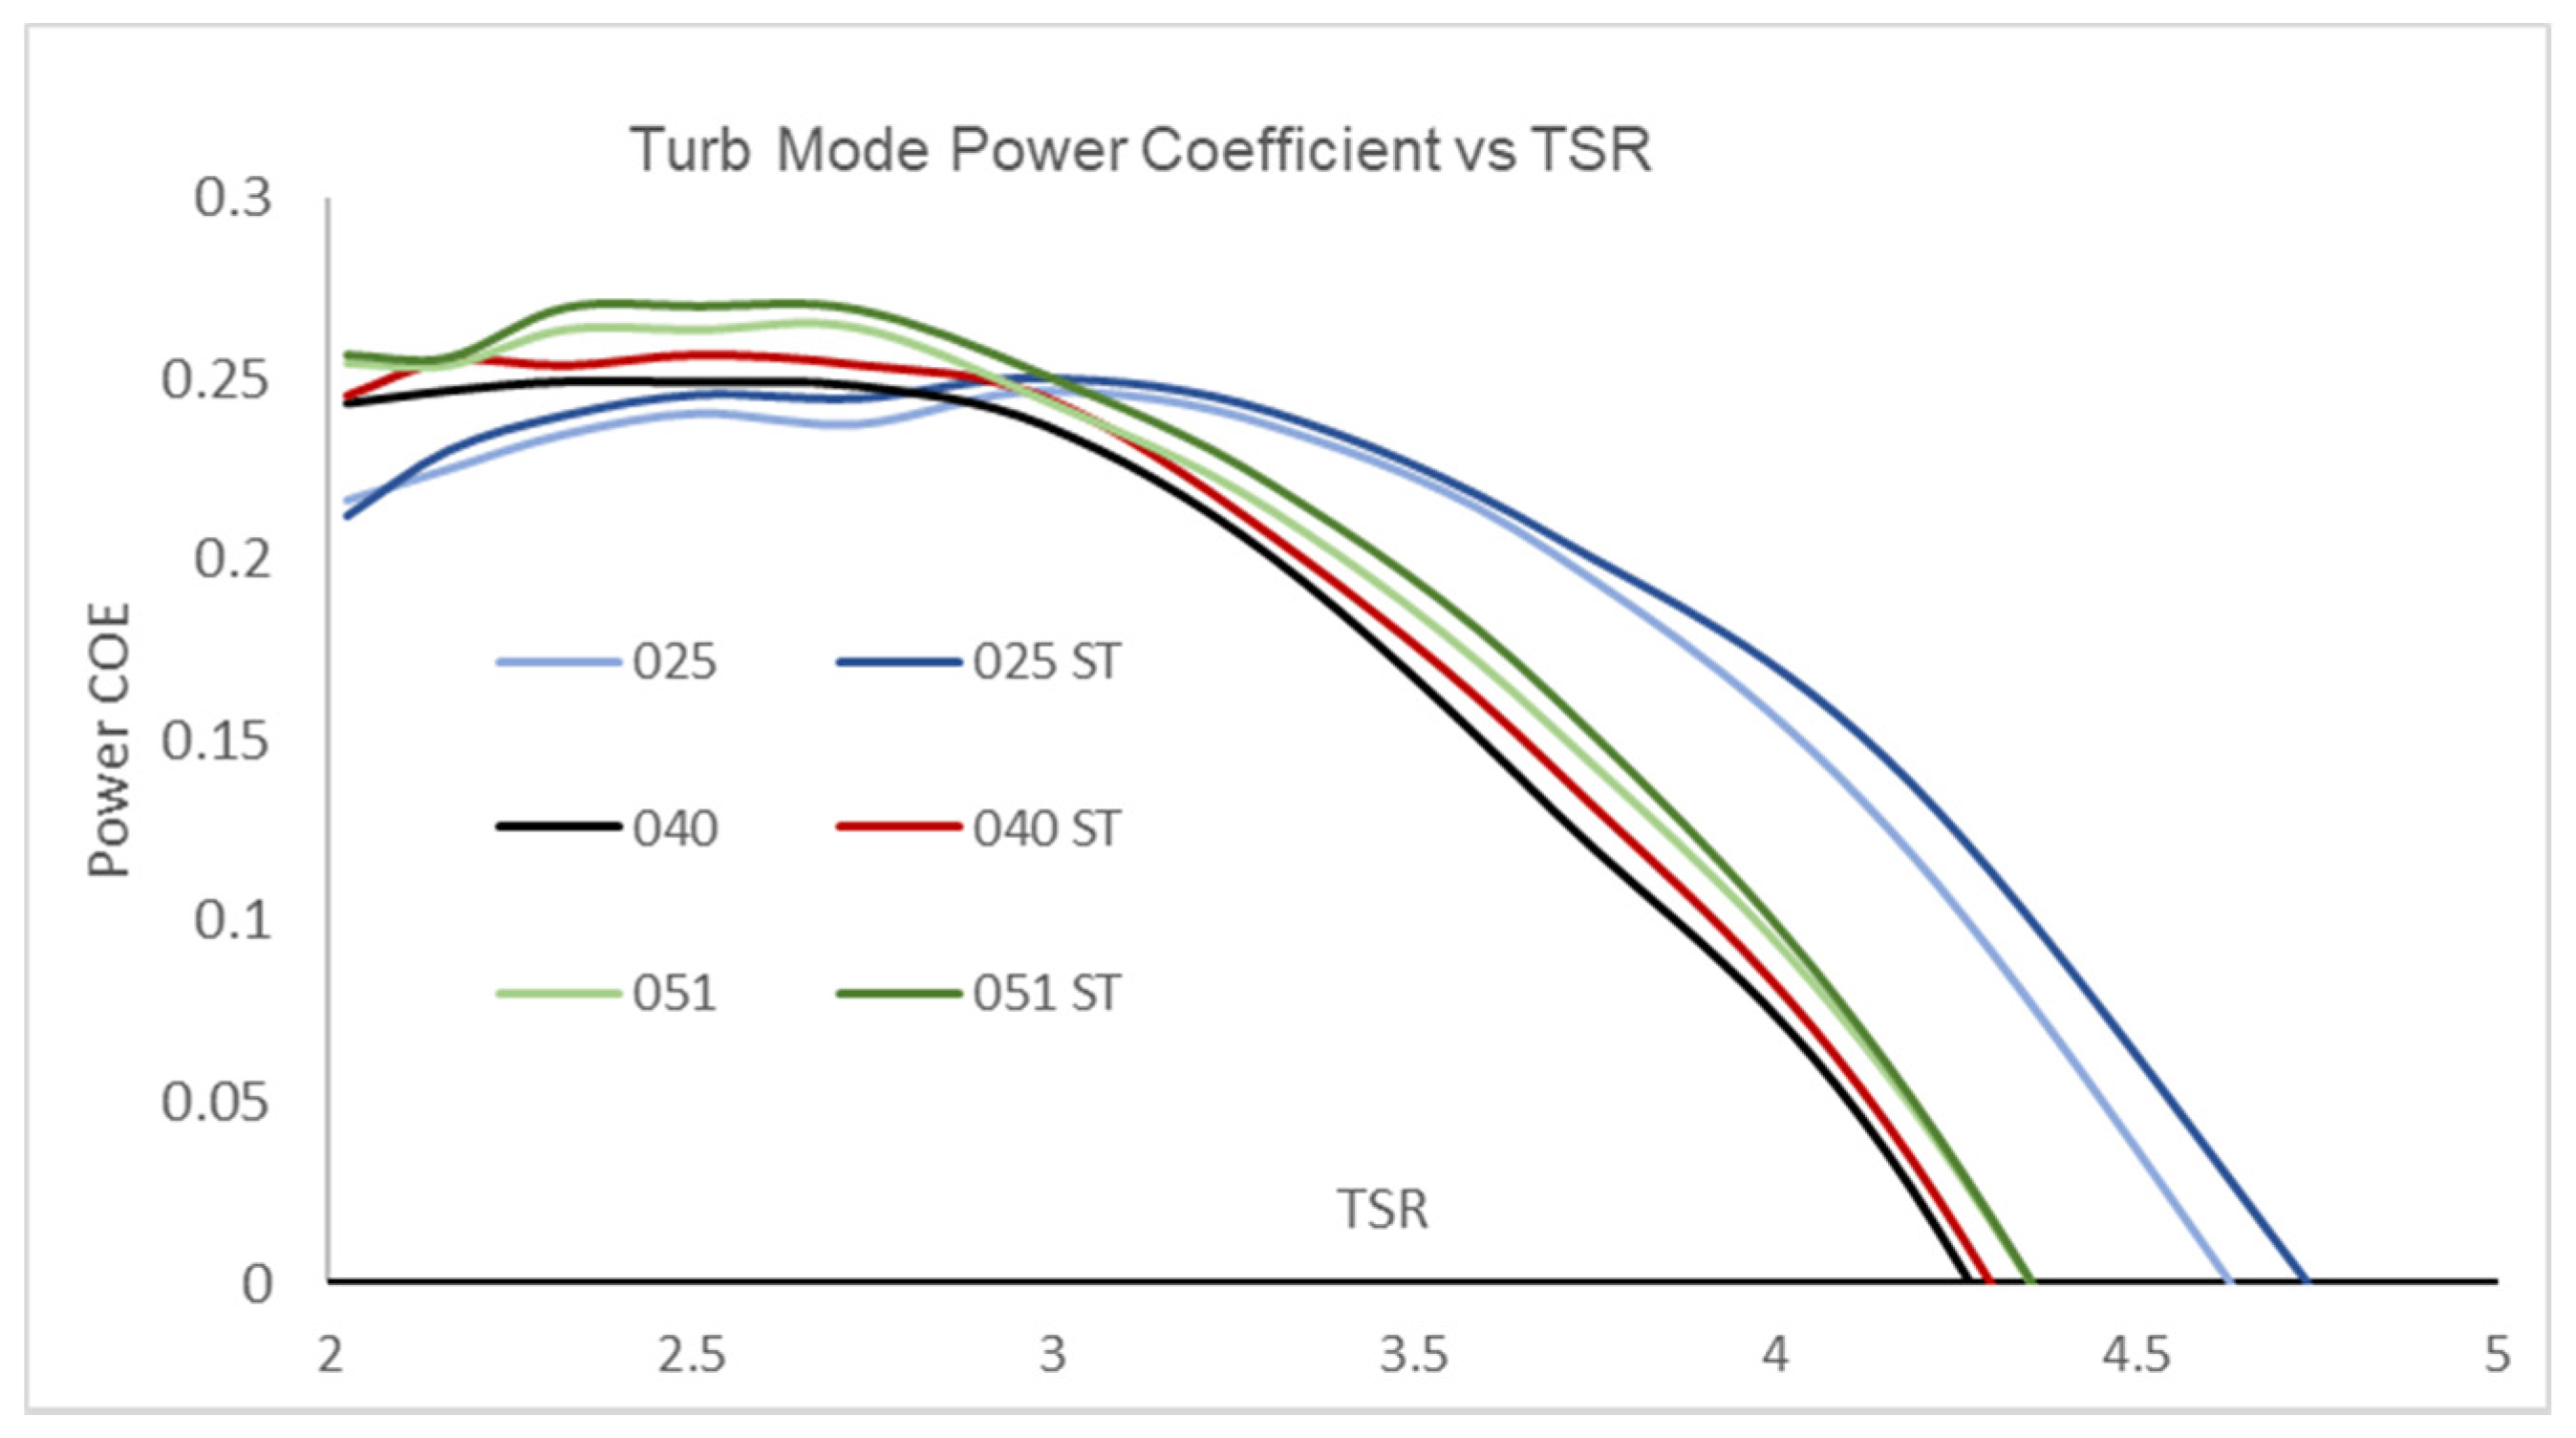
3.4. Effect of Vibration on the Turbine Mode Power Coefficient with Various Pitch Ratios
Regarding the effect of the expanded area ratio on the power generation coefficient, the results of the rotor 25%, 40%, and 51% solidities with and without struts are presented in
Figure 13.
For the rotors with all solidities, the power coefficient increases to the highest point and starts to decrease at approximately 2.5 TSR. The largest solidity rotor (%51) produced the highest power coefficient at an optimum tip speed ratio of about 2.5. All the rotors with struts produced a higher power coefficient due to the reduction of vibration and transverse oscillation. The improvement in power generation measurement for all the solidities (expanded area ratios) is substantial, for example, for the 025 and 040 rotors, the highest increase in the power coefficient is 56% and 31%, respectively, at TSR = 0.418, and for the 051 rotor, the power coefficient improvement is about 6% at TSR = 0.37.
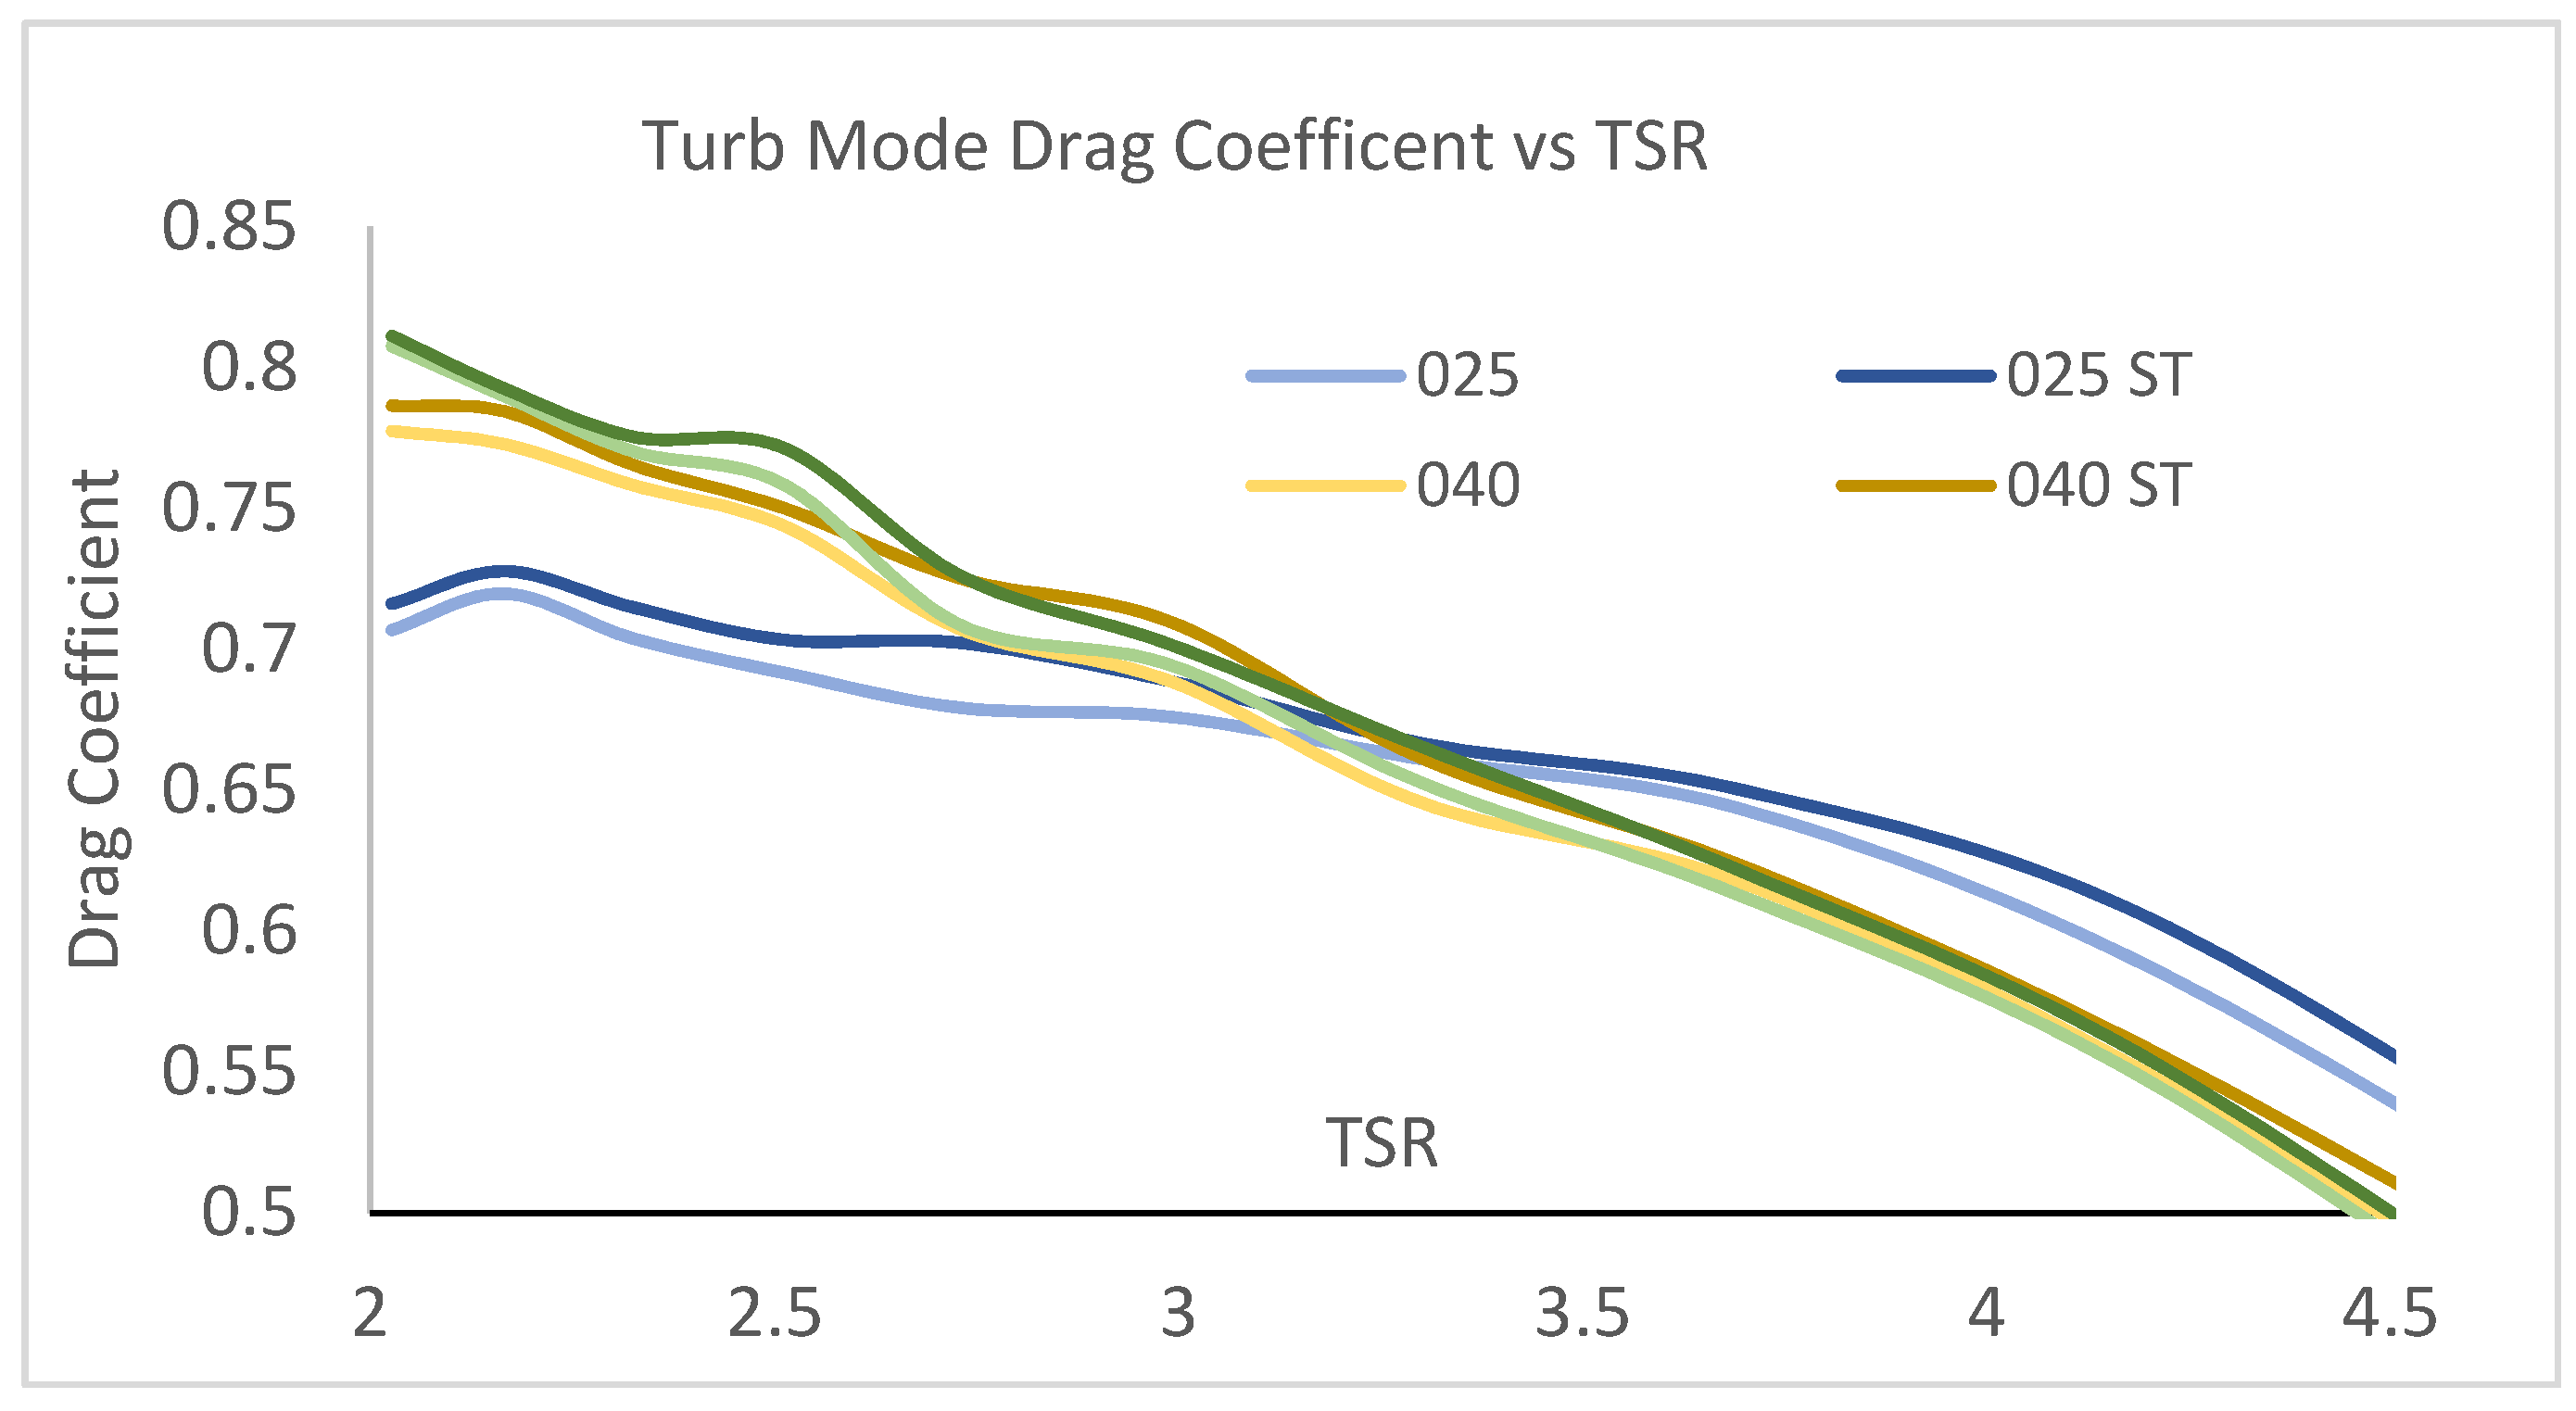
3.5. Effect of Vibration on the Turbine Mode DRAG Coefficient with Various Solidities
As commonly occurred, the drag coefficient decreases as the tip speed ratio increases because a higher tip speed ratio means a higher inflow speed (hence, a higher Reynolds number) and the drag coefficient is inversely proportional to the inflow speed (Reynolds number). It is as expected that the highest solidity generates the highest drag coefficient, i.e., the 051 rotor has the highest draft coefficient and the 025 rotor has the lowest because the higher the solidity, the higher the friction drag. A noticeable difference between the drag coefficients with struts or without struts can be seen in
Figure 14. For all solidities, the drag coefficient measurement was improved by about 3% due to the reduction of vibration and transverse oscillation.
3.6. Testing Procedure and Uncertainty Analysis
Formal guidelines used for the turbine rotor testing procedure currently do not exist. However, the test program for this study was designed and conducted by following the ITTC propeller open-water testing and uncertainty analysis [
11,
12], and referencing the wind turbine testing work [
13]. For typical propeller performance testing, the main procedure includes commission, testing, and decommission.
During testing, different rotors are switched at each constant carriage speed as the carriage speed is easier to change (by a dial) and the shaft rotational speed reaches the desired (prescribed) tip speed ratio TAR. The details of such typical propeller (turbine rotor) testing can be found in numerical publications in the literature. For details, see Liu et al. [
3].
One of the most important requirements regarding achieving accurate and reliable data is to meet the Tare run requirement of the ITTC testing procedure. A tare run runs the test at a carriage speed of zero without a rotor on the shaft before the start of the data measurements each day to obtain a zero datum of the measurement. Without the tare testing, the resulting errors could be much larger than the uncertainty calculated by theory.
Uncertainty analysis was conducted by following the uncertain analysis guidelines of ITTC [
12]. A list of the measurements and their ranges along with a sample calculation for a rotor with an expanded area ratio of 0.51 (i.e., solidity of 0.51) are given in
Table 2. In the table, the value of thrust is for the propeller, and it is drag for the turbine rotor.
This test was designed and conducted with a tank carriage speed of 1.5, 2.0, 2.5, and 3.0 m/s. The revolution speed of the motor was reduced using a 3:1 gear box. An average run elapsed time of 4 s was set for each data point. The sample rate was taken at 3.156 kHz, so the number of measurements for each data point was about 12,530. The standard deviation using the raw data was calculated (SDev (thrust) = 2.039061) and converted to KT. The maximum uncertainty UKT among all the TSRs (tip speeds) was found to be only 0.00126.
4. Conclusions
To improve the instrumented turbine rotor measuring apparatus for better reliability and accuracy, a reduction of the vibration and transverse oscillation was implemented by using four strengthening struts and a set of brackets. The improvement was obtained by analyzing and comparing the hydrodynamic characteristics of three turbine rotors of different solidities. The vibration of the apparatus in operation during the tests was also measured and recorded.
An uncertainty analysis was conducted using the procedure and guideline of ITTC’s propeller open water testing uncertainty analysis documentation. A sample calculation of the rotor drag at various tip speed ratios (TSRs) was completed for the EAR = 0.51 rotor with a test run number 180. The maximum uncertainty UKT among all the TSR was found to be only 0.005%, which indicates sound reliability and accuracy of the data obtained.
The results show that due to the reduction of vibration and transverse oscillation, the reliability and accuracy of the measurements was improved substantially. The maximum improvement of the power coefficient measurement was about 56% at TSR = 4.18, 31% at TSR = 4.18, and 6% at TSR = 3.7, respectively, for rotors with a corresponding solidity of 0.25, 0.40, and 0.51. Substantial improvement in the measurement of the drag coefficients for these rotors was also obtained at about 3%.


