
Atmospheric Drivers of Oceanic North Swells in the Eastern Caribbean


Abstract
:1. Introduction
2. Materials and Methods
2.1. Study Area
2.2. ERA5 Reanalysis
2.3. NOAA Buoys
2.4. Characterizing and Identifying Swells
2.5. Atmosphere and Swell Composites and Anomalies
2.6. Identifying Storms and Their Relationship to the North Swell
3. Results
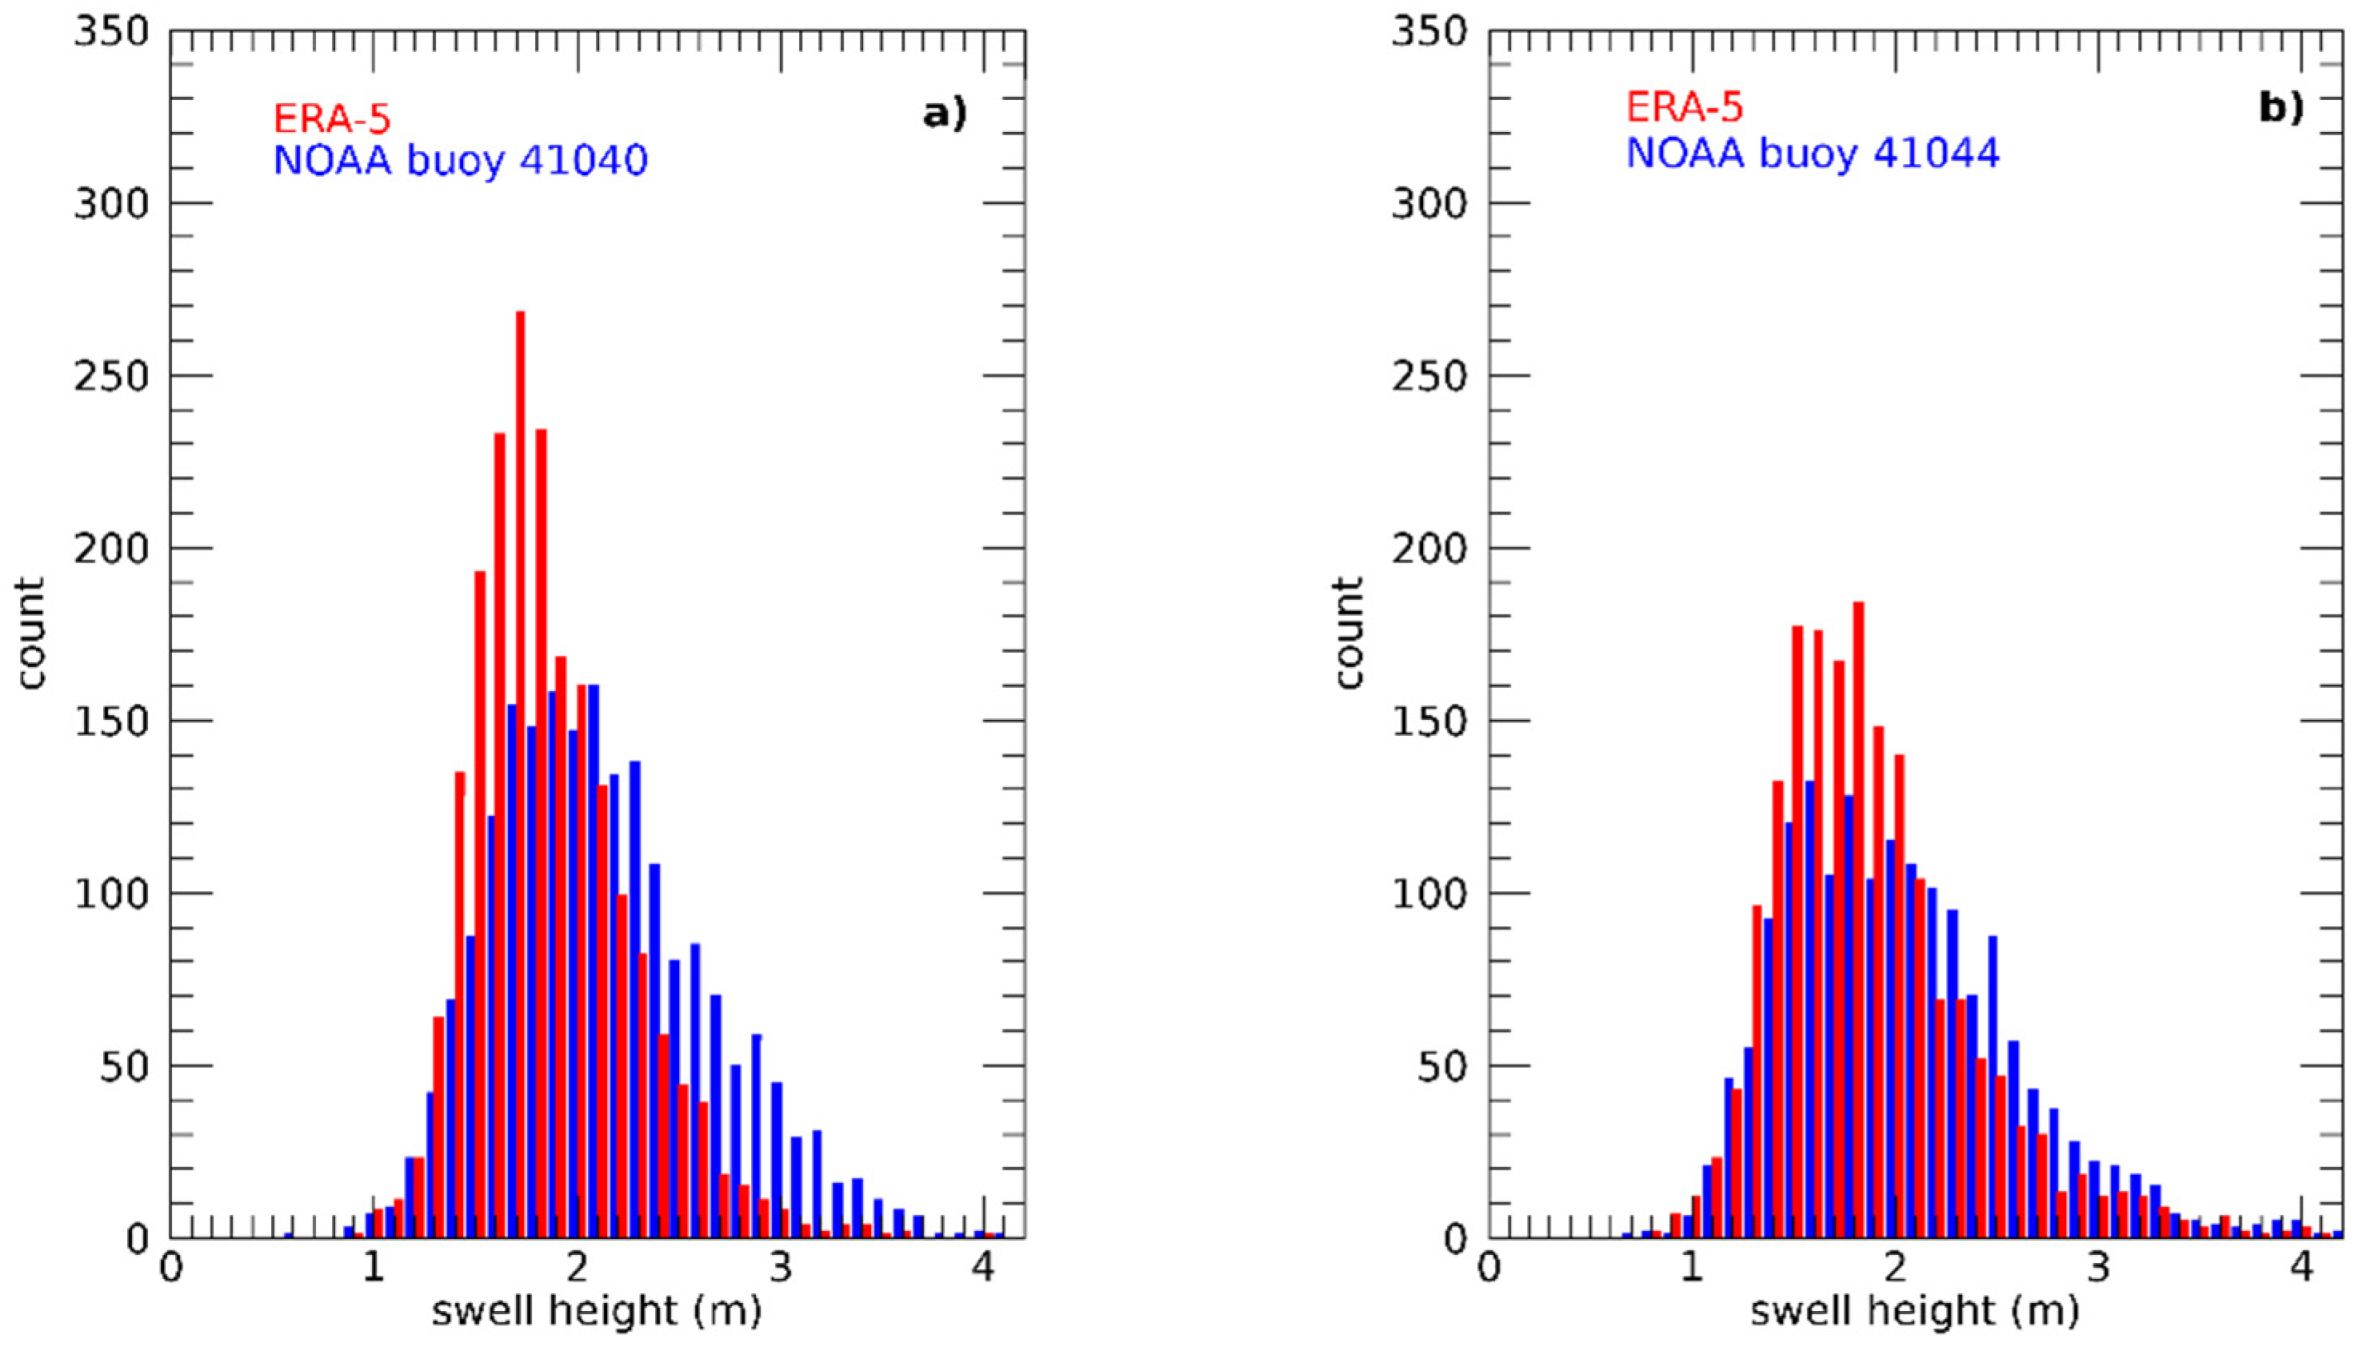
3.1. ERA5 Versus Buoy Data
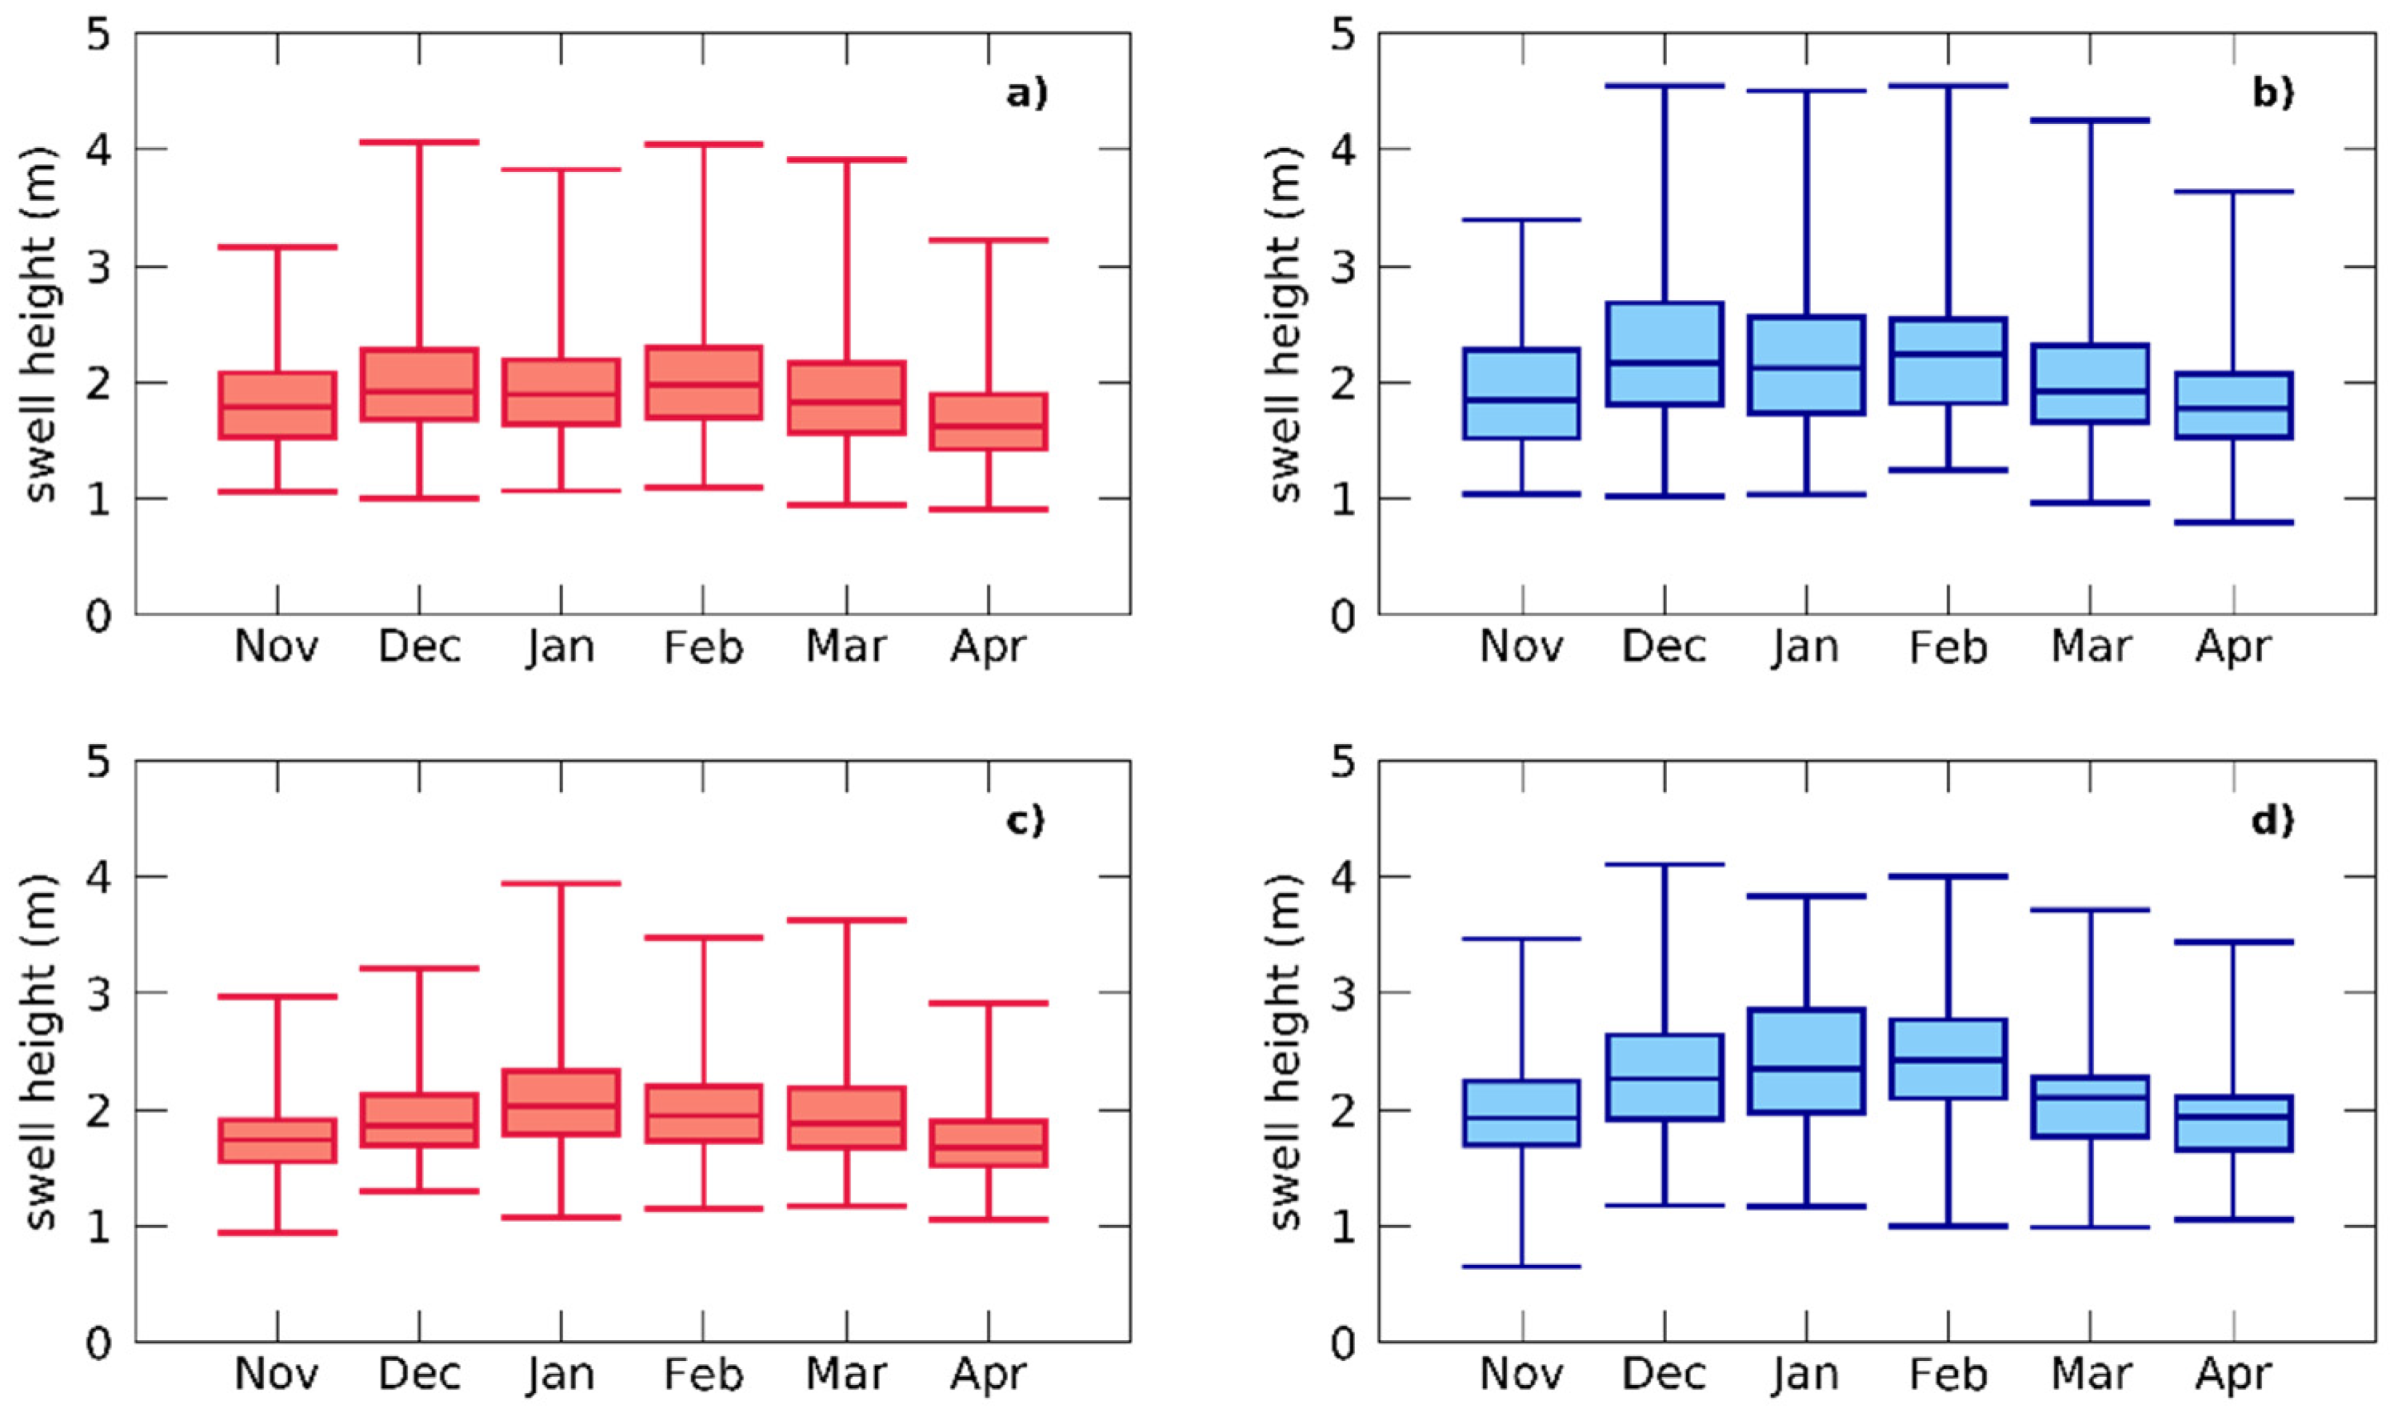
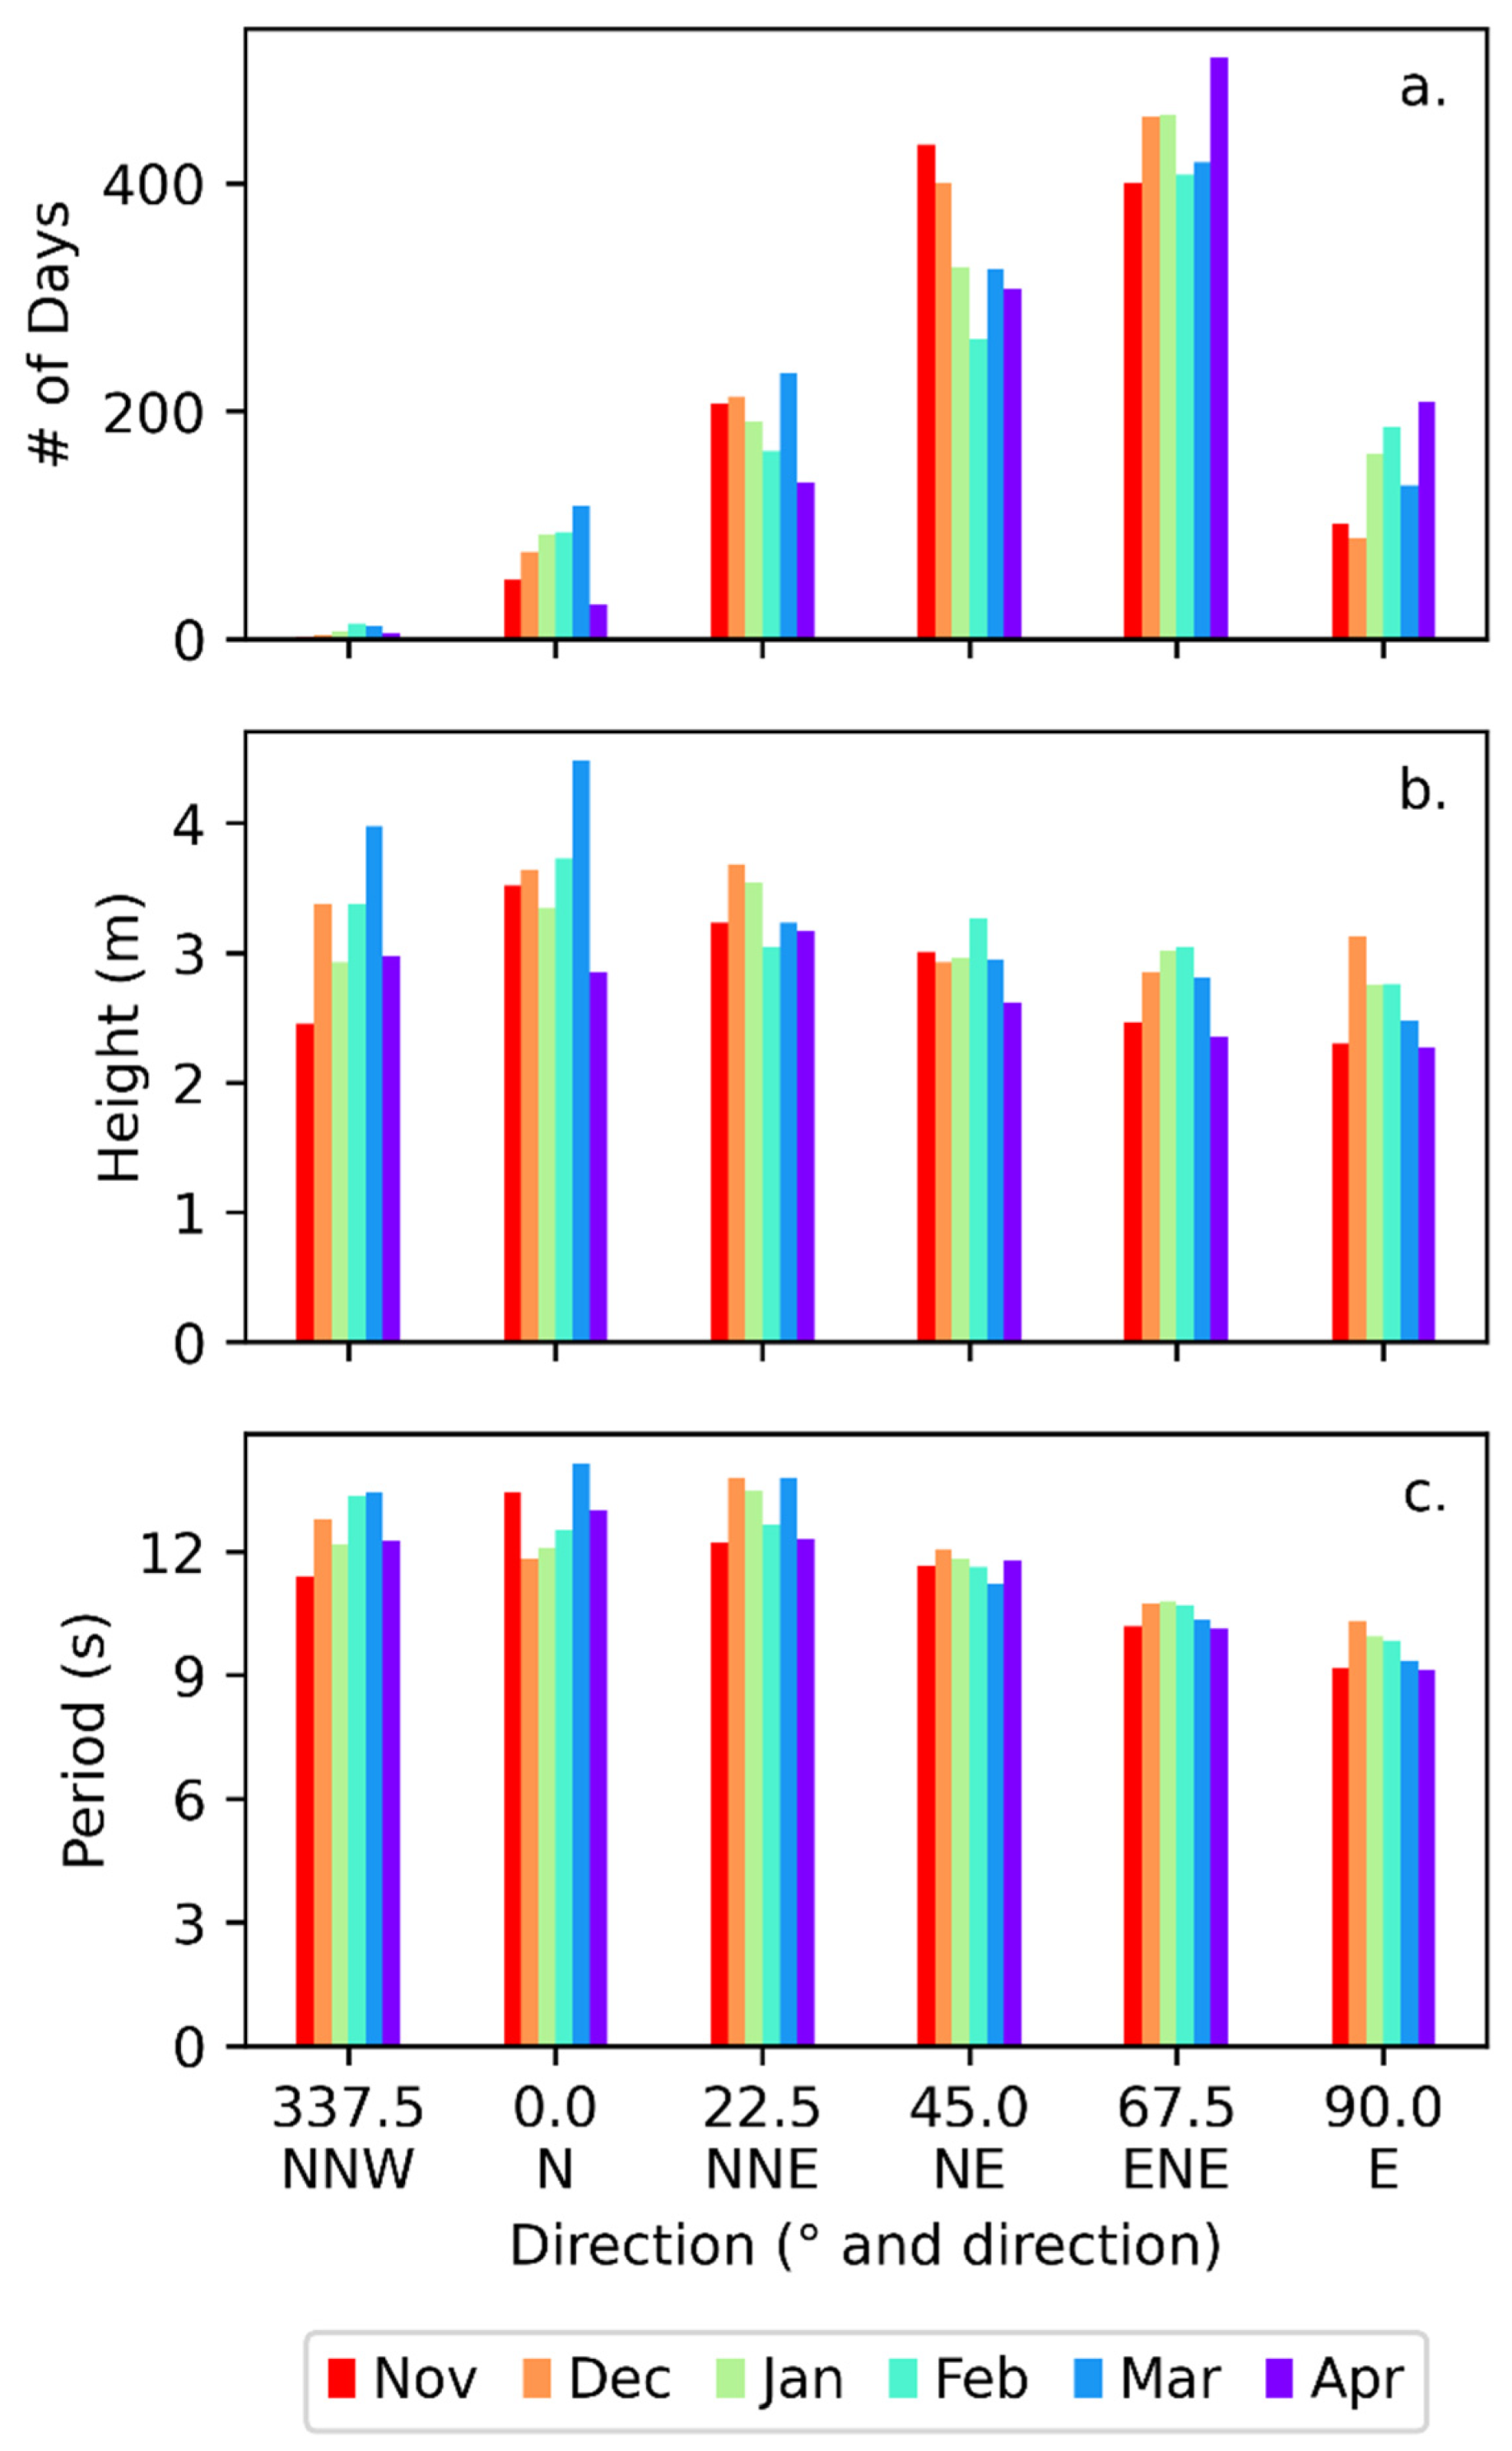
3.2. Summary of Eastern Caribbean Swell Conditions
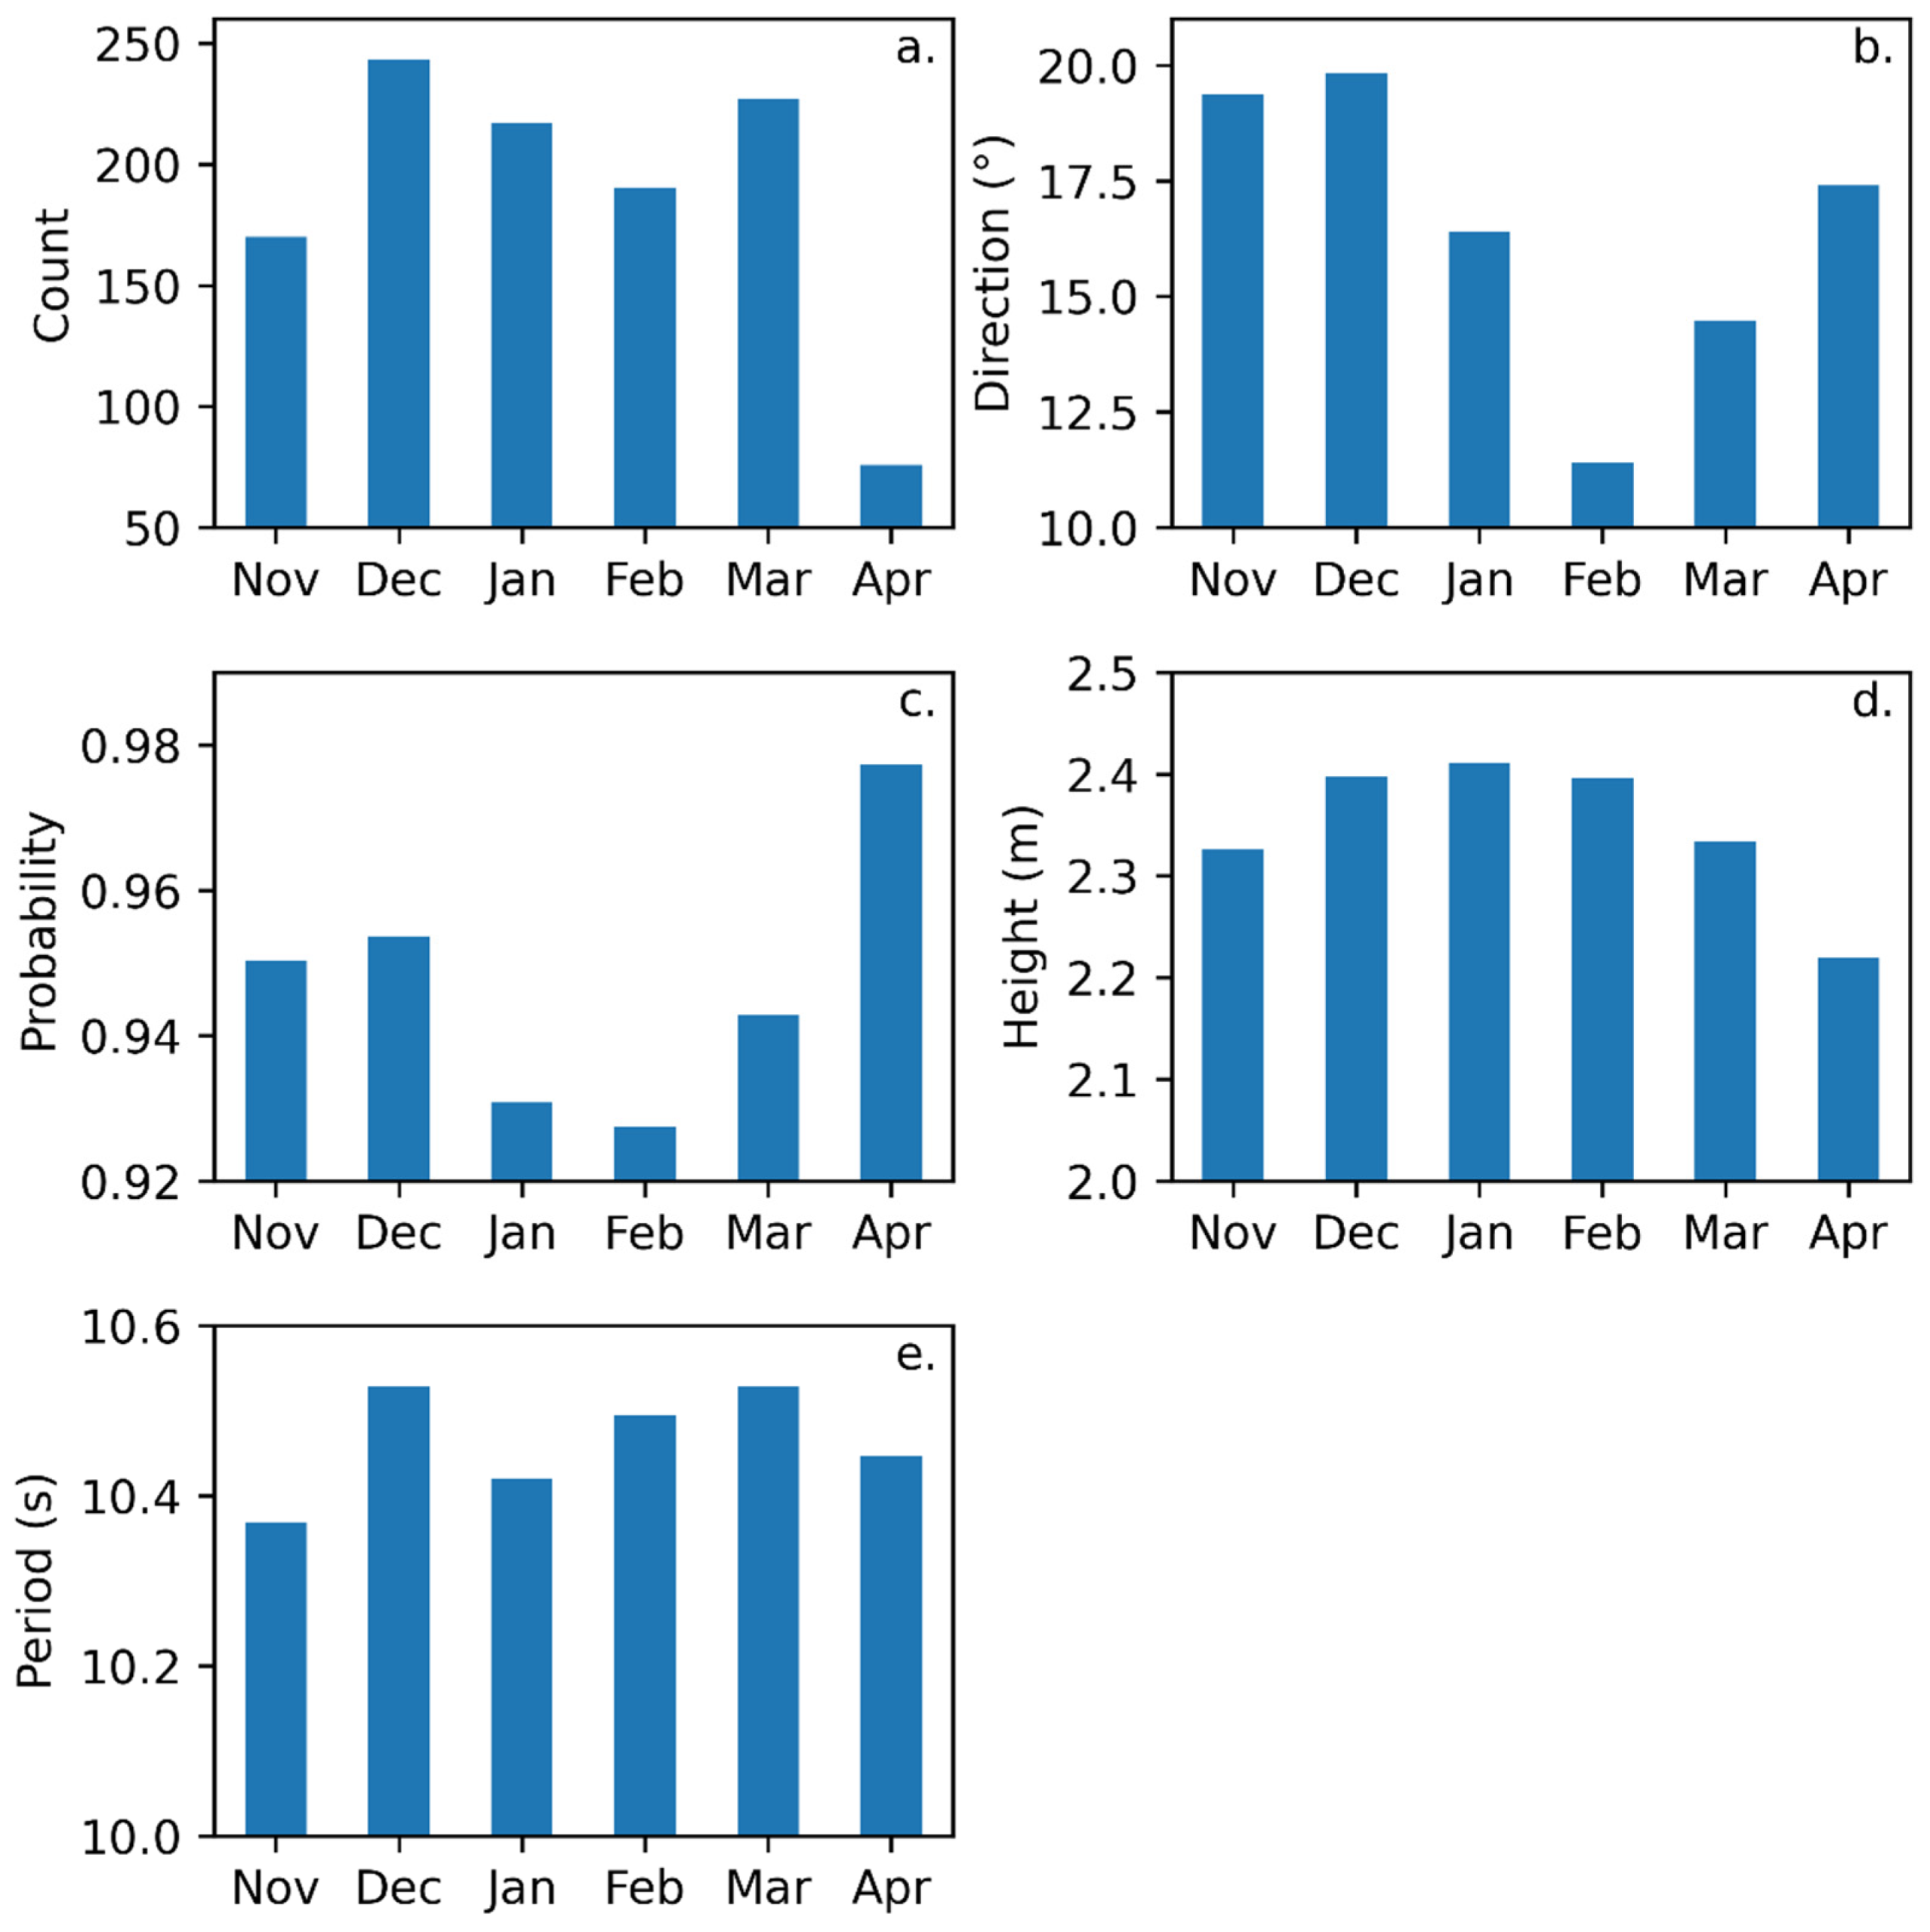
3.3. Characterizing Swell Conditions and Identifying North Swells
3.4. Atmosphere and Swell Composites and Anomalies
3.5. Identification of Storms and Their Relationship to North Swells
3.6. Non-Storm Driven Swells
4. Discussion
Supplementary Materials
Author Contributions
Funding
Institutional Review Board Statement
Informed Consent Statement
Data Availability Statement
Acknowledgments
Conflicts of Interest
References
- Munk, W.H.; Miller, G.R.; Snodgrass, F.E.; Barber, N.F.; Deacon, G.E.R. Directional Recording of Swell from Distant Storms. Philos. Trans. R. Soc. Lond. Ser. A Math. Phys. Sci. 1963, 255, 505–584. [Google Scholar] [CrossRef] [PubMed]
- Young, I.R. Seasonal Variability of the Global Ocean Wind and Wave Climate. Int. J. Climatol. 1999, 19, 931–950. [Google Scholar] [CrossRef]
- Woolf, D.K.; Challenor, P.G.; Cotton, P.D. Variability and Predictability of the North Atlantic Wave Climate. J. Geophys. Res. Oceans 2002, 107, 9-1–9-14. [Google Scholar] [CrossRef]
- Alves, J.-H.G.M. Numerical Modeling of Ocean Swell Contributions to the Global Wind-Wave Climate. Ocean Model. 2006, 11, 98–122. [Google Scholar] [CrossRef]
- Boucharel, J.; Santiago, L.; Almar, R.; Kestenare, E. Coastal Wave Extremes around the Pacific and Their Remote Seasonal Connection to Climate Modes. Climate 2021, 9, 168. [Google Scholar] [CrossRef]
- Lefèvre, J.-M. High Swell Warnings in the Caribbean Islands during March 2008. Nat. Hazards 2009, 49, 361–370. [Google Scholar] [CrossRef]
- Jury, M.R. Characteristics and Meteorology of Atlantic Swells Reaching the Caribbean. J. Coast. Res. 2018, 34, 400–412. [Google Scholar] [CrossRef]
- Cooper, J.A.G.; Jackson, D.W.T.; Gore, S. A Groundswell Event on the Coast of the British Virgin Islands: Spatial Variability in Morphological Impact. J. Coast. Res. 2013, 65, 696–701. [Google Scholar] [CrossRef]
- Nurse, L.; Mclean, R.; Agard, J.; Briguglio, L.; Duvat, V.; Pelesikoti, N.; Tompkins, E. Chapter 29: Small Islands. In Climate Change 2014: Impacts, Adaptation, and Vulnerability. Part B: Regional Aspects. Contribution of Working Group II to the Fifth Assessment Report of the Intergovernmental Panel on Climate Change; Cambridge University Press: Cambridge, UK, 2014; p. 1654. [Google Scholar]
- Young, I.R.; Zieger, S.; Babanin, A.V. Global Trends in Wind Speed and Wave Height. Science 2011, 332, 451–455. [Google Scholar] [CrossRef]
- Timmermans, B.; Stone, D.; Wehner, M.; Krishnan, H. Impact of Tropical Cyclones on Modeled Extreme Wind-Wave Climate. Geophys. Res. Lett. 2017, 44, 1393–1401. [Google Scholar] [CrossRef]
- Young, I.R.; Ribal, A. Multiplatform Evaluation of Global Trends in Wind Speed and Wave Height. Science 2019, 364, 548–552. [Google Scholar] [CrossRef] [PubMed]
- Krien, Y.; Dudon, B.; Roger, J.; Arnaud, G.; Zahibo, N. Assessing Storm Surge Hazard and Impact of Sea Level Rise in the Lesser Antilles Case Study of Martinique. Nat. Hazards Earth Syst. Sci. 2017, 17, 1559–1571. [Google Scholar] [CrossRef] [Green Version]
- Rey, T.; Leone, F.; Candela, T.; Belmadani, A.; Palany, P.; Krien, Y.; Cécé, R.; Gherardi, M.; Péroche, M.; Zahibo, N. Coastal Processes and Influence on Damage to Urban Structures during Hurricane Irma (St-Martin & St-Barthélemy, French West Indies). J. Mar. Sci. Eng. 2019, 7, 215. [Google Scholar] [CrossRef] [Green Version]
- Belmadani, A.; Dalphinet, A.; Chauvin, F.; Pilon, R.; Palany, P. Projected Future Changes in Tropical Cyclone-Related Wave Climate in the North Atlantic. Clim. Dyn. 2021, 56, 3687–3708. [Google Scholar] [CrossRef]
- Reguero, B.G.; Méndez, F.J.; Losada, I.J. Variability of Multivariate Wave Climate in Latin America and the Caribbean. Glob. Planet. Chang. 2013, 100, 70–84. [Google Scholar] [CrossRef]
- Morim, J.; Hemer, M.; Wang, X.L.; Cartwright, N.; Trenham, C.; Semedo, A.; Young, I.; Bricheno, L.; Camus, P.; Casas-Prat, M.; et al. Robustness and Uncertainties in Global Multivariate Wind-Wave Climate Projections. Nat. Clim. Chang. 2019, 9, 711–718. [Google Scholar] [CrossRef] [Green Version]
- Hersbach, H.; Bell, B.; Berrisford, P.; Biavati, G.; Horányi, A.; Muñoz Sabater, J.; Nicolas, J.; Peubey, C.; Radu, R.; Rozum, I.; et al. ERA5 hourly data on single levels from 1979 to present. Copernic. Clim. Change Serv. Clim. Data Store 2022. [Google Scholar] [CrossRef]
- Hersbach, H.; Bell, B.; Berrisford, P.; Hirahara, S.; Horányi, A.; Muñoz-Sabater, J.; Nicolas, J.; Peubey, C.; Radu, R.; Schepers, D.; et al. The ERA5 Global Reanalysis. Q. J. R. Meteorol. Soc. 2020, 146, 1999–2049. [Google Scholar] [CrossRef]
- Camus, P.; Mendez, F.J.; Medina, R.; Cofiño, A.S. Analysis of Clustering and Selection Algorithms for the Study of Multivariate Wave Climate. Coast. Eng. 2011, 58, 453–462. [Google Scholar] [CrossRef]
- Moron, V.; Gouirand, I.; Taylor, M. Weather Types across the Caribbean Basin and Their Relationship with Rainfall and Sea Surface Temperature. Clim. Dyn. 2016, 47, 601–621. [Google Scholar] [CrossRef]
- Méndez, F.J.; Rueda, A. 3—Wave Climates: Deep Water to Shoaling Zone. In Sandy Beach Morphodynamics; Jackson, D.W.T., Short, A.D., Eds.; Elsevier: Amsterdam, The Netherlands, 2020; pp. 39–59. ISBN 978-0-08-102927-5. [Google Scholar]
- Dawson, A. Eofs: A Library for EOF Analysis of Meteorological, Oceanographic, and Climate Data. J. Open Res. Softw. 2016, 4, e14. [Google Scholar] [CrossRef] [Green Version]
- Jain, A.K.; Murty, M.N.; Flynn, P.J. Data Clustering: A Review. ACM Comput. Surv. 1999, 31, 264–323. [Google Scholar] [CrossRef]
- Biabiany, E.; Bernard, D.C.; Page, V.; Paugam-Moisy, H. Design of an Expert Distance Metric for Climate Clustering: The Case of Rainfall in the Lesser Antilles. Comput. Geosci. 2020, 145, 104612. [Google Scholar] [CrossRef]
- Arvai, K. K-Means Clustering in Python: A Practical Guide—Real Python. Available online: https://realpython.com/k-means-clustering-python/ (accessed on 17 June 2021).
- Wang, X.L.; Feng, Y.; Swail, V.R. Changes in Global Ocean Wave Heights as Projected Using Multimodel CMIP5 Simulations. Geophys. Res. Lett. 2014, 41, 1026–1034. [Google Scholar] [CrossRef]
- Naghettini, M. (Ed.) Fundamentals of Statistical Hydrology; Springer: Berlin/Heidelberg, Germany, 2016; ISBN 978-3-319-43560-2. [Google Scholar]
- Hodges, K.I. Adaptive Constraints for Feature Tracking. Mon. Weather Rev. 1999, 127, 1362–1373. [Google Scholar] [CrossRef]
- Hirsch, M.E.; DeGaetano, A.T.; Colucci, S.J. An East Coast Winter Storm Climatology. J. Clim. 2001, 14, 882–899. [Google Scholar] [CrossRef]
- Paciorek, C.J.; Risbey, J.S.; Ventura, V.; Rosen, R.D. Multiple Indices of Northern Hemisphere Cyclone Activity, Winters 1949–1999. J. Clim. 2002, 15, 1573–1590. [Google Scholar] [CrossRef] [Green Version]
- Eichler, T.; Higgins, W. Climatology and ENSO-Related Variability of North American Extratropical Cyclone Activity. J. Clim. 2006, 19, 2076–2093. [Google Scholar] [CrossRef]
- Hodges, K.I.; Lee, R.W.; Bengtsson, L. A Comparison of Extratropical Cyclones in Recent Reanalyses ERA-Interim, NASA MERRA, NCEP CFSR, and JRA-25. J. Clim. 2011, 24, 4888–4906. [Google Scholar] [CrossRef]
- Bernhardt, J.E.; DeGaetano, A.T. Meteorological Factors Affecting the Speed of Movement and Related Impacts of Extratropical Cyclones along the U.S. East Coast. Nat. Hazards 2012, 61, 1463–1472. [Google Scholar] [CrossRef]
- Booth, J.F.; Rieder, H.E.; Lee, D.E.; Kushnir, Y. The Paths of Extratropical Cyclones Associated with Wintertime High-Wind Events in the Northeastern United States. J. Appl. Meteorol. Climatol. 2015, 54, 1871–1885. [Google Scholar] [CrossRef]
- Varino, F.; Arbogast, P.; Joly, B.; Riviere, G.; Fandeur, M.-L.; Bovy, H.; Granier, J.-B. Northern Hemisphere Extratropical Winter Cyclones Variability over the 20th Century Derived from ERA-20C Reanalysis. Clim. Dyn. 2019, 52, 1027–1048. [Google Scholar] [CrossRef]
- Dodet, G.; Piolle, J.-F.; Quilfen, Y.; Abdalla, S.; Accensi, M.; Ardhuin, F.; Ash, E.; Bidlot, J.-R.; Gommenginger, C.; Marechal, G.; et al. The Sea State CCI Dataset v1: Towards a Sea State Climate Data Record Based on Satellite Observations. Earth Syst. Sci. Data 2020, 12, 1929–1951. [Google Scholar] [CrossRef]
- Timmermans, B.W.; Gommenginger, C.P.; Dodet, G.; Bidlot, J.-R. Global Wave Height Trends and Variability from New Multimission Satellite Altimeter Products, Reanalyses, and Wave Buoys. Geophys. Res. Lett. 2020, 47, e2019GL086880. [Google Scholar] [CrossRef]
- Hurrell, J.W.; Kushnir, Y.; Ottersen, G.; Visbeck, M. An Overview of the North Atlantic Oscillation. In The North Atlantic Oscillation: Climatic Significance and Environmental Impact; American Geophysical Union (AGU): Washington, DC, USA, 2003; pp. 1–35. ISBN 978-1-118-66903-7. [Google Scholar]
- Morales-Márquez, V.; Orfila, A.; Simarro, G.; Marcos, M. Extreme Waves and Climatic Patterns of Variability in the Eastern North Atlantic and Mediterranean Basins. Ocean Sci. 2020, 16, 1385–1398. [Google Scholar] [CrossRef]
- Lemos, G.; Menendez, M.; Semedo, A.; Miranda, P.M.A.; Hemer, M. On the Decreases in North Atlantic Significant Wave Heights from Climate Projections. Clim. Dyn. 2021, 57, 2301–2324. [Google Scholar] [CrossRef]


| Direction (°) | # of Days | % of Days | Max Height (m) | Max Period (s) |
|---|---|---|---|---|
| 337.5 | 44 | 0.6 | 3.2 | 12.6 |
| 0.0 | 462 | 6.4 | 3.6 | 12.8 |
| 22.5 | 1145 | 15.8 | 3.3 | 13.0 |
| 45.0 | 2054 | 28.4 | 3.0 | 11.7 |
| 67.5 | 2653 | 36.6 | 2.8 | 10.5 |
| 90.0 | 881 | 12.2 | 2.6 | 9.6 |
| Variable | r | p |
|---|---|---|
| Swell Period | 0.712 | 0.000 |
| Swell Zonal Component | 0.010 | 0.830 |
| Swell Meridional Component | 0.030 | 0.515 |
| Storm Minimum Pressure | −0.019 | 0.717 |
| Storm Minimum Pressure Latitude | −0.187 | 0.000 |
| Storm Minimum Pressure Longitude | 0.125 | 0.016 |
| Storm Daily Average Latitudinal Distance | 0.022 | 0.679 |
| Storm Daily Average Longitudinal Distance | −0.132 | 0.011 |
Publisher’s Note: MDPI stays neutral with regard to jurisdictional claims in published maps and institutional affiliations. |
© 2022 by the authors. Licensee MDPI, Basel, Switzerland. This article is an open access article distributed under the terms and conditions of the Creative Commons Attribution (CC BY) license (https://creativecommons.org/licenses/by/4.0/).
Share and Cite
Hawkins, T.W.; Gouirand, I.; Allen, T.; Belmadani, A. Atmospheric Drivers of Oceanic North Swells in the Eastern Caribbean. J. Mar. Sci. Eng. 2022, 10, 183. https://doi.org/10.3390/jmse10020183
Hawkins TW, Gouirand I, Allen T, Belmadani A. Atmospheric Drivers of Oceanic North Swells in the Eastern Caribbean. Journal of Marine Science and Engineering. 2022; 10(2):183. https://doi.org/10.3390/jmse10020183
Chicago/Turabian StyleHawkins, Timothy W., Isabelle Gouirand, Theodore Allen, and Ali Belmadani. 2022. "Atmospheric Drivers of Oceanic North Swells in the Eastern Caribbean" Journal of Marine Science and Engineering 10, no. 2: 183. https://doi.org/10.3390/jmse10020183
APA StyleHawkins, T. W., Gouirand, I., Allen, T., & Belmadani, A. (2022). Atmospheric Drivers of Oceanic North Swells in the Eastern Caribbean. Journal of Marine Science and Engineering, 10(2), 183. https://doi.org/10.3390/jmse10020183