Article

Mechanical Behavior of the Rock-Concrete Interface for a Bridge Anchorage Structure Using Discrete Element Method

1
State Key Laboratory of Geomechanics and Geotechnical Engineering, Institute of Rock and Soil Mechanics, Chinese Academy of Sciences, Wuhan 430071, China
2
School of Engineering Science, University of Chinese Academy of Sciences, Beijing 100049, China
*
Author to whom correspondence should be addressed.
J. Mar. Sci. Eng. 2022, 10(2), 221; https://doi.org/10.3390/jmse10020221
Submission received: 23 December 2021 / Revised: 23 January 2022 / Accepted: 2 February 2022 / Published: 7 February 2022
(This article belongs to the Special Issue Design and Analysis of Offshore Structures)

Abstract

:
Traditionally, the numerical simulation work of a bridge gravity anchorage structure is performed with a continuous method, such as the finite element method (FEM). However, since the rock mass and gravity anchorage structure are assumed to be continuous in the FEM, the interaction between the rock mass foundation and the concrete of the anchorage is not frequently considered. This paper aims to investigate the problem of the interaction between the rock mass foundation and the concrete of the anchorage. The discrete element method (DEM), which has been verified to be suitable for the modelling of contact problems of discrete blocks, is introduced in this paper to simulate the mechanical behavior of the rock-concrete system of the gravity anchorage structure and its rock mass foundation. Based on the in-situ scale model test for a bridge, the mechanical behavior of the rock-concrete interface was discussed with the DEM method. With the calibrated DEM model, the displacement of the foundation rock mass, contact stresses, and yield state on the rock-concrete interface were numerically investigated. The anti-sliding effect of the keyway and the step at the bottom of the gravity anchorage structure was analyzed. The results show that the anchorage deformation under the design conditions is basically characterized by the rigid rotation around the keyway of platform #2, and that such rotation subsequently affects the anti-shear capacity of the entire gravity anchorage to a large extent. The anchorage scale model could remain stable under the design lateral load such that the rock-concrete interface would remain intact and sufficient shear resistance could be provided by the keyway and steps.

1. Introduction

The increasing economic development of global society has resulted in a growing demand for long-span bridges. Suspension bridges, which possess aesthetic, economic, and technical advantages, are usually selected to span large rivers [1,2,3,4]. In a suspension bridge, the anchorage bears the tension force passed by the suspension cables. Therefore, the anchorage is one of the most important structures of a suspension bridge. The anchorage can be basically categorized into the tunnel type anchorage [5] and the gravity anchorage [6], in which the gravity anchorage is the most used type. The gravity anchorage resists the vertical component of the cable tension force with its own weight and the horizontal component of the cable tension force with the friction between the anchorage concrete and the underlying rock mass [6,7,8].
Considerable research on gravity anchorage stability has been carried out with various methods such as the rigid body model, the finite-length beam assumption method, and numerical simulation [6,7,9,10,11,12,13,14]. Generally, the finite element method (FEM) is applied to numerically analyze the anchorage stabilization. Li et al. [10] studied the horizontal bearing capacity of gravity-type anchorages with the FEM code ABAQUS. Wu et al. [11] established the FEM model of the gravity anchorage of the Aizhai Bridge and then analyzed the tensile and compressive principal stresses within the anchorage structure. The interaction between anchorage concrete and foundation rock mass, in general, is hardly considered because all the elements are assumed to be continuous in the FEM. Although certain effects have been made on the contact problems of gravity anchorage with theoretical solutions [5,15,16], numerical simulation [7,14] and model testing [17,18], systematic investigation work is not yet available.
Therefore, the discrete element method (DEM), which is specially designed to deal with discontinuous mass problems, was introduced in this paper to analyze the mechanical behavior of the interface between rock and concrete from a new perspective by considering the anchorage structure and the foundation as discontinuous media. Furthermore, the stability of a gravity anchorage model would also be analyzed using the DEM approach.
The mechanical behavior of the concrete-rock interface of the gravity anchorage of a planned bridge was simulated numerically by the discrete element method in this paper. Based on the in-situ scale model test project for a planned bridge, the mechanical behavior of the rock-concrete interface was discussed with the DEM method. Firstly, based on two in-situ direct shear tests, the deformation and failure features of the rock-concrete interface were analyzed. Additionally, the parameters of the rock-concrete interface were calibrated. Subsequently, a DEM model for the scale model of the gravity anchorage were constructed. Along with the calibrated parameters, the mechanical behavior of the anchorage model under its design load was investigated. The displacement of the anchorage and the foundation rock mass, the contact stress distribution on the rock-concrete interfaces, and the yield state of the interface were simulated numerically. Additionally, the failure progress and failure mode of scale model of the gravity anchorage under overload conditions were estimated. Finally, the anti-sliding effect of the keyway and platform at the bottom surface of the anchorage was studied.

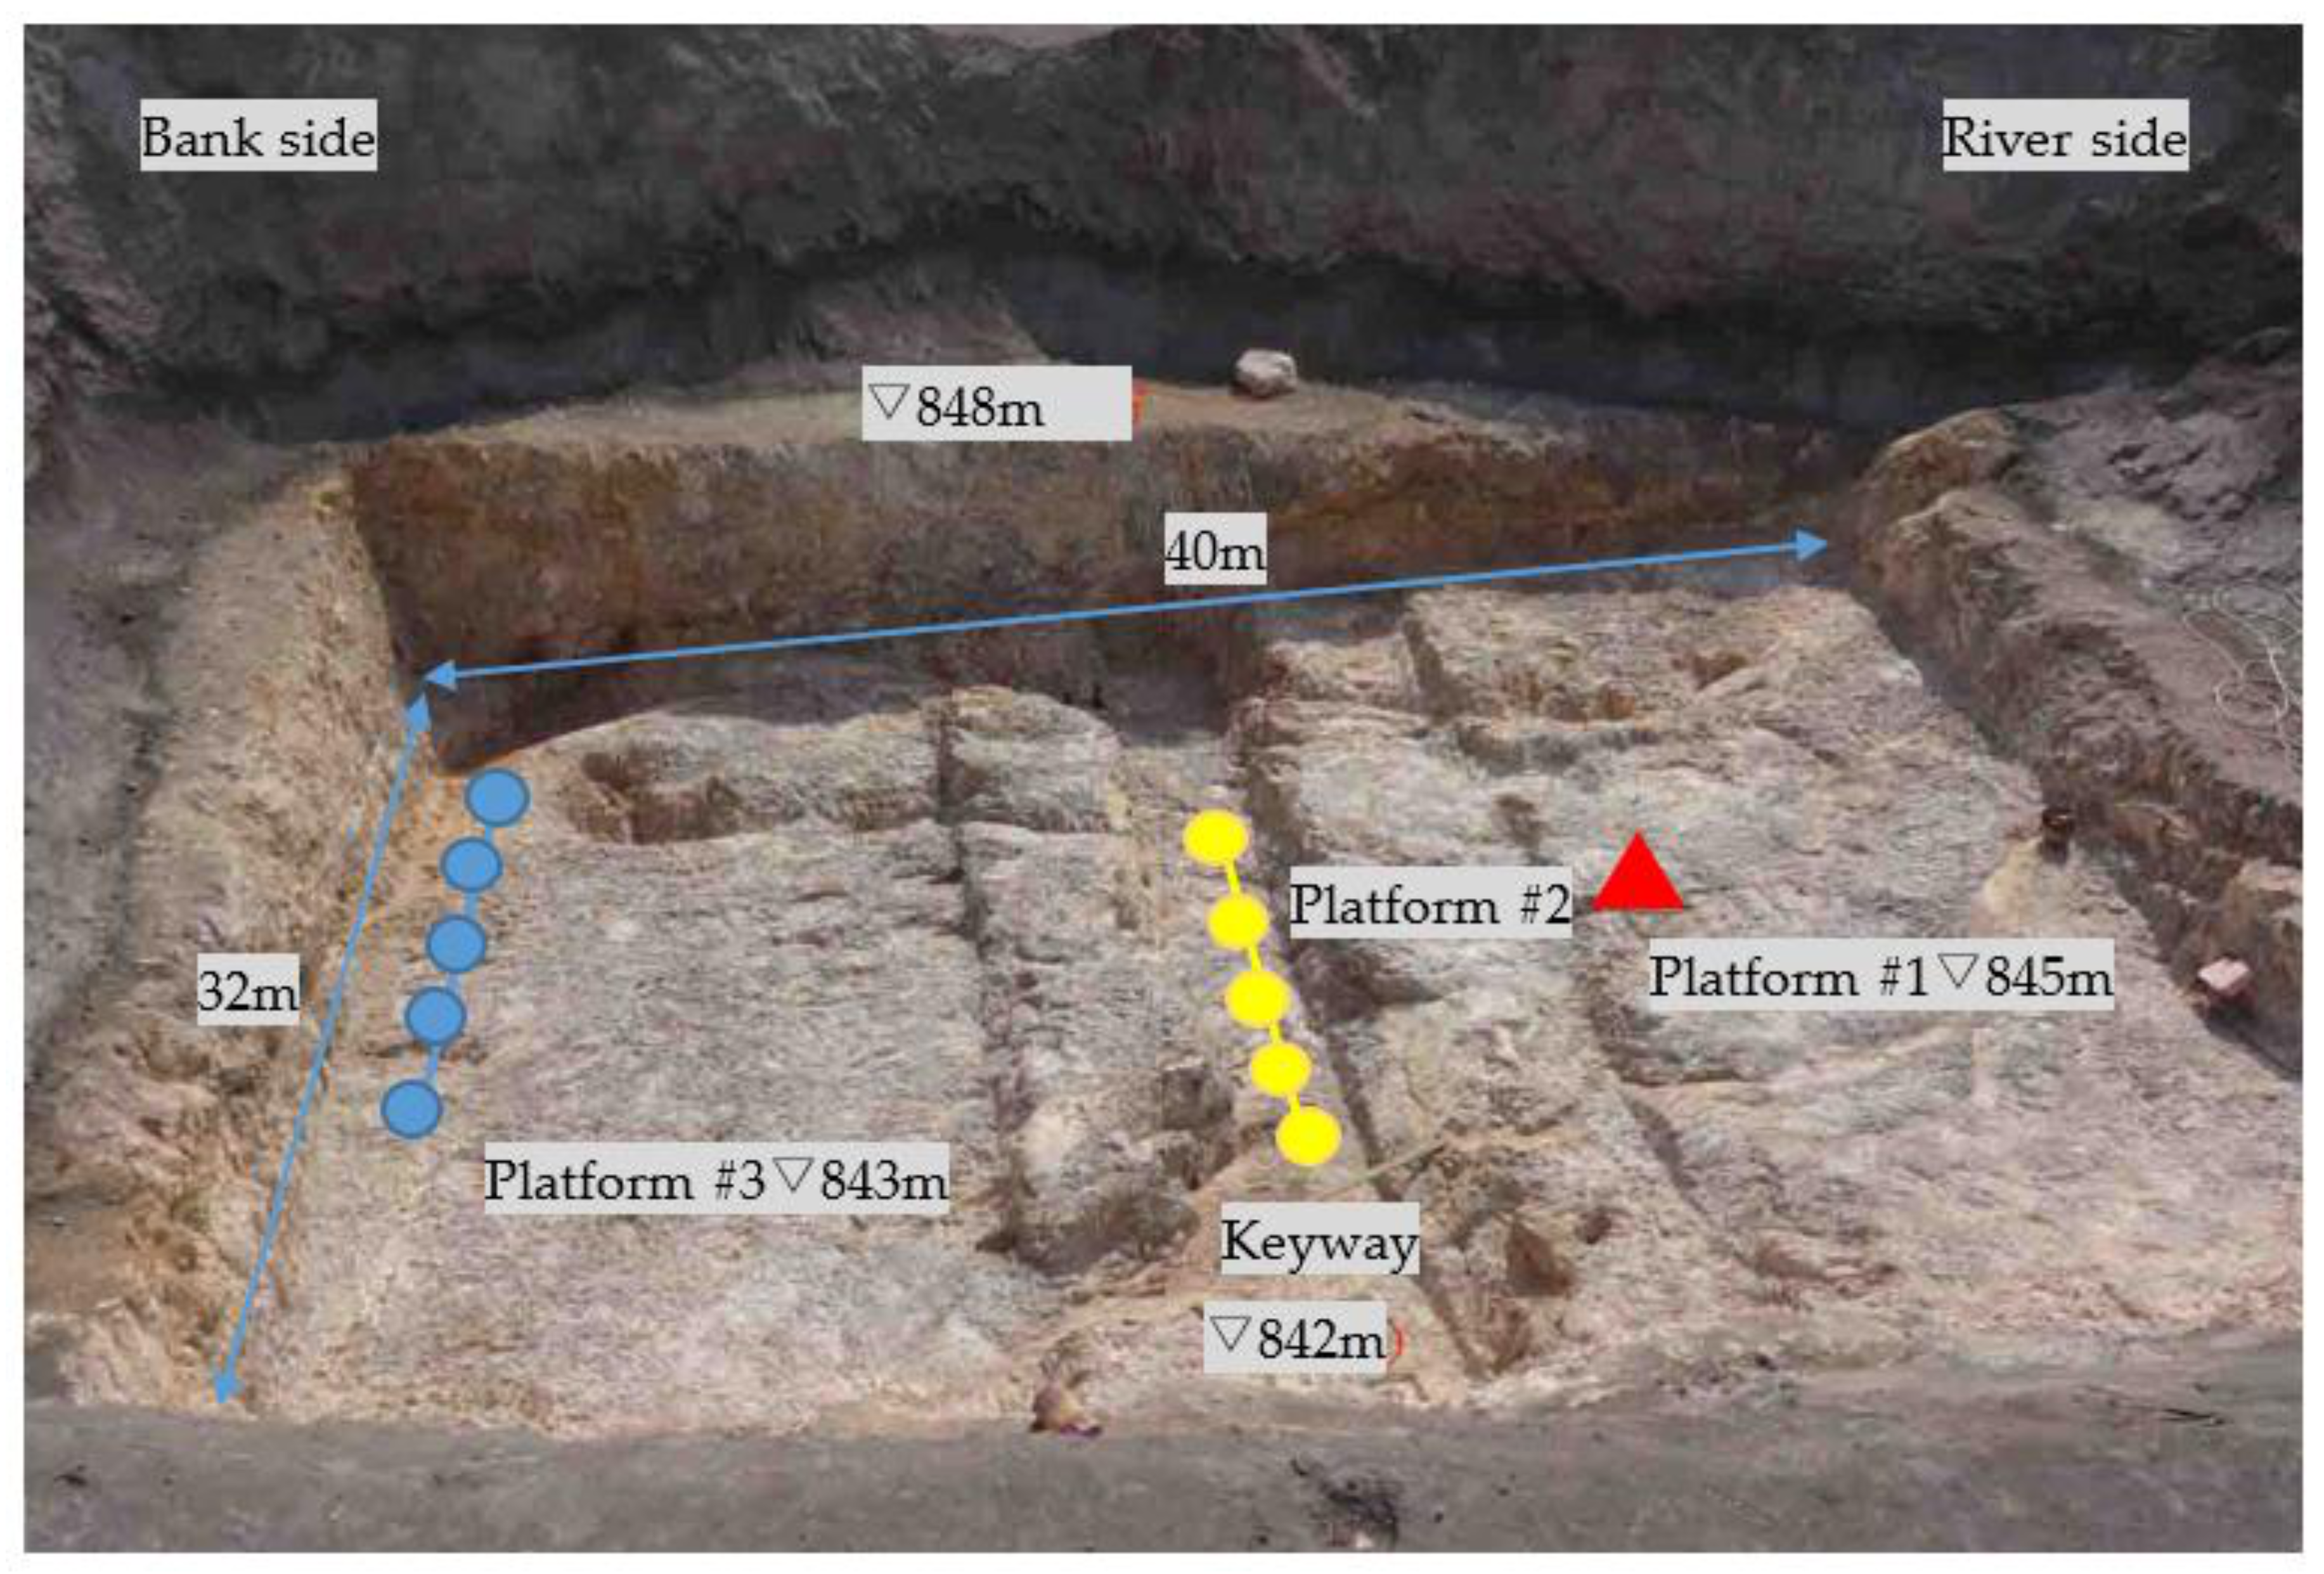
2. In-Situ Direct Shear Test for the Rock-Concrete Interface

The planned Jingxi bridge in Yunnan province, China, is investigated as the background project of this paper. This 700 m-long suspension bridge was planned in the late 2010s of this century and is a representative of the typical Chinese-style suspension bridge. A tunnel-type anchorage was planned for left bank side and a gravity-type anchorage was planned for the right bank side. The bridge deck is 20 m wide, and the right-bank anchorage is located on the mountain top with gentle terrain. The mountain top has an elevation of about 870 m, with slope angle of generally 10~20°. The rock outcrop on the right bank is basically dominated by abundant loose joints and fractures. The gravity-type anchorage on the right bank side was selected as the background case.
To analyze the gravity anchorage stability and to provide design parameters for the designers, a series of rock mass-concrete contact tests and a scale model test were conducted on the rock mass supporting the anchorage to determine various mechanical parameters, which may provide a reasonable and reliable technical support for the design and construction of the bridge anchorage. Several shear tests were directly carried out on the foundation rock mass for the bridge anchorage, to obtain appropriate mechanical properties of concrete-rock interface, as shown in Figure 1. The main investigation of this paper would be based on these test data.
The in-situ direct shear tests for the rock mass-concrete contact surface were conducted in two representative locations. Location #1 was marked with yellow dots and Location #2 was marked with blue dots in Figure 1. The shear surface was 50 cm × 50 cm in size (see Figure 2), and the normal stress levels on the specimens were 1.0, 1.25, 1.5, 1.75, and 2.0 MPa, respectively. Each normal stress was applied through 4 loading steps, and the shear stress was exerted through 8–10 steps depending on the estimated peak shear strength. The normal and shear stresses were both applied step by step at 5 min intervals. The peak shear was recorded immediately after the contact surface failed, and then the shear loading continued to be exerted until the basically stable shear was obtained. During the in-situ shear tests, the shear displacements and shear force (stress) were measured, and the corresponding curves were plotted, as shown in Figure 3. Additionally, the peak and residual shear strengths of the concrete-rock interface were listed in Table 1. The obtained peak and resident shear strengths were then fitted with the Mohr–Coulomb (MC) criterion as shown in Figure 4, the fitted MC parameters are listed in Table 2.
As can be noted, it is the concrete-rock mass interface that failed in both series of shear tests. The concrete specimen and the underlying rock mass would relatively remain intact. All the shear displacement—shear stress curves behave elastically at the beginning and fail finally in a brittle way, generally with peak strength, yield strength, proportional limit strength, and residual strength. The measured shear stresses have a good linear relationship with the normal stresses. Based on the best fit linear regression lines for average peak shears, the peak shear strength parameters were finally determined as f = 1.08 and c = 2.4 MPa, and residual ones are f = 1.0 and c = 0.1 MPa.
According to the field test results above, the mechanical parameters of the concrete-rock interface established in a DEM code were calibrated with back analysis. In the DEM code, the concrete-rock interface was numerically modeled with a nonlinear continuously yielding (CY) model proposed by Cundall and Lemos [19]. The incremental normal stress Δ σ n in the normal loading of the CY model can be expressed as follows:
Δ σ n = K n Δ u n
in which Δ u n is the incremental form of the normal displacement, and the normal stiffness K n can be obtained by the following definition:
K n = a n σ n e n
Equation (2) represents the dependency of the normal stiffness on the normal stress. The greater the normal stress, the greater the normal stiffness would be. The a n parameter represents the initial joint stiffness K n i and e n is the normal joint stiffness exponent.
The CY model can represent some irreversible nonlinear behaviors associated with shearing. The incremental shear stress Δ τ can be written as follows:
Δ τ = F K s Δ u s
in which Δ u n is the incremental form of the shear displacement, and the shear stiffness K s is also dependent on the normal stress given by the following:
K s = a s σ n e s
The coefficient F is the governing parameter for shear stiffness in the shear deformation; it may be continuously degraded during the shear process and give expression to the plastic behavior under large shear deformation. The coefficient F is related to the stress path, the initial friction angle , the effective friction angle m , and the roughness parameter r .
More detailed discussion and verification can be found in the work of Cundall and Lemos [19], and Cui et al. [20]. One can notice that the parameters involved in the above-mentioned equations include both the normal and shear behavior, and deformation and strength behavior. In this way, the tensile behavior (separation) and the nonlinear shear behavior (slip) of the concrete-rock interface can be revealed, which is the advantage of the DEM approach compared to the conventional FEM approach.
The comparison of the test data with DEM simulation can be found in Figure 5. It is evident the CY model in the DEM code and the back-analyzed parameters can qualifiedly simulate the experimental shear curves. It is worth mentioning that the CY model used in current study is a built-in contact model in the 3DEC code, whose computing time is basically the same as the conventional MC model. To perform the simulation run in Figure 5 would take approximately 15 min with the CY model, and approximately 14 min with the conventional MC model.

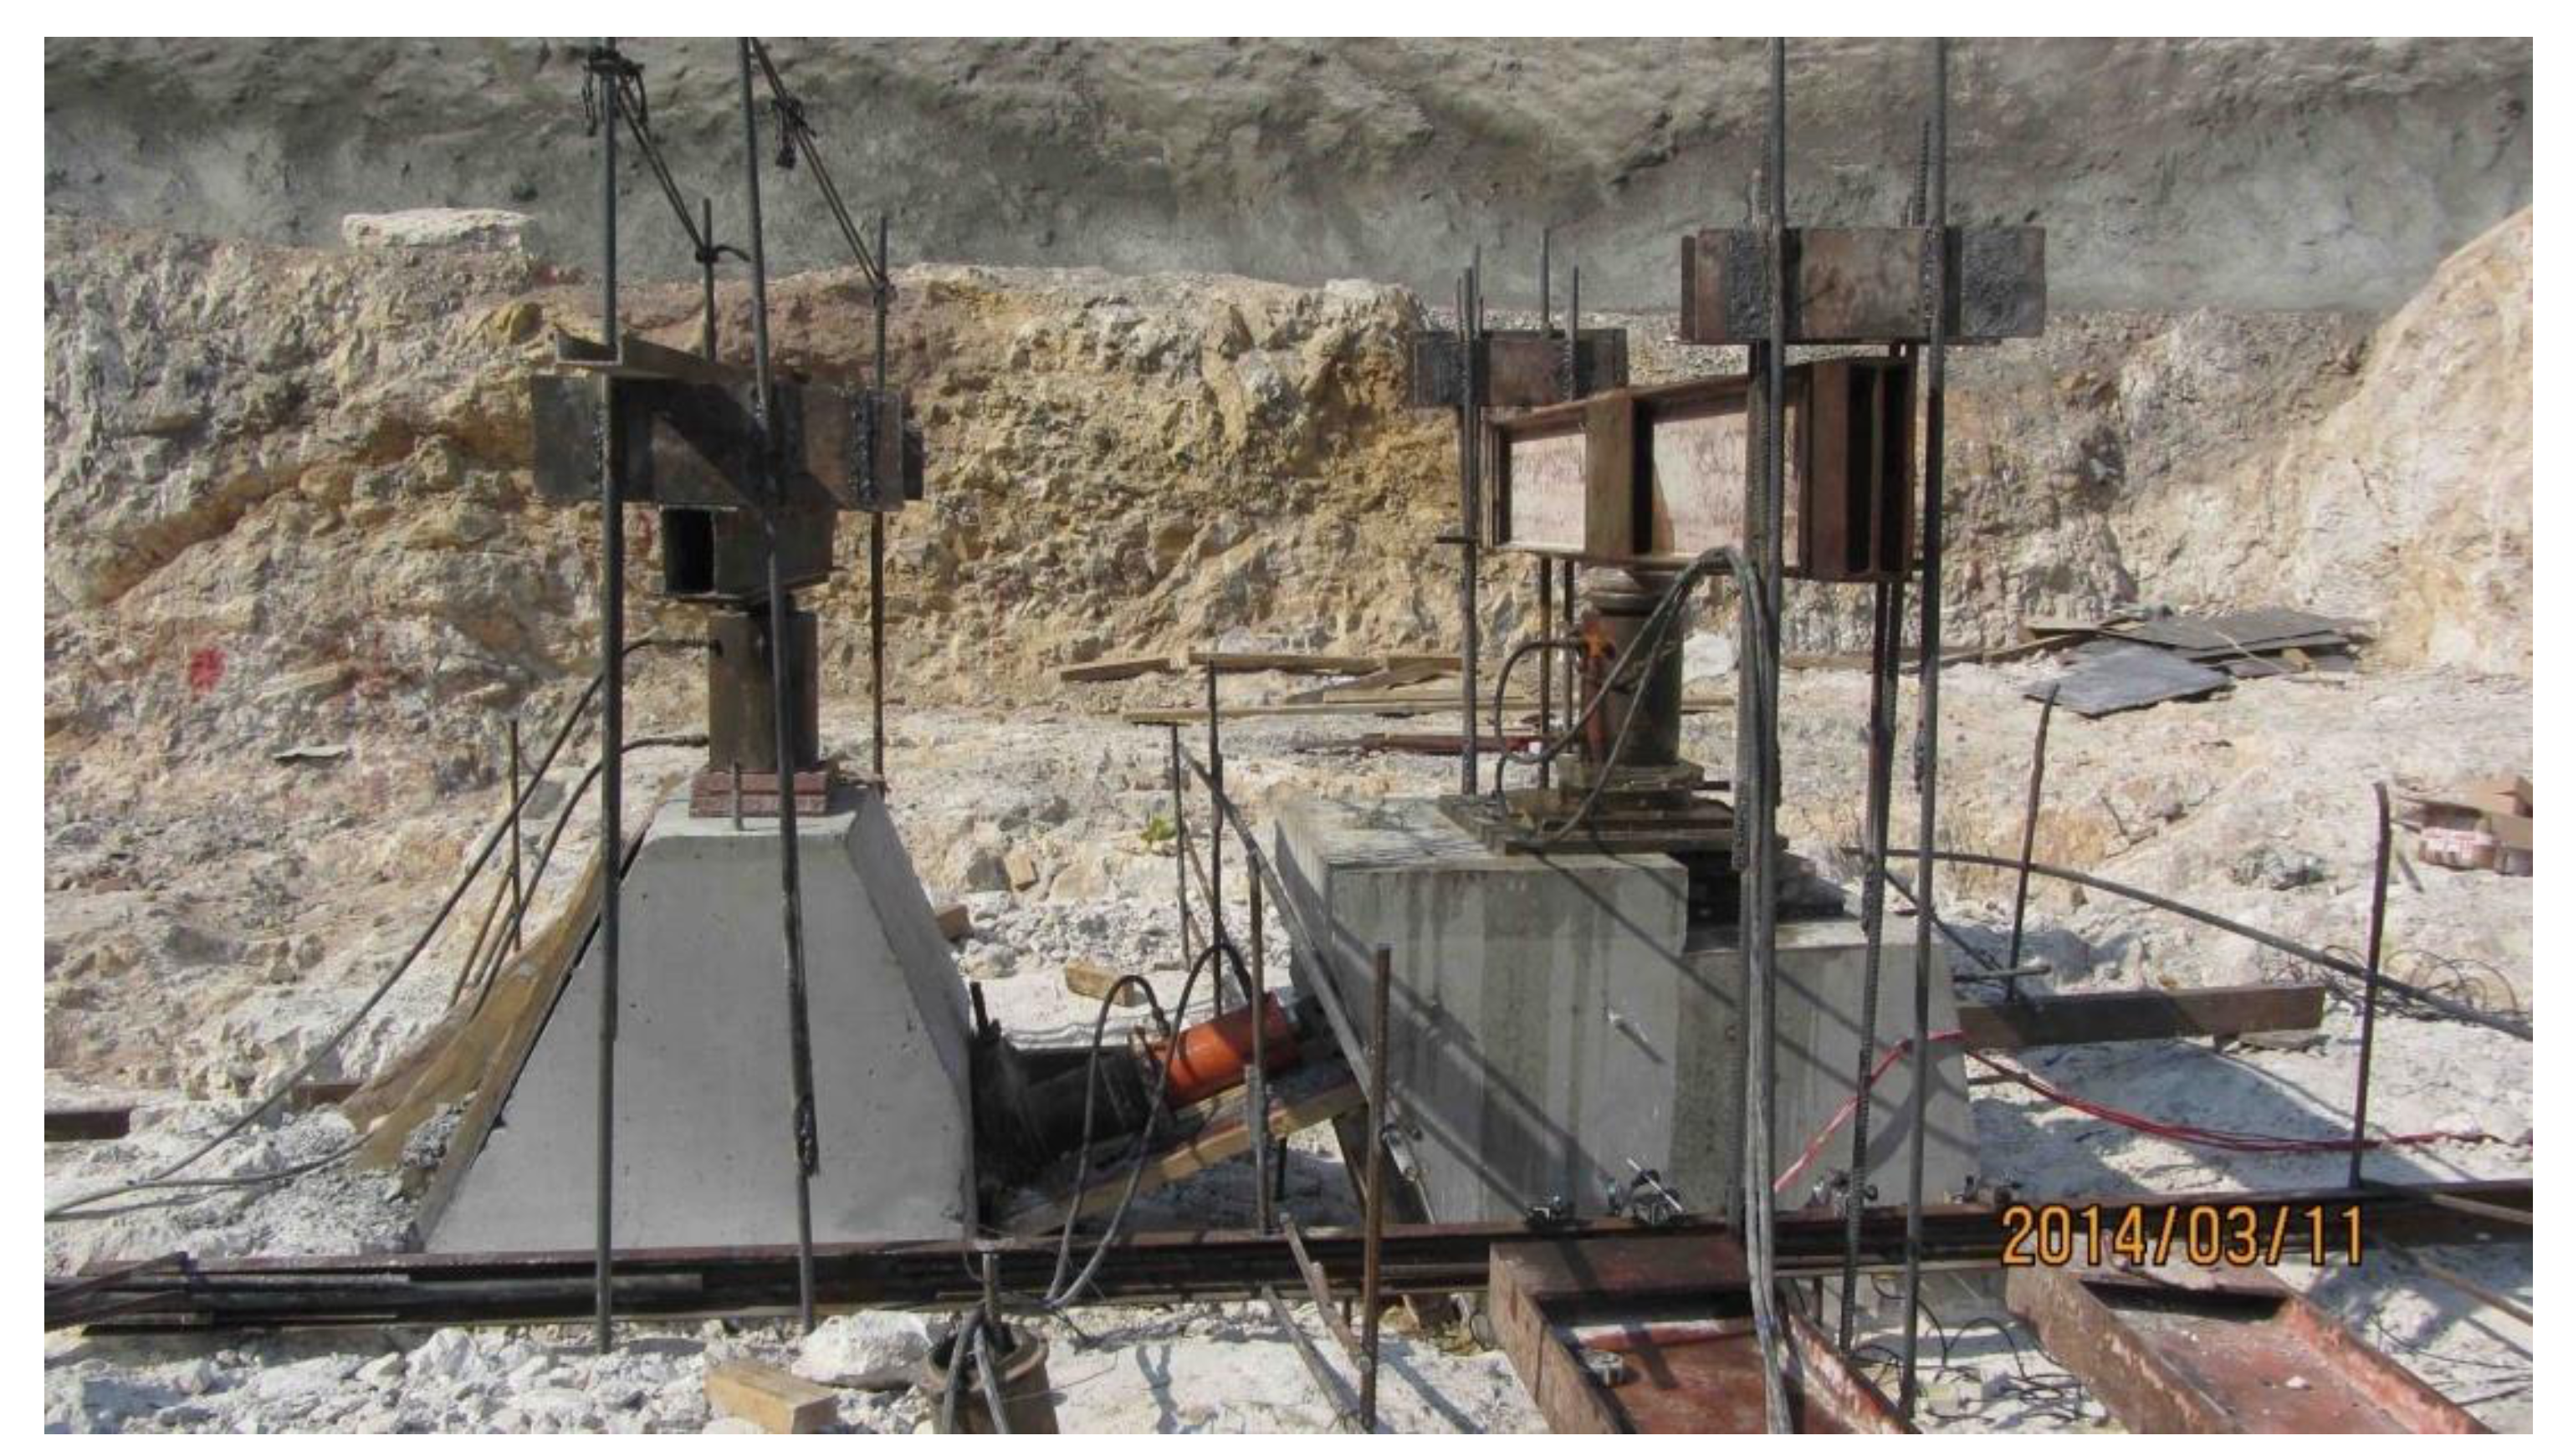
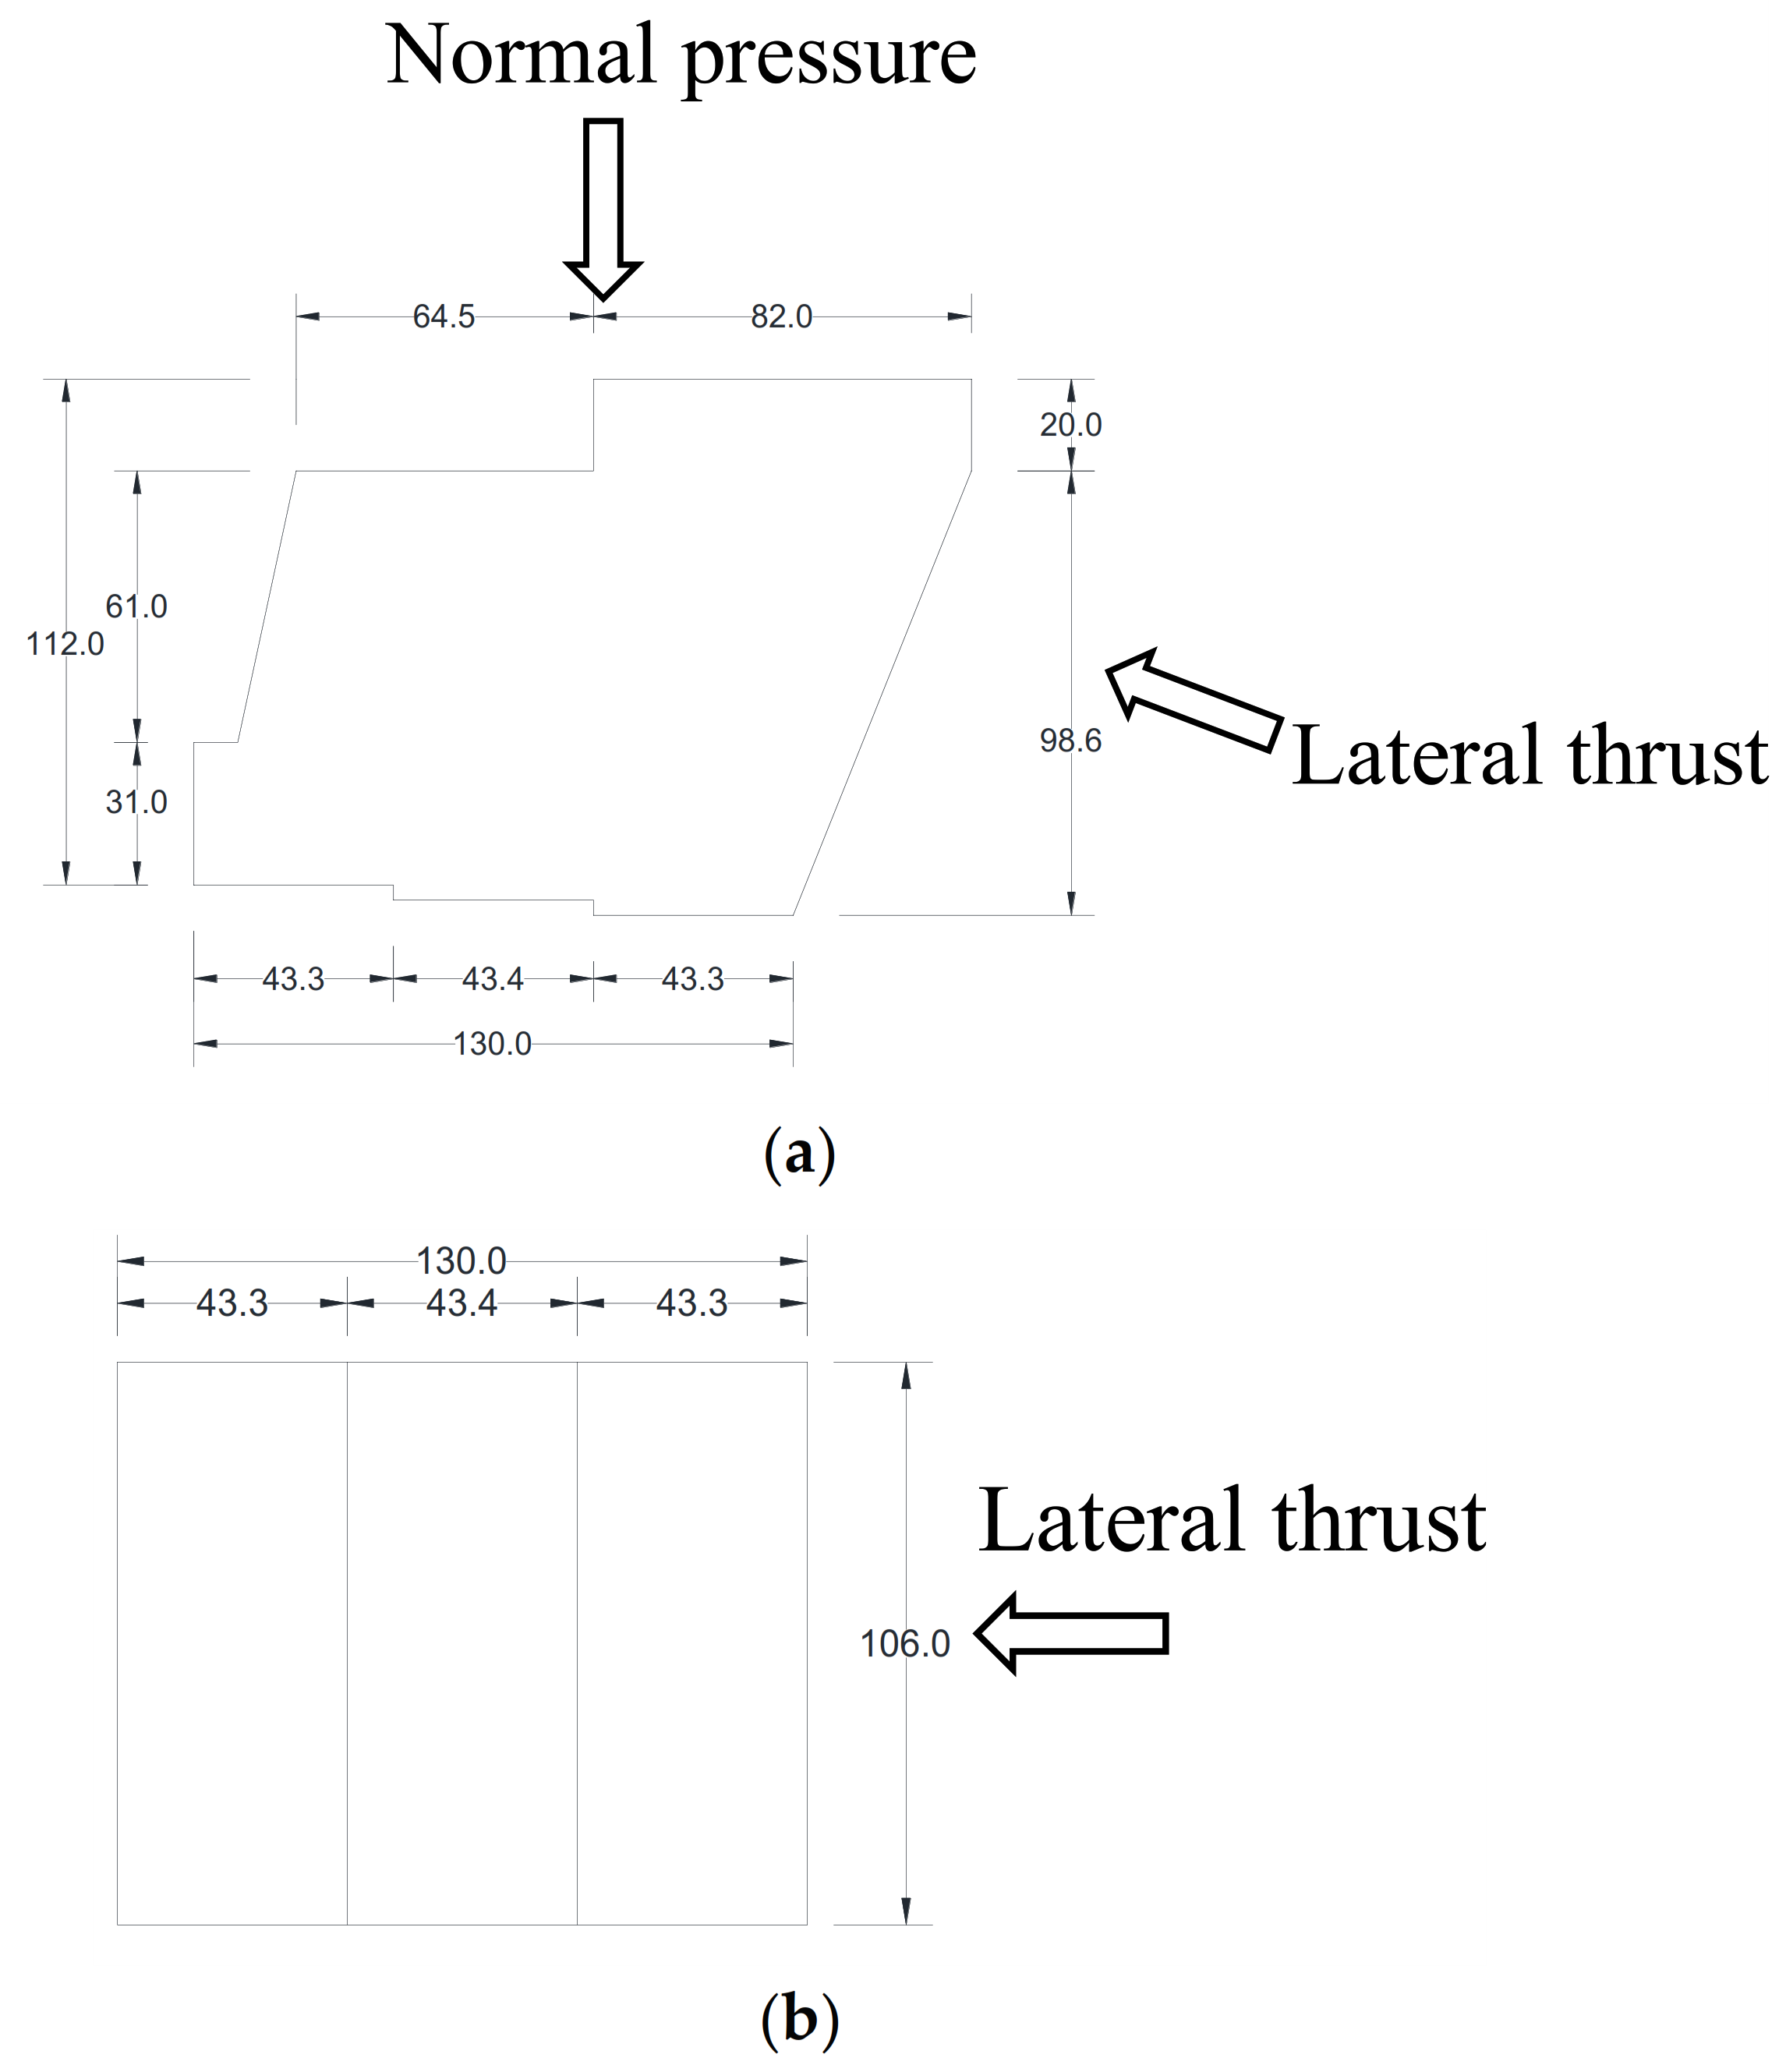
3. Scale Model Tests and Calibration of the DEM Model

To obtain reference for the design work of the suspension bridge, a scale model test of the gravity anchorage was performed (Figure 6). The aim of the scale model test was to estimate the possible anti-slide stability and failure mode of the bridge anchorage. According to the 1:30 scale law, the anchorage model was set to be 130 cm long, 106 cm wide, and 112 cm high. The model was made of concrete the same as the prototype anchorage and has a similar geometry shape and strength as the prototype bridge anchorage, as shown in Figure 7. The test location of the scale model was marked as the red triangle in Figure 1. The three platforms and the keyway slot on base of the prototype anchorage were also considered in the scale model. The vertical load was applied by a vertical hydraulic jack, and the oblique cable load was exerted by the hydraulic jack sitting on a reaction buttress. According to the scale law and the design load of the bridge cables, the design load on the scale model is 245 kN. Additionally, the maximum lateral thrust performed in the test is ≈3 times the design load, i.e., 730 kN.
A 3D DEM model of the scale anchorage model was established to numerically analyze the stress conditions and mechanical behavior of the concrete-rock interface, as shown in Figure 8. The mechanical parameters for numerical simulation were determined by the above-mentioned in-situ direct shear test results.
Comparison between numerical simulation and in-situ test results indicates that the numerical results can match the experimental results acceptably, as shown in Figure 9. The numerical model correctly predicted the rotation movement of the anchorage model under the lateral thrust. Hence, it is suitable to numerically simulate the mechanical behavior of concrete-rock interface with the current DEM model. With the help of the calibrated DEM model, some interesting knowledge of the mechanical behavior of concrete-rock interface can be obtained in the following sections.

4. DEM Simulation of the Anchorage Model under the Design and Overload Condition

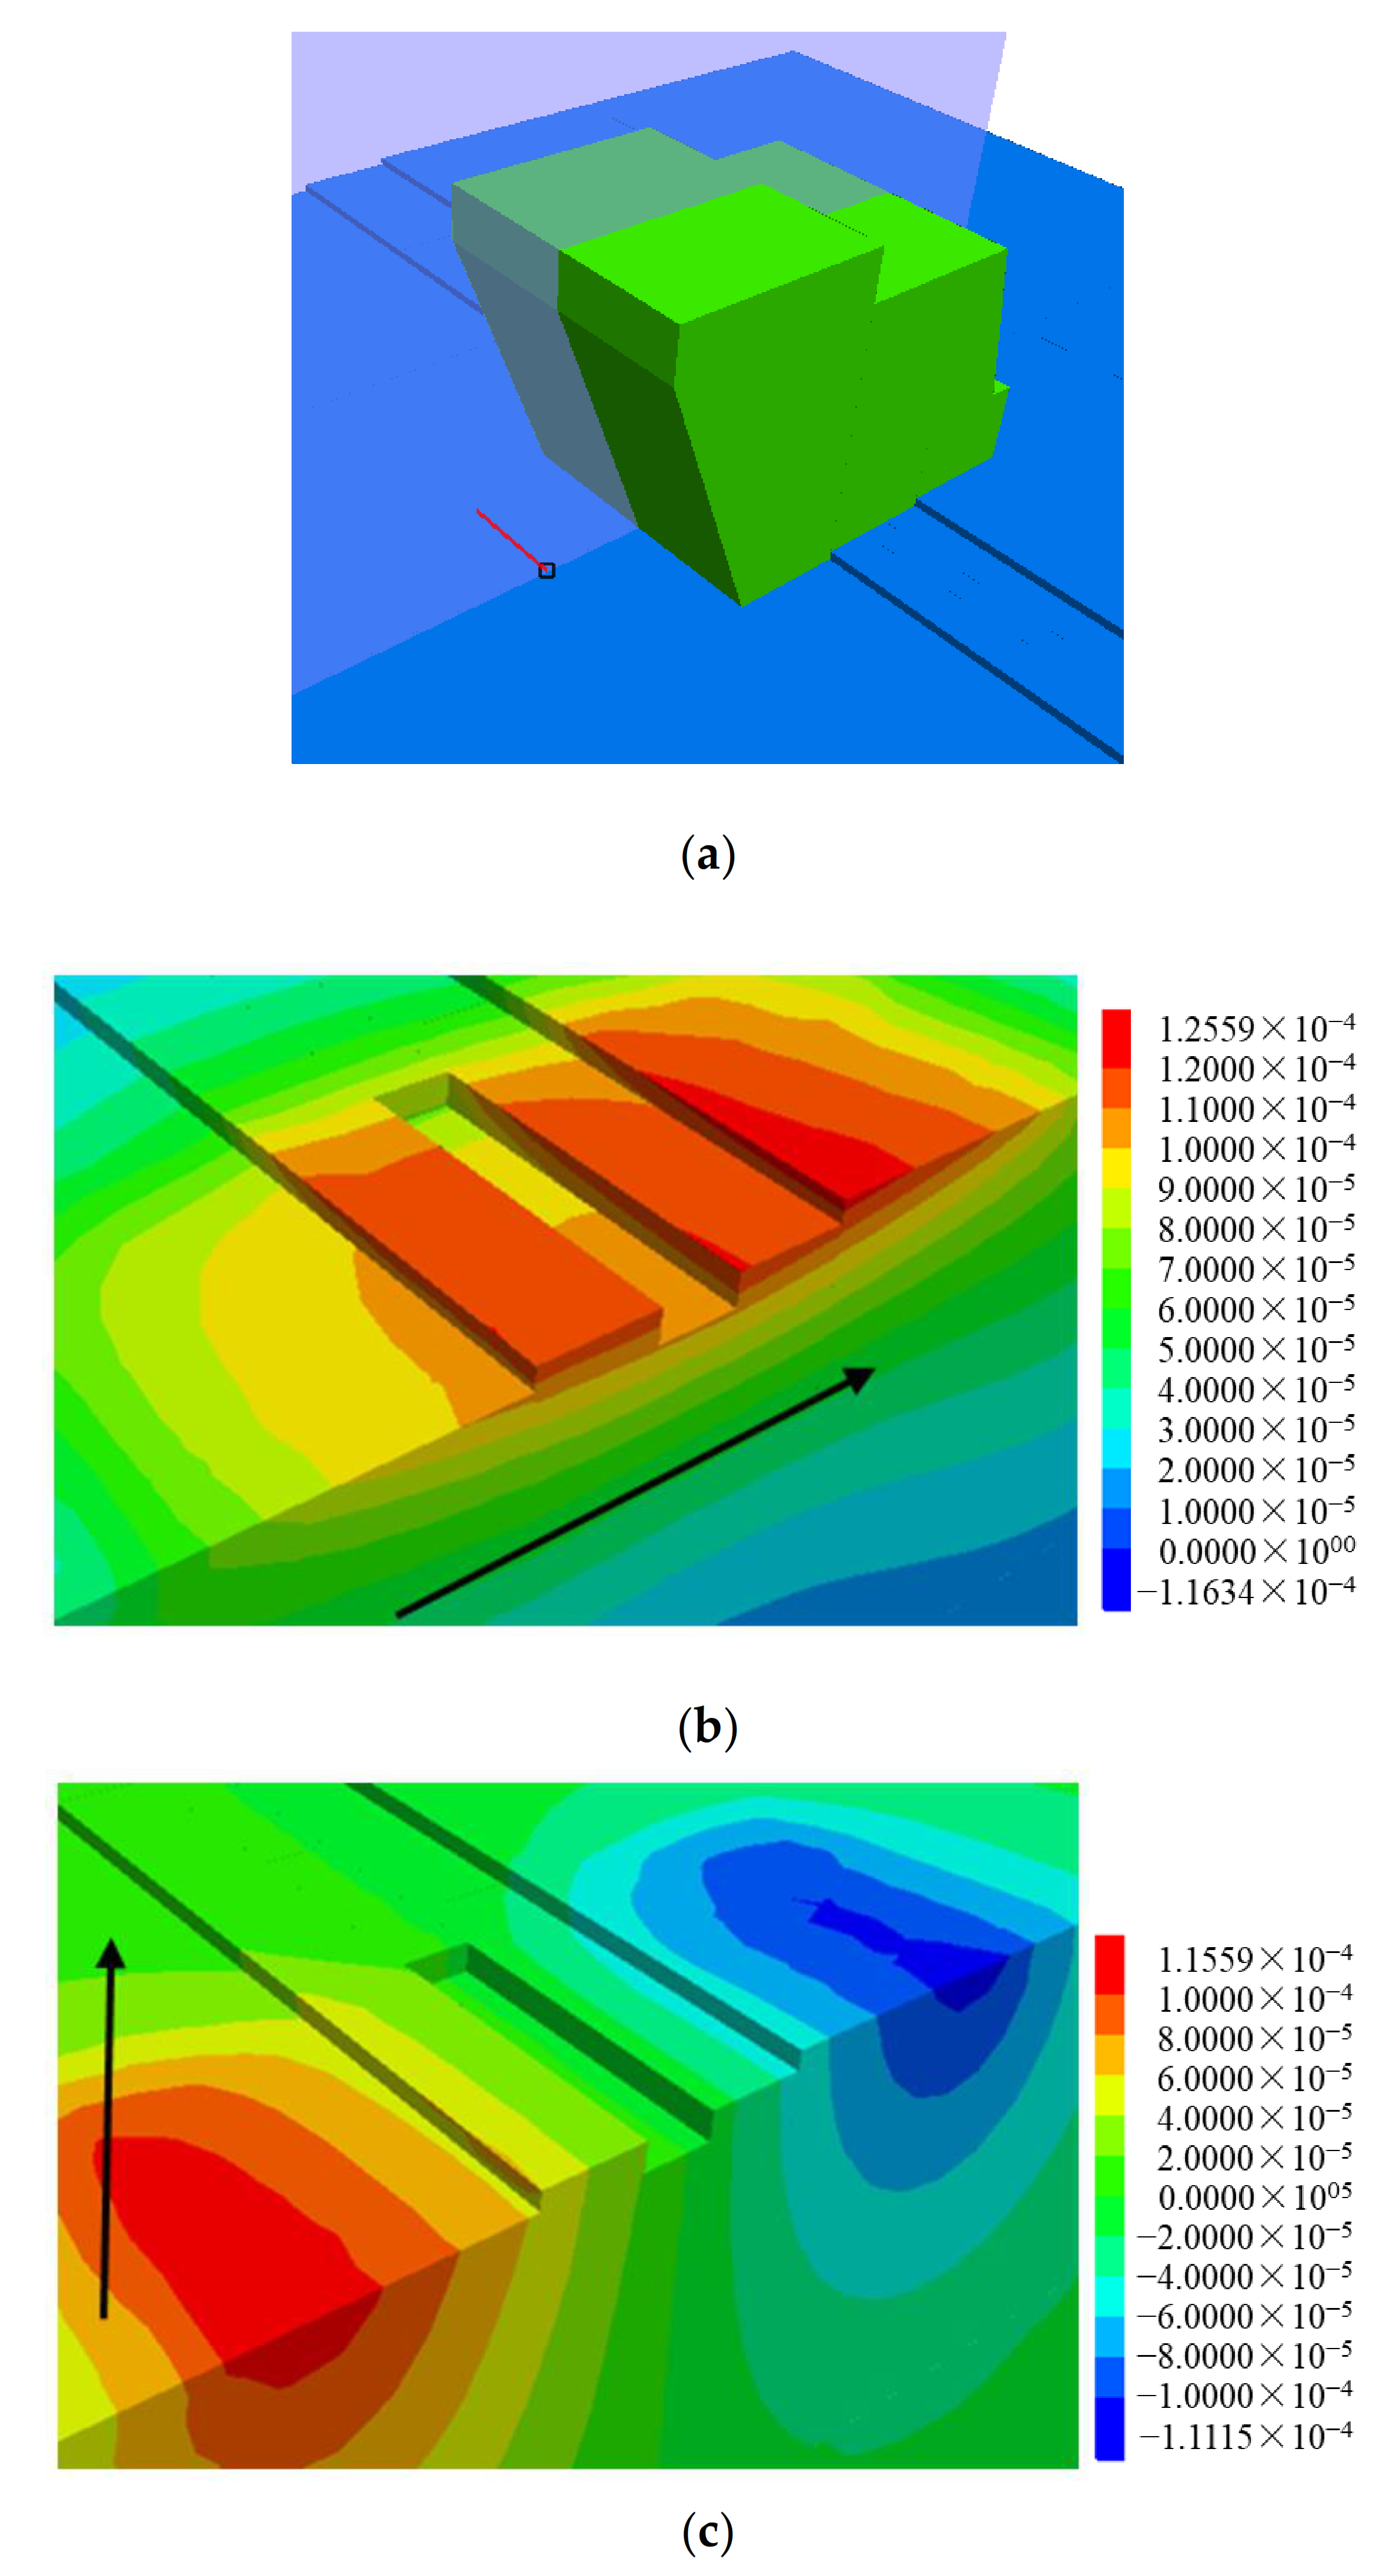
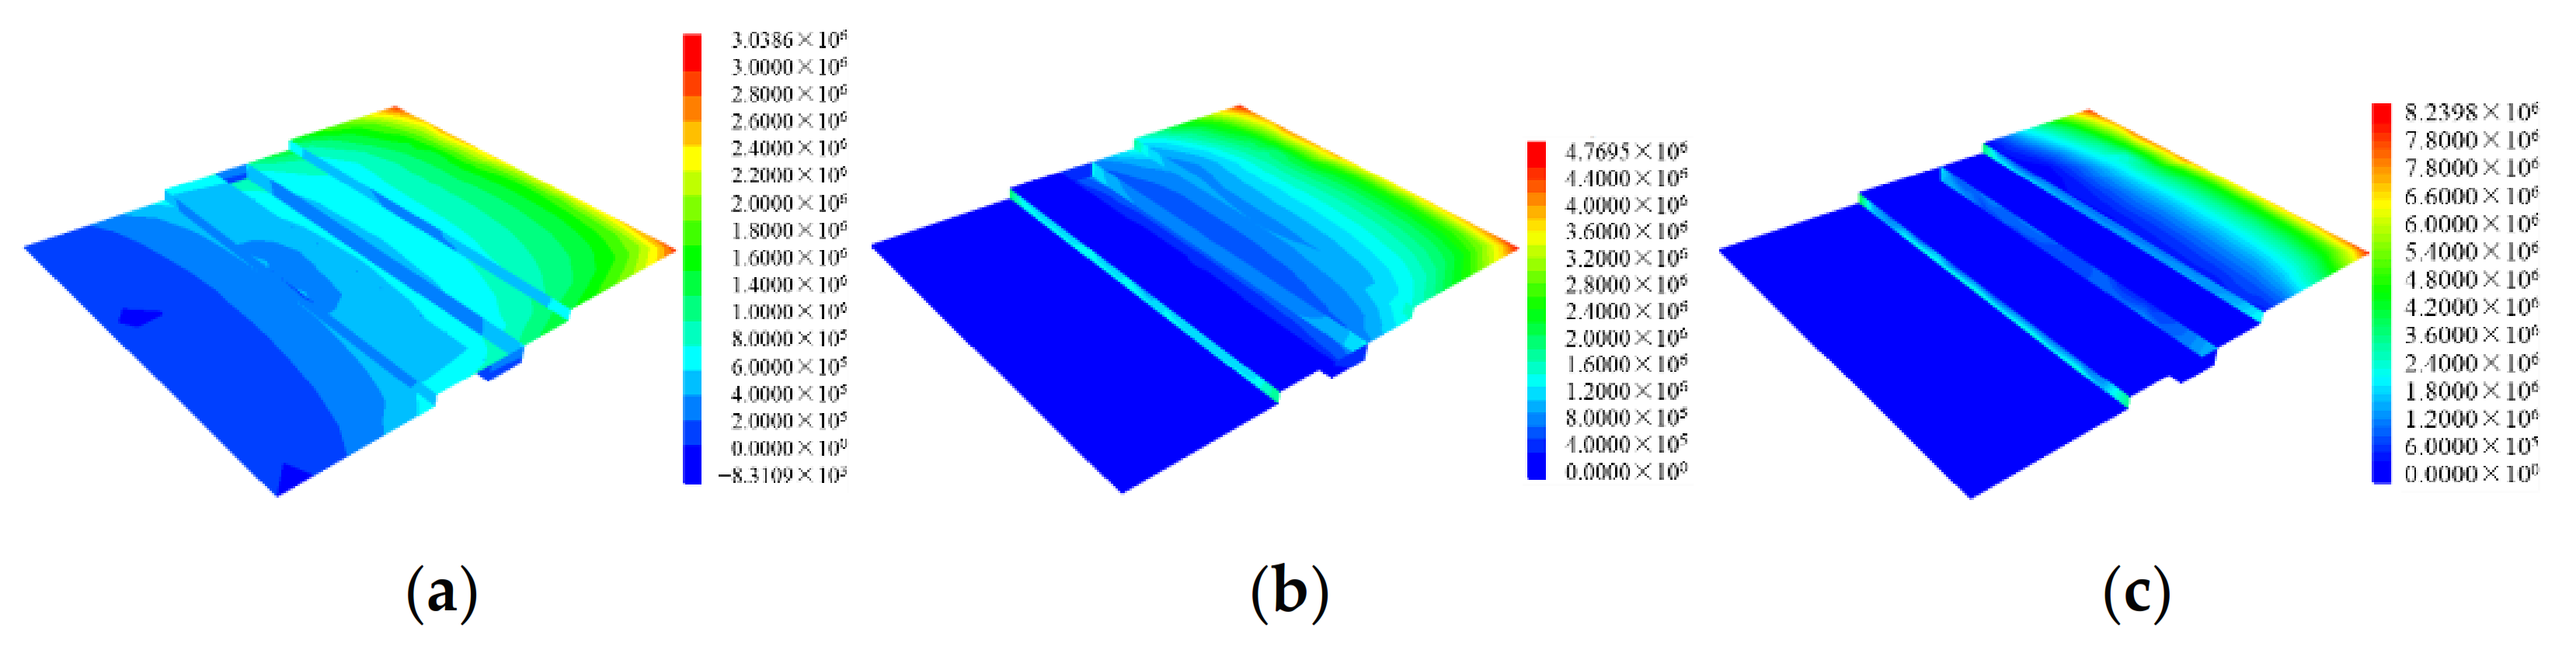
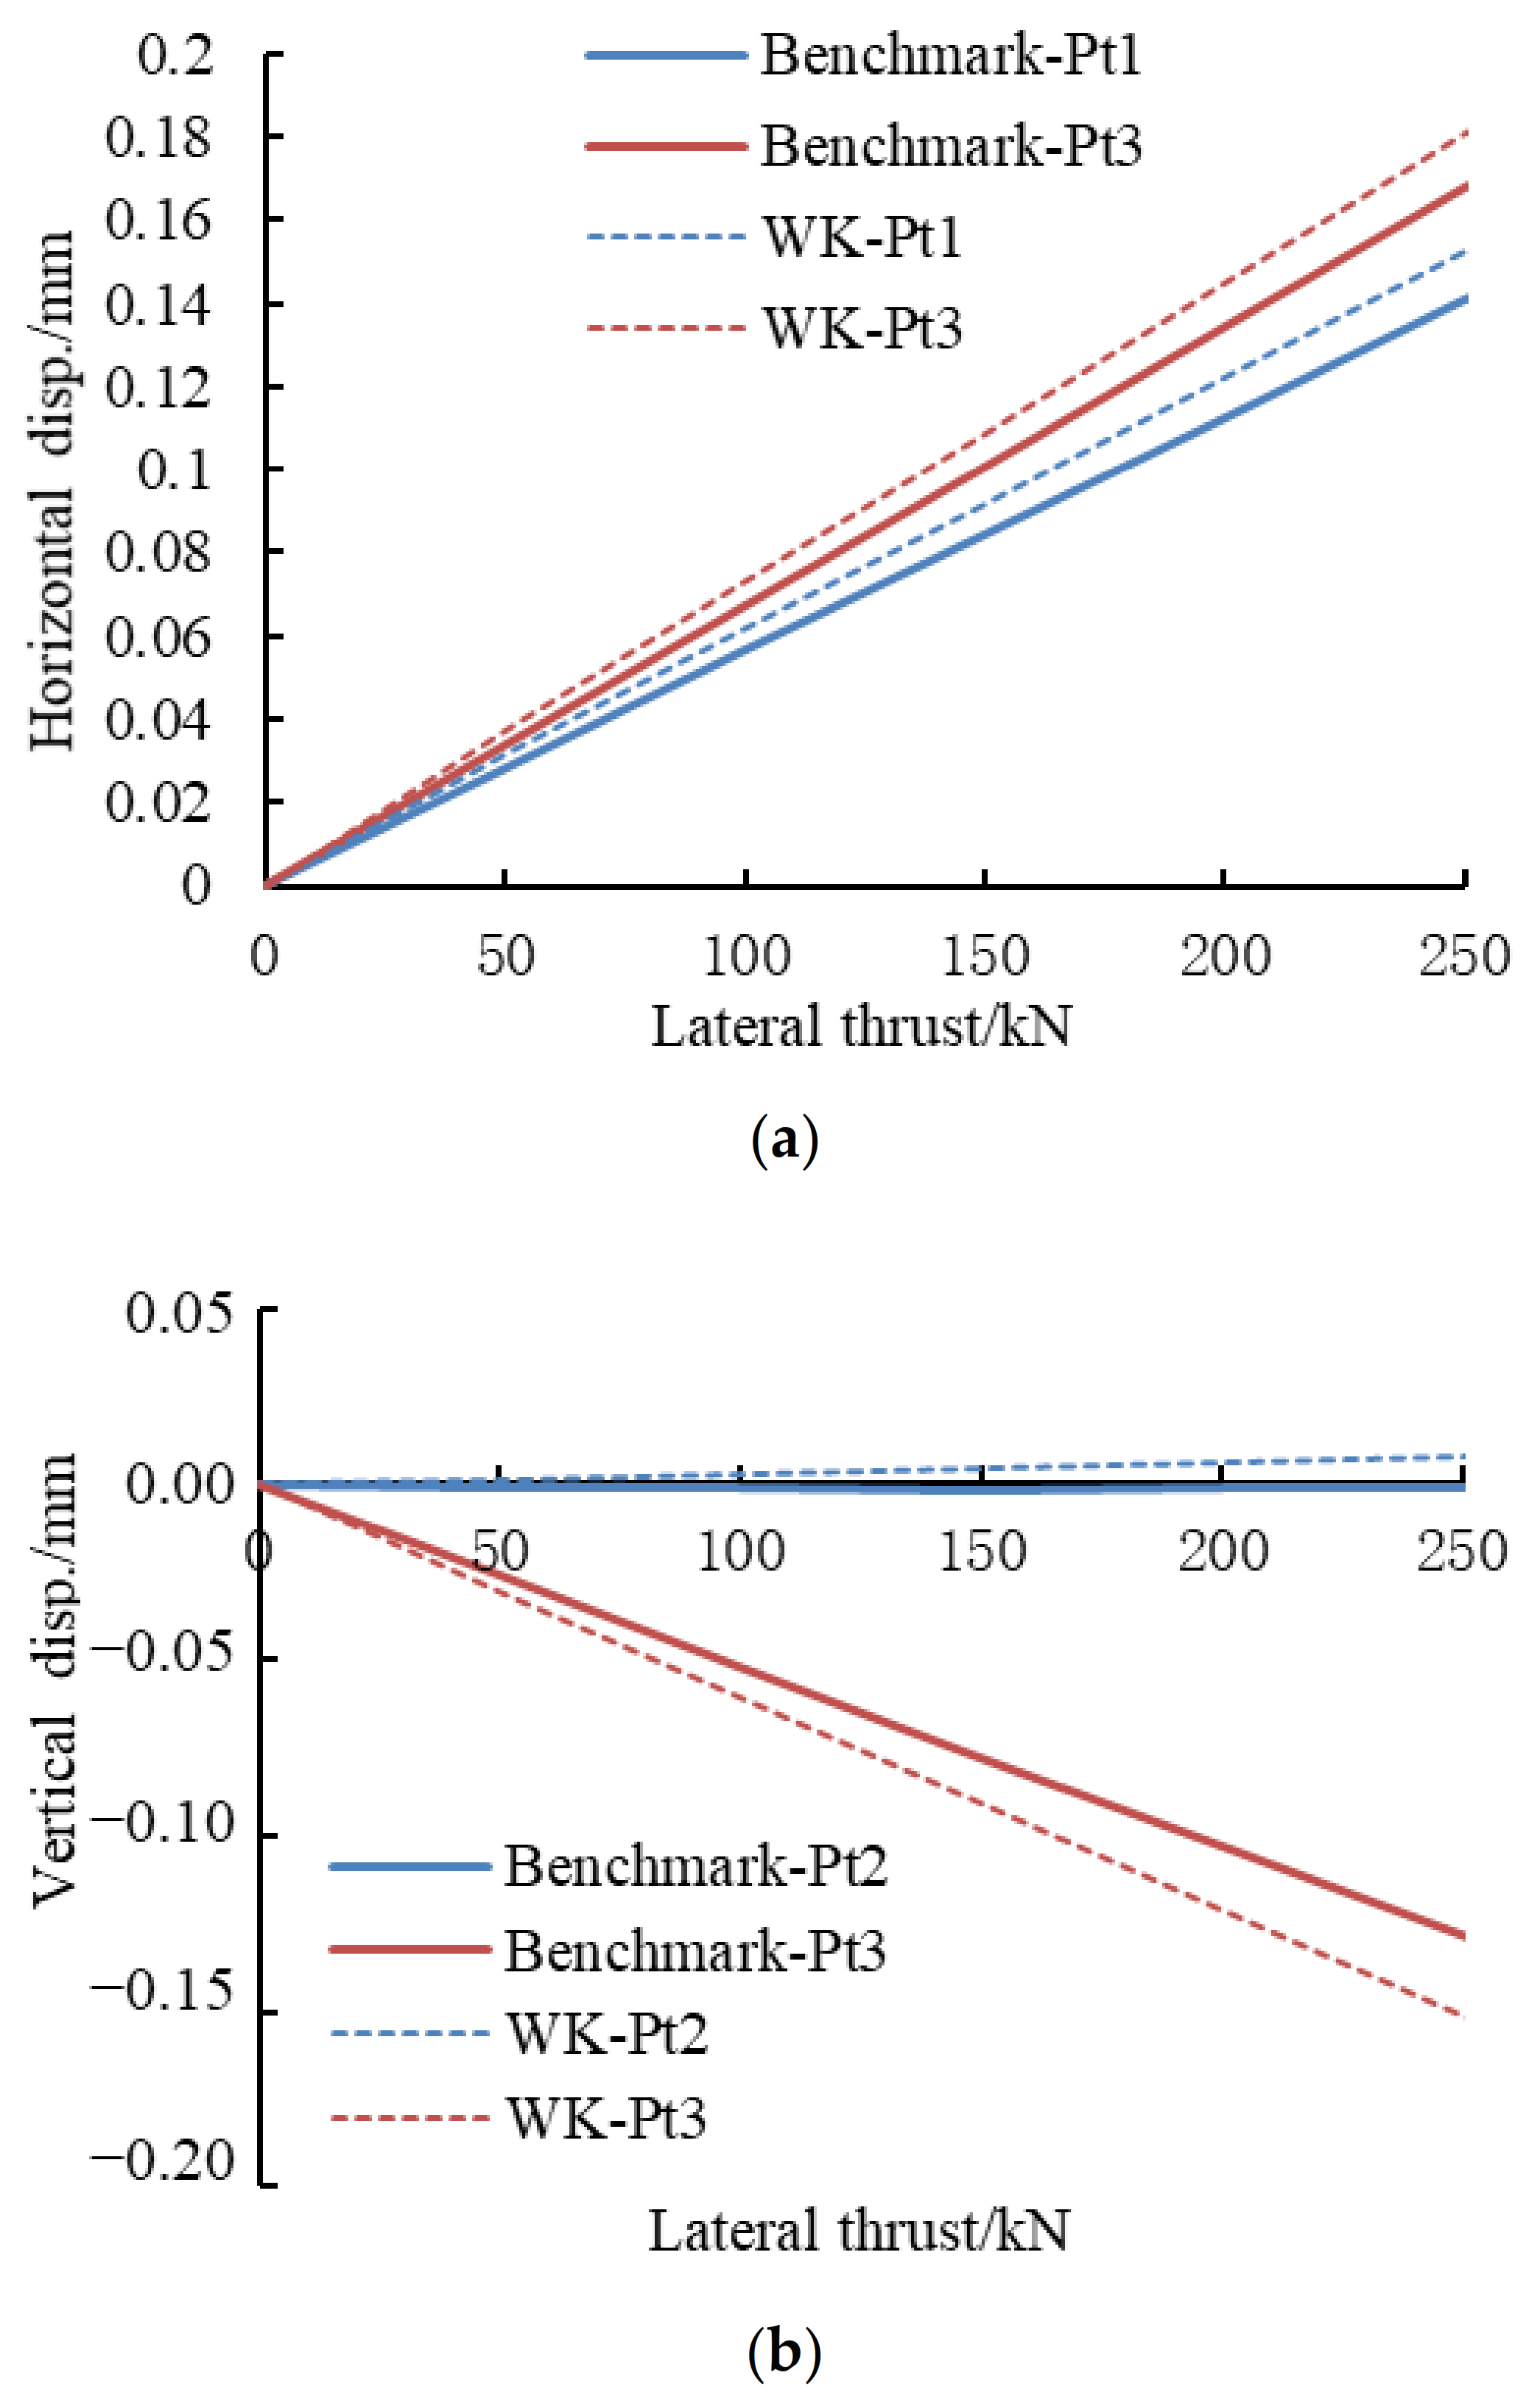
4.1. Under the Design Load

The horizontal component of the bridge cable tension force may result in the horizontal displacement of the anchorage, and the vertical component of cable tension may change the stress distribution on the foundation rock mass that is beneath the anchorage. In addition, the oblique cable tension force would trigger the differential settlement at two ends of the anchorage, which may further increase the possibility of the anchorage overturning. The displacement-related results of the anchorage model under the design load, such as total displacement, horizontal displacement, and vertical displacement, were calculated by DEM simulation, and the corresponding results of the actual anchorage were also determined by 1:30 scale law, as listed in Table 3.
The results show that the anchorage deformation under the design conditions is basically characterized by the rigid rotation around the keyway of platform #2, with a maximum rotation angle of 0.025° and a maximum differential settlement of 0.431 mm, as shown in Figure 10. Accordingly, the maximum differential settlement of prototype anchorage is about 1.3 cm. The majority of horizontal displacement occurs at platforms #2 and #1 which bear the majority of the shear load, as shown in Figure 11. Platform #3 undergoes small shear due to its large upward displacement. Due to the rigid rotation effect, the rock mass region near the river side (platform #1 side) settles under compression stress while the region near the bank side (platform #3 side) bounds upward, generally with identical vertical displacements.
The distribution of normal and shear stresses on the concrete-rock interface is shown in Figure 12. The results show that the normal stress, ranging from 0.4 to 1.6 MPa, is large in the region near the river side and small in the region near the bank side. The shear stress, varying from 0.2 to 0.5 MPa, has a great effect on platform #1 due to the upward movement of platform #3. The keyway slot has small normal stress and large shear stress, indicating that it is mainly used to resist overturning rather than sliding. The sliding is basically resisted by the platform #2, which is under compression condition.
The interface at the keyway and the platform edges are in a yield state under the design loads in the form of slip failure, as shown in Figure 13. However, these slip states were formed in the initial normal loading phase rather than in the shear loading phase. Additionally, Figure 14 shows no yield state in the foundation rock mass under the design loading of the anchorage, which again suggests that the entire anchorage system, including anchorage, interface, and foundation rock mass, was in an intact state under the design load.

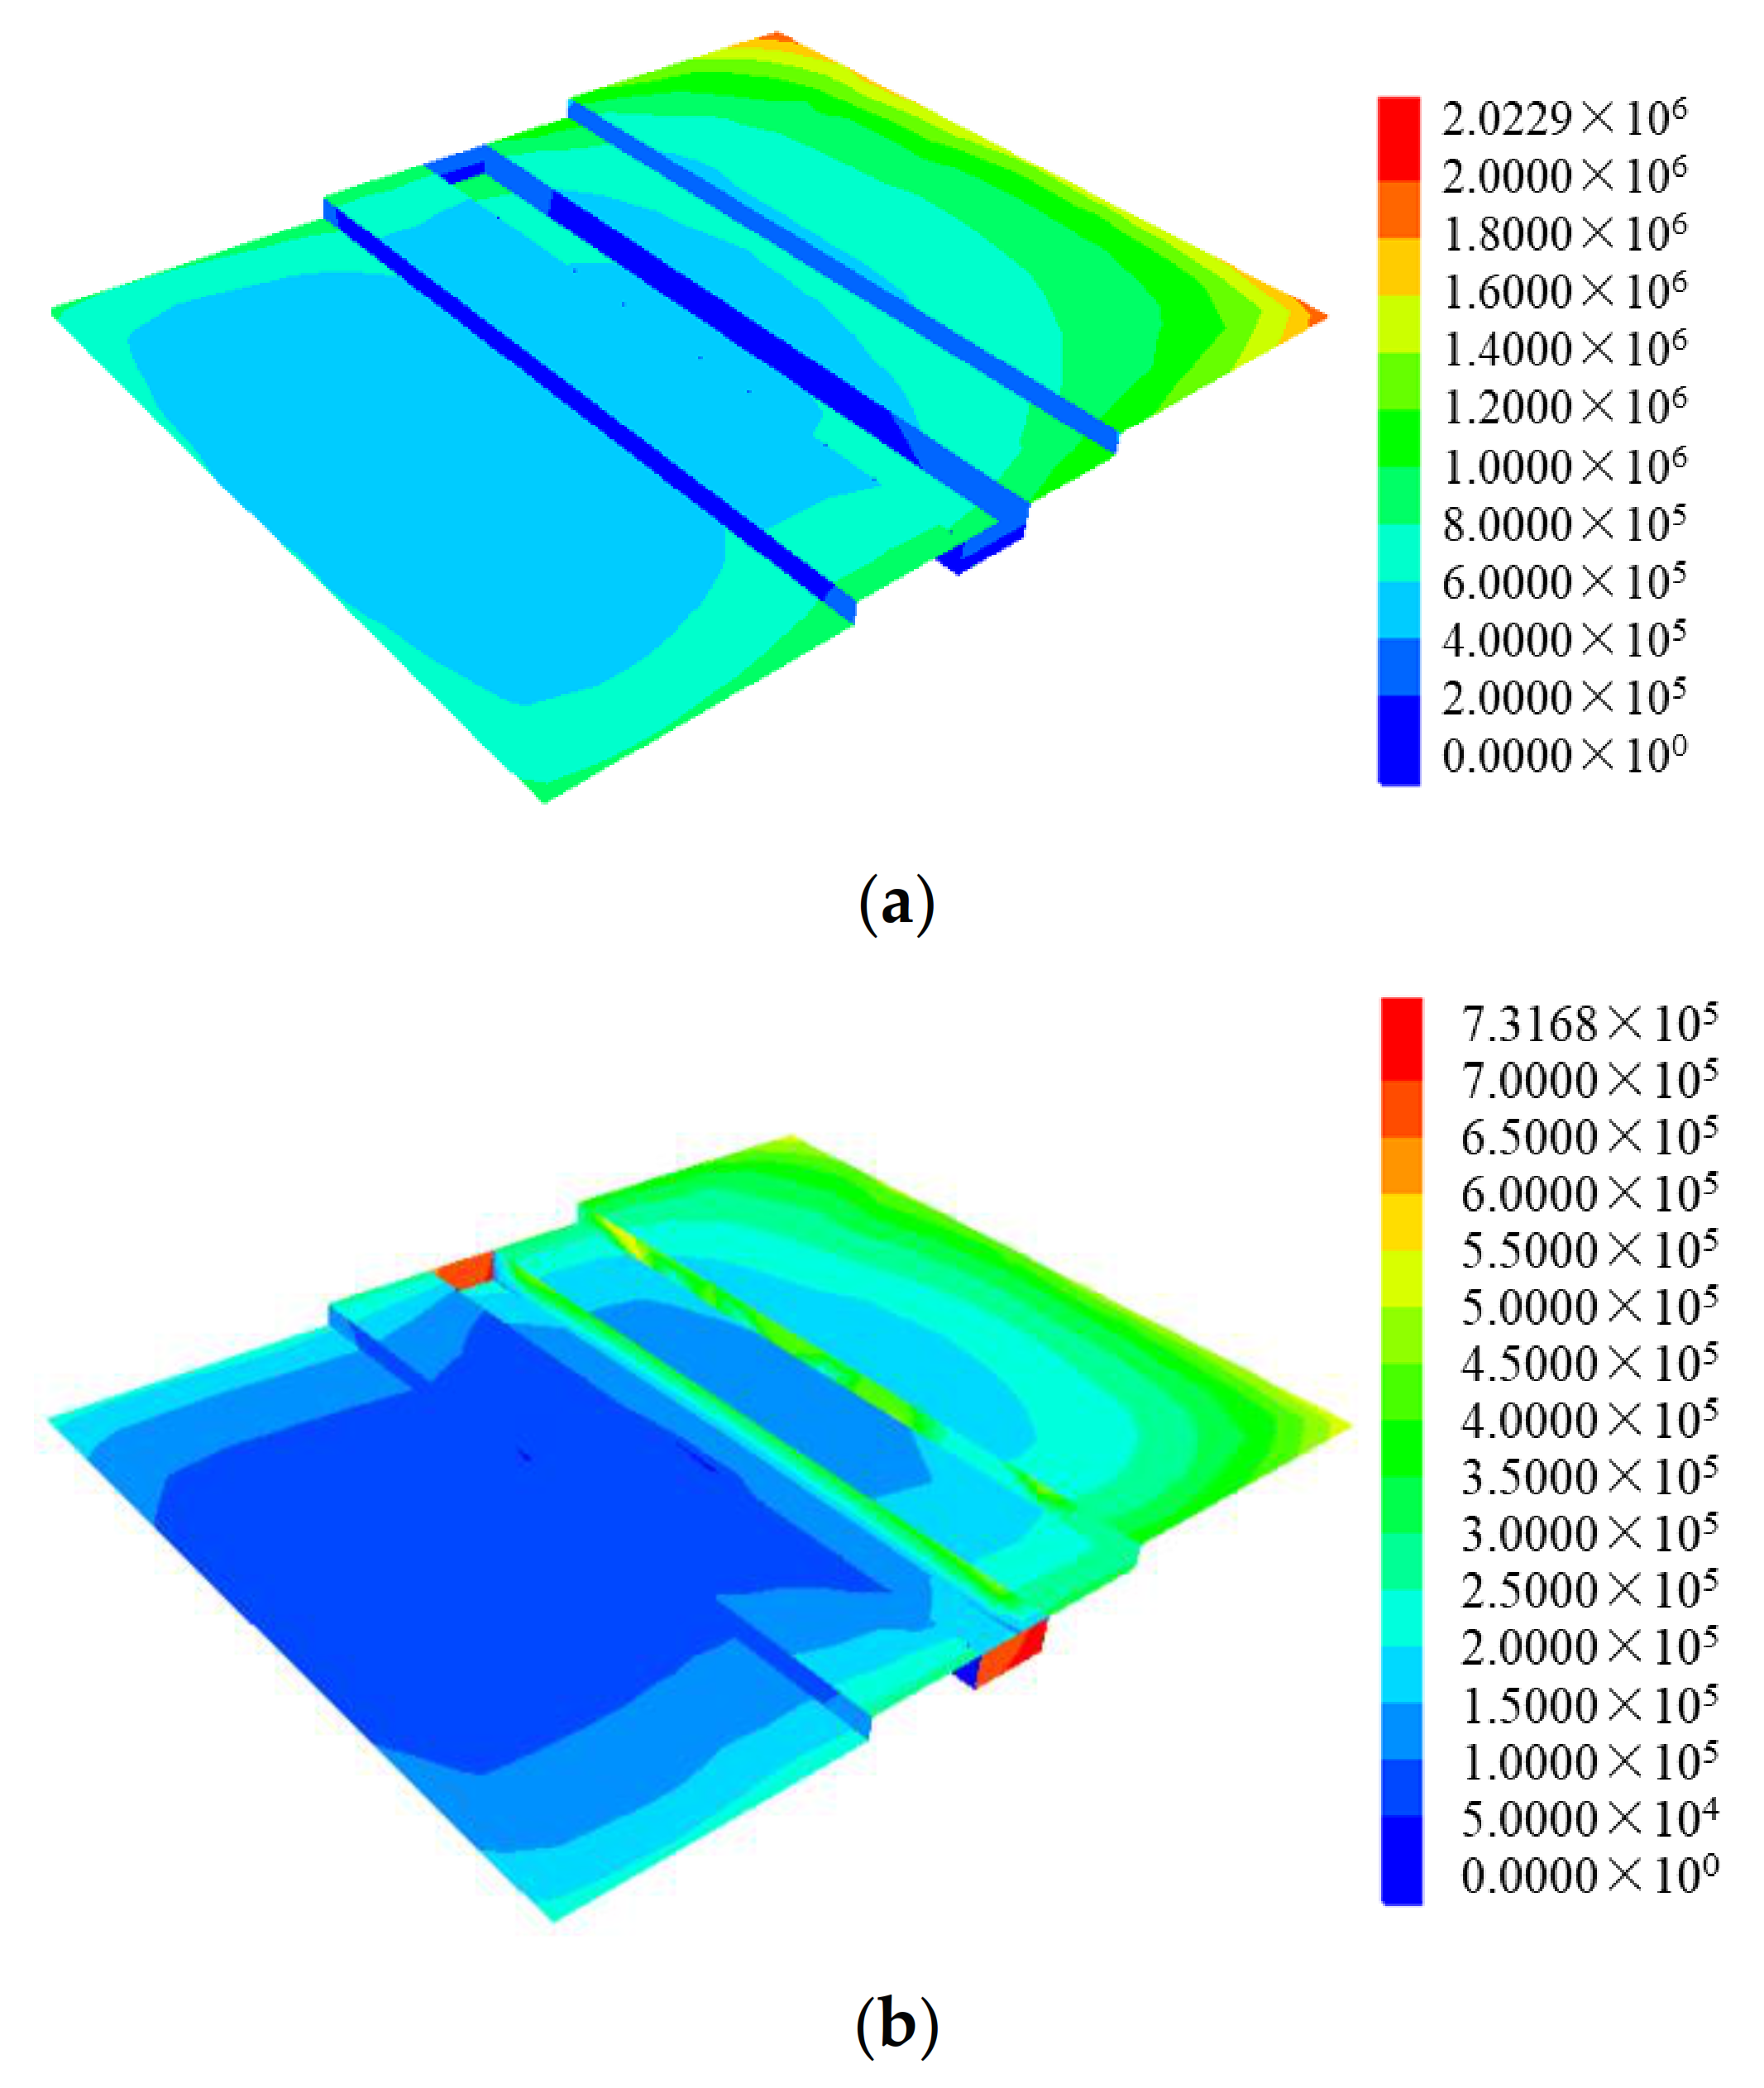
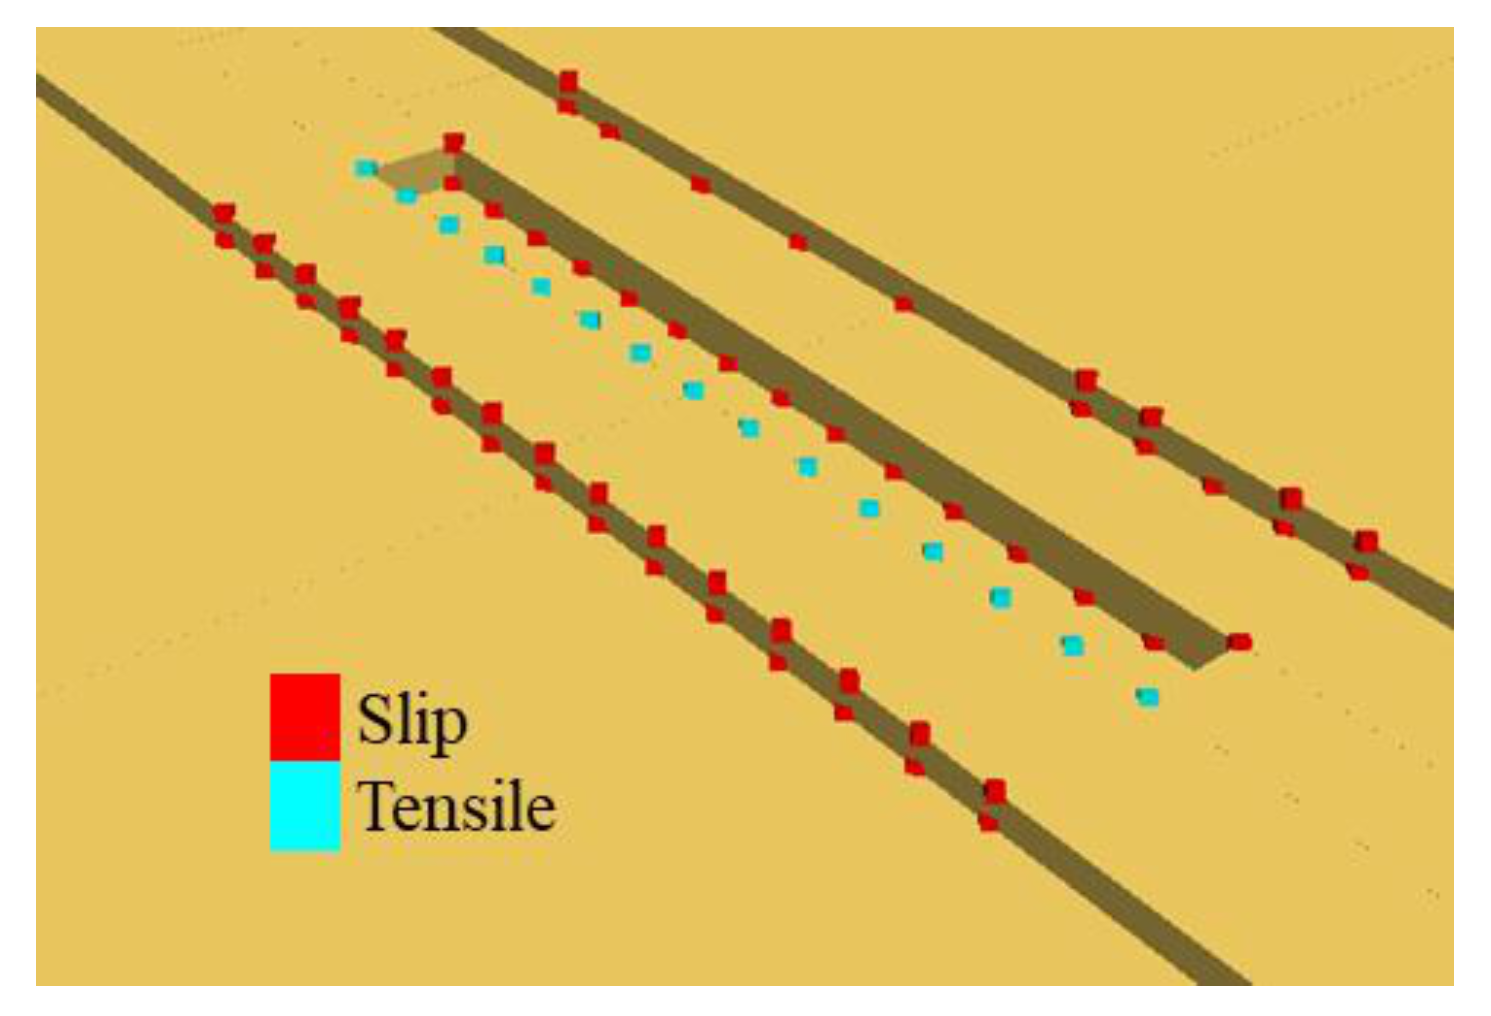
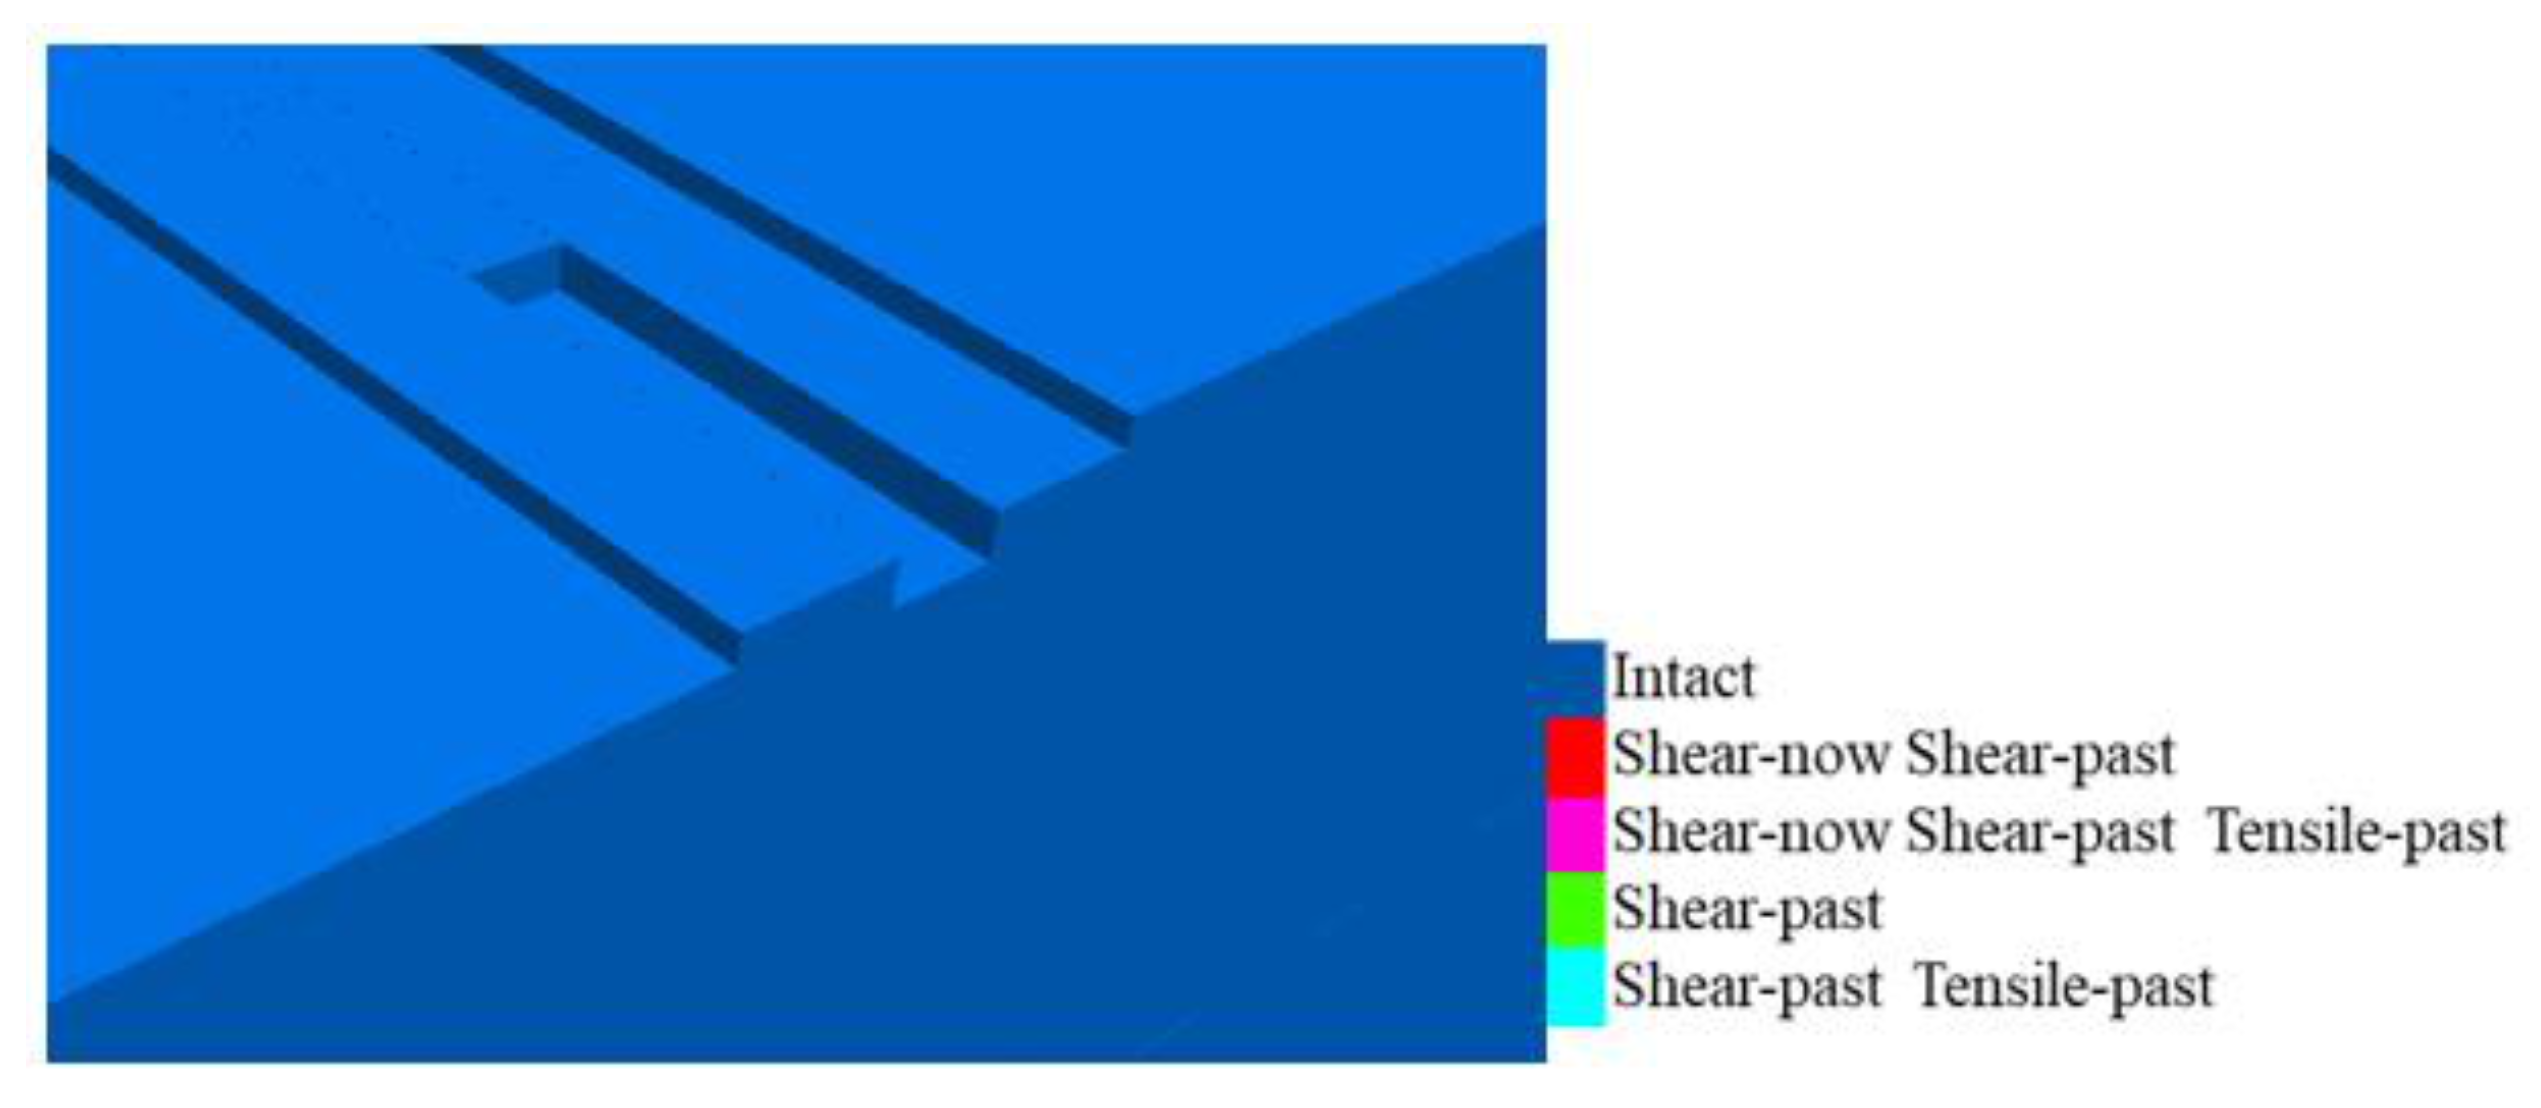
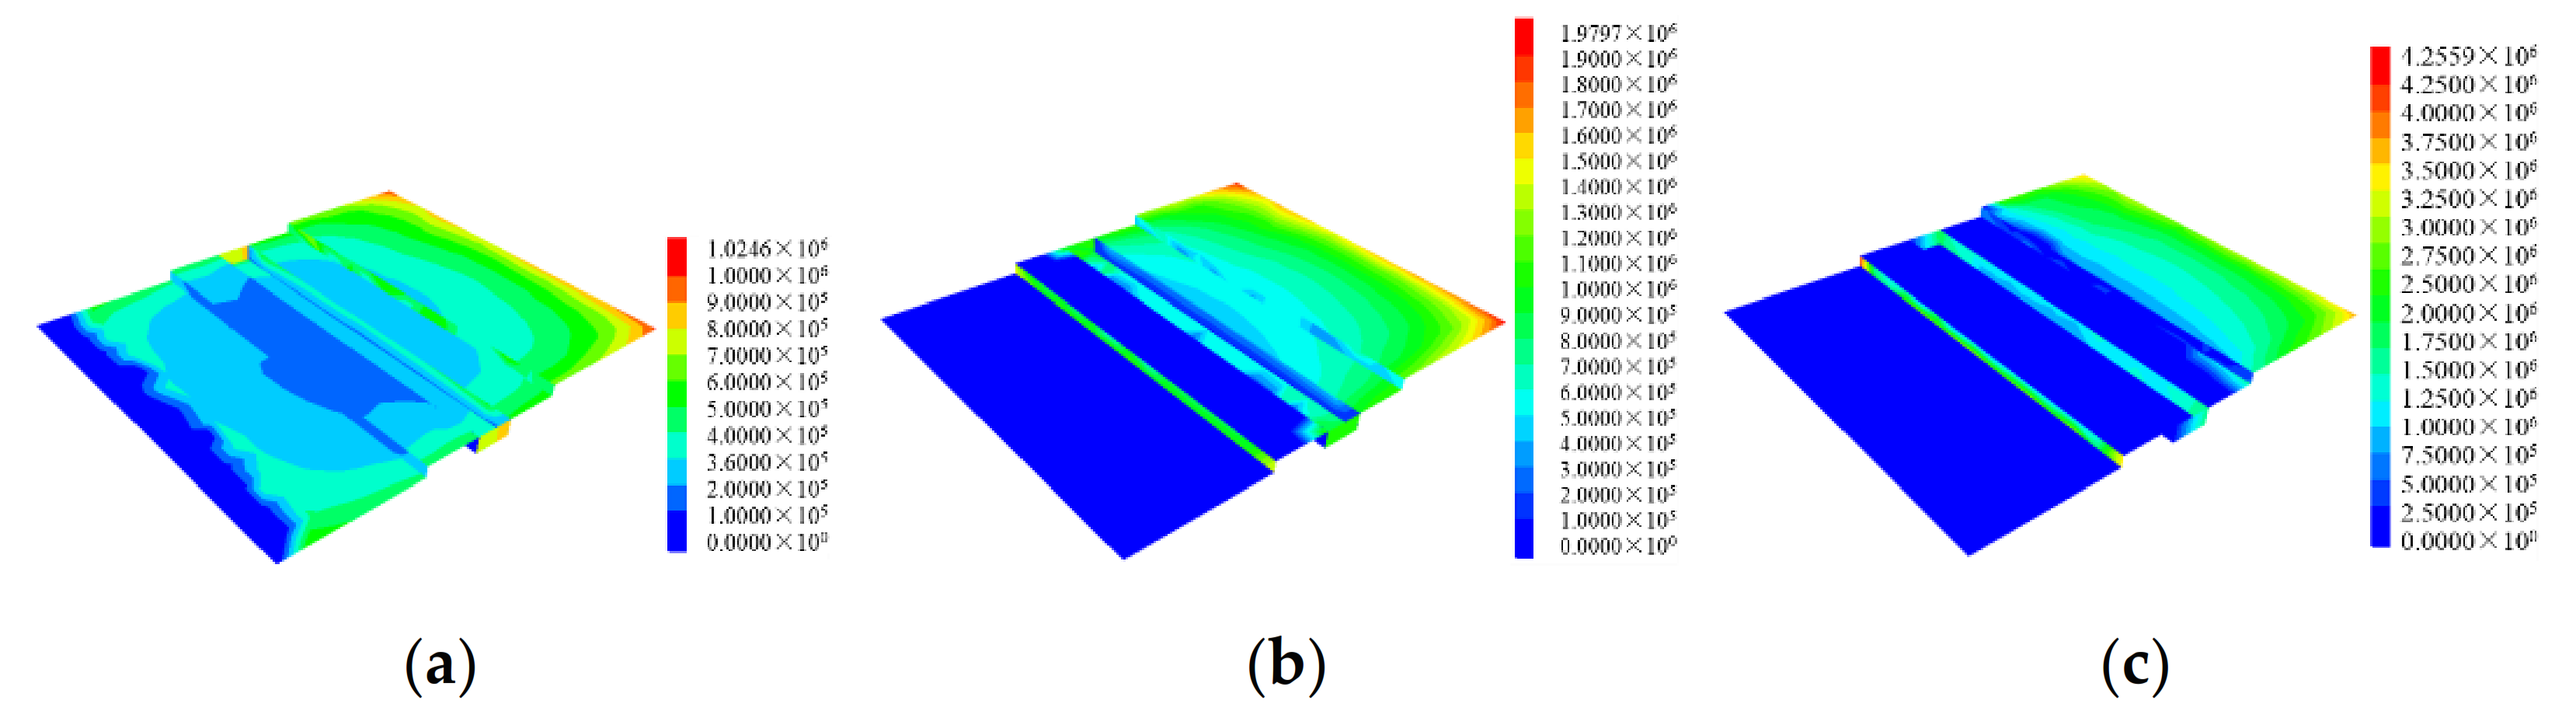
4.2. Under the Overload Condition

It is shown in Figure 9 that the scale model test stopped at an overloading factor of 3, since the scale anchorage model failed at that loading condition. However, it is convenient in the DEM simulation to continue the overloading. Figure 15 shows the variation of the displacement of the bridge anchorage model with the increasing lateral thrust. It can be noted that, akin to the displacement mode during the design loading phase, the displacement mode at the failure state is also rigid rotation about the keyway and platform #2, with a maximum displacement of 7.7 mm. Figure 16 shows the variation of the displacement of the foundation rock mass with the increasing lateral thrust. Figure 17 and Figure 18 show the contact shear stress on the rock-concrete interface with the increasing lateral thrust. These three figures all indicate that during the progressive failure process, the bank side of the anchorage model was gradually lifted by the lateral thrust, thus the contact stresses of the interface were gradually transferred to the river side of the anchorage model, i.e., platform #1. The contact interface on platform #1 shows a notable compressive state. Figure 19 and Figure 20 give the yield state of the contact interface and the foundation rock mass. Both figures indicated that as the anchorage model gradually lifted, the contact interface and the underlying rock mass at platform #3 gradually fell into a yield state, while that at platform #1 would remain relatively intact. These phenomena, discussed above, can be seen as the potential failure mechanism of the anchorage model and the prototype anchorage. It is worth mentioning that the sketch of the foundation rock mass surface after the in-situ test (3 × design load) in Figure 21 was consistent with the DEM-predicted failure state that is shown in Figure 20b.

4.3. Effect of Keyway and Platforms

This section would demonstrate the anti-sliding effect of the keyway and platforms that are underneath the anchorage. Generally, the existence of a keyway and a platform can notably improve the anti-sliding and anti-overturning stability of the anchorage. However, due to the insufficient development of the design theory, traditionally the effect of the anti-sliding measures, such as keyway and platform, are hardly evaluated in a quantitative way. Thus, these measures generally provide shear resistance in terms of passive lateral earth pressure and were merely being considered as the reserved stability factor. Here the anti-sliding and anti-overturning effect of the keyway and platforms of the scale model would be evaluated with the DEM modelling.
Figure 22 gives the comparison of DEM predicted displacements with/without anti-slip measures at the initial loading phase. The scale model results were termed as the benchmark results in Figure 22, while the results of the model without keyway and platform were termed as the WK results. It is evident that the consideration of keyway and platform can largely improve the horizontal and vertical equivalent stiffness of rock mass beneath the anchorage model by about 10% and 20%, respectively.
As shown in Figure 23, for the overload condition, the horizontal displacement of the WK model rises sharply when the load is ≈3 times the design load, indicating the anchorage model fails. However, as demonstrated by the benchmark results, if the keyway and platforms were considered, the anchorage would not fail until the load was 4~5 times the design load. The results show that the keyway and platforms can improve the anti-sliding capability by about 50%.

5. Conclusions

The stability of bridge anchorage structures is frequently simulated in a numerical way with the FEM approach, and thus the interaction between the base rock and structure concrete is hardly considered. The DEM approach, which has been shown to be suitable for the modelling of contact problems of discrete blocks, was introduced in this paper to simulate the mechanical behavior of the rock-concrete system of the gravity anchorage structure and its rock mass foundation. Based on the in-situ scale model test for a suspension bridge, the mechanical behavior of the rock-concrete interface was discussed with the DEM method. The following results have been obtained:
(1)
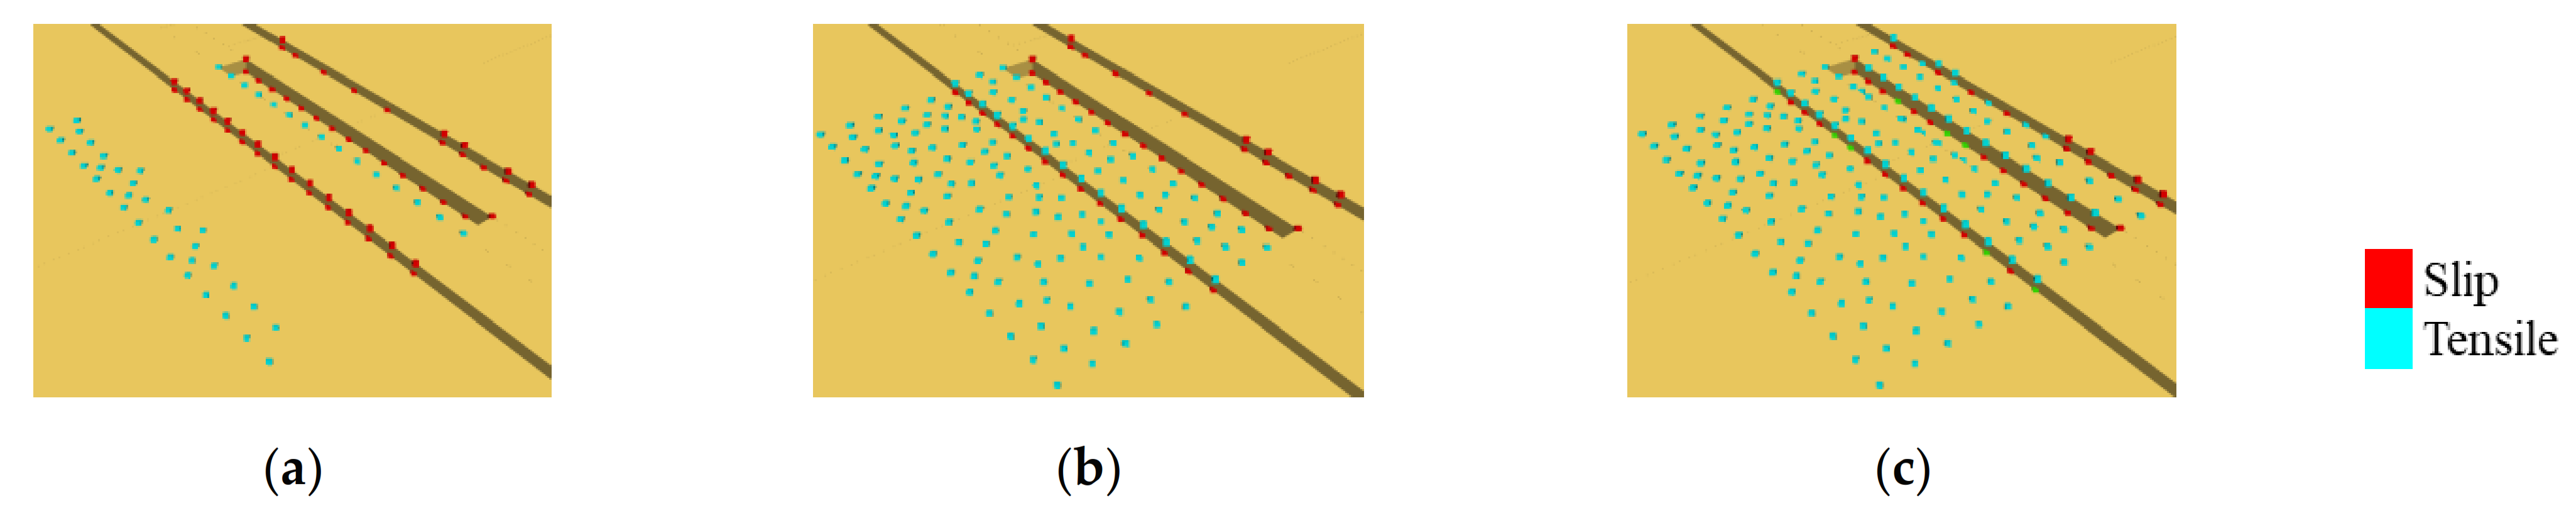
The DEM approach can qualifiedly simulate the in-situ scale test in a numerical way and explain some interesting phenomena that are hardly observed in tests, such as the deformation and stress conditions on the concrete-rock contact surface.
(2)
Under the design load condition, the deformation of the anchorage model is basically characterized by the rigid rotation about the keyway of platform #2. The platforms #2 and #1, rather than platform #3, bear the most shear load due to the large upward displacement of the bank side of the bridge anchorage. The anchorage-rock system basically remains in an elastic state under the design load, and the interface and rock mass will not fail under the shear action.
(3)
With the help of the DEM simulation, the failure behavior of the anchorage model can be revealed, especially the progressive failure process of the concrete-rock contact surface that lies underneath the anchorage model. It is confirmed that, akin to the displacement mode during the design loading phase, the displacement mode at the failure state is also rigid rotation about the keyway of platform #2. During the failure process, the bank side of the anchorage model was gradually lifted by the lateral thrust and lost its sliding resistance, while platform #1 would provide the majority of the anti-sliding force.
(4)
The DEM simulation results show that the anti-sliding measures such as keyway and platform can improve the equivalent stiffness by about 10–20% and the interface anti-sliding capacity by around 50%. Therefore, these measures should not be ignored in the anchorage design work.
(5)
The main limitation of the current paper is that the design and construction work of the bridge project were abandoned due to local policy reasons. Therefore, no DEM simulation was performed for the real prototype anchorage. Yet the current work is sufficient to demonstrate the feasibility of the DEM approach in the analysis of the bridge anchorage problems.

Author Contributions

The paper was written by Z.C. under the guidance of Q.S. with the help of M.Z. The pre-literature research and study design were carried out by Z.C. and M.Z. The numerical model was proposed by Z.C. and M.Z. The data analysis of model tests was carried out M.Z. under the help of Z.C. All authors have read and agreed to the published version of the manuscript.

Funding

This work is supported by the National Natural Science Foundation of China (Nos. U21A20159, 52079133, 41902288), CRSRI Open Research Program (Program SN: CKWV2019746/KY), MOE Key Laboratory of Disaster Forecast and Control in Engineering, Jinan University (No. 20200904002), and the Youth Innovation Promotion Association CAS.

Institutional Review Board Statement

Not applicable.

Informed Consent Statement

Not applicable.

Data Availability Statement

The data presented in this study are available on request from the corresponding author upon reasonable request.

Acknowledgments

We would like to acknowledge the reviewers and the editor for their valuable comments and suggestions.

Conflicts of Interest

The authors declare no conflict of interest.

Nomenclature

CY modelContinuously yielding model
DEMDiscrete element method
FEMFinite element method
MC modelMohr-Coulomb model

References

  1. Kim, H.K.; Lee, M.J.; Chang, S.P. Non-linear shape-finding analysis of a self-anchored suspension bridge. Eng. Struct. 2002, 24, 1547–1559. [Google Scholar] [CrossRef]
  2. Li, J.H.; Feng, D.M.; Li, A.Q.; Yuan, H.H. Determination of reasonable finished state of self-anchored suspension bridges. J. Cent. South Univ. 2016, 23, 209–219. [Google Scholar] [CrossRef]
  3. Han, Y.; Chen, Z.; Luo, S.; Yang, S. Calculation method on shape finding of self-anchored suspension bridge with spatial cables. Front. Struct. Civil Eng. 2009, 3, 165–172. [Google Scholar] [CrossRef]
  4. Matsumoto, K.; Arturo Linan Panting, C.; Kitratporn, N.; Takeuchi, W.; Nagai, K.; Iwasaki, E. Performance Assessment Using Structural Analysis and Spatial Measurement of a Damaged Suspension Bridge: Case Study of Twantay Bridge, Myanmar. J. Bridge Eng. 2018, 23, 1–14. [Google Scholar] [CrossRef] [Green Version]
  5. Han, Y.; Liu, X.; Wei, N.; Li, D.; Deng, Z.; Wu, X.; Liu, D. A Comprehensive Review of the Mechanical Behavior of Suspension Bridge Tunnel-Type Anchorage. Adv. Mater. Sci. Eng. 2019, 2019, 3829281. [Google Scholar] [CrossRef] [Green Version]
  6. Zhang, Z.; Wang, H.; Qin, S.; Ge, X. Limit span of self-anchored cable-stayed suspension cooperation system bridge based on strength. Front. Struct. Civil Eng. 2009, 3, 286–291. [Google Scholar] [CrossRef]
  7. Koji, K.; Fumio, T. Several Geotechnical Design and Construction Issues with Akashi Strait Bridge. Soils Found. 2010, 50, 829–845. [Google Scholar]
  8. Saad, A.S.; Sanders, D.H.; Buckle, I.G. Experimental evaluation of bridge column foundation rocking behavior. J. Bridge Eng. 2018, 23, 1–13. [Google Scholar] [CrossRef]
  9. Sun, J.; Manzanarez, R.; Nader, M. Design of looping cable anchorage system for new San Francisco-Oakland Bay Bridge main suspension span. J. Bridge Eng. 2002, 7, 315–324. [Google Scholar] [CrossRef]
  10. Li, W.S.; Lai, Y.J.; Wu, C.J. 2D-Finite element numerical modelling and analysis of an anchorage of suspension bridge. Chin. J. Undergr. Space Eng. 2009, 5, 1768–1775. [Google Scholar]
  11. Wu, G.G.; Zhang, Y.J.; Chen, G.P.; He, S.L. Stress analysis of gravity anchorage of Aizhai bridge. Bridge Constr. 2013, 43, 40–44. [Google Scholar]
  12. Zhang, Q.H.; Li, Y.J.; Yu, M.W.; Hu, H.H.; Hu, J.H. Study of the rock foundation stability of the Aizhai suspension bridge over a deep canyon area in China. Eng. Geol. 2015, 198, 65–77. [Google Scholar] [CrossRef]
  13. Lee, S.H.; Lee, H.; Paik, I.; Lee, H.S. Evaluation of load and resistance factors for the reliability-based design of the main cable of earth-anchored suspension bridges. KSCE J. Civ. Eng. 2016, 20, 2457–2468. [Google Scholar] [CrossRef]
  14. Gwon, S.G.; Choi, D.H. Static and dynamic analyses of a suspension bridge with three-dimensionally curved main cables using a continuum model. Eng. Struct. 2018, 161, 250–264. [Google Scholar] [CrossRef]
  15. Gorman, J.A.; Gross, D.; Hall, T.S.; Matty, S.; Christoffersen, S.; Cavendish-Tribe, A.; Shulock, R. San Francisco-Oakland Bay Bridge anchor rod cracking issues. Mater. Perform. 2015, 54, 52–57. [Google Scholar]
  16. Shin, S.U.; Jung, M.R.; Park, J.; Kim, M.Y. A deflection theory and its validation of earth-anchored suspension bridges under live loads. KSCE J. Bridge Eng. 2015, 19, 200–212. [Google Scholar] [CrossRef]
  17. Liu, X.R.; Li, D.L.; Wu, X.C.; Li, W.S.; Zhang, R.; Fu, Y. Filed model tests on bearing behavior of mudstone tunnel anchorage. Chin. J. Geotech. Eng. 2017, 39, 161–169. [Google Scholar]
  18. Lekidis, V.; Tsakiri, M.; Makra, K.; Karakostas, C.; Klimis, N.; Sous, I. Evaluation of dynamic response and local soil effects of the Evripos cable-stayed bridge using multi-sensor monitoring systems. Eng. Geol. 2005, 79, 43–59. [Google Scholar]
  19. Cundall, P.A.; Lemos, J.V. Numerical simulation of fault instability with the continuously yielding joint model. In Rockbursts and Seismicity in Mines, Proceedings of the International Symposium on Rockbursts and Seismicity in Mines, Minneapolis, MN, USA, 8–10 June 1988; Fairhurst, C., Ed.; Balkema: Rotterdam, The Netherlands, 1990; pp. 147–152. [Google Scholar]
  20. Cui, Z.; Sheng, Q.; Leng, X.L. Control effect of a large geological discontinuity on the seismic response and stability of underground rock caverns: A case study of the Baihetan #1 surge chamber. Rock Mech. Rock Eng. 2016, 49, 2099–2114. [Google Scholar]
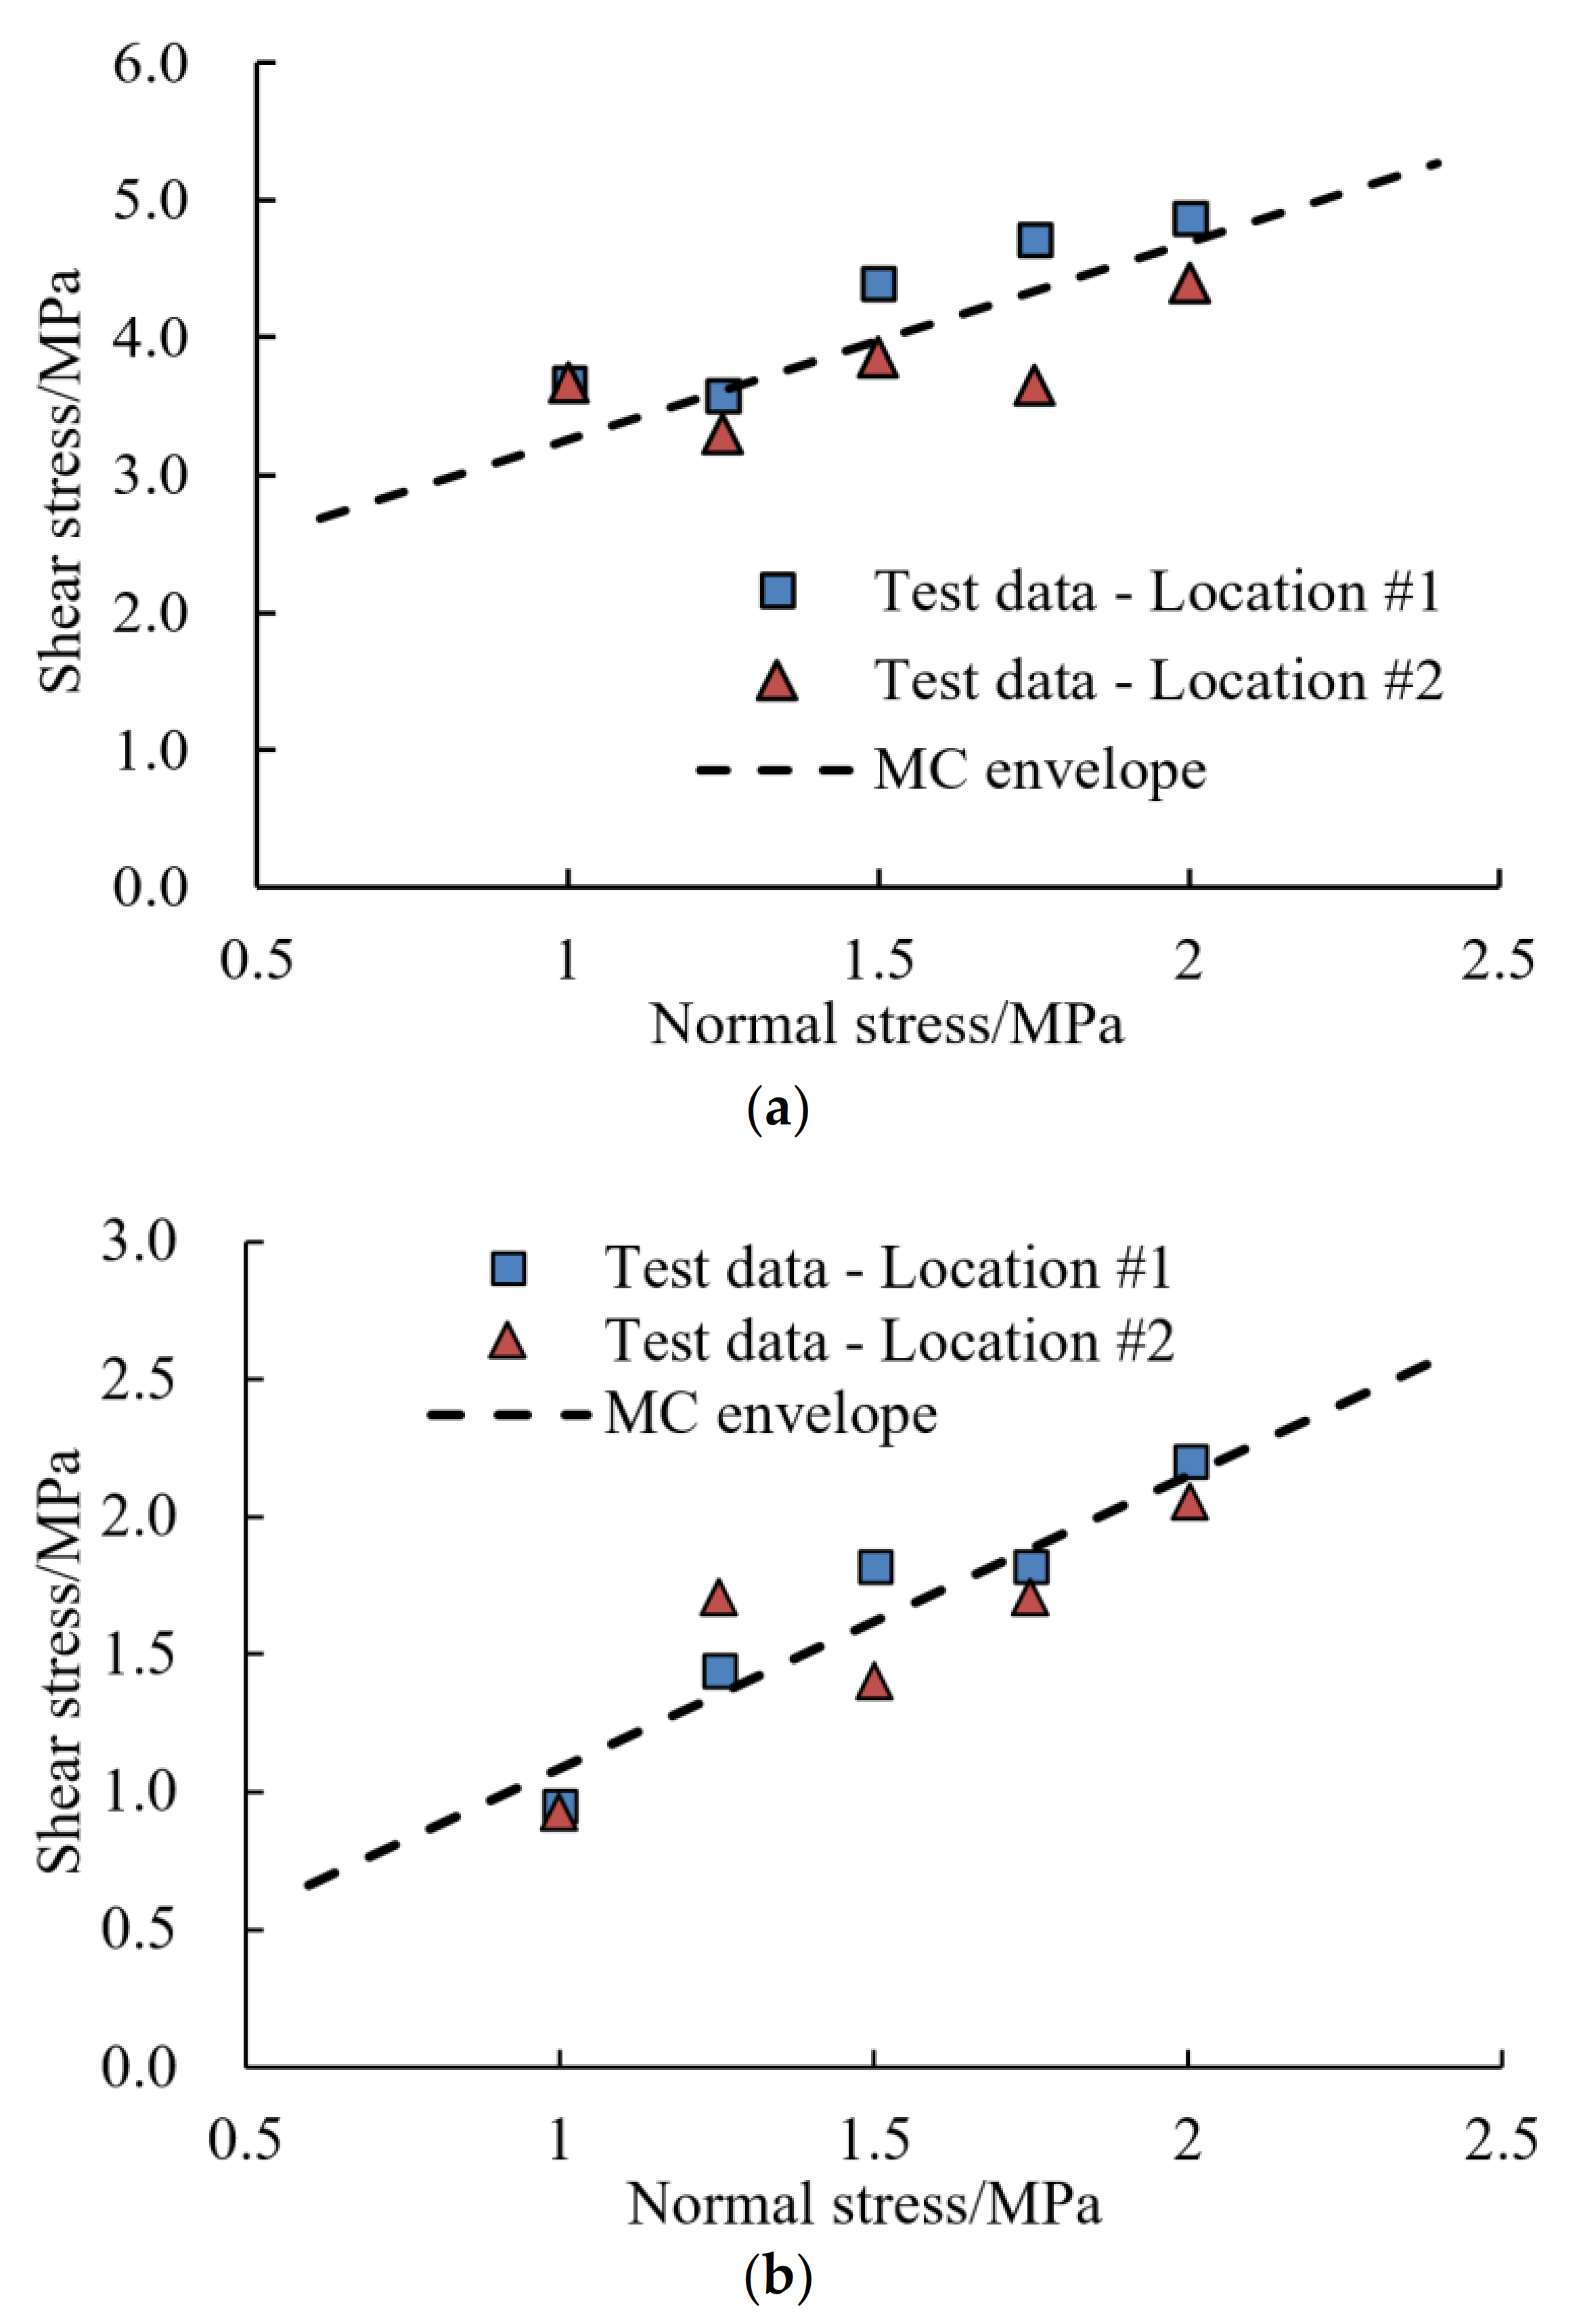
Figure 1. The rock mass foundation surface supporting the bridge anchorage. (The hollow triangle symbol in this figure stands for elevation; The red triangle is the scale model test location; The yellow dots are Location #1 for in-situ shear test and the bule dots are Location #2 for in-situ shear test).
Jmse 10 00221 g001
Figure 2. The in-situ direct shear test of the rock-concrete interface.
Jmse 10 00221 g002
Figure 3. The in-situ direct shear results. (a) Shear test data at Location #1, (b) Shear test data at Location #2.
Jmse 10 00221 g003
Figure 4. Fitting the test results with the MC criterion. (a) Peak strength, (b) Resident strength.
Jmse 10 00221 g004
Figure 5. Comparison of the test data with DEM simulation. (a) Normal stress = 1.25 MPa, (b) Normal stress = 2.0 MPa.
Jmse 10 00221 g005
Figure 6. The in-situ scale model test of the bridge anchorage.
Jmse 10 00221 g006
Figure 7. Schematic geometry of scale anchorage model (Unit in cm). (a) Side view, (b) Plane view.
Jmse 10 00221 g007
Figure 8. DEM model of the scaled anchorage model.
Jmse 10 00221 g008
Figure 9. Comparison of tested displacement with the DEM prediction. (a) Location of the displacement monitoring points and convention of directions; (b) Comparison of tested horizontal displacement with the DEM prediction; (c) Comparison of tested vertical displacement with the DEM prediction.
Jmse 10 00221 g009aJmse 10 00221 g009b
Figure 10. The displacement contour and the displacement vector of the bridge anchorage. (Unit in m).
Jmse 10 00221 g010
Figure 11. The displacement of the rock mass foundation. (Unit in m). (a) The orientation of the section; (b) Section view of the horizontal displacement of the rock mass foundation; (c) Section view of the vertical displacement of the rock mass foundation.
Jmse 10 00221 g011
Figure 12. The contact stress on the rock-concrete interface. (Unit in Pa). (a) Normal stress; (b) Shear stress.
Jmse 10 00221 g012
Figure 13. The yield state of the rock-concrete interface.
Jmse 10 00221 g013
Figure 14. The yield state of the foundation rock mass.
Jmse 10 00221 g014
Figure 15. Variation of the displacement of the bridge anchorage with the increasing lateral thrust. (Unit in m). (a) 2 × design load (500 kN); (b) 3 × design load (750 kN); (c) 4 × design load (1000 kN).
Jmse 10 00221 g015
Figure 16. Variation of the displacement of the foundation rock mass with the increasing lateral thrust. (Unit in m). (a) 2 × design load (500 kN); (b) 3 × design load (750 kN); (c) 4 × design load (1000 kN).
Jmse 10 00221 g016
Figure 17. Variation of the contact normal stress on the rock-concrete interface with the increasing lateral thrust. (Unit in Pa). (a) 2 × design load (500 kN); (b) 3 × design load (750 kN); (c) 4 × design load (1000 kN).
Jmse 10 00221 g017
Figure 18. Variation of the contact shear stress on the rock-concrete interface with the increasing lateral thrust. (Unit in Pa). (a) 2 × design load (500 kN); (b) 3 × design load (750 kN); (c) 4 × design load (1000 kN).
Jmse 10 00221 g018
Figure 19. Variation of yield state of the rock-concrete interface with the increasing lateral thrust. (a) 2 × design load (500 kN); (b) 3 × design load (750 kN); (c) 4 × design load (1000 kN).
Jmse 10 00221 g019
Figure 20. Variation of yield state of the foundation rock mass with the increasing lateral thrust. (a) 2 × design load (500 kN); (b) 3 × design load (750 kN); (c) 4 × design load (1000 kN).
Jmse 10 00221 g020
Figure 21. Sketched contour of the foundation rock mass surface after the overloading test (3 × design load).
Jmse 10 00221 g021
Figure 22. Comparison of DEM predicted displacements with/without anti-slip measures at the initial loading phase. (a) Horizontal displacement; (b) Vertical displacement.
Jmse 10 00221 g022
Figure 23. Comparison of DEM predicted displacements with/without anti-slip measures at the overloading phase.
Jmse 10 00221 g023
Table 1. Tested data of concrete-rock interface under various normal stresses.
Location No.Strength/MPa1.001.251.501.752.00
1Peak3.703.64.434.744.92
Resident0.921.401.701.822.20
2Peak strength3.703.333.903.714.39
Resident0.911.691.391.712.13
AveragePeak strength3.703.474.174.224.65
Resident0.921.551.551.772.17
Table 2. Shear strengths of concrete-rock interface under various normal stresses.
Location No.Peak StrengthResident Strength
Friction CoefficientCohesion/MPaFriction CoefficientCohesion/MPa
11.362.20.90.2
20.722.71.10.0
Average1.082.41.00.1
Table 3. Estimation of deformation magnitude of the anchorage structure based on the DEM simulation.
Total Disp./mmHorizontal Disp./mmVertical Disp./mmRotation Angle/°Maximal Differential Settlement/mm
Scale model0.650.550.360.0250.431
Prototype19.516.510.80.02513
Publisher’s Note: MDPI stays neutral with regard to jurisdictional claims in published maps and institutional affiliations.

