Article

Pore Pressure Response and Dissipation of Piezocone Test in Shallow Silty Soil of Yellow River Delta

1
College of Marine Geosciences, Ocean University of China, Qingdao 266100, China
2
College of Environmental Science and Engineering, Ocean University of China, Qingdao 266100, China
3
Laboratory for Marine Geology, Pilot National Laboratory for Marine Science and Technology, Qingdao 266061, China
*
Authors to whom correspondence should be addressed.
J. Mar. Sci. Eng. 2022, 10(2), 255; https://doi.org/10.3390/jmse10020255
Submission received: 22 December 2021 / Revised: 9 February 2022 / Accepted: 11 February 2022 / Published: 13 February 2022
(This article belongs to the Section Geological Oceanography)

Abstract

:
Soil dilatancy and partial drainage have great influence on the consolidation coefficient assessment of silty soils with clay content of less than 30% in the Yellow River Delta using the CPTu. This paper discussed the effect of soil dilatancy and partial drainage on the pore pressure response and dissipation of piezocone test in shallow silty soil of the Yellow River Delta through variable penetration rate tests in a pressure chamber and a series of supplementary soil element tests. The results show that the pore pressure dissipation curve is affected by soil type and degree of consolidation. The soil dilatancy is the key factor affecting consolidation coefficient inversion of shallow silt and silty clays. The initial pore pressure is negative and the pore pressure increases to umax first, but the umax value is very small in the Yellow River Delta silt. The inversion method used for shear contractile soil cannot be used to invert the mechanical properties of shallow silty soil directly, and a new consolidation curve normalization method is proposed. This paper provides a reference for the consolidation coefficient inversion of CPTu data in the Yellow River Delta area.

1. Introduction

As there are a lot of oil and gas transmission pipelines in the Yellow River Delta [1,2,3], the evaluation of soil consolidation parameters is of great significance to the evaluation of settlement caused by human activities. The cone penetration test (CPTu) is one of the most widely used geotechnical in situ testing methods. It is a fast, reliable, and economical means for obtaining soil properties [4,5]. Many inversion methods of the CPTu have been developed [6,7,8,9,10]. In fine-grained soils, dissipation tests are often carried out to estimate the consolidation coefficient [6,11].
As the consolidation coefficient cv of silts is larger than that of clay, partial drainage would usually affect CPTu test data at the standard penetration rate in silts, and the interaction between the structure and soil is also affected by partial drainage [12,13,14]. The effects of drainage on CPTu test data have been thoroughly investigated. DeJong and Randolph [15] discussed the influence of partial drainage on soil classification results; Randolph and Hope [16] discussed the influence of penetration rate on test results by centrifuge; Silva et al. [17], Yi et al. [18], and Mahmoodzadeh et al. [19] discussed the influence of partial drainage on test results by numerical method. The above research is mainly aimed at contractile soils (i.e., normally consolidated clay). The normalized velocity V = vD/cv is used to represent the drainage condition. For sandy soil, Jaeger et al. [20], and Suzuki and Lehane [21] conducted centrifuge tests and small calibration tank tests on a normally consolidated clay–sand mixture. The results showed that the penetration rate had a significant influence on the penetration resistance of the mixture. The effect of penetration rate on the penetration resistance of sand–clay mixture is greater than that of clay.
For dilatant soils, negative excess pore pressures generated from changes in shear stress are greater than the positive excess pore pressures generated by increased mean stress. With the increase of penetration rate, penetration resistance and lateral friction resistance significantly increase, and negative pore water pressure significantly increases [22,23,24]. The penetration rate in dilatant soil affects the pore pressure response [25]. There are many silty soil layers in the Yellow River Delta [2]. The mechanical properties of silt in the Yellow River Delta changed obviously with the change of clay particles [26,27]. Wang et al. [28] and Zhang [29] studied the mechanical properties of silt in the Mississippi and Yellow River Delta, and test results show that the silty soil exhibits dilatancy. The CPTu inversion method used for shear contractile soil cannot be used to invert the mechanical properties of shallow silty soil directly. It is necessary to study the effects of penetration rate on the accuracy of the results of consolidation coefficient inversion in shallow silty soil.
This paper discusses the effect of dilatancy and partial drainage on the pore pressure response and dissipation of the piezocone test in the shallow silty soil of Yellow River Delta through variable penetration rate tests in a pressure chamber and a series of supplementary soil element tests. In this paper, the inversion methods of consolidation coefficient are summarized by experimental methods, which provides a reference for the inversion of CPTu data in the Yellow River Delta area.

2. Characteristics of Silts and Silty Clays

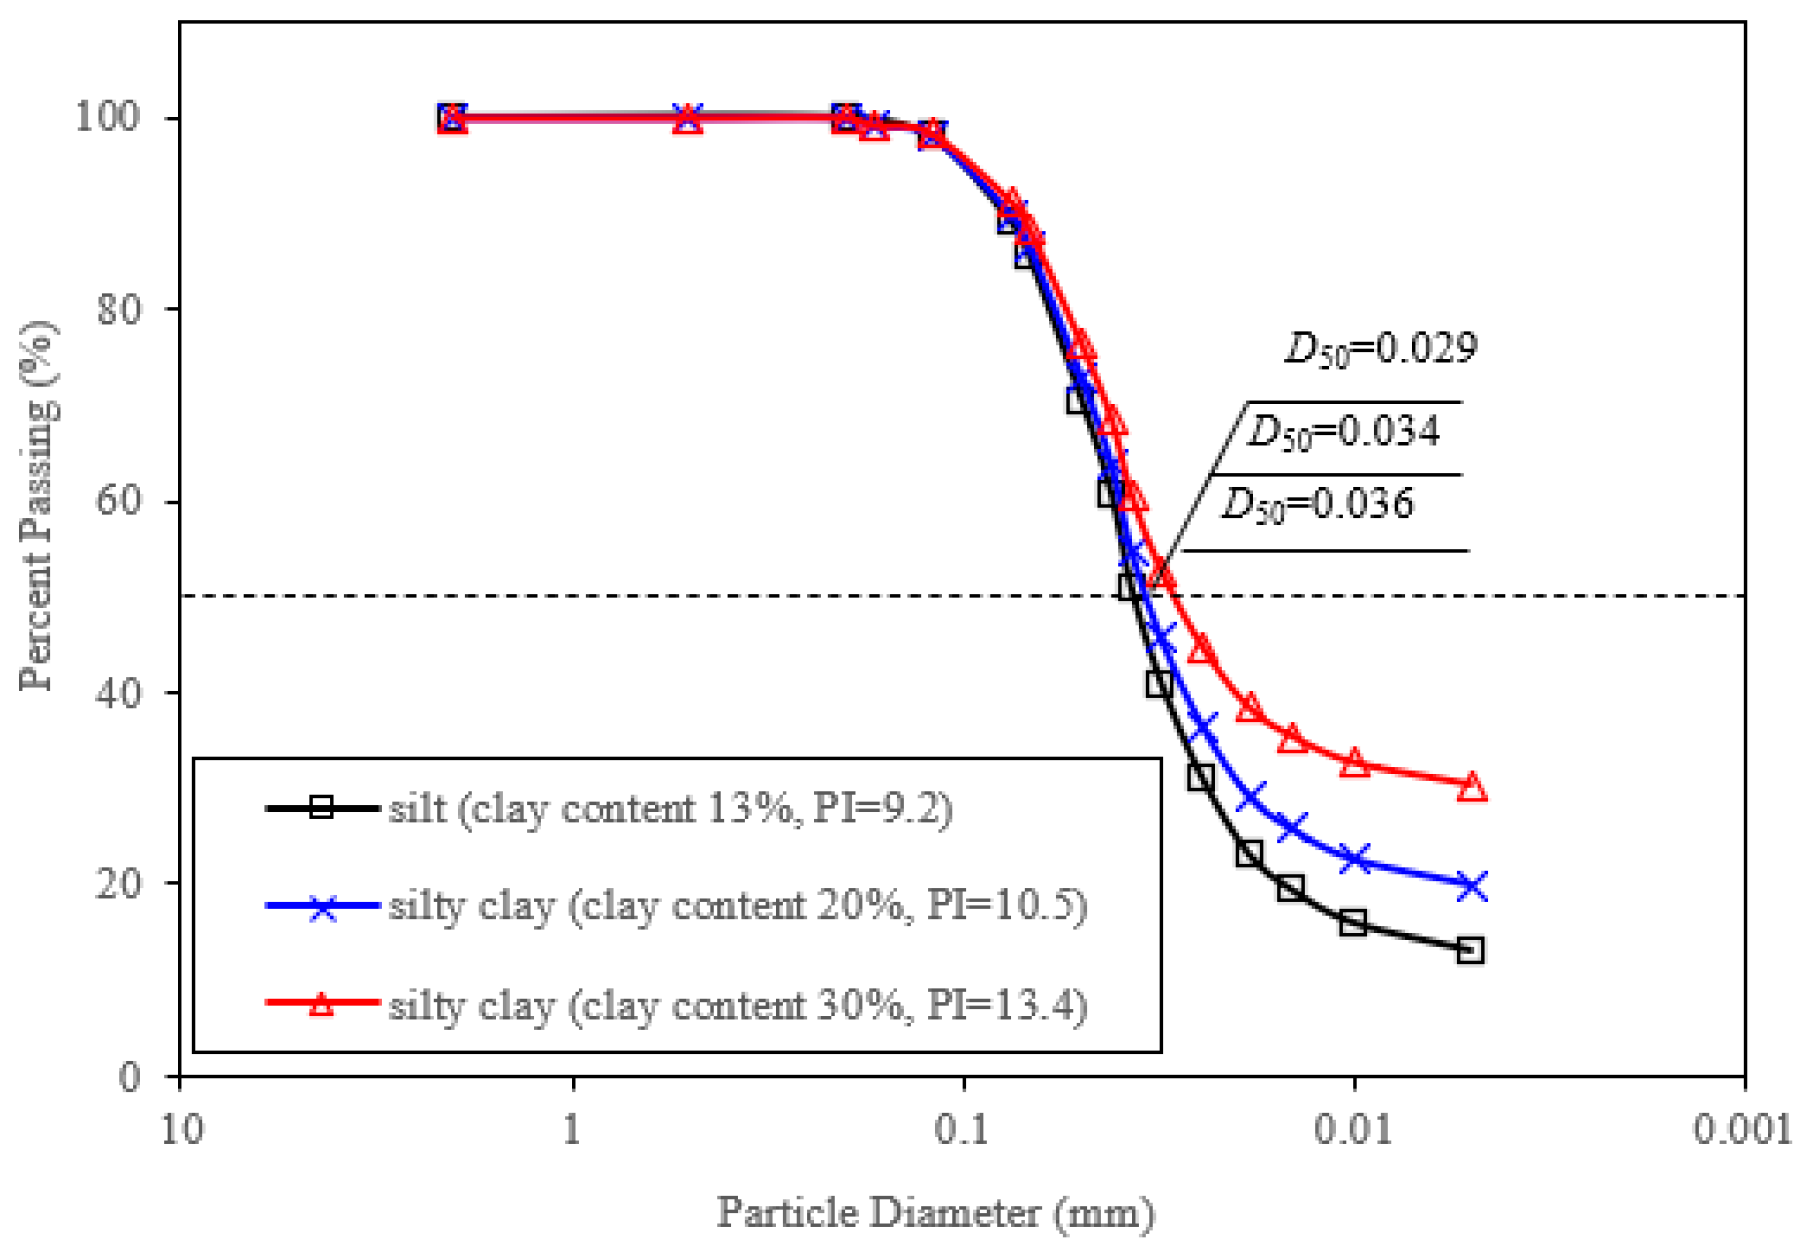
2.1. Particle Size Distribution of Silt and Silty Clays

The silt used in the experiment was collected from the tidal flat of the Yellow River Delta. As the clay content of in situ soil cannot be controlled accurately, two other silty clays were obtained by adding kaolin clay. The clay minerals in the Yellow River Delta are mainly illite and kaolin [2,26], so kaolin clay is selected to control the soil particle size distribution. Fine kaolin clay with particle size less than 0.005 mm was used in the test. Particle size distribution curves of the tested soils are shown in Figure 1. The plasticity index (PI) of three soils is shown in Figure 1, and it was used to distinguish silt and silty clay. When the PI is greater than 10, it is named silty clay according to the soil classification method in GB50021 [30].

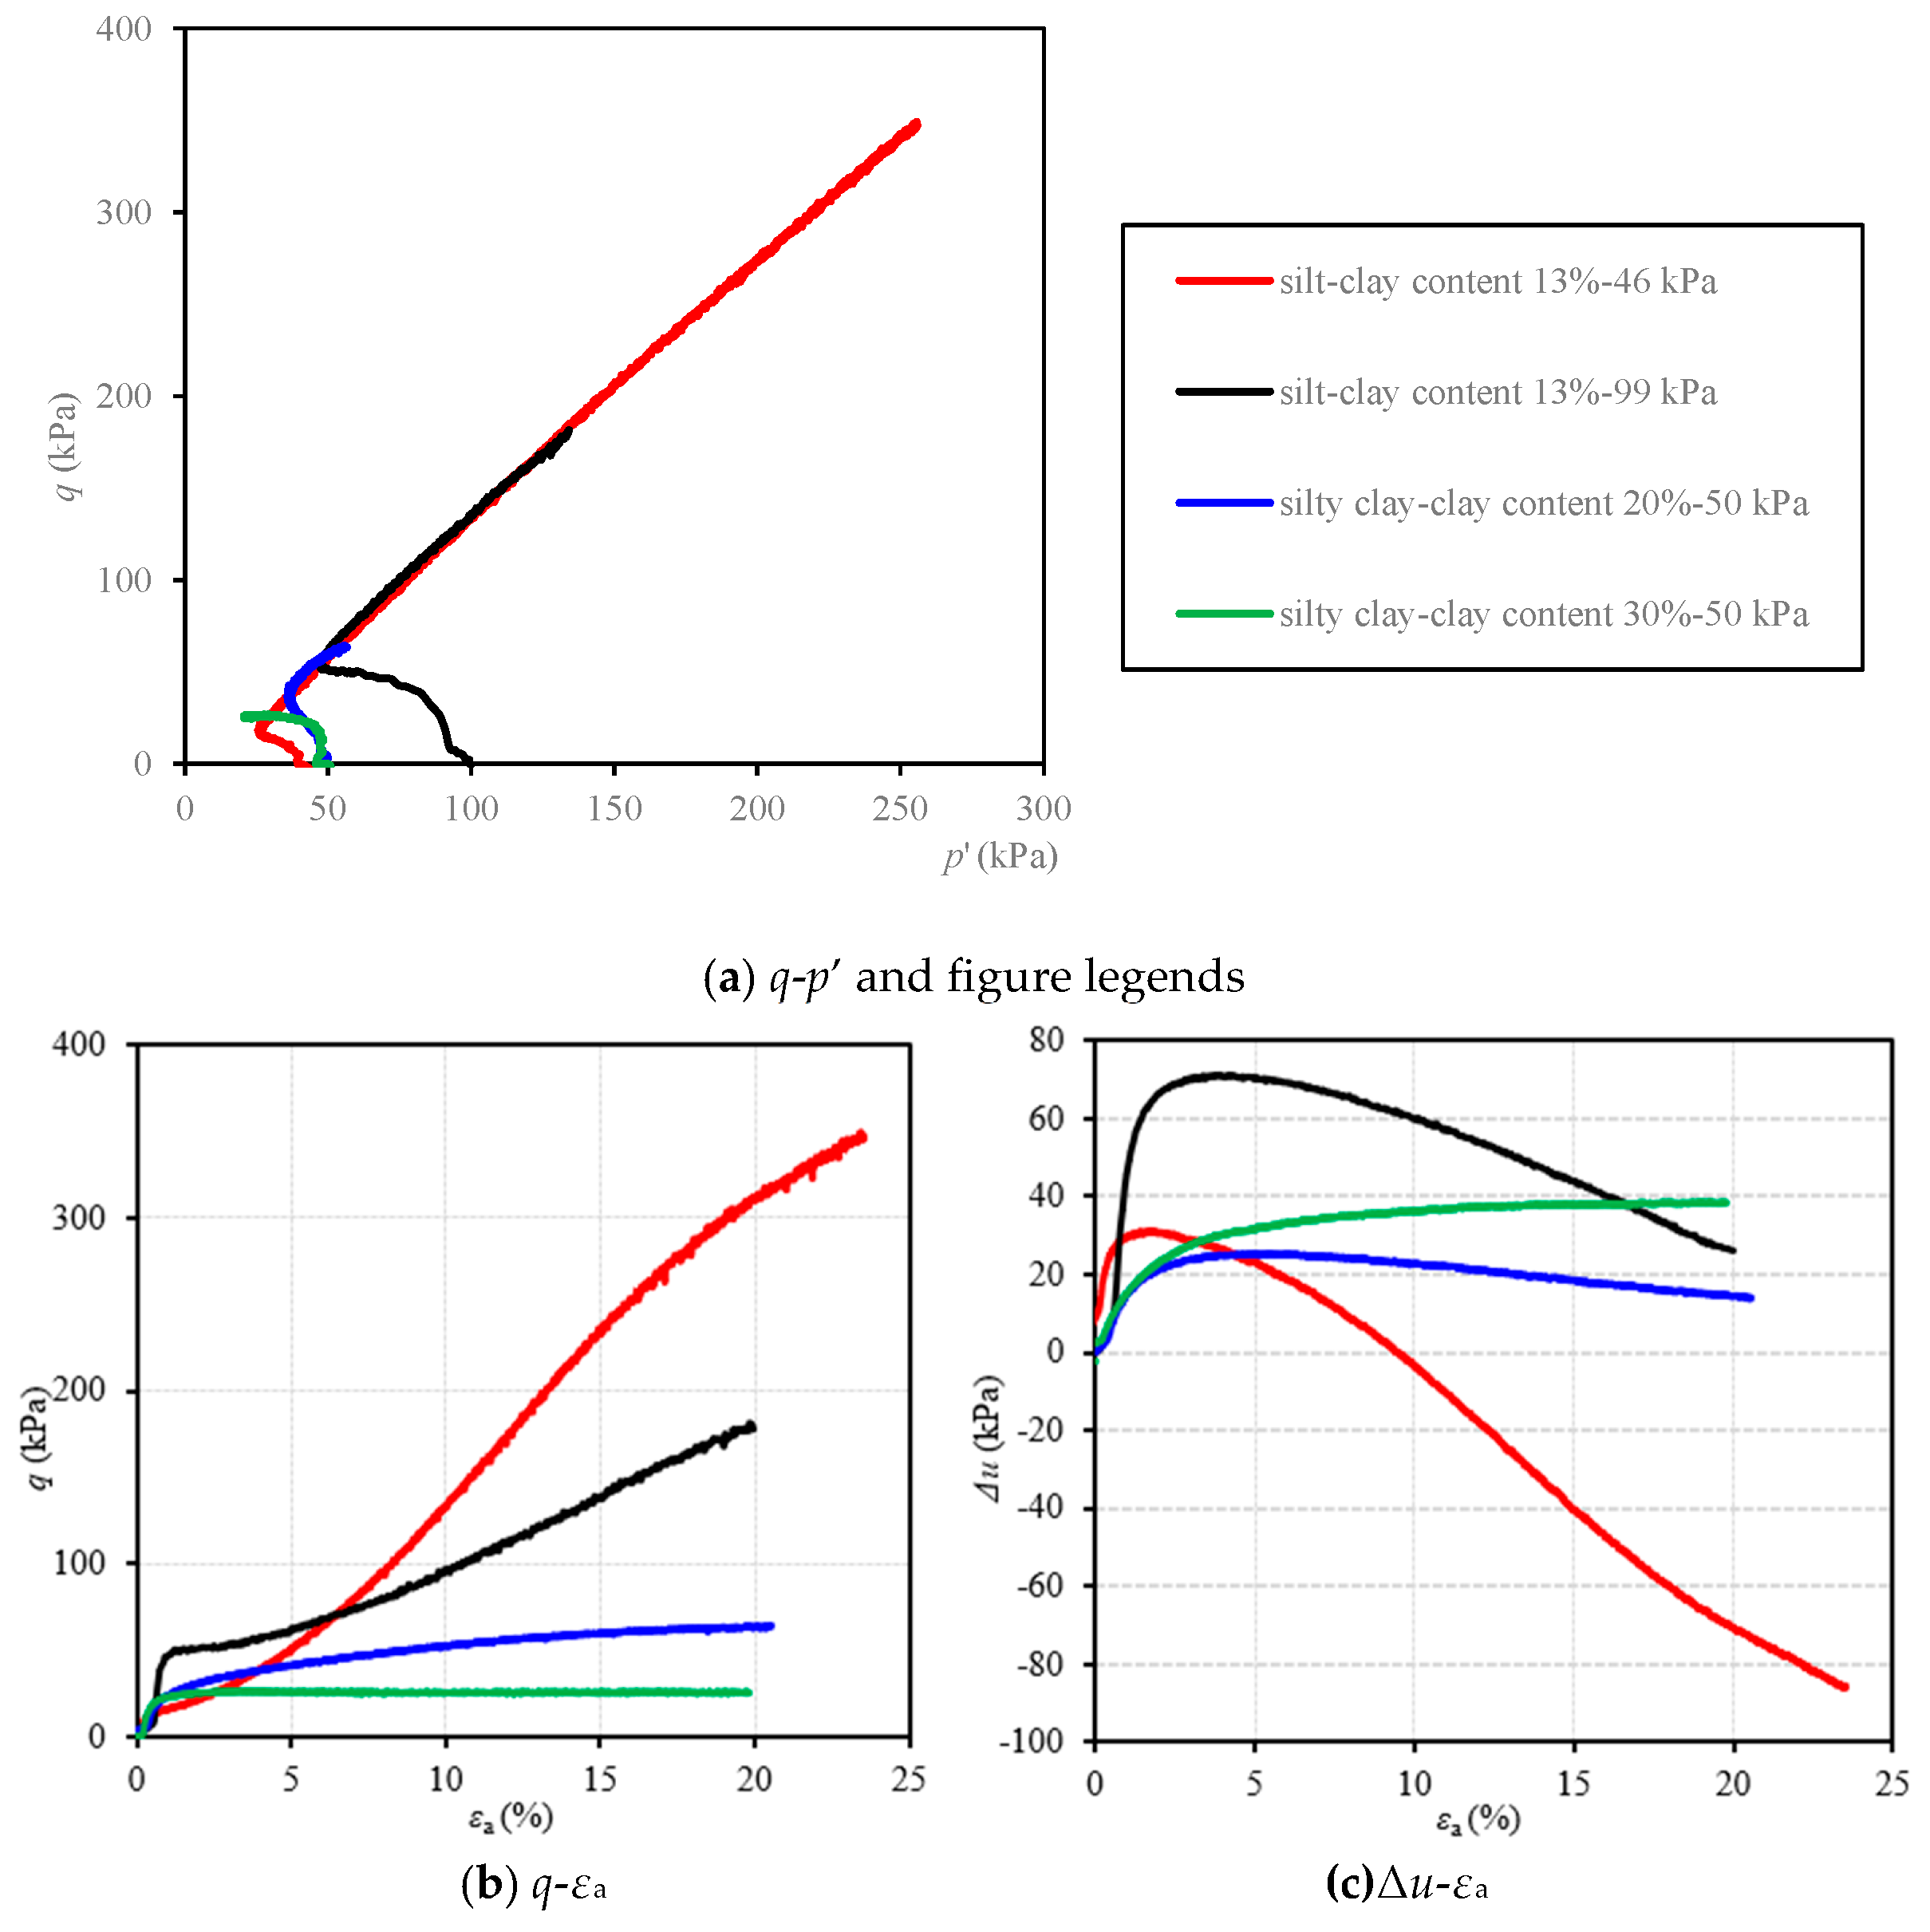
2.2. Triaxial Test Results

Silt samples cannot be prepared by the direct sampling method due to how the sample preparation process will cause soil liquefaction, so silt samples were obtained with the dry method. Silty clay samples were prepared with the direct sampling method from the CPTu test chamber. The porosity ratio of silt was consistent with the CPTu test at 30 kPa. The test results are shown in Figure 2 and summarized in Table 1. By comparing the triaxial test results at 46.1 kPa and 99.2 kPa, it can be known that under the condition of low stress, the dilatancy of the soil was enhanced, and the properties of silt are similar to those of sandy soil. The slope of the q-p’ critical state line of silt is consistent. Comparing the triaxial test results of soil with different clay content, the dilatancy of soil increases with the decrease of clay content. The ratio of excess pore water pressure to deviator stress at the critical state Af is related to the stress condition and clay content.

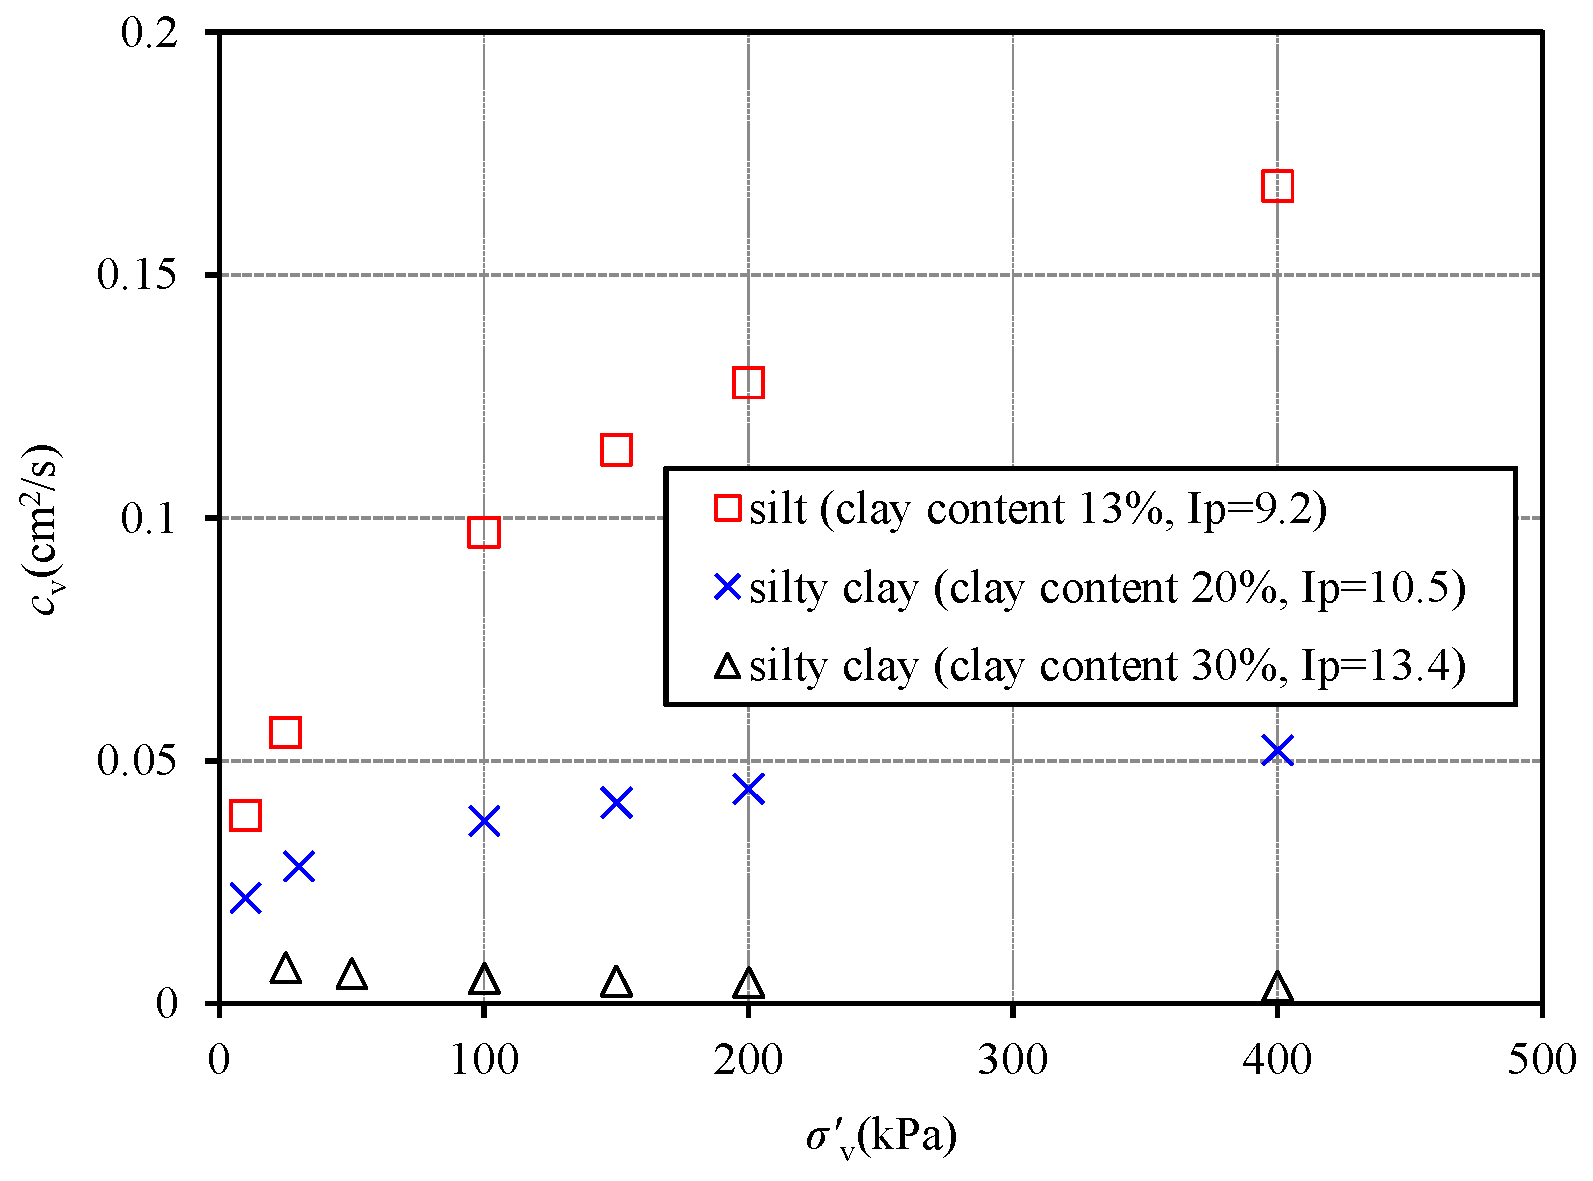
2.3. One-Dimensional Consolidation Test Results

The one-dimensional consolidation test results are shown in Figure 3. The cv of silt is between 0.038 cm2/s and 0.097 cm2/s when σ’v < 100 kPa. The partial drainage conditions were represented by V = vD/cv [16]. With the standard penetration rate of 20 mm/s, the value of V is between 32 and 84. The undrained limit for V of around 30 was suggested by Randolph and Hope [16], Finnie and Randolph [31], Mahmoodzadeh et al. [19], and Yi et al. [18] through centrifuge test and finite element analysis; Ecemis and Karaman [32] suggested that the upper limit of partial drainage is 5–10 in sand with non-/low plastic fines, Chow et al. [33] suggested the upper limit in sand is 74, and Doan and Lehane [34] suggested that the upper limit in the kaolin–sand mixture is 7. The undrained limit is related to soil types. Partial drainage may affect the CPTu results in shallow silty soil of the Yellow River Delta according to the above recommended upper limits of partial drainage. It is necessary to use the variable penetration rate test to obtain the effect of partial drainage in dilatant silty soil.

2.4. Analysis of Mechanical Properties of Silty Soils

Under the condition of low stress, the dilatancy of soil is enhanced, and the properties of silt are similar to those of sandy soil. The soil strain around the probe exceeds 20%, and so negative pore pressure would be produced in the cone shoulder position. The dilatancy of soil affects not only the accumulation of pore pressure but also the dissipation curve of pore pressure [35], thus affecting the results of the consolidation coefficient inversion.
The method of obtaining the consolidation coefficient using the dissipation curve was proposed by Houlsby and Teh [36] using strain path method. A modified theoretical time factor T* is used to calculate the horizontal consolidation coefficient ch. The T* equation is
T * = c h t r 2 I r 0.5
T* is related to the position of the pore pressure sensor. The standard probe pore pressure sensor is generally located at the cone shoulder. The T* of different dissipation degrees is shown in Table 2.
The initial distribution of excess pore pressures has a major influence on pore pressure dissipation process [36]. This paper discussed the effect of the dilatancy and the partial drainage on the pore pressure response and dissipation of piezocone test in shallow silty soil of the Yellow River Delta through variable penetration rate tests in a pressure chamber.

3. CPTu Penetration Analysis in Remolded Silty Clay under Shallow Stress

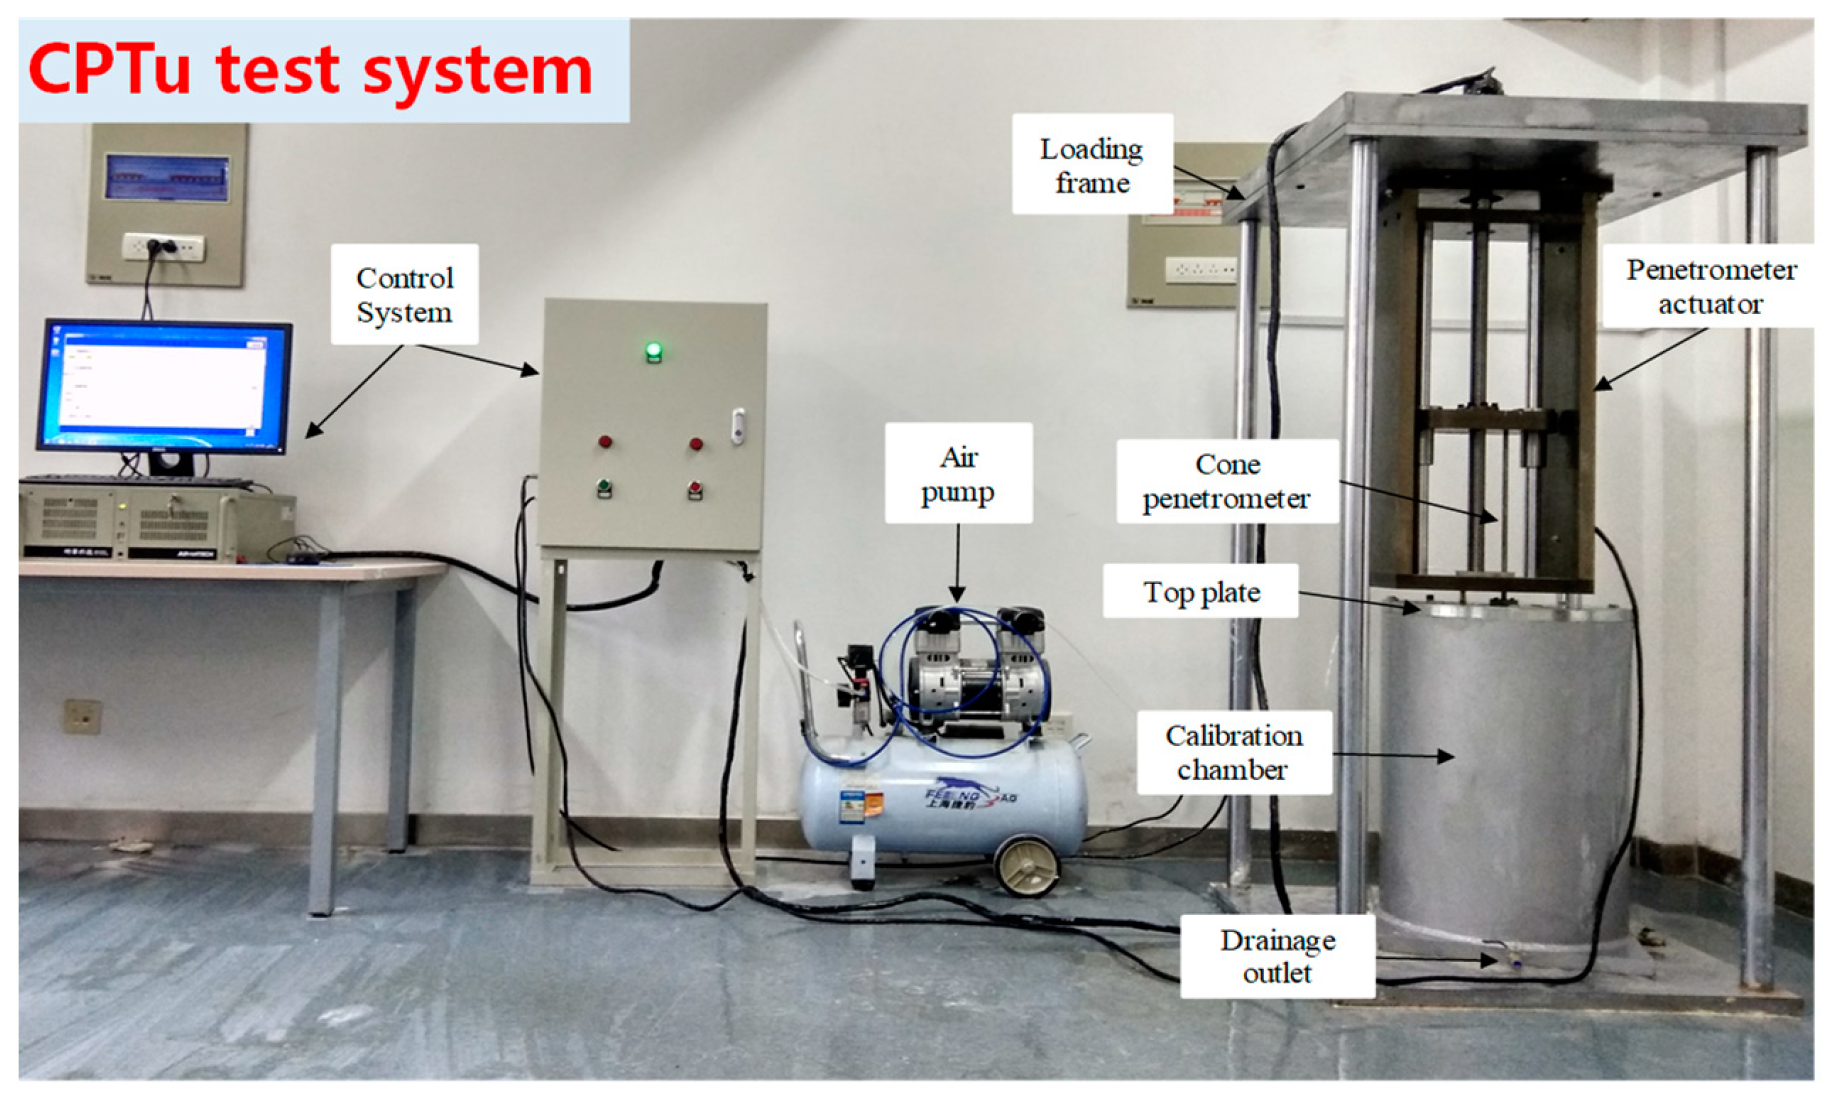
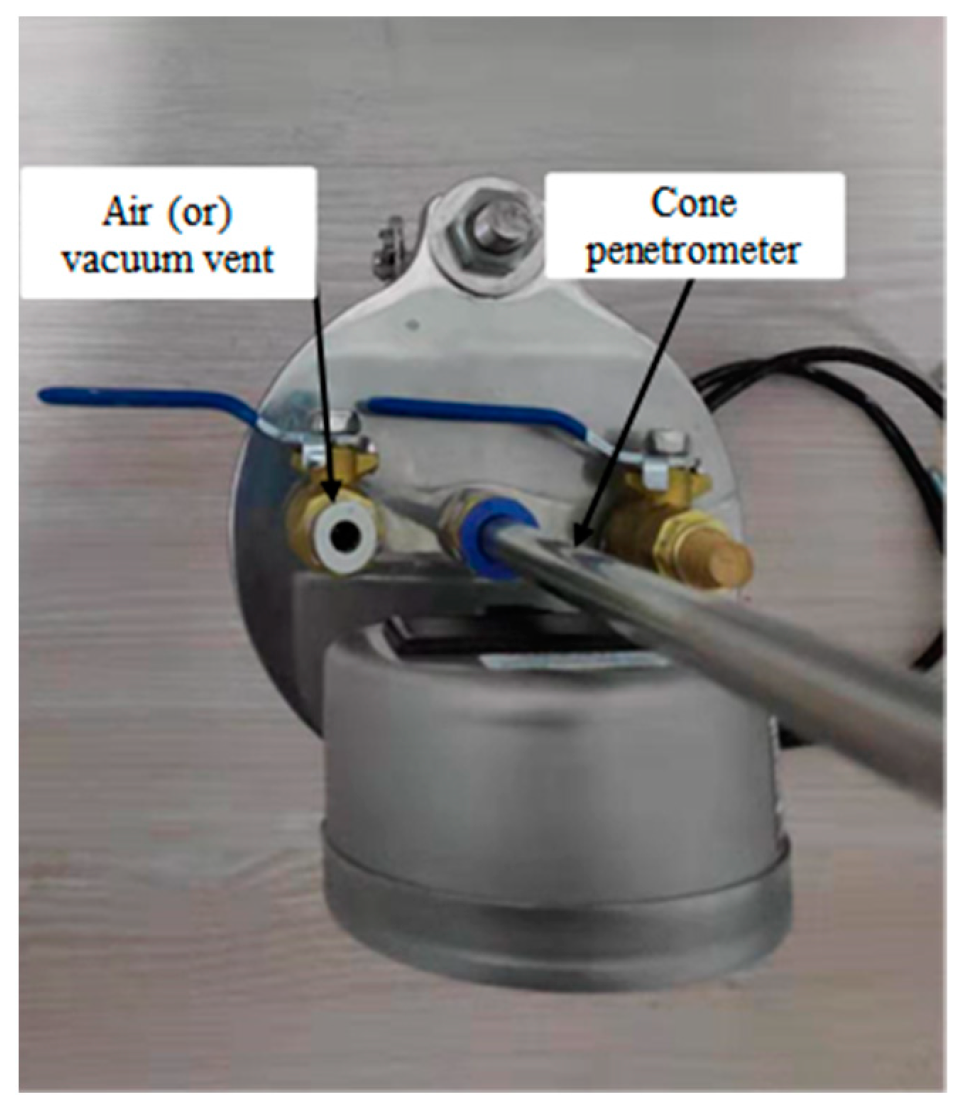
3.1. CPTu Test System

The test equipment included a pressure consolidation chamber and a velocity control penetration system, as shown in Figure 4. The penetration rig is controlled by a servo motor. The segment distance and velocity were entered through the panel on the control box. The diameter of the chamber is 600 mm, and the distance between the CPTu and the chamber wall is more than 15R. R is the radius of the CPTu, which can eliminate the boundary effect of chamber wall on the cone. The diameter of the CPTu was 1.6 cm, and the cross-sectional area was 2 cm2. The penetration depth is 250 mm below the soil surface. Pore pressure dissipation data is measured at u2 position of CPTu. The pore pressure dissipation represents consolidation of soil. Saturation was carried out for 6 h before the penetration test to ensure the accuracy of the data. The filter is saturated by being repeatedly pumped (−100 kPa for half an hour) and pressurized (+100 kPa for half an hour) six times using CPTu saturation unit (Figure 5). The test soils were prepared by the slurry consolidation method with 1.2 times of liquid limit water content.

3.2. Test Plan

Variable penetration rate tests were carried out in three silty soils, all of which underwent 30 kPa of vertical stress to represent shallow soil of 3–5 m. The drainage conditions corresponding to each penetration rate are shown in Table 3. As the modified theoretical time factor T* requires an Ir value, the su and G of the triaxial test under 50 kPa vertical stress were recorded. The su and G of the soil changed with the stress, and the Ir changes little in a certain stress range. The Ir of the soils in the triaxial test under the condition of 50 kPa can be approximated.
After the completion of penetration, the pore pressure dissipation test was conducted, and the dissipation time was evaluated according to Houlsby and Teh’s method [36], in which ch and cv need to be transformed. Mahmoodzadeh et al. [19] suggested adopting an operative consolidation coefficient defined as
C h = 3 ( 1 v ) ( 1 + v ) ( λ κ ) α C v
where α is assumed to be 0.5 [19]; For silt, λ/κ = 4.2–4.8 [29], so ch ≈ 3.5cv.
According to Houlsby and Teh’s method [36], the time to dissipate to 80% is estimated as shown in Table 3, which is used to estimate the time required for the dissipation test. Due to the large consolidation coefficient of the three silty soils, the duration is very short. To obtain a complete pore pressure dissipation curve, however, all dissipation times were increased to over 45 min.

4. Results and Discussion

4.1. Data Processing Method

In the laboratory test, the acquisition frequency of collecting instrument was 40 Hz, which allowed the initial pore pressure and its dissipation after penetration to be accurately measured. The pore pressure at the end of penetration in silt is negative, and the corresponding excess pore pressure at the end of penetration is Δuinitial. The excess pore pressure in dilatant soil first increases and then decreases, and the highest pore pressure is Δumax. In the pore pressure dissipation stage, U and T* are used to normalize.
U = u t u 0 u i n i t i a l u 0 = Δ u t Δ u i n i t i a l   or   U = u t u 0 u max u 0 = Δ u t Δ u max
where uinitial is the initial pore pressure value of cone shoulder, ut is the pore pressure value at time t, u0 is hydrostatic pressure, T* use Equation (1), ch is obtained from Formula (2), and Ir is shown in Table 3.
The penetration resistance qt needs to be corrected by pore pressure u2, and the correction formula is as follows:
qt = qc + u2(1 − Aa/Ac)
where the Aa/Ac of CPTu used in the test is 0.8.

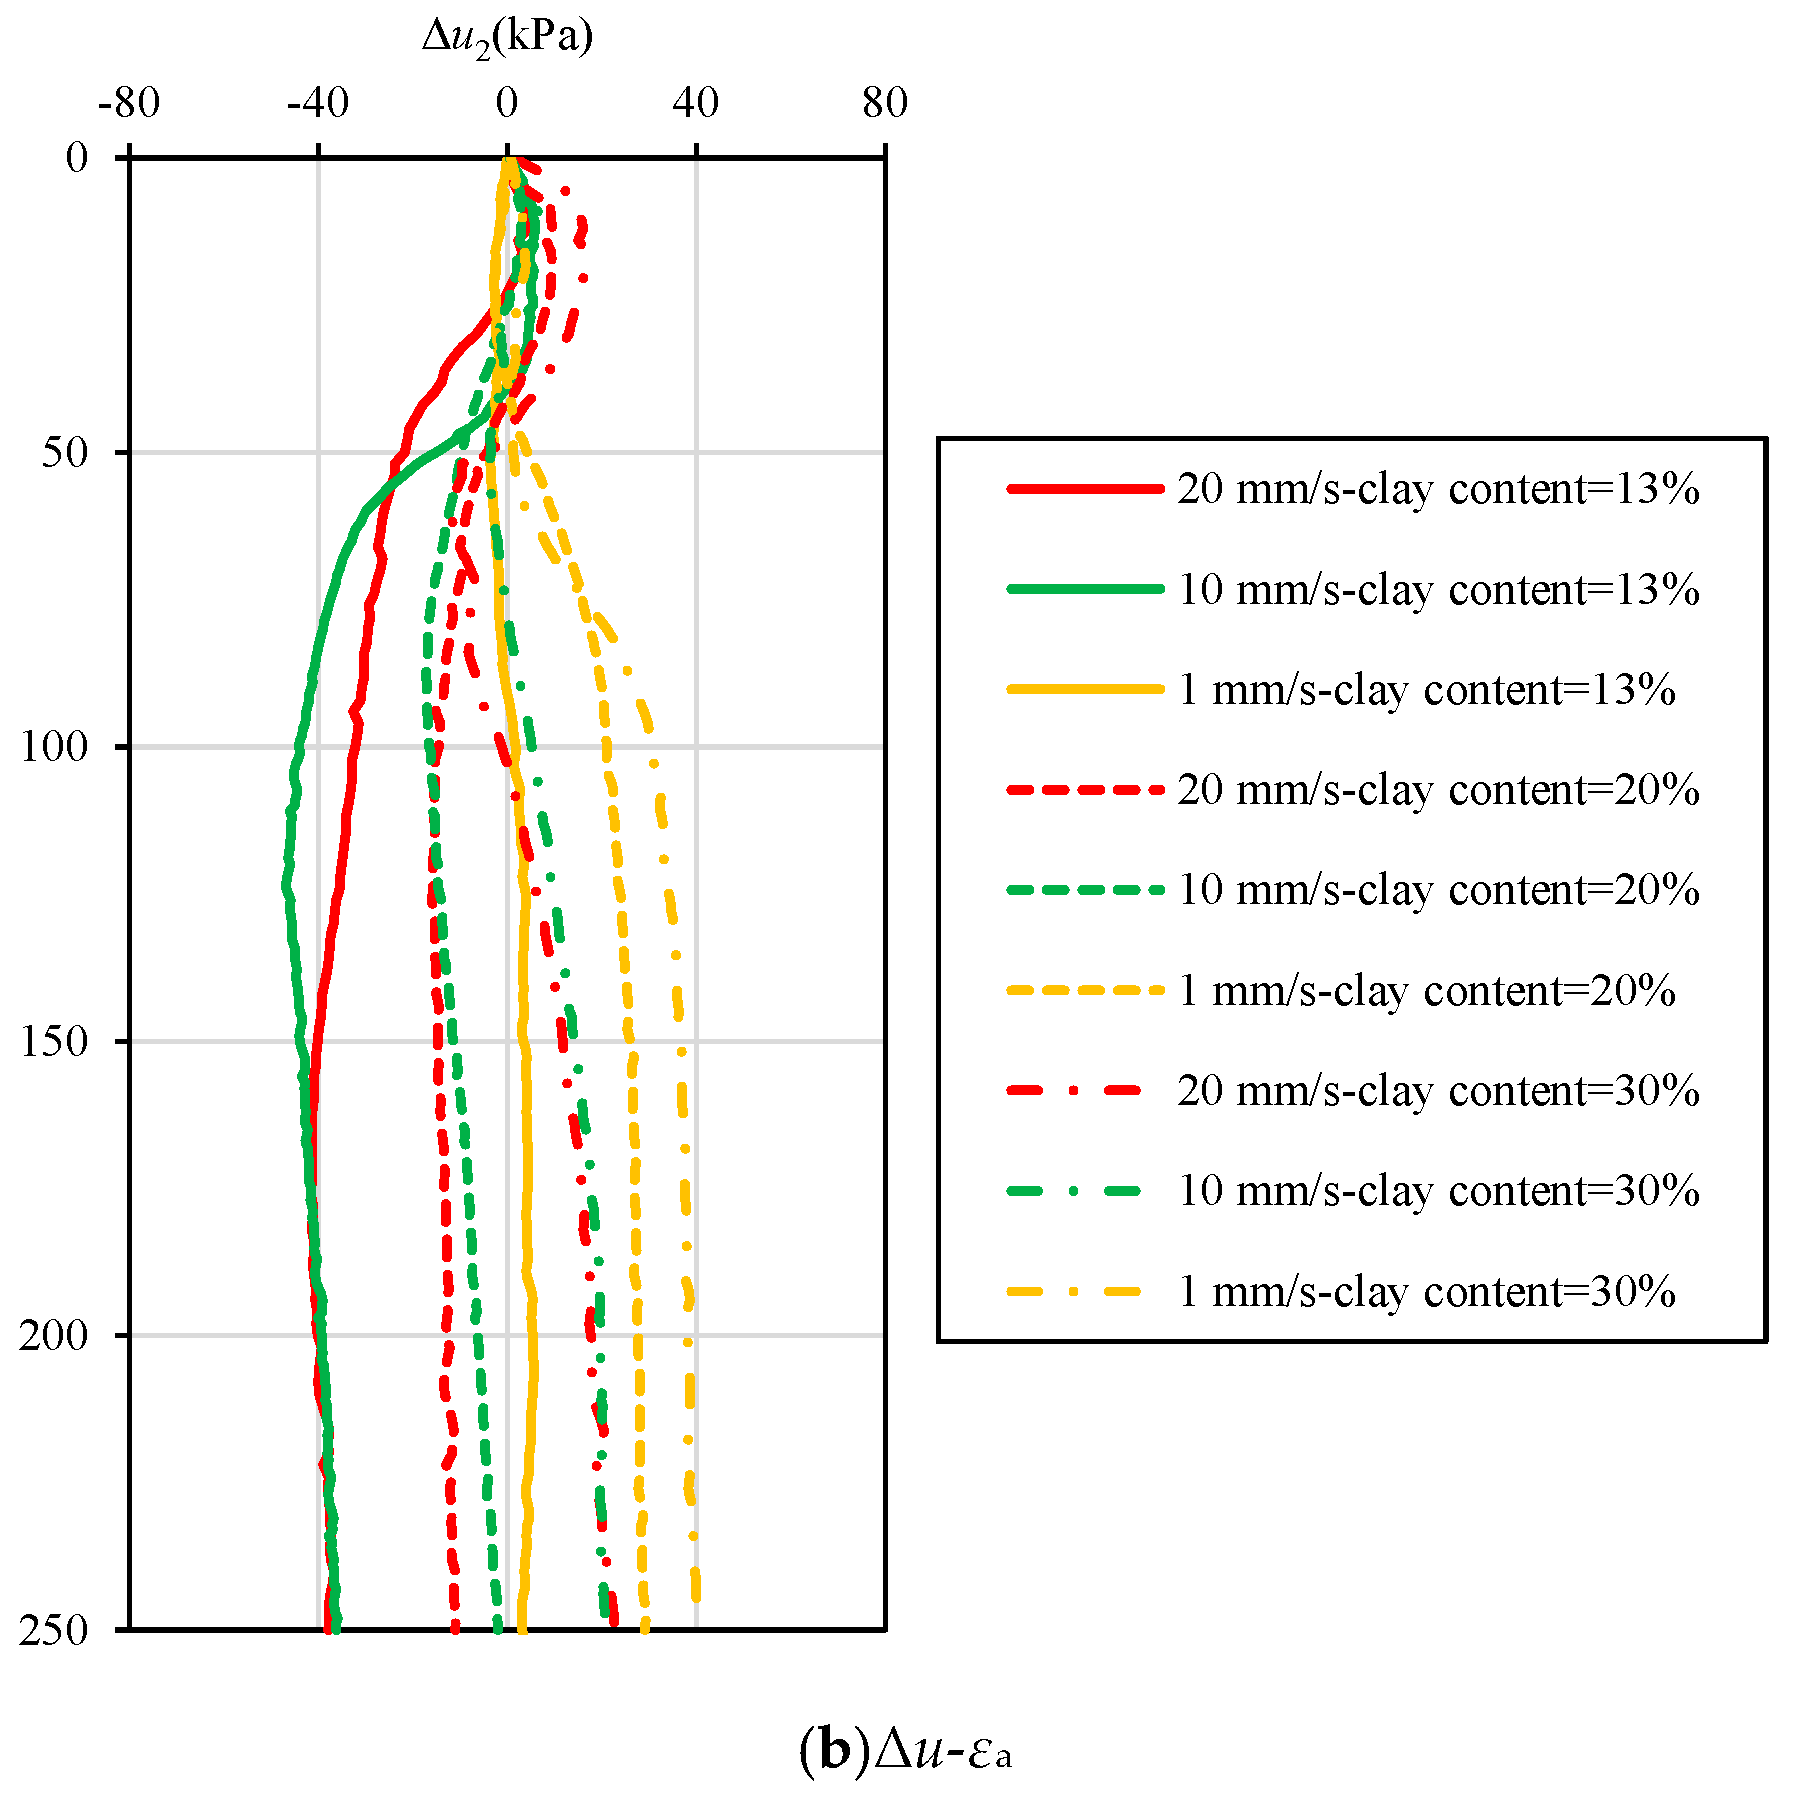
4.2. Penetration Resistance and Pore Pressure Results

The test results of penetration resistance and excess pore pressure in the penetration stage are shown in Figure 6. The increase of surface penetration resistance is caused by the failure mode of surface soil and the influence of cover plate, which does not affect the penetration resistance and pore pressure at the stable penetration depth. The penetration resistance is related to both clay content and penetration rate. With the increase of clay content, pore pressure accumulation increases. The test results in Table 4 are the values of penetration resistance and excess pore pressure at the final penetration depth.
The penetration resistance, initial excess pore pressure after penetration, and the maximum excess pore pressure during dissipation are shown in Table 4.

4.3. Effect of penetration rate on Qt-Bq

A Qt-Bq diagram can be used as a soil classification diagram. Δuinitial and qt from Table 4 are plotted in the Qt-Bq diagram in Figure 7. The normalization method is as follows:
Q t = ( q t σ v 0 ) / σ v 0
B q = ( u initial u 0 ) / ( q t σ v 0 ) = Δ u initial / q net
Figure 7 shows the combination of the classification diagram proposed by Robertson in 1990 [9] and Schneider in 2008 [13]. The test results show that the soil is a type of transitional soils, and a type of silt and silty clay. There is misjudgment of soil classification in the silt with clay content of 13% and the silty clay with clay content of 20%. With the increase of Bq, Qt tends to decrease.

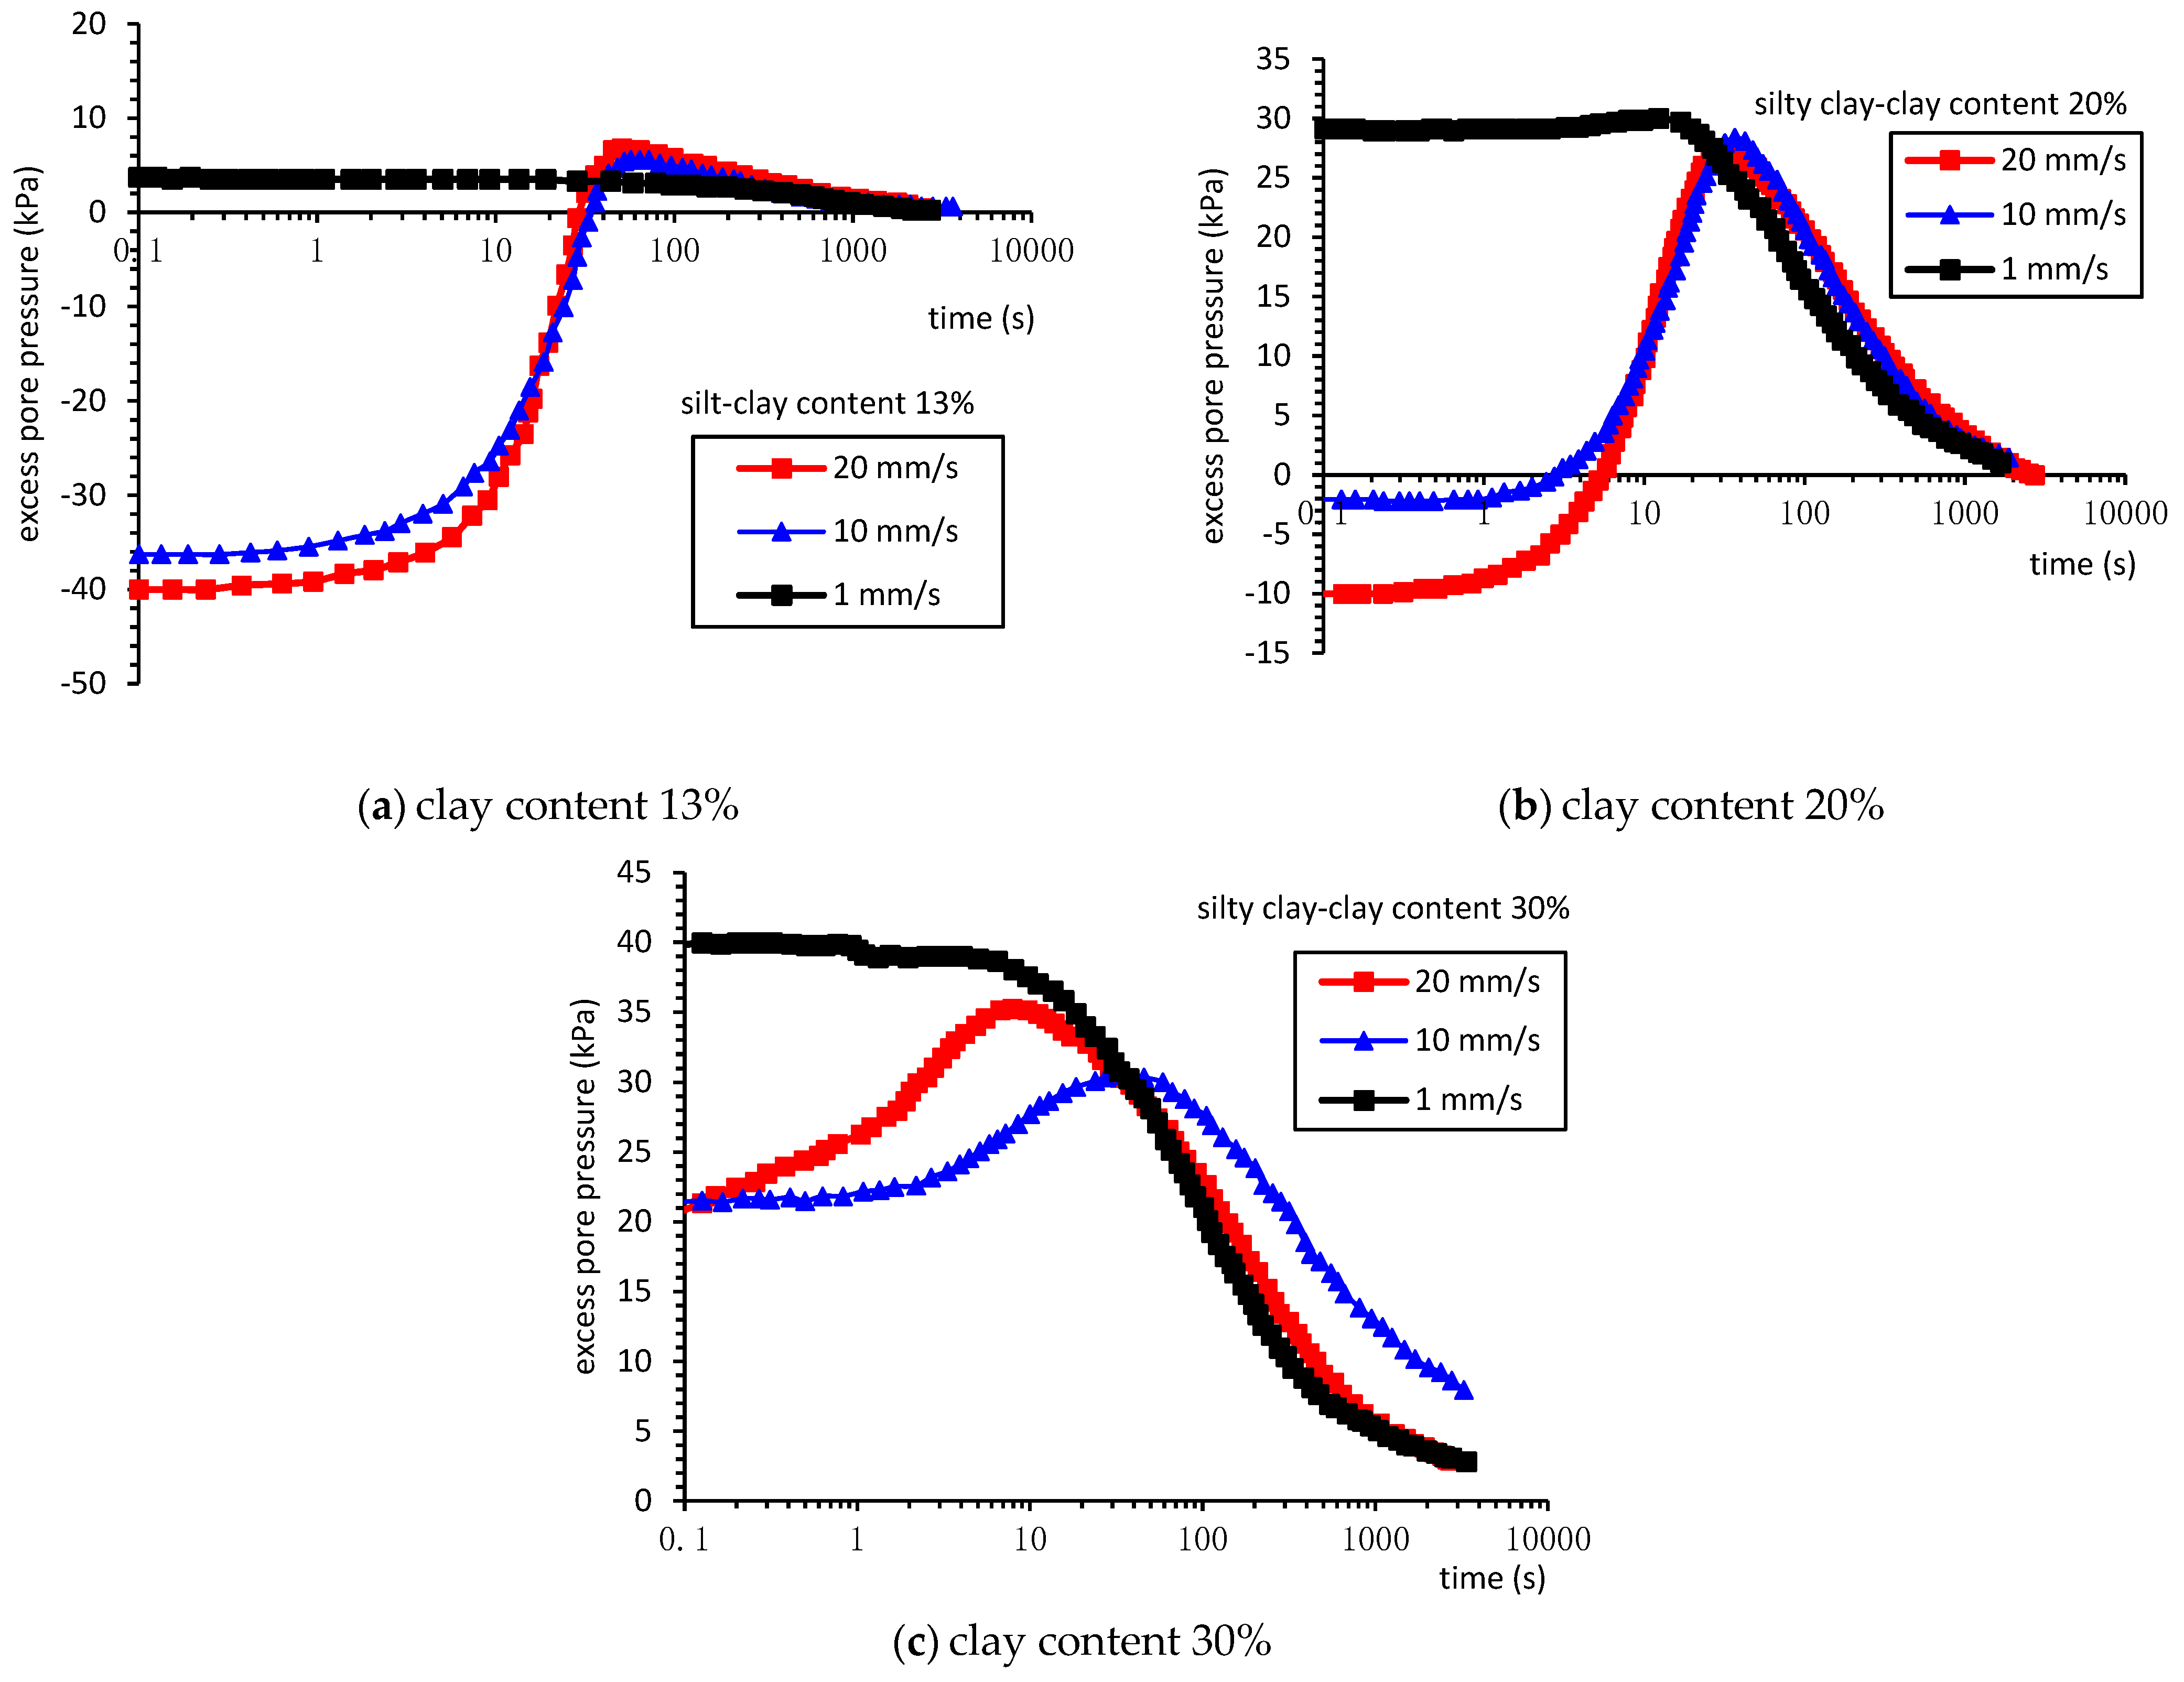
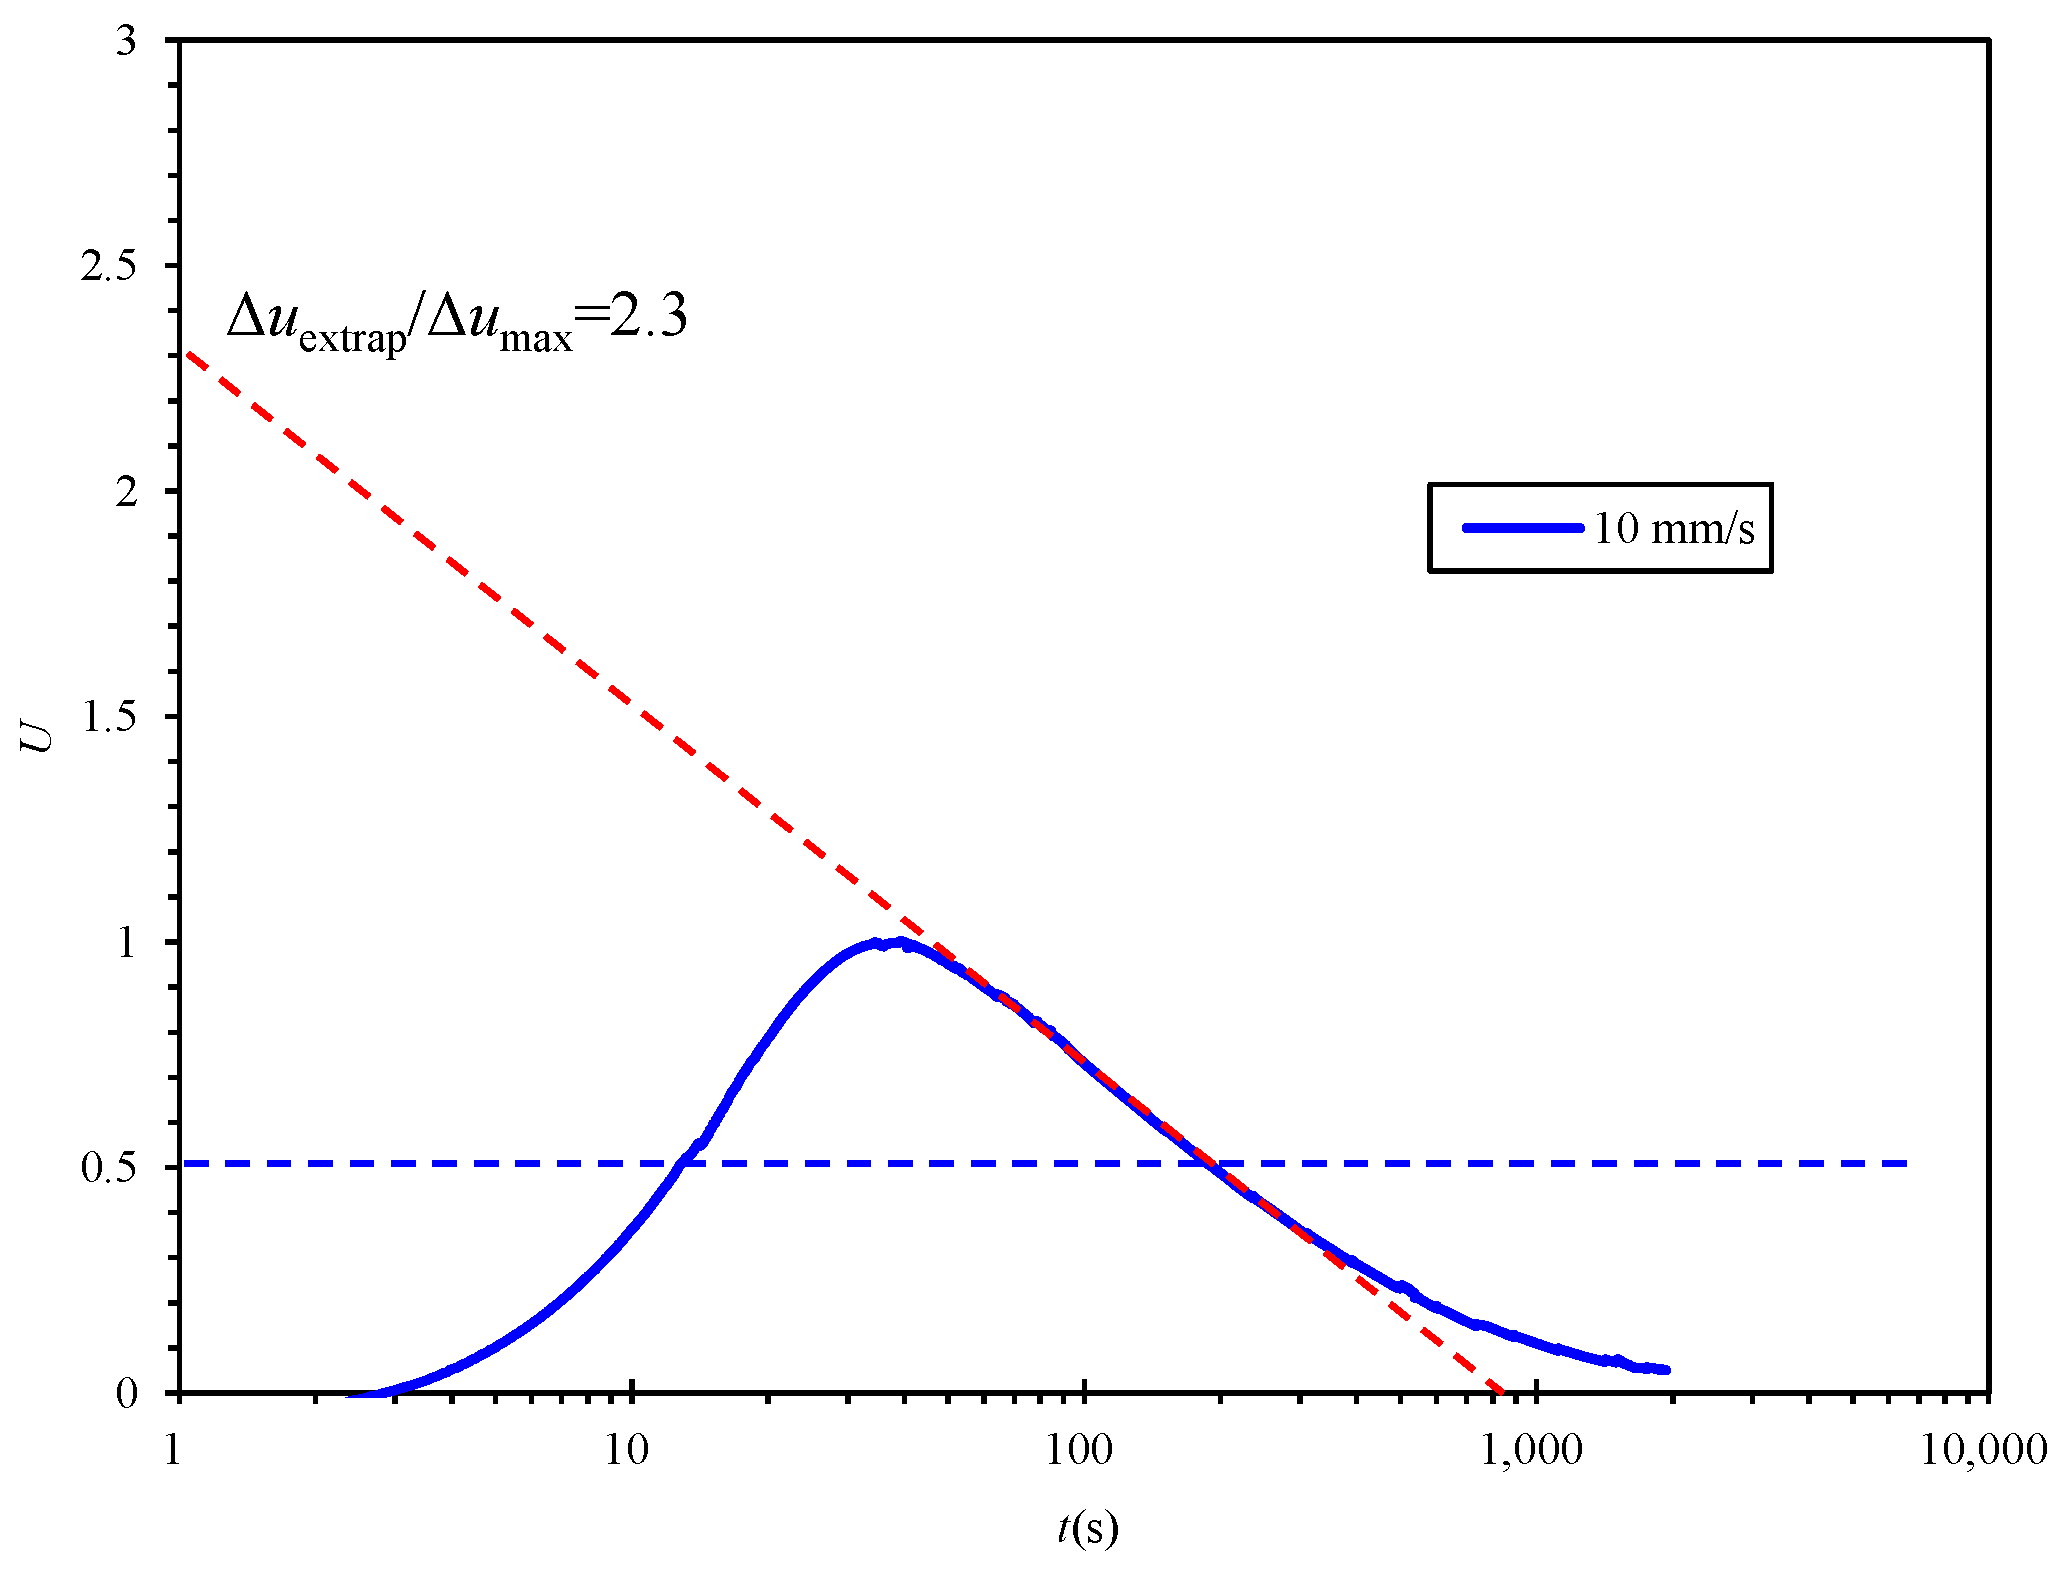
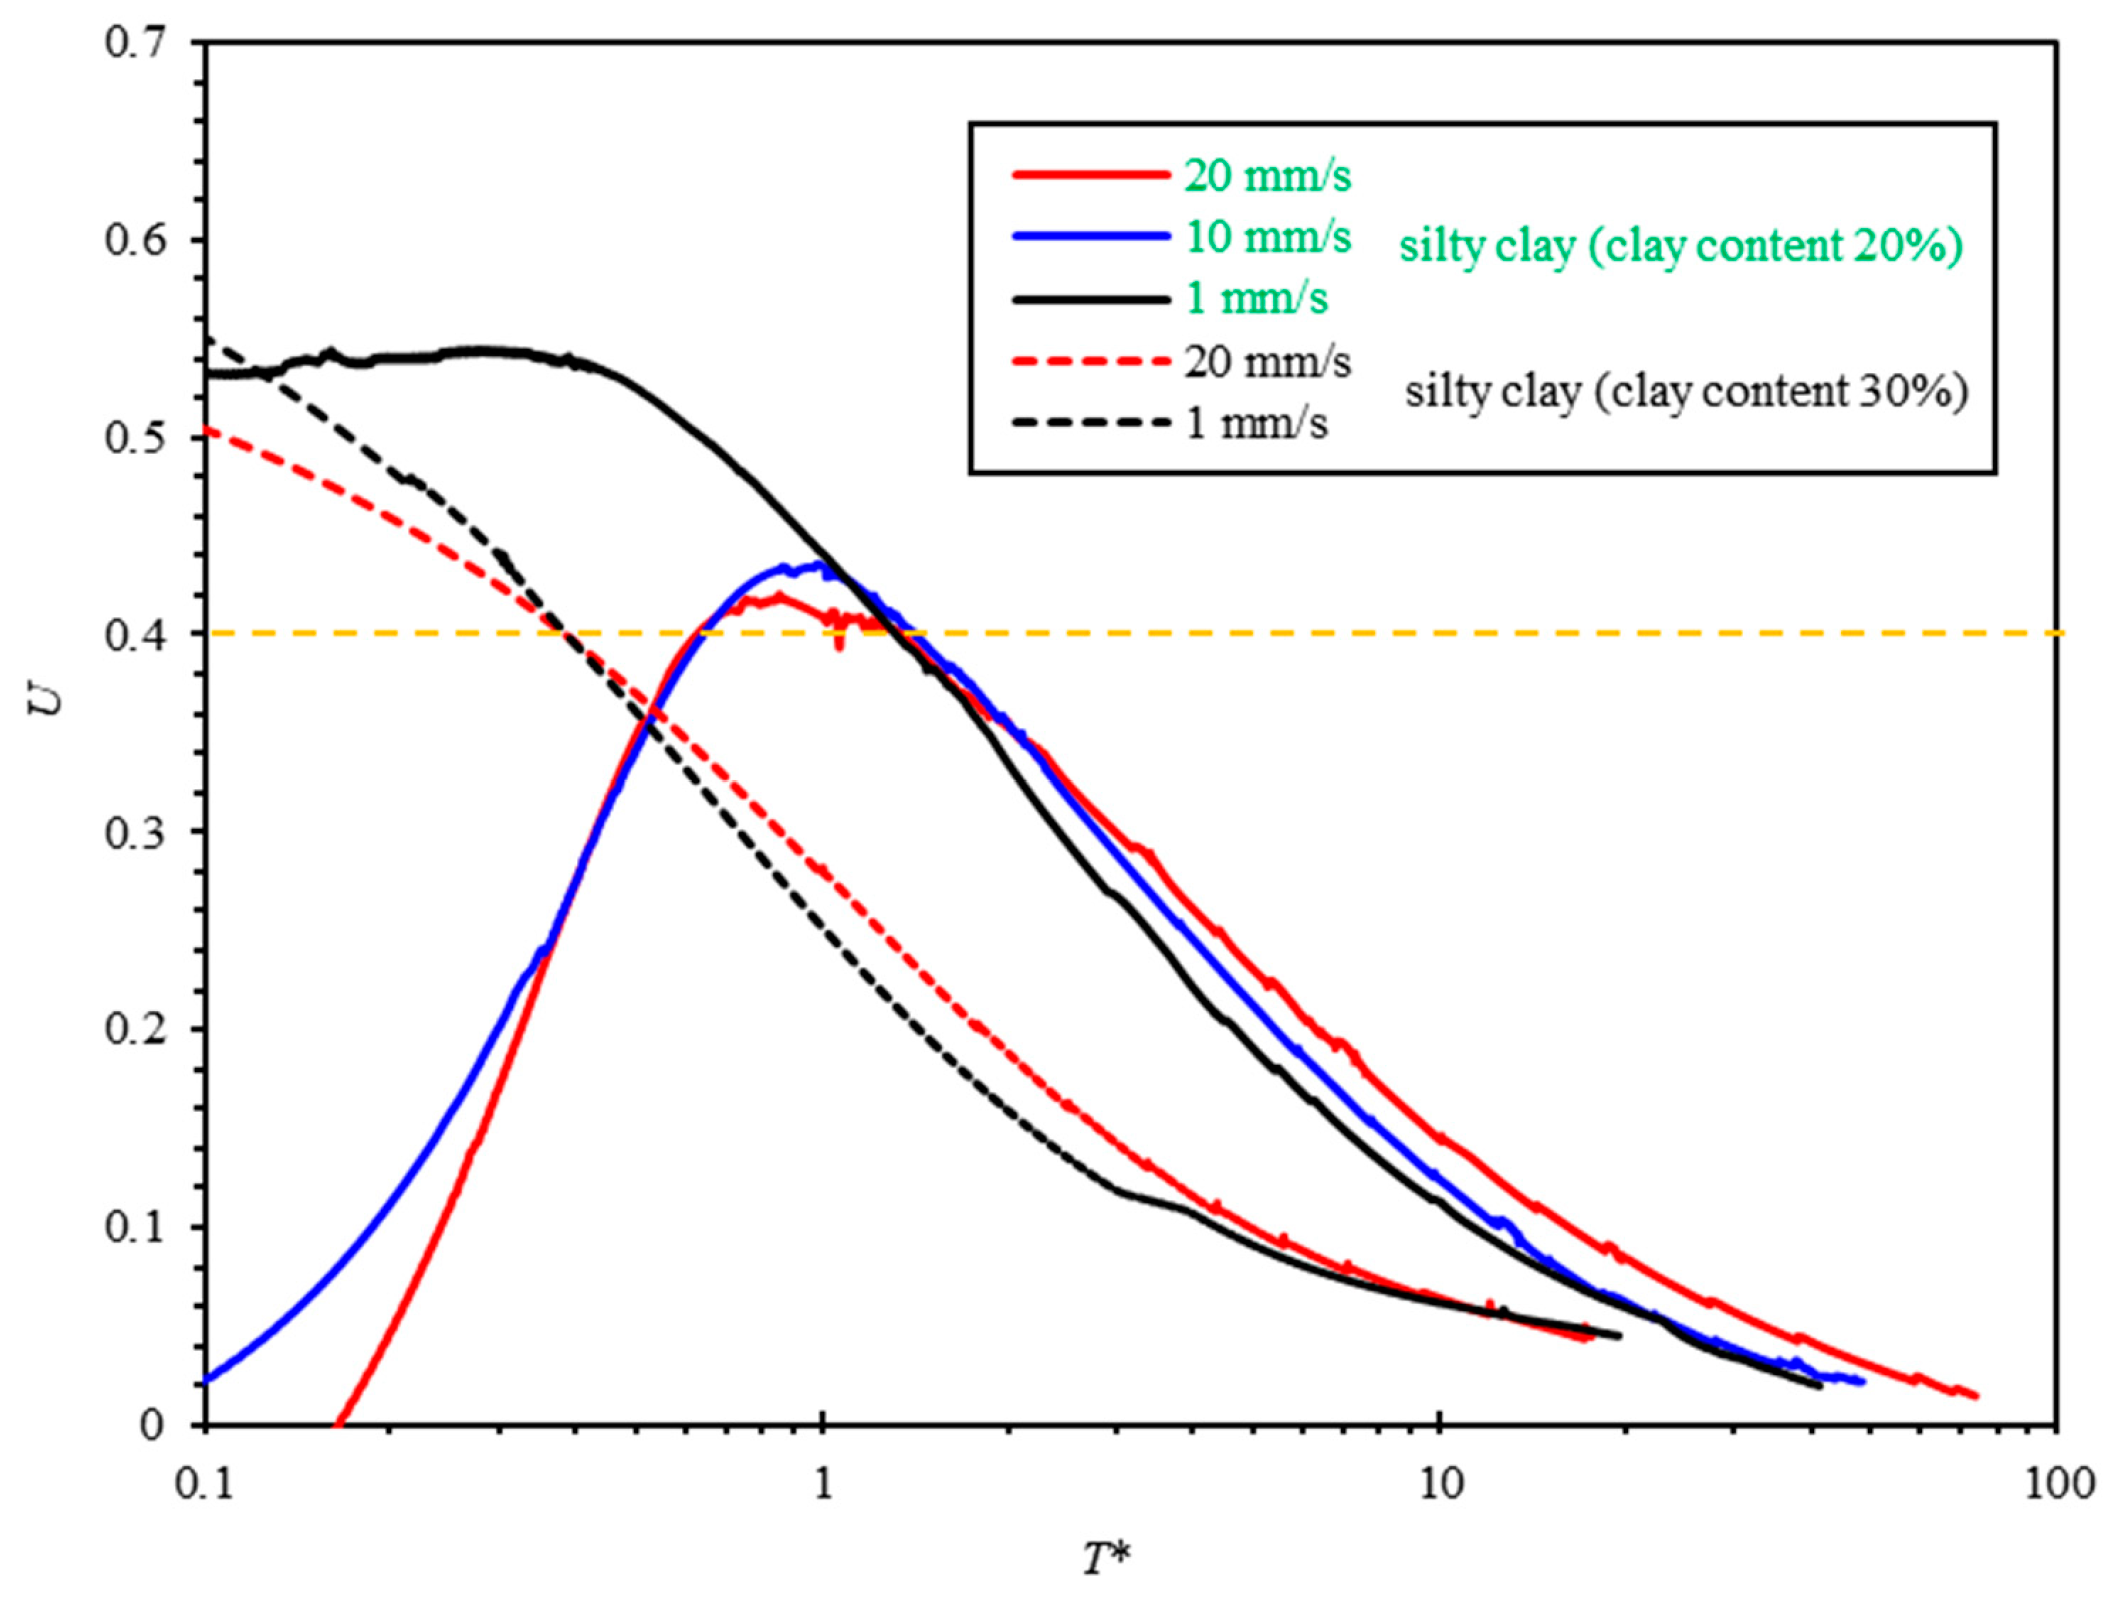
4.4. Pore Pressure Dissipation after Penetration

Pore pressure dissipation after penetration is shown in Figure 8. The dissipation curves of different soils differ significantly. Both silt and silty clay exhibit high dilatancy at high rates of penetration.

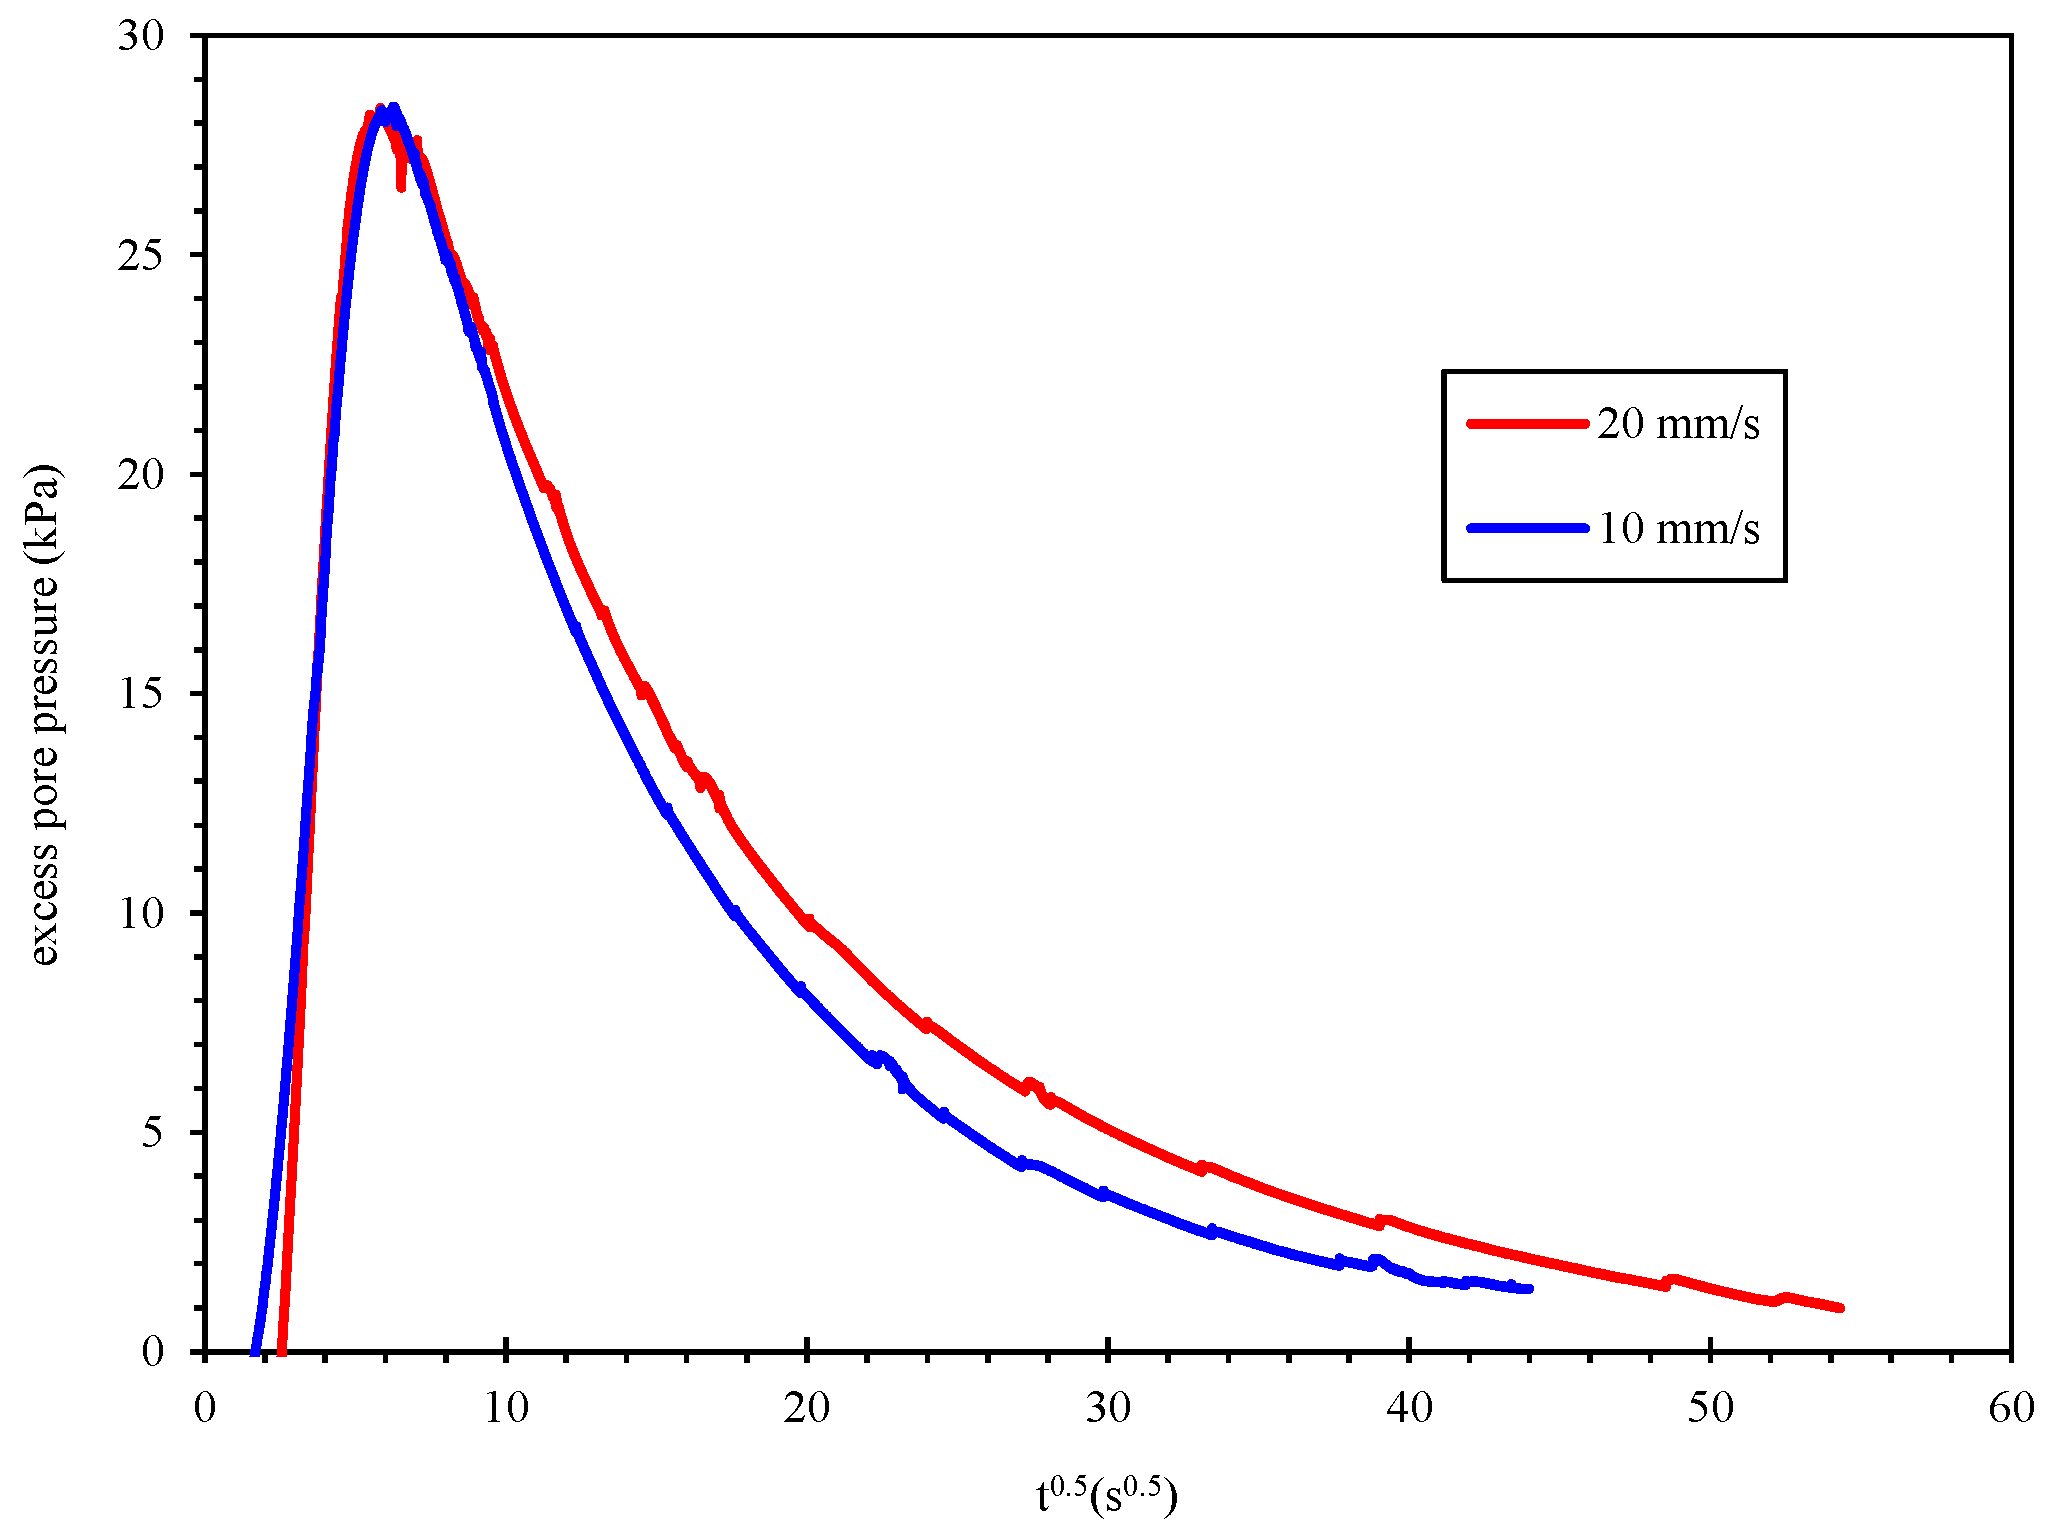
4.5. Selection Method of Modified Theoretical Time Factor T* for Consolidation Coefficient Inversion

The key to the inversion of the consolidation coefficient ch is to determine the modified theoretical time factor. As the negative initial pore pressure is not conducive to estimating the dissipation curve, Δumax was adopted as the normalized parameter, and the normalized U-T* curve is shown in Figure 9. The dissipation data of silty clay with clay content of 30% at 10 mm/s were wrong and are not shown in Figure 9. Other curves showed good regularity. Figure 9 shows that the U-T* curve is related to the soil type and the drainage degree. For silt, pore pressure accumulation is small, and the extremely low penetration rate of 1 mm/s is impossible. The dissipation curves of 10 mm/s and 20 mm/s coincide, which can be taken as T50 = 13.2.
Mahmoodzadeh and Randolph [38] observed that the root time method gives the most reliable results with respect to the similarity of the shape of the measured and theoretical dissipation curves, and gives the determination of Δuextrap with the root method applied to the dissipation. However, this method is not suitable for the soil in the test described in this paper. In Figure 10, the dissipation curve of silty clay with clay content of 20% is taken as an example. There is no dissipation segment close to a straight line to obtain Δuextrap, and so it is difficult to use this method in practice. Figure 9 shows that each dissipation curve is close to a straight line near T50. Δuextrapumax = Umax/Uextrap, therefore, Δuextrapumax can be obtained directly from the normalized U-t curve, as shown in Figure 11.
The new method was adopted to obtain the normalized dissipation curves U-T* of silty clay with clay content of 20% and 30%, as shown in Figure 12. The curves showed good coincidence at T40, so the U-T* curve was obtained by using this method, and the T* value could be calculated and substituted into Formula (3) to obtain the horizontal consolidation coefficient ch. After treatment, the influence of partial drainage is eliminated, but the influence of soil type is not eliminated. T40 = 0.38 in silty clay with clay content of 30% and T40 = 1.3 in silty clay with clay content of 20% is recommended.
The steps of this method can be summarized as follows: (1) obtain Δumax; (2) treat the dissipation curve as a U(which is Δutumax)-t curve, mainly for the convenience of obtaining the position of T50; (3) in the U(which is Δutumax)-t curve, obtain the value of Δuextrapumax by the tangent line; and (4) using Δuextrap to obtain the U(which is Δutuextrap)-t curve, obtain t corresponding to 40% dissipation, and T40 = 0.38 in silty clay with clay content of 30% and T40 = 1.3 in silty clay with clay content of 20%, using Formula (3) to obtain the horizontal consolidation coefficient ch. Ir is generally obtained by the resonance column test or the triaxial test, or a regional empirical value is adopted.

5. Conclusions

In this study, laboratory CPTu tests were carried out for consolidation coefficient inversion methods considering partial drainage effects and dilatancy effects of silty soils in the Yellow River Delta. The three main findings are summarized below:
(1) The soil is a type of transitional soils belonging to silt and silty clay. There is misjudgment of soil classification in the silt with clay content of 13% and the silty clay with clay content of 20%. With the increase of Bq, Qt tends to decrease. The dissipation curves of different soils differ significantly. Both silt and silty clay exhibit high dilatancy at high penetration rates;
(2) For silt in the Yellow River Delta, the initial pore pressure is negative and the pore pressure increases to umax first, but the umax value is very small. When the pore pressure dissipates to 50% umax, the corresponding T50 is used as the value of the modified theoretical time factor, and T50 = 13.2;
(3) The pore pressure dissipation curve is affected by soil type and degree of consolidation. The dilatancy effect is the key factor affecting consolidation coefficient inversion of shallow silt and silty clays. A new consolidation curve normalization method is proposed and is described in detail in the last paragraph of Section 4.5. T40 = 0.38 in silty clay with clay content of 30% and T40 = 1.3 in silty clay with clay content of 20% is recommended to calculate the horizontal consolidation coefficient ch.
This paper provides a reference for the consolidation coefficient inversion of CPTu data in the Yellow River Delta area. This will provide a reference for the influence of partial drainage on the interaction between structure and soil [39,40] in this area.

Author Contributions

Conceptualization, Y.Z.; literature search, Y.Z.; investigation, Y.Z.; experiment, Y.Z.; methodology, Y.Z.; data analysis, Y.Z.; validation, Y.Z., S.D. and C.D.; formal analysis, S.D.; resources, X.F. and T.L.; writing—original draft preparation, Y.Z.; writing—review and editing, S.D.; figures, C.D.; supervision, S.D.; project administration, S.D.; funding acquisition, X.F. and T.L.. All authors have read and agreed to the published version of the manuscript.

Funding

This research was funded by [the National Natural Science Foundation of China] grant number [U2006213, U1806230], [the Fundamental Research Funds for the Central Universities] grant number [201962011], [the Open Foundation of Key Laboratory of Marine Environment and Ecology, Ministry of Education] grant number [MGQNLM-KF201804], and the APC was funded by [U2006213].

Institutional Review Board Statement

Not applicable.

Informed Consent Statement

Not applicable.

Acknowledgments

The authors would like to thank Yunuo Liu and Yao Lu for their help during the experiment. Funding by the National Natural Science Foundation of China (Nos. U2006213, U1806230), the Fundamental Research Funds for the Central Universities (201962011), and the Open Foundation of Key Laboratory of Marine Environment and Ecology, Ministry of Education (MGQNLM-KF201804) is acknowledged. Thanks to Zhejiang University for providing the test equipment.

Conflicts of Interest

The authors declare no conflict of interest.

References

  1. Feng, X.L.; Lin, L.; Zhuang, Z.Y.; Pan, S.C. The relationship between geotechnical parameters and sedimentary environment of soil layers since holocene in modern Huanghe subaqueous delta. Coast Eng. 1999, 18, 1–7. (In Chinese) [Google Scholar]
  2. Jia, Y.G.; Shan, H.X.; Yang, X.J.; Meng, X.M.; Chang, F.Q.; Zheng, J.W. Sediment Dynamics and Geologic Hazards in the Estuary of Yellow River, China; Science Press: Beijing, China, 2011. (In Chinese) [Google Scholar]
  3. Cui, J.G. Analysis and measures of submarine pipeline fracture in Chengdao Oilfield. Corros. Prot. Petrochem. Ind. 2011, 28, 3. (In Chinese) [Google Scholar]
  4. ASTM D5778-07; Standard Test Method for Electronic Friction Cone and Piezocone Penetration Testing of Soils. ASTM International: West Conshohocken, PA, USA, 2007.
  5. Voyiadjis, G.Z.; Song, C.R. Determination of hydraulic conductivity using piezocone penetration test. Int. J. Geomech. 2003, 3, 217–224. [Google Scholar] [CrossRef]
  6. Lunne, T.; Robertson, P.K.; Powell, J.J.M. Cone-Penetration Testing in Geotechnical Practice; Spon Press: London, UK, 2001. [Google Scholar]
  7. Na, Y.; Choa, V.; Teh, C.I.; Chang, M.F. Geotechnical parameters of reclaimed sandfill from the cone penetration test. Can. Geotech. J. 2005, 42, 91–109. [Google Scholar] [CrossRef]
  8. Robertson, P.K.; Cabal, K.L. Guide to Cone Penetration Testing for Geotechnical Engineering; Gregg Drilling & Testing, Inc.: Signal Hill, CA, USA, 2012. [Google Scholar]
  9. Robertson, P.K. Soil classification using the cone penetration test. Can. Geotech. J. 1990, 27, 151–158. [Google Scholar] [CrossRef]
  10. Lu, Q.; Randolph, M.F.; Hu, Y.; Bugarski, I.C. A numerical study of cone penetration in clay. Geotechnique 2004, 54, 257–267. [Google Scholar] [CrossRef]
  11. Lunne, T.; Kleven, A. Role of CPT in north sea foundation engineering. Cone Penetration Test. Exp. ASCE 1981, 2, 76–107. [Google Scholar]
  12. Schneider, J.A.; Lehane, B.M.; Schnaid, F. Velocity effects on piezocone measurements in normally and over consolidated clays. Int. J. Phys. Model. Geotech. 2007, 7, 23–34. [Google Scholar] [CrossRef]
  13. Schneider, J.A.; Randolph, M.F.; Mayne, P.W.; Ramsey, N.R. Analysis of factors influencing soil classification using normalized piezocone tip resistance and pore pressure parameters. J. Geotech. Geoenviron. Eng. 2008, 134, 1569–1586. [Google Scholar] [CrossRef]
  14. Randolph, M.F.; Gaudin, C.; Gourvenec, S.; David, J.W.; Noel, B.; Mark, J.C. Recent advances in offshore geotechnics for deep water oil and gas developments. Ocean Eng. 2011, 38, 818–834. [Google Scholar] [CrossRef] [Green Version]
  15. DeJong, J.T.; Randolph, M.F. Influence of partial consolidation during cone penetration on estimated soil behavior type and pore pressure dissipation measurements. J. Geotech. Geoenviron. Eng. 2012, 138, 777–788. [Google Scholar] [CrossRef]
  16. Randolph, M.F.; Hope, S.F. Effect of cone velocity on cone resistance and excess pore pressures. In Proceedings of the Engineering Practice and Performance of Soft Deposits (IS-OSAKA 2004), Osaka, Japan, 1 January 2004; pp. 147–152. [Google Scholar]
  17. Silva, M.; White, D.; Bolton, M. An analytical study of the effect of penetration rate on piezocone tests in clay. Int. J. Numer. Anal. Methods Geomech. 2006, 30, 501–527. [Google Scholar] [CrossRef]
  18. Yi, J.T.; Goh, S.; Lee, F. A numerical study of cone penetration in fine-grained soils allowing for consolidation effects. Géotechnique 2012, 62, 707–719. [Google Scholar] [CrossRef]
  19. Mahmoodzadeh, H.; Randolph, M.F.; Wang, D. Numerical simulation of piezocone dissipation test in clays. Geotechnique 2014, 64, 657–666. [Google Scholar] [CrossRef]
  20. Jaeger, R.A.; DeJong, J.T.; Boulanger, R.W.; Low, H.E.; Randolph, M.F. Variable penetration rate CPT in an intermediate soil. In Proceedings of the 2nd International Symposium on Cone Penetration Testing, Huntington Beach, CA, USA, 9–11 May 2010. [Google Scholar]
  21. Suzuki, Y.; Lehane, B.M. Cone penetration at variable rates in kaolin–sand mixtures. Int. J. Phys. Model. Geotech. 2015, 15, 209–219. [Google Scholar] [CrossRef]
  22. Silva, M.F. Numerical and Physical Models of Rate Effects in Soil Penetration. Ph.D. Thesis, University of Cambridge, Cambridge, UK, 2005. [Google Scholar]
  23. Tonni, L.; Gottardi, G. Partial drainage effects in the interpretation of piezocone tests in Venetian silty soils. In Proceedings of the 17th International Conference on Soil Mechanics and Geotechnical Engineering, Alexandria, Egypt, 5–9 October 2009; pp. 1004–1007. [Google Scholar]
  24. Tonni, L.; Gottardi, G. Analysis and interpretation of piezocone data on the silty soils of the Venetian Lagoon (Treporti test site). Can. Geotech. J. 2011, 48, 616–633. [Google Scholar] [CrossRef]
  25. Price, A.B.; Boulanger, R.W.; DeJong, J.T. Centrifuge Modeling of Variable-Rate Cone Penetration in Low-Plasticity Silts. J. Geotech. Geoenviron. Eng. 2019, 145, 04019098. [Google Scholar] [CrossRef]
  26. Liu, H.J.; Lv, W.F.; Yang, J.J.; Wang, X.H. Effect of initial dry density and clay content on steady-state strength of silty soil in the Yellow River Delta. Chin. J. Geotech. Eng. 2009, 31, 1287–1291. [Google Scholar]
  27. Wang, H.; Liu, H.J.; Zhang, M.S. Characteristics of undrained strength of marine-silty soil under low stress and its application in analysis of shallow submarine landslide. Chin. J. Rock Mech. Eng. 2014, 33, 849–856. (In Chinese) [Google Scholar]
  28. Wang, S.; Luna, R.; Onyejekwe, S. Effect of initial consolidation condition on post-liquefaction undrained monotonic shear behavior of mississippi river valley silt. J. Geotech. Geoenviron. Eng. 2016, 142, 04015075. [Google Scholar] [CrossRef]
  29. Zhang, Y. Study on CPTU Soil Classification and Parameter Inversion Methods of Silty Layer in the Yellow River Delta. Ph.D.Thesis, Ocean University of China, Qingdao, China, 2020. [Google Scholar]
  30. GB50021-2018; Code for Investigation of Geotechnical Engineering. China Architecture & Building Press: Beijing, China, 2018.
  31. Finnie, I.M.S.; Randolph, M.F. Punch-through and liquefaction induced failure of shallow foundations on calcareous sediments. In Proceedings of the 7th International Conference on the Behaviour of Offshore Structures, Boston, MA, USA, 1 January 1994; Volume 1, pp. 217–230. [Google Scholar]
  32. Ecemis, N.; Karaman, M. Influence of non-/low plastic fines on cone penetration and liquefaction resistance. Eng. Geol. 2014, 181, 48–57. [Google Scholar] [CrossRef] [Green Version]
  33. Chow, S.H.; Bienen, B.; Randolph, M.F. Rapid penetration of piezocones in sand. In Proceedings of the 4th International Symposium on Cone Penetration Testing (CPT’18), Delft, The Netherlands, 21–22 June 2018. [Google Scholar]
  34. Doan, L.V.; Lehane, B.M. CPT data in normally consolidated soils. Acta Geotech. 2021, 16, 2877–2885. [Google Scholar] [CrossRef]
  35. Schnaid, F.; Lehane, B.M.; Fahey, M. Characterization of unusual geomaterials. In Proceedings of the 2nd International Conference on Geotechnical and Geophysical Site Characterization (ISC-2), Rotterdam, The Netherlands, 19–22 September 2004; pp. 49–73. [Google Scholar]
  36. Houlsby, G.T.; Teh, C.I. Analysis of the Piezocone in Clay. In Proceedings of the International Symposium on Penetration Testing, Rotterdam, The Netherlands, 20–24 March 1988; pp. 777–783. [Google Scholar]
  37. Teh, C.I.; Houlsby, G.T. An analytical study of the cone penetration test in clay. Geotechnique 1991, 41, 17–34. [Google Scholar] [CrossRef]
  38. Mahmoodzadeh, H.; Randolph, M. Penetrometer Testing: Effect of partial consolidation on subsequent dissipation response. J. Geotech. Geoenviron. Eng. 2014, 140, 04014022. [Google Scholar] [CrossRef]
  39. Ong, D.; Sim, Y.S.; Leung, C.F. Performance of Field and Numerical Back-Analysis of Floating Stone Columns in Soft Clay Considering the Influence of Dilatancy. Int. J. Geomech. 2018, 18, 04018135. [Google Scholar] [CrossRef] [Green Version]
  40. Salazar, S.E.; Barnes, A.; Coffman, R.A. Development of an Internal Camera–Based Volume Determination System for Triaxial Testing. Geotech. Test. J. 2016, 39, 165–168. [Google Scholar] [CrossRef] [Green Version]
Figure 1. Particle size distribution curves.
Jmse 10 00255 g001
Figure 2. Consolidation-undrained triaxial shear test results.
Jmse 10 00255 g002
Figure 3. One-dimensional compression test results.
Jmse 10 00255 g003
Figure 4. CPTu penetration and consolidation test system.
Jmse 10 00255 g004
Figure 5. CPTu saturation unit.
Jmse 10 00255 g005
Figure 6. Results of penetration resistance (a) and excess pore pressure (b).
Jmse 10 00255 g006aJmse 10 00255 g006b
Figure 7. Effect of penetration rate on Qt-Bq [9,13].
Jmse 10 00255 g007
Figure 8. Pore pressure dissipation after penetration in soils with different clay content.
Jmse 10 00255 g008
Figure 9. The normalized dissipation curve U-T* and comparison with the analytical solution by Houlsby and Teh [36].
Jmse 10 00255 g009
Figure 10. Δu-t0.5 dissipation curve.
Jmse 10 00255 g010
Figure 11. Determination of Δuextrapumax with the U-t curve.
Jmse 10 00255 g011
Figure 12. Normalized dissipation curves U-T* with new method.
Jmse 10 00255 g012
Table 1. Summary of triaxial test results.
NoSoil Typeσc (kPa)eqmax (kPa)Δu (kPa)Af
1silt (clay content 13%)46.10.87337−86.3−0.26
2silt (clay content 13%)99.20.8217726.40.15
3silty clay (clay content 20%)500.86313.80.22
4silty clay (clay content 30%)500.8125.438.31.51
Af is ratio of excess pore water pressure to deviator stress at the critical state.
Table 2. The values of modified theoretical time factor T* [36,37].
Consolidation degree20%30%40%50%60%70%80%
T* in CPTu shoulder0.0380.0780.1420.2450.4390.8041.600
Table 3. Test plan.
Table 3. Test plan.
Soil TypeDrainage Condition (V)σ’v
(kPa)
eρ
(g/cm3)
cv
(cm2/s)
Ir
(50 kPa)
Estimated
t80(s)
v = 20 mm/sv = 10 mm/sv = 1 mm/s
silt (clay content 13%)UD(53)PD(26)PD(2.6)300.871.970.065481
silty clay (clay content 20%)UD(106)UD(53)PD(5.3)300.841.910.0343136
silty clay (clay content 30%)UD(457)UD(228)PD(23)300.861.880.00737590
UD—undrained; PD—Partial, and V is between 0.3–30 [16]; FD—Fully drained.
Table 4. Results of penetration resistance and excess pore pressure response.
v
(mm/s)
Silt (Clay Content 13%) (kPa)Silty Clay (Clay Content 20%) (kPa)Silty Clay (Clay Content 30%) (kPa)
ΔumaxΔuinitialqtΔumaxΔuinitialqtΔumaxΔuinitialqt
206.6−37.8343.728.1−11.3420.235.322.6169.8
105.5−36.2344.428.3−2.0117.830.620.6171.9
13.43.487.429.829.1237.440.0640.06139.2
Publisher’s Note: MDPI stays neutral with regard to jurisdictional claims in published maps and institutional affiliations.

