Article

Modelling the Effect of ‘Roller Dynamics’ on Storm Erosion: Sylt, North Sea

by
Pushpa Dissanayake
1,* and
Jennifer Brown
2
1
Coastal Geology and Sedimentology, Institute of Geosciences, 24118 Kiel, Germany
2
National Oceanographic Centre, Joseph Proudman Building, 6 Brownlow Street, Liverpool L3 5DA, UK
*
Author to whom correspondence should be addressed.
J. Mar. Sci. Eng. 2022, 10(3), 305; https://doi.org/10.3390/jmse10030305
Submission received: 4 January 2022 / Revised: 7 February 2022 / Accepted: 14 February 2022 / Published: 22 February 2022

Abstract

:
Coastal storm erosion can lead to episodic morphological changes and hinterland flooding that requires sustainable management. An accurate estimation of storm erosion can determine the success of hazard mitigation strategies. Two morphological models, Delft3D and XBeach, were applied separately to a stormy period with “Roller” and “No Roller” wave dynamics activated, to estimate erosion of the beach and dune system on the Sylt island. This is the first numerical impact assessment of roller dynamics on coastal erosion using the two models. The choice of model had more impact on the hydrodynamic and morphological predictions than the option to include or omit roller dynamics. Agreement between measured and simulated waves was higher in Delft3D (R2 > 0.90 and RMSE < 0.15 m) than XBeach. Storm erosion in both models had the highest sensitivity to the roller parameter Beta. Both models predicted a similar storm erosion pattern along the coast, albeit different magnitudes. It is found that Delft3D cannot produce comparable storm erosion to XBeach, when the roller dynamics and avalanching are considered. Delft3D is less sensitive to the roller dynamics than XBeach. Including roller dynamics in Delft3D increased storm erosion up to 31% and in XBeach decreased the erosion down to 58% in the nearshore area, while the erosion in the dune area increased up to 13% in Deflt3D and up to 97% in XBeach. Both models are skilled in simulating storm impact. For the simulation of a storm period with intermittent calm periods, it is suggested that applying a time-varying parameter setting for wave dynamics and sediment transport to capture storm erosion and post-storm beach recovery processes could improve results. Such a modelling approach may ultimately increase the accuracy of estimating storm erosion to support coastal management activities (e.g., sand nourishment volume).

1. Introduction

Storm erosion can cause episodic morphological changes and hinterland flooding, providing a major threat to coastal regions thus requiring management [1,2,3]. Morphological changes during storm events may be (partially) recoverable or may lead to long-lasting coastal system modifications [4,5]. Hinterland flooding of coastal areas is responsible for some of the disasters worldwide [3]. Therefore, storm erosion can affect the socio-economic and environmental value of coastal systems, which inhabit 10% of the world’s populations and important infrastructures [6,7], and diverse flora and fauna [8]. In Europe, about 16% of the population (70 million) dwells in the coastal zone, which attracts 500–1000 billion euros of investments for development activities in coastal protection, industries, tourism and urbanization (www.eurosion.org, accessed on 9 December 2021). In the Wadden Sea area, the tourist industry alone generates millions of euros annually for the local communities [8]. These activities are however directly related to the existence of coastal systems, which depend on careful management, particularly against extreme events. A comprehensive understanding of storm erosion is therefore required to provide process knowledge to identify suitable adaptation strategies that deliver sustainable yet effective coastal management.
Increased erosion during extreme events occurs due to high energy physical processes occurring across coastal areas [9,10]. In the surf zone, energetic waves break causing strong turbulence and vertical mixing that suspend more sediment. Increased spatial variation in wave induced momentum flux enhances alongshore and cross shore currents, transporting more sediment [10]. Furthermore, wave breaking can occur closer to the coast with elevated storm water levels, increasing erosion of the upper beach. After short wave breaking, long infragravity waves are released approaching beaches and dunes [11]. Impacts of the long waves are often responsible for the erosion of the upper beaches and dunes [11]. Storm erosion of beaches and dunes can be classified into four regimes [9], in a sequence of increasing erosion severity: (1) Swash (swash motion across the beach), (2) Collision (wave bores collide with the dune face), (3) Overwash (a fraction of the waves overtop dunes) and (4) Inundation (dune is breached and submerged). These main physical processes of erosion are now implemented into numerical models to simulate storm erosion [10,11].
Numerical modelling is widely used to investigate the impacts and the processes of storm erosion e.g., [2,4,10,11]. We focus here on two commonly used opensource models, Delft3D (D3D) and XBeach (XB). D3D enables simulation of the hydrodynamics (circulation and waves), sediment transport and morphological changes by currents, waves and their interactions [12]. An extension of D3D further allows simulation of the effect of short wave groups on long waves (‘roller dynamics’) in the nearshore and dune avalanching [13,14]. XB computes the processes of the four storm erosion regimes by the short wave averaged long wave motion [11]. Roller dynamics are one of the primary processes in XB.
D3D has been used to investigate coastal erosion in calm and storm conditions with the roller dynamics e.g., [13,14,15]. Hsu et al. [13,14] evaluated the model performance with the measured wave heights and longshore currents at the Duck coast, NC and at Santa Barbara, CA, USA. Both studies showed the sensitivity of the currents and wave heights to different parameter setting and improved model prediction by including the roller dynamics. Giardino et al. [15] simulated morphological changes at Egmond aan Zee, the Netherlands for different scenarios using two versions of D3D: the standard version, which was used in this study, and a modified version including a beach and dune module. The modified version caused increased alongshore currents and more realistic morphological changes. However, only standard versions are available in the public domain.
Storm erosion across coastal areas is often investigated using XB e.g., [2,16,17]. Smallegan et al. [16] simulated the impacts of Hurricane Sandy at Bay Head, NJ, USA and showed that the presence of a buried seawall increased wave attenuation and thus coastal protection. The performance of XB and CShore was assessed by simulating beach profiles at Torrey Pines and Cardiff beaches (CA, USA) for different intensity storm events [17]. Results show, both models have limited skill in reproducing storm erosion, and the upper beach profile response is predicted with a different skill to that when the entire profile is considered. Storm erosion at Formby Point, Sefton coast, UK was simulated for the established storm wave threshold (2.5 m) and a new storm classification in Dissanayake et al. [2]. The new classification is developed based on the sequencing of both water levels and wave heights. Results show that the new classification identified more storm events and caused higher erosion than the established classification providing a realistic estimation of storm erosion.
These example studies demonstrate, both D3D and XB are used to investigate storm erosion in different coastal environments and forcing conditions. However, sensitivity of storm erosion to the roller dynamics is not yet considered. Based on the implemented physical processes, these two models might have different skills in capturing storm erosion across a coastal area. In this study, we compare the performance of both models by simulating the effect of roller dynamics in storm erosion of the beach and dune system on the Sylt island.
The Sylt island is a mesotidal mixed energy environment in the North Frisian Wadden Sea, German Bight [18,19]. Measured data on water levels, waves and wind are available representing the environmental forcing at this beach and dune system. Morphological surveys are routinely carried out for management purposes by the local agency of coastal protection. However, the time span of these surveys is very coarse (~1 month to a year) and not suitable to derive storm event scale erosion at this coastal system. Simulating the morphological changes between the available surveys can provide high resolution spatiotemporal information on the storm impact. This information provides a comprehensive understanding of storm erosion to identify suitable management activities.
The main objective of this study is to investigate the effect of the roller dynamics in D3D and XB on storm erosion simulation across a coastal area, and to identify their skills against field data. The novelty of the approach is, we simulate two different morphodynamic models separately covering a major storm period between two morphological surveys, and for the first time assess the sensitivity of the storm erosion to the roller dynamics. Our hypothesis is that including roller dynamics in D3D will increase erosion in the inter-tidal area and the subaerial beach due to an increase in the hydrodynamics from the roller contribution. Therefore, D3D roller dynamics could provide increased dune erosion, although still lower than predicted by XB.
This study is presented as follows. Section 2 describes background and field data of the study area, and Section 3 details the methodology. The results are presented in Section 4, with a discussion of the simulated results with the previous studies in Section 5. The conclusions of the study are in Section 6, including recommendations for suitable applications of these two numerical models.

2. Study Area

2.1. Background

The Sylt island is north-south oriented (maximum width ~13 km), located in the North Frisian Wadden Sea, German Bight and connected to the mainland with a dam (Figure 1a). The western coast of Sylt (North Sea coast) is about 35 km in length and its orientation from south to north varies about 20°. The present study focused on the central coast, which encloses the stretch of the maximum curvature of coastline, and exhibits less influence from the adjacent tidal inlets on the nearshore morphology (see depth contours on Figure 1c). The nearshore morphology has generally a double-barred profile with steep slope on the beach and regular rip channels [18]. The dune system on Sylt reaches up to about 30 m in height. Beach nourishments are routinely carried out to combat storm impact on the beach and dune system [18]. The central coast tends to have high susceptibility to storm impacted erosion [19]. Sediment is characterised by medium to coarse sand [20]. The model sediment bed was established using an average sediment fraction of 300 µm.
Marine forcing continuously shapes the beach and dune system. The semi-diurnal meso-tidal range varies from 1.8 to 2.0 m during neap and spring conditions respectively (at WL in Figure 1b). The highest water level (3.55 m) occurred recently on 06 December 2013 during the storm Xavier. The significant wave height (Hs) during storm events sporadically exceeds 6 m, while the mean Hs fluctuates around 1 m (at 13 m water depth, W1 in Figure 1b). The dominant wave direction is from NW, and the waves are mainly generated from the westerly wind from SW to NW. The averaged wind speed from 2005 to 2018 was about 7 m/s, while increasing over 30 m/s during extreme storm events (at WN in Figure 1b). Data from these three observation points were used for the model simulations, and wave heights at W2 (8 m depth) were used to evaluate the model skills in predicting wave dynamics, which is the main driver for sediment transport and morphodynamics.
Three cross-shore profile locations (N, M and S in Figure 1d) are used for the analysis of hydrodynamics and morphodynamics representing north, middle and south of the model domain. On each profile, three points are further selected for the analysis. They represent nearly the lowest water level during the analysis period (1), on top of the nearshore bar (2) and seaward of the bar (3) (Table 1).

2.2. Field Data

Observed water levels (at WL in Figure 1b), wave (at W1 and W2) and wind (at WN) conditions were used for the model simulations from 24 January to 26 April 2007, which covers a period between two beach and dune surveys. On 18 March 2007, a major storm event impacted the beach and dune system on Sylt (Figure 2).
Water level data at WL from the Federal Agency for Waterways and Shipping (WSV: Wasserstraßen- und Schifffahrtsverwaltung des Bundes) has a temporal resolution of 10 min. The maximum water level (3.1 m) during the analysis period occurred at spring-high water (00:45 h 19 March 2007), while the maximum tidal anomaly (TA: total water level -astronomical tide = 2.7 m) was during the rising tide after spring-low water (20:00 h 18 March 2007). Apart from the major storm event, there are other events with a TA of about 1 m (Figure 2a). The spatiotemporal astronomical tide was extracted from a calibrated German Bight model [21].
Wave observations have temporal resolutions of 1 h at W1 (from the Federal Agency for Maritime and Hydrographic, BSH: Bundesamt für Seeschifffahrt und Hydrographie) and 30 min at W2 (from the local agency for coastal protection, LKN: Landesbetrieb für Küstenschutz, Nationalpark und Meeresschutz Schleswig-Holstein). At W2, there are data only from 7 March to 26 April 2007. Wave heights at W1 and W2 show extreme events (e.g., wave heights exceeding 2 m) from the west (Figure 2b). Peak storm waves (Hs: 5.0 m at W1 and 2.6 m at W2) occurred on the rising tide after spring-low water (18:00 h 18 March 2007), when the total water level was at 1.3 m.
Wind data at WN from the German Weather Service (DWD: Deutscher Wetterdienst) has a temporal resolution of 10 min. During the major storm event, wind speed exceeded 21 m/s and approached from the SW (18:00 h 18 March 2007). In the other events (e.g., at 28 January, 27 February), the wind direction was from the NW exceeding 15 m/s (Figure 2c). It should be noted that the west coast of Sylt is exposed to wind and waves approaching from the entire S to N sector.
The model bathymetries were constructed using two sources of data, (1) Beach and dune topography from LiDAR provided by LKN and (2) Nearshore bathymetry from BSH. There are two LiDAR data sets surveyed on 25 January and 25 April 2007. These data have a spatial resolution of 1 m and extend from the dune area down to about MSL (0 m). The nearshore bathymetry represents the sea bed in 2007, and has a spatial resolution of 50 m and the highest depth reaches about −3 m. Therefore, the nearshore area from 0 to −3 m depth has no observed bathymetry information during the analysis period.

3. Methodology

A hybrid approach of numerical experiments using D3D and XB was used to investigate the impact of roller dynamics on the beach and dune erosion. Both models were initially simulated with hydrodynamics (circulation and waves) only to assess the model performance against measured wave data. Using the optimised roller parameters through a sensitivity analysis, the final model settings were applied implementing roller and no roller dynamics in both D3D and XB (see Section 3.1.4). The simulated hydrodynamics and morphodynamics were analysed to access the effect of the roller dynamics on storm erosion.

3.1. Model Setup

3.1.1. Modelling Tools

The numerical background of the two modelling tools D3D and XB is described below with their similarities and differences.
(a)
Delft3D (D3D)
D3D is an open-source model that has shown skill in simulating morphodynamics in a wide range of applications e.g., [19,22]. This three-dimensional model has been developed based on a finite difference approach with an alternating direction implicit (ADI) numerical scheme [12,23]. D3D enables using different modules to simulate physical processes, e.g., hydrodynamics (FLOW), sediment transport (SED), morphology (MOR). FLOW is the primary module that interacts with all other modules. In FLOW, the unsteady nonlinear shallow water equations are solved using the ADI method to compute the hydrodynamics [24]. In this study, a depth-averaged approach (2DH) is used with the FLOW, SED and MOR modules. Wave forcing on the hydrodynamics are simulated by online-wave coupling between SWAN [25] and FLOW, in which there is a two-way communication at a user specified time interval. A 30-min interval is used to capture the tidal variation, although the temporal resolution of the wave data at W1 is 1 h. SWAN simulates the propagation of a short-wave spectrum (JONSWAP, see Equation (1)) over the model domain based on the offshore imposed wave parameters. In D3D with Roller dynamics (see 3.1.2), the short wave effect on the long wave is also computed and applied in the hydrodynamics at the scale of the wave groups. Total sediment transport under combined waves and currents is estimated using the Soulsby—Van Rijn formulations [26]. Morphodynamics are computed based on the conservation of sediment fluxes, which is multiplied by a morphological acceleration factor, morfac [19]. Avalanching is activated, when a critical wet slope angle is exceeded. In the grid stencil, scalar quantities are computed at the grid-cell centre, while vector quantities at grid-cell faces.
(b)
XBeach (XB)
XB is an open source model, which has been originally developed to investigate hurricane impact (erosion) on beaches and dunes [11]. The skill of this model in predicting storm erosion has been shown in numerous applications e.g., [2,10,16]. XB is a 2DH morphodynamic model, which estimates the beach and dune response to time-varying storm conditions. XB estimates the main physical processes of beach and dune erosion [9] by solving coupled depth-average equations for wave propagation, flow, sediment transport and morphodynamics. The wave solver is based on the 2nd generation HISWA model [27] using the directional distribution of wave action density with a single representative frequency. This study uses the surfbeat mode, which computes the propagation of the short wave averaged envelop and accompanying long-wave motion [11]. Short waves are generated at the offshore boundary based on the JONSWAP spectrum. Similar to D3D, hydrodynamics are computed using the shallow water equations. The numerical scheme follows the method of Stelling and Duinmeijer [28], in which different depth values are used for the continuity and the momentum equation based on a velocity threshold, to improve long-wave runup and backwash on beaches. Avalanching is used to estimate dune erosion. Cross-shore transport depends on the balance of the wave skewness and asymmetry (onshore component), and the undertow (offshore component). Sediment transport is estimated using the Soulsby—Van Rijn formulations [26], and morphodynamics can be accelerated using a morfac as in D3D. Both D3D and XB use the same grid stencil. The main similarities and differences of both models are listed in Table 2.

3.1.2. Roller Model

The roller model simulates the effect of short wave groups on long waves, which causes the spatial variation in the radiation stresses and long waves to travel with the groups of short waves. This is an important phenomenon in dune erosion [11] and is implemented in D3D as an add-on module [29], but is a fundamental process in XB [11]. Both models do not simulate individual long waves but the forcing caused by short waves.
The roller model uses breaking wave energy from the short wave energy balance as the source to compute the propagation of the roller energy. In D3D, the mean wave direction, of which wave and roller energy are transported, and wave period are obtained from the SWAN wave computation. XB estimates wave energy propagation similar to the HISWA model [27] in the directional domain with a representative frequency. In D3D and XB models, the total radiation stresses are estimated by adding roller- and wave-induced radiation stresses to compute the wave forces, which are used in the momentum equations to estimate hydrodynamics.
The roller energy balance equation in XB is given by Equation (1). The fourth term of the left-hand side is not used in D3D.
S r t + c x S r x + c y S r y + c θ S r θ = D w D r
where, t: time (s), Sr: roller energy density (J/m2/Hz), c: wave celerity (m/s), Dw: dissipation of wave energy (J/m2), Dr: dissipation of roller energy (J/m2), x and y: spatial and ϴ: directional domains.
Following Roelvink [30], the wave energy dissipation is implemented in both models based on the propagation of wave groups (Equation (2)).
D w = 2 α f m ( 1 exp ( ( 8 E / ( ρ g ) γ h ) n ) ) E
where, α: wave dissipation coefficient (-), fm: representative frequency (Hz), E: wave energy (J/m2), g: acceleration of gravity (m2/s), ρ : water density (kg/m3), γ: breaker index (-), h: water depth (m), n: calibration coefficient (-).
The roller energy dissipation is given by,
D r = 2 β g E r c
where, β: roller slope (-), Er: roller energy (J/m2)
Total wave forces are estimated based on the wave- and roller-induced radiation stresses as follows,
F x = ( S x x , w + S x x , r x + S x y , w + S x y , r y )
F y = ( S x y , w + S x y , r x + S y y , w + S y y , r y )
where Fx and Fy: total wave force components in x and y directions (N). Sxx, Sxy and Syy are radiation stresses (m/s2), w and r indicate respectively wave and roller induce radiation stress components.
The following three roller coefficients were selected to analyse the sensitivity of beach and dune erosion, while applying the same settings for all other parameters in both models (see Appendix A).
(a)
Beta (β)
The slope of the wave front is Beta, which determines the roller energy dissipation (Equation (3)). The default value is 0.1, and lower values cause delayed response resulting to pronounced inner and outer bars, and larger values result in considerable bar flattening [31]. This parameter is generally used to control the behaviour of breaker bars, which ultimately affects the beach and dune erosion. A range of values from 0.05 to 0.30 are used for D3D and XB (see Section 3.1.4).
(b)
Gamdis
Gamdis (Gamma dissipation) is the wave breaking index, which imposes an upper limit on wave heights as a fraction of the local water depth. Therefore, this determines wave heights in the surf zone. Gamdis can be set to a constant or a depth-dependent value. The default value (0.55) is based on the wave propagation in the time scale of wave groups [30]. A depth-dependent value can be applied following Ruessink et al. [32] in D3D (−1), and other formulations (roelvink1, roelvink2 and roelvink_daly) in XB (see Section 3.1.4). Wave dissipation is proportional to H2 (H is wave height) in roelvink1 and to H3/h in roelvink2 [30]. In roelvink_daly [33], two thresholds are defined for fully- and non-breaking of wave conditions.
(c)
F_lam
F_lam indicates breaker delay, which defines a seaward weighted averaged water depth for the computation of wave energy dissipation due to wave breaking. Waves need a distance (~one wave length) to start and stop breaking, and this phenomenon is considered replacing the local water depth with a water depth weighted over a certain seaward distance from the point of interest [34]. The breaker delay, however, is less influential on the morphodynamics than the previous two parameters [35]. In D3D, there are two options, either two wave lengths offshore (−2) or no breaker delay (0: default). Applying −2, the energy dissipation due to wave breaking is computed using a weighted averaged water depth from the local water depth up to the water depth of two wave lengths offshore. In XB, no (0) and enabled (1: default) breaker delay are used to investigate the effect of breaker delay on beach and dune erosion (see Section 3.1.4).

3.1.3. Model Domains and Boundary Forcing

Two model domains, “apex” and “west”, were used for the numerical experiments (Figure 1b–d). Characteristics of these domains are given in Table 3. The grid resolution of the apex domain is twice that of the west domain. The purpose of the west domain is to generate the wave parameters at the boundaries of the apex domain. This wave nesting approach is required for the D3D simulations to minimize the wave shadow-zone effect at the lateral boundaries of the apex domain (see Dissanayake and Winter [19]). In XB, waves can be simulated without this effect using the apex domain only [19]. However, to enable consistent model comparison and validation, the west domain was employed in the XB simulations as well (note. W2 is located beyond the apex domain, Figure 1b). Morphological changes in both models were simulated using the apex domain.
The model bathymetries for 25 January 2007 were prepared applying the LiDAR (25 January 2007) and the BSH bathymetry (2007) data. As mentioned in Section 2.2, there is a gap in data between 0 and −3 m depths. This stretch extends from MSL down to about N1, M1 and S1 (Table 1 and Figure 1e–g), and there are fairly linear variations along the bed profile segments before MSL, and before the trough of the first nearshore bar (N2, M2 and S2 in Figure 1e–g). Therefore, bed levels within this stretch were generated by linear interpolation across-shore at each grid point along the coast. Similarly, the model bathymetry representing 25 April 2007 was set up using the respective LiDAR and the 2007 BSH data. For the model comparison, the initial and final measured cross-shore profiles at N, M and S (see Figure 1e–g) were extracted from these two combined bathymetries, and those for the models were extracted from the final simulated beds.
Model boundaries were set up using the observed data (water level, waves and wind) and the predicted astronomic tide from a calibrated hydrodynamic model of the German Bight [21]. Spatially varying total water level (astronomical tide + TA) was applied for the offshore boundary of the domains, while the lateral boundaries were imposed with water level gradients. Such a combination generates tidal currents perpendicular to the lateral boundaries following the direction of tidal propagation [36,37]. Spatially varying total water level was prepared by combing the astronomical tide from the German Bight model (amplitudes and phases at the offshore corner points) and the derived TA at WL (Figure 1b). A spatially uniform and temporally varying offshore wave boundary was applied using parametric values at W1 to generate the JONSWAP wave spectrum [38,39]. For the lateral wave boundaries in XB, the gradient of wave energy along the wave crest was set to zero to minimize the wave shadow-zone effect. Spatially uniform and temporally varying wind fields were applied using the wind data at WN.

3.1.4. Simulations

The simulation period spans from 18:00 h 24 January to 00:00 h 26 April 2007 covering two beach and dune surveys (i.e., LiDAR data). The initial period of 6 h was used to spin-up the models so the hydrodynamics in the domain are in equilibrium with the boundary forcing. First, four hydrodynamic simulations using the west domain were run to compare the model performance, and the Roller and No Roller applications (Table 4). Then, a sensitivity analysis of the beach and dune erosion to roller parameters (Beta, Gamdis and F_lam, see Section 3.1.2) was carried out to identify their optimum values (i.e., 17 simulations). Using the selected values for the roller parameters, the final set of models (4) were simulated to investigate the roller effect on beach and dune erosion in D3D and XB.

3.2. Analysis

Simulated results are analysed to illustrate the model skills, and to investigate the effect of the roller dynamics on the hydrodynamics and storm erosion in D3D and XB. The models’ skills in predicting wave dynamics are evaluated using wave height and wave spectral density. Measurements and simulations are compared using three statistical parameters: Correlation coefficient (R2), root mean square error (RMSE) and relative change (µ). Wave height and depth averaged velocity at the time of the observed peak storm wave occurrence (18:00 h at 18 March 2007) are first qualitatively compared in both models to investigate the roller effect on the hydrodynamics. Next, water levels, wave heights, velocities and the effective bed shear stress are analysed along the three cross-shore profiles (N, M and S). The effect of roller parameters on beach and dune erosion is estimated using RMSE and the mean relative change ( µ ¯ ) with respect to the reference (default parameter setting) scenarios. Finally, the roller dynamics on storm erosion are investigated using bed level change of the analysis points along the three profiles, and the sediment volume change within different zones (classified by depth) along the beach and dune profile.
Estimation of the wave spectral density and the effective bed shear stress in D3D and XB, and the statistical parameters used for the comparison are described below.
(a)
Wave spectral density
The wave spectral density (SD) represents the distribution of wave energy as a function of frequency and its shape depends on the processes of wave growth and decay, as well as interactions between different frequency bands. The formulation for the JONSWAP [38,39] spectrum reads as,
S D ( f ) = α g 2 ( 2 π ) 4 f 5 e x p [ 5 4 ( f f p ) 4 ] γ r
where, r = e x p [ ( f f p ) 2 2 σ 2 f p 2 ] ,   σ = { 0.07 ,   f < f p 0.09 ,   f f p , α: Phillips constant (-), f: wave frequency (Hz), γ: peak enhancement factor (3.3), σ: spectral width parameter (-).
In D3D, SD was computed using the modelled Hs and peak period (Tp). XB predicts root-mean-square wave height (Hrms). This is first converted into Hs following a relation of the Rayleigh distribution, Hs = √2 × Hrms, which is however more applicable for normal wave conditions at deep water (see Goda [40]). SD is then computed using, (1) modelled Hrms and observed Tp at W1 and (2) converted Hs and observed Tp at W1 in XB.
(b)
Effective bed shear stress
The effective bed shear stress ( τ b ) represents the overall shear stress on the sea floor from both waves and currents, and their interactions, and determines local sediment transport. The depth-averaged effective bed shear stress for D3D and XB was calculated using the following formulations.
In D3D, the Soulsby [26] approach, which is based on one standard function that can be adapted for different wave–current boundary layer models, is used to estimate τ b following the Fredsøe [41] boundary layer model.
τ b = | τ m | | u | ( u + u s )
| τ m | = Y ( | τ c | + | τ w | )
τ w = 1 2 ρ f w u w 2
τ c = ρ C D u 2
where τ m : bed shear stress of combined waves and currents (N/m2), u : depth-averaged velocity (m/s), u s : depth-averaged Stokes drift, Y: a fitting function for the wave-current boundary layer [26], τ c : bed shear stress from currents alone (N/m2), τ w : bed shear stress from waves alone (N/m2), f w : friction factor (-), u w : wave orbital velocity (m/s), and C D : drag coefficient (-).
In XB, τ b   is calculated based on mean currents and long waves following the approach of Ruessink et al. [42]. The x and y components of τ b read as,
τ b x E = c f ρ u E ( 1.16 u r m s ) 2 + ( u E + v E ) 2
τ b y E = c f ρ v E ( 1.16 u r m s ) 2 + ( u E + v E ) 2
where c f : dimensionless friction coefficient (g/C2), C: Chézy coefficient (m1/2/s), u E and v E : Eulerian velocity (short-wave-averaged velocity observed at a fixed point) at x and y directions (m/s), u r m s : wave orbital velocity (m/s).
(c)
Statistical parameters
The models’ skills in predicting wave characteristics were analyzed by comparing measured and predicted parameters at W2 using three statistical parameters (Equations (13)–(15)).
The coefficient of determination (R2) was calculated to quantify the fraction of variance in each simulation corresponding to the measurements. This is defined as the squared value of the coefficient of correlation [43]:
R 2 = [ j = 1 n ( x j x ¯ ) ( y j y ¯ ) ( x j x ¯ ) ( y j y ¯ ) ] 2
where, x values represent the parameter time series (i.e., Hs) from the measured data and y values represent the simulated values, x ¯ and y ¯ indicate the mean values, and n is the number of time steps during the analysis period.
The root mean square error (RMSE) quantifies the standard deviation of the differences between the simulations and either the measurements or the reference simulation:
R M S E = 1 n j = 1 n ( x j y j ) 2
Smaller RMSEs imply better agreement between the observations and the model simulations.
The mean relative change ( µ ¯ ) indicates the normalised difference between the measured and simulated data.
µ ¯ = 1 n j = 1 n µ j
where,
µ j = ( y j x j ) x j

4. Results

4.1. Model Skill

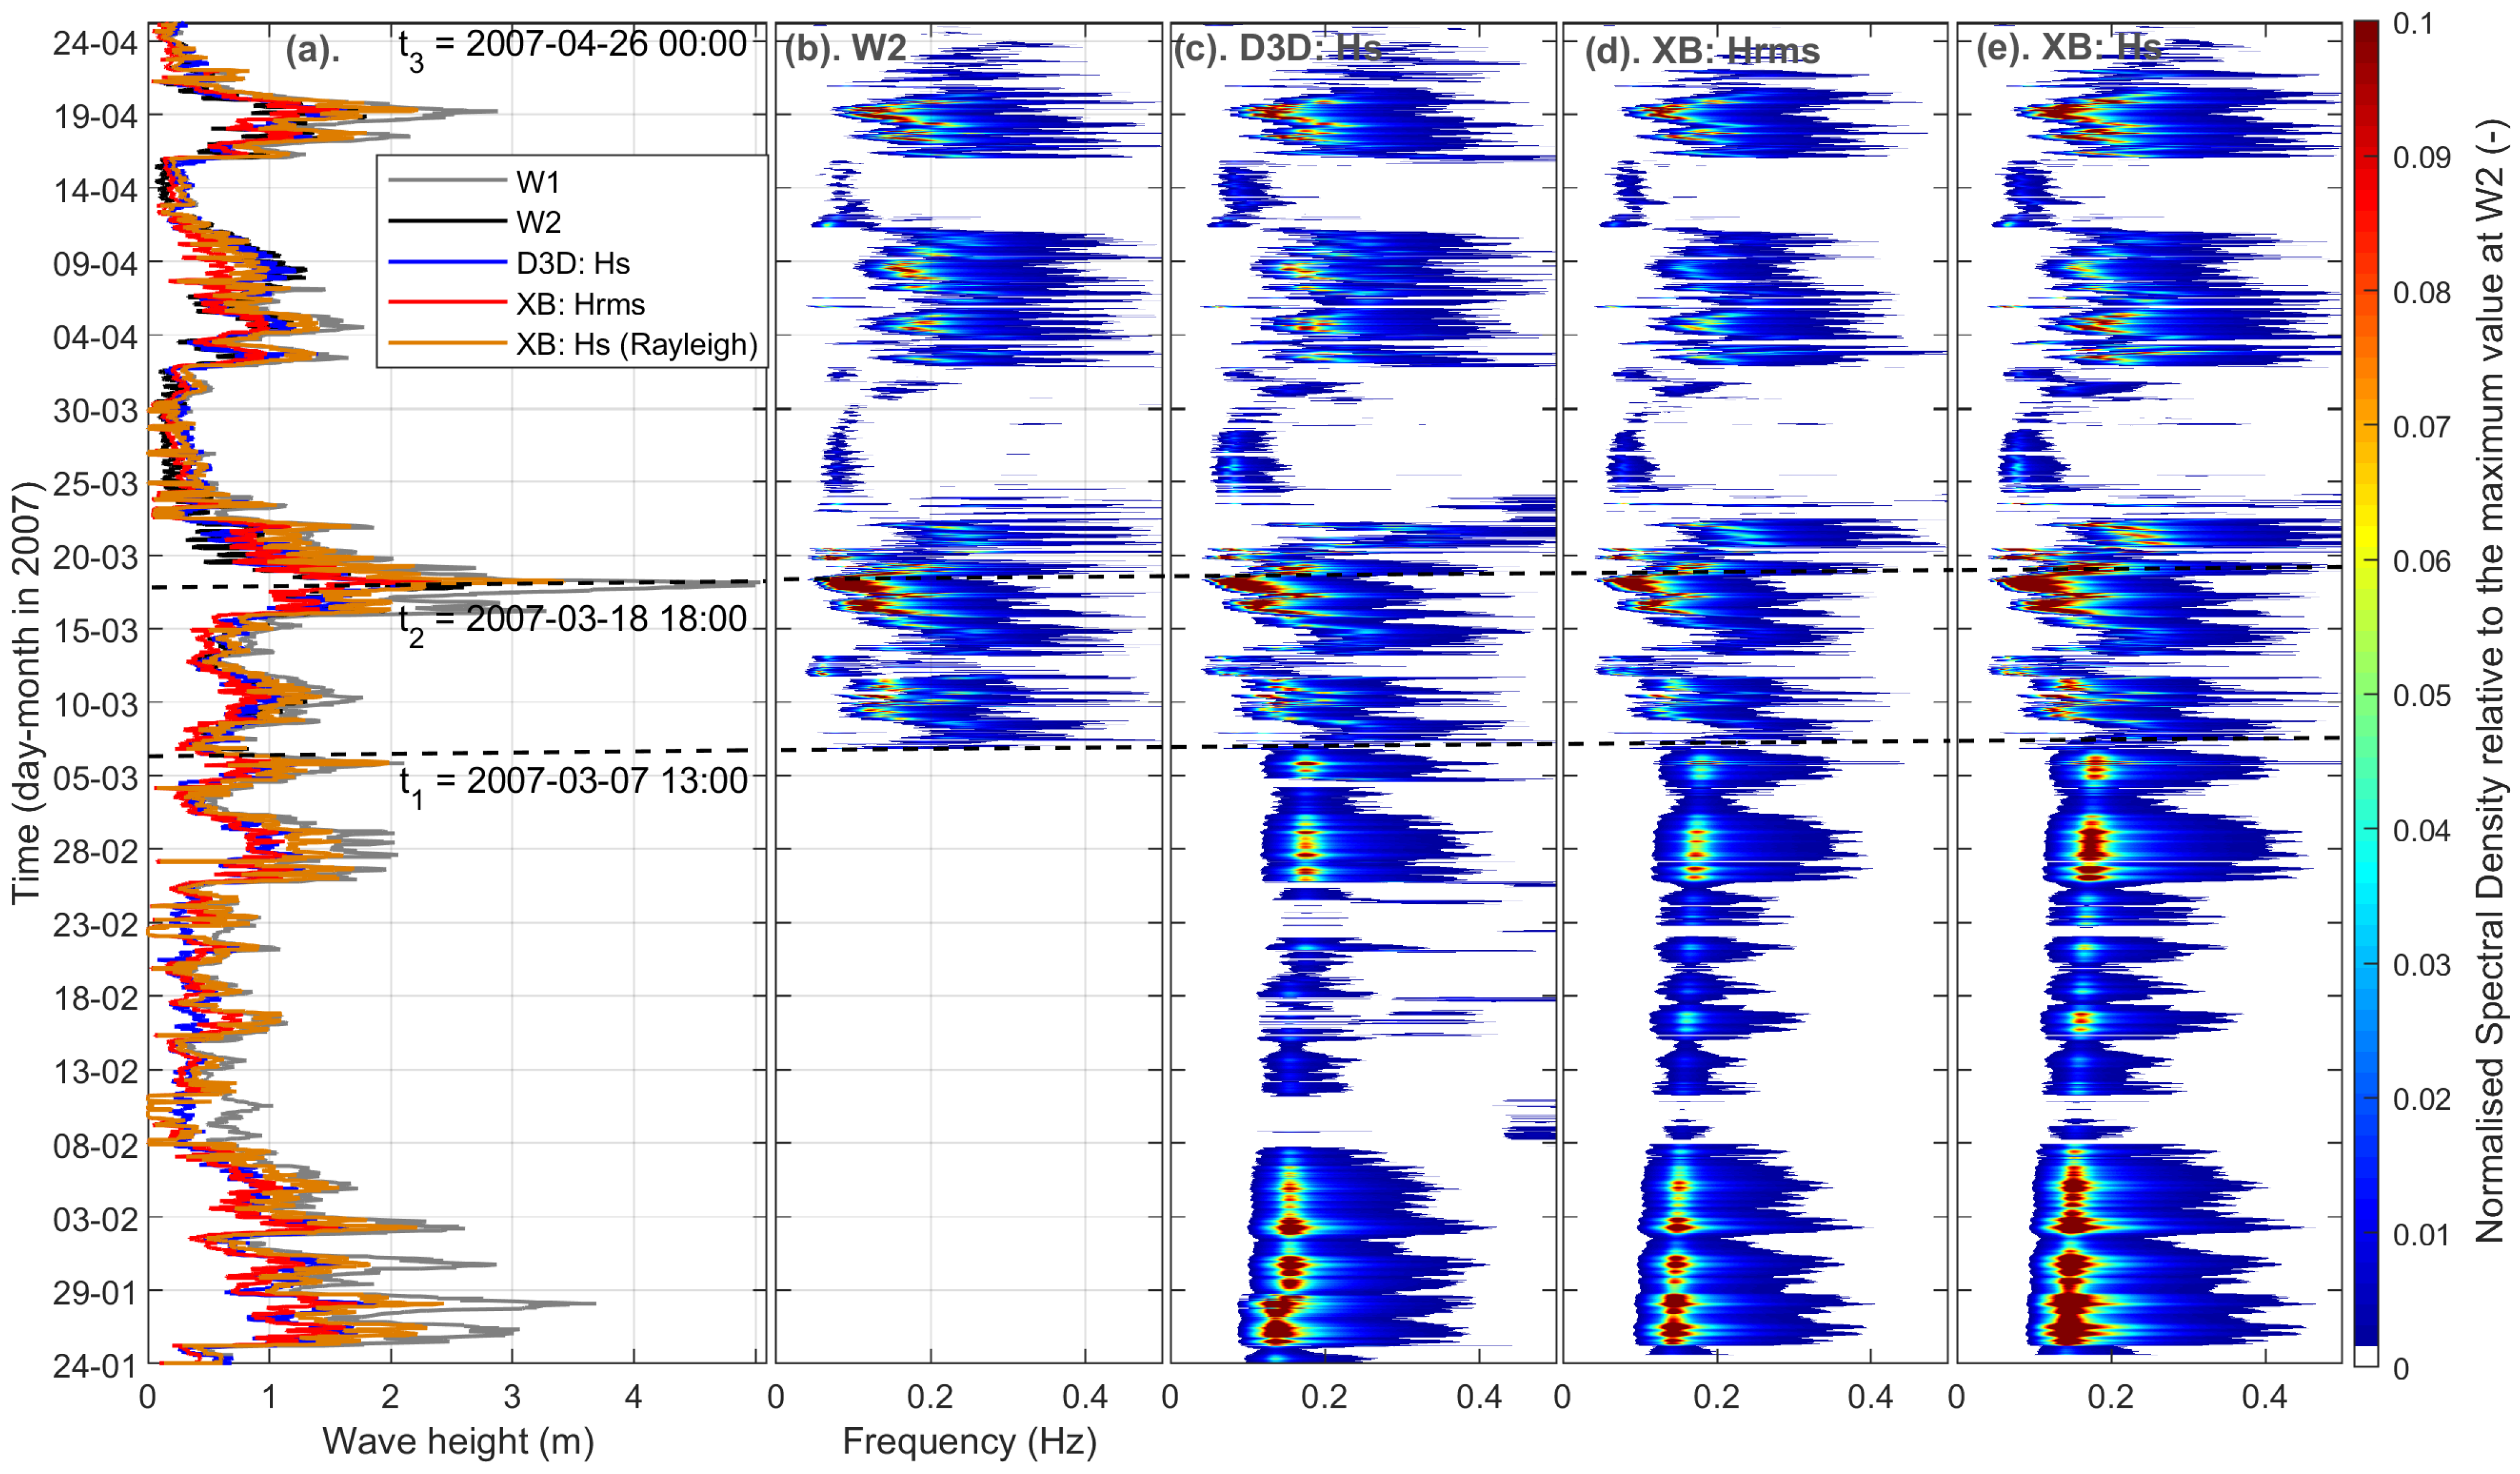
The model skill was analysed by comparing the measured and simulated wave heights at W2 (see location in Figure 1b) and the respective wave spectral densities between D3D NR and XB R being the standard applications.
Wave height comparison is shown in Figure 3a for the measurements (W1 and W2) and the simulations (D3D: Hs, XB: Hrms and Hs). Measured wave heights at W2 span from 13:00 h 07 March 2007 (t1) to 00:00 h 26 April 2007 (t3) only. The peak storm wave height (Hs) was observed as 2.6 m at W2 (t2: 18:00 h 18 March 2007) while it is 2.4 m in D3D and in XB, 2.4 m (Hrms) equal to 3.4 m (Hs). The D3D wave heights are generally higher at low wave heights and lower at high wave heights compared with the observations. The XB wave heights Hs are higher than the observations. Observed wave heights at W1 are always higher than at W2 and the model predictions. This indicates that waves decay during their propagation into the apex domain rather growing.
Wave Spectral densities were analysed at W2. The normalised spectral densities with respect to the maximum spectral density of the observed data were estimated for the waves from the observations (Figure 3b), D3D Hs (c), XB Hrms (d) and XB Hs (e). The highest spectral density corresponds to the peak storm wave height in all cases. Variation of spectral density from t1 to t3 is qualitatively in better agreement between W2 (observations) and D3D, than between W2 and XB. The results of XB Hs are higher compared with that of W2. In the analysis period, high wave heights result in high spectral densities in both model simulations (e.g., 29 January, 28 February).
Wave heights and spectral densities were quantitatively compared between the observations and the simulated results at W2 (Table 5). The highest R2 (0.91) and the lowest RMSE (0.14 m) in D3D indicate that the simulated waves represent the measured wave heights well. In XB, these values imply low agreement between measured and simulated wave heights. Simulated spectral density in D3D is only 0.32 kJ/m2/Hz lower than the observations (µ = −0.03). In contrast, it is lower (2.52 kJ/m2/Hz and µ = −0.27) and higher (3.96 kJ/m2/Hz and µ = 0.45) in XB using Hrms and Hs respectively.
The analysis of model skills showed that D3D can better capture the measured wave characteristics than XB. As mentioned in Section 3.1.1, D3D computes the propagation of wave spectrum in both directional and frequency domains, whereas XB estimates only in the directional domain using a mean frequency. This could contribute to low wave heights in XB. Overall, the simulated waves in XB Hrms can be treated as reasonable based on the statistical values. It should be noted that extensive calibration and validation of the hydrodynamics were not undertaken in this analysis. Therefore, the present parameter setting of these two models (see Appendix A) is used to compare the hydrodynamics with Roller and No Roller applications.

4.2. Hydrodynamics

Roller effects on the hydrodynamics were analysed using the simulated water level, depth-averaged velocity, wave height and bed shear stress in both models. The first three parameters were qualitatively compared between the Roller (R) and No Roller (NR) applications at the time of the peak storm wave height (t2: 18:00 h 18 March 2007 in Figure 3a, Hs: 2.6 m at W2). This energetic condition enables clear visualization of the discrepancies between the simulations. Average values of these parameters were then compared over the full analysis period.
Wave height and directional patterns are shown in Figure 4 for both models with R and NR simulations. For clarity, a nearshore section of the domain (water depth ~5 m) is displayed. In both applications, Hs in D3D are higher than XB Hrms, while the highest waves are shown by XB Hs. D3D R appears to have higher wave heights than D3D NR. However, in XB, wave heights in NR seem to be higher compared with the R. Wave direction is same between R and NR, although slightly different between the two models (~5°). Wave direction in XB is more eastwardly oriented than D3D. This could be due to the fact, SWAN uses peak wave direction and XB uses mean wave direction for the wave computation. The observed peak wave directions were provided as the input wave directions in both models.
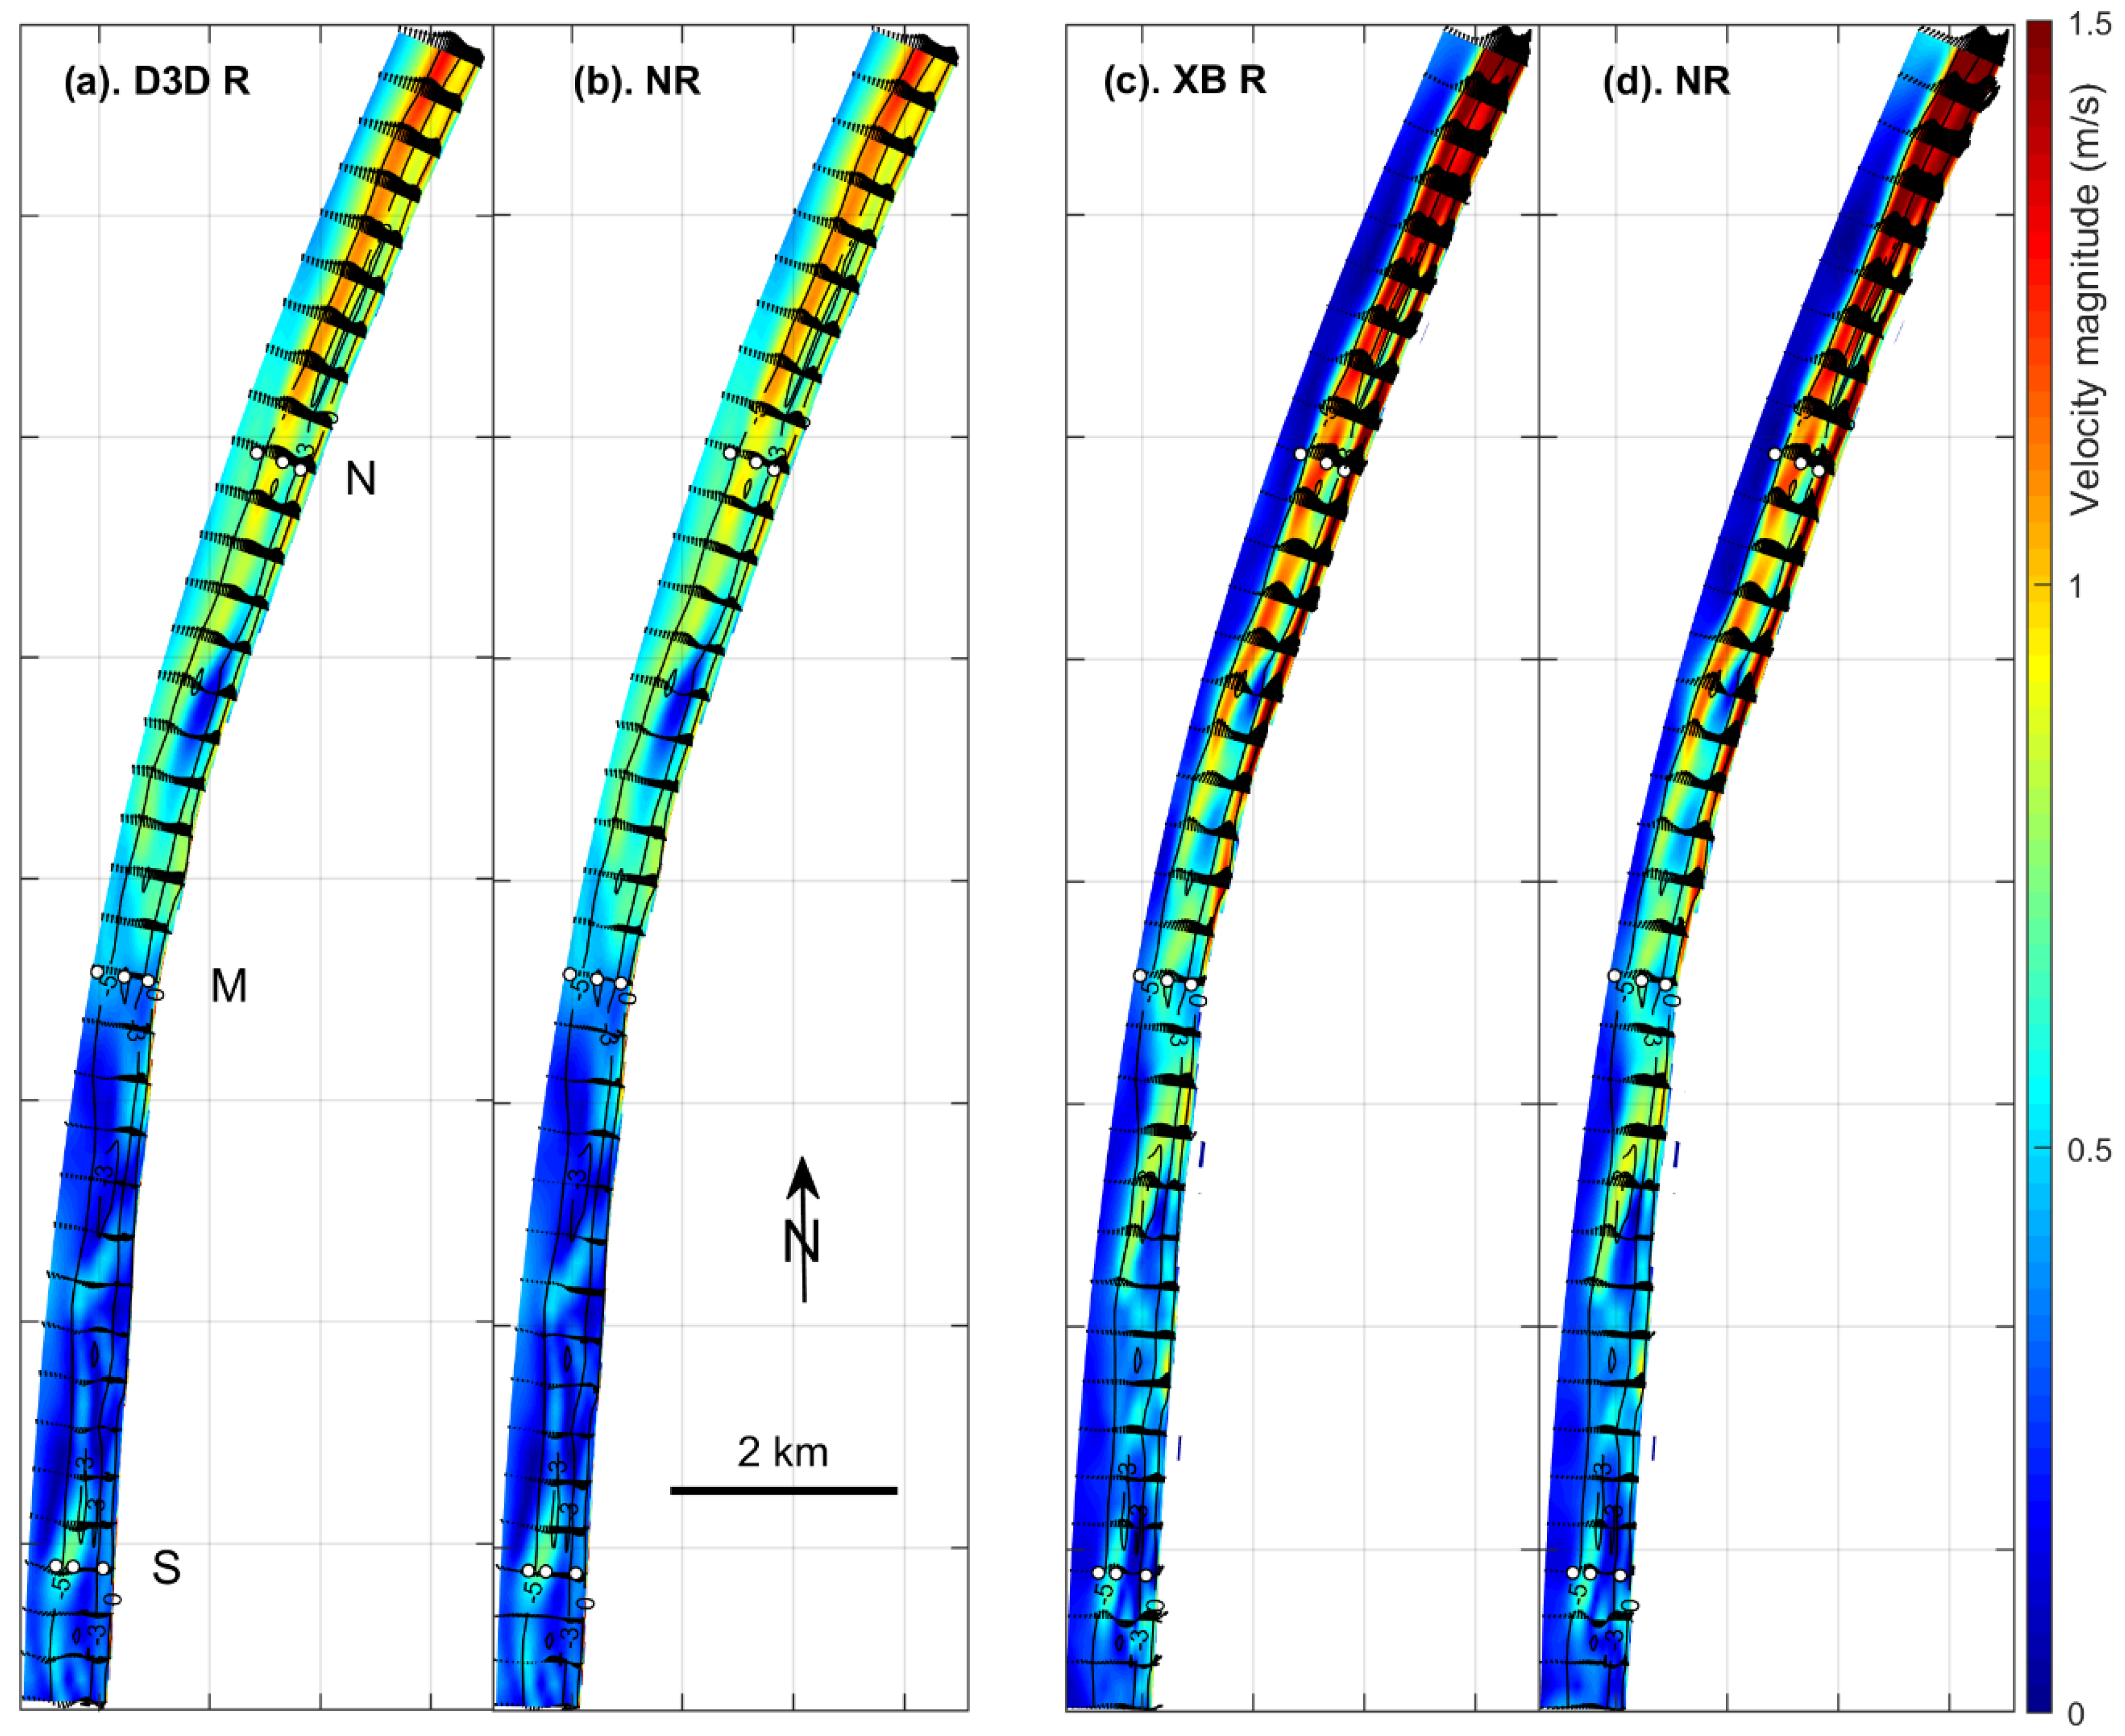
The depth-averaged velocity shows a clear wave driven alongshore current flowing along shore to the north (Figure 5). In agreement with wave heights (Hs), velocity distribution at the time of the peak in storm waves shows the highest values in XB. All applications have a similar pattern of variations along the coast but the magnitudes are different. In D3D, nonzero velocities span across the shore beyond the 5 m depth, and the roller dynamics (a) caused an increase in velocities relative to the no roller dynamics (b). The velocities are higher in XB than D3D, but they are constrained close to the coast up to 5 m depth. Similar to D3D, XB also shows higher velocities with the roller dynamics.
The cross-shore variation of water level, wave height and velocity at t2 are shown in Figure 6 at the three profile locations (N, M and S). Water level (first row) indicates that the difference between R (solid-line) and NR (dash-line) is higher in XB (red-line) than in D3D (blue-line). This could be due to the fact that XB computes the short wave averaged long wave oscillation across the entire domain, while that in D3D depends on wave breaking. It is generally found, the roller dynamics cause high water levels in both models. Around MSL XB tends to produce higher water levels compared with D3D. Over the nearshore bar (at N2, M2 and S2) water level increases, which is more noticeable in D3D than XB.
As found in Figure 4, wave heights (second row) in D3D (blue-line) are lower than in XB Hs (magenta-line). The strong decrease in wave heights at the nearshore bar indicates wave breaking in both models. The effect of roller dynamics on wave heights depends on the profile location. In the south (S) and the north (N), the roller dynamics caused higher wave heights. However, for the middle (M) profile, higher waves are generally found with the no roller application. In D3D, there are always higher wave heights on the beach with the no roller simulation. This indicates that the roller model in D3D decreases wave heights on the beach.
Cross-shore velocities are seaward directed (negative) in D3D for all profiles (blue-line, third row). However, they (except NR at M) are positive indicating shoreward velocities in XB (red-line). It appears that there is a difference between the cross-shore processes in the models. Alongshore velocities are northward (positive) at the N and M profiles in both models (D3D: black-line and XB: magenta-line). However, cross-shore variation and magnitudes are higher in XB than in D3D. In the south (S profile), D3D shows southward (negative) velocities, while they are northward in XB. In both models, the difference between roller and no roller dynamics varies along the cross-shore direction. Overall, the cross-shore variations of water level, wave height and velocity show that the effect of roll dynamics in each model is lower compared to the difference between the two models.
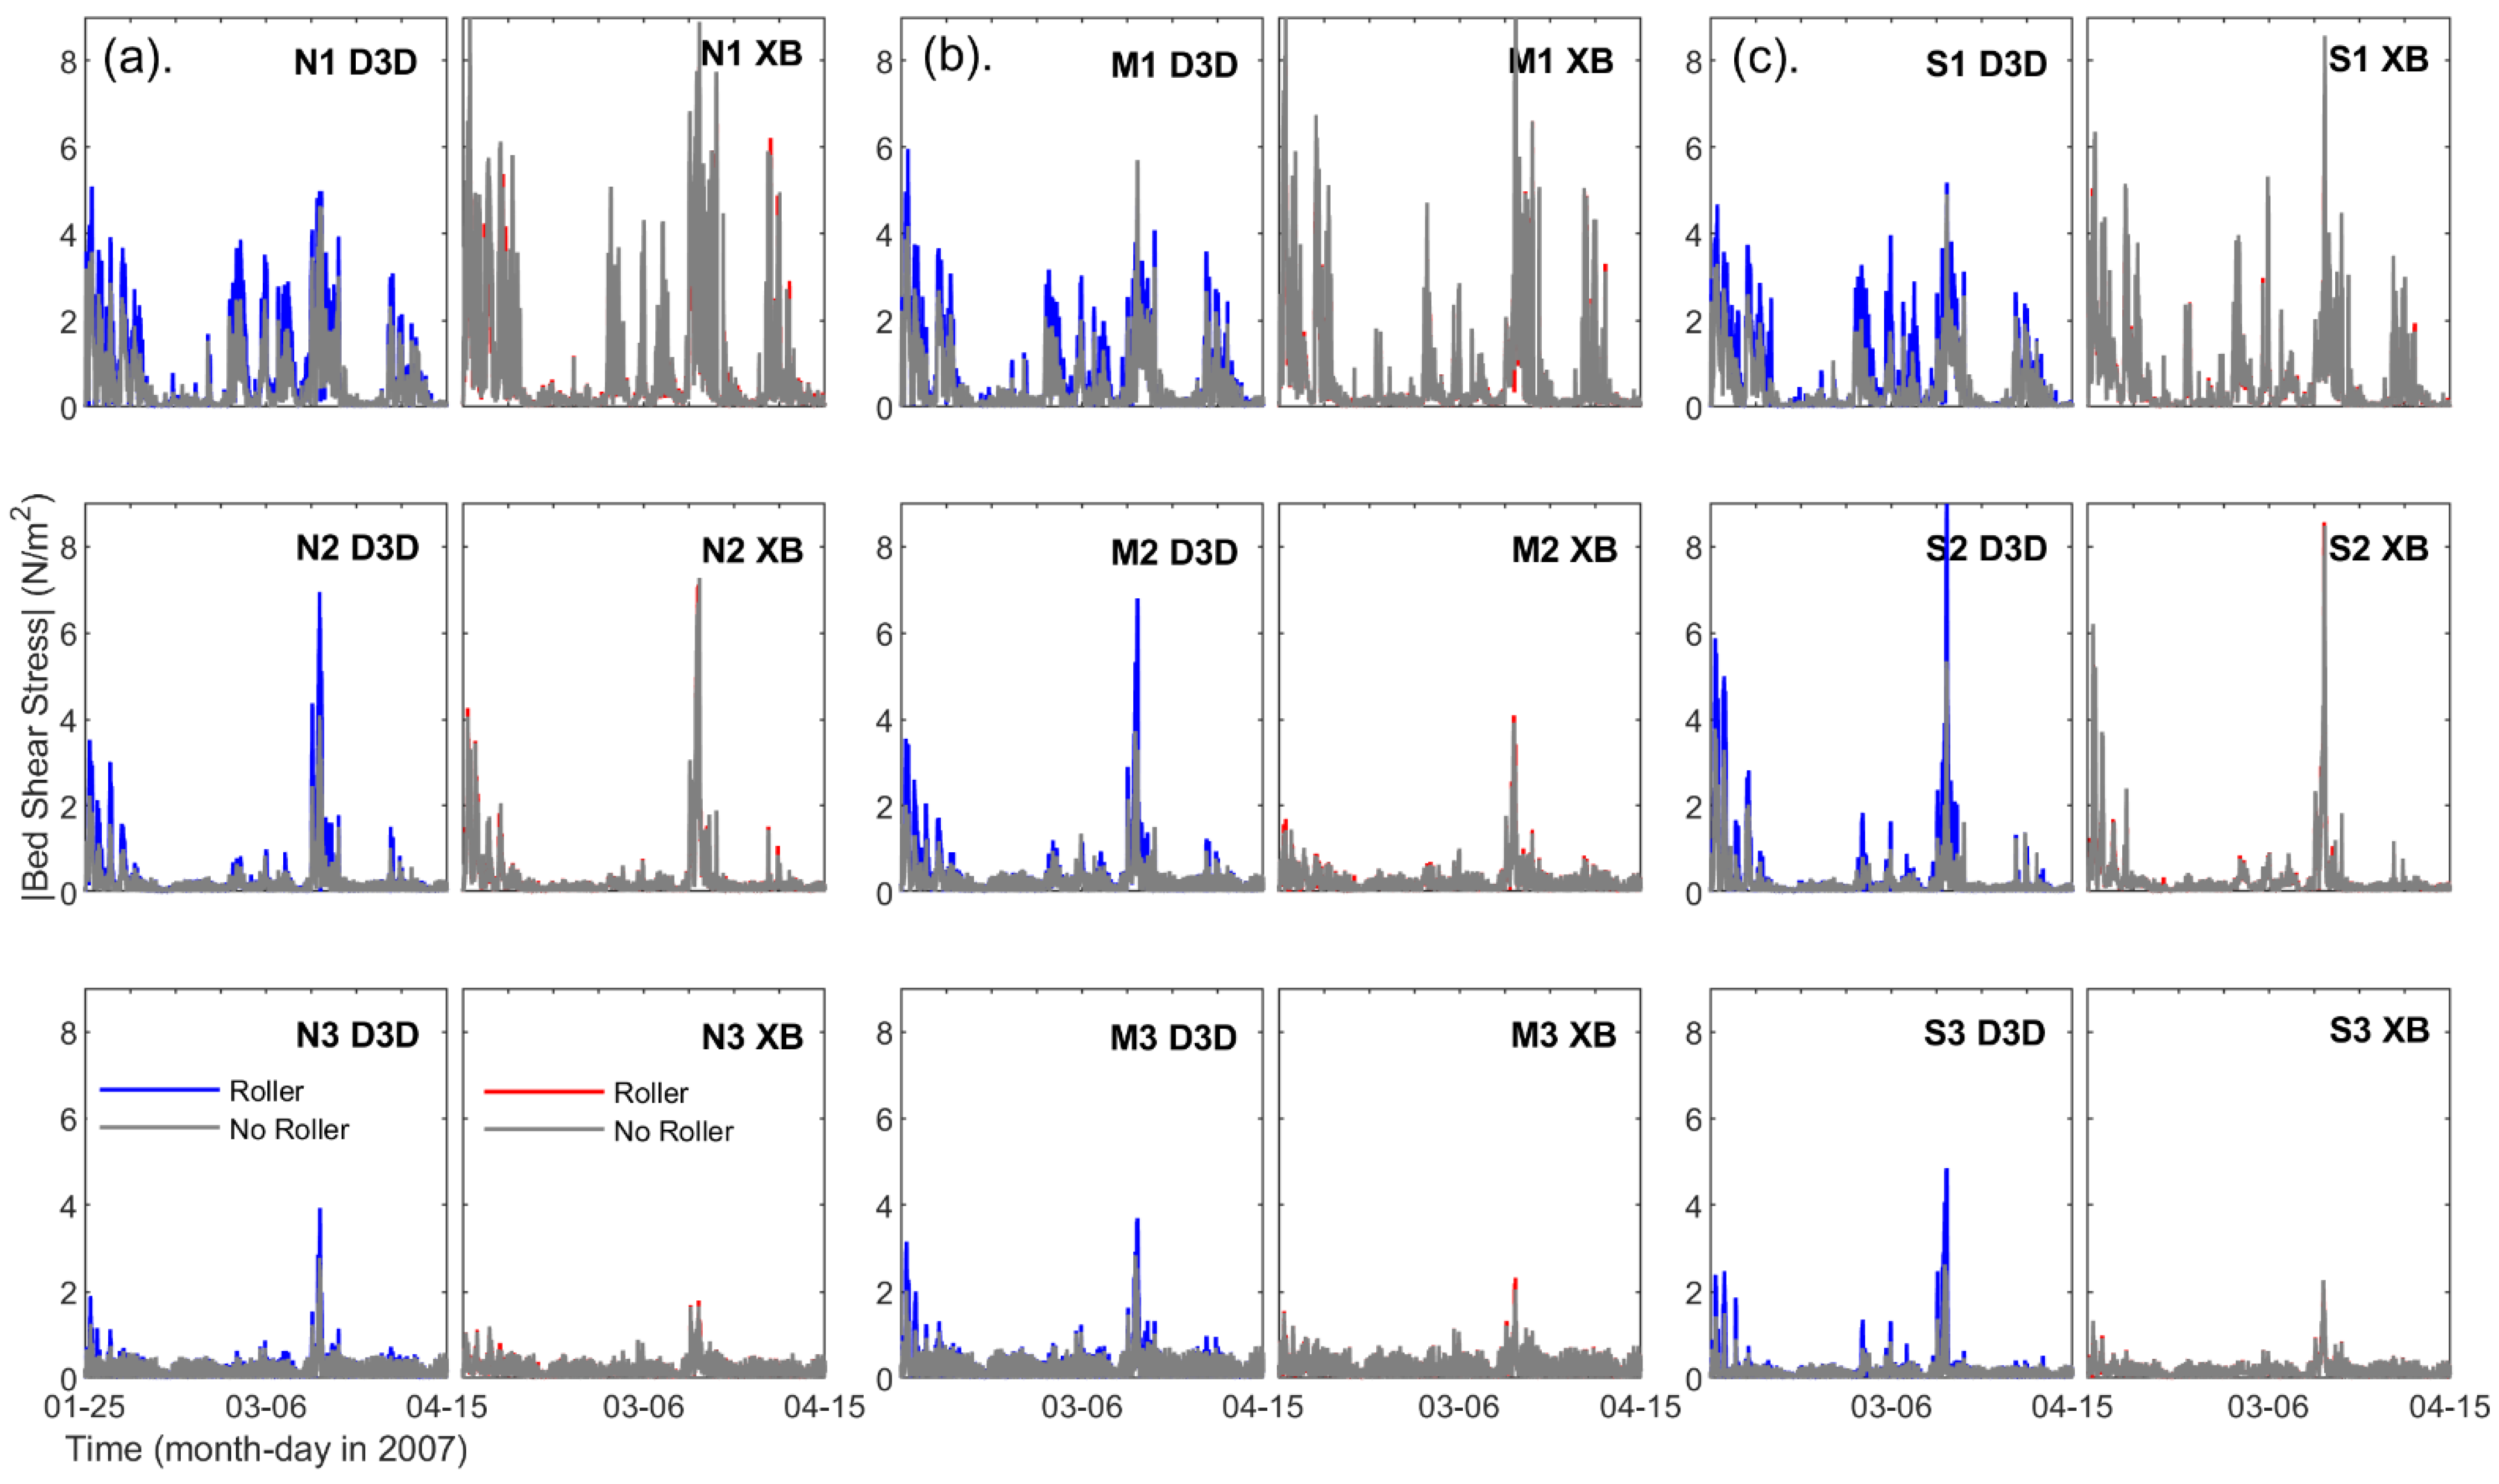
Bed shear stresses at the analysis points decrease with distance towards the sea (from 1 to 3 in Figure 7). During the analysis period (see Figure 2), it can be expected that the waves commonly break at the shallowest analysis location (~2 m depth: N1, M1 and S1) along the profiles. Therefore, a higher bed shear stresses occurred at the shallowest location than the other two points (e.g., N2, N3). However, the deeper two points of all three profiles show a strong peak in bed shear stress during the storm events because larger waves penetrate to a deeper depth causing higher bed shear stress. The difference of bed shear stresses between roller and no roller applications is more noticeable in D3D than in XB. This indicates that including roller dynamics caused increased bed shear stress in D3D. However, the effect of roller dynamics on bed shear stress is marginal in XB.
The averaged wave height, velocity and bed shear stress over the simulation period are summarized in Table 6 for the analysis points along the profiles. In both models and roller applications, wave heights increase seaward, while velocity and bed shear stresses decrease. Wave breaking occurs close to the coast increasing the latter two parameters.
In contrast to Figure 4 and Figure 6, the averaged wave heights (over time at the analysis points) indicate that the values in the roller application are lower than the no roller in D3D. The roller model in D3D uses wave energy from the wave breaking prediction in the SWAN computation. If waves are small (e.g., 0.5 m) and not breaking, there is no wave energy for the wave estimation in the roller model. Therefore, during calm conditions, wave heights from the roller model are zero. Thus, high wave heights become higher when the roller dynamics are considered. However, when taking the average values over the full simulation period the roller dynamics reduce the overall wave height in D3D.
Both the velocity and the bed shear stress increase with the roller dynamics in D3D. The magnitude of the estimated total wave force is higher with the roller dynamics than the no roller application because of the contribution from both wave force and roller force. This total wave force contributes to the momentum of the flow, which influences the water levels and velocities.
The effect of the roller dynamics in XB is marginal on wave height, velocity and bed shear stress. As in D3D, there is no separate module to compute the wave propagation in XB, which estimates the propagation of short wave averaged long wave motion over the entire domain. The difference of wave energy dissipation between the R and NR applications is only about 5% of the entire domain during the simulation period. Therefore, the impact of the roller dynamics is marginal in the computation of the hydrodynamic parameters in XB.

4.3. Storm Erosion

4.3.1. Sensitivity of Storm Erosion to Roller Dynamics

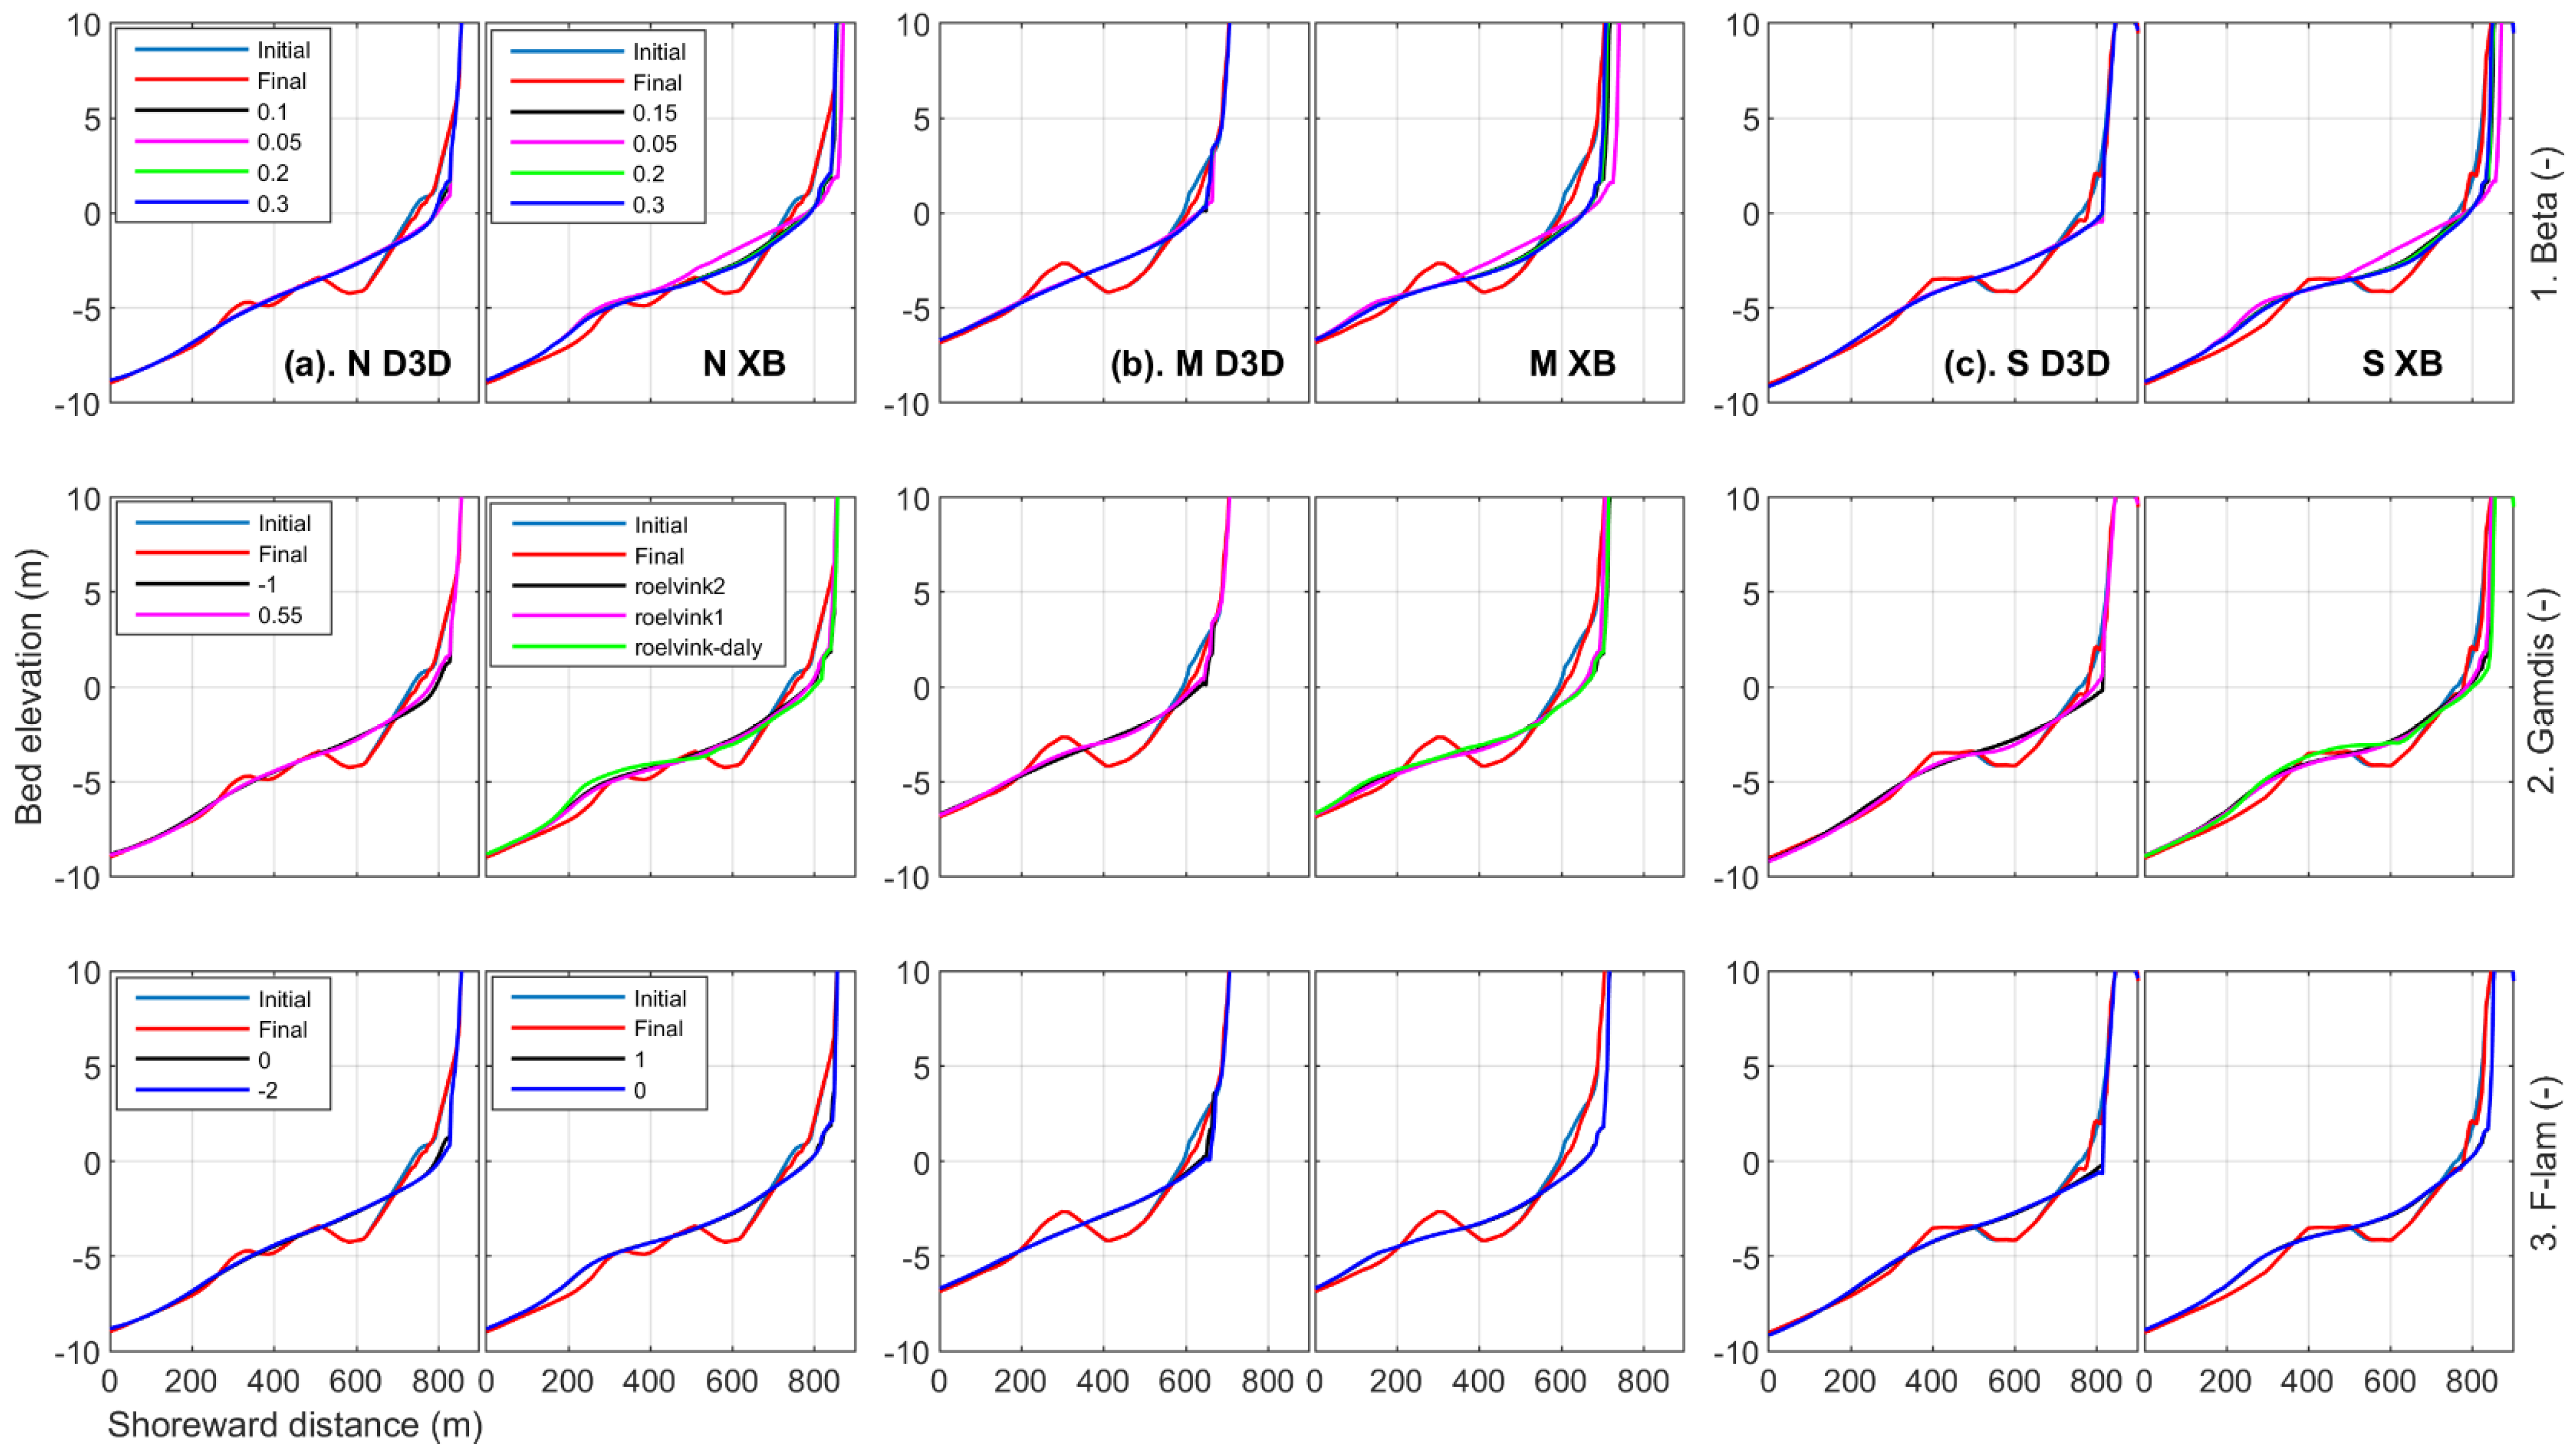
The sensitivity of the profile evolution during the analysis period was analysed using the three roller parameters (rows in Figure 8) for both models (columns). These profiles are from the apex domain and the locations N, M and S are shown in Figure 1d. The measured initial and final profile segments extend from the dune (~15 m) out to MSL (0 m, see Section 2.2). However, a profile segment from 10 to −10 m is shown to help visualize the storm erosion at the nearshore bar and dune relative to the overall change along the profile. Beyond these limits, there is no prominent erosion.
The main erosion and sedimentation patterns in both models are consistent for all parameter settings, though there are fine changes depending on their values. Erosion at the dune front is predicted to be higher than observed. In both models, the nearshore bar erodes with sedimentation in the landward trough. Strong erosion on the bar (depth ~3 m, see Table 1) can be expected given 5 m Hs (at W1 in Figure 1b) and 3.1 m water level during the peak storm wave (Figure 2). However, due to the lack of observations between 0 and −3 m, and the post-storm bathymetry, the final predicted profile cannot be validated. The predicted profiles provide a method of comparison between the simulation settings. The first row in Figure 8 shows the sensitivity of the profile evolution to the parameter Beta (roller slope in Equation (3)). The simulated profiles in D3D show less change compared with that of XB. The north profile (N) experienced the highest erosion in D3D. Erosion of the upper dune (above 5 m) occurred only in XB in all locations when using a Beta of 0.05. It is generally shown that the sensitivity of the profile evolution to Beta is higher in XB than in D3D. With the parameter Gamdis (dissipation) set to 0.55 (second row, Figure 8), D3D resulted in less evolutionary response than that of a setting of −1 [32] for all profiles. The profile evolution in XB is found to be less sensitivity to the three dissipation formulas than D3D. Evolution in both models is least sensitive to the parameter F_lam (breaker delay: third row, Figure 8). D3D shows an increase in bed response when applying a setting of −2. However, there is a hardly any difference between a setting of 1 (with breaker delay) and 0 (no breaker delay) in XB. These erosion and sedimentation patterns indicate that the sensitivity of the bed change under storm conditions decreases in order in response to the parameter settings of Beta, Gamdis and F_lam. The flattening of the beach profile in both models suggests, neither simulates recovery of a bar system during calm conditions particularly well (Note. last storm wave peak 2.9 m at W1 occurred at 21:00 h 19 April: Figure 2b).
The evolution between the observed (LiDAR) and the simulated profile from 0 to 5 m elevation was statistically compared using the root mean square error (RMSE: Equation (14)). D3D shows the smallest changes in the middle profile (M), while XB shows the greatest changes in this profile and the smallest changes in the southern profile (S) (Table 7). Therefore, the models have different skills in capturing the measured topography based on the alongshore location. These values agree with the profile variations in Figure 8 and further indicate that there is a low sensitivity of profile evolution for the different values of each parameter.
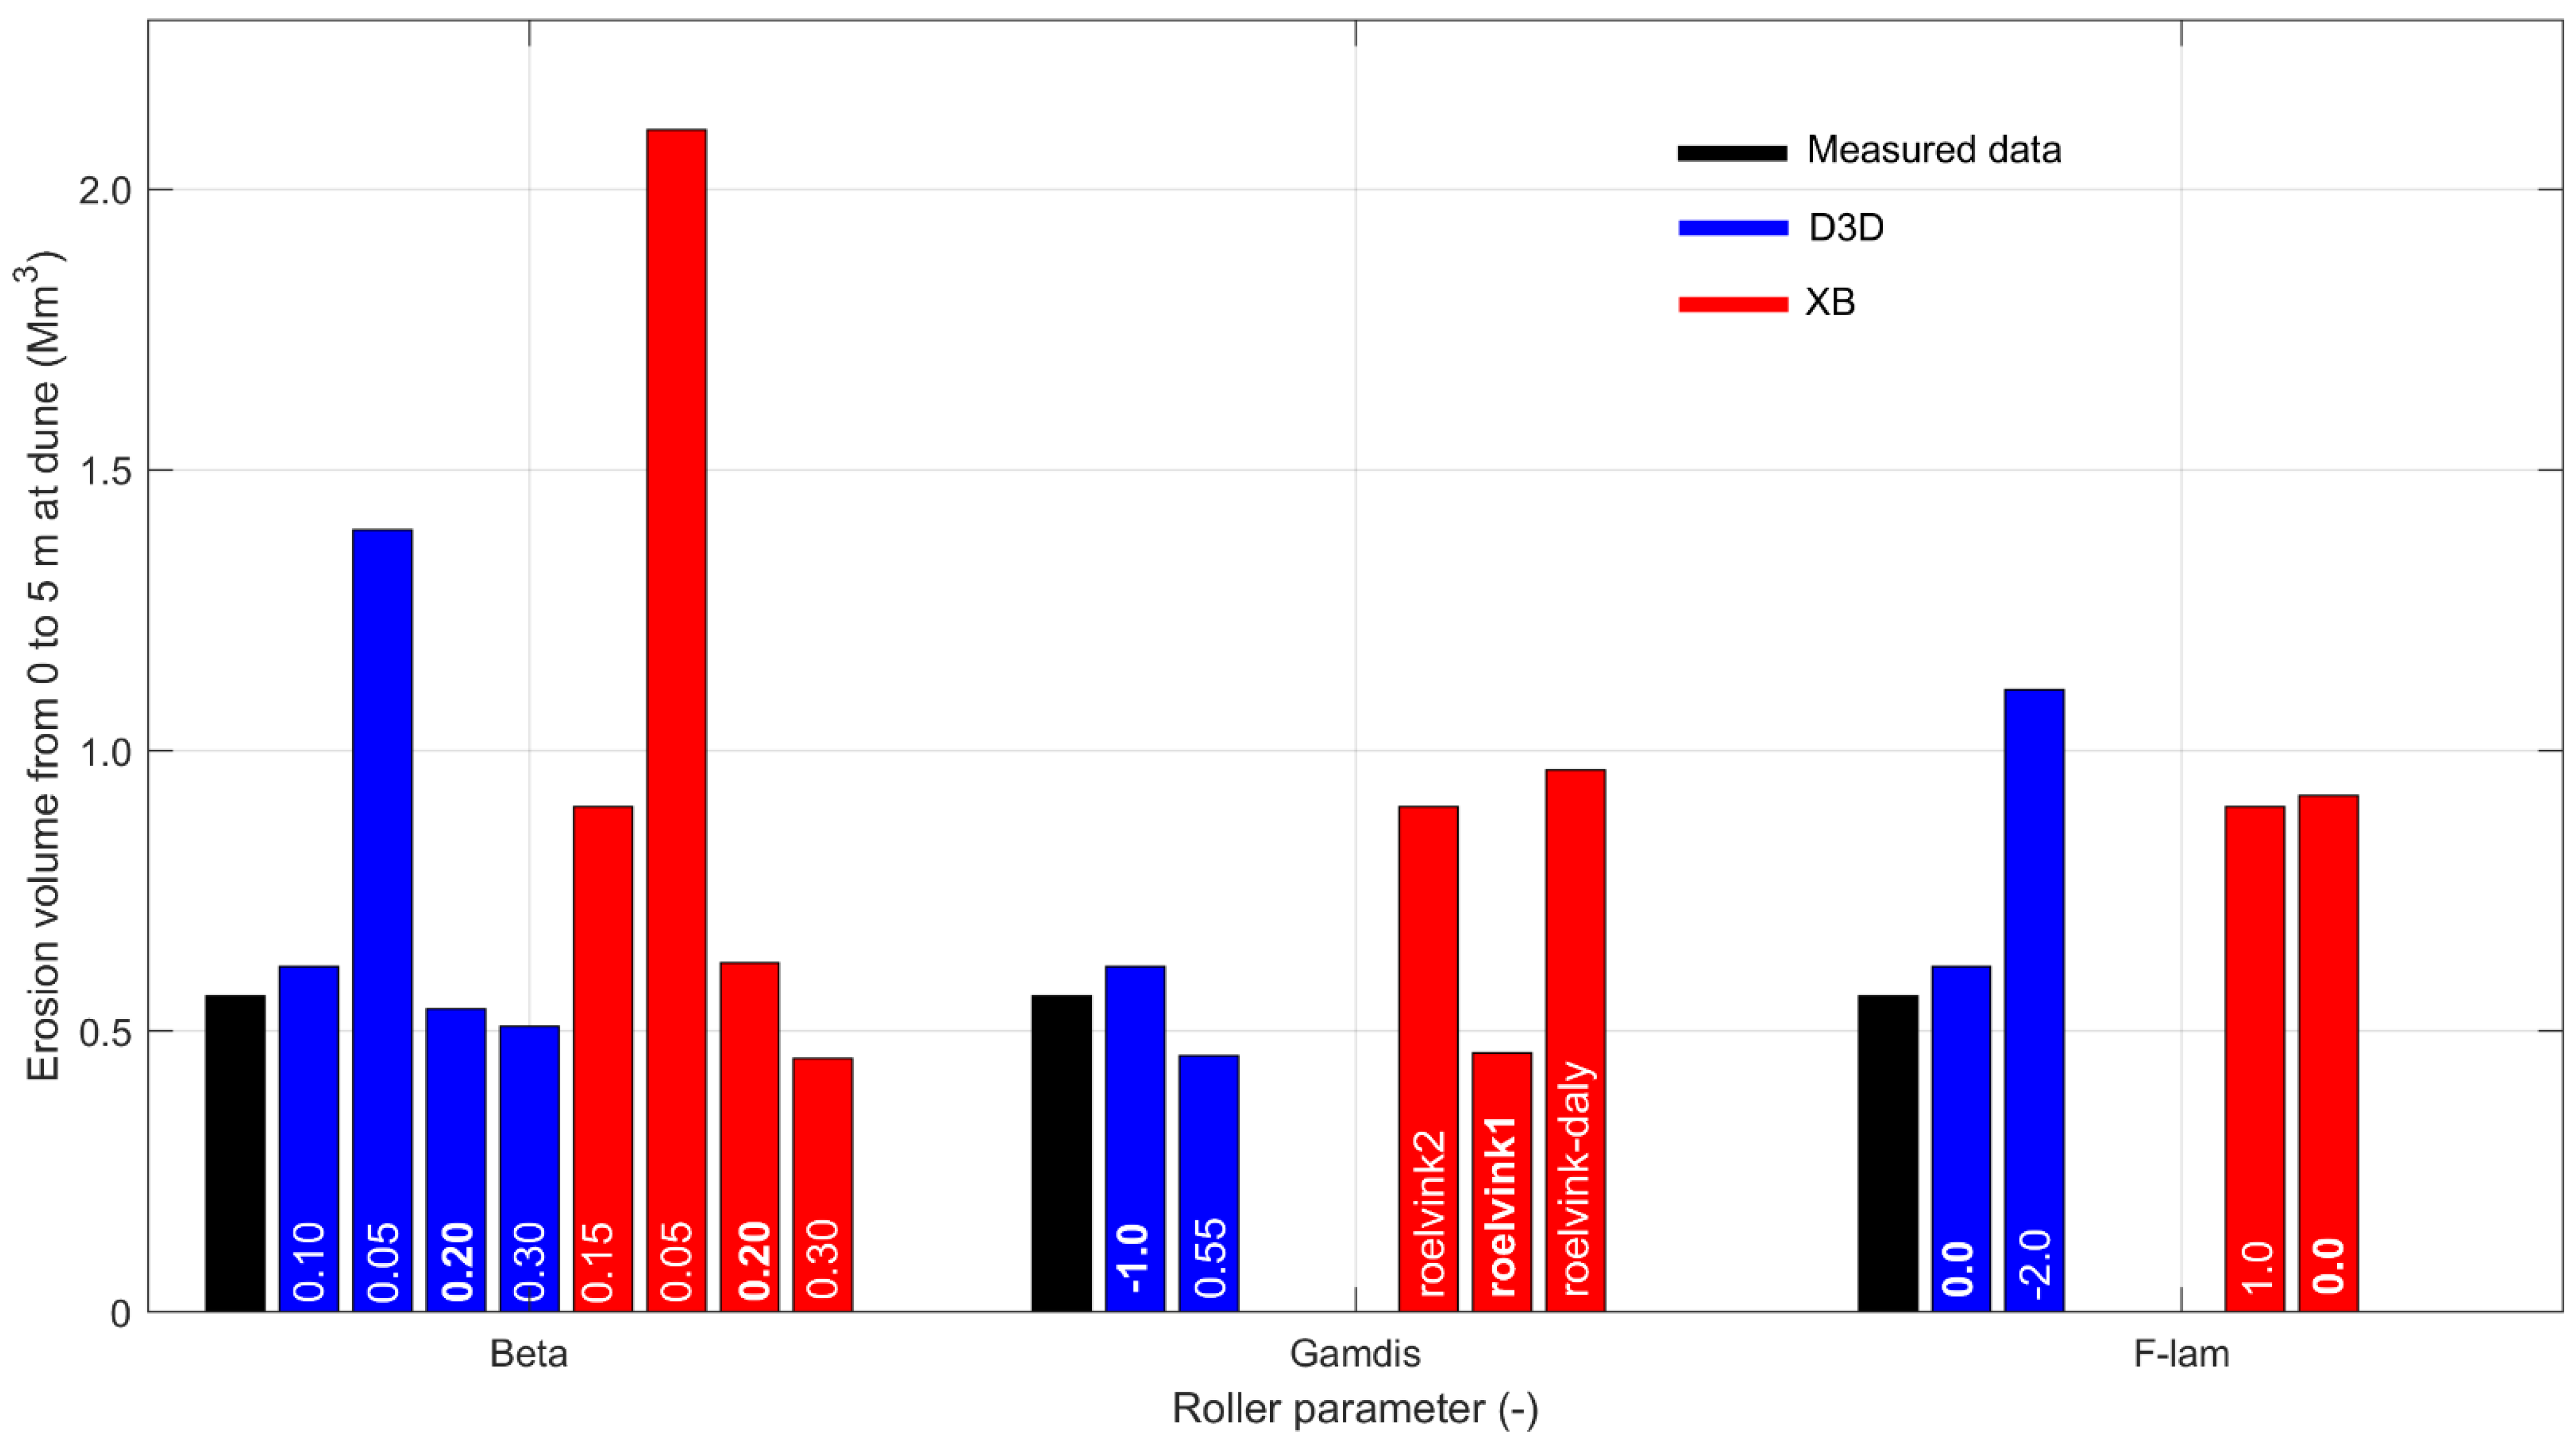
The change in beach and dune sediment volume during the analysis period was estimated between 0 and 5 m elevations considering the initial and final bathymetries from the observations and the model predictions (Figure 9). In all cases, the net change was a loss of volume due to erosion. The lower the Beta the greater the erosion in both models. The best agreement with the measured data is found with 0.20 (difference ~0.02 Mm3 in D3D and 0.06 Mm3 in XB). Depending on the dissipation formula (Gamdis), the erosion volume differs in the models. In D3D, the setting of −1 [32] resulted in the highest agreement with the observations, while it is the roelvink1 setting in XB that performs best. It should be noted that 0.55 (D3D) and roelvink1 (XB) have the same erosion volumes, because roelvink1 has been calibrated against a breaker index of 0.55. D3D is more sensitive to the breaker delay (F_lam) than XB. No breaker delay (0) provides the best agreement with the measured erosion volume. In XB, there is a marginal improvement applying the breaker delay model.
Selected roller parameters for both models are shown in Table 8.

4.3.2. Roller Effect on Storm Erosion

The roller effect on storm erosion was assessed by comparing the erosion and sedimentation pattern along the coast, bed evolution of the analysis points and the sediment volume change in different depth classes from 5 to −5 m elevation.
The simulated erosion and sedimentation patterns have generally common trends whereas different magnitudes in both models (Figure 10). The entire coast is impacted by the storm events approaching from the SW—NW sector (see Figure 2b). All simulations resulted in erosion around MSL (0 m), and sedimentation around −3 m depth, where there is a ridge runnel feature along the coast (see Figure 1e,f and Figure 8). The second erosion stretch occurred on the nearshore bar (see locations of the second analysis points) and the sedimentation around −5 m depth. In D3D, both erosion and sedimentation magnitudes are lower than those of XB. However, D3D R generated higher magnitudes of evolution than D3D NR. In XB, the erosion area at MSL extends towards dune providing more sediment into the nearshore area. XB R shows strong erosion particularly in the dune area, and greater sedimentation in the runnel and around −5 m depth compared to XB NR. The roller effect in XB increased the storm impact more so than in D3D.
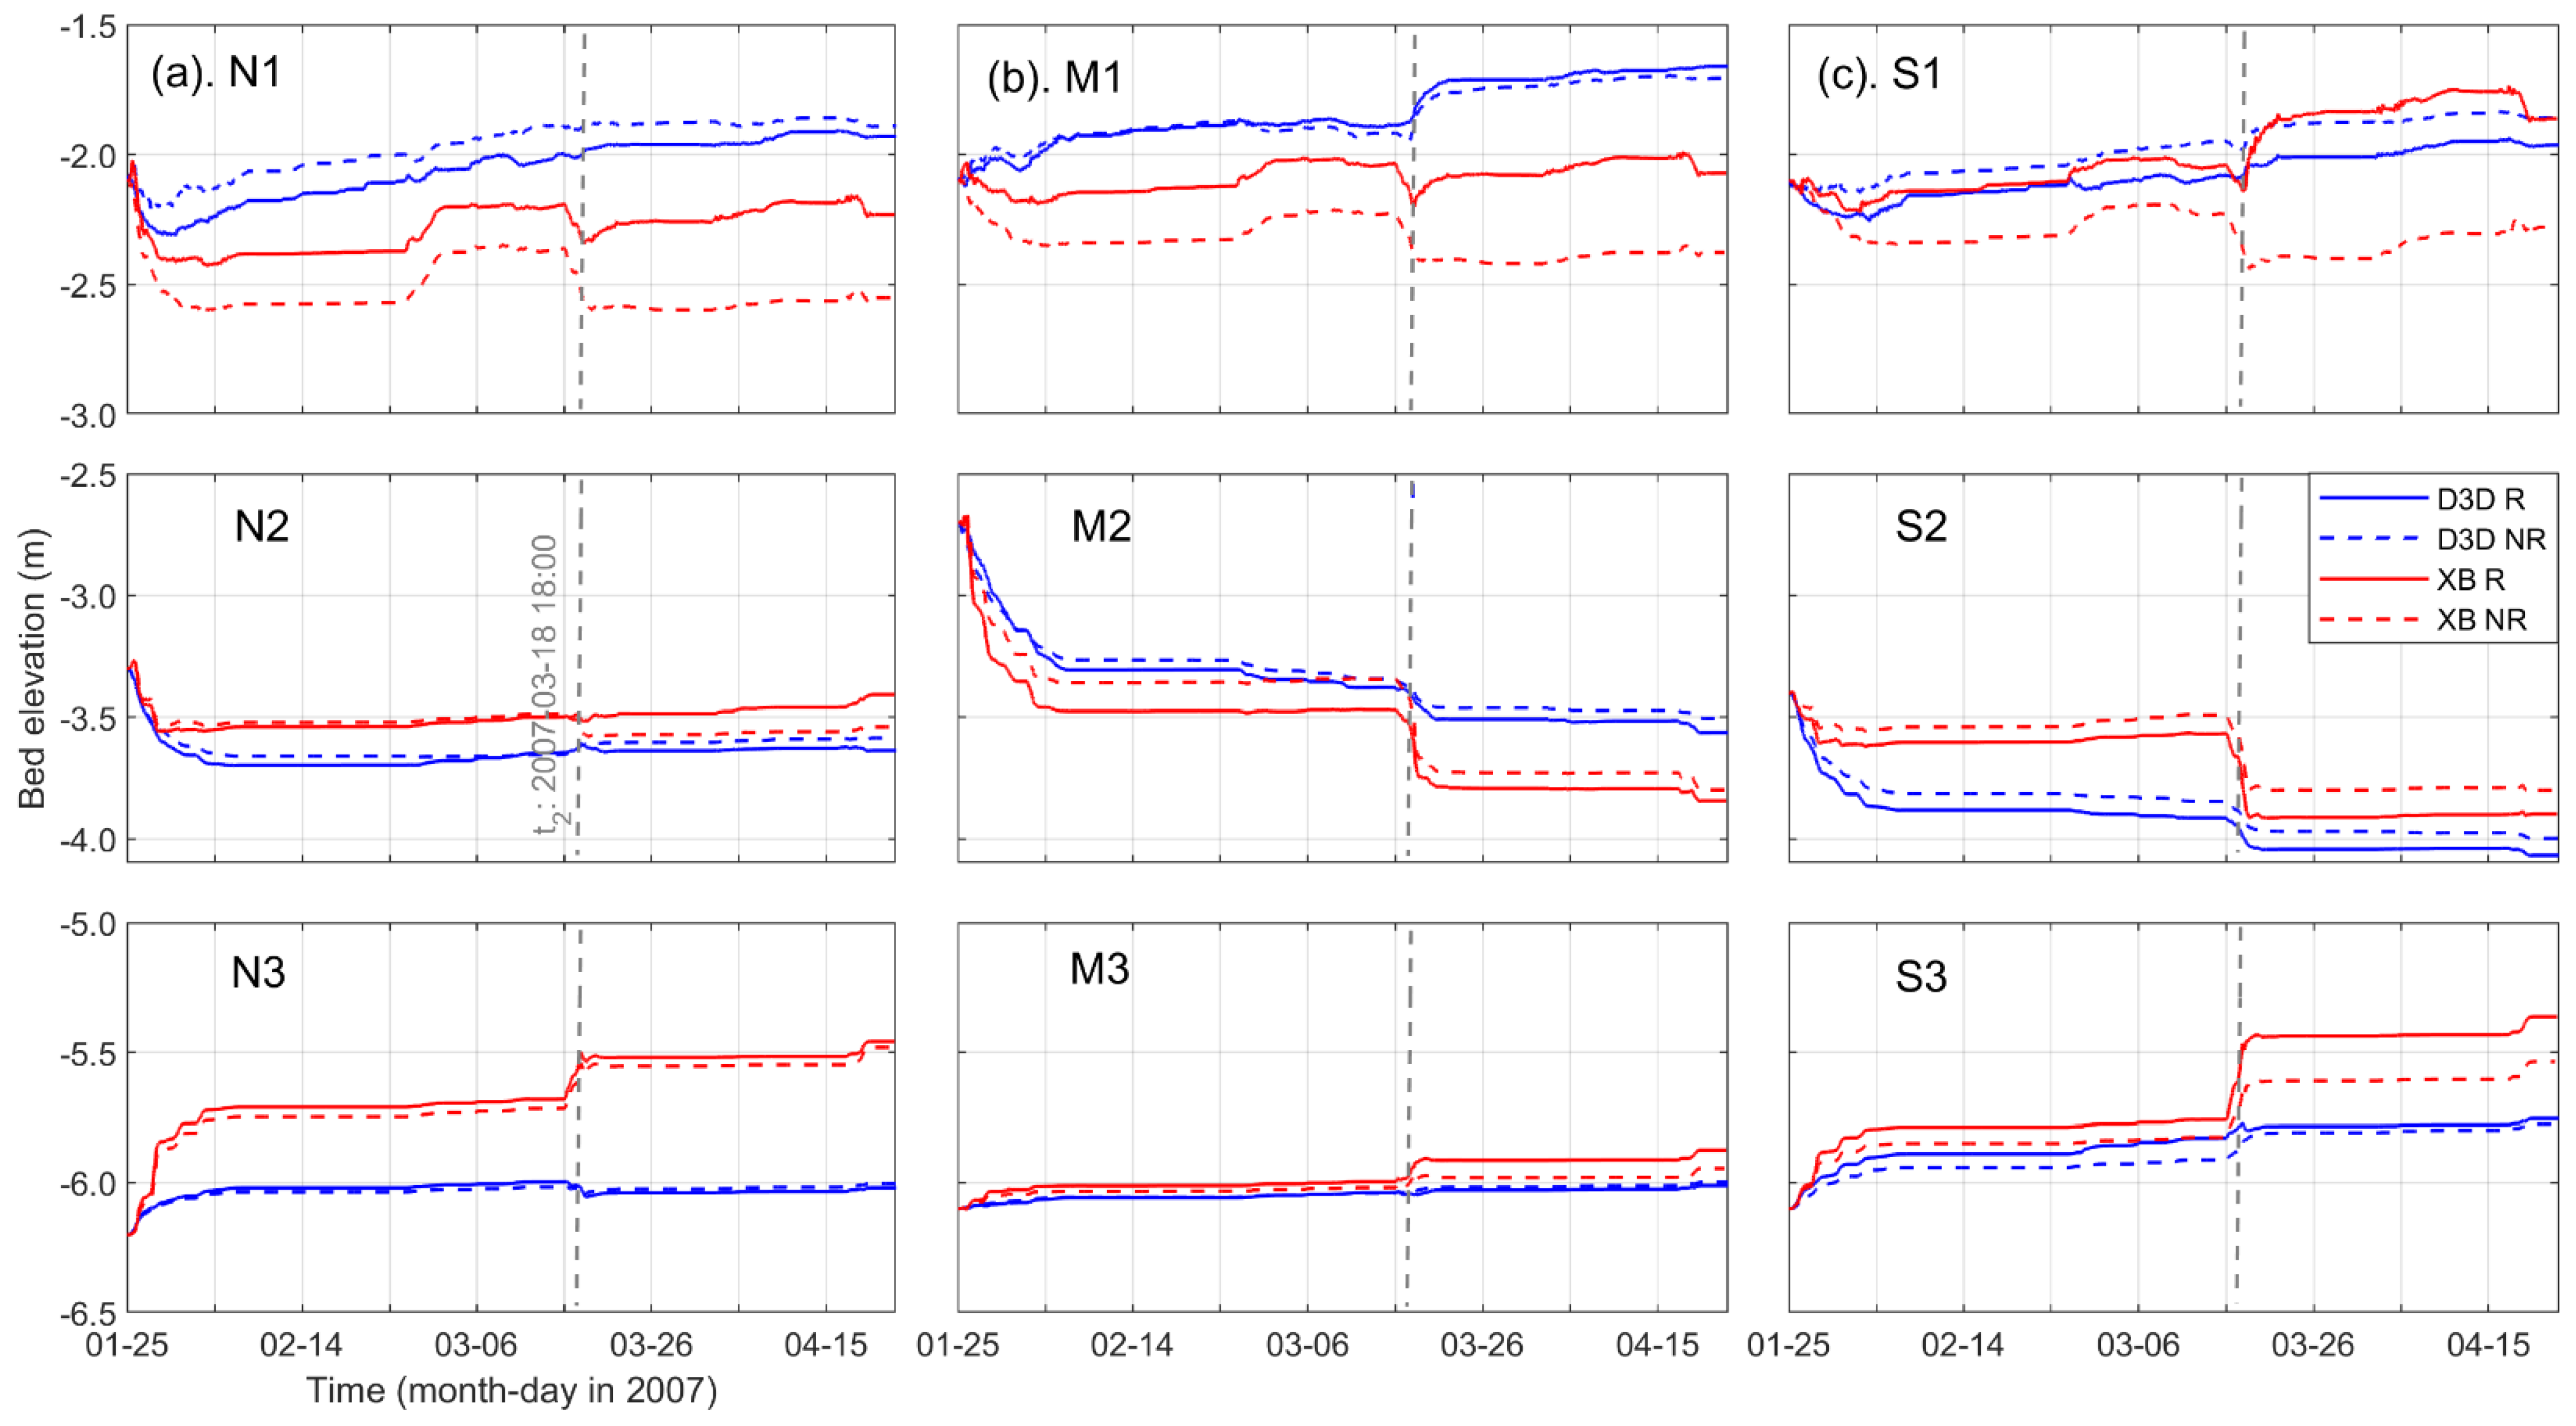
Bed evolution of the analysis points varies depending on their cross-shore locations (Figure 11). The impact of the storm waves on the bed evolution is noticeable at all locations (e.g., at t2). The points located close to the beach (N1, M1 and S1) show the highest impact from the roller dynamics. In D3D, the rate of bed level change increased with the roller application. However, XB R caused a lower rate of bed evolution than D3D R. This could be due to the fact that greater erosion of the dune area provides more sediment to the nearshore zone in XB than in D3D. This process of sediment supply increased in XB R compared with that of XB NR. Therefore, erosion at N1, M1 and S1 in XB R is less than in XB NR. The points on the nearshore bar experience erosion, which increases with the addition of roller dynamics in both models. Erosion due to the storm wave is greater at M2 and S2, where there is a prominent bar feature unlike at N2. The seaward points (N3, M3 and S3) show accretion. In all simulations, the bed evolution at M3 is fairly similar. At N3 and S3, XB resulted in higher accretion than D3D, and that increases with the consideration of the roller dynamics (XB R). Furthermore, the results indicate that the effect of the roller dynamics on bed evolution decreases with distance offshore from the beach into the nearshore.
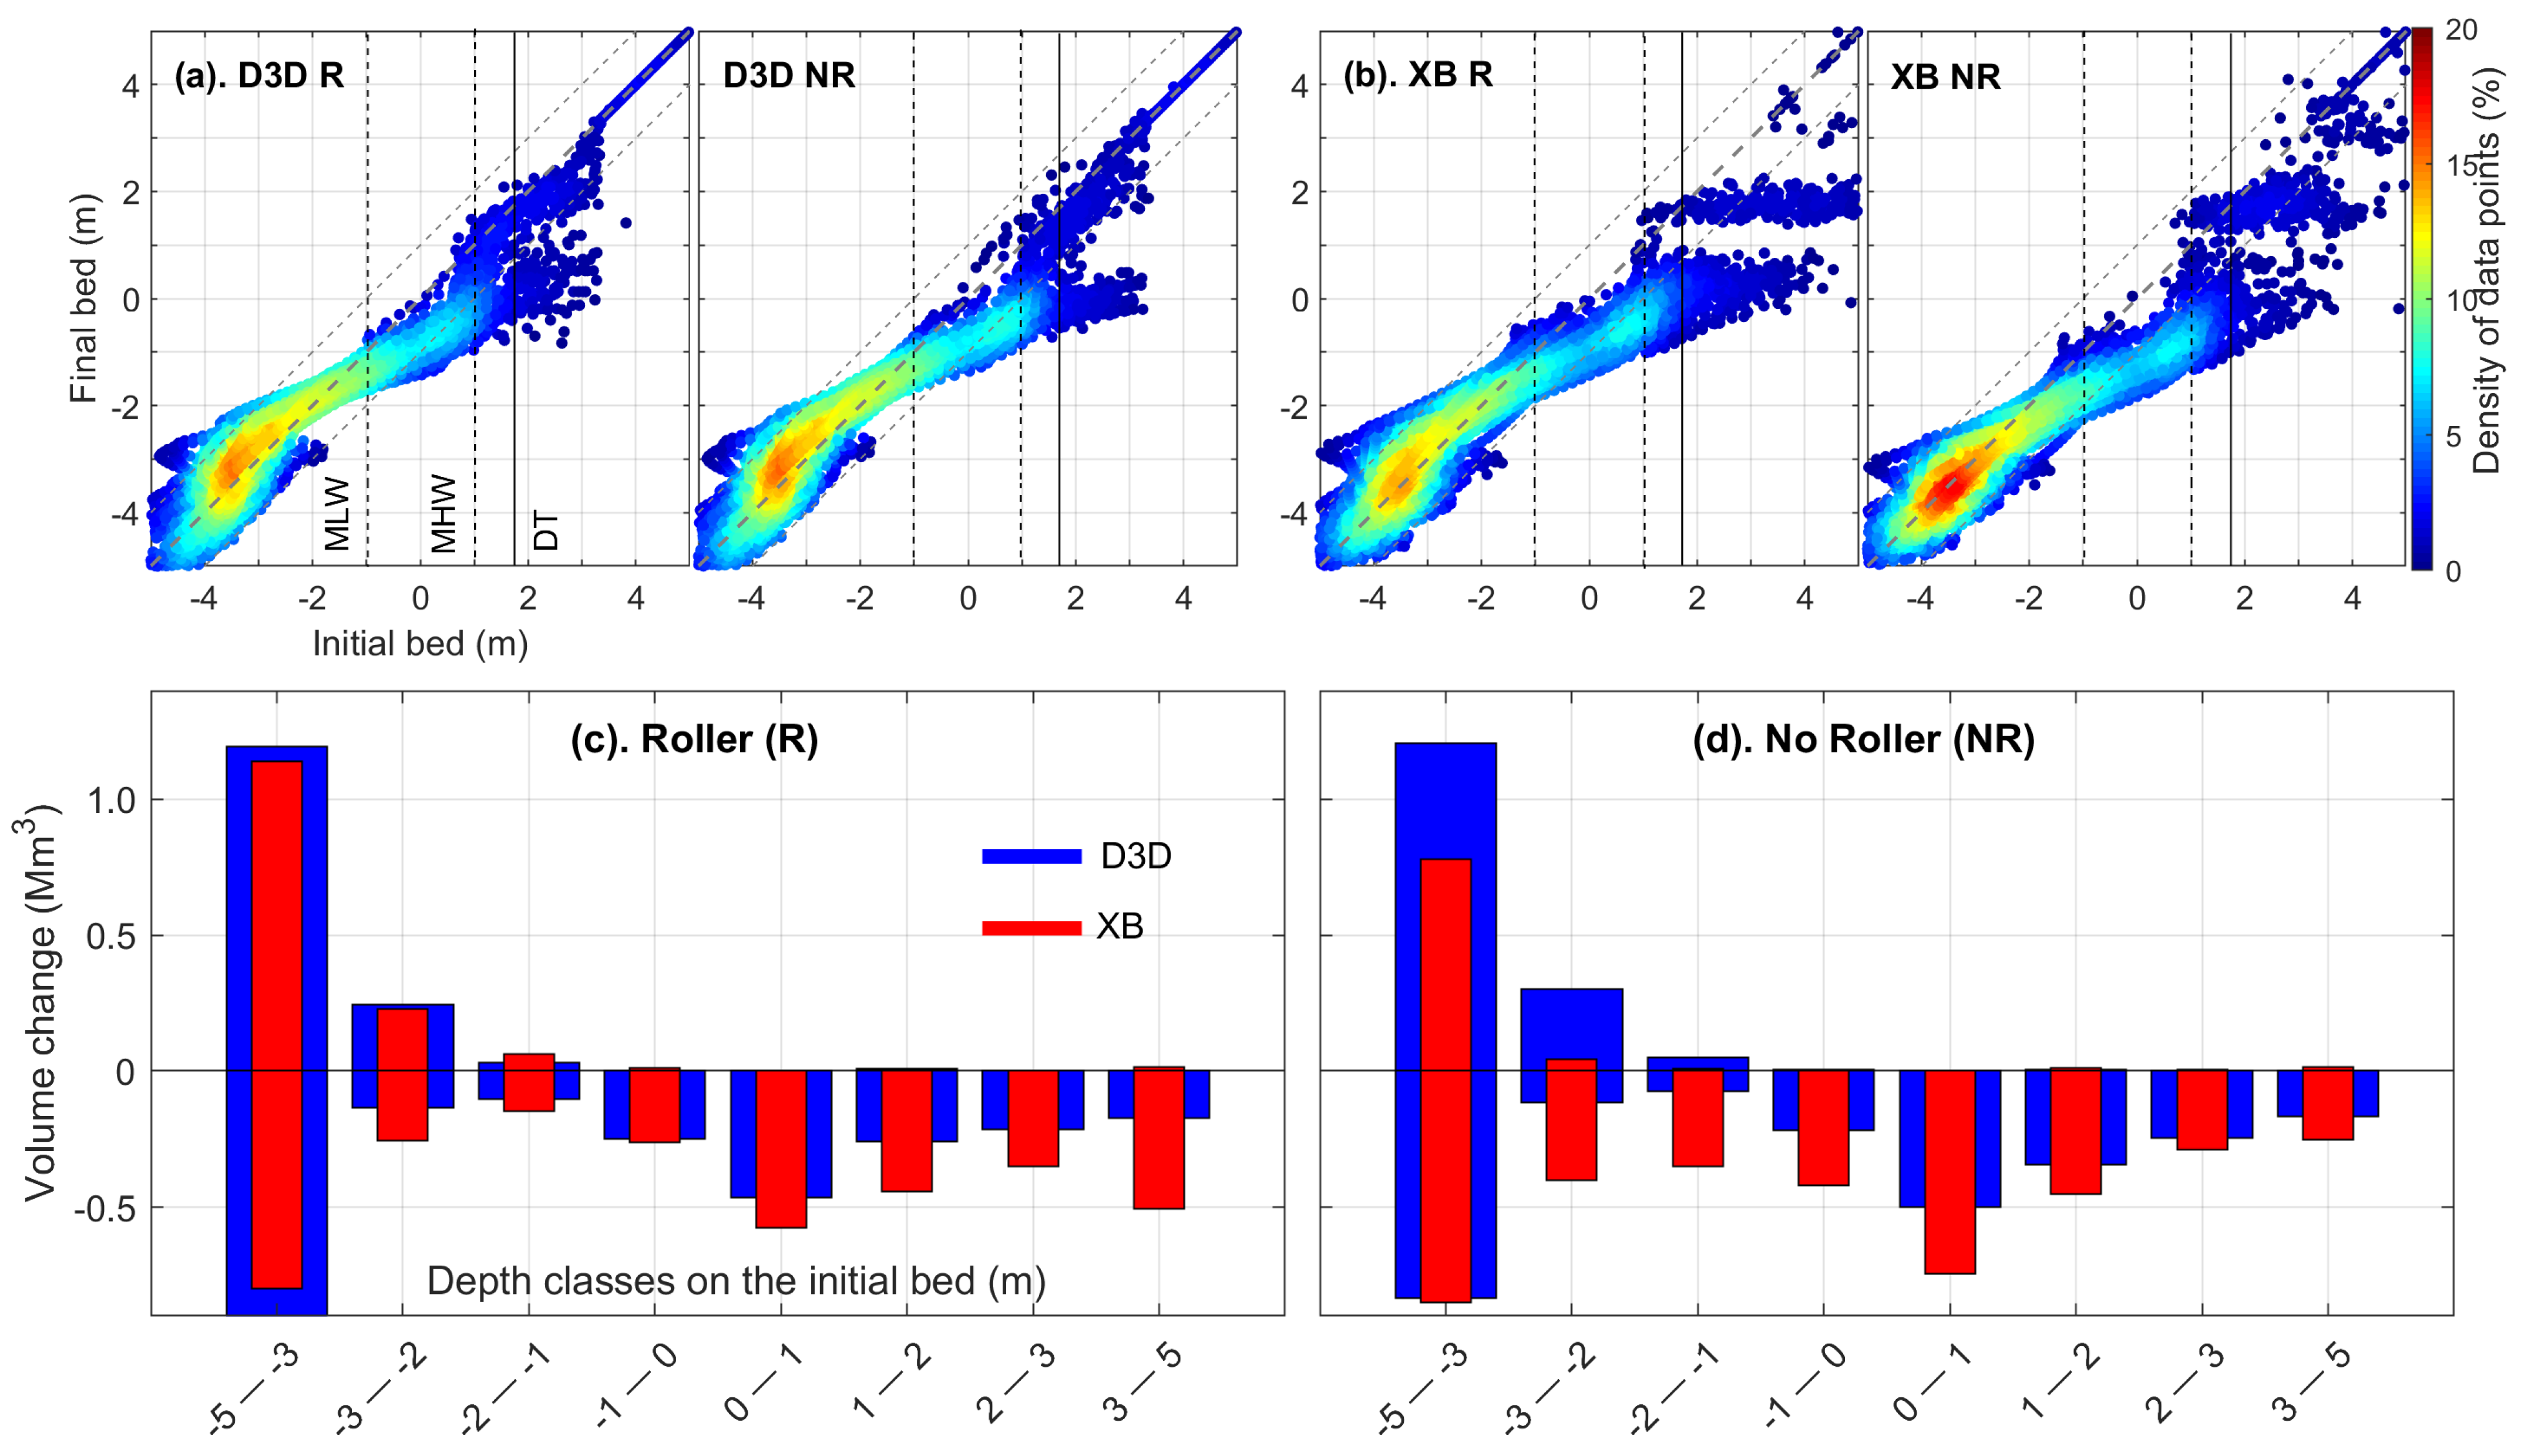
Bed levels and sediment volume were analysed within the cross-shore depth range from 5 to −5 m along the entire coast of the apex domain (Figure 12). The position of the bed level for each model grid point with respect to the line of no bed change (gray-dash-line in upper row) indicates erosion (below) and accretion (above). The area below MLW (Mean Low Water) experienced bed evolution at large number of data points in all simulations (i.e., colour indicates density of data points, %). D3D (a) generally predicts accretion while it decreases from XB R to XB NR (b) (see yellow-red area with respect to the no bed change line). Between MLW and MHW (Mean High Water), erosion is predicted by all simulations. The density of data indicates that higher number of grid points experience erosion in D3D than in XB. Strongest bed evolution occurred above the DT (Dune Toe), and there are marked differences in erosion between R and NR applications, and also between the two models. In D3D, the initial bed levels above 3.5 m elevation are barely changed from the storm impacts. However, the number of erosion points increased with the roller application. Similar observation is found in XB. In particular, XB R generates greater avalanching of the upper dune front (up to ~2 m) and severe erosion at the HW (1 m) contour. It should be noted that the comparison of bed levels from the observation (initial) and the simulations (final) provides an overview of the erosion and accretion pattern. In order to find the sediment volume change, bed level change should be multiplied by the respective grid cell area, which varies in the model domain.
The estimated sediment volumes within the depth classes are stacked for R (c) and NR (d) applications separately. In the R applications, the deepest depth class shows fairly similar erosion and accretion volumes in both models. This trend generally continues up to the MSL contour. From MSL to the dunes, XB shows greater erosion than D3D, and that increases as the elevation increases. It is clearly shown that D3D cannot produce the same dune erosion as in XB (see depth class: 3–5 m) when the roller dynamics and avalanching are considered. In the NR applications, the difference of erosion volume between the models generally increases in the area below MHW. In D3D NR, the erosion volume decreases from nearshore up to MSL compared with that of the R application. For the dune area (above 2 m), there is no significant difference between R and NR applications in D3D. However, XB shows that the R application results in the highest erosion. Therefore, the XB dune response estimate to storm waves is sensitive to the application of the roller dynamics, and in D3D nearshore erosion is sensitive.
The roller effect on storm erosion in each model is summarised by estimating the mean-relative-change of erosion volume with respect to the erosion in the NR application (Table 9). In D3D, the roller dynamics caused increased erosion from the nearshore up to MSL and at the dune (depth class: 3–5 m). However, the area above MSL and below 3 m experienced lower erosion than the NR application. This could be partly due to redistribution of the avalanched sediment from the upper dune area. In XB, the R application resulted in significant erosion at the dune, whereas lower erosion in the other depth classes compared with the NR application. Strong avalanching of sediment at the upper dune provides more sediment to lower depth classes causing the lower erosion. These results suggest that the roller effect in D3D increases dune erosion. Nevertheless, it is very low compared with that of XB.

5. Discussion

This study investigated the effect of roller dynamics (i.e., short wave averaged long wave forcing) on nearshore hydrodynamics and storm erosion by simulating the beach and dune evolution of the Sylt island using two open source morphological models, Delft3D (D3D) and XBeach (XB). D3D computes the roller effect with an add-on module, while it is a primary process in XB. In D3D, the roller effect on hydrodynamics has been evaluated [13,14,35], whereas there has been less concern on the morphodynamics across entire coast [15,35,44]. XB is always applied with the roller effect to estimate storm erosion of a beach and dune system [2,16,17]. This raises the question, whether the D3D roller can predict comparable storm erosion as in XB. To this end, we simulated storm erosion at the beach and dune over a storm period from 25 January to 26 April 2007. Results indicated the roller dynamics impact on both the hydrodynamics and the storm erosion in the two models.

5.1. Hydrodynamics

The model skill at predicting hydrodynamics was verified by comparing measured and simulated wave characteristics at W2 (Figure 1b), which was at 8 m water depth. The maximum wave height at this location was only 2.6 m during the analysis period. Therefore, the W2 buoy captured waves prior to breaking. Hence, the verification of wave heights at this location is equally appropriate for both roller and no roller applications. For the hydrodynamic simulations, similar values were applied for the numerical parameters in both models (e.g., bed roughness, see in Appendix A). Results of D3D NR and XB R being the standard applications were used to compare with the measured wave data. Predicted waves in D3D (i.e., the SWAN computation) showed a reasonable agreement with the measured data (R2 = 0.91, RMSE = 0.14 m and µ = −0.03 in Table 5), although it does overpredict (in agreement with Boyd and Weaver [45]). The study period covered a range of wave conditions (Figure 2b). Our results indicated generally high and low waves during measured low and high waves respectively. XB showed a greater difference in wave prediction than D3D. This is expected due to the schematised approach of wave computation [10,11]. Therefore, tuning model parameters to get a high agreement with the measured waves is not plausible.
The roller effect showed different impacts on hydrodynamics in both models. In D3D, the roller application caused increased wave conditions and velocities. The roller uses wave dissipation energy by breaking as a source for the computation of the short wave effects on long wave forcing. Therefore, the roller dynamics predict high effects on long wave during the breaking of short waves and no effects during non-breaking short waves (e.g., Hs < 0.5 m). With the roller dynamics, the total wave force by short waves and short wave averaged effect on long waves, which contributes to the momentum computation, increases (see Equations (4) and (5)). This results in increased water levels and velocities in the nearshore area. Hsu et al. [13,14] also showed that an increase of nearshore hydrodynamics occurred by including the roller model. Alongshore wave heights and velocities in XB indicated that the difference between the R and NR applications is marginal. XB computes the long wave oscillation across the entire domain and that appears to dominate over the roller effect in the nearshore area. Difference in wave computation is mainly based on the schematised approach in XB [10,11] compared to D3D [25]. These results indicated that the roller effect on hydrodynamics is higher in D3D than in XB.

5.2. Sensitivity of Roller Parameters

Suitable values for the roller parameters (Beta, Gamdis and F_lam) were selected through a sensitivity analysis, while applying the same values for other parameters (see Appendix A). For example, the bottom friction in the wave energy dissipation was set to zero in both models. Bottom friction is not important for wave energy dissipation in the surf zone because the main process is wave breaking [46].
Beta determines the rate of wave energy transfer between the roller and the underlying water. The beach profile evolution showed that low values cause higher erosion above MSL, and the sensitivity is higher in XB than D3D (Figure 8). These results were further evident within the erosion volume (Figure 9). All applications resulted in strong flattening of the nearshore bar, on which strong wave breaking can be expected (e.g., at peak storm wave, Figure 6). Brière and Walstra [31] and Walstra et al. [35] showed that bar flattening increases significantly for higher values (>0.1). Therefore, higher roller energy dissipation causes strong bar flattening, but lower impact to the beach and dune area as found with the present results. Beta has a considerable impact on the cross-shore evolution. It can be used to tune the roller model as shown by Giardino et al. [46]. A value of 0.2 provided comparable erosion volume in both models compared to the measured data.
Gamdis controls the wave energy dissipation by breaking in the surf zone. D3D predicted less profile erosion with the constant value (0.55) than the depth varying values [32]. In XB, the three breaker formulas (i.e., suitable for the here on used surf-beat version [30,33]) applied showed greater erosion along the profiles than D3D. Both the constant value setting in D3D and the use of roelvink1 [30] in XB had the same erosion volumes because the D3D constant value has been estimated based on the Roelvink [30] wave propagation model, which describes variations on the time-scale of wave groups. Walstra et al. [35] compared the bed evolution in D3D between a series of constant values and the depth varying expression of Ruessink et al. [32]. Large constant values resulted in low wave breaking on the bar leading to a pronounce bar, as in the depth varying expression. In Figure 9, the erosion volume of the depth varying expression (i.e., −1) showed a good agreement with the data, better than the constant application.
F_lam imposes a delay distance for the actual start and stop of wave breaking [34]. The profile evolution showed a low sensitivity compared to the previous parameters in both models. However, D3D predicted a greater erosion volume with the breaker delay than without, while there is no considerable difference in XB between the two applications. Walstra [45] showed that the breaker delay generally improves the wave prediction during swell conditions whereas it leads to an overprediction during wind sea conditions. Our analysis is based on a storm period, and the effect of breaker delay overpredicts wave heights leading to a greater erosion volume. Analysis of the cross-shore profile after one year, Walstra et al. [35] showed that there is a marginal impact of breaker delay on the profile evolution. Furthermore, Roelvink et al. [34] found, exclusion of breaker delay does not lead to an improved bar response. The XB results agree with these investigations. F_lam is not suitable to use as a tuning parameter for the roller model, particularly in analysing storm erosion. Therefore, we carried out simulations without applying the breaker delay in both models.

5.3. Roller Effect on Storm Erosion

Storm erosion over the analysis period showed different roller impacts in both models. All simulations produced cross-shore variations in erosion (above MSL and on the nearshore bar) and sedimentation (nearshore runnel and seaward of the bar). These patterns in D3D are less prominent than in XB.
In D3D, there is no considerable difference in the erosion and sedimentation pattern between the R and NR applications. However, the erosion volumes within the depth classes indicated that the roller application caused higher erosion below MSL than the no roller application. As discussed earlier, the nearshore hydrodynamics increase with the roller dynamics [13,14,35]. Therefore, increased sediment transport in the roller application can be expected, causing relatively large erosion. Above MSL, the no roller application generally produced greater erosion compared with the roller application. This suggests that the no roller application has more wave energy approaching the upper beach, while dissipation of wave energy in the nearshore area is strong in the roller application. Therefore, applying roller dynamics in D3D increases storm erosion in the nearshore and decreases storm erosion in the upper beach area.
In contrast to D3D, the erosion and sedimentation pattern in XB showed significant difference between the two applications. In the nearshore area, the roller application produced more sedimentation than the no roller application. In the upper beach area (up to the dunes), the roller application resulted in strong erosion compared with the no roller application (e.g., at the dunes: 3–5 m elevation, ~100%: Table 9). Strong erosion, particularly at the dunes, occurred due to the impact of the estimated long wave oscillation causing avalanching of the dune front [2,4]. The eroded sediment is removed to the nearshore area by the undertow resulting in progressive erosion of the upper beach area and sedimentation in the nearshore area [10,11]. Therefore, the roller model has an important role in computing storm erosion in XB.
Different model physics in D3D and XB contributed to the difference in storm erosion predictions although both models apply the roller dynamics. Besides the roller dynamics, XB computes long wave oscillations across the entire domain. Furthermore, the undertow facilitates progressive erosion [11]. These processes are not estimated in D3D [12]. On contrary to XB, the computation of avalanching in D3D seems to be limited to the inundated area. As hypothesised, the hydrodynamics in D3D increased with the roller dynamics leading to increase erosion below MSL, and at the upper dune (3–5 m) although very low compared with XB. However, the area above MSL and below 3 m showed lower erosion than the no roller application.

5.4. Model Applications

In general, both models can be applied to investigate storm erosion. Besides short-term storm scale applications, D3D is used in long-term decadal scales to investigate climate change impacts and morphodynamic evolution of coastal systems [37,47,48]. Application of the roller dynamics in D3D increased the nearshore hydrodynamics. Previous studies with the roller effect have shown better prediction of nearshore currents and waves [13,14], and bar morphodynamics [15,35,45]. Therefore, D3D R is thought to be suitable to investigate nearshore dynamics. D3D NR (the standard application) predicted greater storm erosion in the upper beach area, albeit rather small. XB R (standard application) estimated morphological changes along the entire cross-shore profile [2,16,17]. Both models predicted strong bar flattening, and no bar recovery after storm impact. Therefore, different (time varying) parameter settings for wave dynamics and sediment transport are required for long period simulation depending on the conditions (calm and stormy). Such a modelling approach could be used to understand the beach response between bathymetry surveys, which are generally separated by periods of at least a few months.

6. Conclusions

The effect of roller dynamics on storm erosion on the beach and dune system of the Sylt island was investigated using Delft3D and XBeach. Simulated wave heights in Delft3D No Roller (standard application) produced a reasonable agreement with the measured data. Wave heights of XB Roller (standard application) had a considerable difference with the observations. Including the roller dynamics in Delft3D caused increased hydrodynamics in the nearshore area, while turning these processes off in XBeach had marginal impact. Suitable roller parameters for both models were selected by a sensitivity analysis comparing simulated and measured erosion volumes. In Delft3D, the nearshore morphodynamics increased applying the roller dynamics. However, there was no increase in the upper beach erosion. In contrast, XBeach predicted storm erosion across the entire cross-shore profile, and showed the impact of including the roller dynamics.
Our results conclude, both models are generally able to produce storm erosion depending on the cross-shore area of interest. However, an alternative (time-varying) calibration parameters for wave dynamics and sediment transport are required to simulate calm and storm conditions in both models for coastal systems with intertidal bars to capture the intermittent beach recovery processes. Using the models to understand the evolution processes over different months could support the planning of storm erosion mitigation measures (e.g., sand nourishment volume), thus increasing the effectiveness of the selected coastal management strategy.

Author Contributions

Conceptualization and methodology, P.D. and J.B.; software, formal analysis, validation, investigation, resources, data curation, writing—original draft preparation, P.D.; writing—review and editing, P.D. and J.B.; visualization, supervision, project administration, funding acquisition, P.D. All authors have read and agreed to the published version of the manuscript.

Funding

This research was funded by German Research Foundation (DFG), grant number DI 2139/2-1 and the APC was funded by the same grant.

Institutional Review Board Statement

Not applicable.

Informed Consent Statement

Not applicable.

Data Availability Statement

Not applicable.

Acknowledgments

This study is part of the MoDECS (Modification of Dune Erosion by adjacent Coastal Systems) project funded by German Research Foundation (DFG) under the grant number DI 2139/2-1. Authors greatly acknowledge Christian Winter for providing access to the field data. The Federal Agency for Waterways and Shipping (WSV), the Federal Institute of Hydrology (BfG), the Federal Agency for Maritime and Hydrographic (BSH), the local agency for coastal protection (LKN) and German Weather Service (DWD) are greatly acknowledged for providing field and environmental forcing data.

Conflicts of Interest

The authors declare no conflict of interest.

Appendix A

Table A1. Comparison of processes and applied model parameters in Delft3D and XBeach.
ProcessDelft3DXBeach
HydrodynamicsWave model Stationary (SWAN),
Non-Stationary (Roller)
Non-Stationary (Surfbeat)
Wave from model nesting×
Short-wave at boundary
Long-wave at boundary×
Short-wave spectrumJonswapJonswap
Lateral wave boundary×wavecrest
Wave computationDirection/frequency Direction domain only
Wave breaking index0.73 (SWAN), −1 (Roller)roelvink1
Lateral flow boundaryNeumannNeumann
Wave current interaction
Bed friction—flowC = 55 m1/2/s55 m1/2/s
Bed friction—wave: SWAN0.067 m2/s−3×
Bed friction—wave: Roller (fw)00
Roller dissipation coefficient (αrol)11
Time step6 sCFL = 0.7
Communication with wave30 minin-build
Min. depth for Undertow (hmin)×0.2 m
Horizontal eddy viscosity0.1 m2/s0.1 m2/s
Horizontal eddy diffusivity1.0 m2/s1.0 m2/s
Sediment transportBed SedimentSingle fraction (300 µm)Single fraction (300 µm)
Sediment layer5 m5 m
Transport formulaSoulsby-Van RijnSoulsby-Van Rijn
Bed slopeαbs = 1, αbn = 1.5roelvink_total
Effect of wave Asymmetryfsusw = 1, fbedw = 1fAs = 0.1
Effect of wave Skewness×fSk = 0.1
Morphological changesMorphological accelerationmorfac = 1morfac = 1
morfac option×1
Avalanchingwetslope = 0.3wetslope = 0.3, dryslope = 1
Avalanching time1 day×
Dry Cell erosion (ThetSD)1-

References

  1. Harley, M.D.; Ciavola, P. Managing local coastal inundation risk using real-time forecasts and artificial dune placements. Coast. Eng. 2013, 77, 77–90. [Google Scholar] [CrossRef]
  2. Dissanayake, P.; Brown, J.; Sibbertsen, P.; Winter, C. Using a two-step framework for the investigation of storm impacted beach and dune erosion. Coast. Eng. 2021, 168, 103939. [Google Scholar] [CrossRef]
  3. Kron, W. Coasts: The high-risk areas of the world. Nat. Hazards 2013, 66, 1363–1382. [Google Scholar] [CrossRef]
  4. Dissanayake, P.; Brown, J.; Wisse, P.; Karunarathna, H. Effect of storm clustering on beach and dune evolution. Mar. Geol. 2015, 370, 63–75. [Google Scholar] [CrossRef]
  5. Huang, S.Y.; Yen, J.Y.; Wu, B.L.; Shih, N.W. Field observations of sediment transport across the rocky coast of east Taiwan: Impacts of extreme waves on the coastal morphology by Typhoon Soudelor. Mar. Geol. 2020, 421, 106088. [Google Scholar] [CrossRef]
  6. McGranahan, G.; Balk, D.; Anderson, B. The rising tide: Assessing the risks of climate change and human settlements in low elevation coastal zones. Environ. Urban 2007, 19, 17–37. [Google Scholar] [CrossRef]
  7. Neumann, B.; Vafeidis, A.T.; Zimmermann, J.; Nicholls, R.J. Future coastal population growth and exposure to sea-level rise and coastal flooding—A global assessment. PLoS ONE 2015, 10, e0131375. [Google Scholar] [CrossRef] [Green Version]
  8. De Jong, F.; Bakker, J.F.; van Berkel, C.J.M.; Dankers, N.M.J.A.; Dahl, K.; Gätje, C.; Marencic, H.; Potel, P. Wadden Sea Quality Status Report, 1999; Wadden Sea Ecosystem No. 9; Common Wadden Sea Secretariat, Trilateral Monitoring and Assessment Group, Quality Status Report Group: Wilhelmshaven, Germany, 1999. [Google Scholar]
  9. Sallenger, A. Storm impact scale for barrier islands. J. Coast. Res. 2000, 16, 890–895. [Google Scholar]
  10. Roelvink, D.; McCall, R.; Mehvar, S.; Nederhoff, K. Improving predictions of swash dynamics in XBeach: The role of groupiness and incident-band runup. Coast. Eng. 2018, 134, 103–123. [Google Scholar] [CrossRef]
  11. Roelvink, D.; Reniers, A.; van Dongeren, A.; van Thiel de Vries, J.; McCall, R.; Lescinski, J. Modelling storm impacts on beaches, dunes and barrier islands. Coast. Eng. 2009, 56, 1133–1152. [Google Scholar] [CrossRef]
  12. Lesser, G.; Roelvink, J.A.; van Kester, J.A.T.M.; Stelling, G.S. Development and validation of a three-dimensional morphological model. Coast. Eng. 2004, 51, 883–915. [Google Scholar] [CrossRef]
  13. Hsu, Y.L.; Dykes, J.D.; Allard, R.A. Evaluation of Delft3D Performance in Nearshore Flows; MS 39529-5004, NRL/MR/7320-06-8984; Naval Research Laboratory: Stennis Space Center, Hancock, MI, USA, 2006. [Google Scholar]
  14. Hsu, Y.L.; Dykes, J.D.; Allard, R.A. Validation Test Report for Delft3D; MS 39529-5004, NRL/MR/7320-08-9079; Naval Research Laboratory: Stennis Space Center, Hancock, MI, USA, 2008. [Google Scholar]
  15. Giardino, A.; Van der Werf, J.; Van Ormondt, M. Simulating Coastal Morphodynamics with Delft3D: Case Study Egmond aan Zee, Deltares Delft Hydraulics; 1200635-005; Deltares: Delft, The Netherlands, 2010. [Google Scholar]
  16. Smallegan, S.M.; Irish, J.L.; Van Dongeren, A.R.; Den Bieman, J.P. Morphological response of a sandy barrier island with a buried seawall during Hurricane Sandy. Coast. Eng. 2016, 110, 102–110. [Google Scholar] [CrossRef] [Green Version]
  17. Kalligeris, N.; Smit, P.B.; Ludka, B.C.; Guza, R.T.; Gallien, T.W. Calibration and assessment of process-based numerical models for beach profile evolution in southern California. Coast. Eng. 2020, 158, 103650. [Google Scholar] [CrossRef] [Green Version]
  18. Blossier, B.; Bryan, K.R.; Daly, C.J.; Winter, C. Spatial and temporal scales of shoreline morphodynamics derived from video camera observations for the island of Sylt, German Wadden Sea. Geo Mar. Lett. 2017, 37, 111–123. [Google Scholar] [CrossRef]
  19. Dissanayake, P.; Winter, C. Modelling the coastline orientation on storm erosion at the Sylt island, North Sea. In Proceedings of the Virtual Conference of Coastal Engineering, Sydney, Australia, 6–9 October 2020; Volume 36, p. 20. [Google Scholar]
  20. Ahrendt, K. Expected effect of climate change of Sylt island: Results from a multidisciplinary German project. Clim. Res. 2001, 18, 141–146. [Google Scholar] [CrossRef]
  21. Chu, K.; Winter, C.; Hebbeln, D.; Schulz, M. Improvement of morphodynamic modelling of tidal channel migration by nudging. Coast. Eng. 2013, 77, 1–13. [Google Scholar] [CrossRef]
  22. Van Ormondt, M.; Nelson, T.R.; Hapke, C.J.; Roelvink, D. Morphodynamic modelling of the wilderness breach, Fire Island, New York. Part I: Model set-up and validation. Coast. Eng. 2020, 157, 103621. [Google Scholar] [CrossRef]
  23. Stelling, G.S. On the construction of computational methods for shallow water flow problem. In Rijkswaterstaat Communications; Governing Printing Office: Hague, The Netherlands, 1984; Volume 35. [Google Scholar]
  24. Stelling, G.S.; Lendertse, J.J. Approximation of Convective Processes by Cyclic ACI methods. In Proceedings of the 2nd ASCE Conference on Estuarine and Coastal Modelling, Tampa, FL, USA, 13–15 November 1991. [Google Scholar]
  25. Booij, N.; Ris, R.C.; Holthuijsen, L.H. A third-generation wave model for coastal regions, Part I, Model description and validation. J. Geophys. Res. 1999, 104, 7649–7666. [Google Scholar] [CrossRef] [Green Version]
  26. Soulsby, R. Dynamics of marine sands, A manual for practical applications. Oceanogr. Lit. Rev. 1997, 9, 947. [Google Scholar]
  27. Holthuijsen, L.H.; Booij, N.; Herbers, T.H.C. A prediction model for stationary short-crested waves in shallow water with ambient currents. Coast. Eng. 1989, 13, 23–54. [Google Scholar] [CrossRef]
  28. Stelling, G.S.; Duinmeijer, S.P.A. A staggered conservative scheme for every Froude number in rapidly varied shallow water flows. Int. J. Numer. Methods Fluids 2003, 43, 1329–1354. [Google Scholar] [CrossRef]
  29. Ruggiero, P.; Walstra, D.J.R.; Gelfenbaum, G.; van Ormondt, M. Seasonal-scale nearshore morphological evolution: Field observations and numerical modeling. Coast. Eng. 2009, 56, 1153–1172. [Google Scholar] [CrossRef]
  30. Roelvink, J.A. Dissipation in random wave groups incident on a beach. Coast. Eng. 1993, 19, 127–150. [Google Scholar] [CrossRef]
  31. Brière, C.; Walstra, D.J.R. Modelling of Bar Dynamics; Report Z4099; WLlDelft Hydraulics: Delft, The Netherlands, 2006. [Google Scholar]
  32. Ruessink, B.G.; Walstra, D.J.R.; Southgate, H.N. Calibration and verification of a parametric wave model on barred beaches. Coast. Eng. 2003, 48, 139–149. [Google Scholar] [CrossRef]
  33. Daly, C.; Roelvink, J.A.; Van Dongeren, A.R.; Van Thiel de Vries, J.S.M.; McCall, R.T. Short wave breaking effects on low frequency waves. In Proceedings of the 32th International Conference on Coastal Engineering, Shanghai, China, 30 June–5 July 2010; pp. 1–13. [Google Scholar]
  34. Roelvink, J.A.; Meijer, T.J.G.P.; Houwman, K.; Bakker, R.; Spanhoff, R. Field validation and application of a coastal profile model. In Proceedings of the Coastal Dynamics Conference, Gdansk, Poland, 4–8 September 1995; pp. 818–828. [Google Scholar]
  35. Walstra, D.J.R.; Van Ormondt, M.; Roelvink, J.A. Shoreface Nourishment Scenarios; WL|Delft Hydraulics Report Z3748.21; Deltares: Delft, The Netherlands, 2004. [Google Scholar]
  36. Dissanayake, D.M.P.K. Modelling Morphological Response of Large Tidal Inlet Systems to Sea Level Rise; Taylor & Francis Group, CRC Press/Balkema: Leiden, The Netherlands, 2011; ISBN 978-0-415-62100-7. [Google Scholar]
  37. Dissanayake, P.; Yates, M.L.; Suanez, S.; Floc’h, F.; Krämer, K. Climate Change impacts on coastal wave dynamics at Vougot Beach, France. J. Mar. Sci. Eng. 2021, 9, 1009. [Google Scholar] [CrossRef]
  38. Donelan, M.A.; Hamilton, H.; Hui, W.H. Directional spectra of wind-generated waves. Philos. Trans. R. Soc. Lond. A 1985, 315, 509–562. [Google Scholar]
  39. Hasselmann, K.; Barnett, T.P.; Bouws, F.; Carlson, H.; Cartwright, D.E.; Enke, K.; Ewing, J.A.; Gienapp, H.; Hasselmann, D.E.; Krusemann, P.; et al. Measurements of Windwave Growth and Swell Decay during the Joint North Sea Wave Project (JONSWAP); Deutches Hydrographisches Institut, A8: Hamburg, Germany, 1973; pp. 1–95. [Google Scholar]
  40. Goda, Y. Random Seas and Design of Maritime Structures, Advanced series on Ocean Engineering 33, 3rd ed.; World Scientific: Jokohama, Japan, 2010. [Google Scholar]
  41. Fredsøe, J. Turbulent boundary layer in wave-current interaction. J. Hydraul. Eng. 1984, 110, 1103–1120. [Google Scholar] [CrossRef]
  42. Ruessink, B.G.; Miles, J.R.; Feddersen, F.; Guza, R.T.; Elgar, S. Modeling the alongshore current on barred beaches. J. Geophys. Res. 2001, 106, 451–463. [Google Scholar] [CrossRef]
  43. Krause, P.; Boyle, D.P.; Bäse, F. Comparison of different efficiency criteria for hydrological model assessment. Adv. Geosci. 2005, 5, 89–97. [Google Scholar] [CrossRef] [Green Version]
  44. Walstra, D.J.R. Unibest-TC User Guide. Report Z2897; WLlDelft Hydraulics: Delft, The Netherlands, 2000. [Google Scholar]
  45. Boyd, S.C.; Weaver, R.J. Replacing a third-generation wave model with a fetch based parametric solver in coastal estuaries. Estuar. Coast. Shelf Sci. 2021, 251, 107192. [Google Scholar] [CrossRef]
  46. Giardino, A.; Brière, C.; Van der Werf, J. Morphological Modelling of Bar Dynamics with Delft3D, the Quest for Optimal Parameter Settings; 1202345-000; Deltare: Delft, The Netherlands, 2011. [Google Scholar]
  47. Dissanayake, D.M.P.K.; Ranasinghe, R.; Roelvink, J.A. The morphological response of large tidal inlet/basin systems to relative sea level rise. Climate Change 2012, 113, 253–276. [Google Scholar] [CrossRef] [Green Version]
  48. Elmilady, H.; Van der Wegen, M.; Roelvink, D.; Van der Spek, A. Morphodynamic Evolution of a Fringing Sandy Shoal: From Tidal Levees to Sea Level Rise. JGR Earth Surface 2020, 125, e2019JF005397. [Google Scholar] [CrossRef]
Figure 1. Location of Sylt in the German Bight, North Sea (a), the apex- and west-model grids (b), model bathymetry for the west domain with the outline of the apex domain (c), model bathymetry for the apex domain with the selected three cross-shore profiles (North: N, Middle: M and South: S) for the analysis (d), profile N (e), M (f) and S (g) with analysis points: close to beach (1), on top of the bar (2) and seaward of the bar (3). Zoom-out profile views of 1 km are shown for clarity.
Jmse 10 00305 g001
Figure 2. Field data used for the numerical simulations. Total water level (blue line), Astronomical tide (green line) and the derived tidal anomaly (TA, red line) at WL (a), Significant wave height (lines) and direction (+) at W1 (blue) and W2 (red) (b), Wind speed (blue line) and direction (red +) at WN (c) (see observation locations in Figure 1b). Dash-line indicates peak storm wave occurrence at 18:00 h 18 March 2007 (Hs = 5.0 m at W1 and 2.6 m at W2).
Jmse 10 00305 g002
Figure 3. Comparison of the measured significant wave heights (gray at W1 and black at W2) and the simulated wave heights at W2 (blue: D3D Hs, red: XB Hrms and orange: XB Hs) (a), Normalised wave spectral density from the measured wave at W2 (b), and from the simulations at W2, D3D Hs (c), XB Hrms (d) and XB Hs (e). t1 indicates the initial time, t2 is the peak wave occurrence and t3 is the last time point of the W2 data (see data locations in Figure 1b).
Jmse 10 00305 g003
Figure 4. Comparison of simulated wave heights at the time of the peak in storm waves (t2: 18:00 h 18 March 2007, observed Hs 2.6 m at W2) with Roller (R) and No Roller (NR) dynamics: D3D Hs (a), XB Hrms (b) and XB Hs (c). Vectors indicate direction and magnitude, and colour indicates magnitude. N, M and S are the cross-shore profile locations with the selected three points for the analysis. Depth is shown with the contour lines.
Jmse 10 00305 g004
Figure 5. Comparison of depth averaged velocities at the time of the peak in storm waves (t2: 18:00 h 18 March 2007) with Roller (R) and No Roller (NR) dynamics: D3D R (a), D3D NR (b), XB R (c) and XB NR (d). Vectors indicate direction and magnitude, and colour indicates magnitude. N, M and S are the cross-shore profile locations with the selected three points for the analysis. Depth is shown with the contour lines.
Jmse 10 00305 g005
Figure 6. Comparison of hydrodynamics (rows: 1. Water level, 2. Wave height and 3. Velocity) along the three cross-shore profiles (Columns: (a). N, (b). M and (c). S) at the time of the peak storm waves (t2: 18:00 h 18 March 2007). Cross-shore profiles (orange lines) are shown with the analysis points (black circles). First row: Water level, D3D (blue) and XB (red). Solid lines are Roller and dash lines are No Roller results. Second row: Wave height, D3D Hs (blue), XB Hrms (red) and XB Hs (magenta). Third row: Velocity, D3D-Cross-shore (CS) (blue) and XB-Cross-shore (red) with shoreward positive values, D3D-alongshore (LS) (black) and XB-alongshore (magenta) with northward positive values. The second (right) y axis has a different scale than the first for a better visualization.
Jmse 10 00305 g006
Figure 7. Comparison of temporal bed shear stress at the three analysis points (1, 2 and 3: seaward) along the three cross-shore profiles, N (a), M (b) and S (c). First column is D3D (blue) and Second column is XB (red), results of No Roller are shown with gray lines.
Jmse 10 00305 g007
Figure 8. Sensitivity of profile evolution N ((a). first column: D3D and second column: XB), M (b) and S (c) for the roller parameters (rows: 1. Beta, 2. Gamdis and 3. F_lam). Initial (light-blue) and final (red) measured profiles (first two lines) spanning the analysis period from 25 January to 26 April 2007 are shown with the simulated final profile with different parameters (colour lines). Note, linearly interpolated bed levels are used between 0 m (MSL) and −3 m depth due to the lack of measured data.
Jmse 10 00305 g008
Figure 9. Sensitivity of erosion volume between 0 and 5 m elevation over the analysis period for the different values (indicated on the bars) of the roller parameters (Beta, Gamdis and F_lam). The estimated erosion volume from the measured data (black) are shown with the simulated results, D3D (blue) and XB (red).
Jmse 10 00305 g009
Figure 10. Simulated erosion and sedimentation patterns during the analysis period from 25 January to 26 April 2007, D3D Roller (a), D3D No Roller (b), XB Roller (c) and XB No Roller (d). N, M and S indicate the selected cross-shore profile locations, and 1, 2 and 3 are analysis points on the profiles.
Jmse 10 00305 g010
Figure 11. Bed level change (D3D: blue and XB: red) of the analysis points (1, 2 and 3) along the three cross-shore profiles (Columns: N (a), M (b) and S (c)). Results from the Roller (R), with solid-line, and No Roller (NR), with dash-line, are indicated. Occurrence of the peak storm wave height at t2 is shown with gray-dash-line. Note, y-axis depth range differs based on the points’ water depths.
Jmse 10 00305 g011
Figure 12. Simulated bed level (upper-row) and sediment volume change (lower-row) within the cross-shore stretch between 5 to −5 m elevation along the coast, D3D Roller and No Roller (a), XB Roller and No Roller (b), and volume change (erosion: negative and accretion: positive) in Roller applications (c) and No Roller applications (d) in D3D (blue) and XB (red). MLW: Mean Low Water (−1 m), MHW: Mean High Water (1 m) and DT: Dune toe level (1.8 m). Gray-dash-line: no change of bed levels and gray-thin-dash-line: 20% change of bed levels.
Jmse 10 00305 g012
Table 1. Characteristics of the analysis locations along the three profiles.
LocationDistance from MSL (m)Depth (m)
North (N)N1582.1
N22333.3
N34816.2
Middle (M)M1672.1
M22852.7
M35316.1
South (S)S1862.1
S23563.4
S35136.1
Table 2. Main similarities and differences of physical processes in D3D and XB for the roller (R) and no roller (NR) applications. A detailed list of process comparison is provided in Appendix A.
Physical ProcessD3DXB
RNRRNR
Short-wave
Long-wave from offshore××
Long-wave effect from short wave breaking (roller model)××
Wave computationDirectional-Domain
Frequency-Domain××
Undertow××
Avalanching
Table 3. Characteristics of the apex- and west-model domains (Figure 1).
Model DomainSpatial Extent
(Cross Shore × Alongshore in km)
Grid NodesRange of Grid Resolution
(Cross Shore × Alongshore in m)
apex-grid9.8 × 1515,1204–200 × 190–300
west-grid10.2 × 3878578–400 × 400–600
Table 4. Model simulations in D3D and XB for the comparison of hydrodynamics and morphodynamics using Roller (R) and No Roller (NR) applications. Default parameters (reference scenario) are in bold-letter.
ScenarioD3DXBNo. of Simulations
RNRRNR
Hydrodynamics only4
Sensitivity analysisBeta0.10 0.15 8
0.05 0.05
0.20 0.20
0.30 0.30
Gamdis−1 roelvink2 5
0.55 roelvink1
roelvink_daly
F_lam0 1 4
−2 0
Beach and dune erosion4
Table 5. Comparison of measured and simulated wave heights and spectral density from t1 to t3 at W2 (see location in Figure 1b).
SourceWave Height Wave Spectral Density (SD)
R2 (-)RMSE (m) ∑SD (kJ/m2/Hz)µ (-)
Observations (Hs)--8.99-
D3D (Hs)0.910.148.67−0.03
XB (Hrms)0.830.216.47−0.27
XB (Hs)0.830.2612.950.45
Table 6. Comparison of wave height, velocity and bed shear stress during the full analysis period between D3D and XB at the 3 analysis points (1, 2 and 3) along the 3 cross-shore profiles (N, M and S). R: Roller and NR: No Roller simulations. < > indicates average over the analysis period and || indicates magnitude of vectors.
Location<Wave Height>
(m)
<|Velocity|>
(m/s)
<|Bed Shear Stress|> (m/s)
D3D HsXB HrmsXB HsD3DXBD3DXB
RNRRNRRNRRNRRNRRNRRNR
North (N)N10.710.780.650.650.920.920.300.250.260.280.740.540.810.90
N20.790.870.680.680.960.960.200.180.150.150.320.240.320.32
N30.890.970.680.680.960.960.210.200.180.180.240.220.220.22
Middle (M)M10.690.780.660.660.940.940.290.240.230.240.660.480.670.71
M20.760.880.670.670.950.950.220.200.190.190.380.290.280.27
M30.900.990.700.700.990.990.250.240.230.230.330.290.290.29
South (S)S10.660.700.660.660.930.930.280.230.190.200.660.450.570.59
S20.780.840.680.680.960.960.200.180.150.150.350.250.310.31
S30.850.910.690.680.970.970.180.170.160.160.200.160.190.19
Table 7. Root mean square error (RMSE) (m) between measured and simulated profiles from 0 to 5 m elevation at dunes along N, M and S with different roller parameters.
Roller ParameterD3DXB
ValueNMSValueNMS
Beta0.101.690.961.690.151.782.181.46
0.051.831.141.790.051.972.351.55
0.201.540.881.650.201.752.171.41
0.301.510.901.630.301.732.151.43
Gamdis−11.690.961.69roelvink21.782.181.46
0.551.340.671.26roelvink11.661.921.24
roelvink_daly2.012.171.77
F_lam01.690.961.6911.782.181.46
−21.931.321.9001.772.201.44
Table 8. Selected values of the roller parameters for D3D and XB by the sensitivity analysis.
Roller ParameterValue
D3DXB
Beta0.200.20
Gamdis−1.0roelvink1
F_lam0.00.0
Table 9. Mean relative change ( µ ¯ ) of storm erosion with respect to the erosion in the No Roller application of each model within different depth classes.
Depth Class (m)D3DXB
−5 to −30.18−0.06
−3 to −20.15−0.36
−2 to −10.31−0.58
−1 to 00.11−0.38
0 to 1−0.06−0.22
1 to 2−0.22−0.02
2 to 3−0.050.21
3 to 50.130.97
Publisher’s Note: MDPI stays neutral with regard to jurisdictional claims in published maps and institutional affiliations.