Article

Experimental Investigation on the Characteristic of Hydrodynamic-Acoustic Cavitation (HAC)

1
Hubei Key Laboratory of Waterjet Theory and New Technology, Wuhan University, Wuhan 430072, China
2
School of Power and Mechanical Engineering, Wuhan University, Wuhan 430072, China
*
Author to whom correspondence should be addressed.
J. Mar. Sci. Eng. 2022, 10(3), 309; https://doi.org/10.3390/jmse10030309
Submission received: 20 December 2021 / Revised: 5 February 2022 / Accepted: 18 February 2022 / Published: 22 February 2022
(This article belongs to the Section Physical Oceanography)

Abstract

:
This study aimed to investigate the Cavitation dynamics of Hydrodynamic-acoustic cavitation by employing experimental methods. The spatial distribution of cavitation clouds, the temporal and spatial distribution achieved by cavitation clouds, and the main flow structure in the flow field were extracted and analyzed by complying with the cavitating flow image captured with the high-speed camera. As indicated from the results, the widened cavitation region and the strength of cavitation under the synergy of ultrasound were reported. When the inlet pressure is 2 MPa, the average value of the volume-averaging cavitation intensity variable is 0.029, 0.058, and 0.092, respectively, and the corresponding growth rate is 95% and 58.5%. By adopting the Proper Orthogonal Decomposition method (POD), the ultrasound was revealed to primarily enhance the cavitation intensity by downregulating the cavitation threshold other than altering the large-scale vortex structure in the flow field. The high-frequency pressure pulsation of ultrasound strengthened the instability exhibited by the shear layer and induced small-scale vortex structures at the shear layer, which was suggested to be the more violently shed and collapse.

1. Introduction

In recent years, cavitation technology has been well applied in the fields of environmental protection, materials science, and bioengineering [1,2]. It has become an advanced technology that is being further developed and gradually introduced into the petroleum industry [3,4,5]. On the whole, cavitation refers to the formation, growth, and collapse of vapor cavities in the fluid, which has been extensively identified in hydraulic engineering [6,7,8]. The drop of local hydrostatic pressure in the liquid is recognized as the major approach for inducing the occurrence of cavitation, which is generally defined as hydrodynamic cavitation and acoustic cavitation [9]. In addition, local energy accumulation (e.g., optic cavitation and particle cavitation) can induce cavitation [10,11]. As impacted by the high temperature and pressure attributed to the collapse of cavitation bubbles, cavitation will cause several negative consequences for hydraulic machinery (e.g., poor performance, metal surface erosion, noise, and vibration) [12,13,14,15]. However, highly reactive hydroxyl radicals are synthesized in the presence of cavitation, thereby making the cavitation to be significant when applied independently as a valid technique in the field of degradation of organic matter, water treatment, algae removal, and many other fields [16,17,18,19].
In numerous applications, the use of ultrasound to initiate and promote chemical reactions has long aroused people’s attention. In the high temperature and pressure environment generated by ultrasonic cavitation, water will be decomposed, and water vapor and chain reaction will be generated [20,21]. Hydrogen free radicals and hydroxyl free radicals are capable of effectively treating wastewater via oxidation-reduction reactions and free radical conversion. Olson et al. [22] indicated through research that the dissolution rate of ozone in water is significantly elevated under ultrasonic cavitation. Under the ultrasonic input power of 54 W, the mass transfer rate constant of ozone dissolved in water increased by 57%. Stock et al. [23] employed the naphthol blue and black aqueous solution as the research object for the US-UV purification and treatment of textile dye water samples. As reported from existing studies, the combined effect of ultrasound and ultraviolet rays can facilitate the conversion of reactants and products on the catalyst surface, thereby increasing the reaction rate. Davydov et al. investigated the effect of ultrasound on the degradation of salicylic acid with four types of titanium dioxide powder [24]. As revealed from the results, compared with UV photocatalysis alone, the use of ultrasound in the photocatalysis process significantly impacts the rate and efficiency of salicylic acid destruction. Moreover, it was highlighted that the combined effect of US-UV can act as a stronger catalyst and exert the synergist effect. In addition, ultrasonic cavitation shows effective application effects in cleaning, anti-scaling, electroplating industry, as well as ultra-fine powder preparation [25]. However, ultrasonic cavitation can only exert a strong cavitation effect in a small range close to the sound source [26]. Only 5–10% of ultrasound energy is employed for cavitation, and the residual energy is heat energy to heat the system, thereby significantly limiting the application of ultrasonic cavitation and making it difficult to achieve industrialization [27].
Research on the application of hydraulic cavitation to sewage treatment has been progressively conducted over the past few years, which has aroused attention for its large processing capacity and low cost [28,29]. Kumar et al. [30] adopted hydrodynamic cavitation to hydrolyze water and castor oil and safflower oil. They reported that for the identical degree of hydrolysis, the energy consumption of hydrodynamic cavitation was significantly lower than that of conventional methods. Pandit et al. [31] performed cell lysis experiments and indicated that the energy consumption of hydraulic cavitation was only 5–10% of the energy consumption of the high-pressure reactor, and the energy utilization rate was significantly improved. Kalumuck et al. [32] employed submerged cavitation water jets to degrade p-nitrophenol. As revealed from the experimental results, the device was 100 times higher than ultrasonic for energy efficiency. However, it is noteworthy that the characteristics of low cavitation strength and poor degradation effect can limit the extensive application of hydraulic cavitation [28,33].
Ultrasonic cavitation and hydrodynamic cavitation can degrade organic matter that is difficult to degrade in sewage, whereas they also exhibit their advantages and limitations. For this reason, integrating acoustic cavitation and hydrodynamic cavitation to improve the performance of individual reactors is the research focus, which complies with the identical physical perspective of acoustic cavitation and hydrodynamic cavitation [34,35]. Amin et al. [36] optimized an individual cavitation reactor by combining acoustic cavitation and hydrodynamic cavitation. As indicated from the results, the degree of hydroxyl radical generation increased by 15%. Franke et al. and Braeutigam et al. [37,38] reported that the so-called Hydrodynamic-Acoustic-Cavitation (HAC) exerted a significant synergistic effect through the comparison of the combined method and the individual method. Besides, Foldyna exploited ultrasonic to enhance the performance of cavitation jet and elevate the removal rate of steel from 19.3 mg/min to 705.7 mg/min [39]. Likewise, the Hydrodynamic-Acoustic-Cavitation exhibited unique advantages in the extraction of tungsten from scheelite [40]. Wu et al. directly observed the cavitation bubbles of Hydrodynamic-Acoustic-Cavitation. As revealed from the periodic characteristics and intensity distributions, the ultrasound significantly widened the range while improving the strength of cavitation [41]. Though the use of Hydrodynamic-Acoustic-Cavitation has been considerable, according to the knowledge of the authors, the mechanism and dynamics of hydrodynamic-acoustic cavitation have not been extensively researched. As a result, more experimental investigations should be conducted to explore the unique cavitation bubble, cavitation cloud, and cavitation field characteristics of Hydrodynamic-Acoustic-Cavitation. On that basis, necessary theoretical support and direction guidance can be provided to improve the cavitation organic wastewater treatment technology and optimize the design of the cavitation reactor.
In this study, experiments were performed to study the synergy mechanism of Hydrodynamic-Acoustic-Cavitation and periodicity dynamic characteristics exhibited by cavitation cloud by employing the high-speed camera. First, the formulation of experimental facilities and methodologies were presented. Second, by complying with the instantaneous continuous cavitation images, the optical characterization method for cavitation was adopted to optimize the parameters of upstream pressure and ultrasonic power. Third, cavitation intensity distribution and the spatial-temporal correlation structure of the cavitation field were performed to examine the periodicity dynamic characteristics. Lastly, the Proper Orthogonal Decomposition (POD) was adopted to identify the large-scale cavitation flow structure and detect the synergy mechanism of Hydrodynamic-Acoustic-Cavitation.

2. Experiment and Methods

2.1. Experimental Setup

Cavity refers to a classic simplified model to study basic problems (e.g., flow stability and cavitation flow). As impacted by the flow separation at the leading edge of the cavity and the instability exhibited by the shear layer, the cavitation in the rectangular cavity is significantly strong [42]. Figure 1 presents the schematic representation of this experiment, comprising a high-pressure pump with an inverter to regulate the flow rate, an accumulator to eliminate the pressure pulsation attributed to the pump, as well as a rectangle cavity (15 × 15 × 10 mm) to be the test section. Through the observation window made of glass, the entire cavity could be overall observed, and the inlet and outlet of the cavity were circle holes of equal size (3 mm in diameter).
The motor-driven plunger pump with the maximal flow rate and pressure of 120 L/min and 60 MPa, provided the power of the entire experiment system. The bladder accumulators were placed in the pipeline, close to the pump to minimize the perturbations attributed to the pump. The ultrasonic transducer fixed on the cavity wall was excited by a continuous wave signal at a frequency of 20.7 kHz and then inserted into the water. The input power of sonotrode is adjustable from 0 W to 500 W, and the amplitude is 30 μm when running at full power. The radiating surface of the ultrasonic transducer was a circle exhibiting a diameter of 5 mm. Furthermore, the power of the ultrasonic transducer could be continuously regulated through a control table from 0 W to 500 W.
The cavitation cloud in the chamber was captured at a frame rate of 100,000 fps, which was primarily achieved with a high-speed camera (Phantom v710) and a light source from the back of the observation window. When the pressure decreased, the cavitation cloud was identified by visualizations where the cloud was black due to the dissipation of light and the liquid was white. The image sizes were all 256 × 256 pixels, and the scale factor was 0.058 mm/pixels.

2.2. Experimental Setup

The primary experiment uncertainty involved the accuracy of the pressure transducer obtaining the pump pressure and the controller of the ultrasonic transducer obtaining the power, less than ±0.1 %FS, and ±0.5 %FS, respectively. The overall uncertainty of the experimental system as calculated using the uncertainty propagation theory was ±0.51 %FS.

3. Result and Discussion

3.1. The Cavitation Performance Governed by Different Methods

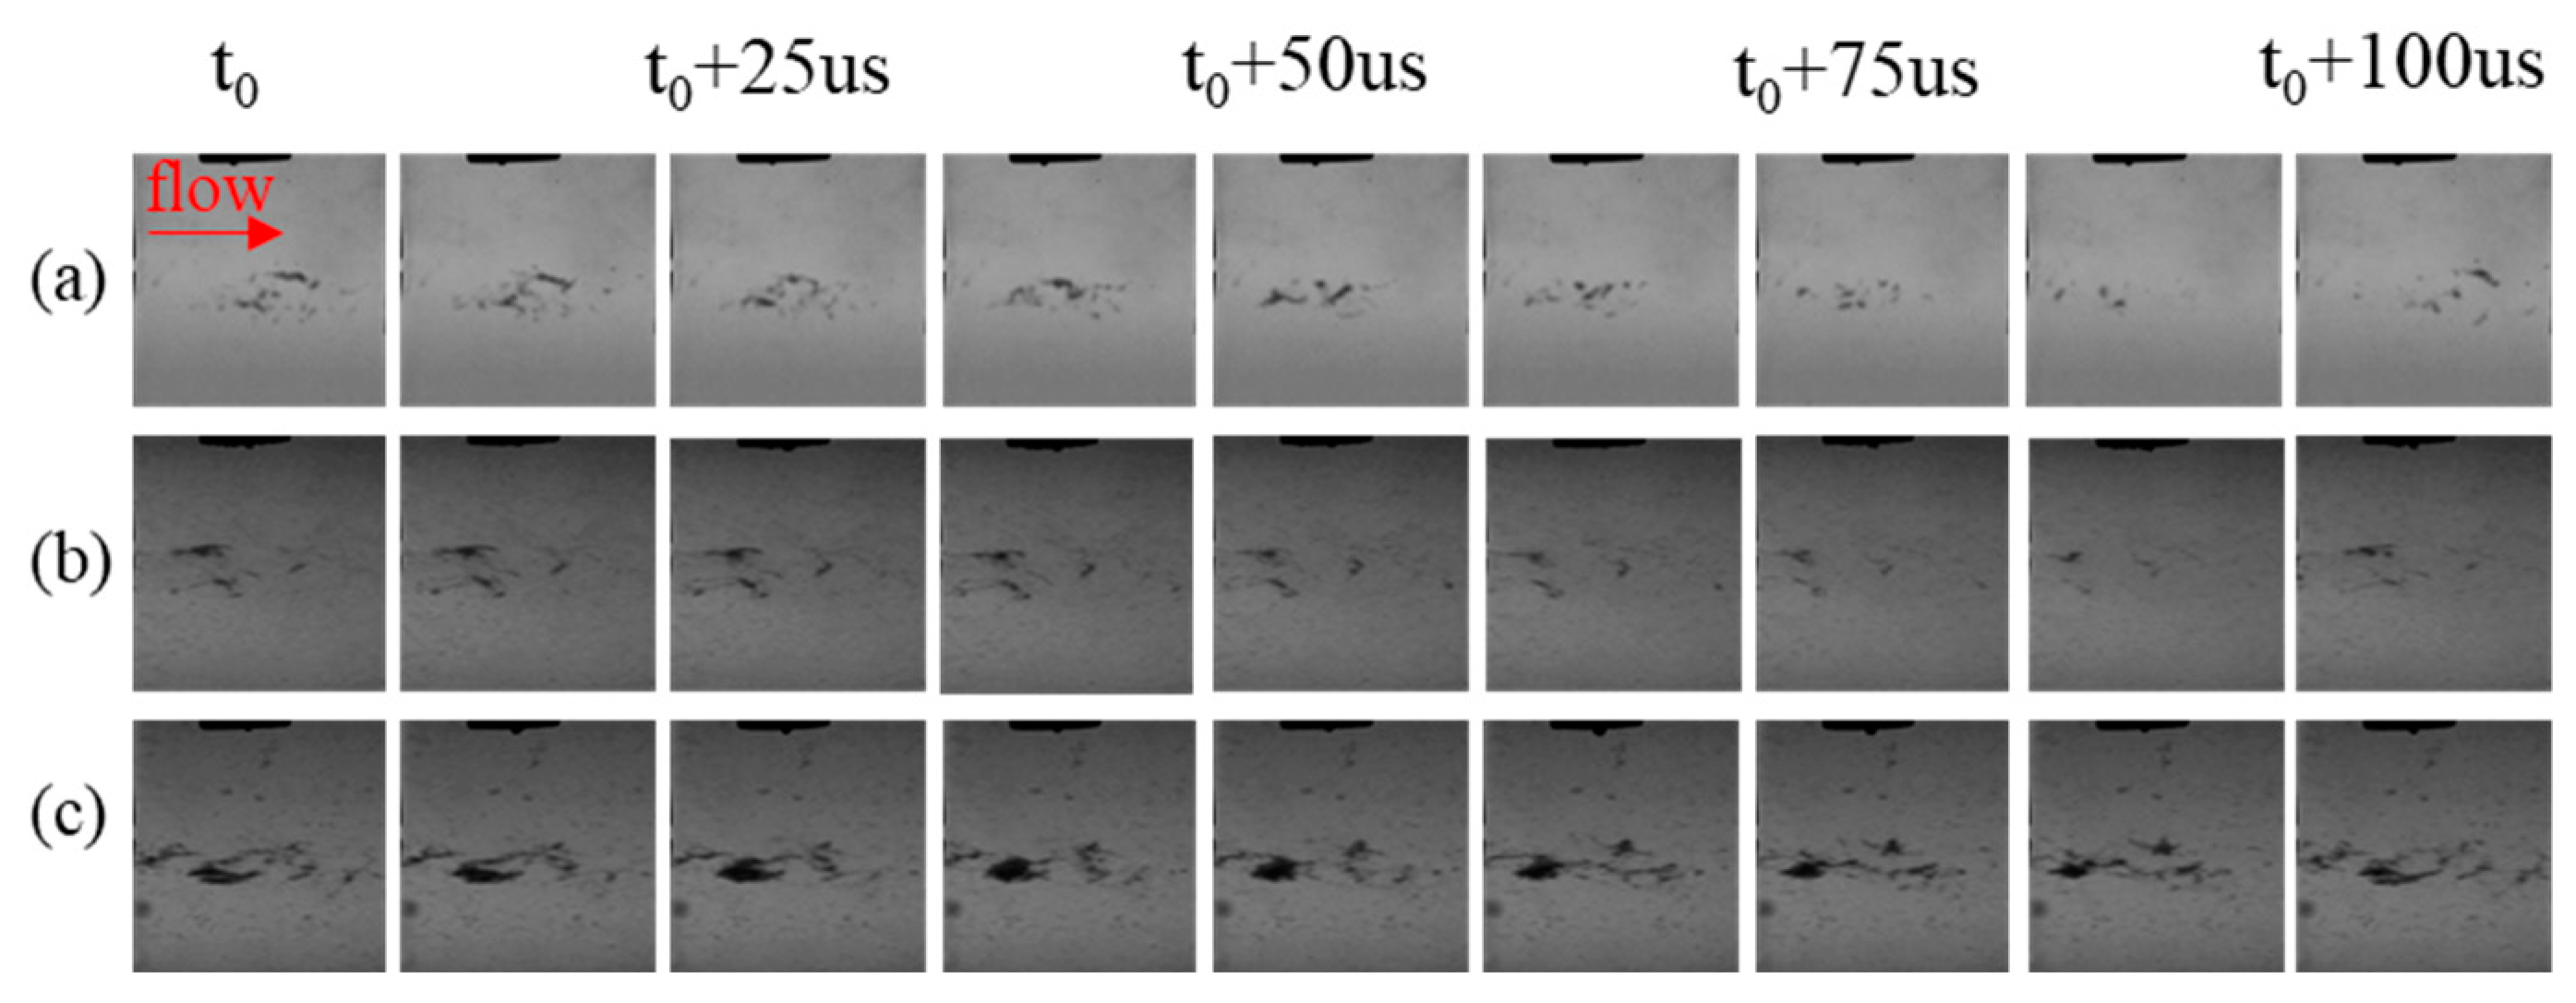
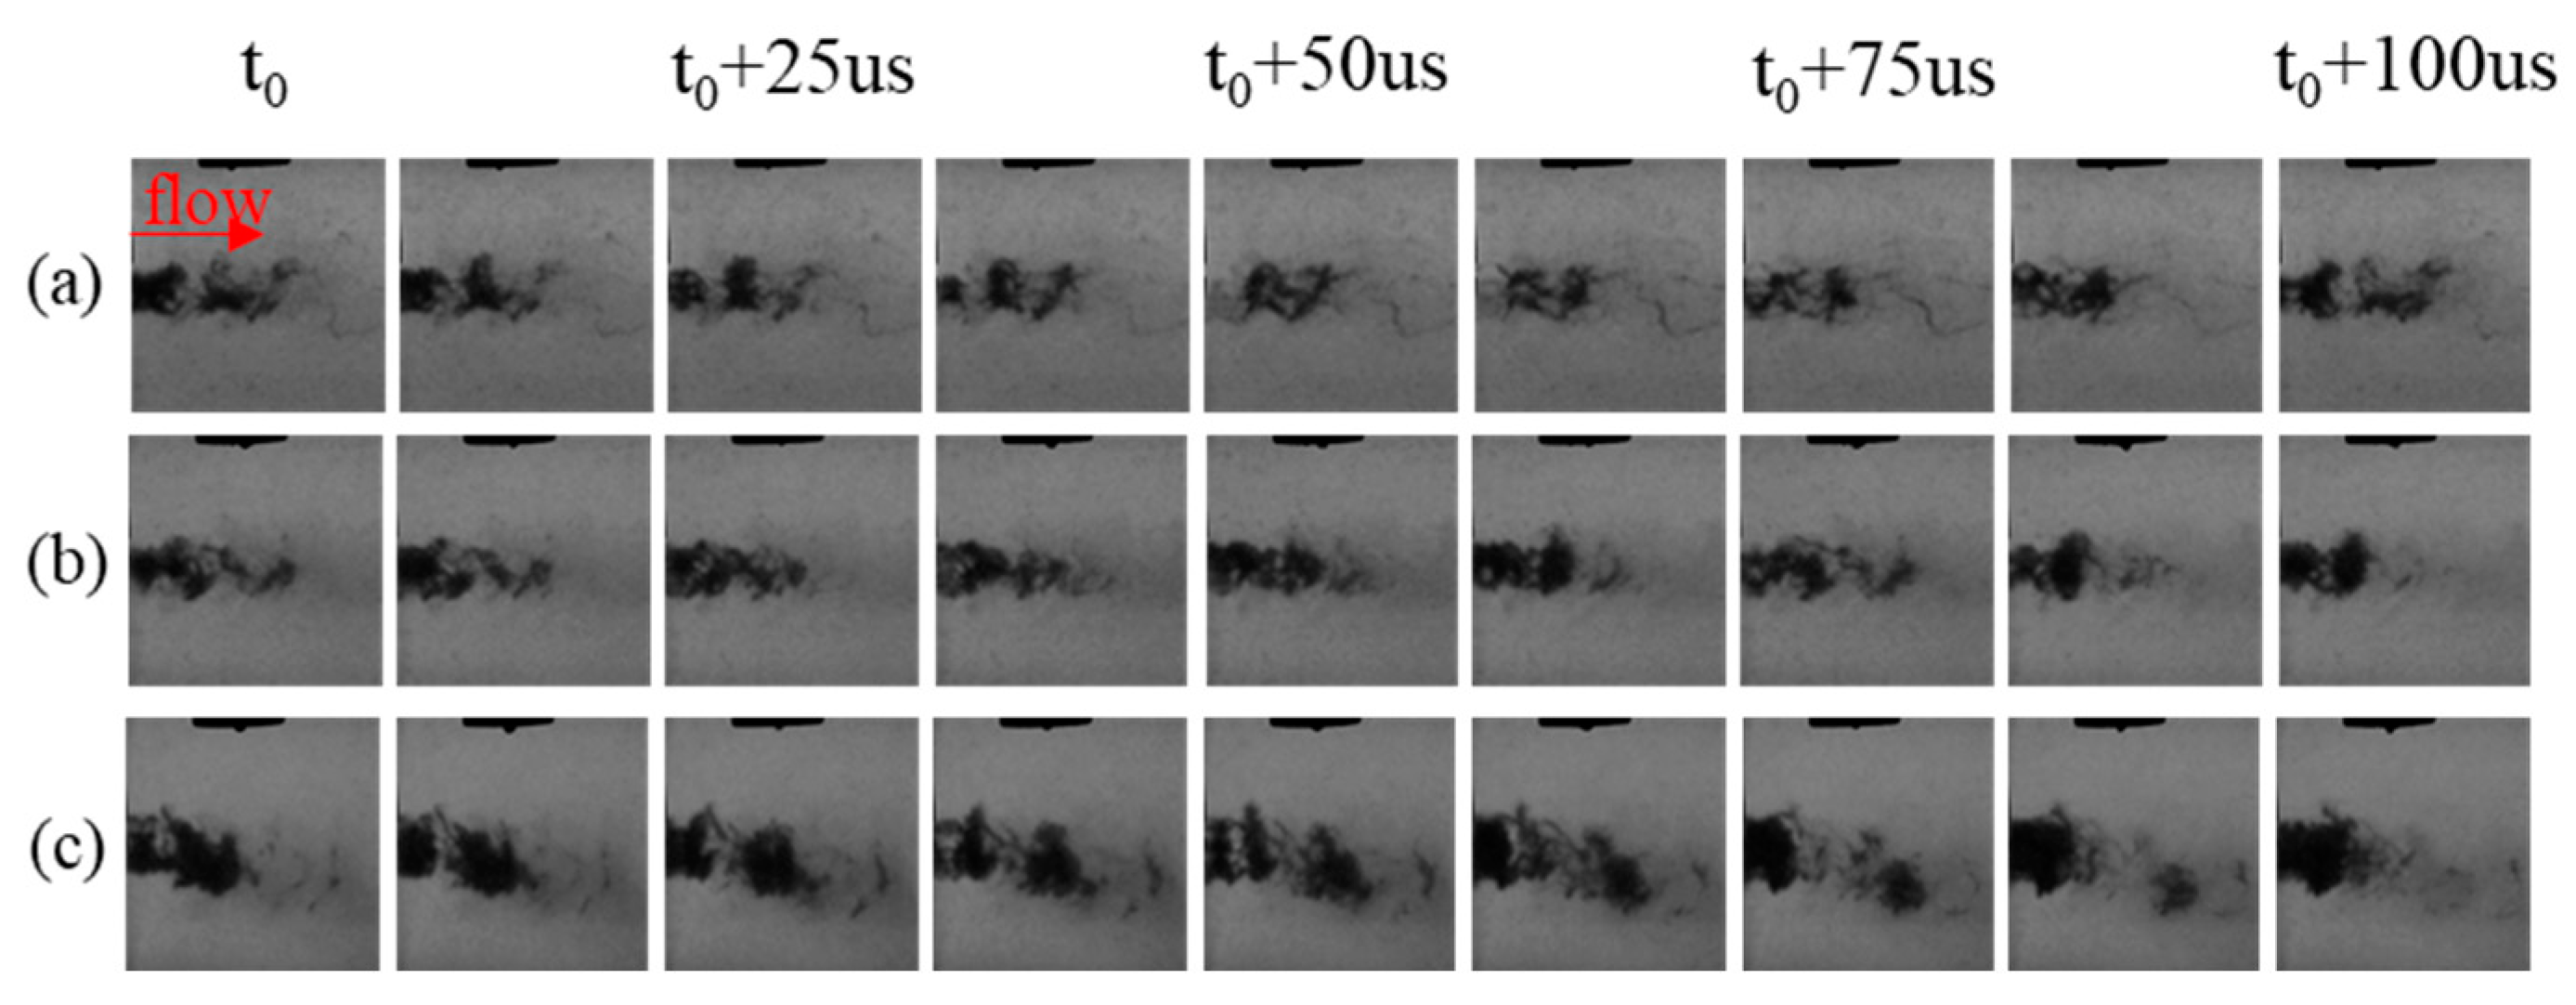
For the cavitation formed by the shearing effect of the jet, the pressure of the incoming flow could act as the major factor [43,44]. Likewise, the power of the ultrasonic transducer could determine the intensity of ultrasonic cavitation [41] Thus, the different combinations of flow pressure and power of the ultrasonic transducer were exploited to investigate the cavitation performance governed by using different methods. Figure 2, Figure 3 and Figure 4 presents the time-series images captured with the high-speed camera operating at 100,000 frames/s under different operating conditions within two periods of ultrasound.
As obviously from Figure 2, the ultrasonic cavitation clouds were not concentrated close to the axis of the nozzle like hydraulic cavitation clouds, whereas they were scattered near the radiation surface of the transducer. However, with the pressure of the cavity inlet set to 1.5 MPa and 2.0 MPa, ultrasonic cavitation clouds would be difficult to find near the radiation surface of the transducer. The pressure of the area close to the radiation surface increased due to the flow and suppressed the occurrence of ultrasonic cavitation. For the flow in the rectangular cavity, the shedding of the vortex ring at the upper nozzle will induce pressure fluctuations in the rectangular cavity. With the increase of the nozzle inlet pressure, the pressure in the rectangular cavity will also increase. The rise of ambient pressure in the rectangular cavity will inhibit the occurrence of cavitation. Others, in Figure 2, Figure 3 and Figure 4 the disappearance of cavitation clouds closed to the 5-mm sonotrode also proves the above point of view.
In addition, it is noteworthy that the cavitation at the shear layer became more severe as assisted by ultrasound, as indicated from Figure 3b,c and Figure 4b,c. For the shear cavitation in cavity flow, the vapor was identified in the vortex core where the pressure was lower than the mixing area outside and carried in the Kelvin–Helmholtz vortices [42]. Furthermore, the size of the cavitation cloud increased significantly with the increase in ultrasonic power, and the Vapor phase volume fraction in the rectangular cavity further increased. In brief, the intensity of hydrodynamic-acoustic cavitation was significantly stronger than that of ultrasonic cavitation alone and hydraulic cavitation alone, thereby indicating the synergy of hydraulic cavitation and ultrasonic cavitation. Indeed, for hydraulic cavitation, the ambient pressure varied with the flow rate, and ultrasound lowered its cavitation threshold, thereby making cavitation more possibly occur.

3.2. The Spatial Distribution of Cavitation Cloud

The intensity of cavitation is worth quantitatively characterizing. Wu et al. developed an optical characterization method of cavitation intensity, exploiting high-speed photographs of cavitation clouds to examine the intensity distribution of the cavitation field [41].
As mentioned above, cavitation refers to the formation, growth, and collapse of vapor cavities in the fluid, thereby causing the difference in the transmittance of light and reflected as grayscale difference [45,46]. Thus, a state variable q to quantitatively characterize the intensity of cavitation was proposed, i.e., the ratio of the instantaneous volume of the cavitation bubble to this space in a certain moment.
q ( x , y , t ) = j = 1 J 4 π 3 R j 3 ( t ) d V I 0 ( x , y , 0 ) I ( x , y , t ) I 0 ( x , y , 0 )
where I (x, y, t) denotes the transmission light intensity distribution on the focus plane.
Equation (1) essentially aims to assume that the cavitation cloud is uniform in the direction of the optical axis (parallel to z). Though this assumption complies with experience rather than rigorous physical derivation, Wu et al. verified the mentioned method by comparing cavitation light intensity and cavitation noise [41]. Thus, it is clarified that the time-averaged cavitation state variable q can characterize the spatial distribution characteristics exhibited by hydrodynamic-acoustic cavitation. The equation was used to calculate the time-averaged cavitation state variable:
q t ( l , m ) = 1 N n = 1 N I 0 ( l , m , 0 ) I ( l , m , n ) I 0 ( l , m , 0 ) = 1 N n = 1 N g 0 ( l , m , 0 ) g ( l , m , n ) g 0 ( l , m , 0 )
where the g (l, m, n) denotes the gray value of the pixel at location (l, m) in the nth image.
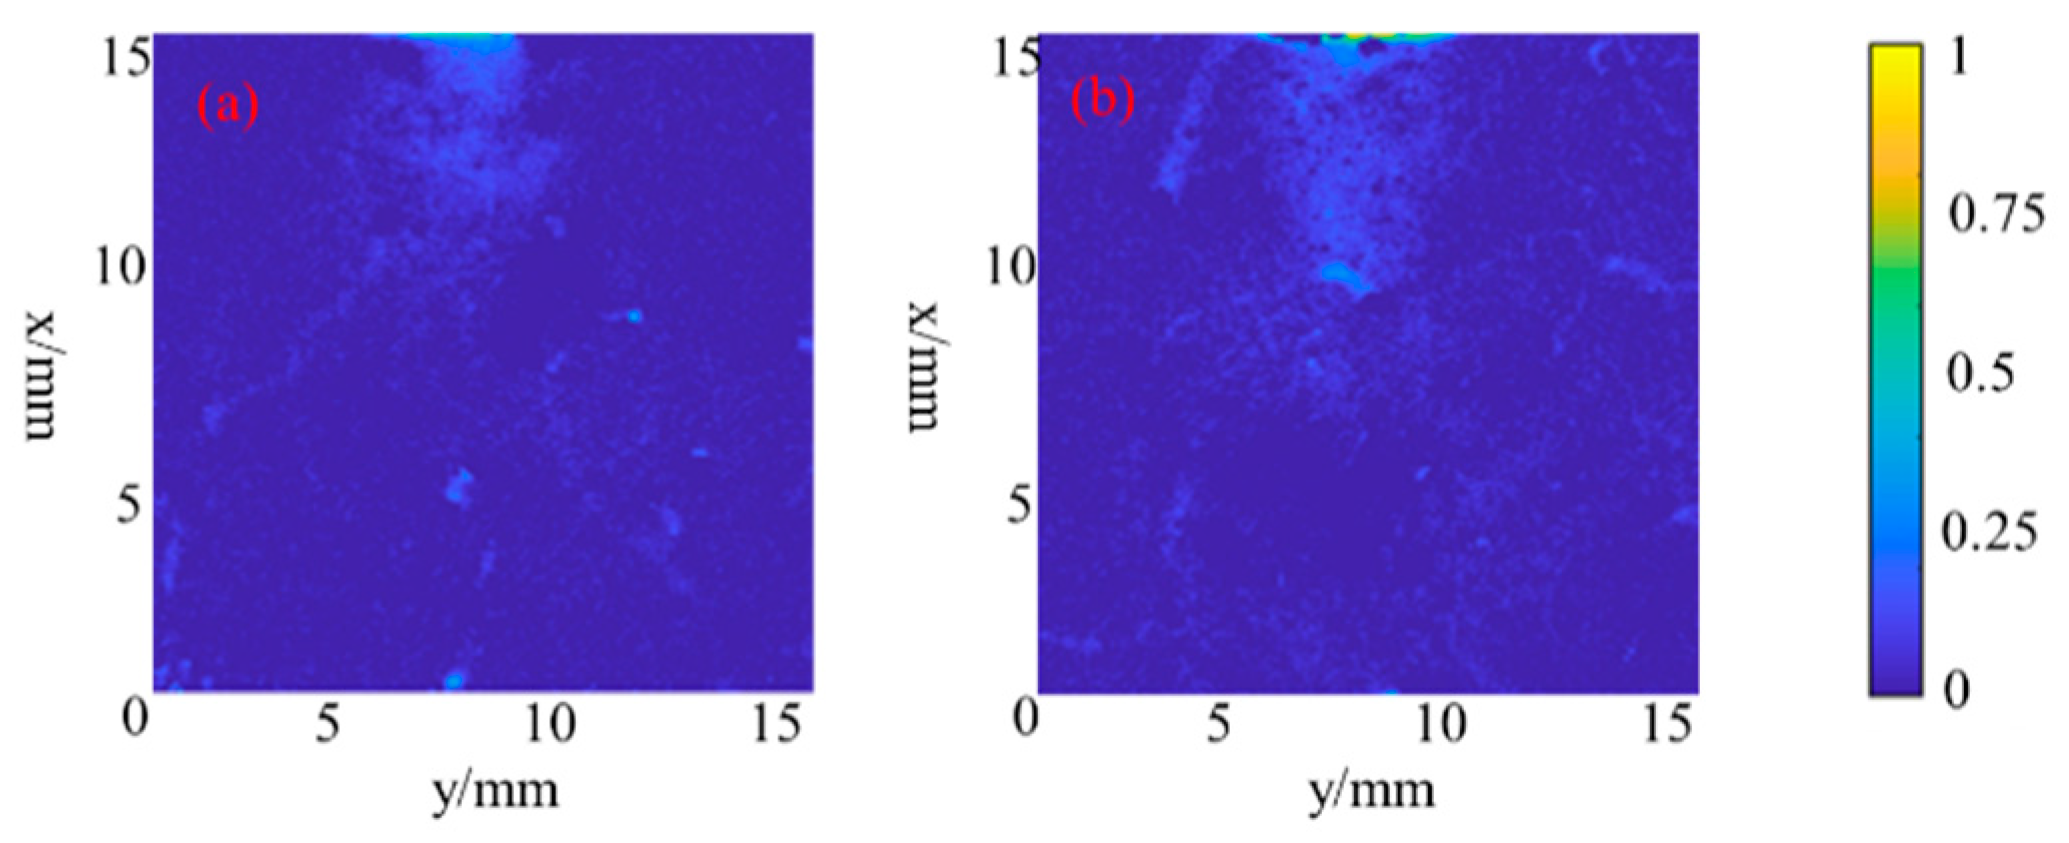
Based on the method, Figure 5, Figure 6 and Figure 7 present the time-averaging cavitation intensity distribution of hydrodynamic-acoustic cavitation under different operating conditions, which was calculated from 1000 original photos. As evidently indicated from Figure 6 and Figure 7, hydrodynamic-acoustic cavitation exerted obvious synergistic effects, largely reflected in the larger cavitation cloud under the coupling of ultrasonic wave and flow. However, the characteristic exhibited by coupled cavitation clouds in different working conditions showed obvious differences. When the cavity inlet pressure was 1.5 MPa, the area outside the shear layer in the cavity could still achieve cavitation as induced by ultrasound, and the shear cavitation was also strengthened by ultrasound. With the inlet pressure increasing to 2 MPa, the cavitation scattered in the area outside the shear layer dissipated, and the scale and intensity of shear cavitation significantly increased.
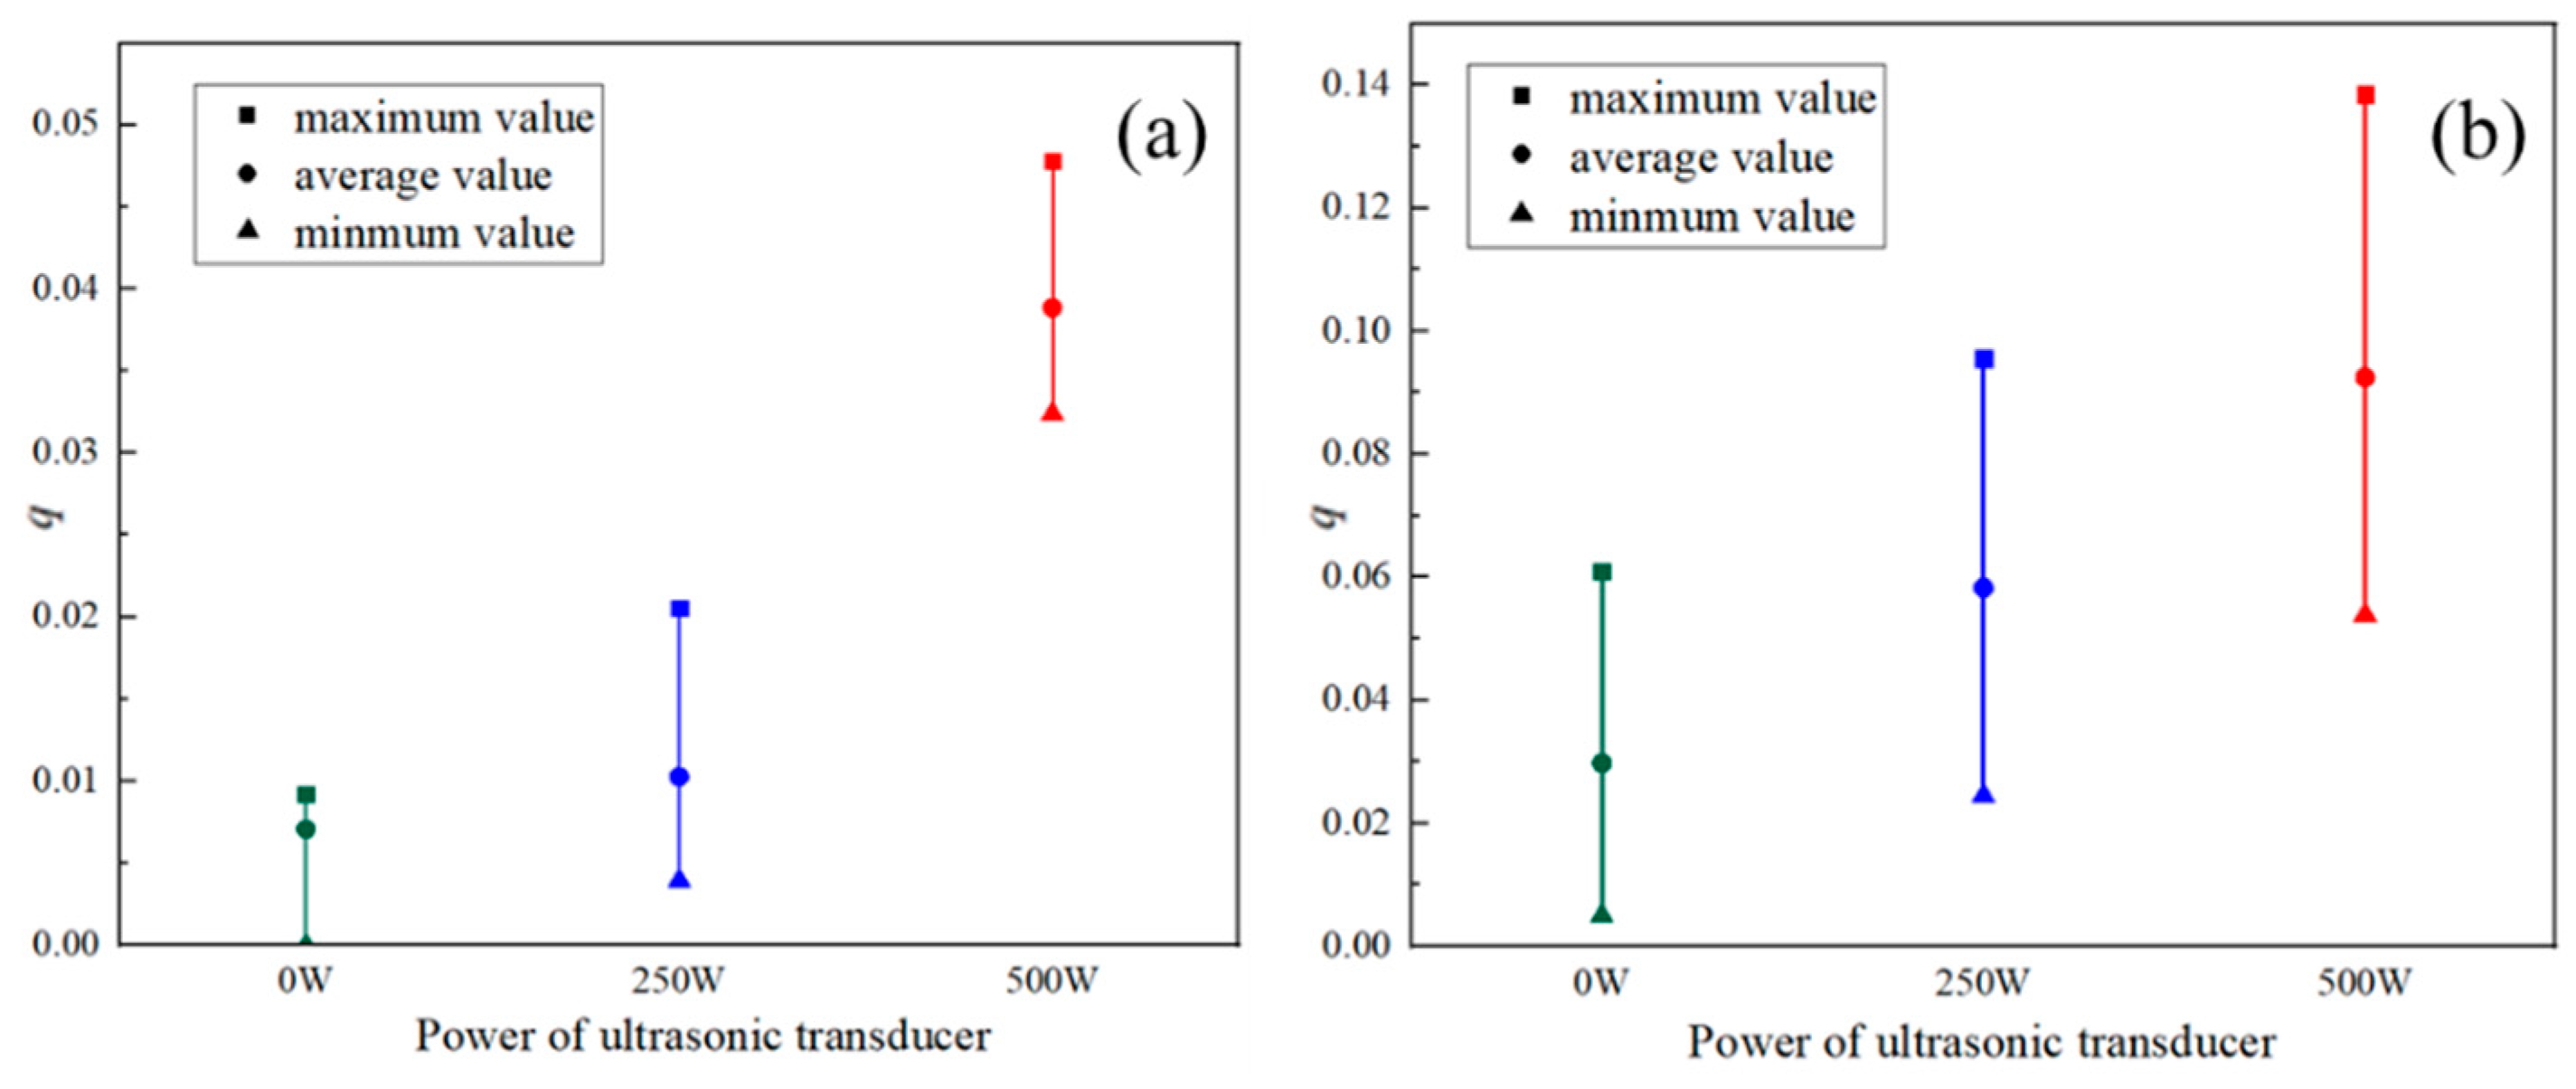
Further, the Volume-averaging cavitation intensity variable of hydrodynamic-acoustic cavitation under the cavity inlet pressure of 1.5 MPa and 2 MPa is plotted in Figure 8, which is defined as Equation (3). At the inlet pressure of 1.5 MPa, the average value of volume-averaging cavitation intensity variable increased from 0.007, 0.01, and 0.038 with the relative increase of cavitation intensity from 41% to 278% at the power of ultrasonic transducer from 0 W, 250 W, and 500 W. And when the inlet pressure is 2 MPa, the average value of volume-averaging cavitation intensity variable is 0.029, 0.058 and 0.092, respectively, and the corresponding growth rate is 95% and 58.5%. In addition, it is worth noting that as the ultrasonic power increases, the fluctuation of the volume-averaging cavitation intensity variable over time also becomes larger, which is manifested in the increasing gap between the maximum value and the minimum value. In other words, due to the existence of ultrasound, the periodic shedding and collapse of cavitation clouds are more violent.
q V ( n ) = = l = 1 L m = 1 M g 0 ( l , m , 0 ) g ( l , m , n ) g 0 ( l , m , 0 ) L × M

3.3. The Spatial-Temporal Profiles of Cavitation Cloud

To examine the collapse period characteristics exhibited by the cavitation cloud along the jet direction, the state variable q to quantitatively characterize the intensity of cavitation was circumferential averaged and then arranged at a time scale [47], as illustrated in Figure 9 for comparison. The average grey levels characterize the passage of cavitating structures and for each time depending on the image, higher grey levels correspond to the coherent structure localization [42]. For the Spatial-temporal profiles of the cavitation cloud in Figure 9, the stripes indicated the collapse characteristics exhibited by the cavitation cloud, and the slope of the stripes reflected the translational speed of the cavitation cloud. The calculation equation is written as:
q y ( x , t ) 0 Y [ I 0 ( x , y , 0 ) I ( x , y , t ) ] d y 0 Y I 0 ( x , y , 0 ) d y m = 1 M g 0 ( l , m , 0 ) g ( l , m , n ) g 0 ( l , m , 0 ) M q M ( l , n )
The significant deviations of the cavitation development when coupled with the hydrodynamic cavitation and acoustic cavitation could be more specifically confirmed by comparing the corresponding spatiotemporal cavitation evolutions (Figure 9). A comparative view of the spatial characteristics exhibited by the cavitation revealed the similarity across the two cavitation induction methods (i.e., independent hydraulic cavitation and hydrodynamic-acoustic cavitation), even with various ultrasonic intensities. Furthermore, the independent hydrodynamic cavitation exhibited slanted stripes, varying in length, which was darker toward the downstream. Given the hydrodynamic-acoustic cavitation, the spatial-temporal profiles did not undergo real fundamental variations, which comprised longer diagonal stripes, thereby indicating that the flow structure was not altered by ultrasound. In other words, ultrasound lowered the threshold of cavitation, thereby making cavitation more possibly occur.
When the inlet pressure is 1.5 MPa, both the hydraulic cavitation cloud and the acoustic flow coupled cavitation appear as discrete cavitation cloud clusters. Thus, for the hydrodynamic-acoustic cavitation under the inlet pressure of 1.5 MPa, it is difficult to identify the average collapse position of the cavitation cloud from Figure 9a–c. However, for the Position-time diagram of cavitation under the condition of 2 MPa, the red dotted line marks the approximate location of the cavitation cloud collapse. It is worth noting that the position where the cavitation bubble collapsed first has an obvious forward movement under the action of ultrasound. As impacted by the transverse pressure gradient between the shear layer core and its boundaries, the mean velocity shear was maximal, forcing the cavitation cloud to fall off and collapse [42]. For the hydrodynamic-acoustic cavitation, periodic ultrasonic waves aggravated the transverse pressure gradients at the shear layer and strengthened the shedding of cavitation clouds. Other, it is worth noting that the position where the cavitation bubble collapsed first remained almost unchanged, and the position where the cavitation bubble collapsed second has a slight backward movement with the increase in the electrical power of the transducer.

3.4. POD Analysis

To compare the dominant vortex structures with the hydraulic cavitation and hydrodynamic-acoustic cavitation, Proper Orthogonal Decomposition (POD) analysis was conducted on the cavitation fields within the cavity. The POD method is recognized as an efficient method of order reduction, thereby making it an efficient tool for mass data processing, which has been extensively employed in flow analysis, weather forecast, and oceanography [19,48,49,50]. The core of the POD method is to approximately express higher-order data, which consists of basic spatial modes and temporal coefficients decomposed from a time series of cavitation images. The basic spatial modes and temporal coefficients are defined as:
G ( k ) = m = 1 M c m ( k ) ϕ m
where G(k) denotes the kth image in a total number of K cavitation images; ϕm represents the mth POD mod; cm expresses the reconstruction coefficient corresponding to eigenfunctions ϕm. ϕm comprises spatial information, while cm contains temporal information about the field [19].
The obvious characteristic exhibited by the POD method is that the coherent structure is correspondingly connected with the contained energy. Moreover, the eigenvalues decrease with the rise of the mode number, i.e., the contribution of corresponding flow structure for the flow decreased. It should be highlighted that the flow structure of various energy levels together formed the turbulent flow field, and large-scale structures were critical to the cavitation field. In this study, POD was used to distinguish the spatial and temporary coherent structures of cavitation cloud and more specifically detect the synergy mechanism of Hydrodynamic-Acoustic-Cavitation.
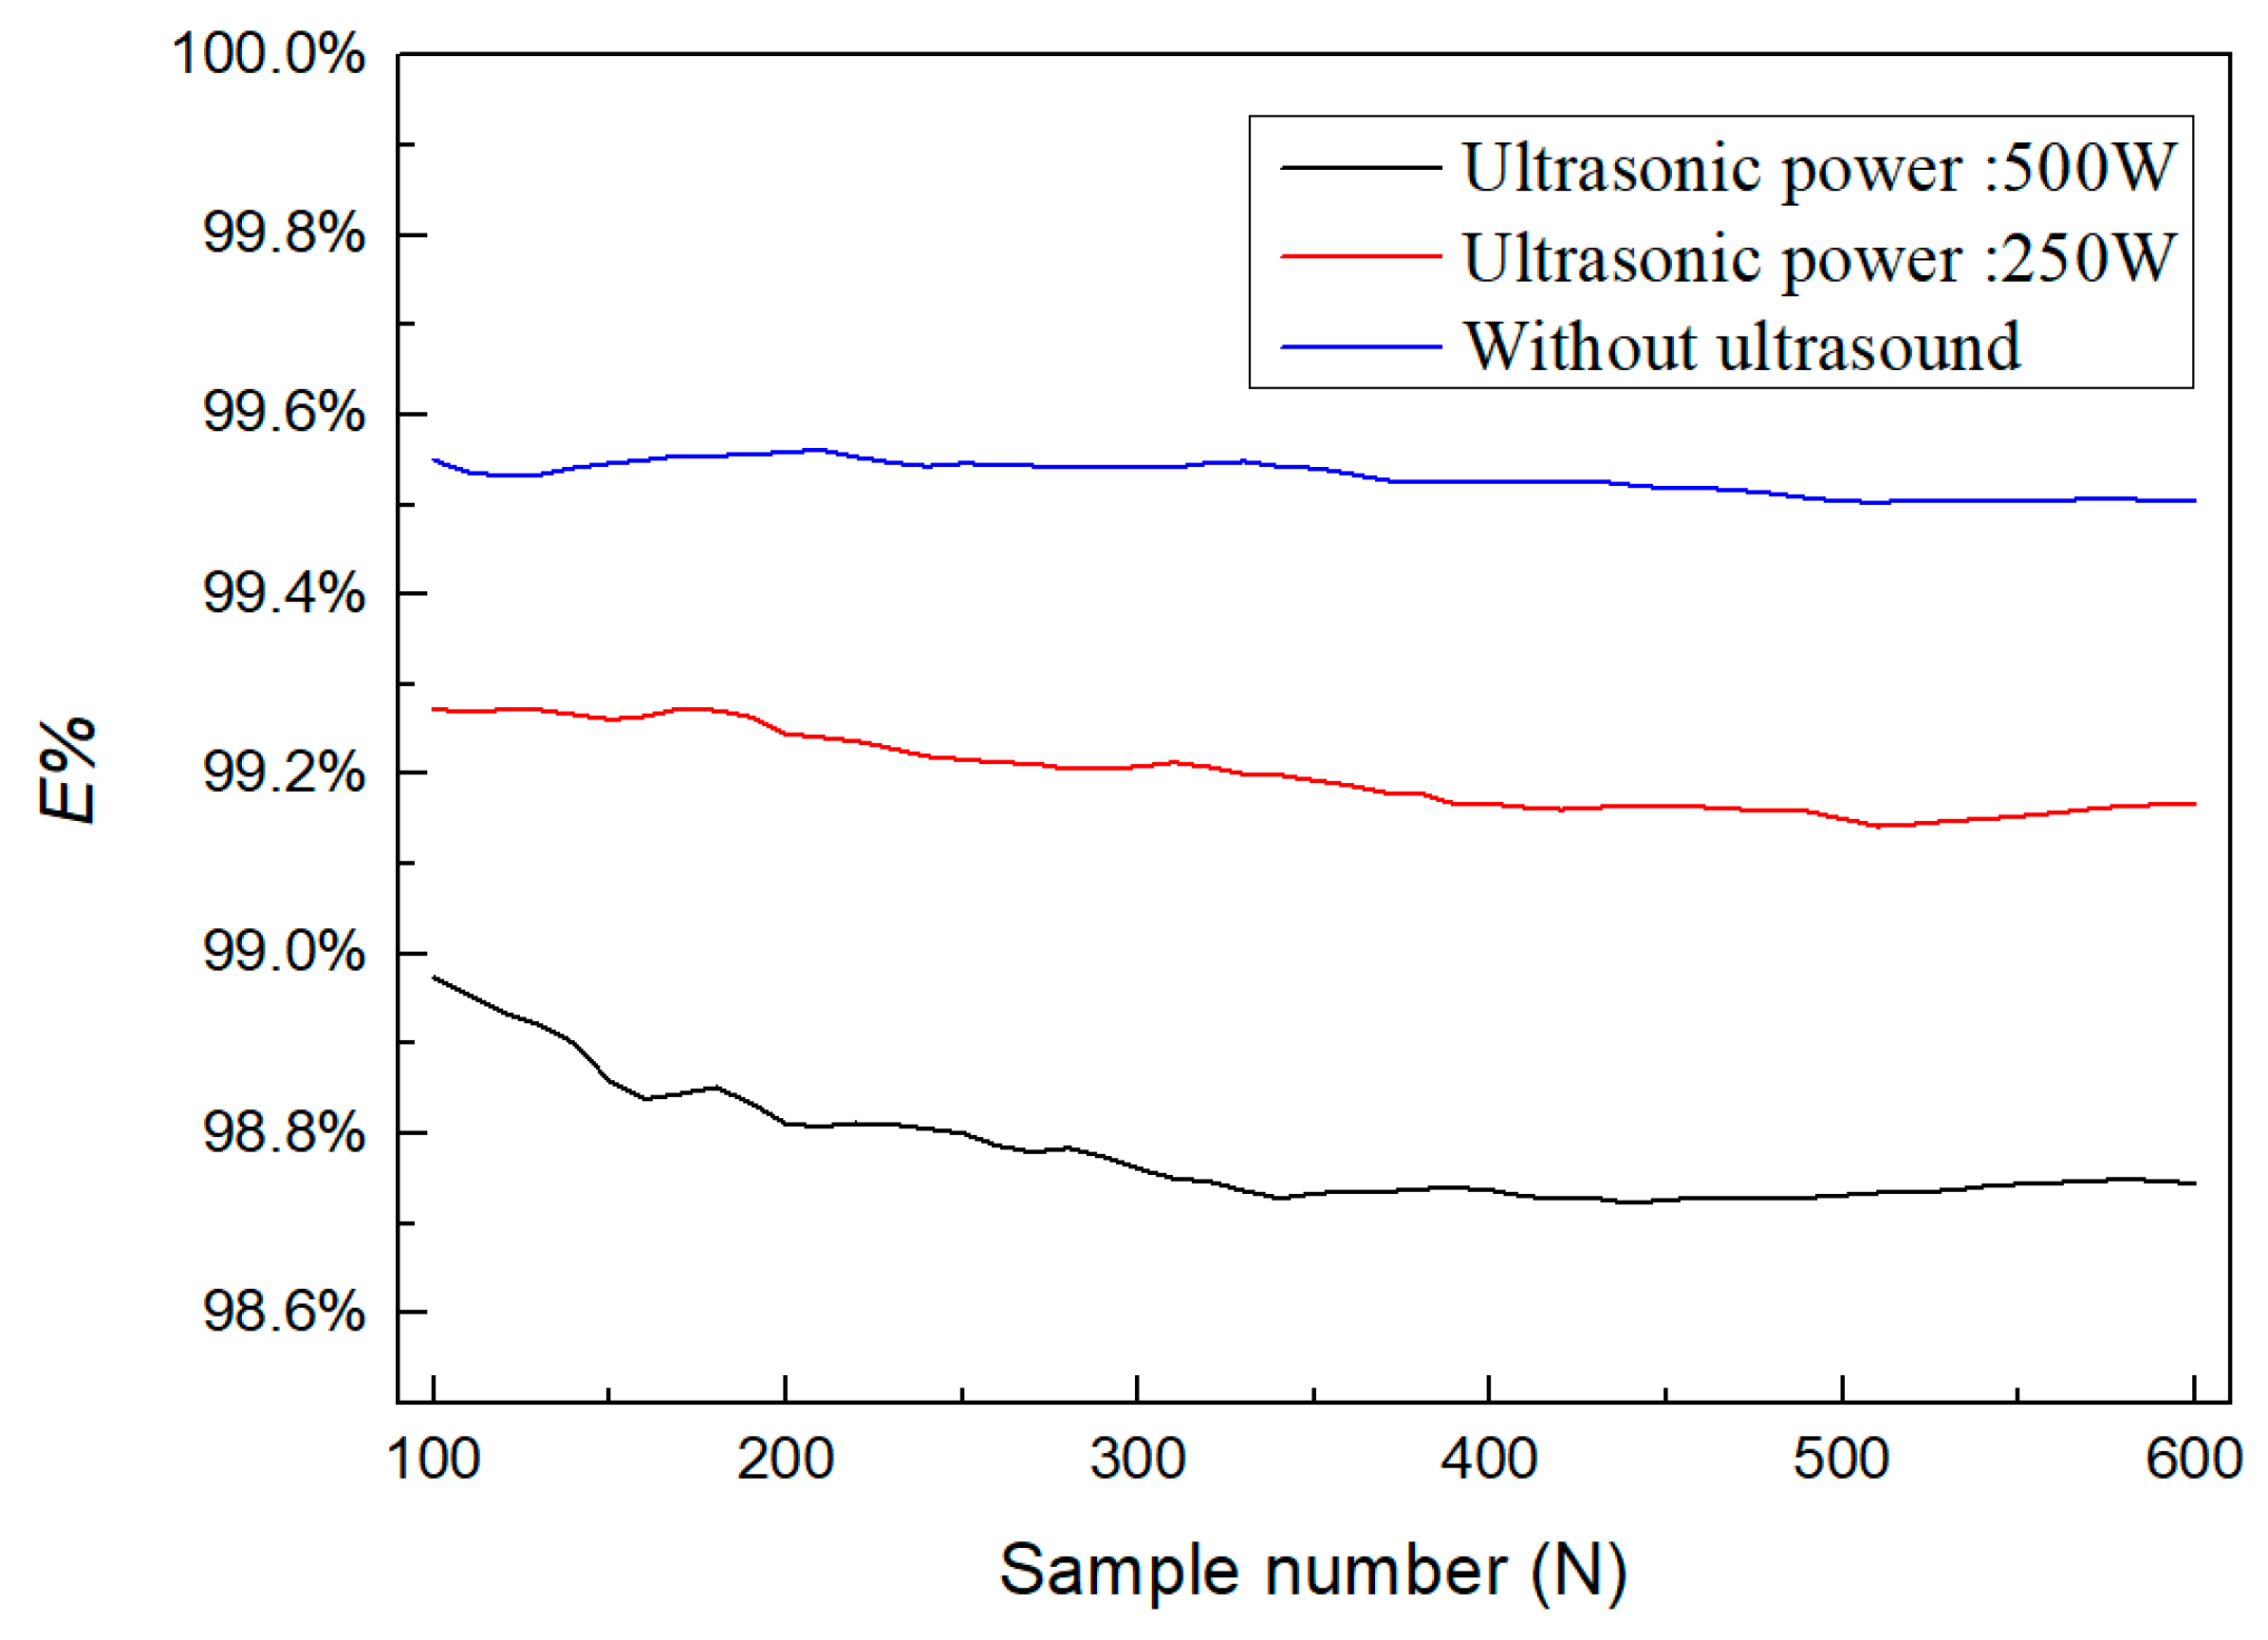
Figure 10 illustrates the cumulative energy of the first 5 modes normalized by the entire energy of all modes for the hydrodynamic-acoustic cavitation under the cavity inlet pressure of 2 MPa. As clearly observed from the figure, when the number of snapshots exceeded 500, the proportion of the first five-order energy no longer varied, which indicated that 500 snapshots could ensure the convergence of POD decomposition. To further reveal the coherent flow structures exhibited by hydrodynamic-acoustic cavitation, the first four POD mode of cavitation flow under different ultrasonic power is presented in Figure 11. It is worth declaring that the mentioned modes were calculated without their reconstruction coefficients, and there was no physical significance of the value of each mode.
The vortex structure in the turbulent shear layer, especially the turbulent coherent structure where the vorticity accumulated at the shear layer, made the local minimum pressure of the flow field significantly lower than the average pressure, thereby causing cavitation [42]. Thus, from mode 0, the main structure inducing cavitation was always the K-H vortex at the shear layer, i.e., ultrasound mainly enhanced the cavitation intensity by reducing the cavitation threshold instead of varying the large-scale vortex structure in the flow field.
Others, the formation of cavitation was correlated with the vortex structure, as well as with the flow field boundary layer and pressure fluctuation characteristics. By comparing the second and third modes of cavitation flow under different conditions, the small region of fluctuating ‘energy’ representing the fluctuation of cavitation intensity increased with the rise of the ultrasonic power. It was therefore indicated that the high-frequency pressure pulsation of ultrasound strengthened the instability exhibited by the shear layer and induced small-scale vortex structures at the shear layer, which was suggested as the more violently shed and collapse. Furthermore, the increase in the second and third mode contribution E% also confirmed the effect of ultrasound on the small-scale vortex structure.

4. Conclusions

In this study, experiments were performed to examine the synergy mechanism of Hydrodynamic-Acoustic-Cavitation and periodicity dynamic characteristics exhibited by cavitation cloud by using the high-speed camera. Through the processing of instantaneous images of cavitation clouds under different working conditions, the spatial distribution of cavitation clouds, the temporal and spatial distribution of cavitation clouds, and the main flow structure in the flow field were extracted and analyzed in this study. The results of this study can provide necessary theoretical support and direction guidance for optimizing the cavitation organic wastewater treatment technology as well as the design of the cavitation reactor. Given the analysis of the results presented, the following conclusions are drawn:
  • The vapor phase volume fraction in the rectangular cavity of hydrodynamic-acoustic cavitation is significantly higher than those of ultrasonic cavitation independently and hydraulic cavitation independently, thereby indicating the synergy of hydraulic cavitation and ultrasonic cavitation. When the inlet pressure is 2 MPa, the average value of the volume-averaging cavitation intensity variable is 0.029, 0.058, and 0.092, respectively, and the corresponding growth rate is 95% and 58.5%.
  • The average collapse position of Hydraulic cavitation and hydrodynamic-acoustic cavitation and the increasing gap between the maximum value and the minimum value employed in this paper shows that due to the existence of ultrasound, the periodic shedding and collapse of cavitation clouds is more violent.
  • Based on the POD analysis, the ultrasound was not altered the large-scale vortex structure in the flow field. The high-frequency pressure pulsation of ultrasound strengthens the instability exhibited by the shear layer and induces small-scale vortex structures at the shear layer, which is suggested as the more violently shed and collapse.

Author Contributions

M.Y.: Formal analysis, Investigation, Writing—original draft. Y.K.: Supervision and Funding acquisition. H.S., D.L. and H.L.: experiment. All authors have read and agreed to the published version of the manuscript.

Funding

This research is financially supported by the National Natural Science Foundation of China (No.51805188, No.51804318), the Fundamental Research Funds for the Central Universities (No. 2042020kf0001), and the National Key Research and Development Program of China (No. 2018YFC0808401).

Institutional Review Board Statement

Not applicable.

Informed Consent Statement

Not applicable.

Data Availability Statement

The data that support the findings of this study are available on request from the corresponding author.

Conflicts of Interest

The authors declare no conflict of interest.

References

  1. Dular, M.; Griessler-Bulc, T.; Gutierrez-Aguirre, I.; Heath, E.; Kosjek, T.; Klemenčič, A.K.; Oder, M.; Petkovšek, M.; Rački, N.; Ravnikar, M.; et al. Use of hydrodynamic cavitation in (waste)water treatment. Ultrason. Sonochem. 2016, 29, 577–588. [Google Scholar] [CrossRef] [PubMed]
  2. Eskin, D.; Tzanakis, I.; Wang, F.; Lebon, G.; Subroto, T.; Pericleous, K.; Mi, J. Fundamental studies of ultrasonic melt processing. Ultrason. Sonochem. 2018, 52, 455–467. [Google Scholar] [CrossRef] [PubMed]
  3. Bjorndalen, N.; Islam, M. The effect of microwave and ultrasonic irradiation on crude oil during production with a horizontal well. J. Pet. Sci. Eng. 2004, 43, 139–150. [Google Scholar] [CrossRef]
  4. Antes, F.G.; Diehl, L.O.; Pereira, J.S.; Guimarães, R.C.; Guarnieri, R.A.; Ferreira, B.M.; Flores, E.M. Effect of ultrasonic frequency on separation of water from heavy crude oil emulsion using ultrasonic baths. Ultrason. Sonochem. 2017, 35, 541–546. [Google Scholar] [CrossRef]
  5. Fedotkin, I.; Oleg, J. Some Problems of Development of Cavitation Technologies for Industry Application. Ned Tijdschr Geneeskd 2001, 145, 1632–1637. [Google Scholar]
  6. Long, X.; Cheng, H.; Ji, B.; Arndt, R.E.; Peng, X. Large eddy simulation and Euler–Lagrangian coupling investigation of the transient cavitating turbulent flow around a twisted hydrofoil. Int. J. Multiph. Flow 2018, 100, 41–56. [Google Scholar] [CrossRef]
  7. Wang, Y.; Zhuang, S.; Liu, H.; Zhao, Z.; Dular, M. Image post-processed approaches for cavitating flow in orifice plate. J. Mech. Sci. Technol. 2017, 31, 3305–3315. [Google Scholar] [CrossRef]
  8. Wittekind, D.; Schuster, M. Propeller cavitation noise and background noise in the sea. Ocean Eng. 2016, 120, 116–121. [Google Scholar] [CrossRef]
  9. Brennen, C.E. Cavitation and Bubble Dynamics; Oxford University Press: Oxford, UK, 1995. [Google Scholar]
  10. Guild, F.J.; Kinloch, A.J.; Taylor, A.C. Particle cavitation in rubber toughened epoxies: The role of particle size. J. Mater. Sci. 2010, 45, 3882–3894. [Google Scholar] [CrossRef] [Green Version]
  11. Schiffers, W.; Shaw, S.; Emmony, D. Acoustical and optical tracking of the collapse of a laser-generated cavitation bubble near a solid boundary. Ultrasonics 1998, 36, 559–563. [Google Scholar] [CrossRef]
  12. Arndt, R.E.A. Cavitation in Fluid Machinery and Hydraulic Structures. Annu. Rev. Fluid Mech. 1981, 13, 273–326. [Google Scholar] [CrossRef]
  13. Chen, H.; Jiang, L.; Chen, D.; Jiadao, W. Damages on steel surface at the incubation stage of the vibration cavitation erosion in water. Wear 2008, 266, 69–75. [Google Scholar]
  14. Hutli, E.; Nedeljkovic, M.S.; Radovic, N.A.; Bonyár, A. The relation between the high speed submerged cavitating jet behaviour and the cavitation erosion process. Int. J. Multiph. Flow 2016, 83, 27–38. [Google Scholar] [CrossRef] [Green Version]
  15. Tzanakis, I.; Bolzoni, L.; Eskin, D.G.; Hadfield, M. Evaluation of cavitation erosion behavior of commercial steel grades used in the design of fluid machinery. Metall. Mater. Trans. A 2017, 48, 2193–2206. [Google Scholar] [CrossRef] [Green Version]
  16. Mettin, R.; Cairós, C. Handbook of Ultrasonics and Sonochemistry; Springer: Singapore, 2016. [Google Scholar]
  17. Flannigan, D.; Suslick, K. Plasma formation and temperature measurement during single-bubble cavitation. Nature 2005, 434, 52–55. [Google Scholar] [CrossRef]
  18. Ma, X.; Huang, B.; Zhao, X.; Wang, Y.; Chang, Q.; Qiu, S.; Fu, X.; Wang, G. Comparisons of spark-charge bubble dynamics near the elastic and rigid boundaries. Ultrason. Sonochem. 2018, 43, 80–90. [Google Scholar] [CrossRef]
  19. Peng, C.; Tian, S.; Li, G.; Wei, M. Enhancement of cavitation intensity and erosion ability of submerged cavitation jet by adding micro-particles. Ocean Eng. 2020, 209, 107516. [Google Scholar] [CrossRef]
  20. Yasuda, K.; Nguyen, T.T.; Asakura, Y. Measurement of distribution of broadband noise and sound pressures in sonochemical reactor. Ultrason. Sonochem. 2018, 43, 23–28. [Google Scholar] [CrossRef]
  21. Henglein, A.; Kormann, C. Scavenging of OH Radicals Produced in the Sonolysis of Water. Int. J. Radiat. Biol. Relat. Stud. Phys. Chem. Med. 1985, 48, 251–258. [Google Scholar] [CrossRef]
  22. Olson, T.M.; Barbier, P.F. Oxidation kinetics of natural organic matter by sonolysis and ozone. Water Res. 1994, 28, 1383–1391. [Google Scholar] [CrossRef]
  23. Stock, N.L.; Peller, J.; Vinodgopal, K.; Kamat, P.V. Combinative Sonolysis and Photocatalysis for Textile Dye Degradation. Environ. Sci. Technol. 2000, 34, 1747–1750. [Google Scholar] [CrossRef]
  24. Davydov, L.; Reddy, E.P.; France, P.; Smirniotis, P.G. Sonophotocatalytic destruction of organic contaminants in aqueous systems on TiO2 powders. Appl. Catal. B Environ. 2001, 32, 95–105. [Google Scholar] [CrossRef]
  25. Chahine, G.L.; Kapahi, A.; Choi, J.-K.; Hsiao, C.-T. Modeling of surface cleaning by cavitation bubble dynamics and collapse. Ultrason. Sonochem. 2016, 29, 528–549. [Google Scholar] [CrossRef]
  26. Morton, J.A.; Khavari, M.; Qin, L.; Maciejewska, B.M.; Tyurnina, A.V.; Grobert, N.; Eskin, D.G.; Mi, J.; Porfyrakis, K.; Prentice, P.; et al. New insights into sono-exfoliation mechanisms of graphite: In situ high-speed imaging studies and acoustic measurements. Mater. Today 2021, 49, 10–22. [Google Scholar] [CrossRef]
  27. Pandit, A.B.; Sivakumar, P.S. Improve Reactions with Hydrodynamic Cavitation. Chem. Eng. Prog. 1999, 95, 43–50. [Google Scholar]
  28. Asgharzadehahmadi, S.; Raman, A.A.A.; Parthasarathy, R.; Sajjadi, B. Sonochemical reactors: Review on features, advantages and limitations. Renew. Sustain. Energy Rev. 2016, 63, 302–314. [Google Scholar] [CrossRef]
  29. Jyoti, K.K.; Pandit, A.B. Water disinfection by acoustic and hydrodynamic cavitation. Biochem. Eng. J. 2001, 7, 201–212. [Google Scholar] [CrossRef]
  30. Kumar, P.S.; Pandit, A.B. Modeling Hydrodynamic Cavitation. Chem. Eng. Technol. 1999, 22, 1017–1027. [Google Scholar] [CrossRef]
  31. Pandit, A.B.; Joshi, J.B. hydrolysis of fatty oils: Effect of cavitation. Chem. Eng. Sci. 1993, 48, 3440–3442. [Google Scholar] [CrossRef]
  32. Kalumuck, K.M.; Chahine, G.L. The Use of Cavitating Jets to Oxidize Organic Compounds in Water. J. Fluids Eng. 2000, 122, 465–470. [Google Scholar] [CrossRef] [Green Version]
  33. Gogate, P.R.; Sutkar, V.S.; Pandit, A.B. Sonochemical reactors: Important design and scale up considerations with a special emphasis on heterogeneous systems. Chem. Eng. J. 2011, 166, 1066–1082. [Google Scholar] [CrossRef]
  34. Chatterjee, D.; Arakeri, V.H. Towards the concept of hydrodynamic cavitation control. J. Fluid Mech. 1997, 332, 377–394. [Google Scholar] [CrossRef]
  35. Jyoti, K.K.; Pandit, A.B. Hybrid cavitation methods for water disinfection. Biochem. Eng. J. 2003, 14, 9–17. [Google Scholar] [CrossRef]
  36. Amin, L.P.; Gogate, P.R.; Burgess, A.E.; Bremner, D.H. Optimization of a hydrodynamic cavitation reactor using salicylic acid dosimetry. Chem. Eng. J. 2010, 156, 165–169. [Google Scholar] [CrossRef] [Green Version]
  37. Franke, M.; Braeutigam, P.; Wu, Z.-L.; Ren, Y.; Ondruschka, B. Enhancement of chloroform degradation by the combination of hydrodynamic and acoustic cavitation. Ultrason. Sonochem. 2011, 18, 888–894. [Google Scholar] [CrossRef]
  38. Braeutigam, P.; Franke, M.; Schneider, R.J.; Lehmann, A.; Stolle, A.; Ondruschka, B. Degradation of carbamazepine in environmentally relevant concentrations in water by Hydrodynamic-Acoustic-Cavitation (HAC). Water Res. 2012, 46, 2469–2477. [Google Scholar] [CrossRef]
  39. Foldyna, J.; Sitek, L.; Švehla, B.; Švehla, Š. Utilization of ultrasound to enhance high-speed water jet effects. Ultrason. Sonochem. 2004, 11, 131–137. [Google Scholar] [CrossRef]
  40. Johansson, Ö.; Pamidi, T.; Shankar, V. Extraction of tungsten from scheelite using hydrodynamic and acoustic cavitation. Ultrasonics Sonochem. 2020, 71, 105408. [Google Scholar] [CrossRef]
  41. Wu, P.; Bai, L.; Lin, W.; Wang, X. Mechanism and dynamics of hydrodynamic-acoustic cavitation (HAC). Ultrason. Sonochem. 2018, 49, 89–96. [Google Scholar] [CrossRef]
  42. Aeschlimann, V.; Prothin, S.; Barre, S.; Djeridi, H. High speed visualizations of the cavitating vortices of 2D mixing layer. Eur. J. Mech.—B/Fluids 2012, 31, 171–180. [Google Scholar] [CrossRef]
  43. Wu, Q.; Wei, W.; Deng, B.; Jiang, P.; Li, D.; Zhang, M.; Fang, Z. Dynamic characteristics of the cavitation clouds of submerged Helmholtz self-sustained oscillation jets from high-speed photography. J. Mech. Sci. Technol. 2019, 33, 621–630. [Google Scholar] [CrossRef]
  44. Liu, W.; Kang, Y.; Wang, X.; Liu, Q.; Fang, Z. Integrated CFD-aided theoretical demonstration of cavitation modulation in self-sustained oscillating jets. Appl. Math. Model. 2020, 79, 521–543. [Google Scholar] [CrossRef]
  45. Holt, R.G.; Crum, L.A. Mie scattering used to determine spherical bubble oscillations. Appl. Opt. 1990, 29, 4182–4191. [Google Scholar] [CrossRef]
  46. Tuziuti, T.; Yasui, K.; Iida, Y. Spatial study on a multibubble system for sonochemistry by laser-light scattering. Ultrason. Sonochem. 2005, 12, 73–77. [Google Scholar] [CrossRef]
  47. Ganesh, H.; Mäkiharju, S.A.; Ceccio, S.L. Bubbly shock propagation as a mechanism for sheet-to-cloud transition of partial cavities. J. Fluid Mech. 2016, 802, 37–78. [Google Scholar] [CrossRef] [Green Version]
  48. Lumley, J.L. The structure of inhomogeneous turbulence. In Atmospheric Turbulence & Radio Wave Propagation; Nauka: Moscow, Russia, 1967. [Google Scholar]
  49. Sirovich, L. Turbulence and the dynamics of coherent structures. I—Coherent structures. II—Symmetries and transformations. III—Dynamics and scaling. Q. Appl. Math. 1987, 45, 561–571. [Google Scholar] [CrossRef] [Green Version]
  50. Wang, P.; Liu, Y. Intensified flow dynamics by second-order acoustic standing-wave mode: Vortex-excited acoustic resonances in channel branches. Phys. Fluids 2019, 31, 035105. [Google Scholar]
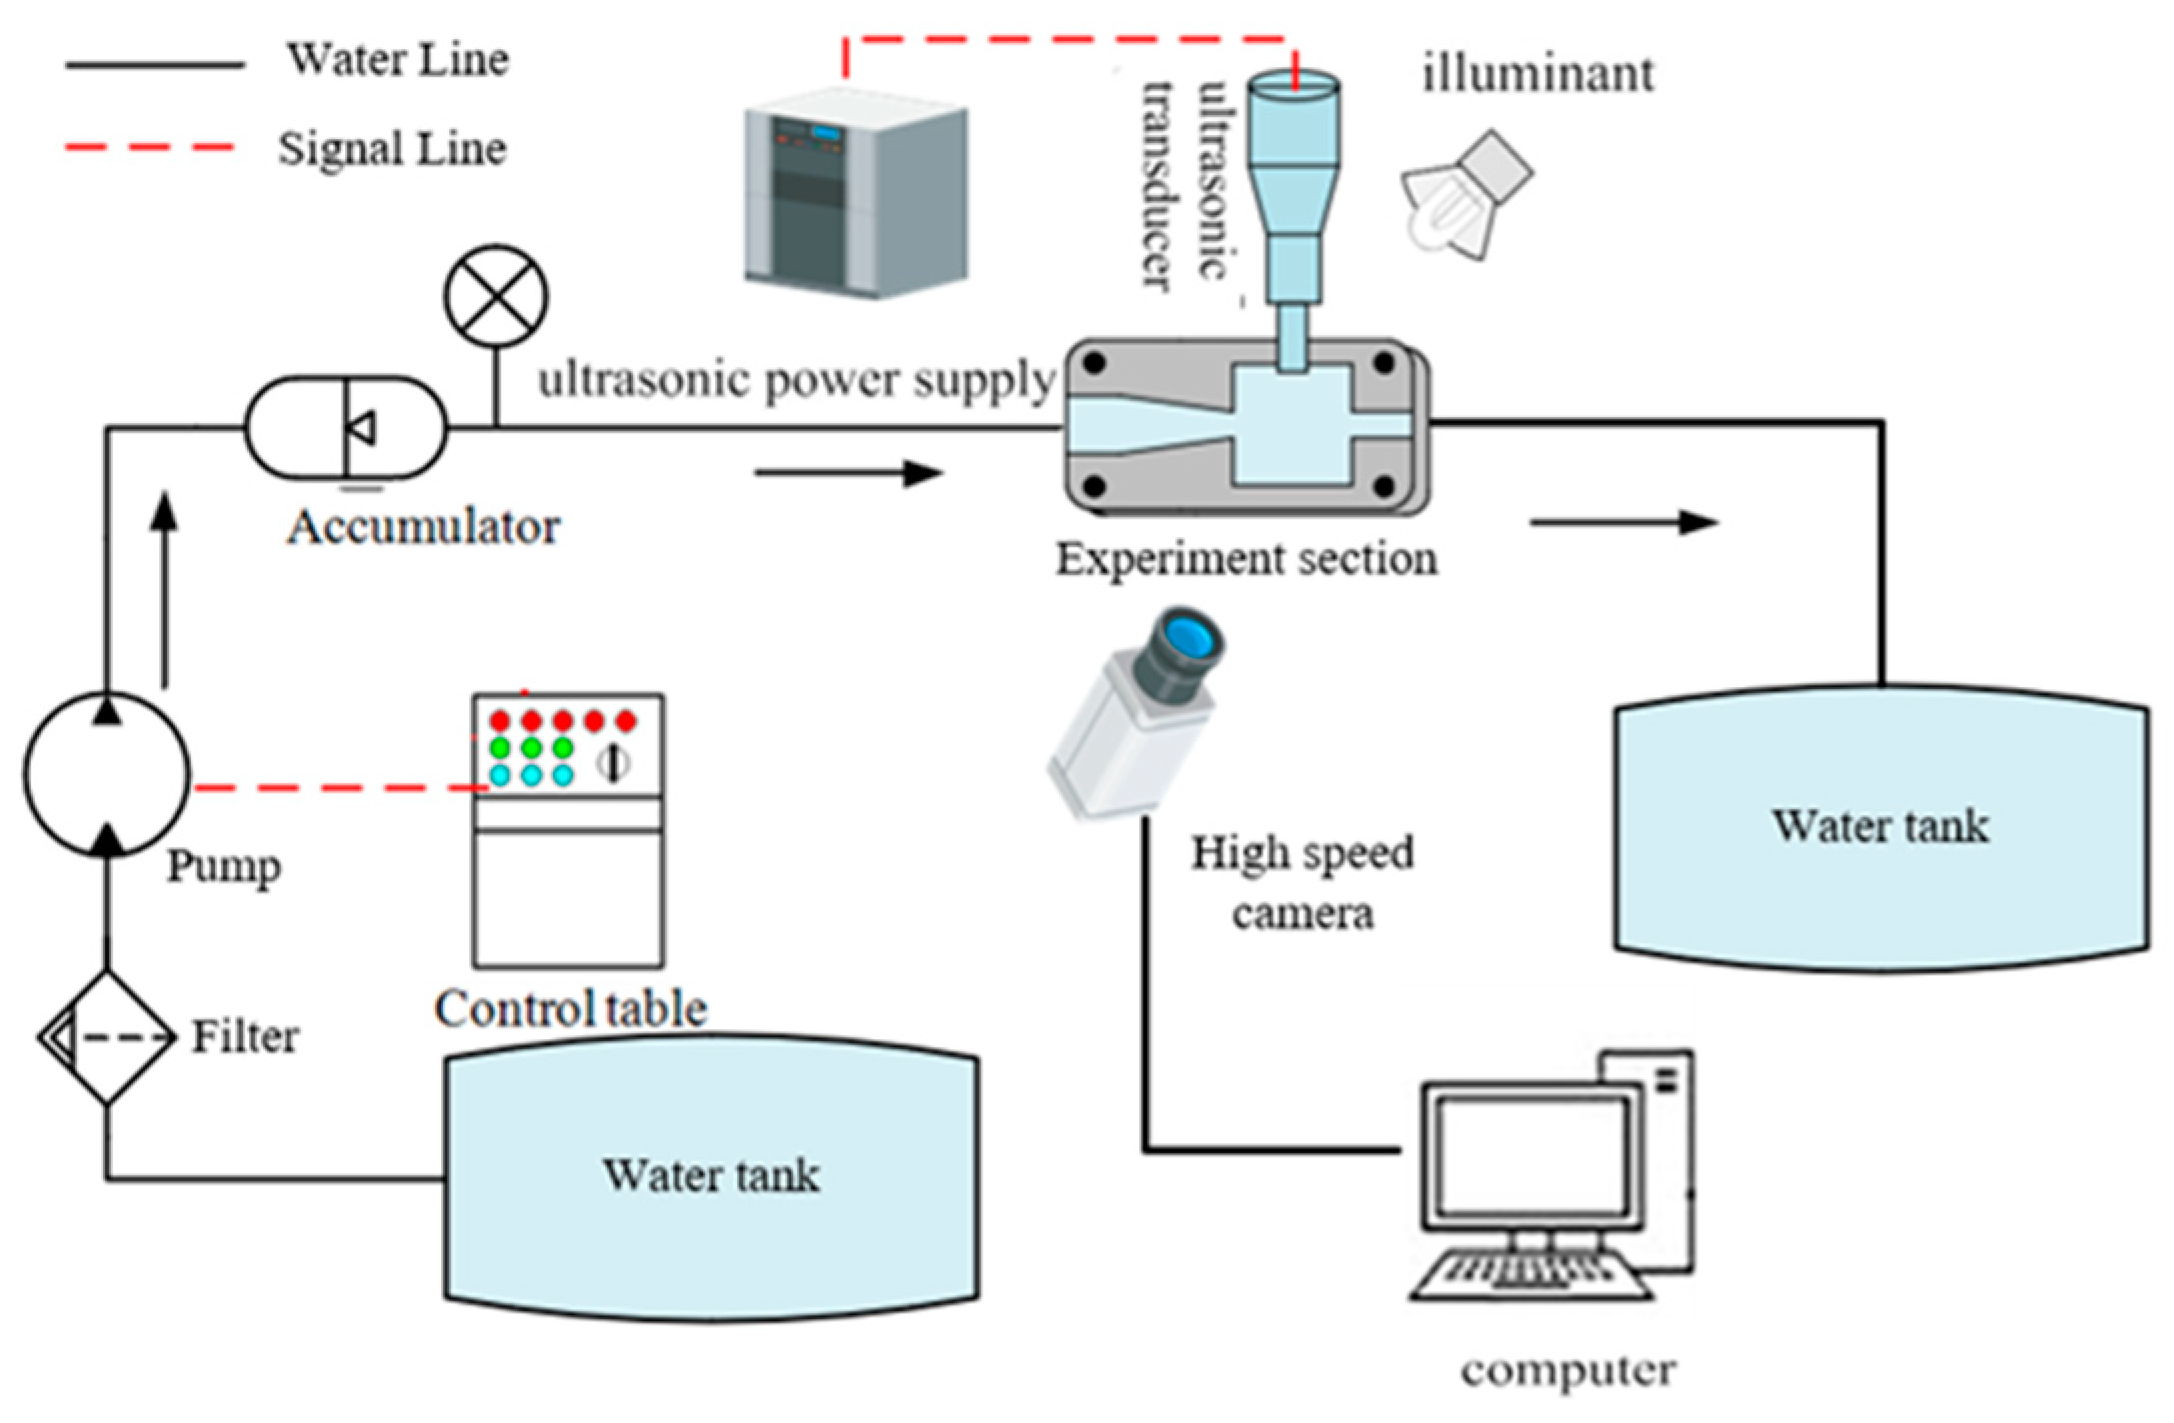
Figure 1. Experimental setup schematic.
Jmse 10 00309 g001
Figure 2. Time-series images of acoustic cavitation (a) 250 W (b) 500 W.
Jmse 10 00309 g002
Figure 3. Time-series images of hydrodynamic-acoustic cavitation under the inlet pressure of 1.5 MPa (a) Without ultrasound (b) 250 W (c) 500 W.
Jmse 10 00309 g003
Figure 4. Time-series images of hydrodynamic-acoustic cavitation under the inlet pressure of 2 MPa (a) Without ultrasound (b) 250 W (c) 500 W.
Jmse 10 00309 g004
Figure 5. The cavitation intensity distribution of acoustic cavitation (a) 250 W (b) 500 W.
Jmse 10 00309 g005
Figure 6. The cavitation intensity distribution of hydrodynamic-acoustic cavitation under the inlet pressure of 1.5 MPa (a) Without ultrasound (b) 250 W (c) 500 W.
Jmse 10 00309 g006
Figure 7. The cavitation intensity distribution of hydrodynamic-acoustic cavitation under the inlet pressure of 2 MPa (a) Without ultrasound (b) 250 W (c) 500 W.
Jmse 10 00309 g007
Figure 8. Volume-averaging cavitation intensity variable of cavitation (a) 1.5 MPa (b) 2 MPa.
Jmse 10 00309 g008
Figure 9. Position-time diagram of cavitation (a) Hydrodynamic cavitation, inlet pressure 1.5 MPa. (b) Hydrodynamic-Acoustic Cavitation, inlet pressure 1.5 MPa, transducer electric power 250 W. (c) Hydrodynamic-Acoustic Cavitation, inlet pressure 1.5 MPa, transducer electric power 500 W. (d) Hydrodynamic cavitation, inlet pressure 2 MPa. (e) Hydrodynamic-Acoustic Cavitation, inlet pressure 2 MPa, transducer electric power 250 W. (f) Hydrodynamic-Acoustic Cavitation, inlet pressure 2 MPa, transducer electric power 500 W.
Jmse 10 00309 g009
Figure 10. The total contribution, E%, of the first five modes.
Jmse 10 00309 g010
Figure 11. The first four modes are at different ultrasonic power.
Jmse 10 00309 g011
Publisher’s Note: MDPI stays neutral with regard to jurisdictional claims in published maps and institutional affiliations.