Abstract
Floating offshore wind turbines (FOWTs) still face many challenges in improving platform stability. A fully submersible FOWT platform with inclined side columns is designed to tackle the current technical bottleneck of the FOWT platform, combining the structural characteristics of the semi-submersible and Spar platform. An integrated numerical model of FOWT is established considering the fully coupled effect, and the hydrodynamic performance of the novel FOWT, the semi-submersible FOWT, and the Spar FOWT are compared and analyzed under different wave incidence angles and wave frequencies, as well as the blade and tower dynamic response of the three FOWTs under the coupling effect of wind, wave, and current. The results show that the novel floating platform can significantly optimize the hydrodynamic performance and has a better recovery ability after being subjected to external loads. The novel floating platform can significantly reduce the heave peak and its corresponding wave frequency compared to the semi-submersible platform, reducing the possibility of heave resonance. FOWT operation should ensure positive wave inflow as far as possible to avoid excessive wave forces in the lateral direction. Both blade and tower dynamic response are affected by rotor rotation and tower vibration to varying degrees, while tower dynamic response is mainly affected by platform motion. This study suggests that the application of the novel FOWT concept is feasible and can be an alternative in offshore wind exploitation in deep water.
1. Introduction
Harvested by advanced technical systems honed over decades of research and development, wind energy has become a mainstream energy resource [1]. 2020 saw global new wind power installations surpass 90 GW, a 53% growth compared to 2019, bringing total installed capacity to 743 GW, a growth of 14% compared to last year. China led the world in new annual offshore wind installations for the third year in a row with over 3 GW of new offshore wind capacity in 2020 [2]. Compared to shallow sea wind resources, deep-sea wind energy has the advantages of abundant resources and less noise pollution. Therefore, offshore wind power is gradually developing to the deep sea [3]. When the water depth is greater than 60 m, the manufacturing and installation cost of the fixed-bottom wind turbine increases significantly, and its safety is difficult to be guaranteed simultaneously. Furthermore, FOWT as the main method of deep-sea wind energy development has become an important direction of the current offshore wind energy development. The FOWT will be subjected to harsher marine environmental loads and a more dramatic motion response. The current common floating platforms can be divided into three types depending on the way they provide stability [4]: Spar platform, where the ballast lowers the center of gravity to provide stability, semi-submerged platform, where several floating bodies provide recovery torque, and Tension Leg Platform, where the mooring cable tension provides stability.
In recent years, many researchers have combined the characteristics of these three types of floating platforms and proposed many different forms of new floating platforms. Based on the original semi-submersible platform, Liu et al. [5] explored the effect of mooring cable arrangement and column inclination on the motion response by changing the mooring cable connection and platform structure. Lai et al. [6] designed a new semi-submersible platform with a deep draft and optimized damping structure and studied its hydrodynamic performance by numerical methods. Le et al. [7] proposed a new 10 MW submersible FOWT concept and established a fully coupled numerical model of the towing system to study the towing performance of a three-column platform versus a four-column one under different wave conditions. Cao et al. [8] designed a 10 MW FOWT concept named SPIC and established the aero-hydro-servo-elastic-moor method to establish a fully coupled numerical model and model tests to investigate its dynamic response in different sea conditions. Konispoliatis et al. [9] combined the characteristics of the semi-submersible platform and TLP platform with oscillating water column device to propose a new concept of FOWT platform named REFOS and based on the numerical model of aero-elastic-hydrodynamic coupling and proportional model test for hydrodynamic analysis to verify its reliability. Jiang et al. [10] designed a novel Stepped Short Spar platform named SJTU-S4 for the problem that the traditional Spar type platform is only applicable to deep water and conducted model tests at a scale of 1:50.
In addition, research on fully coupled methods for FOWT is also a focus of attention. Thomsen et al. [11] investigated and compared three different approaches: Morison approach, linear boundary element method (BEM), and a hybrid approach and evaluated their applicability on the TetraSpar FOWT concept. However, the impact of ocean currents and wind loads on wind turbines is not considered. Alkarem et al. [12] carried out a numerical investigation of DeepCwind semi-submersible FOWTs and investigated two hydrodynamic calibrating methodologies: free decay test-based calibration and wave loading test-based analyzed the irregularity of wave spectra shape and directions influence on the platform motion. However, no wind loads were considered in this analysis. Villoslada et al. [13] presented a general methodology for the identification of a reduced dynamic model of FOWT by Matlab, the coupling between the floating platform and the wind turbine has been modeled using a linearized model. Although this model improves the calculation efficiency without loss of accuracy by linearization and reduction of degrees of freedom, it has not yet considered the influence of turbulent wind and waves. Karimi et al. [14] present a fully coupled frequency domain model for FOWT using the validated numerical tools FAST and WAMIT to obtain the aerodynamic and hydrodynamic performance, respectively. However, compared with the time-domain model, the frequency domain model does improve the calculation efficiency but ignores the influence of turbulent wind and irregular waves. Cermelli et al. [15] integrated FAST into a fluid dynamics analysis tool called TimeFloat for fully coupled modeling of the WindFloat concept. Shim [16] developed an interface to combine FAST with the fluid mechanic’s analysis tool CHARM3D by Fortran, to study the coupled dynamic response of a 1.5 MW TLP FOWT. The platform motions were solved in CHARM3D and then imported into FAST. Based on this method, Bae et al. [17,18,19] analyzed the dynamics of Hywind Spar wind turbine, multi-turbine Semi-submersible wind turbine, and TLP wind turbine and studied their dynamic response under maximum operational and survival conditions. However, CHARM3D-FAST does not consider the speed and acceleration of the platform when solving the motion equation of the upper structure.
The current design solutions for floating platforms of FOWTs provide ideas and a basis for future offshore wind power development. However, the current studies mainly focus on a specific index for individualized solution design and have not yet established a perfect design system for floating platforms of FOWTs. Meanwhile, the analysis of the dynamic response of FOWTs often ignores the structural fully coupled effect. Therefore, it is crucial to establish a process-oriented design system for FOWT platforms considering the full coupling effect of the structure based on combining the advantages of existing FOWT platform solutions. Meanwhile, the proposal of developing a new floating platform of FOWT on this basis has important theoretical significance and engineering application value for future deep-sea wind energy.
Because of this, a new floating platform with a large draft, small waterline surface area, and inclined side columns is designed in this paper. The initial parameters of the platform are optimized iteratively according to the stability and design requirements. The numerical method considering the fully coupled effect is used as the basic method for the current study, and the validity of the method is verified. On this basis, the hydrodynamic performance of the semi-submersible platform, the Spar platform, and the novel floating platform are analyzed. The correlation between structural characteristics and hydrodynamic performance was investigated. The potential relationship between the wind turbine dynamic response and the floating platform motion response is revealed. Finally, the suggestions for the FOWT platform design are proposed.
2. Design of Novel Floating Offshore Wind Turbine Platform
All three mainstream floating platforms have their advantages and disadvantages. Tension leg platforms can resist heave and pitch caused by wind and wave currents, but they are more expensive to manufacture and install and more difficult to construct. In particular, the connection between the tendon and the anchor point on the seabed is not advantageous in the selection of deep-sea floating platform solutions. Spar platform has the characteristics of deep draft, low center of gravity, and less influence by waves, but it is prone to vortex-induced vibration and has relatively low structural safety performance. Although the semi-submersible platform is easy to install and easy to tow, it has the disadvantages of a large waterline area, susceptibility to wave load, shallow draft, etc.
In this paper, a novel floating platform for FOWT is designed based on the design principle of initial stability of the floating body to resist external forces to avoid capsizing. The NREL 5 MW model was chosen for the upper wind turbine model, as it is more commonly studied to provide easy follow-up validation, and its parameters are shown in Table 1.

Table 1.
NREL 5 MW wind turbine parameters.
2.1. Initial Stability Design Principle
The floating platform is in equilibrium by the action of gravity and buoyancy. When the platform is tilted by the environmental load, the position of its floating center changes, thus forming a restoring moment that destroys the original equilibrium state, as shown in Figure 1.
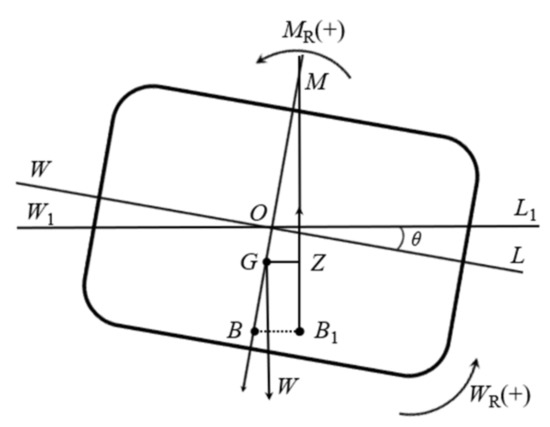
Figure 1.
The diagram effect of restoring torque [20].
When the platform is in the equilibrium position the waterline is , the waterline is after being tilted by external forces at an angle of . After the floating platform tilted , the center of buoyancy moved from to ; extension line intersects the center line at , called metacenter. When is very small, can be viewed as a segment of a circular arc. is center of circle; is the radius of the initial stability center.
Accordingly, it can be inferred that there are two ways to improve the stability of floating platforms: lowering the center of gravity and increasing the moment of inertia. The current mainstream floating platforms are also designed based on these two approaches. For example, the Spar platform lowers the center of gravity by increasing the draft depth, and the semi-submersible platform increases the moment of inertia by multi-column design.
2.2. The Novel Floating Platform
The main direction for optimizing the floating platform is to lower the center of gravity and increase the moment of inertia, as determined by the analysis in Section 2.1. However, lowering the center of gravity will inevitably increase the applicable water depth and manufacturing costs. Increasing the spacing or diameter of the side columns can increase the moment of inertia, but it will lead to enlarged stress on the support structure, and the added displacement of the platform will lead to the tendency of heave resonance. Therefore, this paper proposes that the novel platform uses inclined side columns to enlarge the moment of inertia without significantly increasing the stress. Based on this design principle, the novel platform size is optimized, and the procedure is shown in Figure 2.
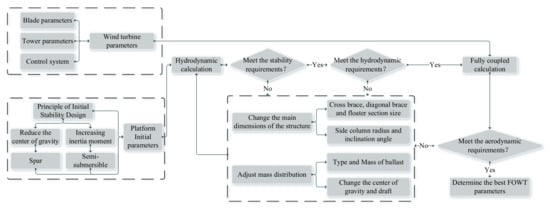
Figure 2.
The flow chart of design optimization of offshore wind turbine floating platform proposed in this paper.
The novel floating platform is designed by combining the advantages of multiple columns (semi-submersible platform) and a large center of gravity (Spar platform). Furthermore, the platform structure is improved based on the inclined side columns. As shown in Figure 3, some detail of the novel floating platform has been presented, and the parameters are listed in Table 2. The upper part is inclined outward. The lower part is simplified as a heave plate to reduce the overall weight. In addition, the novel platform is set with a draft depth greater than the height of the column to reduce the impact of waves. The lower part of the side column is connected by the pontoon. The center column is connected to the horizontal floater by the cross brace and diagonal brace, which reduces the stress and fatigue load at the joint and increases the damping. In terms of design principle, the novel floating platform designed in this paper should have the advantages of semi-submersible and Spar platforms, respectively. The subsequent analysis will compare the various hydrodynamic performances of the three platforms based on the consideration of the upper wind turbine structure.

Figure 3.
Schematic diagram of the novel floating platform model proposed in this paper.

Table 2.
Parameters of the novel floating platform proposed in this paper.
3. Methodology of the Coupling Framework
Unlike other offshore structures, the FOWT platform is equipped with tall towers and huge wind turbines, which are subject to strong aerodynamic thrusts and overturning moments in service. The coupling between aerodynamic loads, hydrodynamic loads, and mooring cable tensions can make the motion of the FOWT exceptionally complex. Therefore, the dynamic analysis method of FOWT needs to consider the interaction between upper and lower structures.
3.1. Environmental Load
3.1.1. Aerodynamic Load
Aerodynamic load calculations for FOWT need to consider the effect of turbulent wind. The turbulent wind is divided into the average wind and fluctuating wind. Average wind speed is expressed as
where is the average wind speed at a height of , is the Karman constant, is the friction velocity, is the roughness parameter.
It has been suggested that the Kaimal spectrum can better describe the energy distribution of the pulsating wind speed field in the frequency domain [21]. Kaimal spectrum is also recommended by the International Electrotechnical Commission (IEC) for turbulent wind design conditions of wind turbines [22]. Kaimal spectrum is expressed as
where is the frequency, is the power spectral density, is the standard deviation of velocity, is the turbulence integration scale, is the hub wind speed.
Aerodynamic loads are calculated by Blade Element Method (BEM). BEM assumes that each blade element is independent and does not influence the other. The aerodynamic load acting on each blade element is determined only by the lift and drag coefficient of the airfoil. Thrust and torque can be expressed as
where is the relative velocity of the blade, is the number of blades, is the chord of this segment of the blade element airfoil, and are the lift and drag coefficients, respectively, is the angle of inflow, is the radius of the blade. On this basis, the thrust and torque of each blade element are obtained and then integrated along the blade to obtain the aerodynamic load of the whole blade.
3.1.2. Hydrodynamic Load
Characteristic diameter of the floating body is less than 0.2 times the incident wavelength, for example, tube and brace have no significant effect on wave motion, mainly considering its viscosity effect and added mass effect. Characteristic diameter greater than 0.2 times the incident wavelength, such as floater and column, has a significant impact on the wave motion, mainly considering the wave diffraction effect. Floating platforms are usually systems that combine the above two structures. This paper calculates the wave load of floating platforms based on Morison formulation and Potential Flow theory, which are widely used in wave theory [23]. Morison formulation of the hydrodynamic force acting on the cross-section of a slender structural member is expressed as
where is drag coefficient, is the characteristic drag diameter, is the lateral velocity of fluid particles, is the lateral velocity of the structure, is the seawater density, take the value of 1.025 g/cm3, is the inertia coefficient, is the cross-sectional area, is the length of the structure.
The total velocity potential of the fluid domain around the floating body structure is expressed as
where is incident wave velocity potential, is diffraction wave velocity potential, is radiation wave velocity potential. Each velocity potential needs to satisfy Laplace equation and boundary conditions.
where is the fluid velocity, is the fluid density, is the pressure, is the height, is the gravitational acceleration.
For the novel floating platform proposed in this paper, the characteristic diameters of the diagonal braces and cross braces are small, and the wave loads in this part need to be calculated by Morison formulation. The characteristic diameters of side columns, center columns, floaters, heave plates, and pontoons are larger, so the wave load in this part is calculated by potential flow theory. The names of each part of the platform are shown in Figure 3a.
3.1.3. Mooring Load
To improve the model accuracy and computational efficiency, the lumped-mass mooring line model is used to calculate the mooring load in this paper [24]. The mooring cable is discretized into uniformly sized line segments connecting nodes to establish a dynamic mooring model. The position of each node is determined by a vector. Each section of the mooring cable has the same density and dimensional characteristics. The equation of motion of the mooring cable is expressed as
where is the th node acceleration matrix, is the static buoyancy of each node, is the gravity of each node, is the axial tension of each node, is the damping force of each node, is the added mass force of the mooring cable, is the seabed support force.
3.1.4. Environmental Conditions
The North Pacific sea state statistics are used to carry out the environmental conditions of this study [25]. The water depth was selected as 200 m and the wind speed was set to the rated wind speed of NREL 5 MW wind turbine. The environmental working conditions parameters are shown in Table 3.

Table 3.
Parameters of environmental conditions in this paper.
3.2. Development of the Coupling Framework
The novel floating wind turbine model is shown in Figure 4. Among them, the blade and tower belong to the ultra-long flexible parts; their deformation cannot be ignored, so we consider the flexible body. The deformation of the hub, nacelle, and the floating platform is negligible and they can be considered as rigid parts. The mooring cable for the centralized mass node simplification considers its dynamic characteristics.
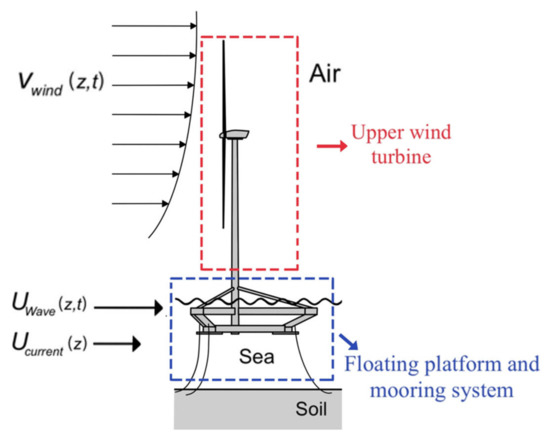
Figure 4.
Novel floating wind turbine.
The numerical analysis method in this paper is implemented based on FAST and AQWA [25,26,27,28]. It contains:
- (1)
- Upper wind turbine: The aerodynamic model based on the BEM, the servo control model based on individual variable pitch, and the multi-body dynamics model based on the Kane equation were developed by FAST.
- (2)
- Floating platform and mooring system: The hydrodynamic model based on Morison formulation and Potential Flow theory and the dynamic mooring model based on the lumped-mass mooring line model were established by AQWA.
- (3)
- Structural coupling: FAST is called through the dynamic link library (DLL) in AQWA for data exchange.
The calculation flow chart is shown in Figure 5.
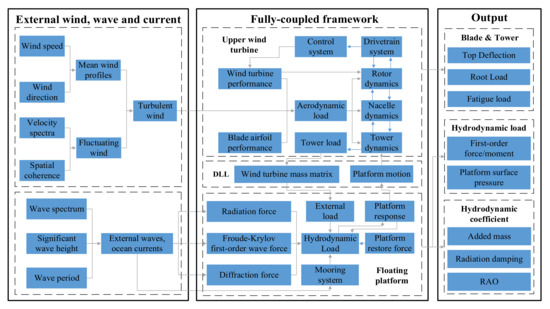
Figure 5.
Calculation flow chart considering the fully coupled effect of the structure.
3.3. Validation
To verify the numerical method, the reference [25] is reappeared (Table 4). The results of this paper’s method with those of OpenFAST are compared. The same controller is used for pitch and torque control. The model settings for the two methods are shown in Table 5.

Table 4.
Verify the study case settings.

Table 5.
Comparison of two calculation models.
Figure 6 and Figure 7 and Table 6 compare the motion response of the wind turbine and the platform calculated by the two methods. The results show that the rotor speed operation trends calculated by the two methods are similar, and the differences between the results of blade tip out-of-plane deflection and tower top fore-aft deflection calculated by the different methods are small. The pitch results calculated by the two methods match well, the error of heave motion response is small, and the predicted surge motion response by the two methods has the same trend of change. Thus, it can be seen that the calculation method in this paper is reliable.
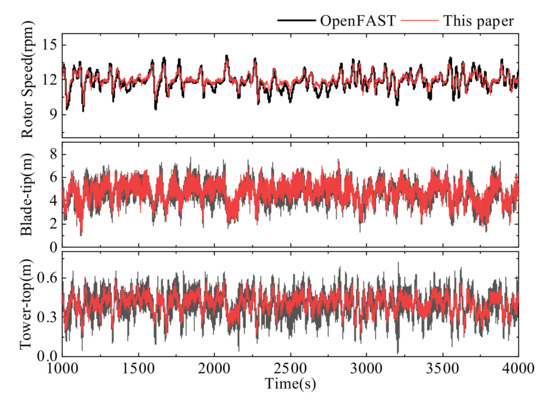
Figure 6.
Wind turbine motion response verification.
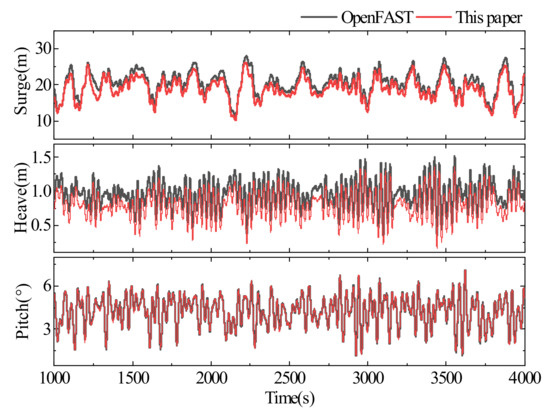
Figure 7.
Platform motion response verification.

Table 6.
The statistics of two calculation models.
4. Motion Response Analysis
Before carrying out the analysis of the results in this paper, it is necessary to define the global coordinate system and the local coordinate system of each part. The global coordinate system and local coordinate system are shown in Figure 8 and Figure 9, respectively.
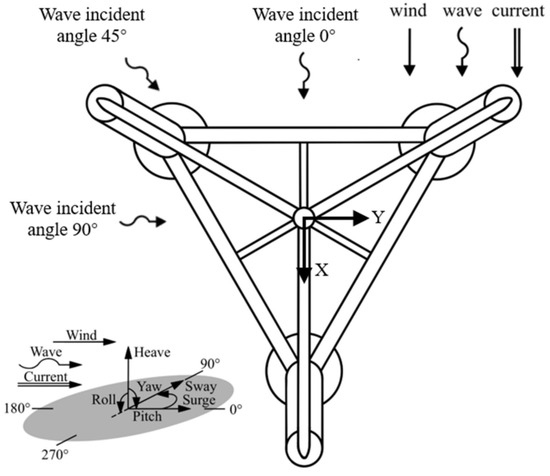
Figure 8.
Global coordinate system and wind, wave, current direction definition.
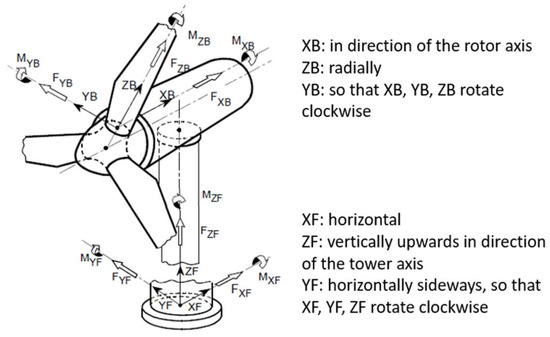
Figure 9.
Blade and tower local coordinate system [29].
4.1. Platform Hydrodynamic Performance
In order to study the hydrodynamic performance of the novel floating platform, OC4 DeepCwind semi-submersible platform [30] and OC3 Hywind Spar platform [31] were selected as the comparison. The structures are shown in Figure 10, the parameters are shown in Table 7, and the mooring system properties of three platforms are shown in Table 8, respectively. It is worth noting that the novel floating platform and the semi-submersible platform have similar structural dimensions, so the same mooring system properties are selected. The optimization of the mooring system parameters of the novel floating platform will be the focus of our future research. Consider the influence of wave frequency and platform form on hydrodynamic performance. The wave frequency range of 0.02 to 0.4 Hz covers the possible range of wave frequencies in the actual ocean (actual wave frequency range of 0.04 to 0.3 Hz [32]).
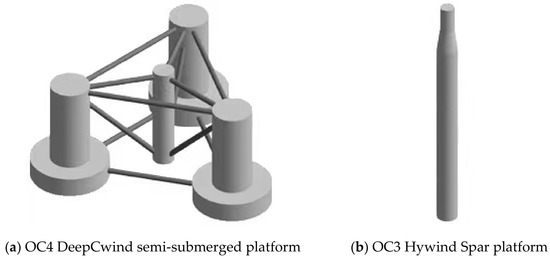
Figure 10.
Schematic of the semi-submerged platform and Spar platform.

Table 7.
Parameters of the semi-submersible platform and Spar platform.

Table 8.
Mooring system properties of three platforms.
4.1.1. Hydrodynamic Load
First-Order Force/Moment
A comparison of the first-order wave forces in the translational direction for the three floating platforms is presented in Figure 11, Figure 12 and Figure 13. Considering the symmetry of the platform, only the results of 0°, 45°, and 90° wave incident angles are presented. The surge first-order wave force is significantly affected by the wave frequency and decreases with the increase of the wave incident angle. The sway first-order wave force is influenced by the wave frequency and increases with the increase of wave incident angle. The heave first-order wave force is less influenced by wave frequency and less influenced by the wave incident angle.
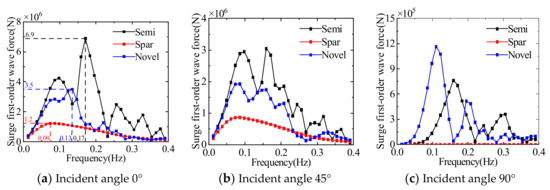
Figure 11.
Comparison of the first-order wave force in surge direction of three floating platforms.

Figure 12.
Comparison of the first-order wave force in sway direction of three floating platforms.

Figure 13.
Comparison of the first-order wave force in heave direction of three floating platforms.
The comparison of the first-order wave moments in the rotation direction of the three floating platforms is presented in Figure 14, Figure 15 and Figure 16. The roll first-order wave moment is significantly affected by wave frequency; the maximum roll first-order wave moment for both the semi-submersible platform and the novel platform occurs at a 45° incident angle. The maximum roll first-order wave moment for the Spar platform occurs at a 90° incident angle. The maximum pitch first-order wave moment of the semi-submersible platform and the novel platform appear at 0° and 90° incident angles and the pitch first-order wave moment of the Spar platform decreases with the increase of the wave incident angle. The maximum yaw first-order wave moment of the semi-submersible platform and the novel platform appear at 90° incident angle, and the first-order wave moment of the Spar platform is not affected by the wave direction.

Figure 14.
Comparison of the first-order wave moment in the roll direction of three floating platforms.

Figure 15.
Comparison of the first-order wave moment in the pitch direction of three floating platforms.

Figure 16.
Comparison of the first-order wave moment in the yaw direction of three floating platforms.
The results of comparing the first-order wave forces (moments) of the three floating platforms at different wave incident angles can be seen: when the wave frequency is in the range of 0.05~0.25 Hz, the first-order wave force and moment of the floating platform are larger. The first-order wave force (moment) of the multi-column platform (including semi-submersible and novel platform) is larger than that of the single-column platform, and there are multiple peaks with the change of wave frequency, which is due to the larger projection area of the multi-column platform in all directions, resulting in its more obvious influence by wave force. In terms of first-order wave force and moment, the Spar platform is significantly better than the other two platforms, but the standard Spar platform adopted in this paper has a draft of 120 m, which greatly limits the use of the water depth range.
Surface Pressure
Figure 17 shows the pressure distribution on the surface of the three floating platforms. The load distribution of the three platforms is similar; all of them have relatively large loads near the water surface, which indicates that the wave load has a great influence on the floating platform. Meanwhile, the maximum surface pressure of the semi-submersible platform is 42.87 kN/m2 and the maximum surface pressure of the Spar platform is 41.624 kN/m2, while the maximum surface pressure of the novel platform is 24.135 kN/m2, which is reduced by 43.7%. It shows that the novel platform reduces the cross-sectional area of the columns and significantly reduces the influence of waves on the platform. Moreover, the maximum pressure distribution area of the novel platform is smaller and only distributed at a single column, while the three columns of the semi-submersible platform and the center column have the maximum pressure distribution. The distance between the columns of the semi-submersible platform is close, and the hydrodynamic influence between the columns is strong.

Figure 17.
Surface pressure distribution of three floating platforms.
4.1.2. Structural Hydrodynamic Coefficient
Added Mass
A comparison of the added mass of the three offshore wind turbine floating platforms is given in Figure 18. The surge/sway added mass of the semi-submersible platform becomes sharply smaller when the wave frequency increases. The surge/sway added mass of the Spar platform is a small change with an increasing wave frequency of about 8 × 10⁷ kg. The surge/sway added mass of the novel platform increases and then decreases with increasing wave frequency. The heave added mass of the semi-submersible platform varies around 1.4 × 10⁷ kg. The heave added mass of the Spar platform varies around 2.3 × 10⁵ kg. The heave added mass of the novel platform varies around 1 × 10⁷ kg. The roll/pitch added mass of the semi-submersible platform varies around 1.1 × 10⁸ kg. The roll/pitch added mass of the Spar platform decreases slightly at the wave frequency and varies around 2.75 × 10⁸ kg. The maximum roll/pitch added mass of the novel platform is about 2.2 × 10⁸ kg. The yaw added mass of the semi-submersible platform and the novel platform increases and then decreases with wave frequency, while the yaw added mass of the Spar platform is much smaller than the other two platforms.
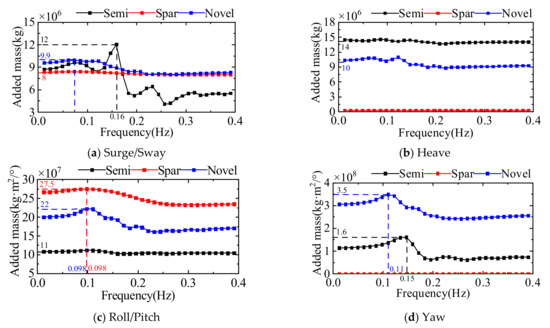
Figure 18.
Comparison of the added mass of three floating platforms.
Compared with the single-column platform, the added mass in each direction of the multi-column platform (semi-submersible and novel platforms) is more influenced by the wave frequency. The typical influence frequency range is 0.1–0.2 Hz. At this frequency, the multi-column platform will show a more obvious added mass attenuation. However, the novel platform proposed in this paper effectively optimizes the added mass attenuation trend and still has a large added mass even at higher frequencies.
Radiation Damping
A comparison of the radiation damping of the three floating platforms is given in Figure 19. The surge/sway radiation damping of the three types of floating platforms is influenced by wave frequency. With the increase of wave frequency, it increases first and then decreases, and the semi-submersible platform is much larger than the other two platforms. The heave radiation damping of the semi-submersible platform and the novel platform is larger in wave frequency, while the heave radiation damping of the Spar platform is small. The roll/pitch radiation damping of the three floating platforms is larger in wave frequency, and the Spar platform and the novel platform are much larger than the semi-submersible platform. The yaw radiation damping of three floating platforms is also affected by wave frequency, especially for semi-submersible platforms and novel platforms.


Figure 19.
Comparison of the radiation damping of three floating platforms.
The radiation damping of the floating platform is influenced by wave frequency. When the wave frequency is in the range of 0.1~0.3 Hz, the radiation damping is larger. At low and high frequencies, the radiation damping of the floating platform is smaller, and the ability to naturally restore balance is weaker. Due to the complex structure of the multi-column platform, the projected area is larger than that of the single-column platform, which makes the radiation damping effect more obvious in comparison. In addition to the wave frequency, the radiation damping is mainly affected by the projected area.
Response Amplitude Operator
Figure 20, Figure 21, Figure 22, Figure 23, Figure 24 and Figure 25 show the response amplitude operators of the three floating platforms for different wave incident angles in the translational direction and the rotational direction, respectively. It can be learned that the anisotropic response amplitude operator of the floating platform is strongly influenced by the wave frequency. The motion response of the floating platform in translation direction is influenced by low-frequency waves, and the motion response in rotation direction is more obviously influenced by common wave frequencies. Due to the symmetry of the structure, the surge and sway response amplitude operators and roll and pitch response amplitude operators of the floating platform show opposite trends. The multi-column structure is more complex than the single-column platform, which makes it easy to produce the yaw.

Figure 20.
Comparison of the response amplitude operator in surge direction of three floating platforms.

Figure 21.
Comparison of the response amplitude operator in sway direction of three floating platforms.

Figure 22.
Comparison of the response amplitude operator in heave direction of three floating platforms.

Figure 23.
Comparison of the response amplitude operator in roll direction of three floating platforms.

Figure 24.
Comparison of the response amplitude operator in pitch direction of three floating platforms.

Figure 25.
Comparison of the response amplitude operator in yaw direction of three floating platforms.
4.2. Wind Turbine Dynamic Response
4.2.1. Analysis of Blade
Blade Tip Deflection
Table 9 and Figure 26 show the time domain statistics and power spectral density of the three FOWT blade tip deflections, respectively. The blade tip out-of-plane deflection is more volatile compared to the blade tip in-plane deflection. The blade is the main part of the aerodynamic thrust, so the blade tip deflection is mainly perpendicular to the rotor plane. The blade tip deflection is affected by the combined effect of rotor rotation and tower vibration. Blade deflection is largely unaffected by the floating platform.

Table 9.
Blade tip deflection statistics.
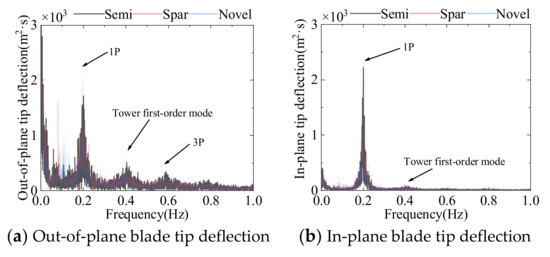
Figure 26.
Power spectral density of blade tip deflection of three FOWTs.
Blade Root Load
Table 10 and Figure 27 and Figure 28 show the time domain statistics and power spectral density of the three FOWT blade root loads, respectively. The blade root shear force is similar to the blade tip deflection, which is mainly in the direction perpendicular to the rotor. The pulsating characteristic of the aerodynamic load leads to much greater shear irregularity in the X direction than in the other two directions. Blade root shear force is influenced by the combined effect of rotor rotation and tower vibration. The aerodynamic load mainly affects the Y-direction root moment, so the Y-direction root moment is much larger than the other two directions, both in terms of value and irregularity. FOWT blade loads are also largely unaffected by changes on floating platforms.

Table 10.
Blade root load statistics.

Figure 27.
Power spectral density of blade root shear force of three FOWTs.

Figure 28.
Power spectral density of blade root moment of three FOWTs.
Blade Fatigue Load
In this section, Miner’s linear cumulative damage rule [33] is used for fatigue analysis. The blade is divided into 17 sections according to the airfoil aerodynamic characteristics, and nine of them are intercepted. Fatigue analysis is performed on the shear force and moment at the center of each blade element. The effects of blade length on Damage Equivalent Load (DEL) and Damage Rate (DR) were investigated. The blade section aerodynamic properties of each node are shown in Table 11.

Table 11.
Blade section properties.
Figure 29 shows the DEL and DR for shear force and moment for different length blade sections of three FOWTs. As the blade length increases, the DEL and DR of the blade decrease, indicating that the blade root is most susceptible to fatigue damage. DEL is only affected by the load amplitude and cycle period. Fz, Mx, and My have larger load variations and longer load cycle periods, so the blade design needs to protect these three directions. DR is proportional to the number of load cycles. Fz contains the effect of blade gravity and is subject to high-frequency alternating loads. My is mainly affected by aerodynamic loads and is subject to much more frequent alternating load cycles than Mx and Mz. The differences between DEL and DR for different FOWT blades are not distinct.
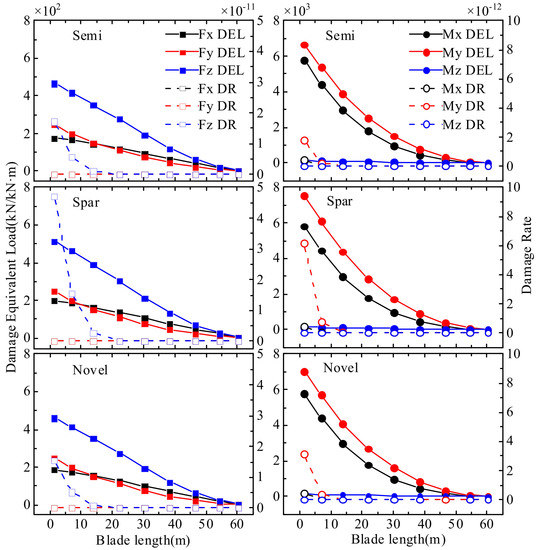
Figure 29.
Blade fatigue load of three FOWTs.
4.2.2. Analysis of Tower
Tower Top Deflection
Table 12 and Figure 30 show the time domain statistics and power spectral density of the three FOWT tower top deflections, respectively. The tower top deflection is mainly in the windward direction. Tower top deflection of Spar FOWT is more volatile than the other two FOWTs. The tower top fore-aft deflection is influenced by platform motion and tower vibration. The tower top side-side deflection is influenced by its vibration mode more than platform motion.

Table 12.
Tower top deflection statistics.
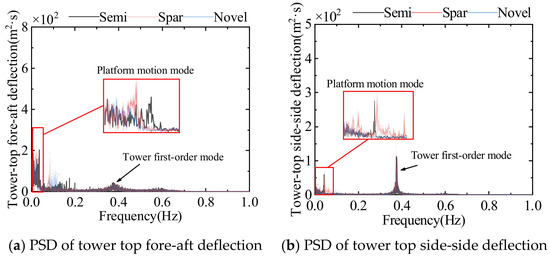
Figure 30.
Power spectral density of tower top deflection of three FOWTs.
Loads at the Tower Base
Table 13 and Figure 31 and Figure 32 show the time domain statistics and power spectral density of the three FOWT tower base loads, respectively. The instability of turbulent winds leads to drastic variations of aerodynamic loads. The tower has a similar trend to the rotor load. The loads at tower base are influenced by the combined effect of platform motion, tower vibration, and rotor rotation. The combined effect of a variety of factors makes the loads at tower base change extremely violent. The load fluctuation frequency of the Spar FOWT is greater than the other FOWTs. It indicates that lowering the center of gravity has a greater effect.

Table 13.
The statistics of loads at tower base.

Figure 31.
Power spectral density of tower base shear force of three FOWTs.

Figure 32.
Power spectral density of tower base moment of three FOWTs.
Tower Fatigue Load
The tower is divided into 50 equal distance sections; nine of these sections are intercepted and fatigue analysis is performed on each tower node. The relationship between the fatigue load and the tower height is studied. At the same time, the DEL and DR at different angles of the same section were analyzed considering the form of the circular section of the tower. The corresponding tower heights for each section are shown in Table 14.

Table 14.
Tower section properties.
Figure 33 shows DEL and DR of the tower nodes at different heights for the three FOWTs. As the tower height increases, the DEL and DR are reduced, indicating that the middle and lower parts of the tower are most susceptible to fatigue damage. The DEL and DR at 0° are the largest, followed by 180° and 90°, and 270° is the lowest, indicating that the tower is more prone to fatigue damage in the fore and aft, and the tower is safer in the side-to-side. Therefore, the tower should be designed with more safety measures at the rear tower. In addition to this, the platform motion has a great impact on the tower fatigue load.
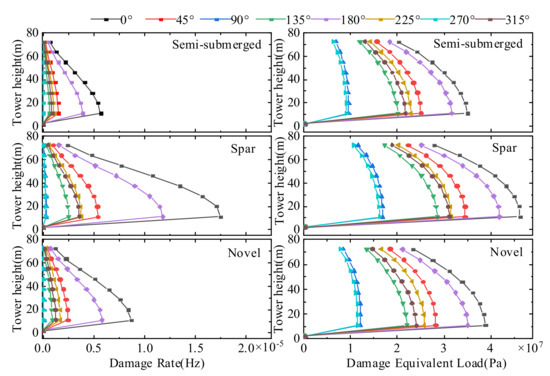
Figure 33.
Damage Equivalent Load and Damage Rate of three FOWT towers.
4.2.3. Analysis of Platform
In order to compare the motion performance of three different floating platforms, a spectral analysis of the platform motion response was performed.
The PSD of the motion response of the three FOWTs is shown in Figure 34. The PSD of surge motion at the low and wave frequencies of the novel platform and Spar platform is significantly lower than that of the semi-submersible platform, indicating that the small waterline surface can reduce the influence of waves on the platform. The novel platform’s PSD of heave motion is greatly reduced, and the peak corresponding frequency of 0.024 Hz is far away from the wave frequency, which reduces the possibility of heave resonance. The higher PSD of pitch motion at the wave frequency of the novel platform indicates that the pitch motion response of the novel platform is slightly larger than that of the other two floating platforms.

Figure 34.
Power spectral density of the motion response of three FOWTs.
4.3. Wind Turbine Output Power
In order to investigate the effect of different platform structures on the final capacity, the output power of the three FOWTs is compared.
Figure 35 and Figure 36 show the output power trends of the three FOWTs. It can be seen that the three FOWTs’ output power change trend is relatively close, and output power of Spar FOWT change is greater than the other two FOWTs. This confirms that the Spar FOWT is more affected by the low frequency response.
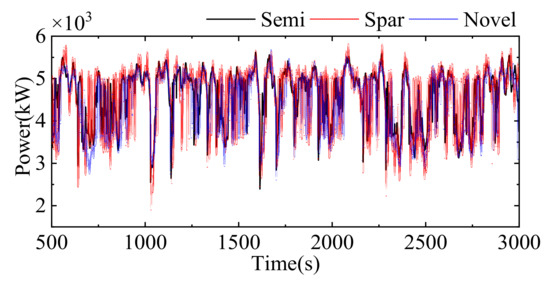
Figure 35.
Output power curves of three FOWTs.
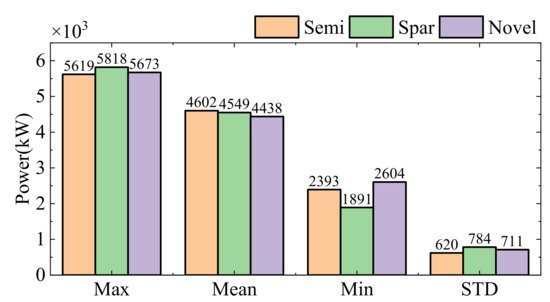
Figure 36.
Output power statistics of three FOWTs.
5. Conclusions
In this paper, a novel floating platform for FOWT is designed by combining the characteristics of the semi-submersible platform and the Spar platform. Considering the fully coupled effect, the hydrodynamic performance and dynamic response of the semi-submersible FOWT, Spar FOWT, and the novel FOWT are analyzed. The following conclusions are obtained:
- (1)
- The novel floating platform proposed based on the optimized design process in this paper can significantly reduce the effect of wave loads. The novel platform reduces the overall mass of the platform by almost 10% compared to the semi-submersible platform. Compared with the Spar platform, the novel platform can reduce the draft depth by 80%, which can effectively improve the applicable water depth range. Comparing the hydrodynamic performance of the novel platform with the semi-submersible and Spar platforms, the novel floating platform can significantly optimize the hydrodynamic performance and has better restoring ability after being subjected to the external load. The novel floating platform can significantly reduce the peak of heave and its corresponding wave frequency compared with the semi-submersible platform and reduce the possibility of heave resonance.
- (2)
- The first-order wave force and moment of the floating platform depend mainly on the projected area of the platform in all directions. It should be designed and constructed in such a way that the waves are parallel to the floating platform to avoid excessive lateral wave forces. The heave added mass of the multi-column platform is significantly larger than that of the single-column platform. The pitch/roll added mass is related to the center of gravity of the platform. The multi-column platform is more complex, making the isotropic radiation damping significantly greater than the single-column platform and more obvious in the wave frequency range. The novel floating platform structure form can significantly reduce the platform surface pressure of wave action.
- (3)
- The influence of the floating platform of FOWT on the dynamic response of the upper wind turbine is mainly reflected at the tower, with less influence on the blades. Blade deformation and blade load are mainly affected by the aerodynamic load but also due to rotor rotation and tower vibration interference resonance. Blade fatigue loads exist mainly downwind of the blade root and are largely unaffected by the platform. Unlike the blade response, the tower dynamic response is mainly affected by the platform motion and is also related to the rotor rotation and the tower’s vibration mode. Fatigue loads are most pronounced at the tower base and can also be affected by changes in platform form.
Author Contributions
Conceptualization, H.Z. and H.W.; methodology, H.Z.; software, H.Z.; validation, H.Z., H.W. and X.C.; formal analysis, H.Z.; investigation, H.Z.; resources, Y.W.; data curation, J.X.; writing—original draft preparation, H.Z.; writing—review and editing, H.W.; visualization, J.X.; supervision, X.C. and N.Z.; project administration, Y.W.; funding acquisition, X.C. All authors have read and agreed to the published version of the manuscript.
Funding
This research was funded by the National Key Research and Development Project of China (No.2019YFB1503701), National Natural Science Foundation of China (No.5207080548), and sponsored by the “first group of the 2011 plan of Jiangsu Province” ([2013]56), which are gratefully acknowledged.
Institutional Review Board Statement
Not applicable.
Informed Consent Statement
Not applicable.
Data Availability Statement
Not applicable.
Acknowledgments
The authors would like to thank Yang Yang from Ningbo University for his valuable discussion of simulation in F2A software.
Conflicts of Interest
The authors declare no conflict of interest.
References
- Veers, P.; Dykes, K.; Lantz, E.; Barth, S.; Bottasso, C.L.; Carlson, O.; Clifton, A.; Green, J.; Green, P.; Holttinen, H.; et al. Grand challenges in the science of wind energy. Science 2019, 366, eaau2027. [Google Scholar] [CrossRef] [PubMed] [Green Version]
- Lee, J.; Zhao, F. Global Wind Report; GWEC: Brussels, Belgium, 2021. [Google Scholar]
- Butterfield, S.; Musial, W.; Jonkman, J.; Sclavounos, P. Engineering Challenges for Floating Offshore Wind Turbines; National Renewable Energy Lab (NREL): Golden, CO, USA, 2007. [Google Scholar]
- Thiagarajan, K.P.; Dagher, H.J. A Review of Floating Platform Concepts for Offshore Wind Energy Generation. J. Offshore Mech. Arct. Eng. 2014, 136, 020903. [Google Scholar] [CrossRef]
- Liu, Z.; Zhou, Q.; Tu, Y.; Wang, W.; Hua, X. Proposal of a Novel Semi-Submersible Floating Wind Turbine Platform Composed of Inclined Columns and Multi-Segmented Mooring Lines. Energies 2019, 12, 1809. [Google Scholar] [CrossRef] [Green Version]
- Bin Lai, B.; Zhao, C.B.; Chen, X.M.; Tang, Y.H.; Lin, W. A Novel Structural Form of Semi-Submersible Platform for a Floating Offshore Wind Turbine with Hydrodynamic Performance Analysis. Appl. Mech. Mater. 2013, 477–478, 109–113. [Google Scholar] [CrossRef]
- Le, C.; Ren, J.; Wang, K.; Zhang, P.; Ding, H. Towing Performance of the Submerged Floating Offshore Wind Turbine under Different Wave Conditions. J. Mar. Sci. Eng. 2021, 9, 633. [Google Scholar] [CrossRef]
- Cao, Q.; Xiao, L.; Cheng, Z.; Liu, M. Dynamic responses of a 10 MW semi-submersible wind turbine at an intermediate water depth: A comprehensive numerical and experimental comparison. Ocean Eng. 2021, 232, 109138. [Google Scholar] [CrossRef]
- Konispoliatis, D.; Katsaounis, G.; Manolas, D.; Soukissian, T.; Polyzos, S.; Mazarakos, T.; Voutsinas, S.; Mavrakos, S. REFOS: A Renewable Energy Multi-Purpose Floating Offshore System. Energies 2021, 14, 3126. [Google Scholar] [CrossRef]
- Jiang, Z.; Wen, B.; Chen, G.; Xiao, L.; Li, J.; Peng, Z.; Tian, X. Feasibility studies of a novel spar-type floating wind turbine for moderate water depths: Hydrodynamic perspective with model test. Ocean Eng. 2021, 233, 109070. [Google Scholar] [CrossRef]
- Thomsen, J.; Têtu, A.; Stiesdal, H. A Comparative Investigation of Prevalent Hydrodynamic Modelling Approaches for Floating Offshore Wind Turbine Foundations: A TetraSpar Case Study. J. Mar. Sci. Eng. 2021, 9, 683. [Google Scholar] [CrossRef]
- Alkarem, Y.; Ozbahceci, B. A Complemental Analysis of Wave Irregularity Effect on the Hydrodynamic Responses Offshore Wind Turbines with the Semi-Submersible Platform. Appl. Ocean Res. 2021, 113, 102757. [Google Scholar] [CrossRef]
- Villoslada, D.; Santos, M.; Tomás-Rodríguez, M. General Methodology for the Identification of Reduced Dynamic Models of Barge-Type Floating Wind Turbines. Energies 2021, 14, 3902. [Google Scholar] [CrossRef]
- Karimi, M.; Buckham, B.; Crawford, C. A fully coupled frequency domain model for floating offshore wind turbines. J. Ocean Eng. Mar. Energy 2019, 5, 135–158. [Google Scholar] [CrossRef]
- Cermelli, C.; Roddier, D.; Aubault, A. Wind Float: A Floating Foundation for Offshore Wind Turbines—Part II: Hydrodynamics Analysis. ASME 2009, 43444, 135–143. [Google Scholar] [CrossRef]
- Shim, S. Coupled Dynamic Analysis of Floating Offshore Wind Farms. MSc Thesis, Texas A & M University, College Station, TX, USA, 2007. [Google Scholar]
- Bae, Y.H.; Kim, M.H. Aero-Elastic-Control-Floater-Mooring Coupled Dynamic Analysis of Floating Offshore Wind Turbine in Maximum Operation and Survival Conditions. J. Offshore Mech. Arct. Eng. 2014, 136, 020902. [Google Scholar] [CrossRef]
- Bae, Y.; Kim, M. Coupled dynamic analysis of multiple wind turbines on a large single floater. Ocean Eng. 2014, 92, 175–187. [Google Scholar] [CrossRef]
- Bae, Y.; Kim, M. Rotor-floater-tether coupled dynamics including second-order sum–frequency wave loads for a mono-column-TLP-type FOWT (floating offshore wind turbine). Ocean Eng. 2013, 61, 109–122. [Google Scholar] [CrossRef]
- Barrass, B.; Derrett, D.R. Ship Stability for Masters and Mates; Elsevier: Burlington, MA, USA, 2006. [Google Scholar]
- Nybø, A.; Nielsen, F.G.; Reuder, J.; Churchfield, M.J.; Godvik, M. Evaluation of different wind fields for the investigation of the dynamic response of offshore wind turbines. Wind. Energy 2020, 23, 1810–1830. [Google Scholar] [CrossRef]
- International Electrotechnical Commission. Wind Energy Generation Systems-Part 3-2: Design Requirements for Floating Offshore Wind Turbines; IEC TS: Geneva, Switzerland, 2019. [Google Scholar]
- Chen, P.; Chen, J.; Hu, Z. Review of Experimental-Numerical Methodologies and Challenges for Floating Offshore Wind Turbines. J. Mar. Sci. Appl. 2020, 19, 339–361. [Google Scholar] [CrossRef]
- Hall, M.; Goupee, A. Validation of a lumped-mass mooring line model with DeepCwind semisubmersible model test data. Ocean Eng. 2015, 104, 590–603. [Google Scholar] [CrossRef] [Green Version]
- Yang, Y.; Bashir, M.; Michailides, C.; Li, C.; Wang, J. Development and application of an aero-hydro-servo-elastic coupling framework for analysis of floating offshore wind turbines. Renew. Energy 2020, 161, 606–625. [Google Scholar] [CrossRef]
- Yang, Y.; Bashir, M.; Michailides, C.; Mei, X.; Wang, J.; Li, C. Coupled analysis of a 10 MW multi-body floating offshore wind turbine subjected to tendon failures. Renew. Energy 2021, 176, 89–105. [Google Scholar] [CrossRef]
- Yang, Y.; Bashir, M.; Li, C.; Wang, J. Investigation on mooring breakage effects of a 5 MW barge-type floating offshore wind turbine using F2A. Ocean Eng. 2021, 233, 108887. [Google Scholar] [CrossRef]
- Yang, Y.; Bashir, M.; Wang, J.; Yu, J.; Li, C. Performance evaluation of an integrated floating energy system based on coupled analysis. Energy Convers. Manag. 2020, 223, 113308. [Google Scholar] [CrossRef]
- GL, D. Loads and Site Conditions for Wind Turbines; DNV: Høvik, Norway, 2016. [Google Scholar]
- Coulling, A.J.; Goupee, A.J.; Robertson, A.N.; Jonkman, J.M.; Dagher, H.J. Validation of a FAST semi-submersible floating wind turbine numerical model with DeepCwind test data. J. Renew. Sustain. Energy 2013, 5, 023116. [Google Scholar] [CrossRef]
- Yue, M.; Liu, Q.; Li, C.; Ding, Q.; Cheng, S.; Zhu, H. Effects of heave plate on dynamic response of floating wind turbine Spar platform under the coupling effect of wind and wave. Ocean Eng. 2020, 201, 107103. [Google Scholar] [CrossRef]
- Faltinsen, O. Sea Loads on Ships and Offshore Structures; Cambridge University Press: Cambridge, UK, 1993. [Google Scholar]
- Hayman, G.J. MLife Theory Manual for Version 1.00; National Renewable Energy Laboratory (NREL): Golden, CO, USA, 2012. [Google Scholar]
Publisher’s Note: MDPI stays neutral with regard to jurisdictional claims in published maps and institutional affiliations. |
© 2022 by the authors. Licensee MDPI, Basel, Switzerland. This article is an open access article distributed under the terms and conditions of the Creative Commons Attribution (CC BY) license (https://creativecommons.org/licenses/by/4.0/).