Article

Development of a webGIS Application to Assess Conflicting Activities in the Framework of Marine Spatial Planning

Laboratory of Environmental Quality and Geospatial Applications, Department of Marine Sciences, School of the Environment, University of the Aegean, 81100 Mytilene, Lesvos, Greece
*
Author to whom correspondence should be addressed.
J. Mar. Sci. Eng. 2022, 10(3), 389; https://doi.org/10.3390/jmse10030389
Submission received: 4 February 2022 / Revised: 28 February 2022 / Accepted: 4 March 2022 / Published: 8 March 2022
(This article belongs to the Special Issue Decision Support Systems and Tools in Coastal Areas)

Abstract

:
Marine spatial planning (MSP) has been established as the appropriate policy framework to study and resolve conflicts that arise among various activities. A pre-requisite for the successful implementation of MSP is the availability of efficient tools to support decision-makers and enhance stakeholders’ engagement. In this paper, a webGIS application is proposed that is able to assess the intensity of conflicts among marine activities; the area of the Cyclades in the Aegean Sea was used as a case study. The webGIS application allows the visualization of existing activities, the delineation of conflicting activities, the detection of areas where multiple conflicts co-exist, and the delineation of areas of conflicts based on specific criteria. The webGIS application is available via a user-friendly interface as well as allowing interaction with users by providing them the opportunity to comment on the results and/or exchange ideas with other users of various groups; therefore, the participatory process, a creative stage in MSP, is further supported. The usefulness of such tools in coastal and marine planning and the decision-making process are further discussed.

1. Introduction

During the last years, there is a growing demand for space in both marine and coastal areas regarding different activities which are expected to increase in number and intensity, as a result of the current and future demand for marine resources [1]. This growing demand has led to conflicts due to the overlapping of various activities related to economic development and specific social and environmental goals, which cause higher pressure on marine ecosystems, along with space competition [1,2,3,4]. These conflicts could be either “user-environment conflicts”, which arise between the human uses and the environment, or “user-user conflicts”, when various activities are incompatible with each other, competing for space; for instance, between fisheries and gas/oil development [5,6]. This high and ever-increasing requirement for maritime space to implement diverse activities led to the demand for an incorporated management and planning procedure [7]. Nowadays, marine spatial planning (MSP) is recognized as the procedure which assesses and allocates the spatio-temporal distribution of various maritime activities by managing coastal and marine resources based on the contributions of policy specialists, scientists, and experts with the final aim to successfully resolve the arising conflicts [8,9,10,11,12,13,14,15].
MSP’s main purpose is to balance the development of marine activities along with the enhancement of cross-border cooperation via transparency, improved coordination among administrations, more explicit legislation, and the early detection of conflicts that may emerge from the different activities [4,7]. Consequently, MSP is a public procedure, which assists in the allocation and analysis of the spatiotemporal distribution of marine activities, resulting in the achievement of the ecological and socio-economic objectives, commonly defined over a political process [4,12,16,17].
MSP has been recognized to have multiple benefits beyond the assessment of conflicting activities, such as the conservation of ecosystem services, the development of alternative policies for the sustainable use of marine resources, and planning for the future [18]. During the last decade, MSP has become the procedure for the successful implementation of the maritime and coastal management’s multiple goals, since at least 13 countries have established maritime plans; such are the efforts made by Germany, Netherlands, Norway, Belgium, U.S., Canada, and Australia [10,19,20,21,22,23], which cover the 7% of the world’s territorial waters and exclusive economic zones [24]. Moreover, various countries all over the world have adopted MSP to identify and resolve conflicts among competing uses in marine areas as well as between human uses regarding the natural marine environment [25], and it is expected that a third of the world’s exclusive economic zones will be regulated by spatial plans by 2030 [26]. However, the development and implementation of MSP, despite its widespread recognition and use, continues to meet hundreds of challenges, both practical and conceptual, that are related to sources of science, society, environment, economy, and policy [8].
An important factor to ensure the effective development of MSP is mapping the marine areas’ biophysical characteristics, as well as the activities that are occurring in these areas [12,27]. The mapping process consists of identifying, collecting, and compiling the accessible ecosystem services’ data, along with the biophysical data of great importance or the ecosystems’ characteristics that are providing these services. Subsequently, the successful development and implementation of MSPs cannot be achieved without the collection of the necessary spatial data [28], through which the spatio-temporal distribution of the present and future activities is determined [7]. Particularly, the MSP process includes the development of GIS thematic layers, such as mapping of both coastal [29] and open sea [30] fishing activity, the evaluation of potential interactions between whales and shipping [31], the relative sensitivity of seabirds within the English territorial waters, to offshore wind farms [32], etc.
Geographic Information Systems (GIS) have been extensively used in decision-making and the management of marine and coastal areas [33,34], providing a suitable environment for gathering, storing, processing, and analyzing the spatial information, while at the same time are considered to be necessary at the different stages of the MSP process [35,36]. Over the last decade, the rapid growth of the internet resulted in the emergence of new capabilities regarding visualization, mapping, and decision-making at various spatial scales. The integration of internet technologies with GIS has led to the development of web-based GIS (webGIS) applications [37], which are gaining popularity and are useful both for sharing and interoperating diverse spatial data [38]. These applications can be accessed by multiple users, enabling simultaneous visualization, processing, and analysis of spatial information without the necessity to install any specialized software [39].
In the literature, a wide range of methods are found for assessing and managing conflicts in the framework of MSP. For instance, GIS combined with multi-criteria decision analysis (MCDA) and integer goal programming (IGP) were used for the identification of conflict hotspots and the determination of the best feasible use patterns to support decisions regarding conflict management [40]. GIS were also applied in conjunction with stakeholder participation for the identification of conflicts in areas where small-scale fishing takes place and for suggesting strategies to minimize these conflicts [41]. However, the development of criteria that are suitable to study the conflicts’ assessment has not been widely used. A first attempt was made for the assessment of the potential spatio-temporal conflicting activities within Washington’s marine waters. In particular, the marine potential conflict index (MPCI) was developed, combining the uses’ space, time, and intensity [42]. Another attempt was made in the Adriatic Sea, during the ADRIPLAN (ADRiatic Ionian maritime spatial PLANning) project, where a tool was developed for conflict analysis of the marine activities (COEXIST). The development of the tool was based on the criteria that were derived by experts’ judgment regarding the spatio-temporal characteristics of the various marine uses and resulted in the visualization of the conflict scores for the marine activities pairs that were detected in the same cell [43].
Moreover, the possible co-existence of marine activities is emboldened by the EU, resulting in the multi-use (MU) of marine space [44,45]. This multi-use concept is supported by the Marine/Maritime Spatial Directive, enabling the EU Member States to integrate the concept of multi-use into their legislation [44]. In Greece, the multi-use MSP setting is presented through various examples; the possible co-existence of fisheries and tourism, where the fishing activity status is examined, along with its potentials and the obstacles that need to be overcome to regulate multi-use opportunities [46]. Moreover, the possible co-existence of small-scale fisheries (SSF), tourism, and nature conservation is being assessed in another case study in Greece, in the sense of multi-use in the marine space, following the DABI analysis (drivers, added values, barriers, and negative impacts) [47]. Furthermore, other interesting works that were performed in the framework of multi-use can be found in research projects, such as the Horizon 2020 project MARIBE and the MUSICA project [48,49].
In this paper, a webGIS application is presented aiming to support MSP through the visualization of conflicts in marine areas and the assessment of their intensity based on specific criteria. The application includes several geoprocessing (GP) tools and can be accessed via a user-friendly interface by people with different levels of knowledge on GIS such as scientists, decision-makers, stakeholders, and the wider public. The area that was selected as a case study was the Cyclades in the Aegean Sea, Greece.

2. Materials and Methods

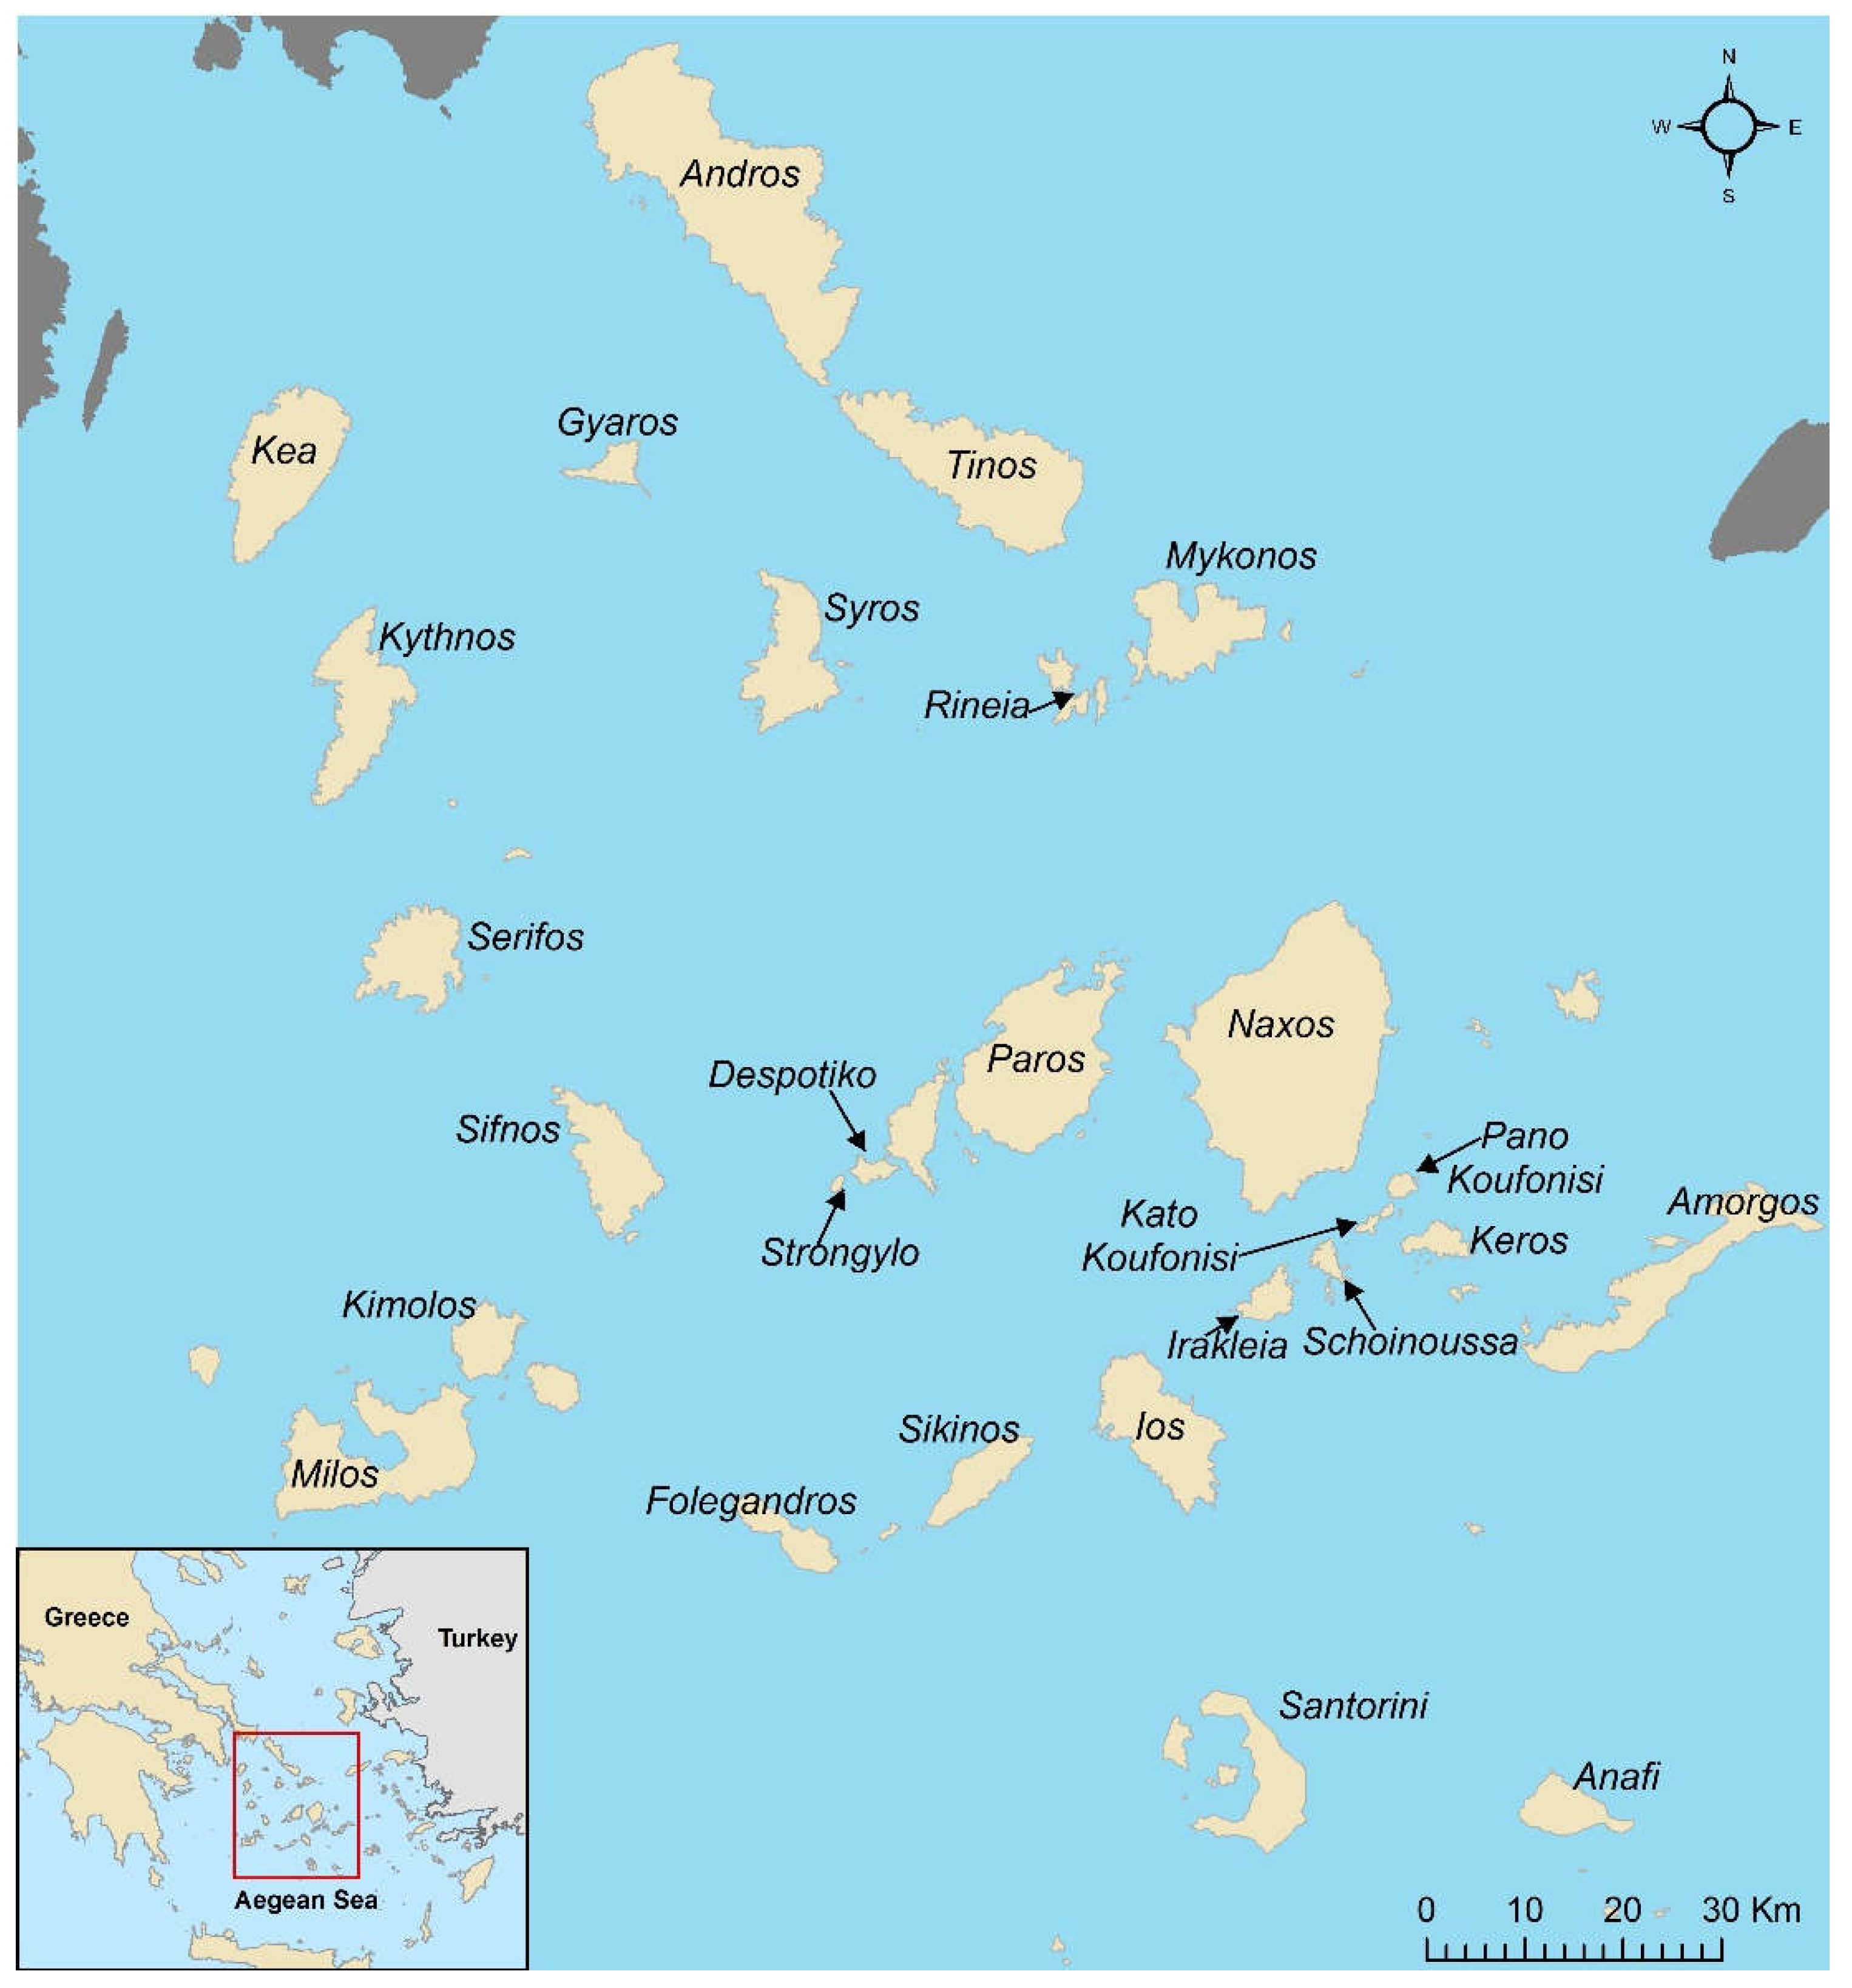
2.1. Study Area and Source of Data

The Cyclades is a group of islands with an irregular coastline, including Naxos which is the largest one, Syros, Paros, Andros, Tinos, Mykonos, Amorgos, Santorini, Ios, etc. (Figure 1). The islands have similar cultural and geographical characteristics; however, each one has its particular character that is relevant to its touristic growth, topography, and local customs. The implementation of effective MSP is considered of major importance in this area where diverse activities such as fisheries, aquaculture, tourism, etc., co-exist with a significant number of infrastructures, i.e., submarine communication cables, ports, and marinas [7]. Furthermore, a large extent of the area is protected by Natura 2000 which makes imperative the need to protect the natural environment and the cultural heritage.
The activities that take place in the study area were identified and numerous sources were used to collect the relevant datasets among which various websites with open access data (i.e., geodata.gov.gr, EMODnet, etc.), as well as several public and private services, such as the Hellenic Ministries of Rural Development and Food, of Environment and Energy, of Culture and Sports, etc.

2.2. Methodology

2.2.1. Geodatabase Development—Spatial Analysis—Delineation of Conflicting Activities

Geographic Information Systems (GIS) are computerized systems that are used to input, store, query, manage, analyze, display, and describe spatial information and geographic data of the Earth’s surface [50]. GIS integrates a powerful set of tools for the manipulation of spatial data [51] with the most popular processes included in spatial analysis. Spatial analysis is used to understand phenomena at a spatial scale and solve practical geospatial problems [52,53,54]. Spatial analysis combines a set of mathematical functions in different ways to create a variety of models of more complex analysis. These analysis models may include various functions, such as basic spatial queries, creating zones of interest, overlay by using map algebra, calculating surface models such as slope maps and aspect maps, calculations of spatial statistical analysis, etc. [55]. Neighbor functions are the most common methods of spatial analysis. They are used to evaluate the characteristics of an area surrounding an element, using the position of the element itself as a parameter [52]. Overlay methods are spatial analysis functions that allow the combination of two or more cartographic layers. GIS can support overlay methods using an algebraic function, i.e., perform an algebraic calculation by using mapping layers as data [56]. Intersect analysis is a type of overlay method that is used to combine two or more layers by preserving their common features and storing the result into a new layer [57]. Furthermore, buffer zone methods are the most important neighborhood functions that define an area surrounding one or more geographical elements. The created buffer zones may have either a specific width or it can vary depending on the area’s characteristics [52,58,59].
The information that was collected regarding the activities in the area was stored in a geodatabase that was designed and implemented for this purpose in a GIS environment. The acquired datasets were originally in diverse formats, such as vector, pdf files, or excel tables, so it was necessary to convert them to a compatible format to GIS in a common coordinate system. A total of 14 GIS layers that were representative of the activities taking place in the study area were stored in the geodatabase: marine aquaculture, purse seining, coastal fishing, trawling, bathing waters, ports, passenger shipping routes, marinas, anchorages, submarine communication cables, wastewater disposal, underwater archaeological sites, marine protected areas (Natura 2000), and areas that were covered by the phanerogamous plant Posidonia oceanica (Table 1). In addition, several of these layers were further processed using spatial analysis to provide additional information regarding the areas where relevant activities are allowed according to the existing European/Greek legislation and local/regional regulations.
The first step for the detection of the conflicting activities was the formation of a table of conflicts that was based on the existing European/Greek legislation and local/regional regulations as well [60]. As a result, 43 conflicts were detected in the area; consequently, 43 vector layers were created, each one representing the areas where 2 conflicting activities co-exist. The conflicting activities detected in the study area are the following: C1: Coastal fishing-Marine aquaculture, C2: Coastal fishing-Bathing waters, C3: Coastal fishing-Anchorages, C4: Coastal fishing-Ports, C5: Coastal fishing-Marinas, C6: Coastal fishing-Shipping routes (passenger), C7: Coastal fishing-Wastewater disposal, C8: Coastal fishing-Submarine communications cable, C9: Coastal fishing-Marine protected areas (Natura 2000), C10: Coastal fishing-Underwater archaeological sites, C11: Coastal fishing-Areas covered by Posidonia oceanica, C12: Purse seining-Marine aquaculture, C13: Purse seining-Anchorages, C14: Purse seining-Ports, C15: Purse seining-Marinas, C16: Purse seining-Shipping routes (passenger), C17: Purse seining-Wastewater disposal, C18: Purse seining-Submarine communications cable, C19: Purse seining-Marine protected areas (Natura 2000), C20: Purse seining-Underwater archaeological sites, C21: Purse seining-Areas covered by Posidonia oceanica, C22: Trawling-Shipping routes (passenger), C23: Trawling-Submarine communications cable, C24: Trawling-Marine protected areas (Natura 2000), C25: Marine aquaculture-Marine protected areas (Natura 2000), C26: Marine aquaculture-Areas covered by Posidonia oceanica, C27: Bathing waters-Anchorages, C28: Bathing waters-Ports, C29: Bathing waters-Marinas, C30: Bathing waters-Shipping routes (passenger), C31: Bathing waters-Wastewater disposal, C32: Anchorages-Shipping routes (passenger), C33: Anchorages-Marine protected areas (Natura 2000), C34: Anchorages-Underwater archaeological sites, C35: Anchorages-Areas covered by Posidonia oceanica, C36: Ports-Marinas, C37: Ports-Marine protected areas (Natura 2000), C38: Ports-Underwater archaeological sites, C39: Ports-Areas covered by Posidonia oceanica, C40: Marinas-Underwater archaeological sites, C41: Marinas-Areas covered by Posidonia oceanica, C42: Shipping routes (passenger)-Marine protected areas (Natura 2000), C43: Wastewater disposal-Areas covered by Posidonia oceanica. These vector layers were also stored in the geodatabase. It should be noted here that the temporal character of the conflicts was not considered in this study. More information regarding the activities and the resulting conflicts in the study area are provided by Pataki & Kitsiou [60].

2.2.2. The webGIS Application

WebGIS is the result of the integration of GIS with the internet, therefore, incorporating the advantages of both technologies. In addition to desktop GIS capabilities that are systems that allow georeferenced data to be processed and displayed locally on a device, webGIS applications allow geoprocessing to be executed through a browser. They are based on a client-server architecture; the client through a browser displays spatial and attribute data, acquires input data and commands for further analysis of the spatial data. On the other hand, the server processes the input data and provides the client with the required data in the form of vector type, raster type, or attribute data. The ArcGIS Desktop 10.8.1 ESRI and the ArcGIS Server 10.8.1 ESRI were used to develop and store the GP services. ArcGIS Enterprise portal ESRI allows sharing the web maps, GP tools, and webGIS applications via the internet. In this paper, a webGIS application was developed providing five GP tools via a user-friendly interface. The architecture of the webGIS application with the available GP tools is shown in Figure 2. The developed webGIS application is available to the public and other relevant groups via the link: https://sdi-portal.aegean.gr/portal/apps/sites/#/conflicts-assessment (accessed on 3 March 2022).
Using the webGIS application, users can visualize the (a) activities that take place in the study area, (b) areas where conflicting activities are detected, (c) areas where two specific conflicts co-exist, (d) areas where more than a specific number of conflicts co-exist, (e) areas where conflicts exist within a specific zone area around a point of interest, (f) areas where conflicts exist within a zone around the coastline, (g) areas of conflicts that are larger than a specific extent, and (h) the extent of all the above-delineated areas.
The first GP tool allows the detection of areas where two user-defined conflicts co-exist. This GP tool performs intersect analysis and displays the common areas of the two conflicts.
The second GP tool allows the detection of areas where more than a –user-selected number of conflicts co-exist; a drop-down list is available where the user can choose this number. The resulting areas are illustrated by different colors according to the relative number of conflicts.
The third GP tool allows searching for the areas of co-existing conflicts in a specific zone around a point of interest. The user can digitize a point of interest, and a buffer zone is created around it which is intersected with the layer of the conflicts in the area. The resulting areas are illustrated by different colors according to the relative number of conflicts.
The fourth GP tool can detect the areas of co-existing conflicts within a selected distance from the coastline. The user can choose the width of the buffer zone to be created from the coastline; the latter is intersected with the layer of the conflicts in the area. The resulting areas are illustrated by different colors according to the relative number of conflicts.
The fifth GP tool can detect the areas where the extent of co-existing conflicts is higher than a selected extent.
It is important that the webGIS application includes a link as well to a website where users can comment on the results of the GP tools and express their opinion about conflicts assessment and propose management plans to resolve conflicts in the study area. This additional capability enhances and supports public engagement during the implementation of MSP.

3. Results and Discussion

3.1. Application of the Developed Web GP Tools

3.1.1. GP Tool 1: Detection of Areas Where Two Specific Conflicts Co-Exist

The first GP tool (Figure 3) was applied to detect whether the conflicts ‘C19: Purse seining—Marine Protected areas (Natura 2000)’ and ‘C11: Coastal fishing—Areas covered by Posidonia oceanica’ co-exist somewhere in the study area. The result is illustrated in Figure 3, where the detected areas are visualized as green polygons. In this example, the conflicts C19 and C11 co-exist mainly in the coastal areas of Paros, Antiparos, Despotiko, Milos, Kimolos, Pano Koufonisi, and Kato Koufonisi as well as in several coastal areas of Naxos, Andros, Serifos, Rineia, Schoinoussa, and Kythnos.

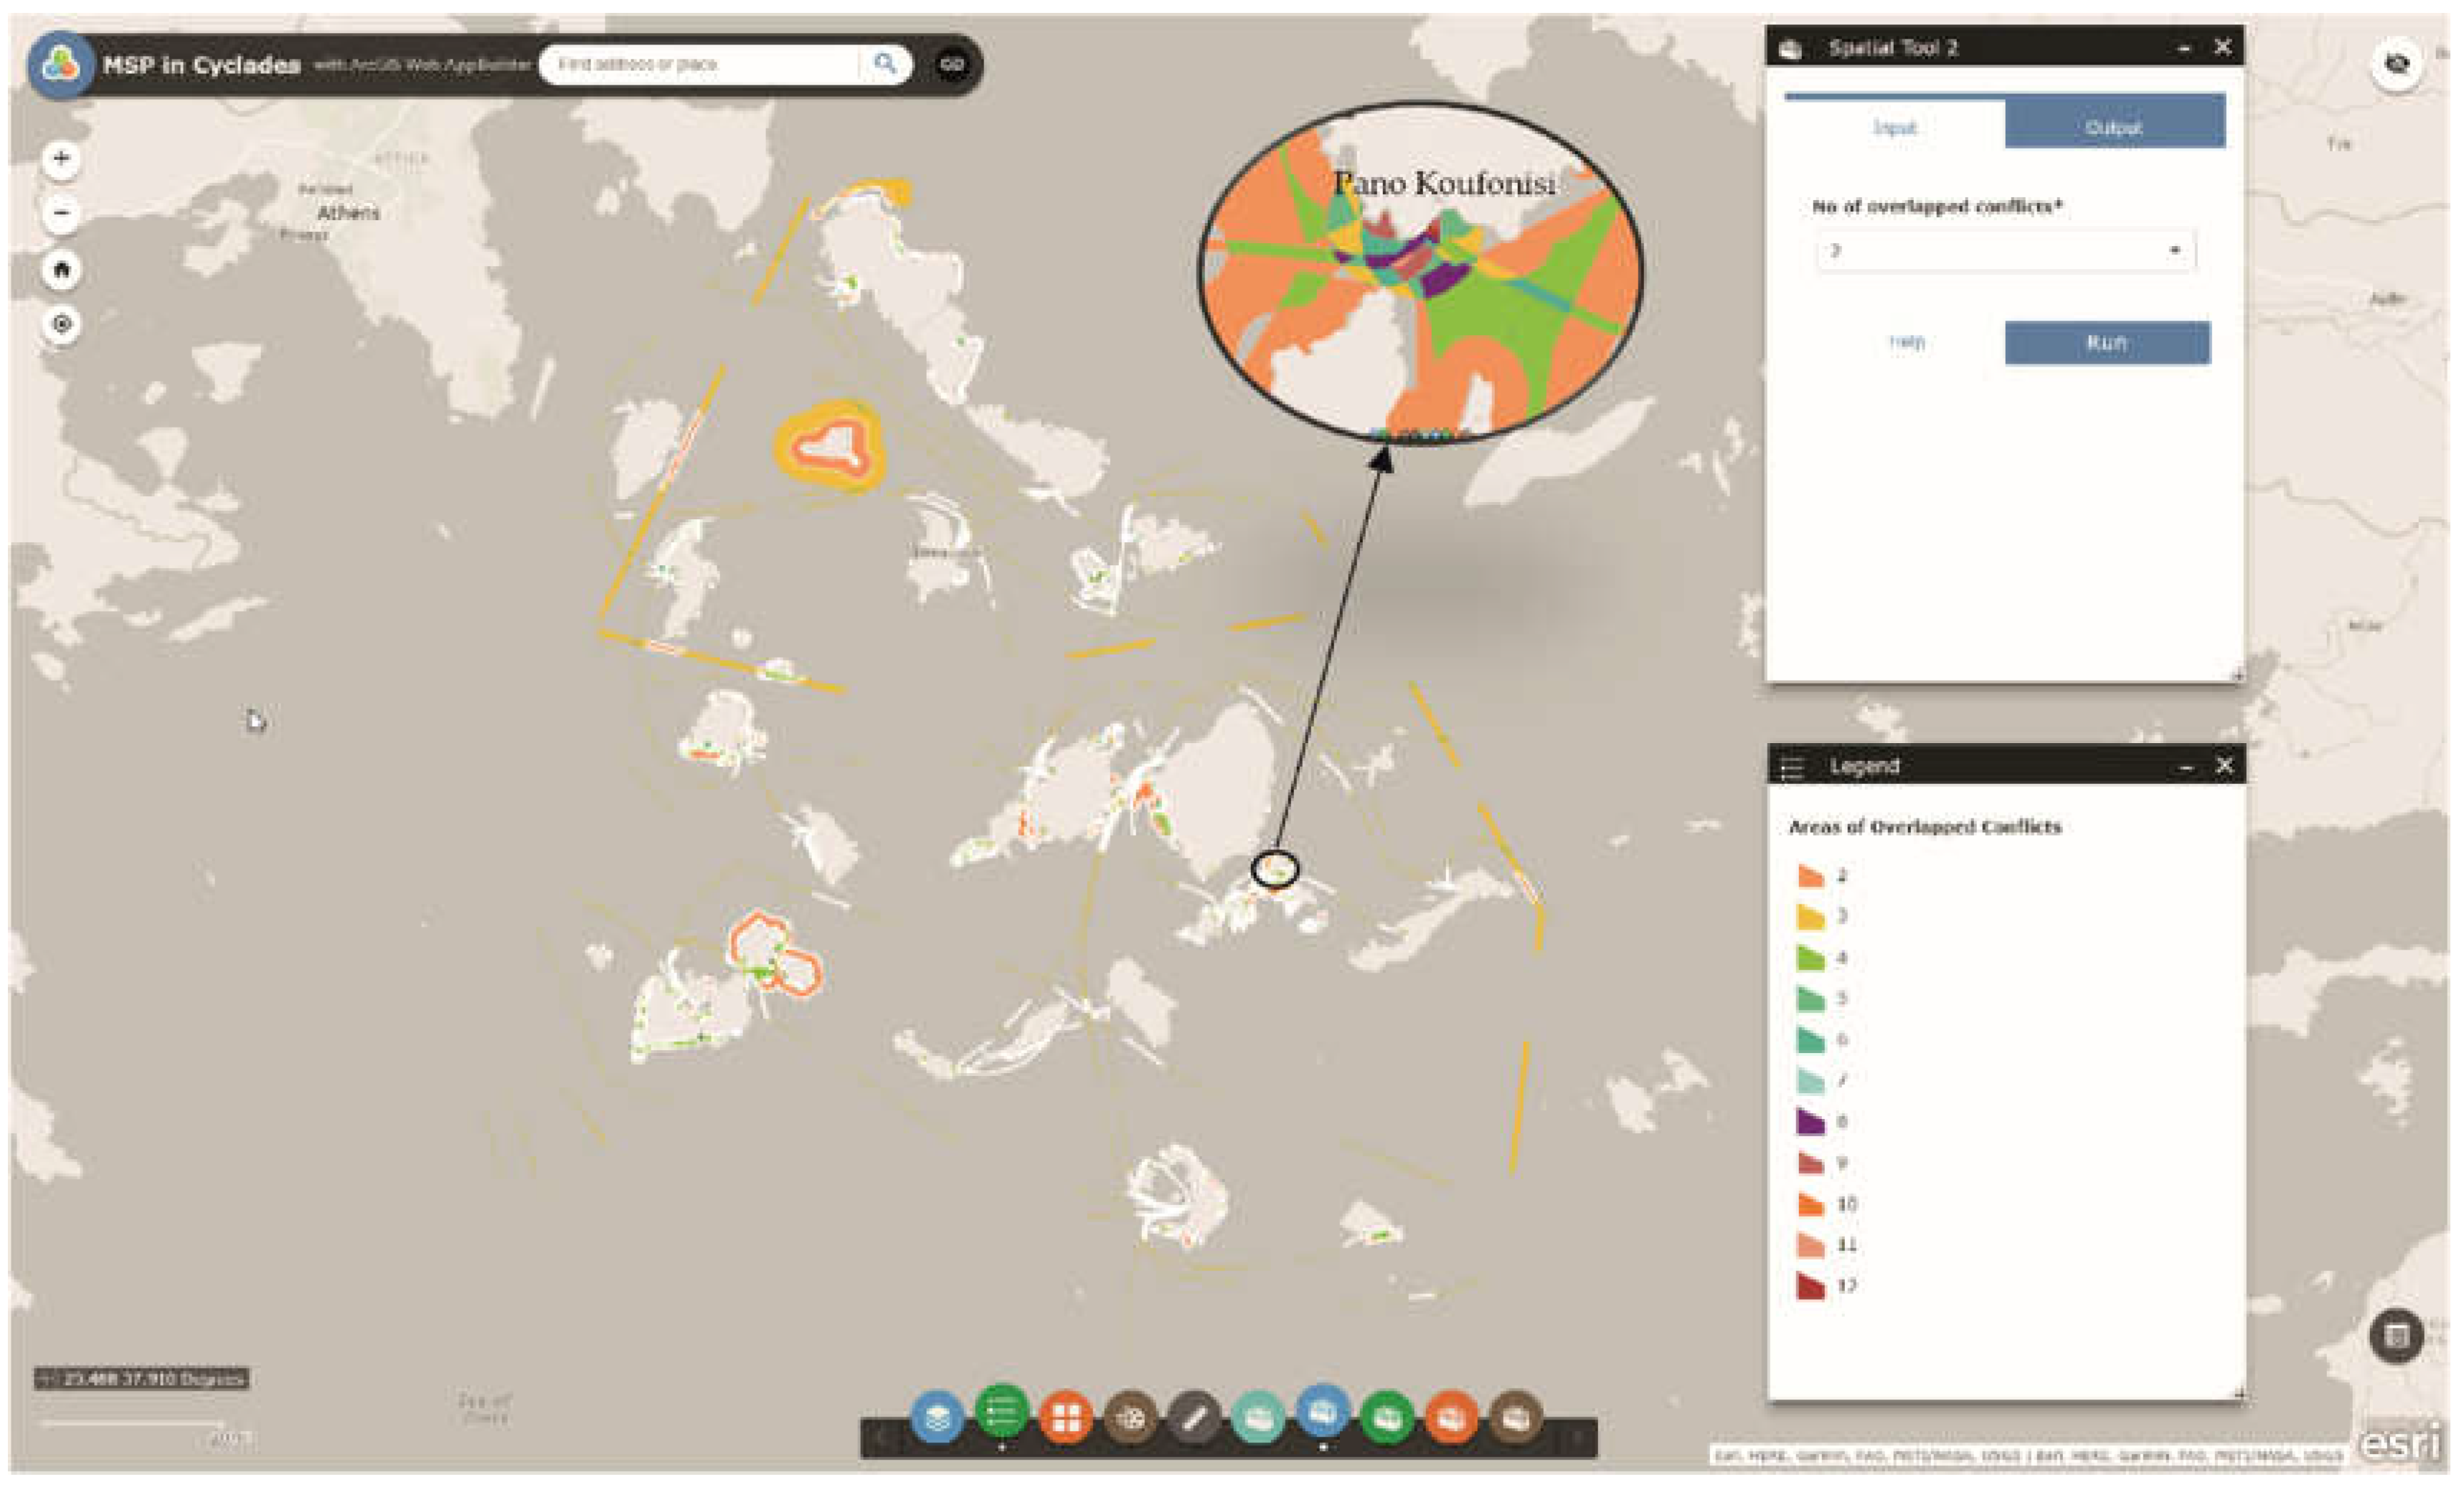
3.1.2. GP Tool 2: Detection of Areas Where More than Two Conflicts Co-Exist

The second GP tool (Figure 4) was applied to detect areas where two or more conflicts co-exist in the study area. The result is illustrated in Figure 4, where the detected areas are visualized in different colors depending on the number of conflicts that co-exist. The area with the most co-existing conflicts (12 in total) is located in the island of Pano Koufonisi with an extent of 8200 m2. The window ‘Layer List’ (Figure 2) was activated at this point to visualize the layers of conflicts and get information on their identity. The 12 co-existing conflicts are, therefore, the C2, C3, C4, C6, C9, C27, C28, C30, C32, C33, C37, and C42 with the majority of them related to the fishing activity and the existence of ports/shipping routes, bathing waters, and marine protected areas (Natura 2000). Subsequently, this GP tool was applied multiple times (not shown) to detect areas where 3, 4, 5, or more conflicts, respectively, co-exist in order to identify the areas with the most intense conflicts. The latter were delineated and are located in Milos, Rineia, Paros, Antiparos, Schoinoussa, Pano, and Kato Koufonisi, Despotiko, Gyaros, east of Naxos, south of Kimolos, and in limited areas in Santorini, Mykonos, Anafi, south of Serifos, and west of Kythnos.

3.1.3. GP Tool 3: Detection of Co-Existing Conflicts in a Specific Area around a Point of Interest

The third GP tool (Figure 5) was applied to detect conflicts that exist in a zone of 5 km around a selected point of interest that was located at the marine area east of Schoinoussa and south of Kato Koufonisi. The result is shown in Figure 5, where the areas with a given number of conflicts are illustrated in different colors depending on the number of conflicts that co-exist. It is obvious that the majority of the selected area is represented by two co-existing conflicts, C9 and C19, but there are also some areas with 4 co-existing conflicts, C9, C19, C11, and C21 located east of Schoinoussa, in Kato Koufonisi and a very limited area west of Keros. It should be also noted that all these conflicts are related to the fishing activity (coastal or purse seining).

3.1.4. GP Tool 4: Detection of Co-Existing Conflicts within a Selected Distance from the Coastline

The fourth GP tool (Figure 6) was applied to detect conflicts within 2 km from the coastline. The result is illustrated in Figure 6, where the conflict areas are illustrated in different colors depending on the number of conflicts that co-exist. Most of the marine areas are represented by two co-existing conflicts (C9, C19). In addition, there are some areas that are covered by four co-existing conflicts (C9, C19, C11, and C21) mainly in Paros, Antiparos, Milos, south of Kimolos, Strongylo, Despotiko, Rineia, Pano Koufonisi, Kato Koufonisi, and Andros. All these conflicts are mainly related to the fishing activity.

3.1.5. GP Tool 5: Detection of Areas of Co-Existing Conflicts That Are Larger than a Specific Extent

The fifth GP tool (Figure 7) was applied to detect conflicts covering an area of more than 50,000 m2. The result is illustrated in Figure 7, where the detected areas are visualized in different colors depending on the number of conflicts that co-exist. Most of the detected areas are represented by two co-existing conflicts, mainly C9 and C19. There are also extended areas with three co-existing conflicts either C9, C19, and C24 or C8, C18, and C23 that are mainly located in Paros, Rineia, and Gyaros. All the above-mentioned conflicts are related to the fishing activity (coastal, purse seining, or trawling).

3.2. Analysis of the Results

The user can acquire the extent of the areas resulting from all the GP tools by clicking on the relevant polygons or by visualizing the relevant attribute table. In this section, the results of the GP tools 2, 4, and 5 were used to assess the intensity of the conflicts in the study area. The extent of the areas resulting from each GP tool was retrieved and areas corresponding to the same number of conflicts were grouped; therefore, the total extent of the areas where 2, 3, and so on conflicts co-exist was obtained. The results are shown in Table 2.
The most common number of co-existing conflicts is two and the second one is three, while there are several areas where four conflicts co-exist. In addition, within 2 km from the coastline (GP tool 4), two conflicts co-exist in the 92% of the total area of conflicts. Areas where more than eight conflicts co-exist, are not many in the study area. Furthermore, according to the results, the larger areas where conflicts co-exist (GP tool 5) are usually represented by two or three conflicts. Finally, there are areas where even 12 conflicts co-exist; however they are of a very low extent.

4. Discussion

In this paper, a webGIS application was designed and implemented to: (a) explore the study area in detail and provide information on the areas where conflicting activities exist, (b) detect the areas of multiple conflicts that need to be addressed by priority from policy-makers, (c) support the process of locating new activities in areas that are not affected by conflicts, (d) support the decision-making process of delineating multi-use areas, and (e) promote awareness on spatial planning by facilitating the participation of various groups, in particular, stakeholders and the wider public, during the implementation of the MSP process. The webGIS application is open and fully functional. The web GP tools may be applied either individually or in combination to get information from the study area.
In the area of Cyclades, 14 activities were recorded and relevant datasets were acquired from multiple sources which were stored in a geodatabase that was designed and implemented for this purpose. Further processing of these datasets led to the detection of 43 conflicting activities based on the existing European/Greek legislation and local/regional regulations. In this paper, the application of the developed GP tools led to the acquirement of information regarding the number of co-existing conflicts in the study area, their delineation and extent, as well as the activities that they are related to. Therefore, the areas with the most intense conflicts were detected as well as the activities that lead to multiple conflicts. The marine areas with the most intense conflicts are located in Milos, Rineia, Paros, Antiparos, Schoinoussa, Pano and Kato Koufonisi, Despotiko, Gyaros, east of Naxos, south of Kimolos, and in limited areas in Santorini, Mykonos, Anafi, south of Serifos and west of Kythnos. The majority of these conflicts are related to the fishing activity (mainly coastal and purse seining) and the existence of ports/shipping routes, marine protected areas (Natura 2000), as well as areas that are covered by Posidonia oceanica. The area with the most co-existing conflicts (12 in total) is located in the island of Pano Koufonisi with an extent of 8200 m2, although it is an island with a low population; however, with an important touristic development during the last decade. On the other hand, the islands with lower intensity of conflicts are Amorgos, Kea, Ios, Folegandros, Sifnos, Syros (where the capital of the Prefecture of Cyclades is located), and Sikinos, although some of them such as Sifnos and Syros are characterized by important touristic development. Furthermore, it should be noted that in the majority of the extent of the study area mostly two or three conflicts co-exist; in particular, within 2 km from the coastline, two conflicts co-exist in 92% of the total area of conflicts.
Based on the results, it is obvious that the high intensity of conflicting activities is not necessarily related to the level of touristic development of the neighboring islands but to the specific activities that are taking place in the area and the existence or not of marine protected areas and infrastructures (i.e., ports). Furthermore, the fact that the majority of the detected conflicts are related to the various types of fishing activity, is explained by its incompatibility or conditional compatibility with most of the other activities in the study area [60]. The latter is quite important since the fishing activity is a strong element of the socio-economic life in Greece, especially in islands and coastal communities. Therefore, specific efforts should be focused on the better delineation of zones where fishing might take place, especially in areas where emphasis should be given to the protection of the natural environment and cultural heritage. Such efforts have already been initiated in Greece regarding the multi-use of marine space and, in particular, the possible co-existence of small-scale fisheries, tourism, and nature conservation [47].
Furthermore, in specific cases that conflicts should be resolved at a local level, i.e., in Pano Koufonisi where 12 conflicts were found to co-exist, further datasets should be collected and added in the geodatabase regarding the particular activities in the area, considering as well their temporal character. In this way, the development of specific plans by decision-makers could be supported, focusing on the harmonious co-existence of various activities during all year. The latter is very important, especially in areas where multiple activities of seasonal character are performed. In this context, it should be emphasized that the development of any conflict resolution plans and the appropriate delineation of new or future activities in the framework of MSP should be combined with the assessment of the relevance of these conflicts based on the specific characteristics of the study area, as well as the priorities that are set by policy-makers and those that are responsible for decision-making [60]. At this stage, the need for effective tools is imperative [61]. The presented webGIS application with the incorporated GP tools can significantly contribute to this direction due to the following reasons:
(a) The access is free to multiple users such as decision-makers, scientists, stakeholders, and the public. (b) There is no need to buy, download, or install any special software; the only requirement for using the webGIS application is an internet connection and a browser. (c) Experience in using any specialized GIS software is not required as well. This is important, as a large number of people who are responsible for decision-making or are involved in any way in the coastal management process have either limited knowledge of GIS or limited familiarity with computer systems. The user-friendly interface of the webGIS application and windows of GP tools contain simple and understandable menus. (d) The visualization of the results is simple and comprehensible; the latter allows scientists and decision-makers to communicate quite easily the results, exchange ideas, and make suggestions regarding marine and coastal management. (e) The webGIS application may be visible by many users simultaneously; this is important when there is limited time for consultancy, planning, management, and decision-making. (f) The functionality of the webGIS application is fully controlled. The system administrator is responsible for updating the data or the system, consequently, in case any change in existing activities arises, the geodatabase can be updated and the users can be informed. (g) The webGIS application is flexible and can be adapted to different study areas. The adaptation is possible, provided that relevant high precision data are collected from the new areas. In addition, the dataset can be updated and new variables can be integrated as well if needed. (h) In the webGIS interface, a link allows users to send comments regarding the results of the application and/or make proposals for further study or analysis. The manual of the webGIS application and guidance on the use of the GP tools are provided as well.

5. Conclusions

The contribution of the MSP process to the management and potential resolution of conflicts in marine areas is widely accepted [62,63] and established in Europe through the adoption of the Directive 2014/89/EU of the European Parliament [7]. This Directive emphasizes the need for the Member States to ensure the means for stakeholders’ awareness, participation, and consulting from the earliest stages of MSP as well as for their information as soon as the plans are finalized. The level of stakeholder involvement, existing knowledge and data availability are pre-requisites for the successful implementation of MSP and the resolution of conflicts [6]. However, it should be noted that, in some cases, the relocation of activities may be expensive or time-consuming [64]; it is, therefore, recommended, that managers refer to spatial or non-spatial solutions that are appropriate for each occasion according to the technical study of the European Commission [64]. In these cases, informing and interacting with relevant groups is imperative for conflict resolution.
Nevertheless, the participation of stakeholders in the decision-making process will always involve the risk of creating tensions both among individuals of the same group as well as among different groups of interest [65]. In this framework, the development of methodologies and tools that will delimit the participation of stakeholders and promote knowledge is considered of high importance as they can reduce the chances of the consultation process failing [66,67,68,69].
The evolution of technology has contributed to the development of tools such as webGIS applications which could enhance the participatory process in an environment delimited by decision-makers, managers, and people in charge of the MSP process. The integration of internet applications to the consultation toolkit is very important; both for the citizens, who are allowed to be heard by decision-makers and interact with them, as well as for the policy- and decision-makers who could also have the opportunity to establish easier channels of communication with stakeholders and therefore, be supported to appropriately adapt their plans to represent the majority of different views [70,71].
In the developed webGIS application, the participation and active involvement of the public and other relevant groups is possible via user-friendly GP tools that are designed to be easily performed. In this way, the users become part of the MSP process additionally to informing and raising awareness. The novelty of the webGIS application is this integration of easy-to-use GP tools by people that are involved in the MSP process, with low or even without knowledge of GIS, who need to (a) have access to spatial information easily and reliably updated with new datasets and relevant information, (b) pose queries and get answers quickly at a spatial scale that is illustrated in mapping format in a user-friendly environment, (c) actively interact with other users such as policy- and decision-makers, administrators, citizens, specific relevant groups (i.e., fishermen, port authorities, people that are involved in tourism, etc.).
The proposed webGIS application could be integrated into an already available decision support system (DSS), contributing to the study of conflicts and their intensity, and supporting coastal management in combination with other methods. In conclusion, the proposed webGIS application is considered a useful tool in the process of MSP and coastal management, since it could have a significant contribution to the settlement of conflicts and the engagement of stakeholders and the public through a participatory process.
Future research is mainly oriented to (a) the development of new GP tools for further facilitation of the participatory process, (b) the development of additional GP tools to rank the conflict areas based on user priorities, supporting, therefore, effective decisions, and (c) the development of new GP tools that are based on the needs that are indicated by users.

Author Contributions

Conceptualization, A.P.; methodology, A.P.; software, A.P.; validation, A.P., Z.P. and D.K.; data analysis, A.P. and Z.P.; writing—original draft preparation, A.P. and Z.P.; writing—review and editing, D.K.; supervision, D.K. All authors have read and agreed to the published version of the manuscript.

Funding

This research received no external funding.

Institutional Review Board Statement

Not applicable.

Informed Consent Statement

Not applicable.

Data Availability Statement

Acknowledgments

The authors acknowledge the technical support provided by Michael Vaitis and his team in the Department of Geography, University of the Aegean, Lesvos, Greece.

Conflicts of Interest

The authors declare no conflict of interest.

References

  1. Basirati, M.; Billot, R.; Meyer, P. A Hybrid Multi-Objective Evolutionary-Based and Multi-Criteria Decision Making Approach For Cooperative Marine Spatial Planning (MSP). In Proceedings of the ROADEF, Montpellier, France, 19–21 February 2020. [Google Scholar]
  2. Uusitalo, L.; Korpinen, S.; Andersen, J.H.; Niiranen, S.; Valanko, S.; Heiskanen, A.-S.; Dickey-Collas, M. Exploring methods for predicting multiple pressures on ecosystem recovery: A case study on marine eutrophication and fisheries. Cont. Shelf Res. 2015, 121, 48–60. [Google Scholar] [CrossRef] [Green Version]
  3. Burgess, M.G.; Clemence, M.; McDermott, G.R.; Costello, C.; Gaines, S.D. Five rules for pragmatic blue growth. Mar. Policy 2018, 87, 331–339. [Google Scholar] [CrossRef]
  4. Pınarbaşı, K.; Galparsoro, I.; Borja, Á.; Stelzenmüller, V.; Ehler, C.N.; Gimpel, A. Decision support tools in marine spatial planning: Present applications, gaps and future perspectives. Mar. Policy 2017, 83, 83–91. [Google Scholar] [CrossRef]
  5. Moore, S.A.; Brown, G.; Kobryn, H.; Strickland-munro, J. Identifying conflict potential in a coastal and marine environment using participatory mapping. J. Environ. Manag. 2017, 197, 706–718. [Google Scholar] [CrossRef] [PubMed] [Green Version]
  6. Tuda, A.O.; Stevens, T.F.; Rodwell, L.D. Resolving coastal conflicts using marine spatial planning. J. Environ. Manag. 2014, 133, 59–68. [Google Scholar] [CrossRef]
  7. European Union (EU), Directive 2014/89/EU of the European Parliament and of the Council of 23 July 2014 establishing a framework for maritime spatial planning. Off. J. Eur. Union 2014, 135–145.
  8. Frazão Santos, C.; Ehler, C.N.; Agardy, T.; Andrade, F.; Orbach, M.K.; Crowder, L.B. Chapter 30—Marine Spatial Planning. In World Seas: An Environmental Evaluation, Volume III: Ecological Issues and Environmental Impacts, 2nd ed.; Sheppard, C., Ed.; Academic Press: Cambridge, MA, USA, 2019; pp. 571–592. ISBN 9780128050521. [Google Scholar]
  9. Crowder, L.B.; Osherenko, G.; Young, O.R.; Airamé, S.; Norse, E.A.; Baron, N.; Day, J.C.; Douvere, F.; Ehler, C.N.; Halpern, B.S.; et al. Resolving Mismatches in U.S. Ocean Governance. Science 2006, 313, 617–618. [Google Scholar] [CrossRef] [Green Version]
  10. Douvere, F.; Ehler, C.N. New perspectives on sea use management: Initial findings from European experience with marine spatial planning. J. Environ. Manag. 2009, 90, 77–88. [Google Scholar] [CrossRef]
  11. Ehler, C.; Douvere, F. Marine Spatial Planning: A Step-by-Step Approach toward Ecosystem-Based Management. Intergovernmental Oceanographic Commission and Man and the Biosphere Programme; IOC Manuals and Guides No. 53., ICAM Dossier No. 6.; UNESCO: Paris, France, 2009. [Google Scholar]
  12. Foley, M.M.; Halpern, B.S.; Micheli, F.; Armsby, M.H.; Caldwell, M.R.; Crain, C.M.; Prahler, E.; Rohr, N.; Sivas, D.; Beck, M.W.; et al. Guiding ecological principles for marine spatial planning. Mar. Policy 2010, 34, 955–966. [Google Scholar] [CrossRef]
  13. Halpern, B.S.; Diamond, J.; Gaines, S.; Gelcich, S.; Gleason, M.; Jennings, S.; Lester, S.; Mace, A.; McCook, L.; McLeod, K.; et al. Near-term priorities for the science, policy and practice of Coastal and Marine Spatial Planning (CMSP). Mar. Policy 2012, 36, 198–205. [Google Scholar] [CrossRef]
  14. Young, O.R.; Osherenko, G.; Ekstrom, J.; Crowder, L.B.; Ogden, J.; Wilson, J.A.; Day, J.C.; Douvere, F.; Ehler, C.N.; McLeod, K.L.; et al. Solving the crisis in ocean governance: Place-based management of marine ecosystems. Environment 2007, 49, 20–32. [Google Scholar] [CrossRef]
  15. Smythe, T.C. Marine spatial planning as a tool for regional ocean governance?: An analysis of the New England ocean planning network. Ocean Coast. Manag. 2017, 135, 11–24. [Google Scholar] [CrossRef]
  16. Ehler, C.; Douvere, F. Visions for a Sea Change: Report of the First International Workshop on Marine Spatial Planning. Intergovernmental Oceanographic Commission and Man and the Biosphere Programme; IOC Manual and Guides, 46; UNESCO: Paris, France, 2007. [Google Scholar]
  17. Rodríguez-Rodríguez, D.; Malak, D.A.; Soukissian, T.; Sánchez-Espinosa, A. Achieving Blue Growth through maritime spatial planning: Offshore wind energy optimization and biodiversity conservation in Spain. Mar. Policy 2016, 73, 8–14. [Google Scholar] [CrossRef]
  18. Bax, N.; Novaglio, C.; Maxwell, K.H.; Meyers, K.; McCann, J.; Jennings, S.; Frusher, S.; Fulton, E.A.; Nursey-Bray, M.; Fischer, M.; et al. Ocean resource use: Building the coastal blue economy. Rev. Fish Biol Fisheries 2021. online ahead of print. [Google Scholar] [CrossRef] [PubMed]
  19. Douvere, F. The importance of marine spatial planning in advancing ecosystem-based sea use management. Mar. Policy 2008, 32, 762–771. [Google Scholar] [CrossRef]
  20. Kenchington, R.; Day, J. Zoning, a fundamental cornerstone of effective Marine Spatial Planning: Lessons learnt from the Great Barrier Reef, Australia. J. Coast. Conserv. 2011, 15, 271–278. [Google Scholar] [CrossRef] [Green Version]
  21. Jay, S.; Ellis, G.; Kidd, S. Marine Spatial Planning: A New Frontier? J. Environ. Policy Plan. 2012, 14, 1–5. [Google Scholar] [CrossRef]
  22. Jentoft, S.; Knol, M. Marine spatial planning: Risk or opportunity for fisheries in the North Sea? Marit. Stud. 2014, 12, 16. [Google Scholar] [CrossRef] [Green Version]
  23. Vince, J. Oceans governance and marine spatial planning in Australia. Aust. J. Marit. Ocean Aff. 2014, 6, 5–17. [Google Scholar] [CrossRef] [Green Version]
  24. Lombard, A.T.; Ban, N.C.; Smith, J.L.; Lester, S.E.; Sink, K.J.; Wood, S.A.; Jacob, A.L.; Kyriazi, Z.; Tingey, R.; Sims, H.E. Practical approaches and advances in spatial tools to achieve multi-objective marine spatial planning. Front. Mar. Sci. 2019, 6, 166. [Google Scholar] [CrossRef]
  25. Ehler, C.N. Marine spatial planning: An idea whose time has come. In Offshore Energy and Marine Spatial Planning, 1st ed.; Yates, K.L., Bradshaw, C.J.A., Eds.; Routledge: London, UK, 2018; pp. 6–17. [Google Scholar] [CrossRef]
  26. Ehler, C.; Zaucha, J.; Gee, K. Maritime/Marine Spatial Planning at the Interface of Research and Practice. In Maritime Spatial Planning, 1st ed.; Zaucha, J., Gee, K., Eds.; Palgrave Macmillan: Cham, Switzerland, 2019; pp. 1–22. [Google Scholar] [CrossRef] [Green Version]
  27. Crowder, L.; Norse, E. Essential ecological insights for marine ecosystem-based management and marine spatial planning. Mar. Policy 2008, 32, 772–778. [Google Scholar] [CrossRef]
  28. Shucksmith, R.J.; Kelly, C. Data collection and mapping—Principles, processes and application in marine spatial planning. Mar. Policy 2014, 50, 27–33. [Google Scholar] [CrossRef]
  29. Campbell, M.S.; Stehfest, K.M.; Votier, S.C.; Hall-Spencer, J.M. Mapping fisheries for marine spatial planning: Gear-specific vessel monitoring system (VMS), marine conservation and offshore renewable energy. Mar. Policy 2014, 45, 293–300. [Google Scholar] [CrossRef]
  30. Breen, P.; Vanstaen, K.; Clark, R.W.E. Mapping inshore fishing activity using aerial, land, and vessel-based sighting information. ICES J. Mar. Sci. 2015, 72, 467–479. [Google Scholar] [CrossRef] [Green Version]
  31. Petruny, L.; Wright, A.; Smith, C. Getting it right for the North Atlantic right whale (Eubalaenaglacialis): A last opportunity for effective marine spatial planning? Mar. Pollut. Bull. 2014, 85, 24–32. [Google Scholar] [CrossRef]
  32. Bradbury, G.; Trinder, M.; Furness, B.; Banks, A.N.; Caldow, R.W.G.; Hume, D. Mapping Seabird Sensitivity to Offshore Wind Farms. PLoS ONE 2014, 9, e106366. [Google Scholar] [CrossRef] [PubMed] [Green Version]
  33. De Freitas, D.M.; Tagliani, P.R.A. The use of GIS for the integration of traditional and scientific knowledge in supporting artisanal fisheries management in southern Brazil. J. Environ. Manag. 2009, 90, 2071–2080. [Google Scholar] [CrossRef]
  34. Zhou, F.; Huang, G.H.; Guo, H.; Zhang, W.; Hao, Z. Spatio-temporal patterns and source apportionment of coastal water pollution in eastern Hong Kong. Water Res. 2007, 41, 3429–3439. [Google Scholar] [CrossRef]
  35. Jay, S.; Gee, K. TPEA Good Practice Guide: Lessons for Cross-Border MSP from Transboundary Planning in the European Atlantic; University of Liverpool: Liverpool, UK, 2014. [Google Scholar]
  36. Shucksmith, R.; Gray, L.; Kelly, C.; Tweddle, J.F. Regional marine spatial planning—The data collection and mapping process. Mar. Policy 2014, 50, 1–9. [Google Scholar] [CrossRef]
  37. Boroushaki, S.; Malczewski, J. Measuring consensus for collaborative decision-making: A GIS-based approach. Comput Environ. Urban. Syst 2010, 34, 322–332. [Google Scholar] [CrossRef]
  38. Ajwaliya, R.J.; Patel, S.; Sharma, S.A. Web-GIS based application for utility management system. J. Geomat. 2017, 11, 86–92. [Google Scholar]
  39. Simão, A.; Densham, P.J.; Haklay, M.M. Web-based GIS for collaborative planning and public participation: An application to the strategic planning of wind farm sites. J. Environ. Manag. 2009, 90, 2027–2040. [Google Scholar] [CrossRef] [PubMed]
  40. Tuda, A.O.; Rodwell, L.D.; Stevens, T. Conflict management in Mombasa Marine National Park and Reserve, Kenya: A spatial multicriteria approach. In Proceedings of the Workshop on a Regional Perspective on MPAs in the Western Indian Ocean, Rodrigues Island, Mauritius, 9–14 May 2007; University of Newcastle and Marine Education Trust: Newcastle, UK; pp. 63–72. [Google Scholar]
  41. Prestrelo, L.; Vianna, M. Identifying multiple-use conflicts prior to marine spatial planning: A case study of A multi-legislative estuary in Brazil. Mar. Policy 2016, 67, 83–93. [Google Scholar] [CrossRef]
  42. Freeman, M.C.; Whiting, L.; Kelly, R.P. Assessing potential spatial and temporal conflicts in Washington’s marine waters. Mar. Policy 2016, 70, 137–144. [Google Scholar] [CrossRef]
  43. Depellegrin, D.; Menegon, S.; Ghezzo, M.; Gissi, E.; Sarretta, A.; Farella, G.; Venier, C.; Barbanti, A. Multi-objective spatial tools to inform Maritime Spatial Planning in the Adriatic Sea. Sci. Total 2017, 609, 1627–1639. [Google Scholar] [CrossRef] [Green Version]
  44. Kyvelou, S.S.; Ierapetritis, D. Discussing and Analyzing “Maritime Cohesion” in MSP, to achieve sustainability in the Marine Realm. Sustainability 2019, 11, 3444. [Google Scholar] [CrossRef] [Green Version]
  45. Schultz-Zehden, A.; Weig, B.; Lukic, I. Maritime Spatial Planning and the EU’s Blue Growth Policy: Past, Present and Future Perspectives. In Maritime Spatial Planning, 1st ed.; Zaucha, J., Gee, K., Eds.; Palgrave Macmillan: Cham, Switzerland, 2019; pp. 121–150. [Google Scholar] [CrossRef]
  46. Kyvelou, S.S.; Ierapetritis, D. Fisheries Sustainability through Soft Multi-Use Maritime Spatial Planning and Local Development Co-Management: Potentials and Challenges in Greece. Sustainability 2020, 12, 2026. [Google Scholar] [CrossRef] [Green Version]
  47. Kyvelou, S.S.; Ierapetritis, D. Fostering Spatial Efficiency in the Marine Space, in a Socially Sustainable Way: Lessons Learnt from a Soft Multi-Use Assessment in the Mediterranean. Front. Mar. Sci. 2021, 8, 613–721. [Google Scholar] [CrossRef]
  48. MARIBE project, Marine Investment for the Blue Economy. Available online: http://maribe.eu/ (accessed on 1 February 2022).
  49. MUSICA project, Multiple Use of Space for Island Clean Autonomy. Available online: https://musica-project.eu/ (accessed on 1 February 2022).
  50. Xie, Y.; Xie, B.; Wang, Z.; Gupta, R.K.; Baz, M.; Al Zain, M.A.; Masud, M. Geological Resource Planning and Environmental Impact Assessments Based on GIS. Sustainability 2022, 14, 906. [Google Scholar] [CrossRef]
  51. Burrough, P.A.; McDonnell, R.A. Principles of Geographical Information Systems; Oxford University Press: Oxford, UK, 1998. [Google Scholar]
  52. Huisman, O.; de By, R. Principles of Geographic Information Systems; ITC: Enschede, The Netherlands, 2009; ISBN 9789061642695. [Google Scholar]
  53. Liu, Y.; Zhang, X.; Xu, M.; Zhang, X.; Shan, B.; Wang, A. Spatial Patterns and Driving Factors of Rural Population Loss under Urban&Rural Integration Development: A Micro-Scale Study on the Village Level in a Hilly Region. Land 2022, 11, 99. [Google Scholar] [CrossRef]
  54. Kitsiou, D.; Karydis, M. Marine eutrophication: A proposed data analysis procedure for assessing spatial trends. Environ. Monit. Assess. 2001, 68, 297–312. [Google Scholar] [CrossRef] [PubMed]
  55. Unwin, D.J. GIS, spatial analysis and spatial statistics. Prog. Hum. Geogr. 1996, 20, 540–551. [Google Scholar] [CrossRef]
  56. Ahlqvist, O. Overlay (in GIS). In International Encyclopedia of Human Geography; Elsevier: Amsterdam, The Netherlands, 2009; ISBN 9780080449104. [Google Scholar]
  57. Syanalia, A.; Winata, F. Decarbonizing Energy in Bali with Solar Photovoltaic: GIS-Based Evaluation on Grid-Connected System. Indones. J. Energy 2018, 1, 5–20. [Google Scholar] [CrossRef]
  58. Dong, P.; Yang, C.; Rui, X.; Zhang, L.; Cheng, Q. An Effective Buffer Generation Method in GIS. In Proceedings of the International Geoscience and Remote Sensing Symposium (IGARSS), Toulouse, France, 21–25 July 2003. [Google Scholar]
  59. Ma, M.; Wu, Y.; Chen, L.; Li, J.; Jing, N. Interactive and online buffer-overlay analytics of large-scale spatial data. ISPRS Int. J. Geo Inf. 2019, 8, 21. [Google Scholar] [CrossRef] [Green Version]
  60. Pataki, Z.; Kitsiou, D. Marine Spatial Planning: Assessment of the intensity of conflicting activities in the marine environment of the Aegean Sea. Ocean Coast. Manag. 2022, 220, 106079. [Google Scholar] [CrossRef]
  61. Kitsiou, D.; Patera, A.; Tsegas, G.; Nitis, T. A webgis application to assess seawater quality: A case study in a coastal area in the northern aegean sea. J. Mar. Sci. Eng. 2021, 9, 33. [Google Scholar] [CrossRef]
  62. Ehler, C.N. Marine Spatial Planning: An Idea Whose Time Has Come. In Offshore Energy and Marine Spatial Planning; Routledge: Abingdon-on-Thames, UK, 2017; ISBN 9781317356424. [Google Scholar]
  63. Gilliland, P.M.; Laffoley, D. Key elements and steps in the process of developing ecosystem-based marine spatial planning. Mar. Policy 2008, 32, 787–796. [Google Scholar] [CrossRef]
  64. European Commission, Executive Agency for Small Medium-Sized Enterprises; Ooms, E.; Onwona, A.J.; Lukic, I. Addressing Conflicting Spatial Demands in MSP: Considerations for MSP Planners: Final Technical Study; Publications Office: Luxembourg, 2019; Available online: https://data.europa.eu/doi/10.2826/151447 (accessed on 3 March 2022).
  65. De Nooy, W. Communication in natural resource management: Agreement between and disagreement within stakeholder groups. Ecol. Soc. 2013, 18, 1–12. [Google Scholar] [CrossRef] [Green Version]
  66. Gregory, R.; Keeney, R.L. Creating policy alternatives using stakeholder values. Manage. Sci. 1994, 40, 1035–1048. [Google Scholar] [CrossRef]
  67. Karakosta, C.; Flamos, A.; Forouli, A. Identification of climate policy knowledge needs: A stakeholders consultation approach. Int. J. Clim. Chang. Strateg. Manag. 2018, 10, 772–795. [Google Scholar] [CrossRef]
  68. Kallis, G.; Hatzilacou, D.; Mexa, A.; Coccossis, H.; Svoronou, E. Beyond the manual: Practicing deliberative visioning in a Greek island. Ecol. Econ. 2009, 68, 979–989. [Google Scholar] [CrossRef]
  69. Kallis, G.; Videira, N.; Antunes, P.; Pereira, Â.G.; Spash, C.L.; Coccossis, H.; Quintana, S.C.; del Moral, L.; Hatzilacou, D.; Lobo, G.; et al. Participatory methods for water resources planning. Environ. Plan. C Gov. Policy 2006, 24, 215–234. [Google Scholar] [CrossRef]
  70. Adams, N.J.; Macintosh, A.; Johnston, J. E-petitioning: Enabling ground-up participation. In Challenges of Expanding Internet: E-Commerce, E-Business, and E-Government. IFIP International Federation for Information Processing; Springer: Boston, MA, USA, 2005. [Google Scholar] [CrossRef] [Green Version]
  71. Ergazakis, K.; Metaxiotis, K.; Tsitsanis, T. A state-of-the-art review of applied forms and areas, tools and technologies for e-Participation. Int. J. Electron. Gov. Res. 2011, 7, 1–19. [Google Scholar] [CrossRef]
Figure 1. The study area of the Cyclades in the Aegean Sea.
Jmse 10 00389 g001
Figure 2. The architecture of the webGIS application and the available geoprocessing tools (https://sdi-portal.aegean.gr/portal/apps/sites/#/conflicts-assessment (accessed on 3 March 2022).
Jmse 10 00389 g002
Figure 3. Areas where the conflicts ‘C19: Purse seining—Marine protected areas (Natura 2000)’ and ‘C11: Coastal fishing—Areas covered by Posidonia oceanica’ co-exist.
Jmse 10 00389 g003
Figure 4. Areas where more than two conflicts co-exist.
Jmse 10 00389 g004
Figure 5. Areas of conflicts within a user-defined area.
Jmse 10 00389 g005
Figure 6. Conflicts within 2 km from the coastline.
Jmse 10 00389 g006
Figure 7. Areas of conflicts that are larger than 50,000 m2.
Jmse 10 00389 g007
Table 1. The activities in the study area and the relevant data sources.
ActivitiesData Sources
Coastal fishingFisheries Control Directorate
TrawlingCouncil Regulation (EC) No 1967/2006
Purse seiningCouncil Regulation (EC) No 1967/2006
Marine aquacultureRiver Basin Management Plans, River Basin District of the Aegean Islands, Special Secretariat for Water, Ministry of Environment and Energy; EMODnet; Oikoskopio, WWF Greece
Bathing watersSpecial Secretariat for Water, Ministry of Environment and Energy
AnchoragesWorld Cruising and Sailing Wiki
PortsMinistry of Rural Development and Food; EMODnet; World Cruising and Sailing Wiki
MarinasWorld Cruising and Sailing Wiki
Shipping routes (passenger)EuroGeographics—EuroGlobalMap
Wastewater disposalMinistry of Environment and Energy
Submarine communications cableEMODnet
Marine protected areas (Natura 2000)Ministry of Environment and Energy; Geodata.gov.gr
Underwater archeological sitesMinistry of Culture and Sports
Areas covered by Posidonia oceanicaMinisterial Decision 2442/51879/2016; Fisheries Control Directorate; Ministerial Decision 2886/142447/2019
Table 2. Extent of the areas where conflicts were detected using GP tools 2, 4, and 5.
Number of Co-Existing ConflictsGP Tool 2 (km2)GP Tool 4 (km2)GP Tool 5 (km2)
21205.971181.551188.30
3653.8416.27643.01
481.4877.6780.02
513.7310.9410.94
68.101.457.72
71.360.780.78
83.393.123.12
90.240.080.08
100.220.000.00
110.010.210.21
120.120.120.12
Total area (km2)1968.471292.201934.30
Publisher’s Note: MDPI stays neutral with regard to jurisdictional claims in published maps and institutional affiliations.

