Article

Age and Growth of the Spot-Tail Shark, Carcharhinus sorrah, in the Taiwan Strait

1
Department of Environmental Biology and Fisheries Science, National Taiwan Ocean University, 2 Pei-Ning Road, Keelung 20224, Taiwan
2
George Chen Shark Research Center, National Taiwan Ocean University, 2 Pei-Ning Road, Keelung 20224, Taiwan
3
Institute of Marine Affairs and Resource Management, National Taiwan Ocean University, 2 Pei-Ning Road, Keelung 20224, Taiwan
4
Center of Excellence for the Oceans, National Taiwan Ocean University, 2 Pei-Ning Road, Keelung 20224, Taiwan
*
Author to whom correspondence should be addressed.
J. Mar. Sci. Eng. 2022, 10(3), 413; https://doi.org/10.3390/jmse10030413
Submission received: 4 February 2022 / Revised: 5 March 2022 / Accepted: 10 March 2022 / Published: 12 March 2022
(This article belongs to the Special Issue Interannual Variation of Planktonic Species and Fish Populations)

Abstract

:
The age and growth of the spot-tail shark, Carcharhinus sorrah, were estimated based on 327 specimens (171 females and 156 males) captured by the coastal/offshore longline or drift net fishery in the waters of the Taiwan Strait from October 2010 to December 2011 and July 2019 to August 2021. Sex-specific whole weight (W)—curved total length (TL) relationships were estimated as follows: W = 7.0 × 10⁻⁶ TL2.9313 (n = 171, and p < 0.05) for females, and W = 4.0 × 10⁻⁶ TL3.0516 (n = 156, and p < 0.05) for males. The periodicity of growth band pair (including translucent and opaque bands) deposition in precaudal vertebrae was assumed to be 1 year based on centrum edge analysis and verified by a statistical analysis. The band pairs after the birth mark were counted as 0–5 and 0–8 for females and males, respectively. The Gompertz and von Bertalanffy growth function best described the observed length-at-age data for females and males, respectively. The parameters for sex-specific growth equations were estimated as: L = 158.6 ± 9.09 cm TL, kG = 0.2347 ± 0.0245 year−1, and c = −0.3233 ± 0.2043 (n = 171, and p < 0.01) for females, and L = 170.2 ± 9.51 cm TL, k = 0.1461 ± 0.0182 year−1, and t0 = −3.1586 ± 0.2065 (n = 156, and p < 0.01) for males.

1. Introduction

Due to the decline of large shark catch, fishers shifted to targeting median and small sharks in recent years [1,2]. Small sharks generally grow faster and are more abundant than large sharks, but several small shark stocks, in addition to some pelagic sharks, have been found to be heavily exploited [3]. Therefore, it is urgent to collect species-specific biological information for stock assessment to ensure that small shark stocks can be exploited sustainably to maintain the balance of marine ecosystems and the fishery.
Total annual landings of small sharks (including small/juvenile pelagic and demersal sharks) in Taiwan declined dramatically from 5905 tons in 1993 to 447 tons in 2013 [4], which implies that these stocks have been overexploited in the past two decades as fishing effort did not vary on a large scale. Unfortunately, detailed (such as species-specific) yield information for small sharks in Taiwan waters is not available.
The spot-tail shark, Carcharhinus sorrah (Müller & Henle 1839), is widely distributed in the Indian Ocean and the West Pacific Ocean, from the Red Sea and East Africa to the Philippines and from China and Taiwan to Australian waters [5]. This small requiem species is found in the waters of the continental shelf and coral reefs around Taiwan [6]. It is a common species for local fishery and is caught by the coastal small-scale longline or drift net fishery in the waters of the Taiwan Strait. The small-scale longline fishing vessels operate on a 1–3 day basis with 1–6 settings (500–750 hooks per set) per trip at depths of 20–60 m using spotted chub mackerel, Scomber australasicus, or striped bonito, Sarda orientalis, as bait. Most spot-tail sharks are caught by small-scale longline vessels during the major fishing season from April to October with a peak from June to September. The catch of this species decreases after September because most longline fishing vessels switch to drift net targeting the narrow-barred Spanish mackerel, Scomberomorus commerson, which has higher economic value. Drift net fishing vessels operate at depths of 10–50 m with a mesh size of 15–16 cm. In addition, large individuals of this species are caught by offshore longline vessels in the northeastern Taiwan waters.
Biological information of the spot-tail shark is limited. Compagno et al. [7] described the general biological information of this species and reported the maximum size greater than 160 cm, size at maturity of 106 cm and 110–118 cm for males and females, litter size of 1–6 with the size at birth of 50–60 cm. Giles et al. [8] documented the genetic population structure of spot-tail shark in the Indo–West Pacific. Stevens and Wiley [9] reported the mating season was from February to March, pupping occurred in January with mean litter size of 3. Davenport and Stevens [10] reported the age at maturity was 2–3 year and growth parameters of this species in north Australian waters. White [11] depicted the catch composition and reproductive biology of whaler sharks including spot-tail shark in Indonesia waters. Harry et al. [12] described the age, growth, and reproductive biology of the spot-tail shark in northeastern Australia. Despite the aforementioned work, biological information of the spot-tail shark in the western North Pacific is still lacking.
Spot-tail shark is listed as near threatened (NT) on the IUCN Red List of threatened species, and its population status is still unknown [13]. As this species is commonly caught by various fishing gears in the coastal and offshore waters, it is urgent to evaluate the stock status of this species. However, the stock assessment and subsequent fishery management of the spot-tail shark are impeded by the lack of life history information. As the vertebral centrum is the most commonly used calcified structure for age determination of chondrichthyan fishes [14], this study aims to provide the first detailed information on the age and growth of the spot-tail shark based on vertebral band pair count in the waters of the Taiwan Strait. The results derived from this study can provide useful information for future stock assessment and management of the species in this region.

2. Materials and Methods

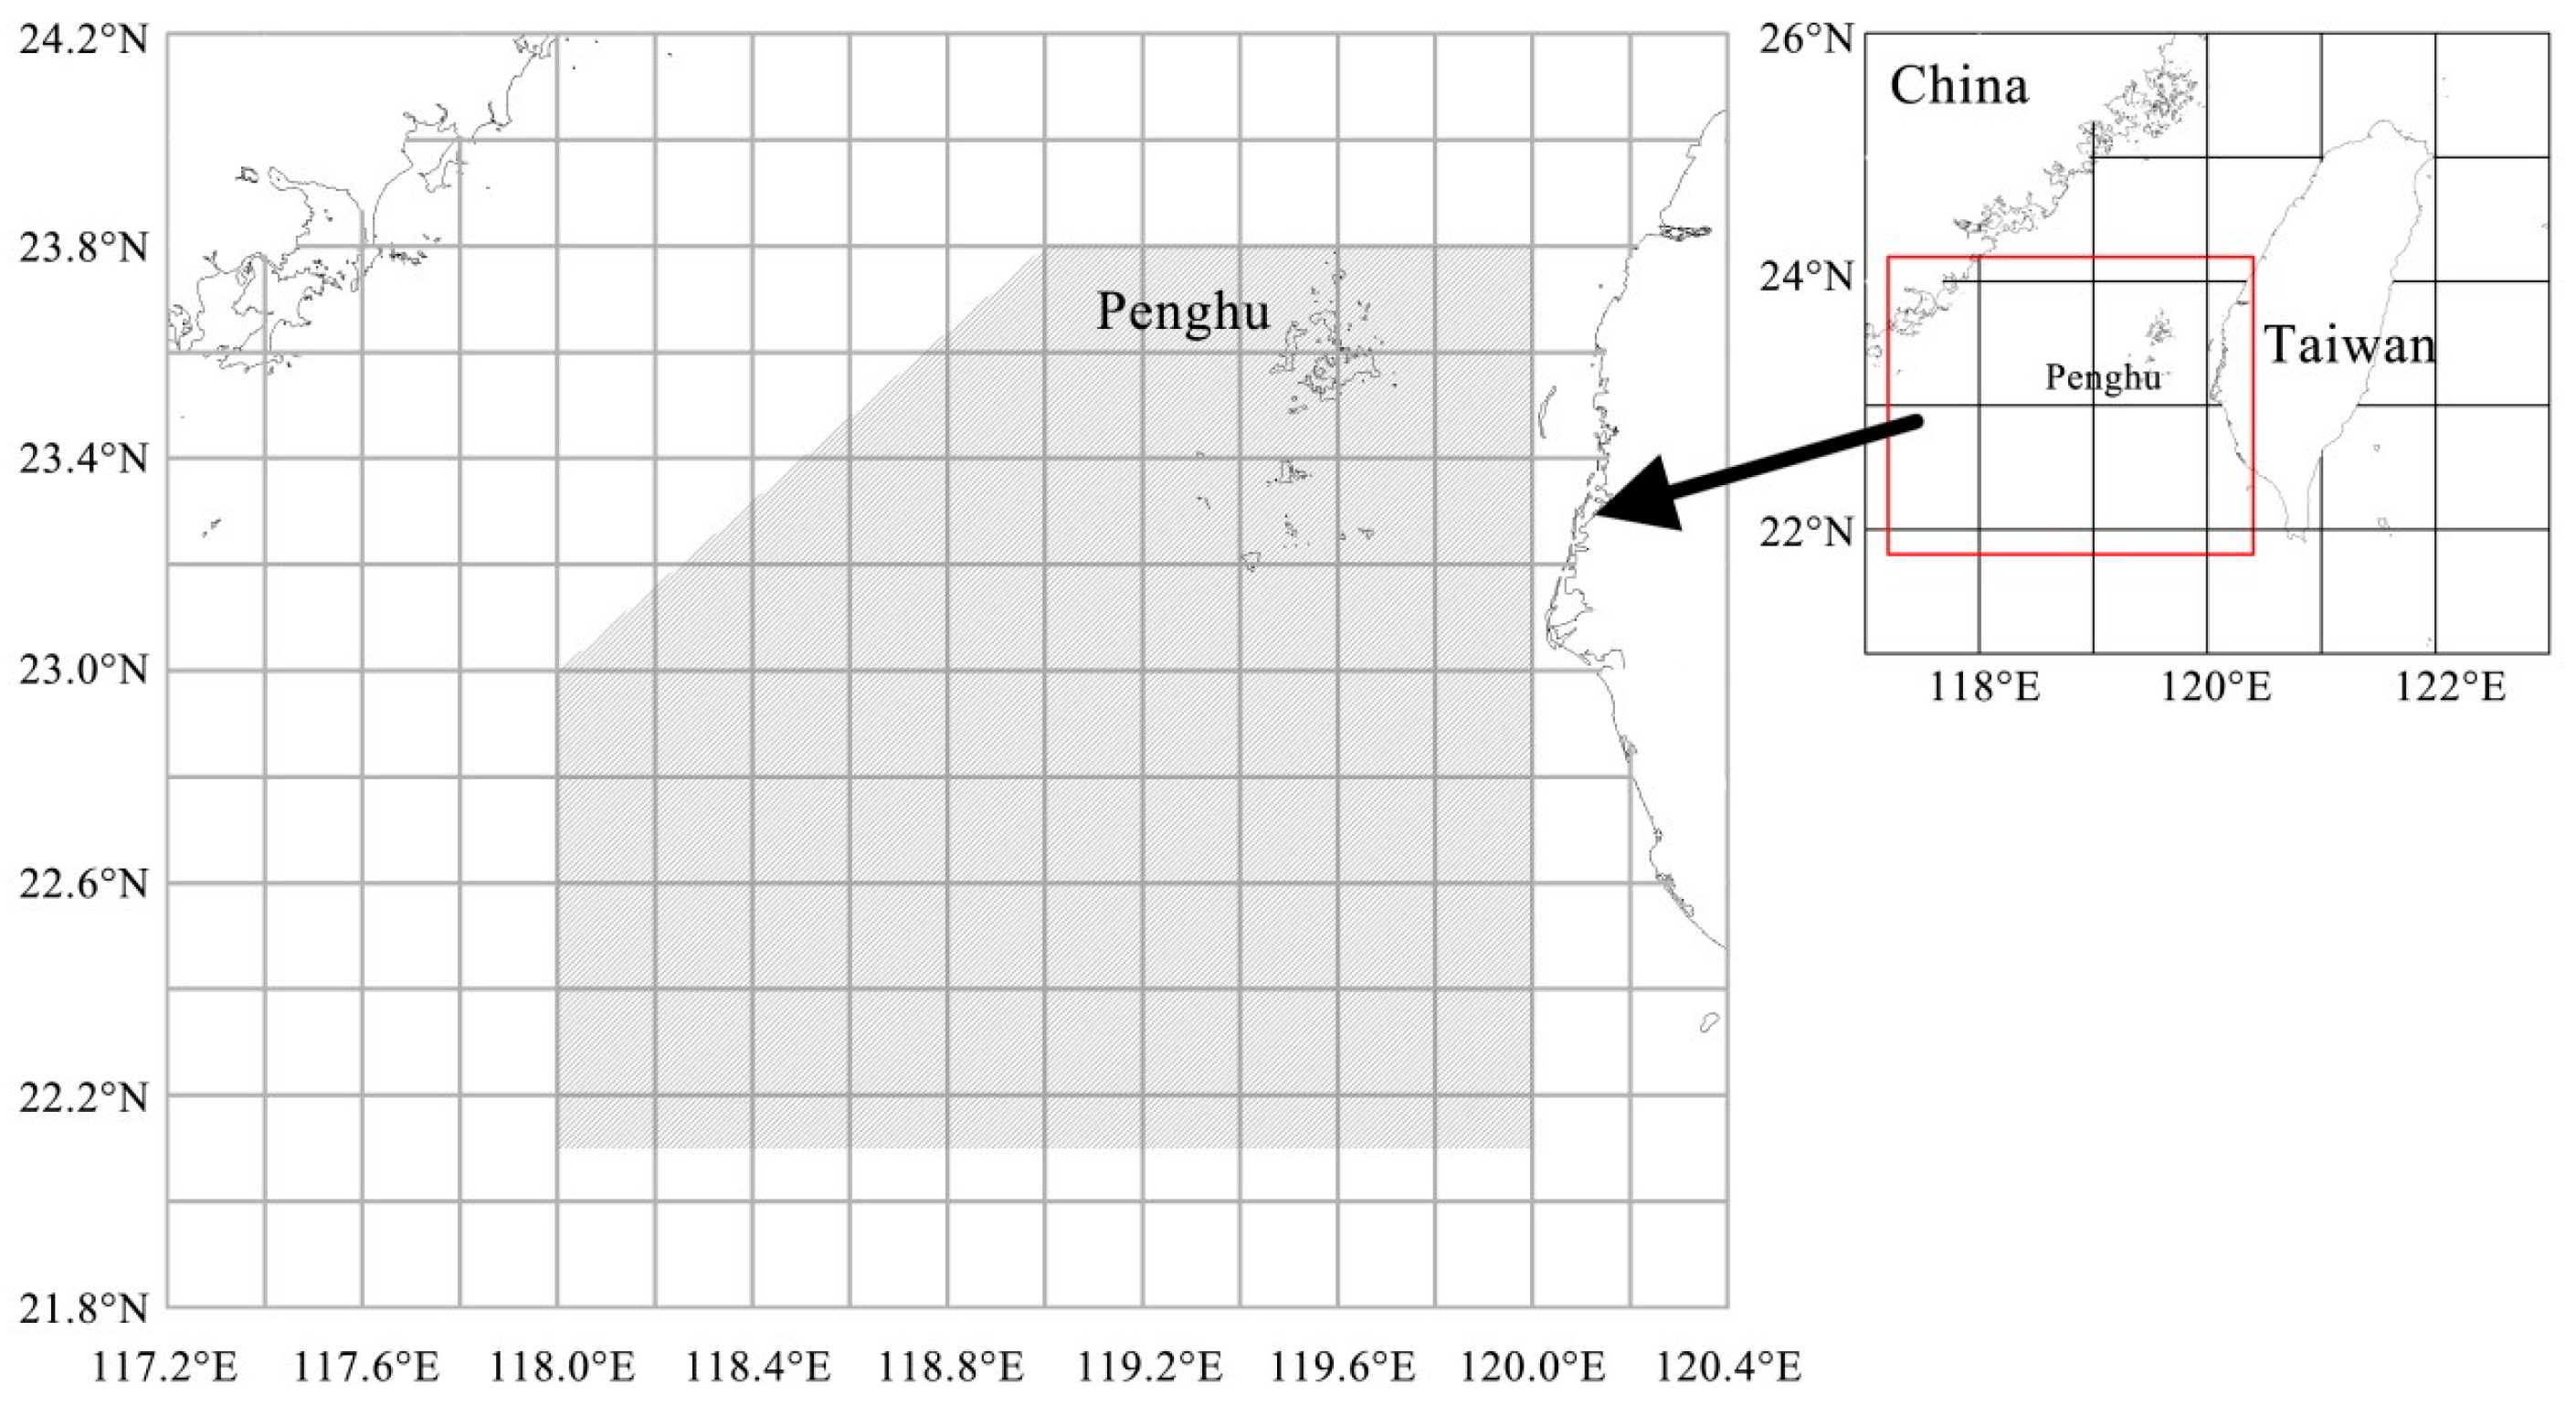
2.1. Specimen Collection and Processing

The spot-tail shark caught by coastal/offshore drift net or longline fishing vessels in the Taiwan Strait (Figure 1) in chilled form were landed at various fish markets in Taiwan. Specimens were opportunistically collected at the Makung fishing port between October 2010 and December 2011 on a monthly basis and additional specimens were collected at other fishing ports in northwestern Taiwan from July 2019 to August 2021. Measurements of curved total length (TL, in cm); curved pre-caudal length (PCL), taken over the curve of the body in natural form; and whole weight (W, in kg) were conducted. The sex of each specimen was also identified. A block of eight vertebral centra was taken from the precaudal peduncle region (the only area of vertebrae available for sampling at the fishing port) from each of the sampled sharks. A simple linear regression was used for conversion between length measurements (TL and PCL), and analysis of covariance (ANCOVA) [15] was used to examine the difference between sexes. The W–TL relationship was expressed as W = aTLb where a and b are parameters. The maximum likelihood ratio test [16] was used to compare the W–TL relationship between sexes.
The vertebral columns from six specimens (80, 82, and 87 cm TL males and 78, 79, and 83 cm TL females) were used to compare variations in the number of band pairs and the diameter of the vertebral centrum (CD) from different locations along the vertebral column of the specimens. The coefficient of variation (CV) of the diameter of eight consecutive vertebrae centrum was calculated. The numbers of band pairs were the same in different locations of vertebral columns for each of the six specimens, and the smallest CV was found for vertebrae in the precaudal region. Thus, precaudal vertebrae (the 57th–64th vertebral centra of the vertebral column) were used for age estimation.
Vertebral centra were rinsed in 10% KOH for 2–4 h to remove connective tissue, then rinsed with running water for 24 h and air-dried [17]. The dried vertebral centra were dyed with 1% ninhydrin for 3–6 h depending on their sizes. After being dyed, whole vertebral centra were examined using a microscope (ZEISS Stemi SV 6) (Figure 2) with reflected light under a black background, and images were obtained by taking photographs with an attached digital camera (Canon PowerShot D10).

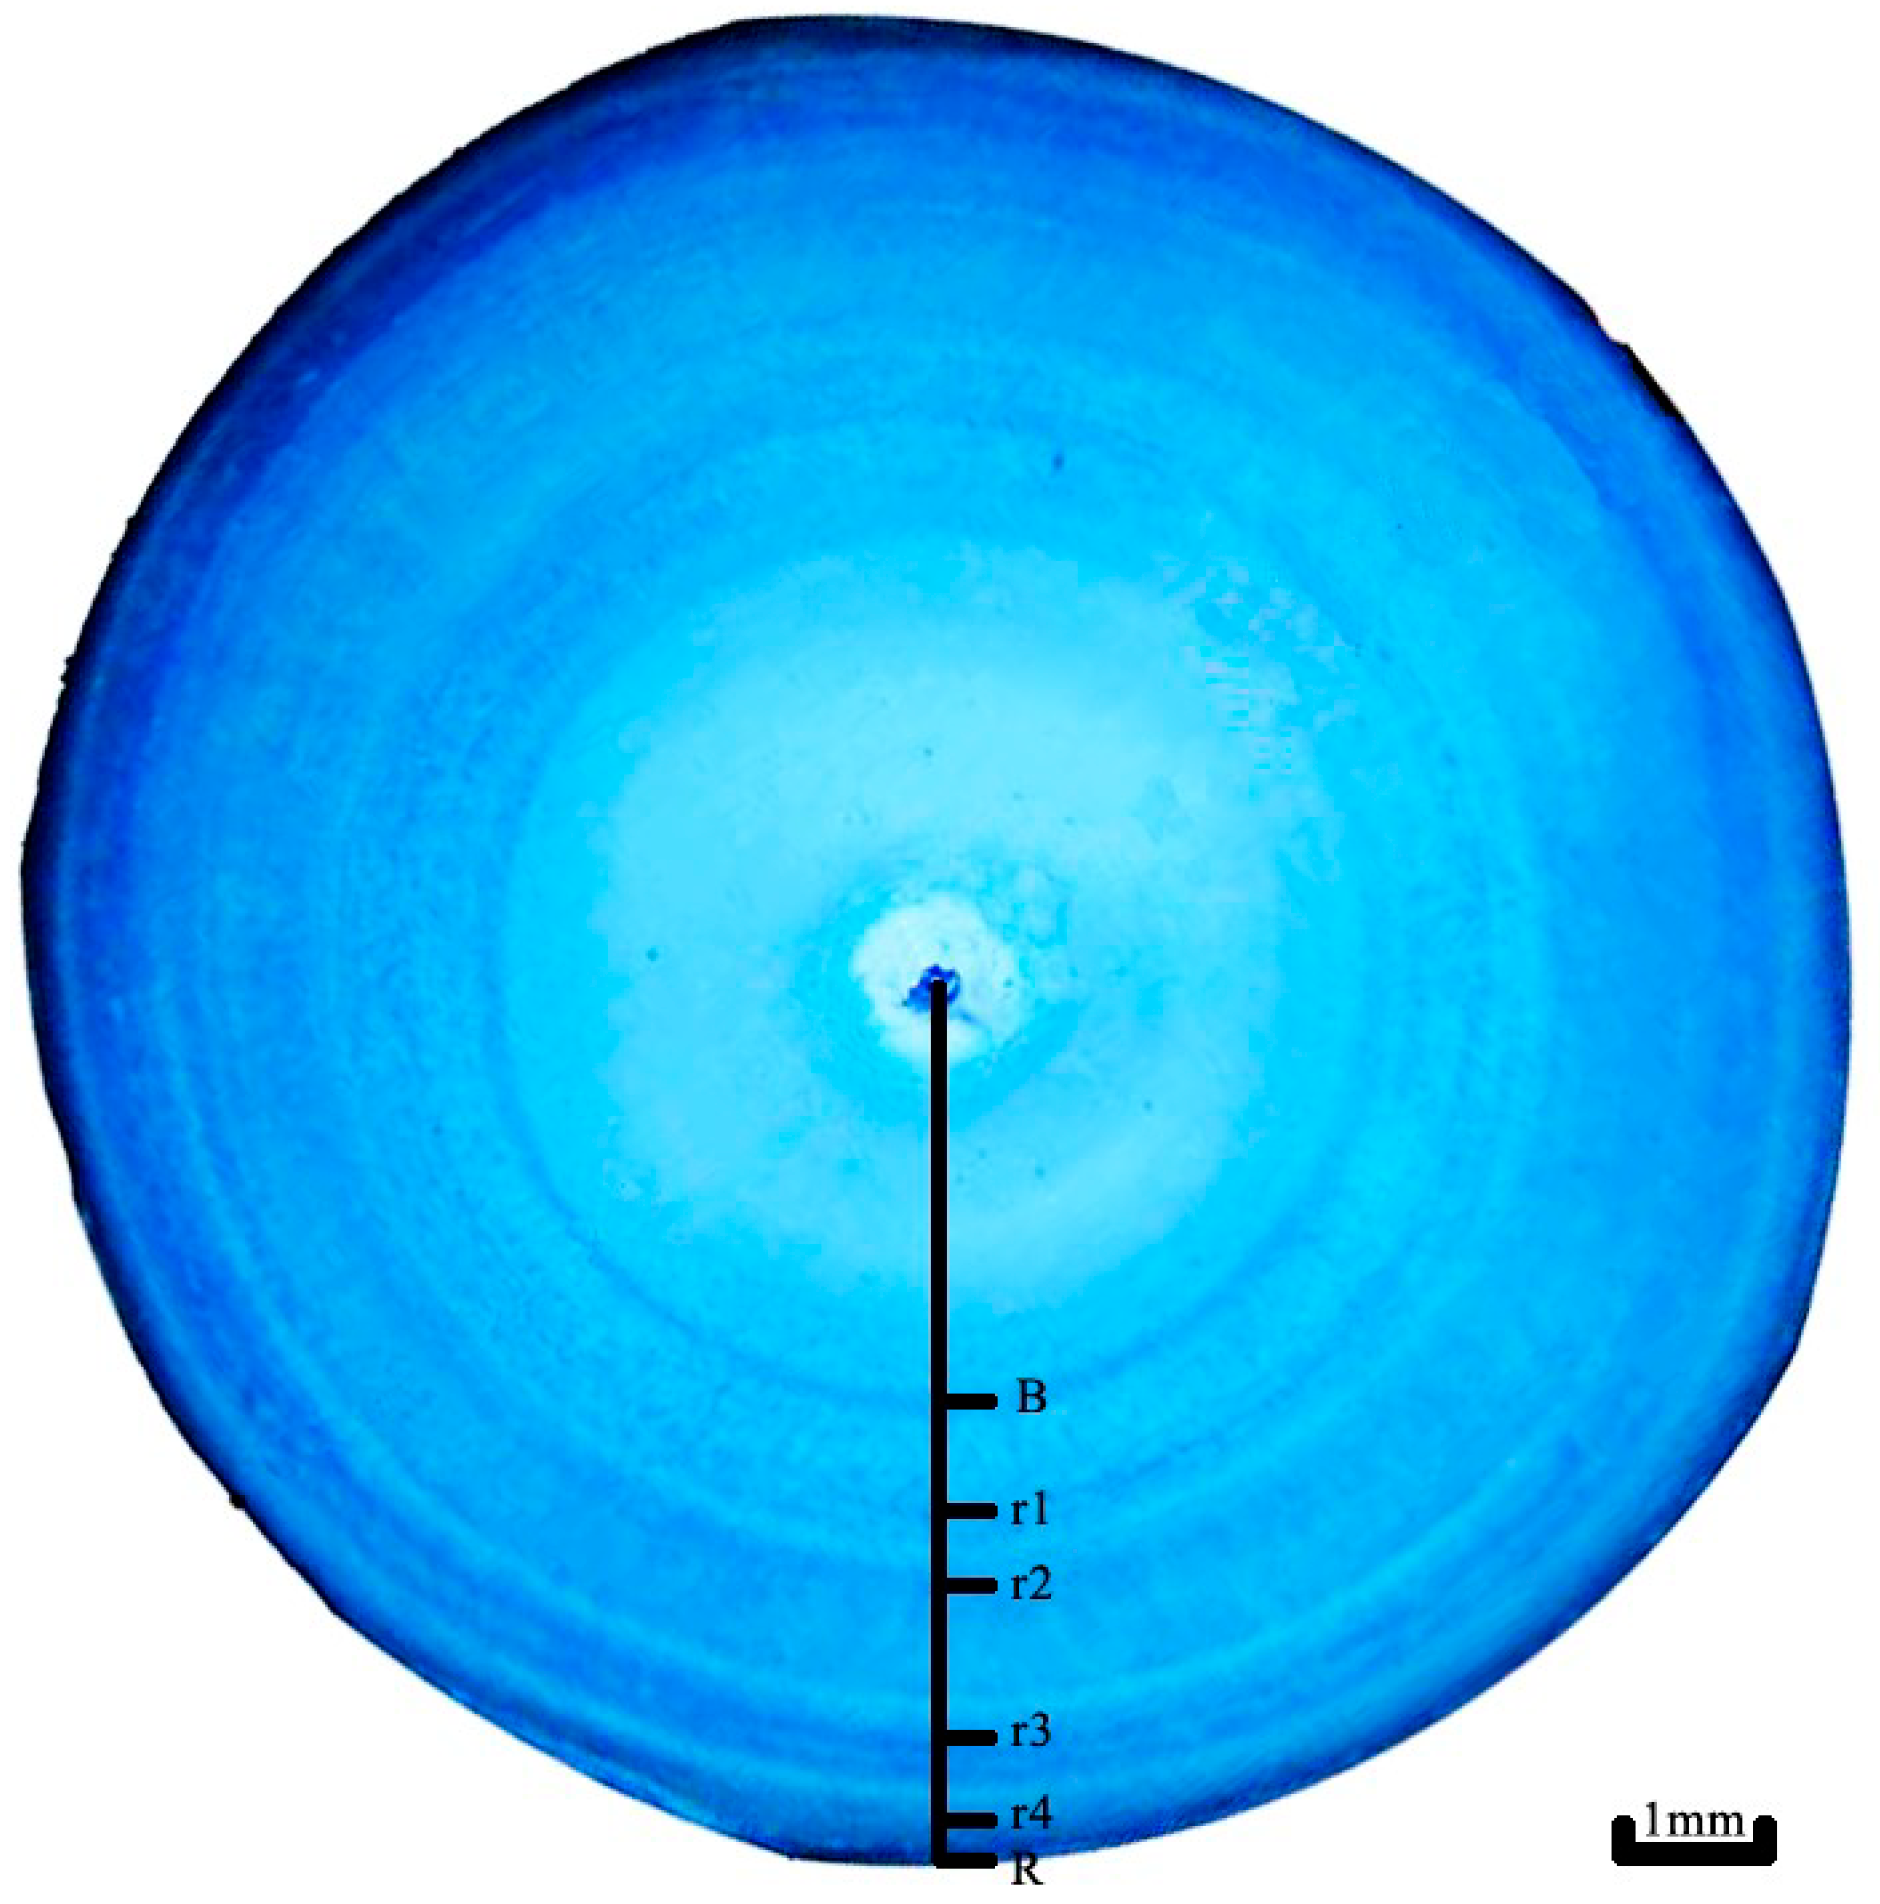
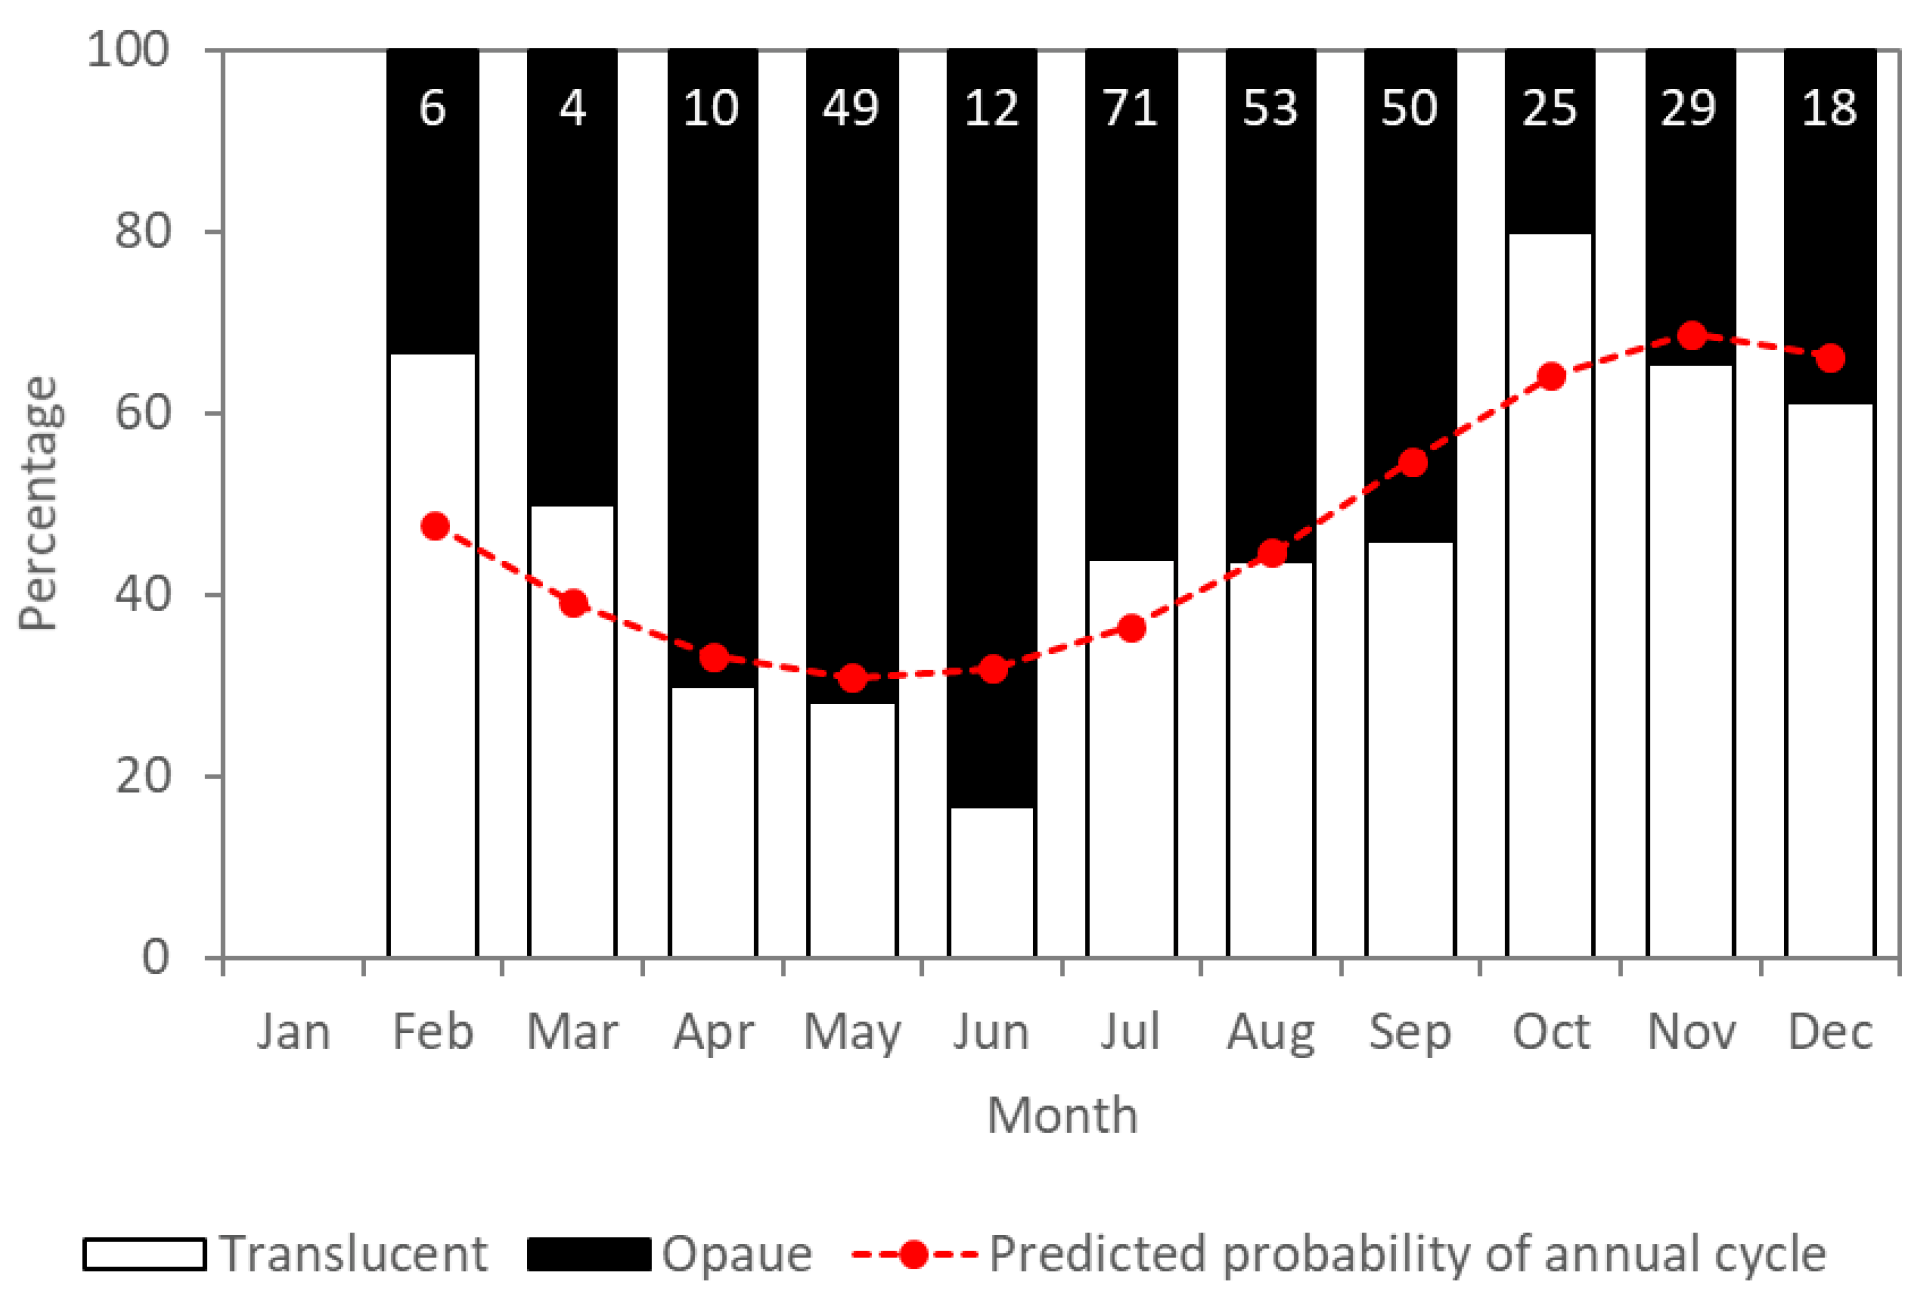
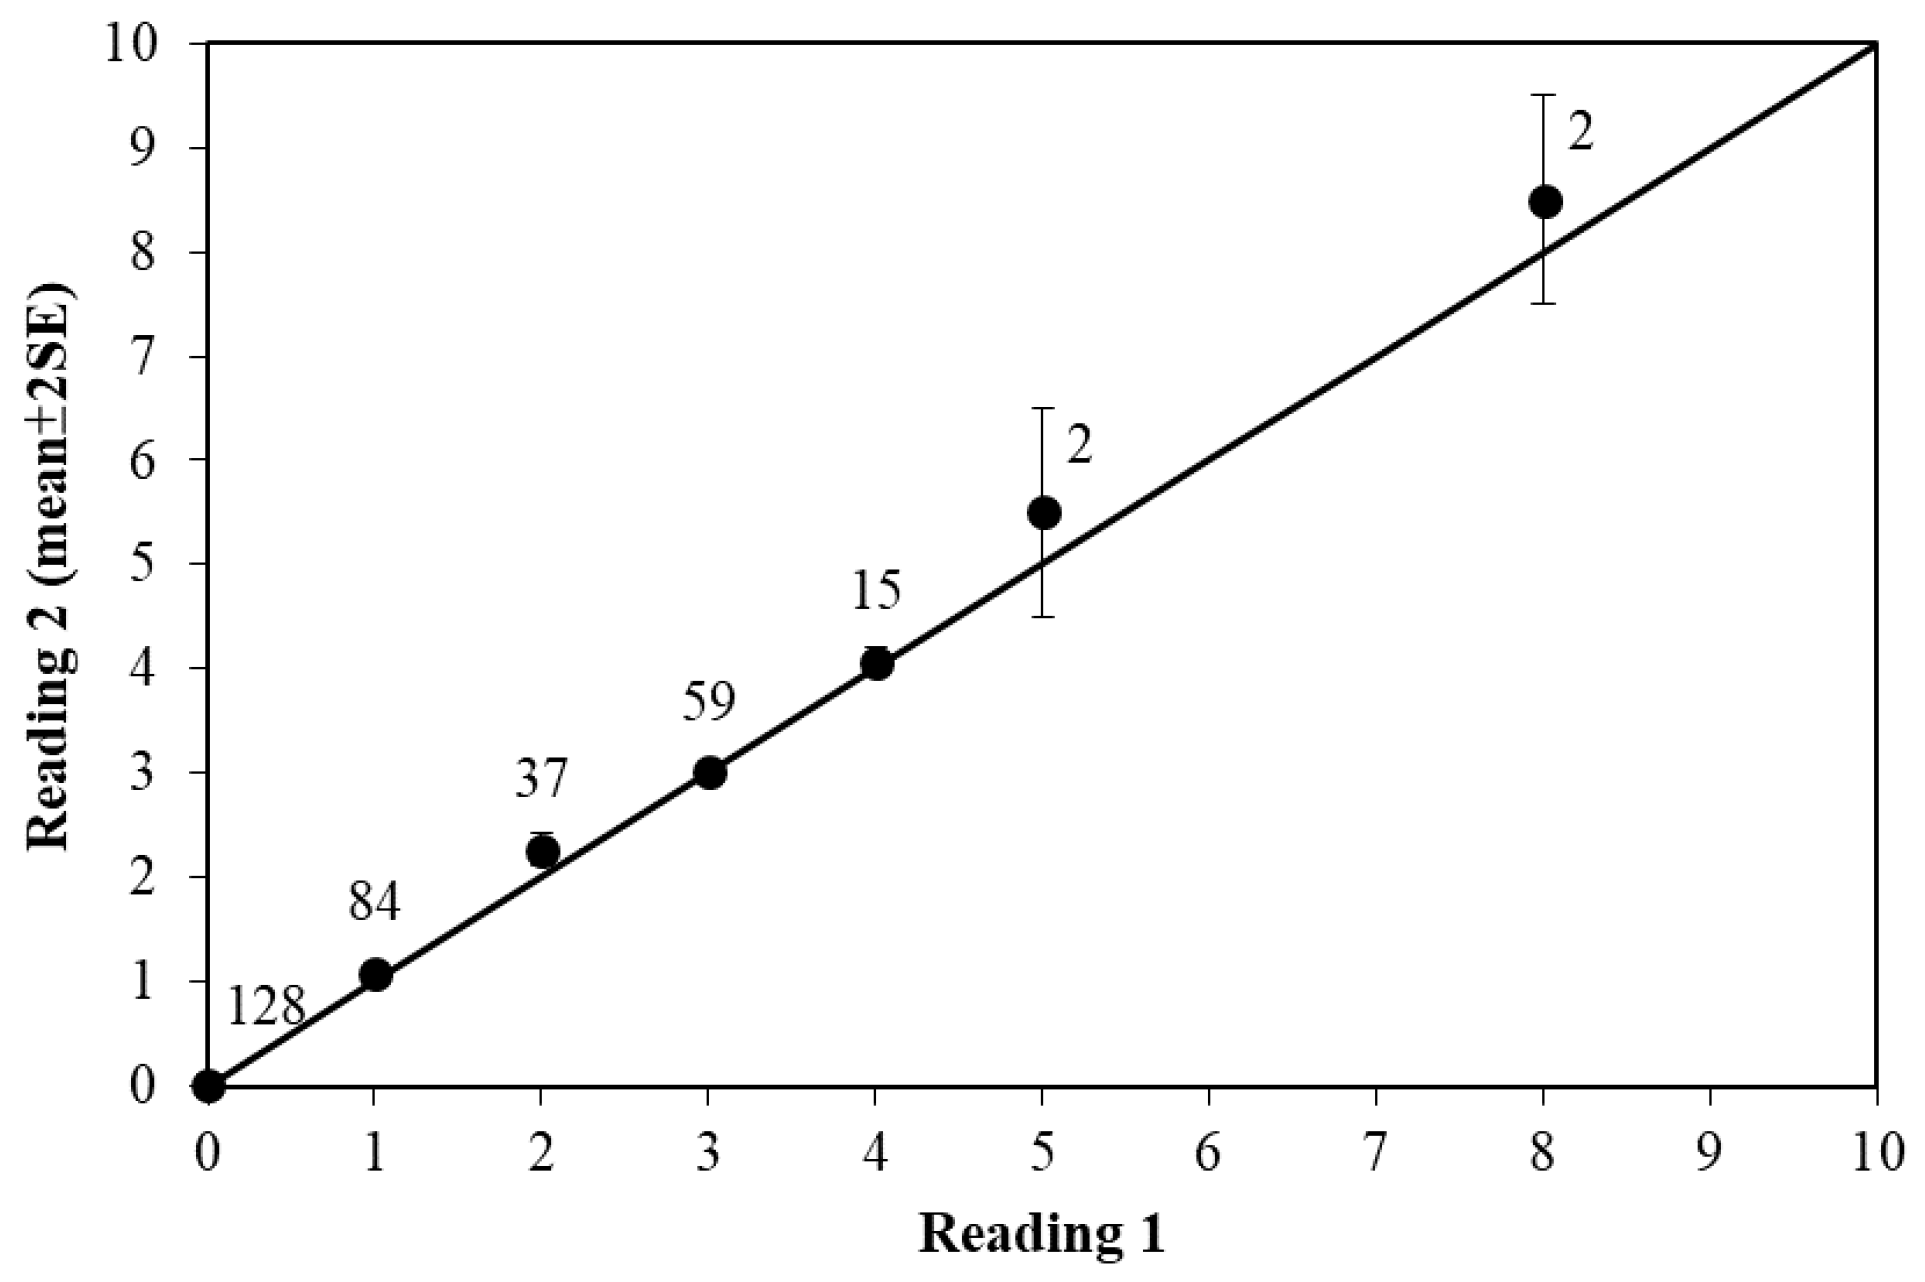
2.2. Age Estimation and Verification

Growth band pairs (including one translucent and one opaque band) were counted on the vertebral images by using Adobe Photoshop CS4 version 11.0 (Adobe, San Jose, CA, USA) to increase the contrast and clarity. Growth band pairs were counted without prior knowledge of the specimens. All vertebral centra were read twice by the same reader with an interval of 2 weeks at least. If both readings were the same, counts were accepted. The vertebral centra were discarded if the two counts differed by two or more band pairs [17,18]. A third count was conducted if the two counts differed by one band pair. The final count was accepted if it agreed with one of the previous counts. Otherwise, the vertebral centra were discarded. The first opaque band was assumed to be the birth mark. The radius of each vertebral centrum was measured from the focus to the ultimate centrum margin (Figure 2). A simple linear regression model was used to describe the relationship between TL and CD.
The periodicity and time of band pair deposition in vertebral centra were estimated using edge analysis [14] and verified by a statistical model [19]. A corrected Akaike’s information criterion (AICc) [20] was used to select the most probable periodicity of band pair formation.
As the smallest specimens for both sexes were collected in July suggesting that the parturition of spot-tail sharks occurred in July, the birth date for all specimens was assumed to be July 1 in this study. As opaque bands were deposited in June (see result), the age at the birth mark was assumed to be 11/12 year. The age of each specimen was estimated by the number of band pairs after the birth mark plus the time elapsed from the birth date to the day of being sampled using the following equations:
Age = 11/12 + n + 1 + (m − 6)/12, if m < 6
Age = 1/12 + n + (m − 6)/12, if m ≥ 6
where n is the number of band pairs after birth mark and m is the sampling month.

2.3. Growth Functions

Four growth functions namely, the von Bertalanffy growth function (VBGF) [21], the two-parameter VBGF [22], the Robertson growth function [23], and the Gompertz growth function [24], were used to fit the observed length at age data. The parameters of each function were estimated by using the nonlinear (NLIN) procedure of the statistical package SAS V. 9.0 (SAS Institute Inc. 2008, Cary, NC, USA). Size at birth was set as 50 cm TL based on our observation in this study. Akaike’s information criterion (AIC) [25], corrected AICc [20], and AICc difference (ΔAICc) [26] were used to compare the goodness of fit of the four growth functions.

3. Results

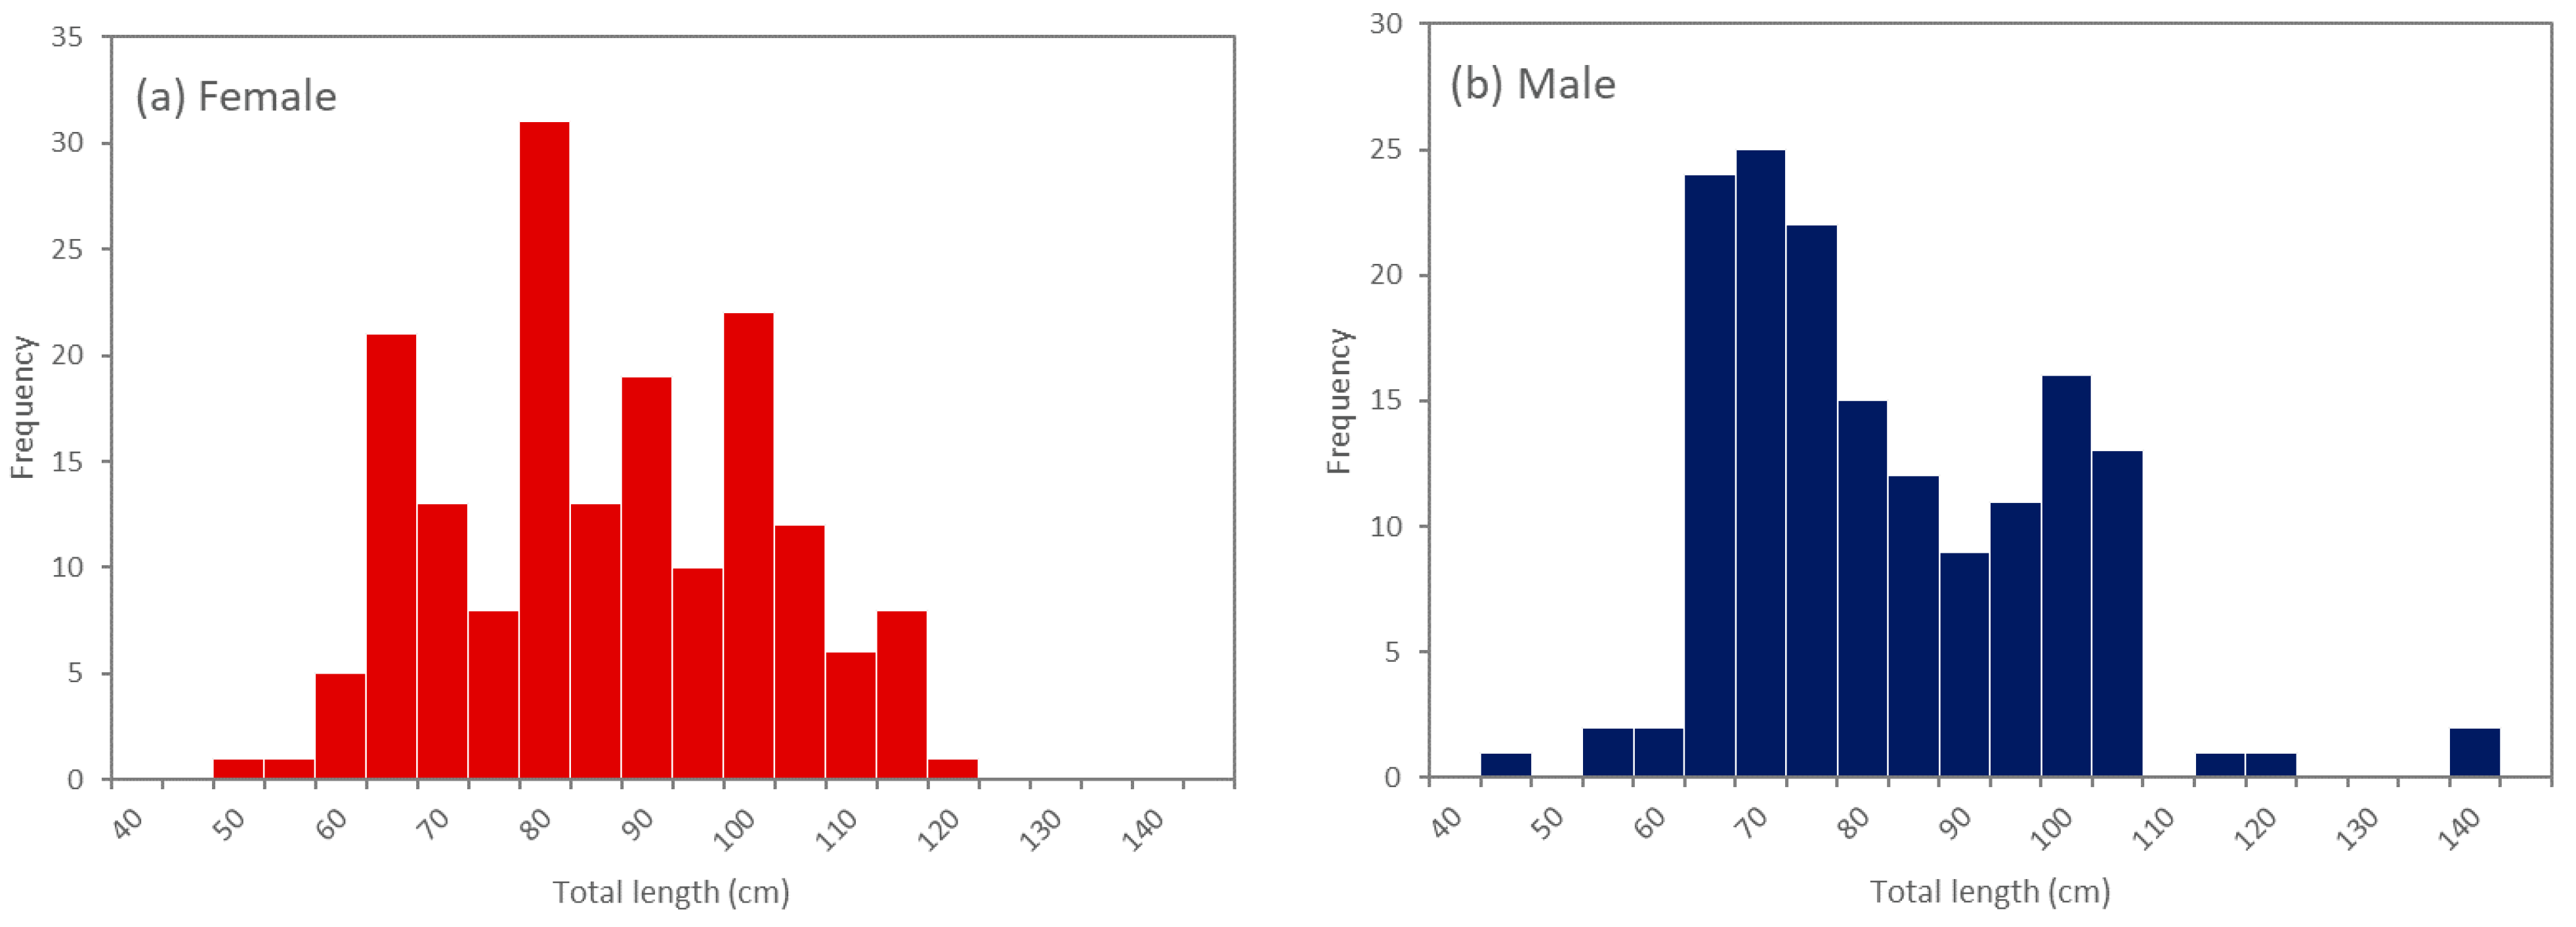
3.1. Size Range of Specimens

A total of 327 specimens (171 females and 156 males) were collected in this study (Table 1). The TL of specimens ranged from 52.5 to 123 cm (Figure 3), and the W ranged from 0.9 to 10.0 kg for females; TL ranged from 49.5 to 142 cm, and W ranged from 0.8 to 15.4 kg for males (Table 1). The seasonal length frequency distribution indicated that the smallest shark occurred in summer (June to August), suggesting that the pupping season is in summer.

3.2. Meristic Relationships

The ANCOVA results indicated that there is no significant difference between males and females in the relationship between TL and PCL (p > 0.05). Thus, the TL–PCL relationship (sexes-combined) was estimated as follows:
TL = 4.77 + 1.328PCL (n = 327, r2 = 0.97, p < 0.05).

3.3. TL–CD and W–TL Relationships

The ANCOVA indicated that there was no significant difference in the TL–CD relationship between sexes (p > 0.05). Thus, the sexes-combined TL–CD relationship was described as follows:
TL = 14.585 + 8.641CD (n = 327, r2 = 0.95, p < 0.05).
The W–TL relationships between sexes were found to be significantly different (p < 0.05) based on the maximum likelihood ratio test. Thus, the sex-specific W–TL relationships were described as follows:
W = 7.0 × 10⁻⁶ TL2.9513 (n = 171, p < 0.05) for females, and
W = 4.0 × 10⁻⁶ TL3.0516 (n = 156, p < 0.05) for males.
The centrum edge analysis indicated that the proportion of opaque bands began to increase in October, peaked in June, and decreased thereafter, suggesting that an opaque band is deposited once a year in June (Figure 4). Analysis using Okamura and Semba’s model [19] also indicated that the scenario of annual band pair formation had the smallest AICc with a good fit between predicted probability and observations (Figure 4). The scenarios of biannual formation and no cycle per year had no support due to their large values of ΔAICc (>10).
Three near-term embryos (42–45 cm TL) were collected in June 2011 but no growth bands in vertebral centra were found. However, an opaque band was found in the vertebral centrum for a free-swimming individual (57 cm TL) collected in July. Hence, we assumed that the first opaque band was the birth mark.
In total, only four (1.3%) vertebrae were discarded due to the inconsistencies in band pair count, and 91.7% of the two counts were within one-band difference. The IAPE and CV were estimated to be 2.02% and 3.03%, respectively (Figure 5). The band pairs after the birth mark were counted from 0 to 5 (123 cm TL) for females, and from 0 to 8 (140, 142 cm TL) for males based on 323 vertebral centra.

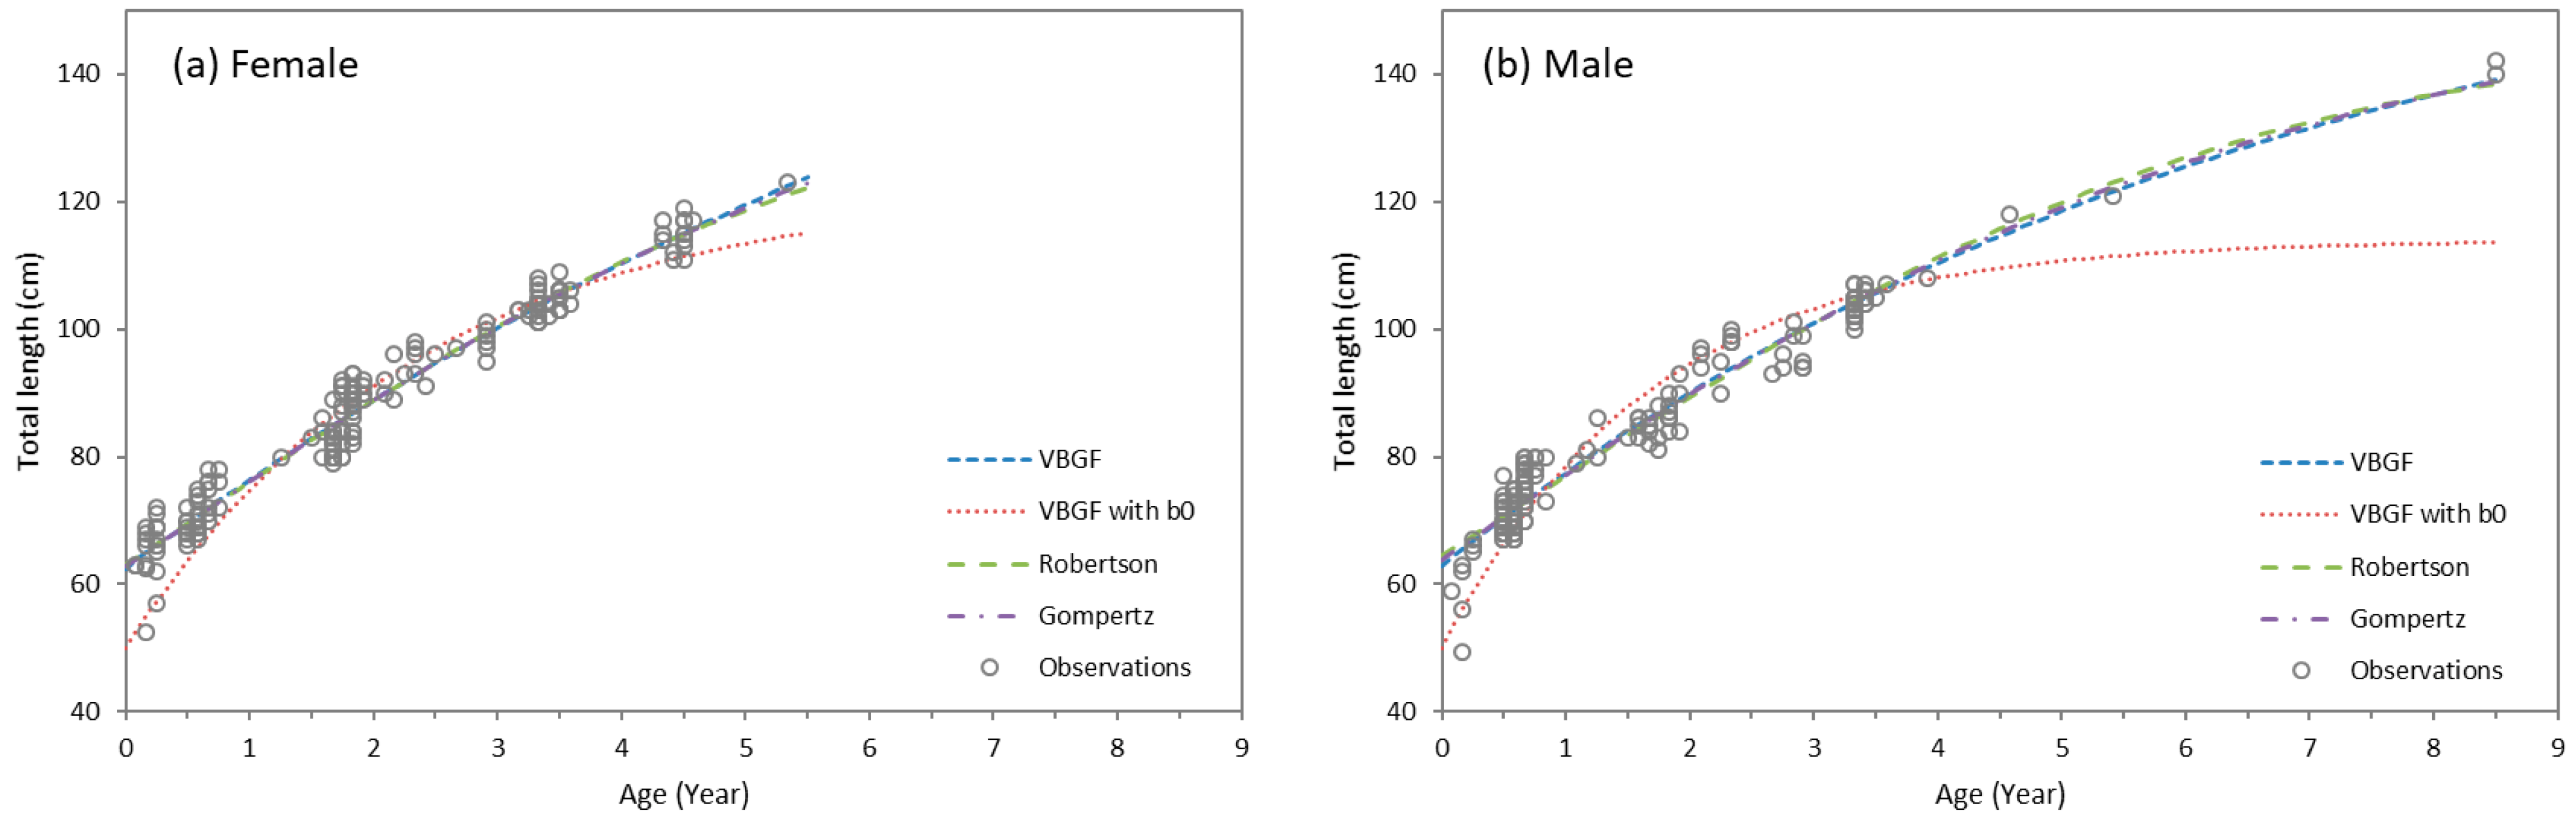
3.4. Growth Parameters
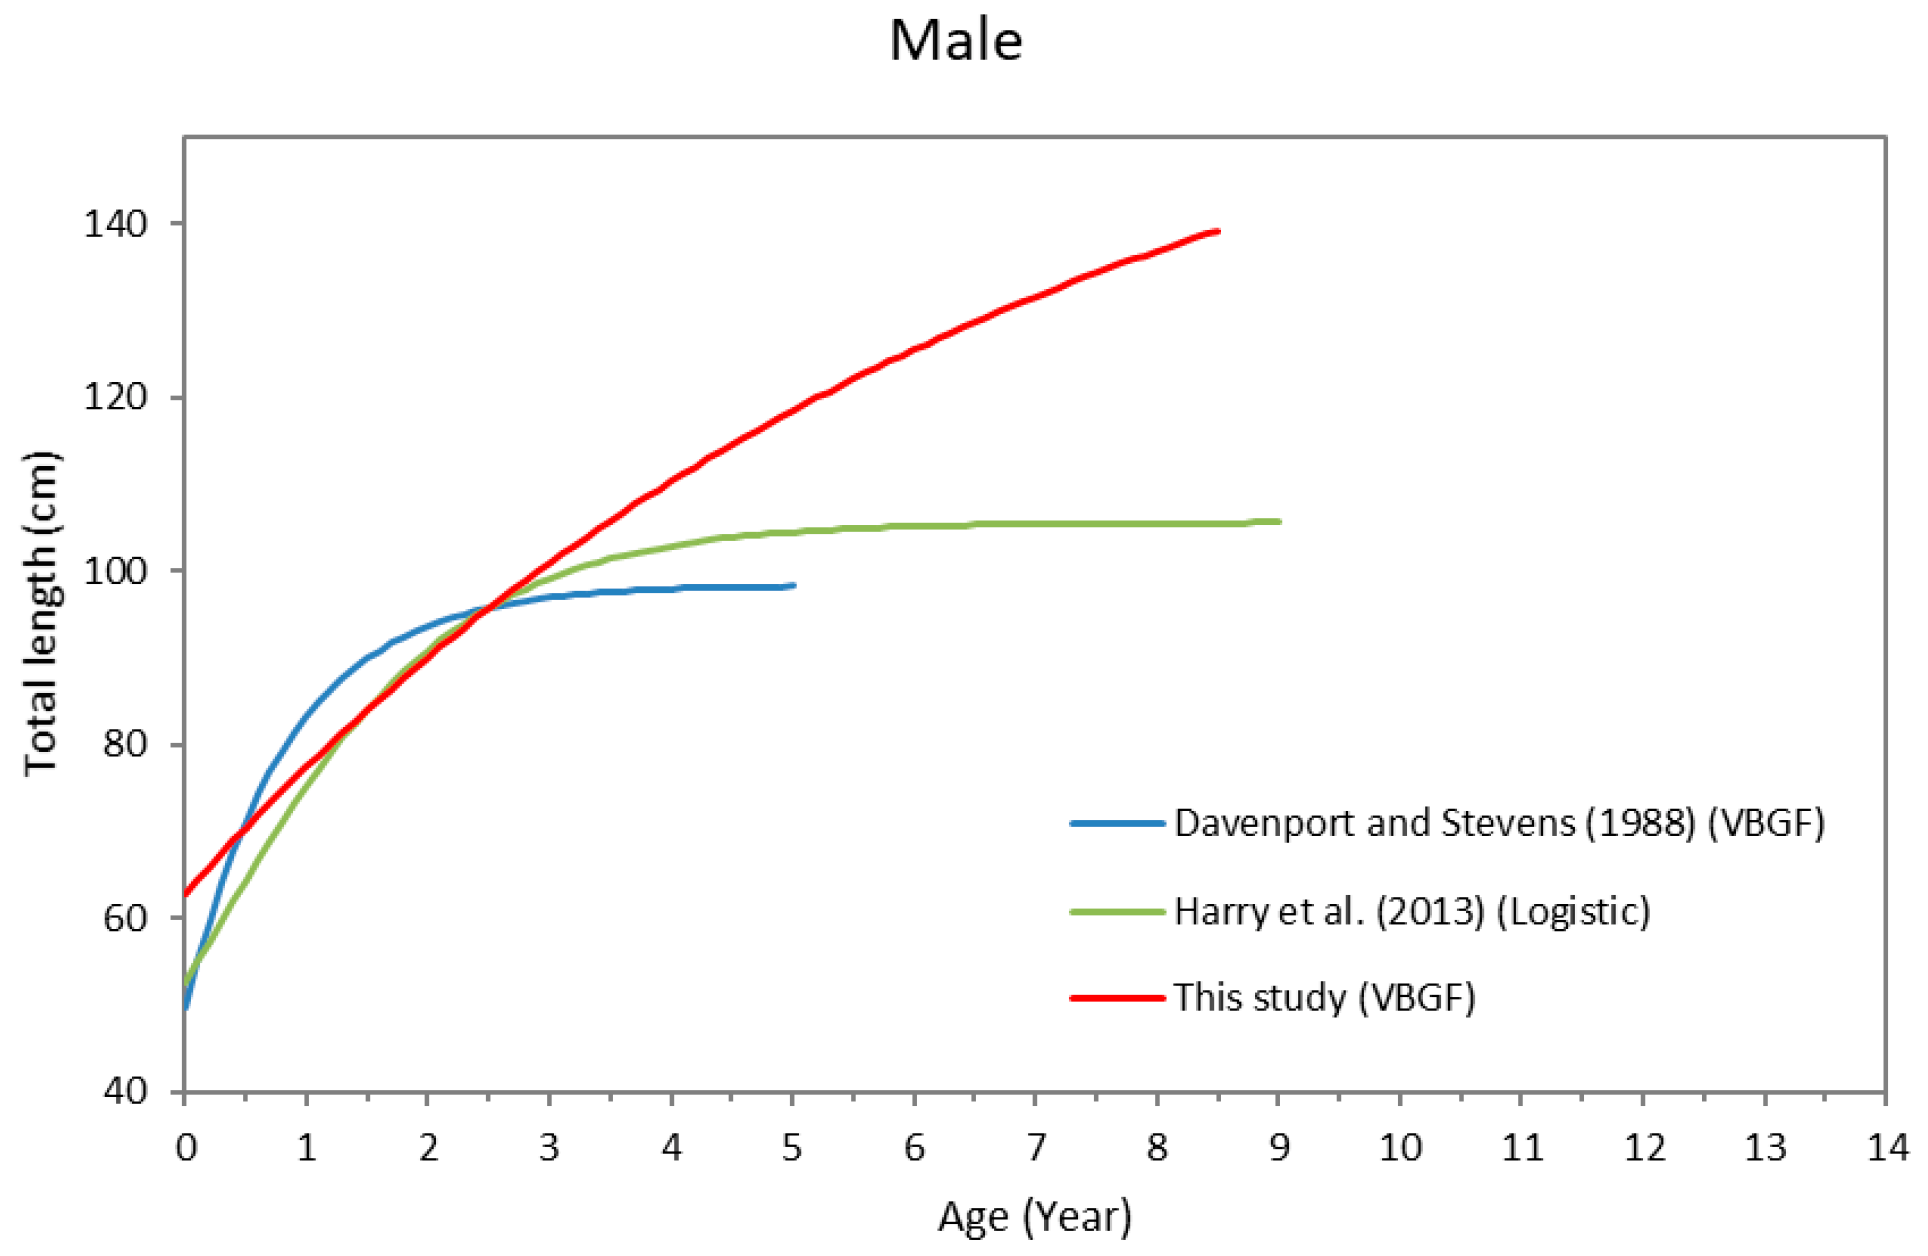
The VBGF had the smallest AICc, but the Gompertz and Robertson growth function had equal support as ΔAICc < 2 for females (Table 2). As regards males, the VBGF had the smallest AICc, but other growth functions had no support (ΔAICc > 6.0). The estimated L for females from the VBGF (203.5 cm TL) was much larger than the maximum observed lengths (123 cm TL). Thus, the Gompertz growth function with an L of 158.6 cm TL was chosen as the best model for females, and the VBGF was chosen as the best fit for males. The parameters of the Gompertz and VBGF function for the spot-tail shark were estimated as follows: L = 158.6 ± 9.09 cm TL, kG = 0.235 ± 0.0245 year−1, and c = −0.323 ± 0.204 (n = 171, p < 0.01) for females, and L = 170.2 ± 9.52 cm TL, k = 0.146 ± 0.018 year−1, and t0 = −3.16 ± 0.21 year−1 (n = 156, p < 0.01) for males (Figure 6).

4. Discussion

This study provides important information on the age and growth of the spot-tail shark in the waters of the Taiwan Strait, which can fill the research gap and could be used as input biological parameters for future stock assessment.
Although the specimens used in the present study covered a wide range of sizes, specimens larger than 110 cm TL were rarely collected (Figure 3). The maximum observed length of females (123 cm TL) was smaller than that in the northeastern Australian waters (130 cm TL) but the maximum observed size of males (142 cm TL) was much larger than that in the northeastern Australian waters (112 cm TL). The largest male and female specimens were 138 and 162 cm TL, respectively, in the Indian Ocean [8]; 114 and 131 cm TL in the northeastern Australian waters [27]; and 124 and 157 cm TL in Indonesian waters [11]. Two female spot-tail sharks of 144 and 160 cm TL caught in the northeastern Taiwan waters by offshore longline vessels were observed (but not included in our analysis), suggesting that the maximum observed length of females was larger than that of males in Taiwan waters. Similar findings were reported by [10,27]. The reason that large females were not collected in the western Taiwan waters was likely that mature females moved away from the shallow waters in the Taiwan Strait to deeper open waters where our coastal fishery did not operate. On the other hand, some large males kept staying in the Taiwan Strait and were collected in this study. A tagging study should be conducted in the future to clarify the distribution and movement of spot-tail sharks in different life stages particularly for the mature female.
Our estimates of L (158.6 cm for females and 170.2 cm TL for males) using the Gompertz and von Bertalanffy growth function for females and males were larger than the maximum observed sizes (123 cm TL for females and 142 cm TL for males) but were comparable with the maximum female individual of 160 cm TL observed in the Nanfanao fish market, northeastern Taiwan. Thus, these estimates are believed to be biologically realistic.
To examine whether the birth mark was correctly assumed on the vertebral centra of the spot-tail sharks, the size at birth (L0) (50 cm TL), the average of the largest full-term embryo (44.5 cm) and the smallest free-swimming individual (57 cm TL), observed in this study were substituted in the TL–CD equation to back estimate the diameter of the vertebral centrum at birth. The estimated diameter of vertebral centrum birth (4.24 mm) is comparable with the mean diameter of the first opaque band. Thus, the assumption of the first opaque band as the birth mark in vertebral centra is believed to be reasonable. The L0 assumed in this study is comparable with that of 45–60 cm TL [7], 52–55 cm TL in Indonesian waters [11], 50 cm TL (FishBase) [28], and the youngest male and female (both had unhealed umbilical scars indicating recent birth) of 47.8 and 50.5 cm TL in the northeastern Australian waters [27], suggesting that the L0 assumed in this study is reasonable.
The vertebrae used in this study were taken from the precaudal peduncle region. Although the vertebral centrum in this region was smaller than that in other locations of the vertebral centrum, which may result in underestimation of age, the numbers of band pairs of the vertebrae in this region were found to be the same as those in other regions of the six specimens collected in this study. In addition, the vertebrae in this region have been successfully used to estimate the age of other requiem sharks [29,30,31,32]. Thus, we believe that our age and growth estimate of spottail shark using vertebrae in the precaudal region in this study is acceptable.
In this study, we assumed that a single growth band pair was deposited per year based on the centrum edge analysis and a statistical model [19]. A similar finding was also reported by [10], who concluded that the growth band pair is deposited annually for spot-tail sharks in north Australian waters by using tagging with OTC technique. Harry et al. [27] assumed an annual deposition for spot-tail sharks in northeastern Australia because of failure in aging validation using marking (fluorescent dye calcein) and tagging and recapture data of eight mature individuals with liberty time from 188 to 1059 days. Only one un-pregnant female (105 cm stretched TL) was found one band-pair visible after marking and release for 241 days, suggesting that vertebral band pair counting may underestimate the real age of mature individuals.
A similar conclusion in different studies (areas) suggests that the assumption of annual band pair deposition of spot-tail sharks in this study is reasonable. The average water temperatures at the depths that spot-tail sharks inhabit (20–140 m) [6] in the waters of the central Taiwan Strait varied from 19.3 to 29.3 °C in June to August [33] suggesting that band formation in spot-tail sharks of the waters of the Taiwan Strait may be related to changes in water temperature of their habitats. In addition, the time of opaque band formation (June) corresponds to the pupping season (July) of this species suggesting that band pair formation may also be closely related to the parturition season.
In the present study, the numbers of band pairs were counted up to 5 and 8 for females and males, respectively. These results were comparable with those of [10], but the maximum number of band pairs of females (5) was much less than that (14) reported in [27]. Large-size females not collected in this study or different criteria for determining the number of band pairs were the possible reason that resulted in the discrepancy between the two studies. Harry [12] documented aging sharks by counting growth zones on calcified structures; for example, vertebral centra may underestimate true age. Davenport and Stevens [10] used stained whole thoracic vertebral centra, while Harry et al. [27] use sagittal thin sections of anterior centra. In this study, dyed whole precaudal vertebral centra were used for ageing. The discrepancy of maximum ages among studies may be also due to different processing methods employed in age estimates. Further study on age validation using tagging with OTC technique is needed to clarify this uncertainty.
Recent studies have found evidence that vertebra-based estimates systematically underage elasmobranchs, especially for older individuals, in which band pair deposition may slow or cease altogether (e.g., [34]). Harry et al. (2013) [27] also mentioned the occurrence of age underestimation of spot-tail shark based on the calcine marking. Therefore, it is likely that age underestimation may affect not only long-lived species [35] but also short-lived species.
The Gompertz growth function and the VBGF were selected as the best model for females and males, respectively, in the present study. However, the VBGF was used in describing the growth of spot-tail shark in other regions except for males in the northeastern Australian waters (logistic function). The estimated L for both sexes in this study is quite larger than those in northern and northeastern Australia [10,27] (Table 3). The growth coefficient of males in this study was smaller than those from Australian waters. However, the comparison of growth coefficient for females was not made as different growth functions have different meanings [36]. The L of females estimated from the present study is smaller than that of males. This result is inconsistent with the results from the literature that the L of females is much larger than that of males [10,27]. As we mentioned earlier, large females caught by offshore longline fishery in the northeastern waters have been observed in other fishing port. Therefore, sex segregation of large individuals is likely one of the possible reasons that resulted in the discrepancy. However, further study is needed to clarify this possibility. The growth curve of females derived from this study was close to those in [10,27] up to age 4 (Figure 7). On the other hand, the growth curve of males derived from this study was different from those from other regions [10,27] (Figure 8). The discrepancy may be because large male specimens were not collected in Australian waters or was due to geographic variation in growth.
This study provides the first detailed information on age and growth of the spot-tail shark in the Taiwan Strait. However, substantial additional samples and analysis are needed to make the results directly applicable for future stock assessment. The overlapping of its habitat and coastal or offshore fishery makes this stock vulnerable to overfishing. A close monitoring of the catch and size composition and season closure will ensure the sustainability of this species in this region.

Author Contributions

Conceptualization, S.-J.J. and K.-M.L.; methodology, Z.-Y.H.; software, K.-Y.S.; formal analysis, Z.-Y.H. and K.-Y.S.; data curation, Z.-Y.H.; writing—original draft preparation, S.-J.J. and Z.-Y.H.; writing—review and editing, S.-J.J. and K.-M.L.; supervision, S.-J.J.; project administration, K.-M.L.; funding acquisition, K.-M.L. All authors have read and agreed to the published version of the manuscript.

Funding

This research was funded by the Ministry of Science and Technology, Taiwan, ROC, grant number MOST 105-2313-B-019-005-MY3.

Data Availability Statement

Not applicable.

Conflicts of Interest

The authors declare no conflict of interest.

References

  1. Fordham, S. Conservation and management status of spiny dogfish sharks (Squalus acanthias). AC20 Inf. 2004, 22, 1–7. [Google Scholar]
  2. Kruse, G.H.; Gallucci, V.F.; Tribuzio, C.A.; Rice, J. Abundance, Life History, and Population Demographics of Spiny Dogfish, Squalus Acanthias, in the Gulf of Alaska; School of Fisheries and Ocean Sciences, University of Alaska Fairbanks: Fairbanks, AK, USA, 2008; p. 173. [Google Scholar]
  3. Reynolds, J.D.; Dulvy, N.K.; Goodwin, N.B.; Hutchings, J.A. Biology of extinction risk in marine fishes. Proc. R. Soc. B Biol. Sci. 2005, 272, 2337–2344. [Google Scholar] [CrossRef] [PubMed] [Green Version]
  4. Anon. Taiwan Fisheries Statistic Year Book, Fisheries Agency, Council of Agriculture, Taiwan. 2014. Available online: https://www.fa.gov.tw/cht/PublicationsFishYear/ (accessed on 24 June 2015).
  5. Compagno, L.J.V. FAO species catalogue. Vol. 4. Sharks of the World. An annoted and illustrated catalogue of shark species known to date. Part 2. Carcharhiniformes. FAO Fish. Synop. 1984, 125, 251–655. [Google Scholar]
  6. Shao, K.T. The Fish Database of Taiwan. WWW Web Electronic Publication. 2018. Available online: http://fishdb.sinica.edu.tw (accessed on 20 December 2018).
  7. Compagno, L.J.V.; Dando, M.; Fowler, S. Sharks of the World: Collins Field Guide; Harper Collins Publishers: London, UK, 2005; p. 368. [Google Scholar]
  8. Giles, J.L.; Ovenden, J.R.; AlMojil, D.; Garvilles, E.; Khampetch, K.O.; Manjebrayakath, H.; Riginos, C. Extensive genetic population structure in the Indo–West Pacific spot-tail shark, Carcharhinus sorrah. Bull. Mar. Sci. 2014, 90, 427–454. [Google Scholar] [CrossRef] [Green Version]
  9. Stevens, J.D.; Wiley, P.D. Biology of two commercially important Carcharhinid sharks from northern Australia. Mar. Freshw. Res. 1986, 37, 671–688. [Google Scholar] [CrossRef]
  10. Davenport, S.; Stevens, J.D. Age and growth of two commercially important sharks (Carcharhinus tilstoni and C. sorrah) from Northern Australia. Mar. Freshw. Res. 1988, 39, 417–433. [Google Scholar] [CrossRef]
  11. White, W.T. Catch composition and reproductive biology of whaler sharks (Carcharhiniformes: Carcharhinidae) caught by fisheries in Indonesia. J. Fish. Biol. 2007, 71, 1512–1540. [Google Scholar] [CrossRef]
  12. Harry, A.V. Evidence for systemic age underestimation in shark and ray ageing studies. Fish Fish. 2018, 19, 185–200. [Google Scholar] [CrossRef]
  13. Pillans, R.; Stevens, J.D.; White, W.T. Carcharhinus sorrah. The IUCN Red List of Threatened Species 2009: E.T161376A5409506. Retrieved 2009, 10, 2009-2. [Google Scholar]
  14. Cailliet, G.M.; Goldman, K.J. Age determination and validation in chondrichthyan fishes. In Biology of Sharks and Their Relatives; Carrier, J.C., Musick, J.A., Heithaus, M.R., Eds.; CRC Press: Boca Raton, FL, USA, 2004. [Google Scholar]
  15. Zar, J.H. Biostatistical Analysis, 5th ed.; Prentice-Hall Pearson: Hoboken, NJ, USA, 2010. [Google Scholar]
  16. Kimura, D.K. Likelihood models for the von Bertalanffy growth curve. Fish. Bull. 1980, 77, 765–776. [Google Scholar]
  17. Joung, S.J.; Liao, Y.Y.; Chen, C.T. Age and growth of sandbar shark, Carcharhinus plumbeus, in northeastern Taiwan waters. Fish. Res. 2004, 70, 83–96. [Google Scholar] [CrossRef]
  18. Chen, C.T.; Leu, T.C.; Joung, S.J.; Lo, N.C.H. Age and growth of the scalloped hammerhead, Sphyrna lewini, in northeastern Taiwan waters. Pac. Sci. 1990, 44, 156–170. [Google Scholar]
  19. Okamura, H.; Semba, Y. A novel statistical method for validating the periodicity of vertebral growth band formation in elasmobranch fishes. Can. J. Fish. Aquat. Sci. 2009, 66, 771–780. [Google Scholar] [CrossRef]
  20. Hurvich, C.M.; Tsai, C.L. Regression and time series model selection in small samples. Biometrika 1989, 76, 297–307. [Google Scholar] [CrossRef]
  21. Beverton, R.J.H. Notes on the Use of Theoretical Models in the Study of the Dynamics of Exploited Fish Populations; Miscellaneous contributions, US Fishery Laboratory, number 2; Bureau of Commercial Fisheries: Beaufort, NC, USA, 1954. [Google Scholar]
  22. Fabens, A.J. Properties and fitting of the von Bertalanffy growth curve. Growth 1965, 29, 265–289. [Google Scholar]
  23. Robertson, T.B. The Chemical Basis of Growth and Senescence; Lippincott, J.B., Ed.; JB Lippincott Company: Philadelphia, PA, USA, 1923; p. 98. [Google Scholar]
  24. Gompertz, B. On the nature of the function expressive of the law of human mortality and on a new mode of determining life contingencies. Philos. Trans. R. Soc. Lond.–A Math. Phys. Sci. 1825, 115, 513–583. [Google Scholar] [CrossRef]
  25. Akaike, H. Information theory and an extension of the maximum likelihood principle. In Second International Symposium on Information Theory; Petrov, B.N., Csaki, F., Eds.; Akademiai Kiado: Budapest, Hungary, 1973; pp. 267–281. [Google Scholar] [CrossRef]
  26. Burnham, K.P.; Anderson, D.R. Model Selection and Multimodel Inference: A Practical Information–Theoretic Approach; Springer: New York, NY, USA, 2002. [Google Scholar]
  27. Harry, A.V.; Tobin, A.J.; Simpfendorfer, C.A. Age, growth and reproductive biology of the spot-tail shark, Carcharhinus sorrah, and the Australian blacktip shark, C. tilstoni, from the Great Barrier Reef World Heritage Area, northeastern Australia. Mar. Freshw. Res. 2013, 64, 277–293. [Google Scholar] [CrossRef]
  28. Froese, R.; Pauly, D. (Eds.) FishBase, version (08/2021); World Wide Web Electronic Publication, 2021. Available online: https://www.fishbase.se/search.php (accessed on 1 August 2021).
  29. Joung, S.J.; Liao, Y.Y.; Liu, K.M.; Chen, C.T.; Leu, L.C. Age, growth, and reproduction of the spinner shark, Carcharhinus brevipinna, in the northeastern waters of Taiwan. Zool. Stud. 2005, 44, 102–110. [Google Scholar]
  30. Joung, S.J.; Chen, C.T.; Lee, H.H.; Liu, K.M. Age, growth, and reproduction of the silky sharks Carcharhinus falciformis in northeastern Taiwan waters. Fish. Res. 2008, 90, 78–85. [Google Scholar] [CrossRef]
  31. Joung, S.J.; Chen, J.H.; Chin, C.P.; Liu, K.M. Age and growth of the dusky shark, Carcharhinus obscurus, in the Northwest Pacific Ocean. Terr. Atmos. Ocean. Sci. 2015, 26, 153–160. [Google Scholar] [CrossRef] [Green Version]
  32. Joung, S.J.; Chen, N.F.; Hsu, H.H.; Liu, K.M. Estimates of life history parameters of the oceanic whitetip shark, Carcharhinus longimanus, in the western North Pacific Ocean. Mar. Biol. Res. 2016, 12, 758–768. [Google Scholar] [CrossRef]
  33. Ocean Data Bank of Taiwan, WWW Web Electronic Publication. 2017. Available online: https://www.odb.ntu.edu.tw (accessed on 5 December 2017).
  34. Natanson, L.J.; Skomal, G.; Hoffmann, S.; Porter, M.E.; Goldman, K.J.; Serra, D. Age and growth of sharks: Do vertebral band pairs record age? Mar. Freshw. Res. 2018, 69, 1440–1452. [Google Scholar] [CrossRef]
  35. Francis, M.; Campana, S.E.; Jones, C.M. Age under-estimation in New Zealand porbeagle sharks (Lamna nasus): Is there an upper limit to ages that can be determined from shark vertebrae? Mar. Freshw. Res. 2007, 58, 10–23. [Google Scholar] [CrossRef] [Green Version]
  36. Liu, K.M.; Wu, C.B.; Joung, S.J.; Tsai, W.P.; Su, K.Y. Multi-model approach on growth estimation and association with life history trait for elasmobranchs. Front. Mar. Sci. 2021, 8, 591692. [Google Scholar] [CrossRef]
Figure 1. Sampling area of the spot-tail shark in the Taiwan Strait.
Jmse 10 00413 g001
Figure 2. Longitudinal cross section of a vertebral centrum from a female spot-tail shark (117 cm TL) counted to be 4 band pairs. B: birth mark; R: centrum radius.
Jmse 10 00413 g002
Figure 3. Total length frequency distribution of the spot-tail shark used in this study.
Jmse 10 00413 g003
Figure 4. Monthly frequency changes in band edge on vertebral centrum for the spot-tail shark. Numbers indicate sample size, : predicted probability of annual cycle from Okamura and Semba’s method (2009).
Jmse 10 00413 g004
Figure 5. Age-bias plot for the comparison of band pair counts between readings 1 and 2 (±2 SE).
Jmse 10 00413 g005
Figure 6. Sex-specific growth curves for the spot-tail shark: VBGF: ------, VBGF with L0: ·········, Robertson: − −, Gompertz: − · −.
Jmse 10 00413 g006
Figure 7. Comparison of the growth curves of female spot-tail sharks in different regions. VBGF: Davenport and Stevens (1988) and Harry et al. (2013); Gompertz: this study.
Jmse 10 00413 g007
Figure 8. Comparison of the growth curves of male spot-tail sharks in different regions. VBGF: Davenport and Stevens (1988), and this study; Robertson: Harry et al. (2013).
Jmse 10 00413 g008
Table 1. Specimens of the spot-tail shark collected in this study.
Female Male
MonthnRage of TL (cm)nRage of TL (cm)Total
January-----
February285.0–88.0479–976
March486.0–103.0--4
April474.0–103.0680–10810
May2663.0–123.02359–10749
June588.0–112.07104–11012
July3657.5–115.03549.5–14271
August2757.0–110.02665–11053
September2372.0–97.02770–9350
October1672.0–92.0977–8825
November1882.0–93.01173–10129
December1091.0–98.0884–10018
Total17157.0–123.015649.5–142.0327
Table 2. Growth parameters of spot-tail sharks estimated from three growth functions.
L(cm)k/kR/kG(Year−1)t0/b/c-AICc∆AICc
FemaleVBGF203.5(152.3–254.7)0.104(0.057–0.151)−3.54(−4.14–−2.93)1270.820.00
VBGF with L0122.3(117.0–127.7)0.420(0.363–0.478) 1447.79176.97
Roberstson142.7(132.2–153.1)0.366(0.316–0.416)0.64(0.25–1.02)1272.101.28
Gompertz158.6(140.7–176.6)0.235(0.186–0.283)−0.32(−0.73–0.08)1271.220.40
MaleVBGF170.2(151.4–189.0)0.146(0.110–0.182)−3.16(−3.57–−2.75)1178.970.00
VBGF with L0114.0(110.2–117.7)0.595(0.523–0.667) 1329.68150.71
Roberstson148.7(140.0–157.3)0.338(0.302–0.374)0.79(0.44–1.13)1191.2512.28
Gompertz155.8(143.8–167.8)0.241(0.203–0.278)−0.47(−0.73–−0.21)1185.186.21
L: asymptotic length; k: growth coefficient of VBGF; t0: theoretical age at zero length; kR: growth coefficient of Robertson growth function; kG: growth coefficient of Gompertz growth function; b: growth parameter of Robertson growth function; c: growth parameter of Gompertz growth function; AICc: corrected Akaike’s information criterion; △AICc: the difference of each AICc and the lowest observed AICc. The values in parentheses are 95% confidence intervals.
Table 3. Comparison of growth parameters of spot-tail sharks estimated from different studies.
AreaSexModelLk/kR/kGt0/L0/ctmaxReference
Northern AustraliaMaleVBGF98.41.170−0.65Davenport and Stevens (1988)
FemaleVBGF123.90.340−1.97
Northeastern AustraliaMaleLogistic105.60.91652.59Harry et al., (2013)
FemaleVBGF126.60.33655.314
Taiwan StraitMaleVBGF170.20.146−3.168This study
FemaleGompertz158.60.235−0.325
Publisher’s Note: MDPI stays neutral with regard to jurisdictional claims in published maps and institutional affiliations.

