Abstract
Decarbonization is an ongoing issue in the shipping industry, and electric propulsion systems are being proposed as alternative solutions to satisfy this requirement. To answer the fundamental questions of “Are electric propulsion systems the green solution?” and “Can DC distribution systems contribute to the decarbonization in shipping?”, this paper analyzed DC distribution system electrical characteristics, economic feasibility, and environmental evaluation for a full-scale AC-DC hybrid distribution electric propulsion system facility. By applying the actual ship’s operating profile as inputs, a DC distribution system with an active front end rectifier and a variable speed generator engine was proven to guarantee the same electric stability as the conventional AC distribution system. The life cycle assessment results achieved economic and life cycle environmental benefits of about 10% (8.9% for Case 1 and 12.4% for Case 2). These research findings offer meaningful insights into the DC distribution system to minimize fuel consumption and emissions toward cleaner shipping.
1. Introduction
1.1. Background
With growing concerns about accelerated climate change, the United Nations (UN) has made a series of international agreements to curb greenhouse gases over the last decades. The United Nations Framework Convention on Climate Change (UNFCCC) adopted the Kyoto Protocol in 1997, starting with the United Nations Framework Convention on Climate Change in May 1992, followed by the Paris Agreement in December 2015 and prepared detailed implementation rule [1].
According to the ‘Fourth IMO Greenhouse Gas Study’ report [2] of the International Maritime Organization (IMO) under the United Nations in 2020, greenhouse gas (GHG) emissions (including carbon dioxide, methane, and nitrous oxide) from shipping activities increased from 2.76% in 2012 to 2.89% in 2018. IMO adopted an ambitious resolution to curb GHG emissions from all ships by 50% by 2050, compared to the 2008 level in 2018 [3].
The Republic of Korea enacted the ‘Act on Promotion of the Development and Distribution of Environmentally Friendly Ships’ that promotes comprehensive measures and policies to enhance cleaner shipping, which came into force on 1 January 2020 [4]. In addition, the ‘Green Public Vessel Conversion Project’ was also proposed to replace government-own ships aged 20 years and over with greener ones. Similarly, the ‘Green Ship Certification System’ was designed to encourage private shipping sectors to take part in cleaner shipping with national support.
In the Korean government’s green ship project, technologies that can improve the efficiency of conventional ships and reduce emissions were categorized as ‘green technologies’. Electric propulsions, hybrid systems, and fuel cells are good examples.
In particular, applying an electric propulsion system in coastal ships is widely recognized as an effective solution. As a result, since the first operation of the All-Electric Ship ‘MV AMPERE’ in 2015 [5], the number of electric-powered ships has been continuously increasing. Their global market share is expected to grow from $4.7 billion in 2021 to $16.2 billion in 2030 as shown in Figure 1 [6].
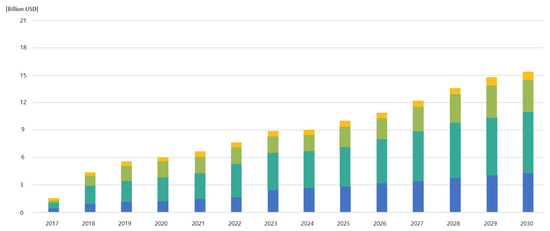
Figure 1.
New building market trends of electric propulsion ships (2020, Market Research Report).
Siemens and Bellona in 2019 [7] indicated that 70% of 180 Norwegian ferries have adopted battery hybrid-electric propulsion systems. Several examples support the drastic movement to convert the conventional mechanical propulsion system to electric or hybrid propulsion.
In January 2019, Wartsila signed a contract with Hagland Shipping AS to convert the propulsion system of its cargo ship from a diesel-based mechanical propulsion system to an electric propulsion system with a battery [8]. Additionally, in 2020, it can be confirmed that cargo ships with fully electric propulsion systems are being built and operated in China [9]. As such, it can be seen that the paradigm of ship propulsion systems worldwide is rapidly changing from the existing mechanical propulsion systems to electric propulsion systems [10].
Despite the growing attention to electric-powered ships, there is still a lack of information on whether electric-powered vessels can contribute to reducing the environmental impacts overall. This can be answered if the performance of the entire electric propulsion system, such as the generator, switchboard, power conversion device, propulsion motor, and load bank, is measured simultaneously. Those systems have been applied mainly to coast sailing–small ships rather than medium–large ocean-going ships due to their technical hindrances, such as low energy density.
In addition, most hybrid-electric propulsion ships have currently been operated based on AC power-distribution systems. However, the remarkable advancement in semiconductor devices for power with improved capacity and switching speed has improved power control, power converter efficiencies, and DC circuit breakers. As a result, the shipbuilding sector has started to draw attention to DC power-distribution systems onboard. Nevertheless, their applications, as well as impact assessments, are still limited.
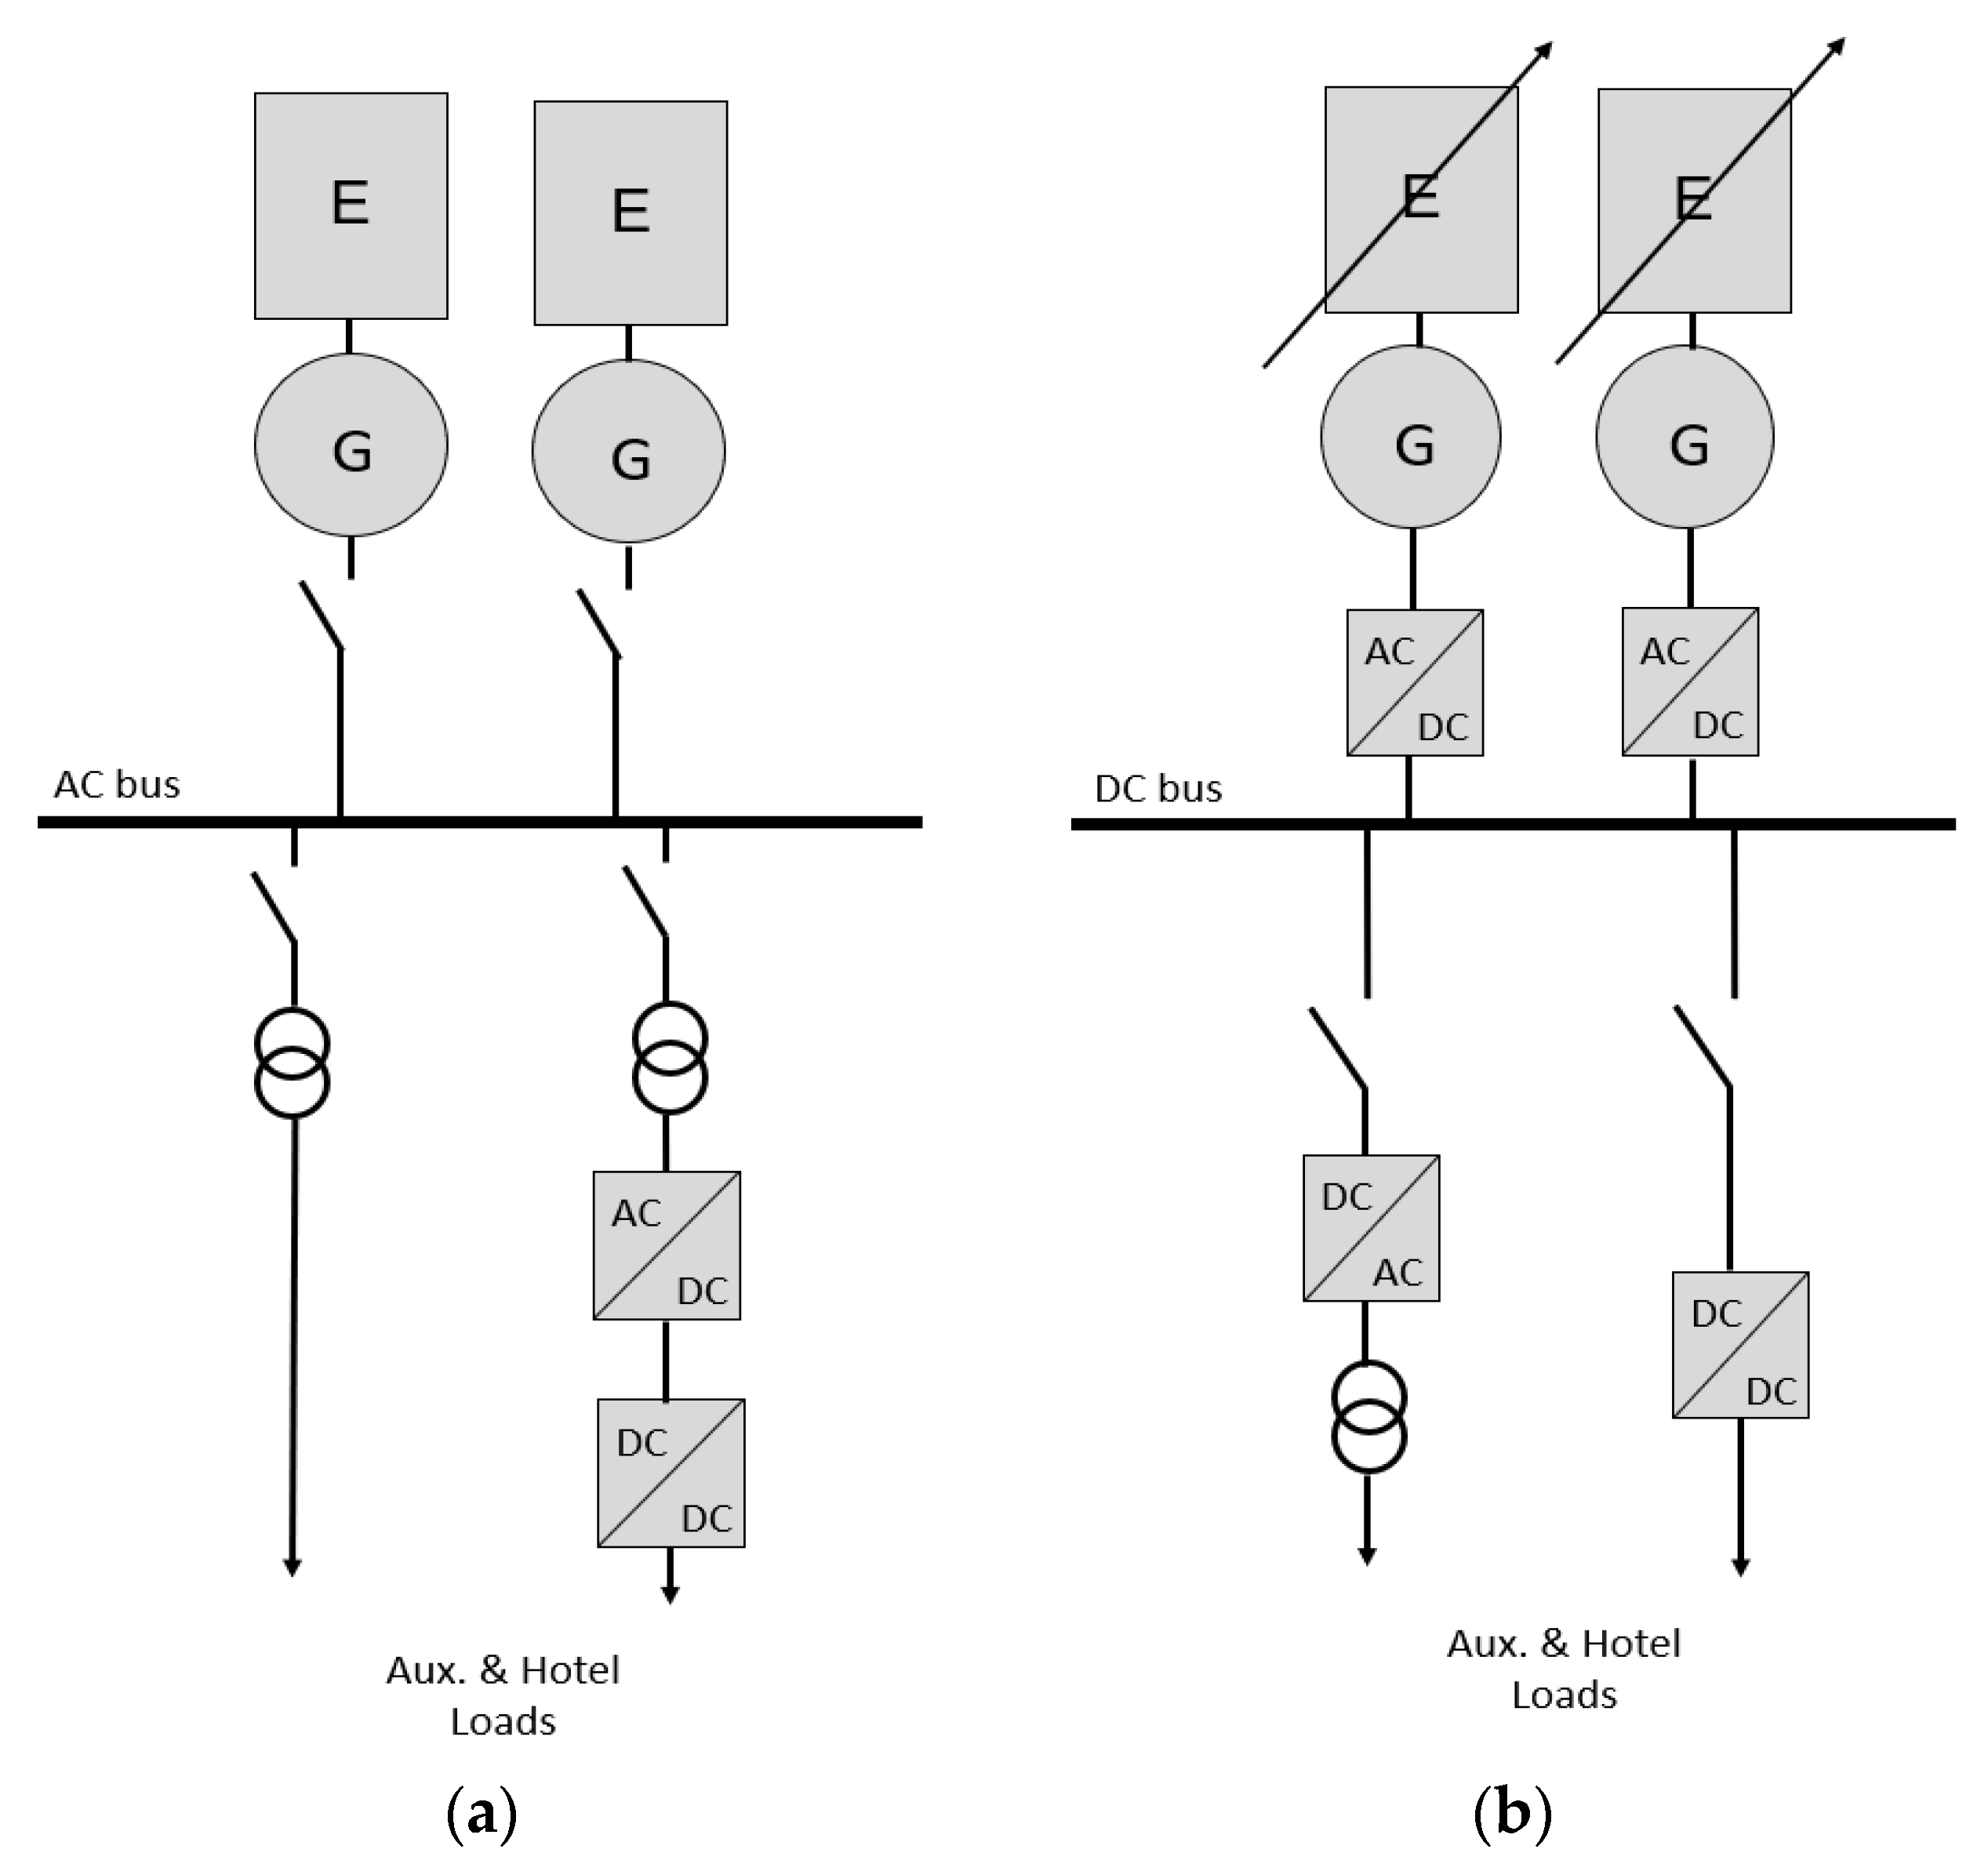
This paper was motivated to investigate the benefits of using DC distribution systems from economic and environmental perspectives and to offer insights into whether DC distribution systems can be a new standard for electric propulsion ships. Figure 2 compares the key differences between AC and DC grid systems.

Figure 2.
System configuration of AC and DC grid systems in an electric propulsion system; (a) AC grid system, (b) DC grid system.
As shown in Figure 2a, the constant speed power generation system uses AC distribution, and the converted voltage (220V, 460V, or 3300 V) via a transformer is supplied to loads. To provide DC power, this voltage goes through an additional AC-DC converting process. In the case of the conventional AC power-distribution system, since the rotational speed of the power source is constant, the frequency is also constant with stable AC voltage, and the load also uses the AC source. However, in the case of a variable speed power generation system, the voltage is irregularly changed to increase the efficiency of the prime mover at a low load with different rpm. In the variable speed power generation system of Figure 2b, the rectification system is required for voltage and frequency controls in response to various changes in engine speed.
The rectification system constant voltage is supplied to DC distribution by the rectification system, mainly using the AFE (Active Front End) rectifier. After that, it is converted to AC voltage according to the load required, and then power is supplied through the step-down and step-up process via a transformer, and DC power is supplied in the same way as in the AC distribution system [11]. A significant difference between the constant speed and the variable speed power generation systems is the configuration of the prime mover and distribution system with rectification control [12]. A power generation system applies a stable DC power in the distribution system according to the frequency change. The variable speed generator and the constant speed generator are the same; however, a key difference is placed in their mechanism on voltage and speed controls [12,13].
Table 1 shows the advent of ships using DC power-distribution systems. It can be observed that there is an increasing number of cases of applying the DC distribution system to replace the AC distribution system, centering on small- and medium-sized power ships [10,14].

Table 1.
References of the DC-gird system in ships [Kim et al., 2020].
1.2. Past Research
To introduce and utilize past research results on our DC distribution system research, we performed a diverse literature review, as shown in Table 2, about the generator, rectification system, distribution system, control, and efficiency.
Table 2.
Literature review of electric propulsion systems.
The main components of the DC distribution system were introduced in a conceptual study on the improvement of ship energy efficiency [14]. Previous research also compares the advantages and disadvantages of the AC power-distribution system and the DC power-distribution system [17,31] with some example cases where the basic concept of the overall system has been studied. The DC power-distribution system for electric propulsion ships converts the output of the AC generator into DC using a power converter by using a power conversion device installed at the rear end of the generator. Parallel operation between grids is possible with the DC voltage as their bus terminal remains the same [24,25].
The DC switchboard has no particular internal configuration except for the control of the circuit breaker. It connects the output generated from the generator to the load stage through the on/off of the installed circuit breaker. This plays a role in transmitting to the monitoring system in real-time. In other words, the parallel operation with an AC distribution system requires a much-complicated process. A study was conducted to verify the control method through simulation and to analyze the results for each situation according to circuit applications through various system designs of DC power-distribution systems.
There has been a series of research investigating the performance of DC power systems: a study related to the fuel-saving effects in a DC power-distribution system applying a variable speed engine generator [34,35] through simulation [19]; a study on the reference voltage control algorithm that occurs when the speed of a variable speed engine synchronous generator changes [12]; optimal power control algorithm design for electric-powered ships applying DC distribution [46]; power quality improvement simulation studies of electric-powered ships using DC distribution system [47]; equivalent consumption minimization strategy compared to conventional control methods [32]; and a study on the fuel efficiency improvement simulation of the DC distribution system of an electric-powered ship applying the and the design and control of circuit breaker, which is the current task of the DC distribution system [28].
Most of the past research was focused on conceptual and laboratory-level simulations. Their focus is on the evaluation of variable-speed engine generators, power conversion devices, and power-distribution systems. In this regard, their studies were overly laden with theoretical verification with model simulation or experimental tests. However, it was found that there is a significant lack of research for evaluating the overall performance of the DC distribution electric propulsion system to which the variable speed engine generator is applied in consideration of actual ship-operating conditions.
Many studies have been conducted on motor control, rectifier control, load sharing control, energy management control, and motor and switching element improvement. There was no case demonstrating how much the fuel consumption is reduced with the same electric propulsion system and how it affects the ship’s environmental aspect. Research on the electric propulsion system’s control algorithm has focused on stability and robustness without considering the economic aspects of the environmental impact analysis.
The application of the DC power-distribution system with the variable speed generator through an AFE rectifier can improve the efficiency of the entire electric propulsion system. Only the electrical characteristics are considered in the past research without establishing a full-scale electric propulsion system in terms of the controller’s performance applied to the electric propulsion system. While green technology is highly demanded, it is not easy to find research on overall system efficiency improvement and the environmental impact of the controller.
This study can answer the fundamental question of whether the DC distribution system’s improvement can affect decarbonization in the shipping industry. This research is motivated by the research gap that brings out the need to investigate further the performance of integrated systems: DC power-distribution system with various speed engine generator sets, power conversion devices, and the propulsion motor. In this context, this research was proposed to evaluate the holistic DC propulsion systems using an onshore testbed by implementing actual electric-ship-operating conditions by applying an AFE rectifier. Thus, we provide meaningful insight into how the DC distribution system can contribute to reducing environmental impacts from electric ships.
2. Methodology
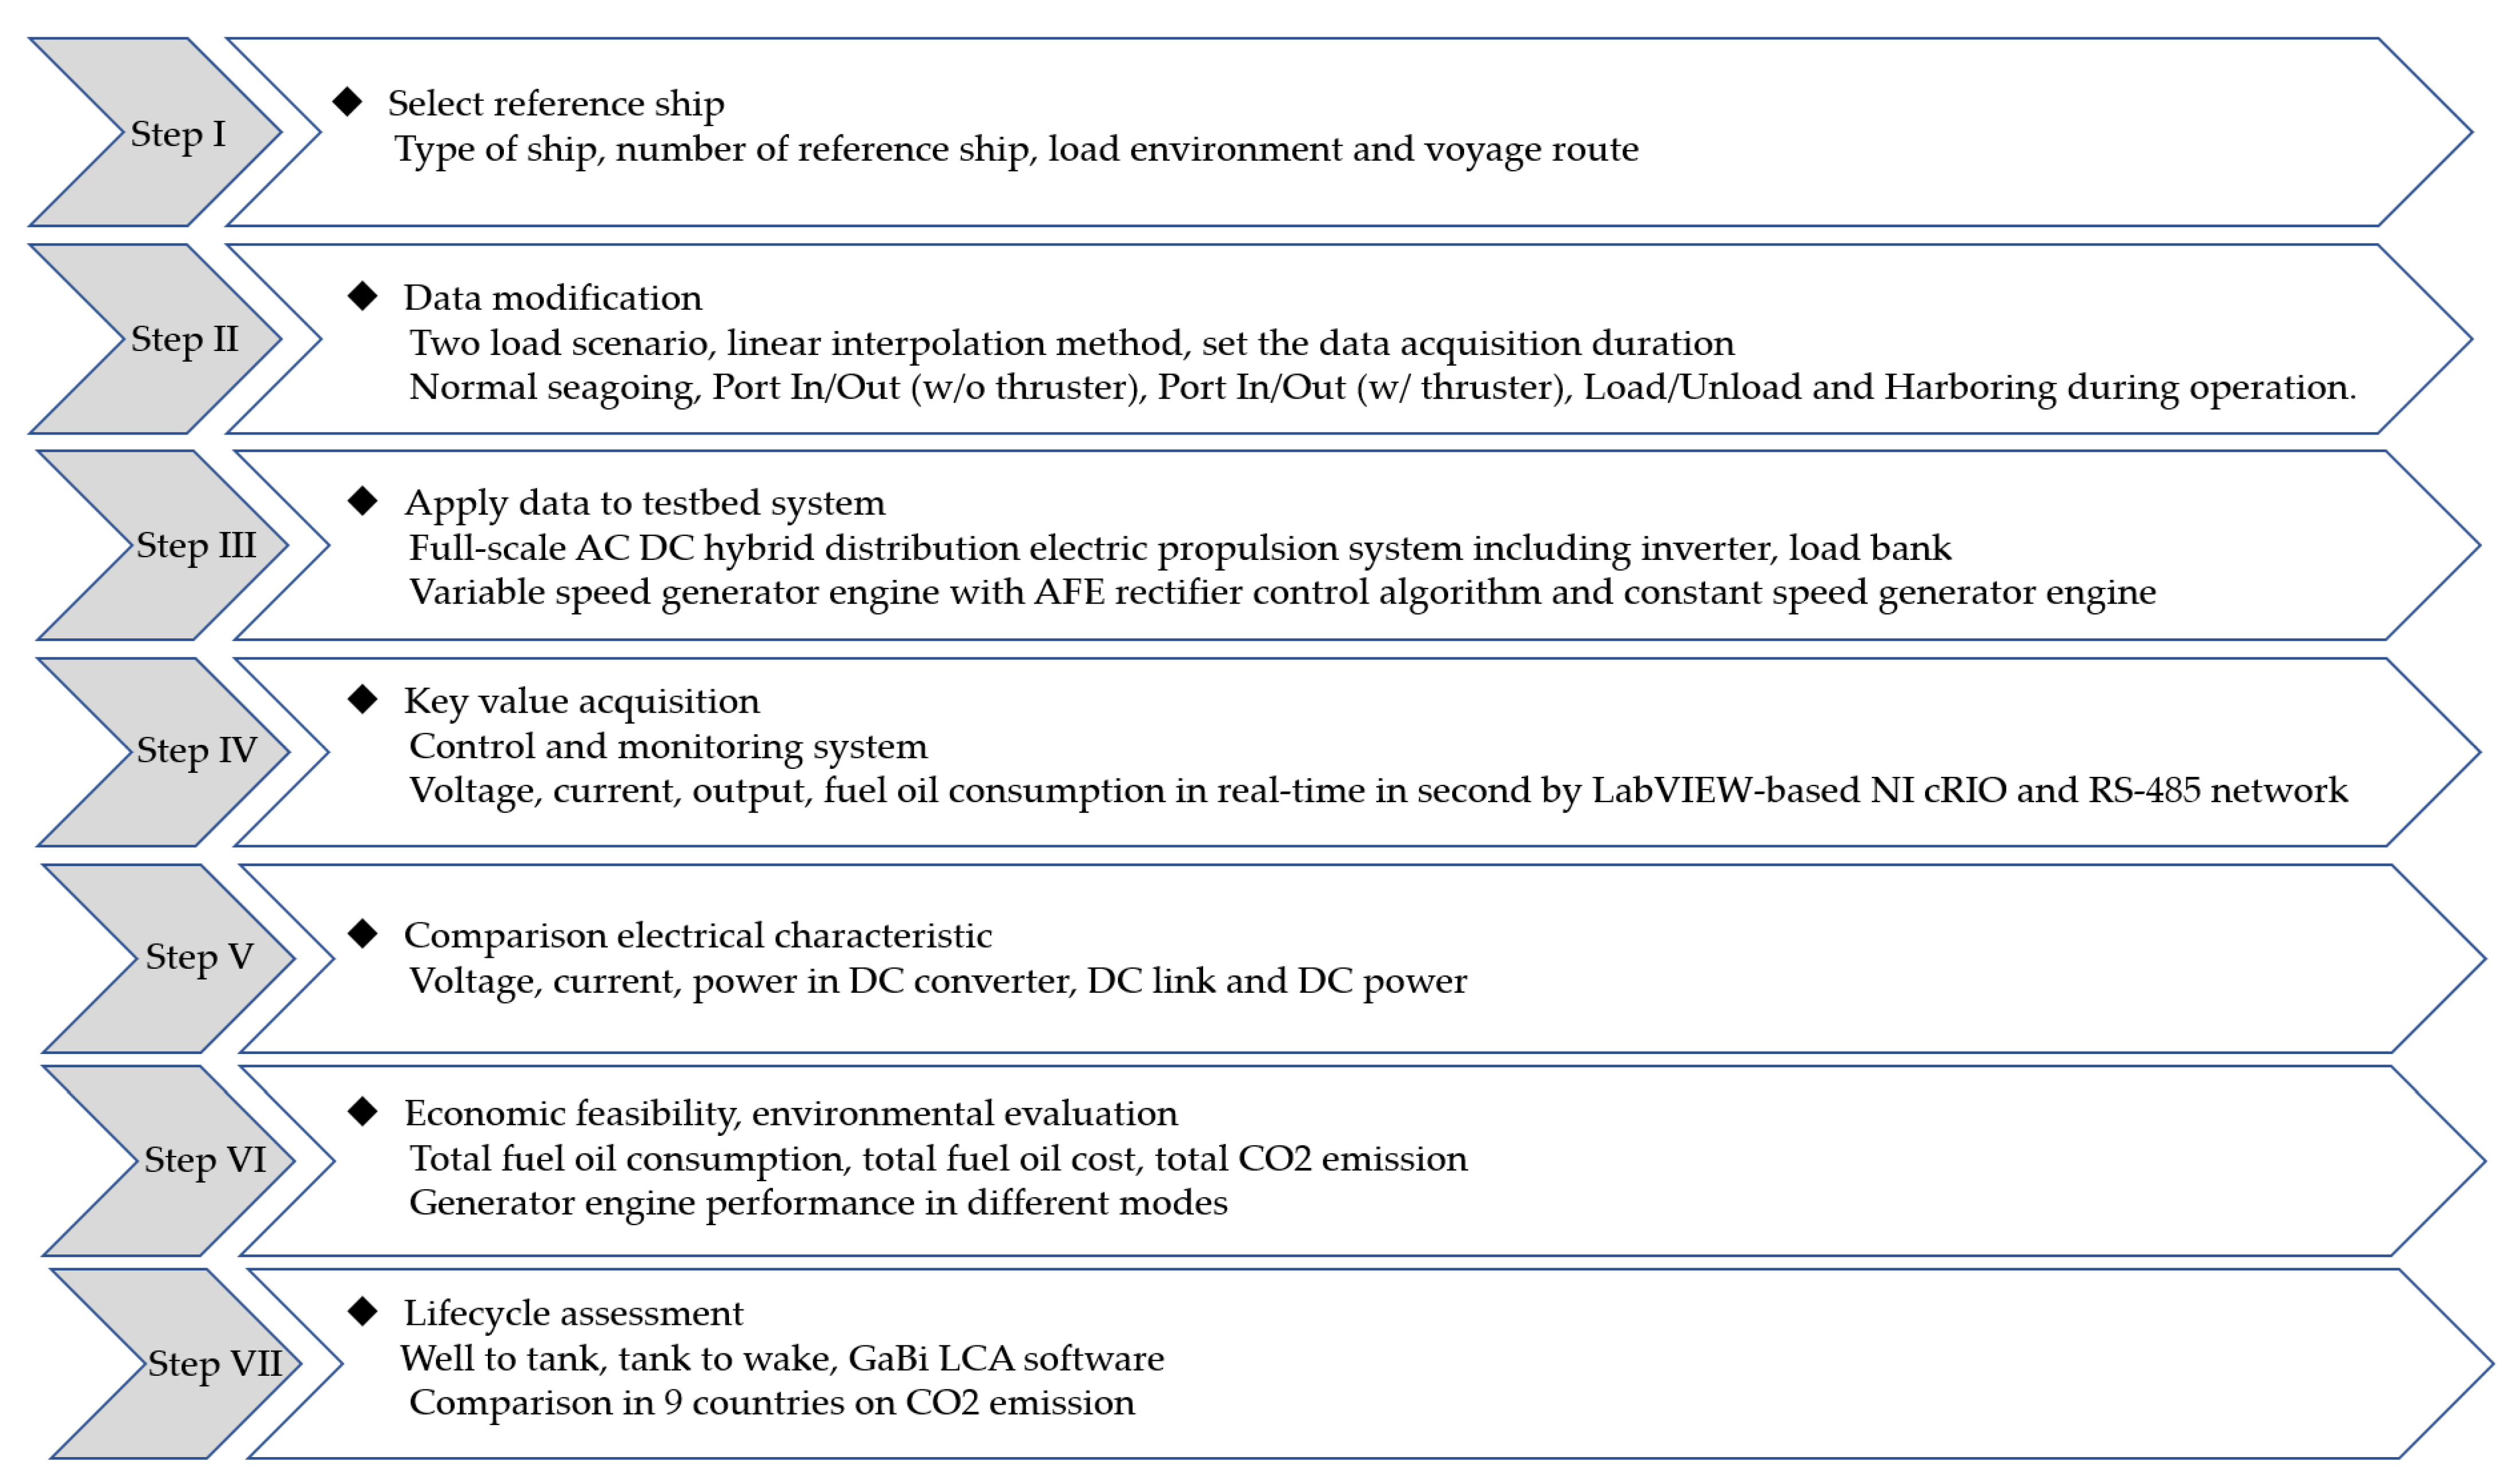
To answer the fundamental question of how much the DC distribution system with AFE rectifier and variable speed engine can improve energy-savings and reduce the environmental impacts of electric ships, its effectiveness is demonstrated in comparison with a conventional system. Figure 3 presents the step-by-step approach through the experiment.
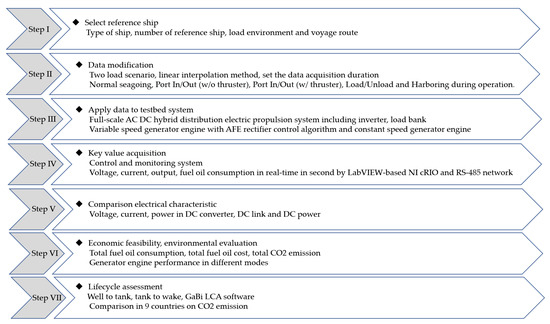
Figure 3.
Empirical research phase.
Therefore, this paper evaluates the overall efficiency of the DC distribution system under the integrated systems. The data captured was analyzed to identify the stability and dynamic characteristics. This process enables the comparison of the performances of two different concepts. Finally, Step 6 is to quantify the energy-saving and environmental impact reduction for the proposed operation mode.
2.1. Step I: Select Reference Ship
To apply the same load environment for comparison between different systems, two case ships, a 5500 TEU reefer container and a 13K TEU container ship currently in operation were selected, and their propulsion load variation data over time was compiled.
2.2. Step II: Data Modification
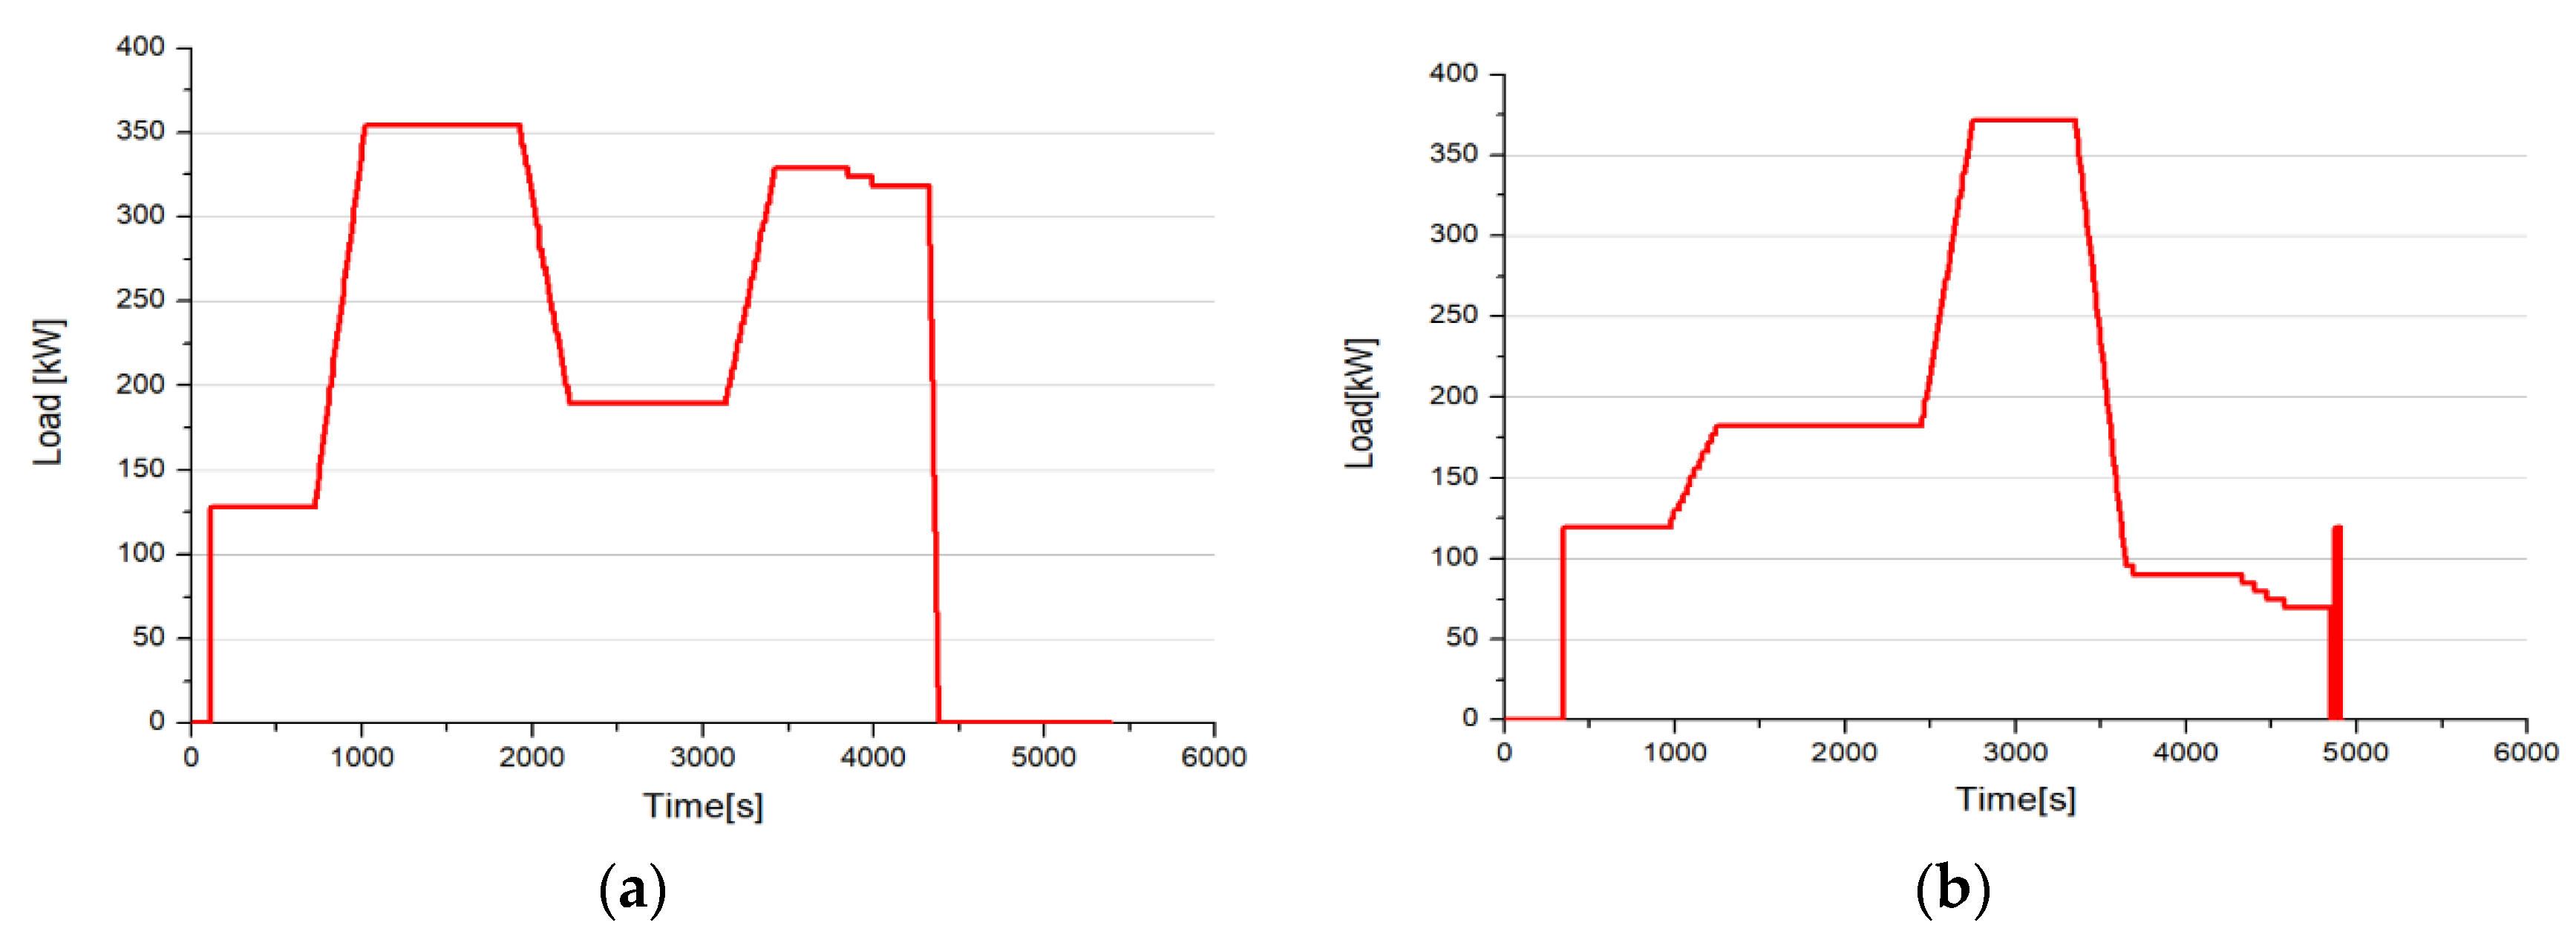
The data from the ships were fed into the experiment as key inputs to implement simulations under the actual shipload profiles in Step 2. Under the test-bed experiment, this step confirms the electrical output characteristics, fuel consumption reduction ratio, and carbon dioxide emission reduction ratio. Two load scenarios were developed and applied for the testbed simulation based on the linear interpolation method generally used in shipyards and related research institutes [48]. Figure 4 shows the load profile scenario used in this experiment. The container ships have operation modes of Normal seagoing, Port in/out (w/o thruster), Port in/out (w/ thruster), Load/Unload, and Harboring during operation. The actual ship’s load value was scaled-up, and the operating trend was converted to the specific time and applied as a load to the test generator.
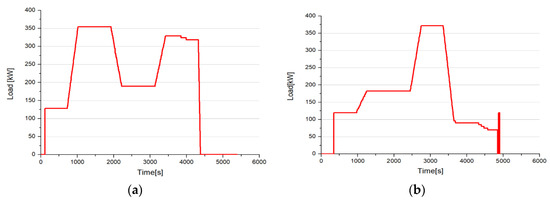
Figure 4.
Load profiles for the reference container ships; (a) 5,500 TEU (b) 13K TEU.
2.3. Step III: Apply Data to the Testbed System
In Step 3, the same load data was applied to the electric propulsion system using the constant speed generator engine with the conventional AC distribution and the variable speed generator engine with the DC distribution system. Both experiments were applied in the testbed with the same capacity.
2.3.1. Test Facility
Before the testbed was built, the electric propulsion system was modeled according to the capacity of the equipment for the testbed using the power analysis program (PSIM). The power characteristics of the power generation source, AFE rectifier, inverter, and propulsion motor were analyzed through the modeled electric propulsion system. The system configuration was verified before the testbed was built in Figure 5.
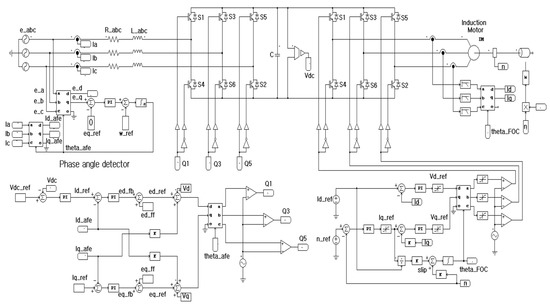
Figure 5.
Modeling of electric propulsion system using the PSIM program.
Figure 6 shows the overall system of the AC-DC hybrid distribution electric propulsion system testbed, which has the following key elements: the power source of the actual electric propulsion ship to the propulsion motor, a load bank, and a control and monitoring system.
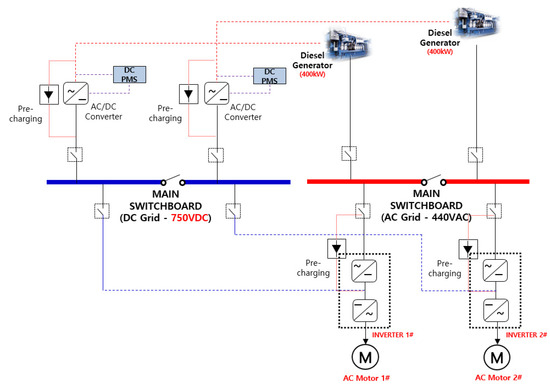
Figure 6.
Configuration of the AC-DC hybrid distribution electric propulsion system for the testbed.
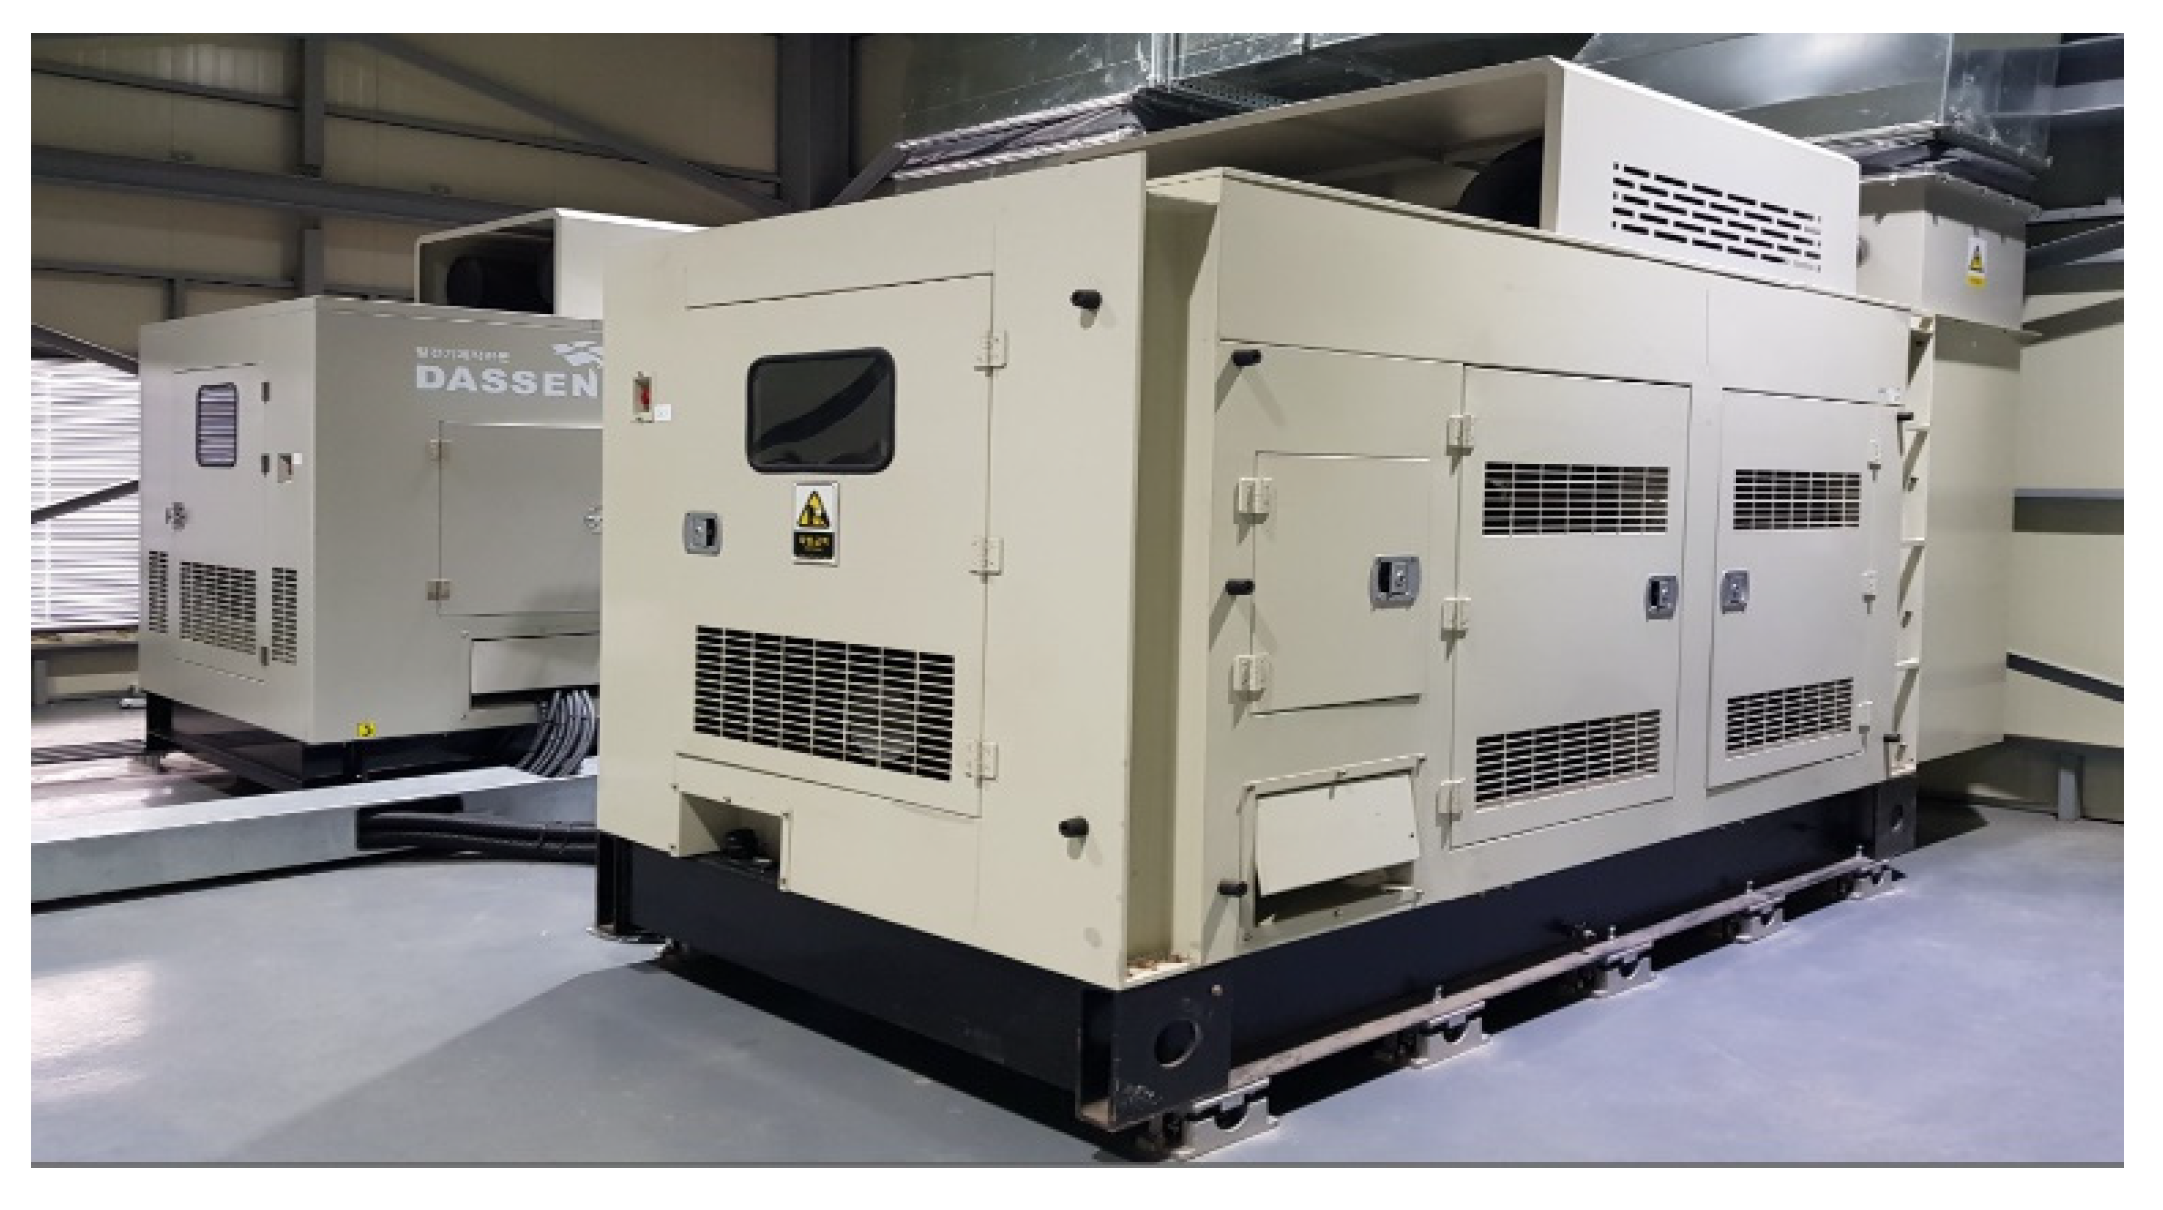
2.3.2. Generator Engine
The generator installed on the testbed is shown in Figure 7 and Table 3. This is a generator that is generally installed in electric propulsion ships, and it is a brushless synchronous generator.

Figure 7.
Test generator engine of the testbed.
Table 3.
Hybrid testbed and generator engine specifications.
To implement the DC power distribution in the electric propulsion system, variable engine speeds ranging between 1100 and 1800 RPM were applied. To adjust the generator’s output voltage according to the speed change of the variable speed engine, as shown in Figure 8, a lookup table that outputs paired output voltages for each speed according to the speed change of the generator was configured in advance. The control unit of the power management device is an automatic voltage adjusting device that outputs a reference voltage requested through a lookup table. It outputs a target resistance value of an external input through a proportional integral controller. The input current of the potentiometer for outputting the target resistance value is calculated through the proportional integral controller of the control unit and then input to the potentiometer. The control system was designed for the output voltage.
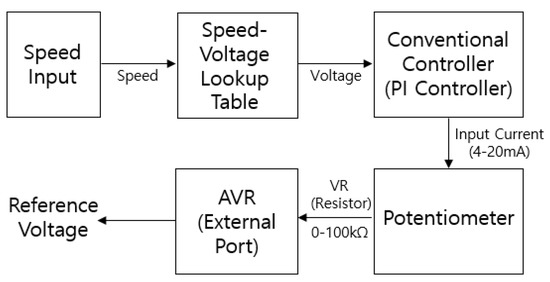
Figure 8.
Schematic diagram of the automatic voltage regulator in the testbed.
2.3.3. Distribution System
The DC switchgear is configured to receive AC power produced by generators, to convert AC to DC through a rectifier installed inside, and to supply the converted DC to the motor drive unit. The installed rectifier is an AFE (Active Front End) rectifier using an IGBT device so that it can control on/off by applying an IGBT element as shown in Figure 9.
Figure 9.
AC-DC hybrid distribution system of the testbed.
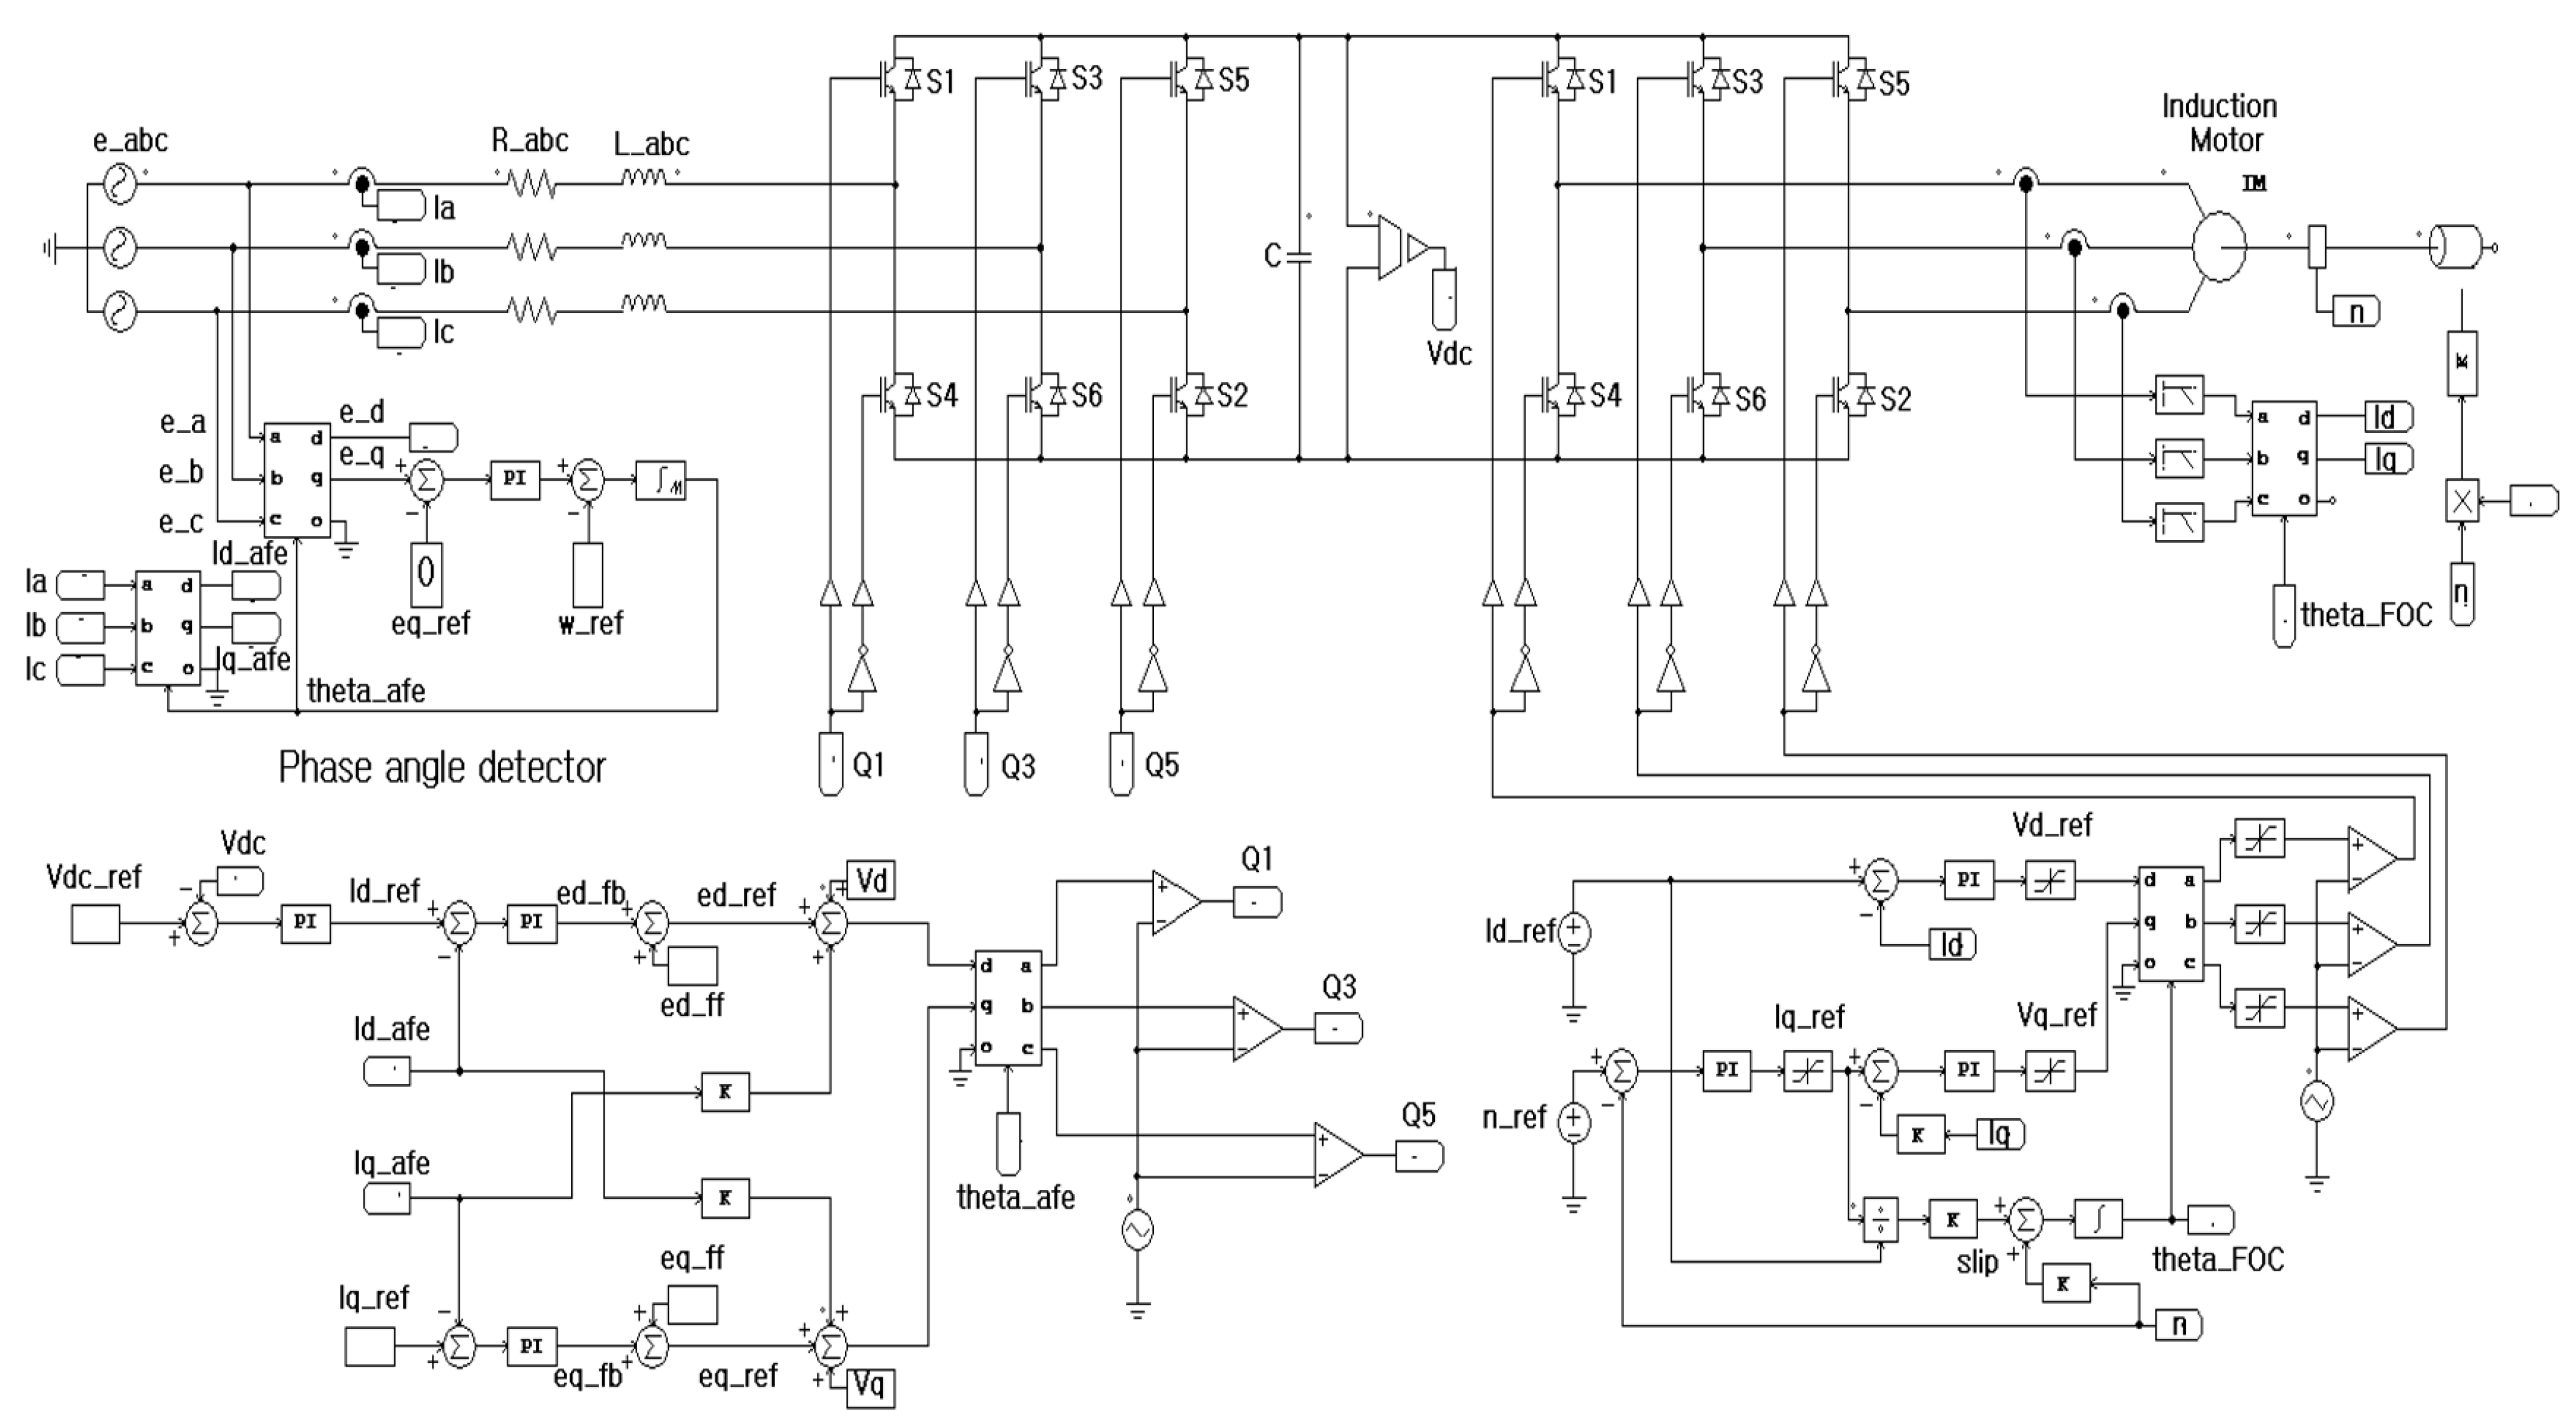
2.3.4. Control Algorithm of AFE Rectifier
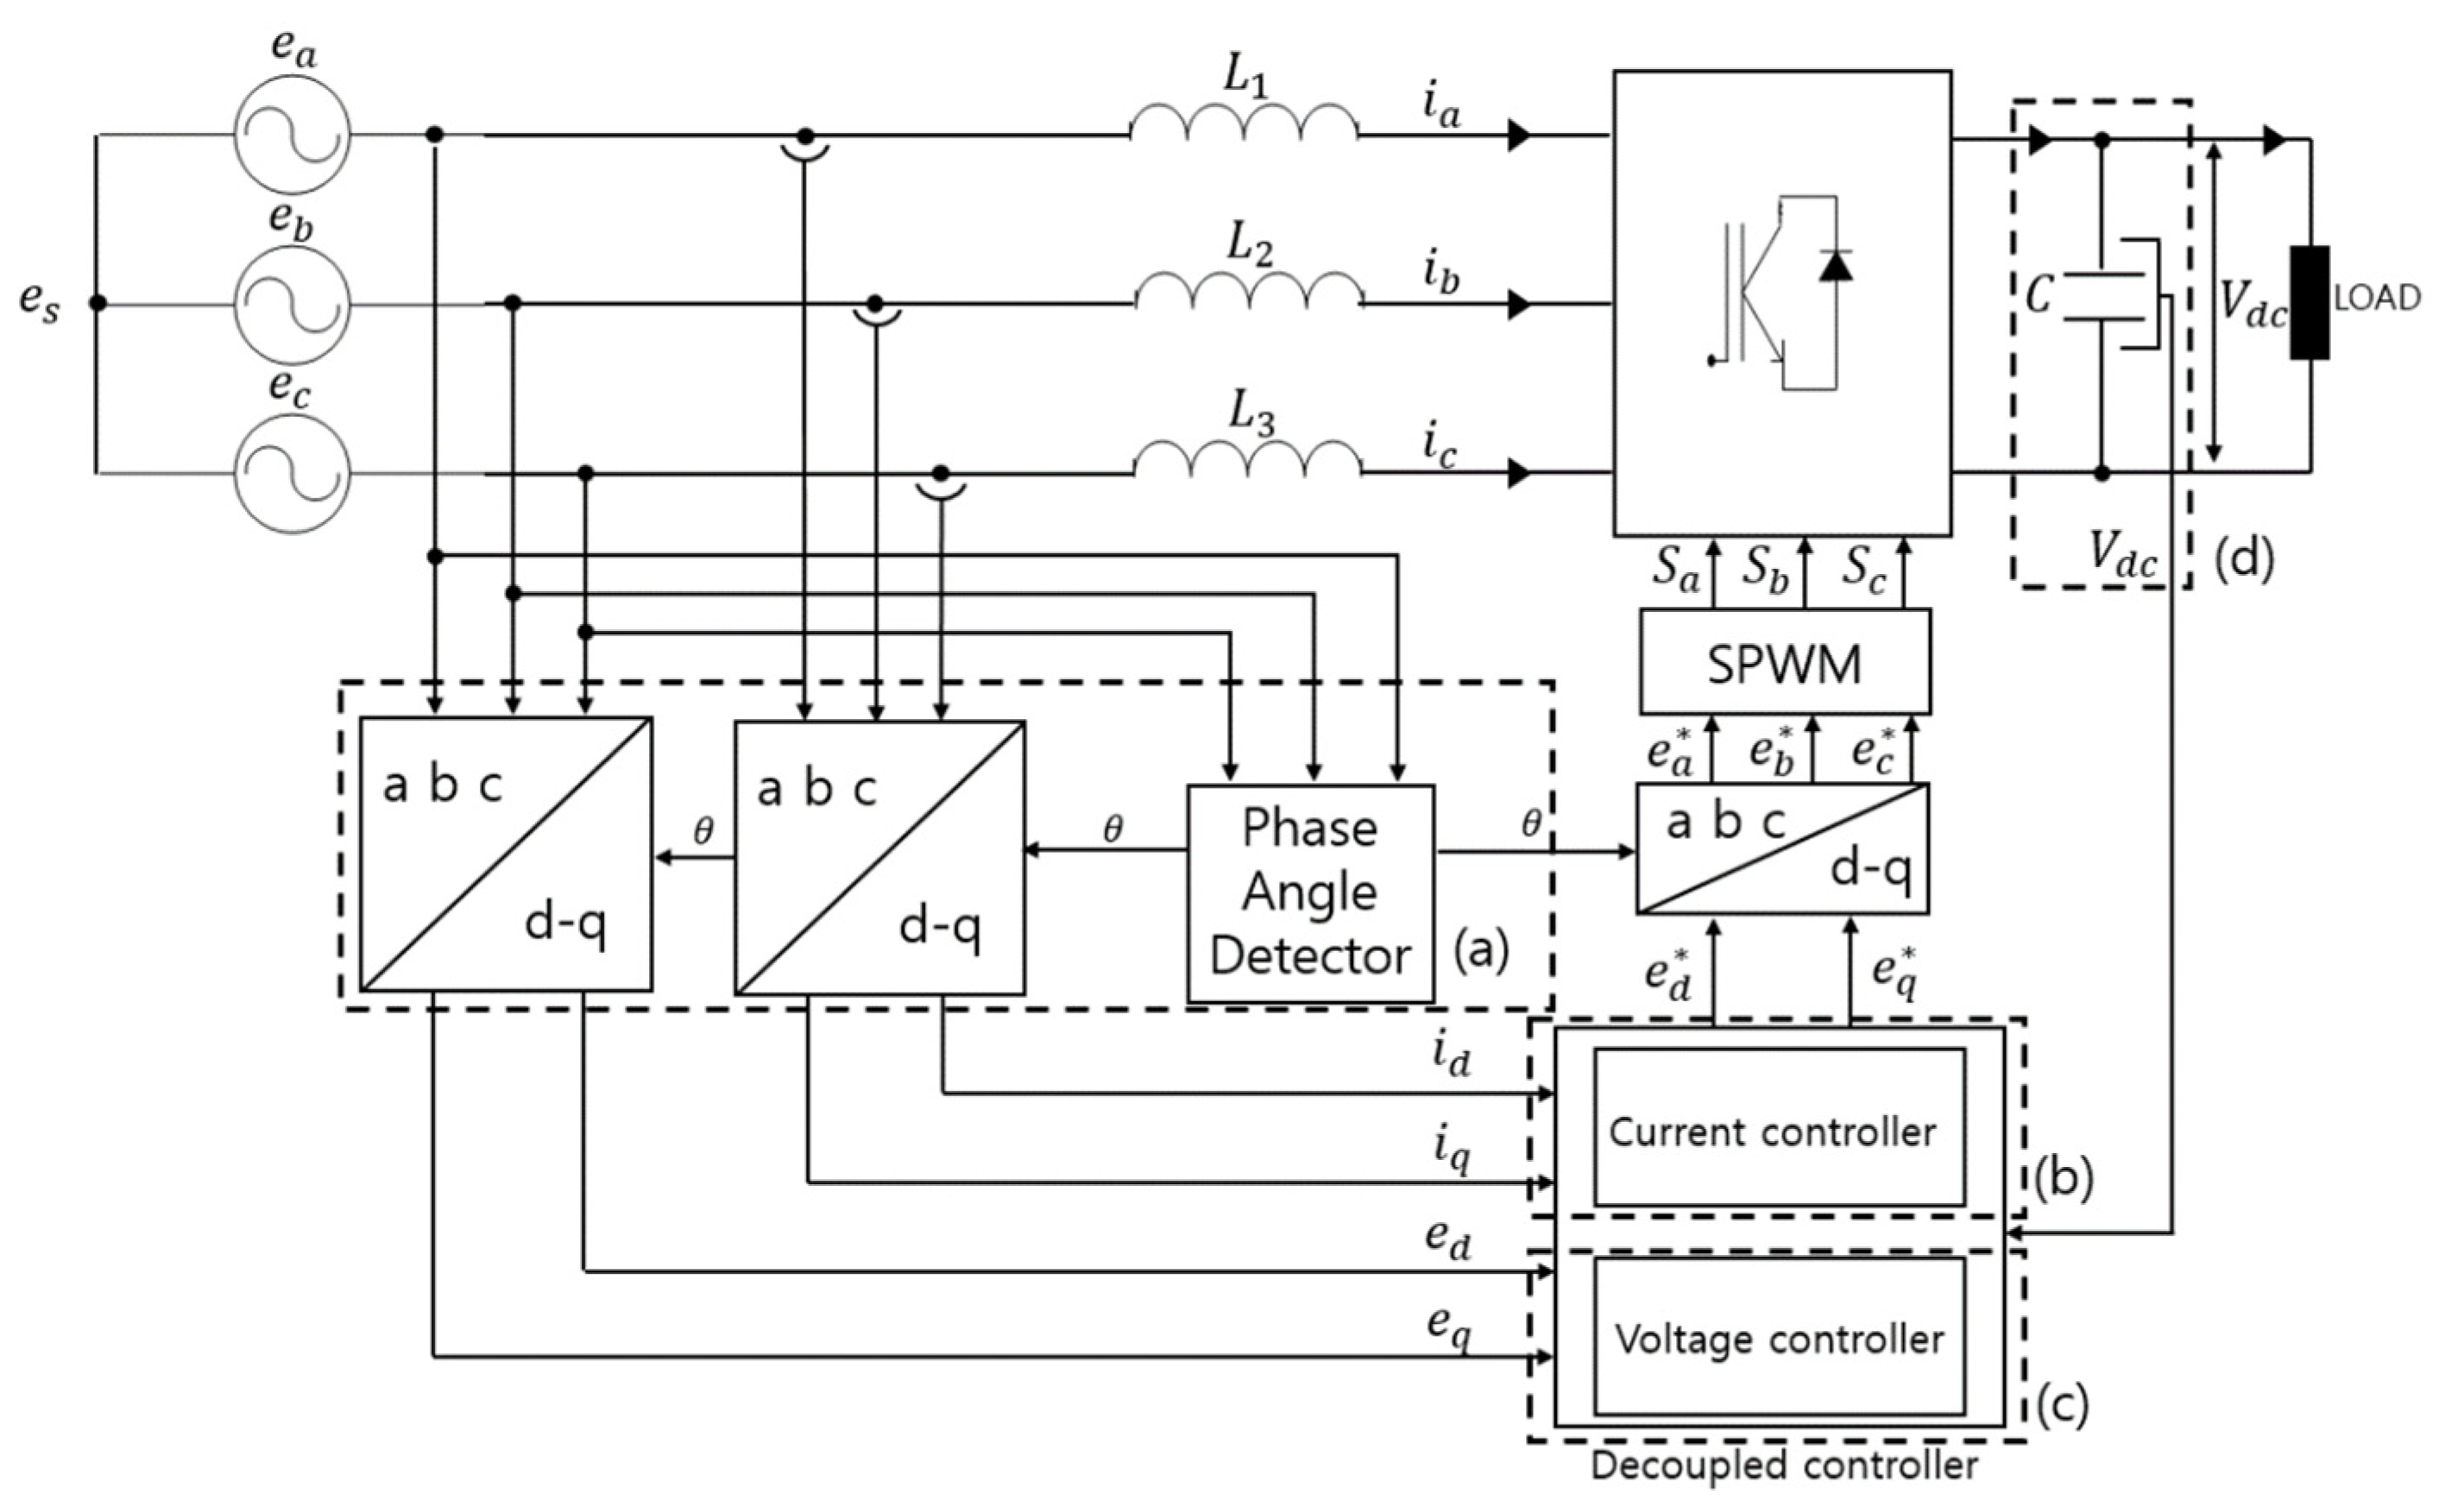
Figure 10 shows the configuration of AFE rectifier, which has three stages (pole) and six semiconductor switches. It receives the three-phase AC power output from the generator and outputs 750VDC through control.
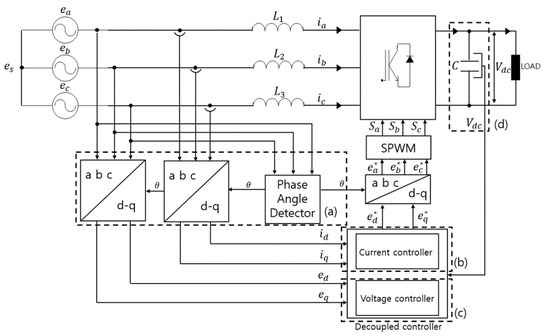
Figure 10.
Configuration of the AFE rectifier system in the testbed.
The control system of the AFE rectifier consists of a voltage controller and a current controller. In the voltage controller, if the input power supplied from the power source is greater than the output power consumed by the load, the DC output voltage of the DC link terminal increases, and vice versa.
As the DC output voltage decreases, it controls the DC Link stage’s by controlling the input power. In addition, the current controller using the value output from the voltage controller uses the three-phase input current output from the generator for control using the DC value obtained by converting the synchronous rotation coordinate system axis. Since the DC controller designed with the value of the synchronous rotation coordinate system controls the DC current and DC output voltage, its performance can be excellent using the proportional integral controller.
The voltage equation of the AFE rectifier is as follows.
Here, , , and are power supply voltages; , , and are phase currents; and , , and are rectifier input voltages.
To convert the three-phase AC value, which changes in real-time with time, into two DC values that are convenient to control, the converted value of the synchronous rotational coordinate system is used to manage the AFE rectifier.
Here, and are the power voltage converted to the axis of the synchronous rotation coordinate system; and are the current converted to the axis of the synchronous rotation coordinate system; is the arbitrary angular velocity; and and are the rectifier input voltage converted to the axis of the synchronous rotation coordinate system.
Figure 10a shows the power supply voltage phase angle controller, (b) presents the current controller, and (c) is the voltage controller. The voltage controller (c) compares the DC output waveform of the DC-link with the command voltage value and outputs the error as the d-axis current through the proportional integral controller to control the DC output voltage.
is the current command value converted to the axis of the synchronous rotation coordinate system, is the DC voltage target value, is the DC link actual measured voltage, is the PI controller proportional gain, and is the PI controller integral gain.
2.3.5. Inverter Drive and Propulsion Motor
The inverter drive unit outputs an AC with variable frequency and voltage using an IGBT element that can control on/off of the power supplied from the power-distribution system and converts the output voltage waveform by pulse width modulation (PWM). This drive generates a sine wave. The FOC (Field Oriented Control) method was applied to the inverter drive unit used for the simulation, and a system was configured to control the rotational speed of the propulsion motor as a load using the voltage and frequency converted by the FOC control method as shown in Figure 11.
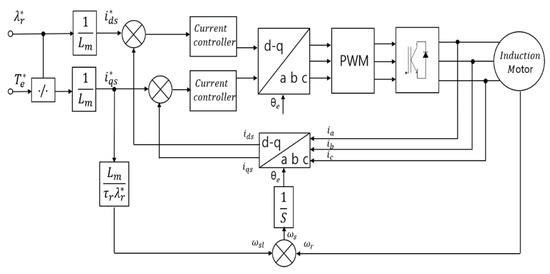
Figure 11.
Schematic diagram of the FOC control method for a propulsion motor in the testbed.
The indirect vector control method based on the rotor flux was applied among the vector control method. For high-performance torque and magnetic flux control, the stator current supplied to the motor is divided into orthogonal to the reference magnetic flux and controlled. The stator current is designed to be controlled separately into the magnetic flux component current and torque component current . Since the rotor flux-based indirect vector control controls the rotor flux to exist only in the -axis component, the following equation holds.
is the synchronous rotation coordinate system -axis magnetic flux, and is the differential operator.
The torque equation is as follows.
is the motor torque equation, is the number of motor poles, is the mutual inductance, is the self inductance, is the synchronous rotation coordinate system d-axis magnetic flux, and is the stator current converted to the q-axis of the synchronous rotation coordinate system.
When is constant, the slip relation can be expressed as follows.
is the synchronous rotation coordinate system slip angular velocity, is the stator current converted to the d-axis of the synchronous rotation coordinate system, is the stator current converted to the d-axis of the synchronous rotation coordinate system, is the rotor resistance, and is the self-inductance.
Since the rotor flux position is the integral value of the sum of the motor speed and the slip command angular speed, the following equation is obtained.
is the angular velocity of the synchronous rotation coordinate system, and is the angular velocity of the motor rotor.
The propulsion motor is an induction motor widely applied to electric propulsion ships was selected, and the motor’s capacity is 400 kW. Figure 12 presents the drive unit and the propulsion motor.
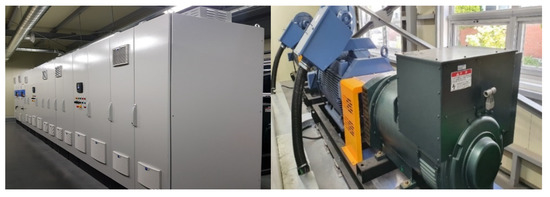
Figure 12.
Drive unit with the propulsion system in testbed.
2.3.6. Load Bank
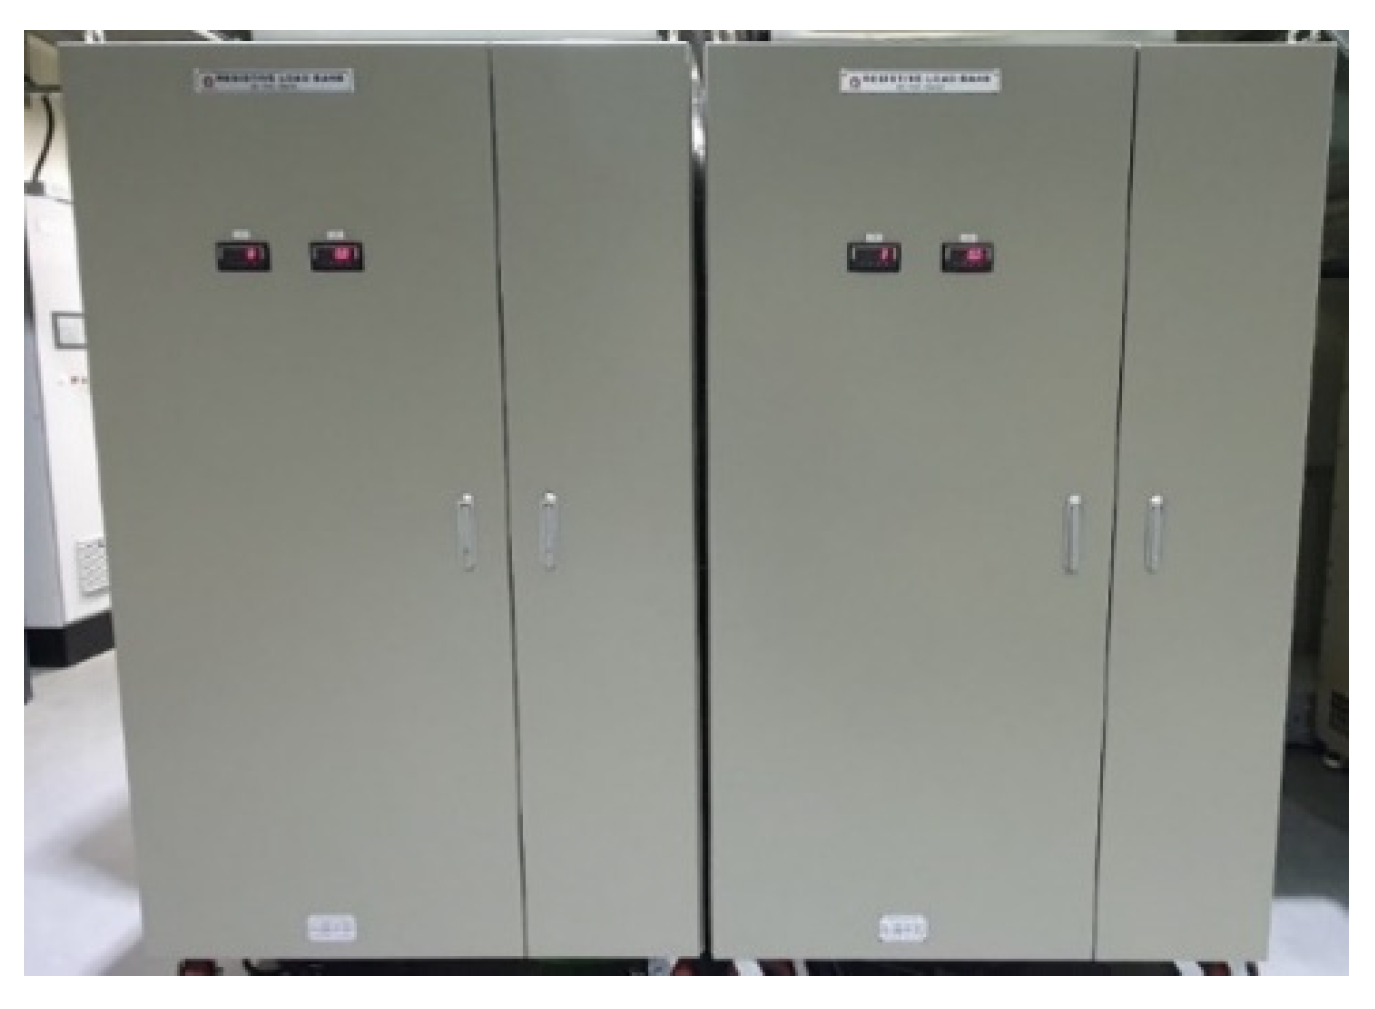
A load bank is a system designed to consume the power generated by the generator built in the testbed as an electric load. The load bank used is shown in Figure 13 and Table 4, and can generate loads up to 1100 kW at 440 V and 60 Hz.
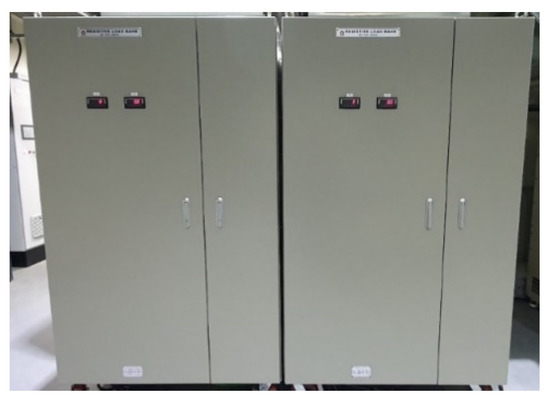
Figure 13.
Load bank system in the testbed.
Table 4.
Load bank specifications of the testbed.
The resistance part of the load bank was constructed using a helical-type element. The state of the load bank can be monitored and controlled by the controller system installed inside the load bank.
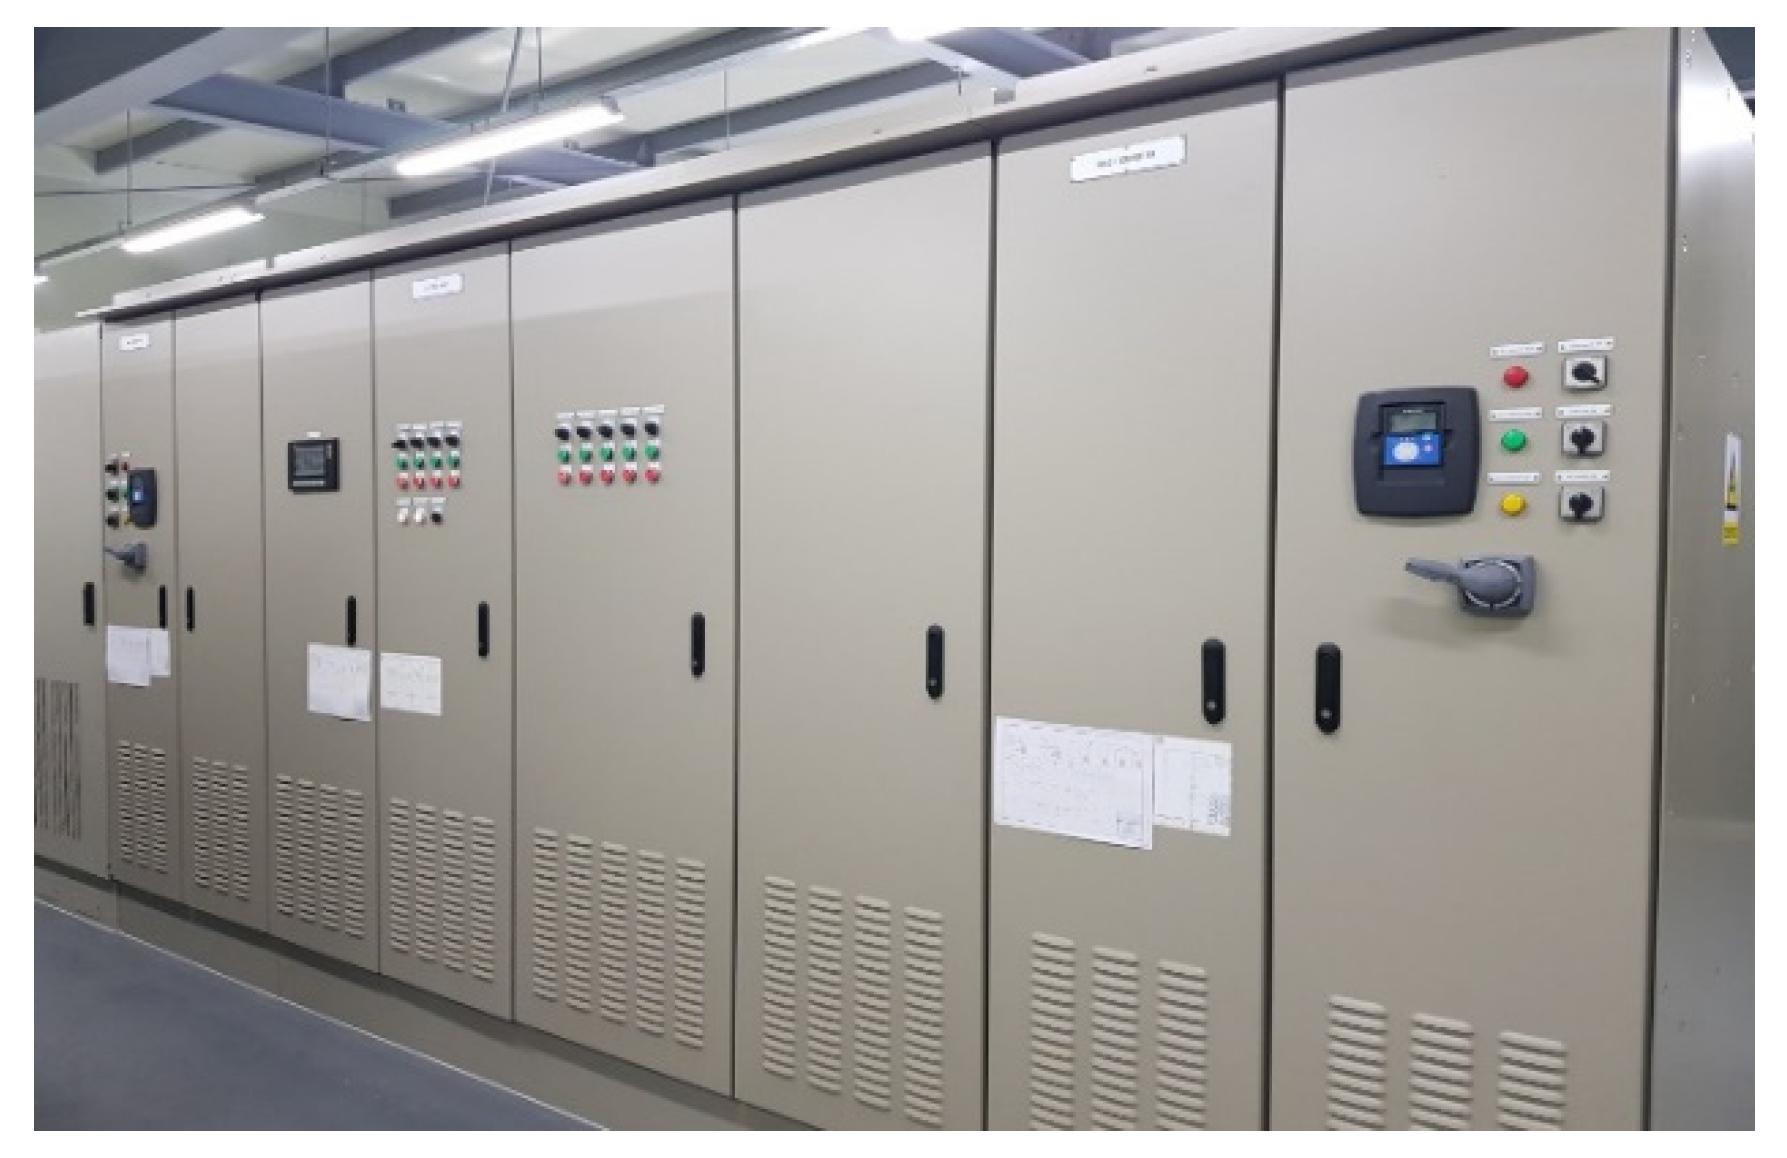
2.4. Step IV: Key Key-Value Acquisition
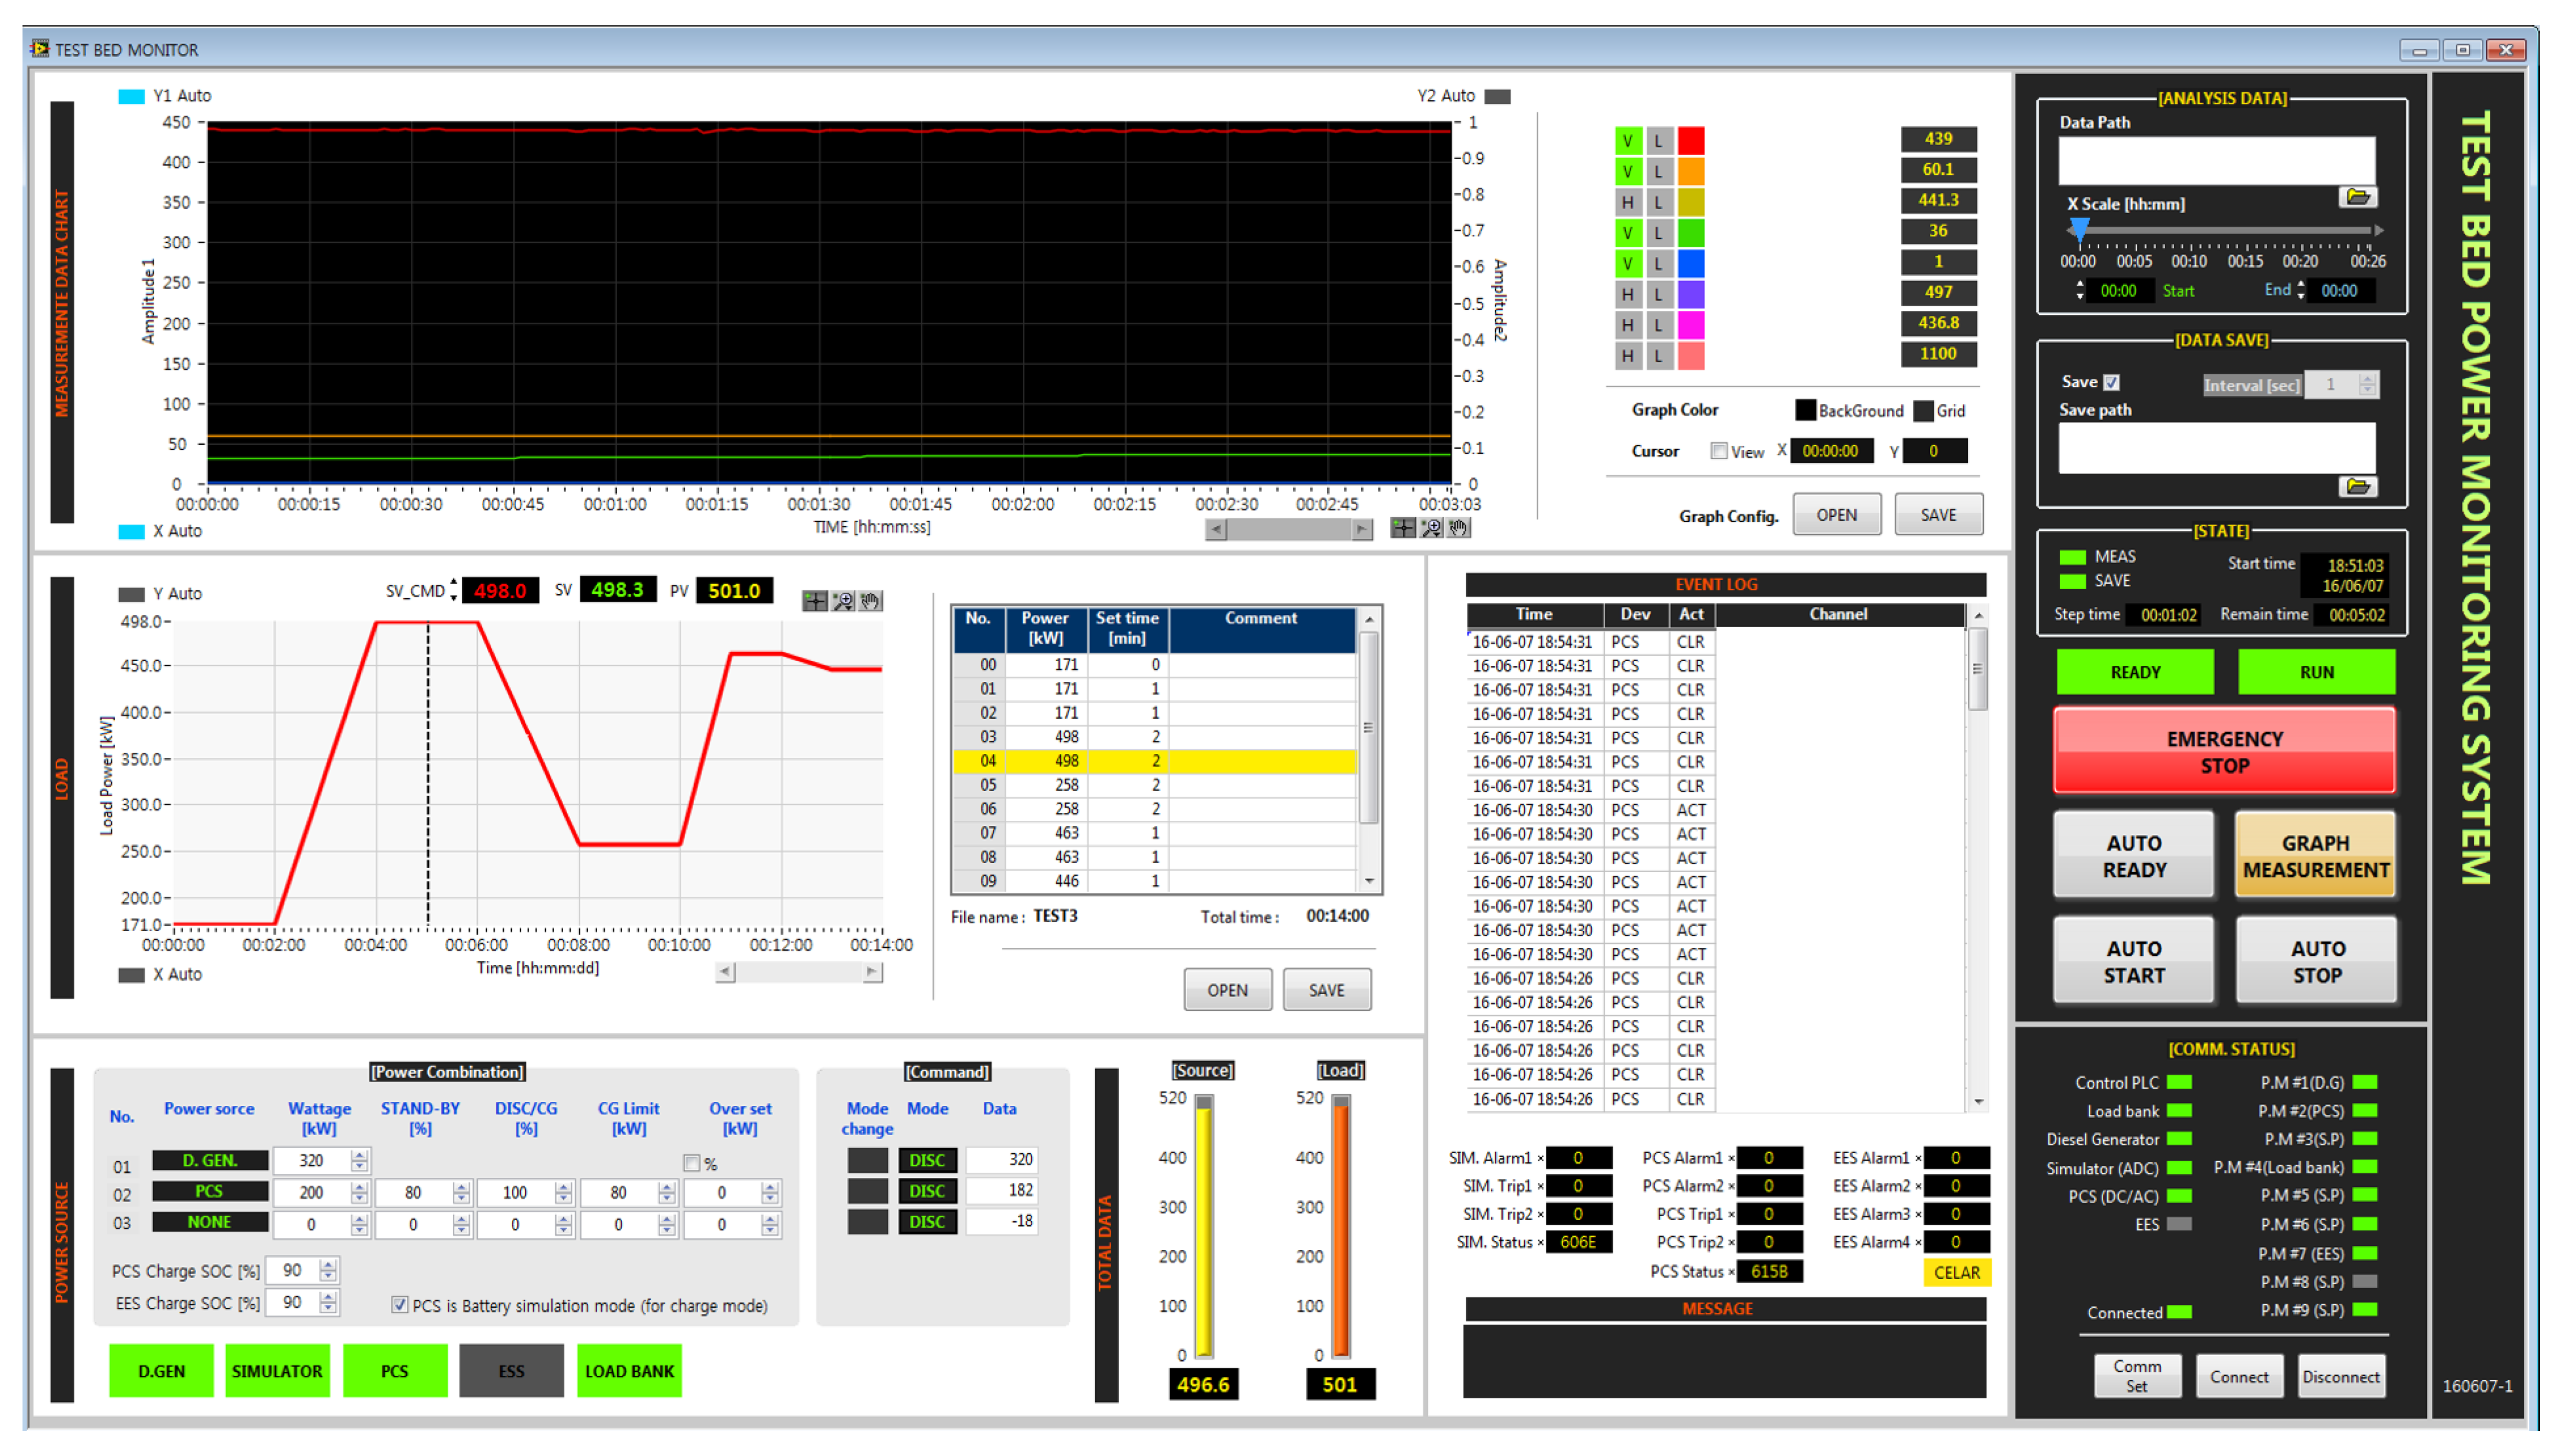
Figure 14 shows the control and monitoring system. The power data of the equipment built in the testbed is monitored.
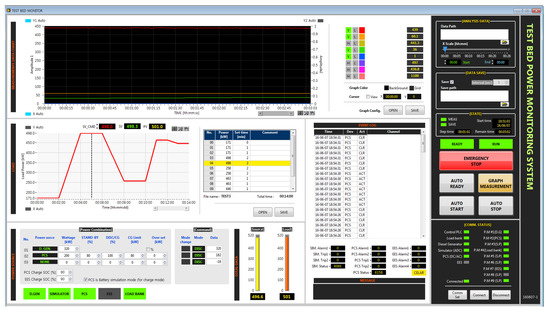
Figure 14.
The monitoring system in the testbed.
The voltage, current, output amount, and system status of each item of equipment are monitored in real-time so that the system can be operated stably. The control and monitoring system are configured so that it is possible to configure the I/O list for the data required for each device and to check the information on the current data using the LabVIEW-based ‘NI cRIO’.
In addition, the system was constructed so that the generator’s output could be varied by creating a load pattern to be applied during the load test and adjusting the load in real-time by increasing or decreasing the resistance of the load bank according to the load pattern. The testbed was configured to send and receive the device status and operation commands through the interface between each device’s control and monitoring system. Communication is based on RS-485 and ethernet communication considering external environmental factors, such as noise and peripheral devices. In addition, it was designed to monitor the testbed system in operation where the internet is available using an external internet network.
2.5. Step V: Comparative Analysis of the Electrical Characteristic for the AC-DC Distribution System
To verify the operation characteristics of the proposed DC distribution electric propulsion system, various data for electric characteristics of the system were monitored and stored in real-time every second as shown in Table 5.
Table 5.
Data acquisition list.
2.6. Step VI: Economic Feasibility and Environmental Evaluation
To compare and verify the economic feasibility and environmental characteristics of the DC distribution system in an electric propulsion ship, we conducted comparative analysis and evaluation. It is possible to calculate the fuel consumption per kW output, carbon dioxide emissions per 1 kW output, and cost per kW. This can verify the total fuel consumption with the total fuel cost and the estimated total carbon dioxide emissions.
2.6.1. Method to Calculate Total Fuel Consumption
This research measured the fuel oil consumption through a flowmeter having a correction factor according to temperature. The data received in kg/s per second is converted into g/s, and the integrated value is calculated as the total fuel oil consumption.
is the time [sec], and is the fuel oil consumption calculation result by flow meter measurement at considering the temperature factor.
2.6.2. Method to Calculate OPEX
For the relative fuel cost comparison, the MGO price of 689 USD/mt Hong Kong was used as the standard as of 20 November 2021. [Source: https://shipandbunker.com (20 November 2021)]
2.6.3. Method to Calculate CO2 Emission
The total carbon dioxide emissions can be calculated using the following formula based on the fuel oil consumption.
where the value represents the carbon dioxide emission coefficient according to the fuel consumption according to the type of oil as shown in Table 6. The Diesel/Gas Oil used in this experiment is ISO 8217 Grades and has a value of 3.206, which was applied to the conversion of carbon dioxide emissions.
Table 6.
CO2 emission factor according to the fuel.
2.7. Step VII: Lifecycle Assessment
Life cycle assessment (LCA) is a methodology for evaluating the environmental impacts associated with all phases of the life cycle of a commercial product, process, or service. For marine fuels, for example, the environmental impact is assessed, from the extraction of the primary energy sources, refinery, and supply to onboard usage. Recently LCA has been drawing more attention to the marine industry to examine the holistic environmental benefits/harms of conventional marine fuels and alternative ones.
To quantify the environmental benefits obtainable from the DC distribution system, this paper also adopted the LCA method in aid of GaBi LCA, the most common commercial LCA software (Sphera, Chicago, IL, USA) [49].
The International Maritime Organization also recognized the limitations of the existing environmental assessment methods for ships. LCA guidelines applicable to marine vessels are presently under development and are highly expected to become a new standard for maritime environmental impact assessment. This paper was motivated by the current maritime trend so that it applies LCA for the proposed cases.
3. Results
This section presents the results of the comparative analysis between the DC distribution system with a variable speed power generation system and the conventional AC distribution system with a constant speed power generation system.
3.1. Electric Characteristic Comparative Analysis in Voltage, Current, Power
3.1.1. Container 5500 TEU Case Ship
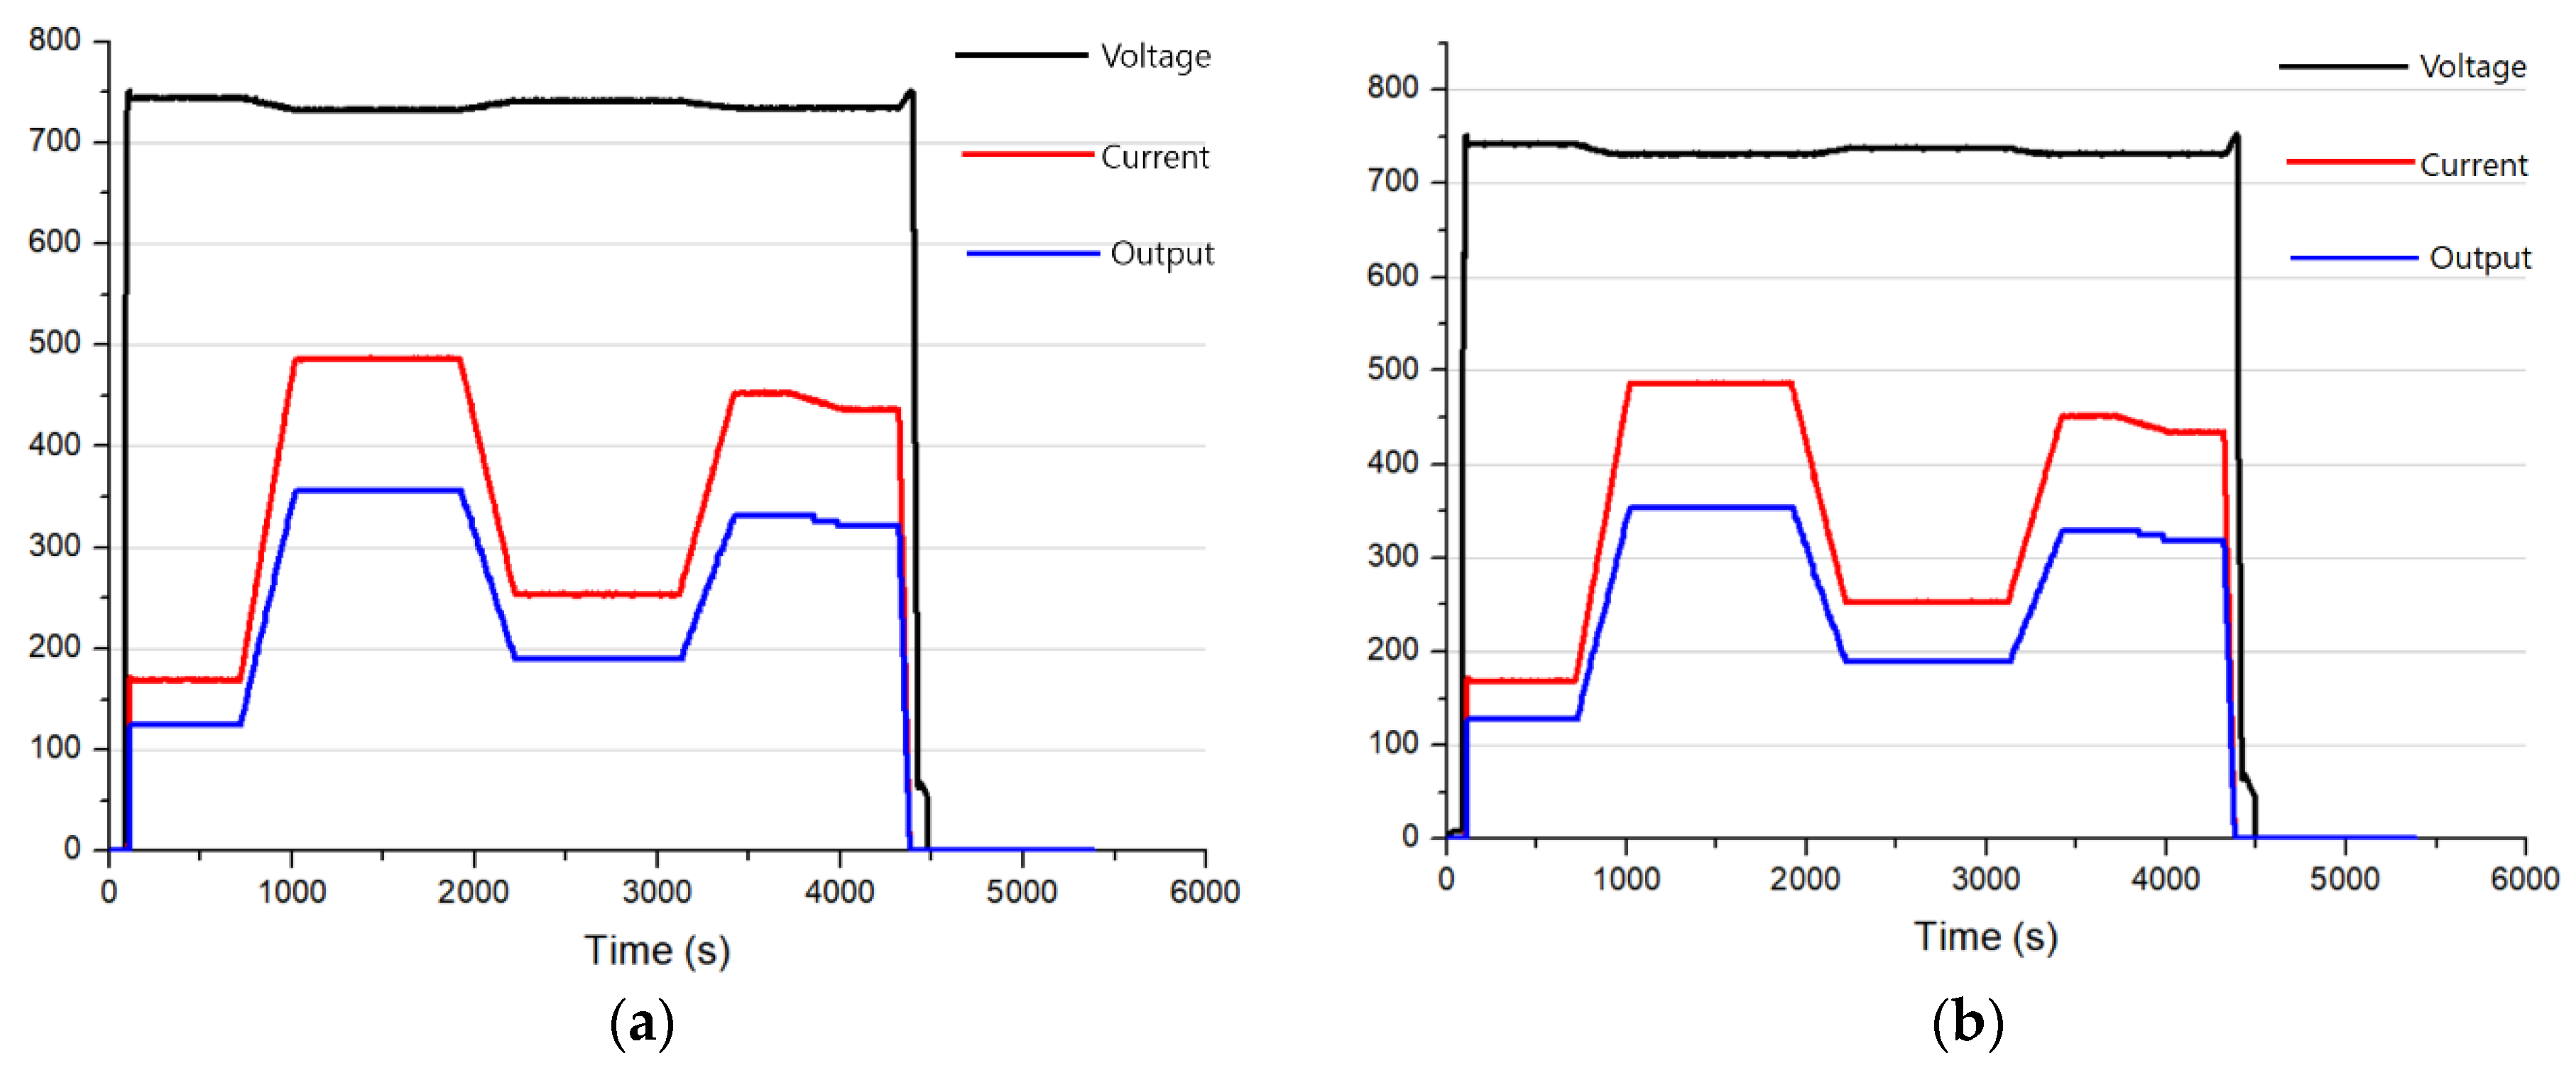
Figure 15 shows the power characteristics according to the 5500 TEU load profile scenario.
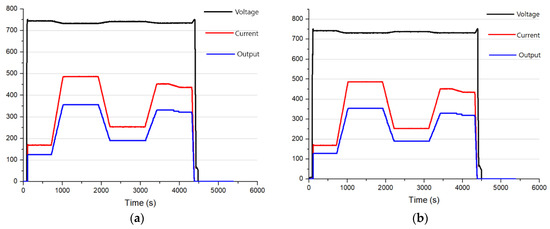
Figure 15.
Electric characteristic in voltage, current, and power for the 5500 TEU scenario; (a) AC grid system (Constant speed mode), (b) DC grid system (Variable speed mode).
Both systems use constant DC voltage and display 730~751 V, indicating stable operation in voltage control. It can be confirmed that there is no difference in propulsion performance with the same power characteristics as the changes in current and power according to a given load variation.
In addition, even in the section where the load changes, the current is stably controlled without a large ripple and shows a desirable output even in the section of the sudden rise and fall.
3.1.2. Container 13K TEU Case Ship
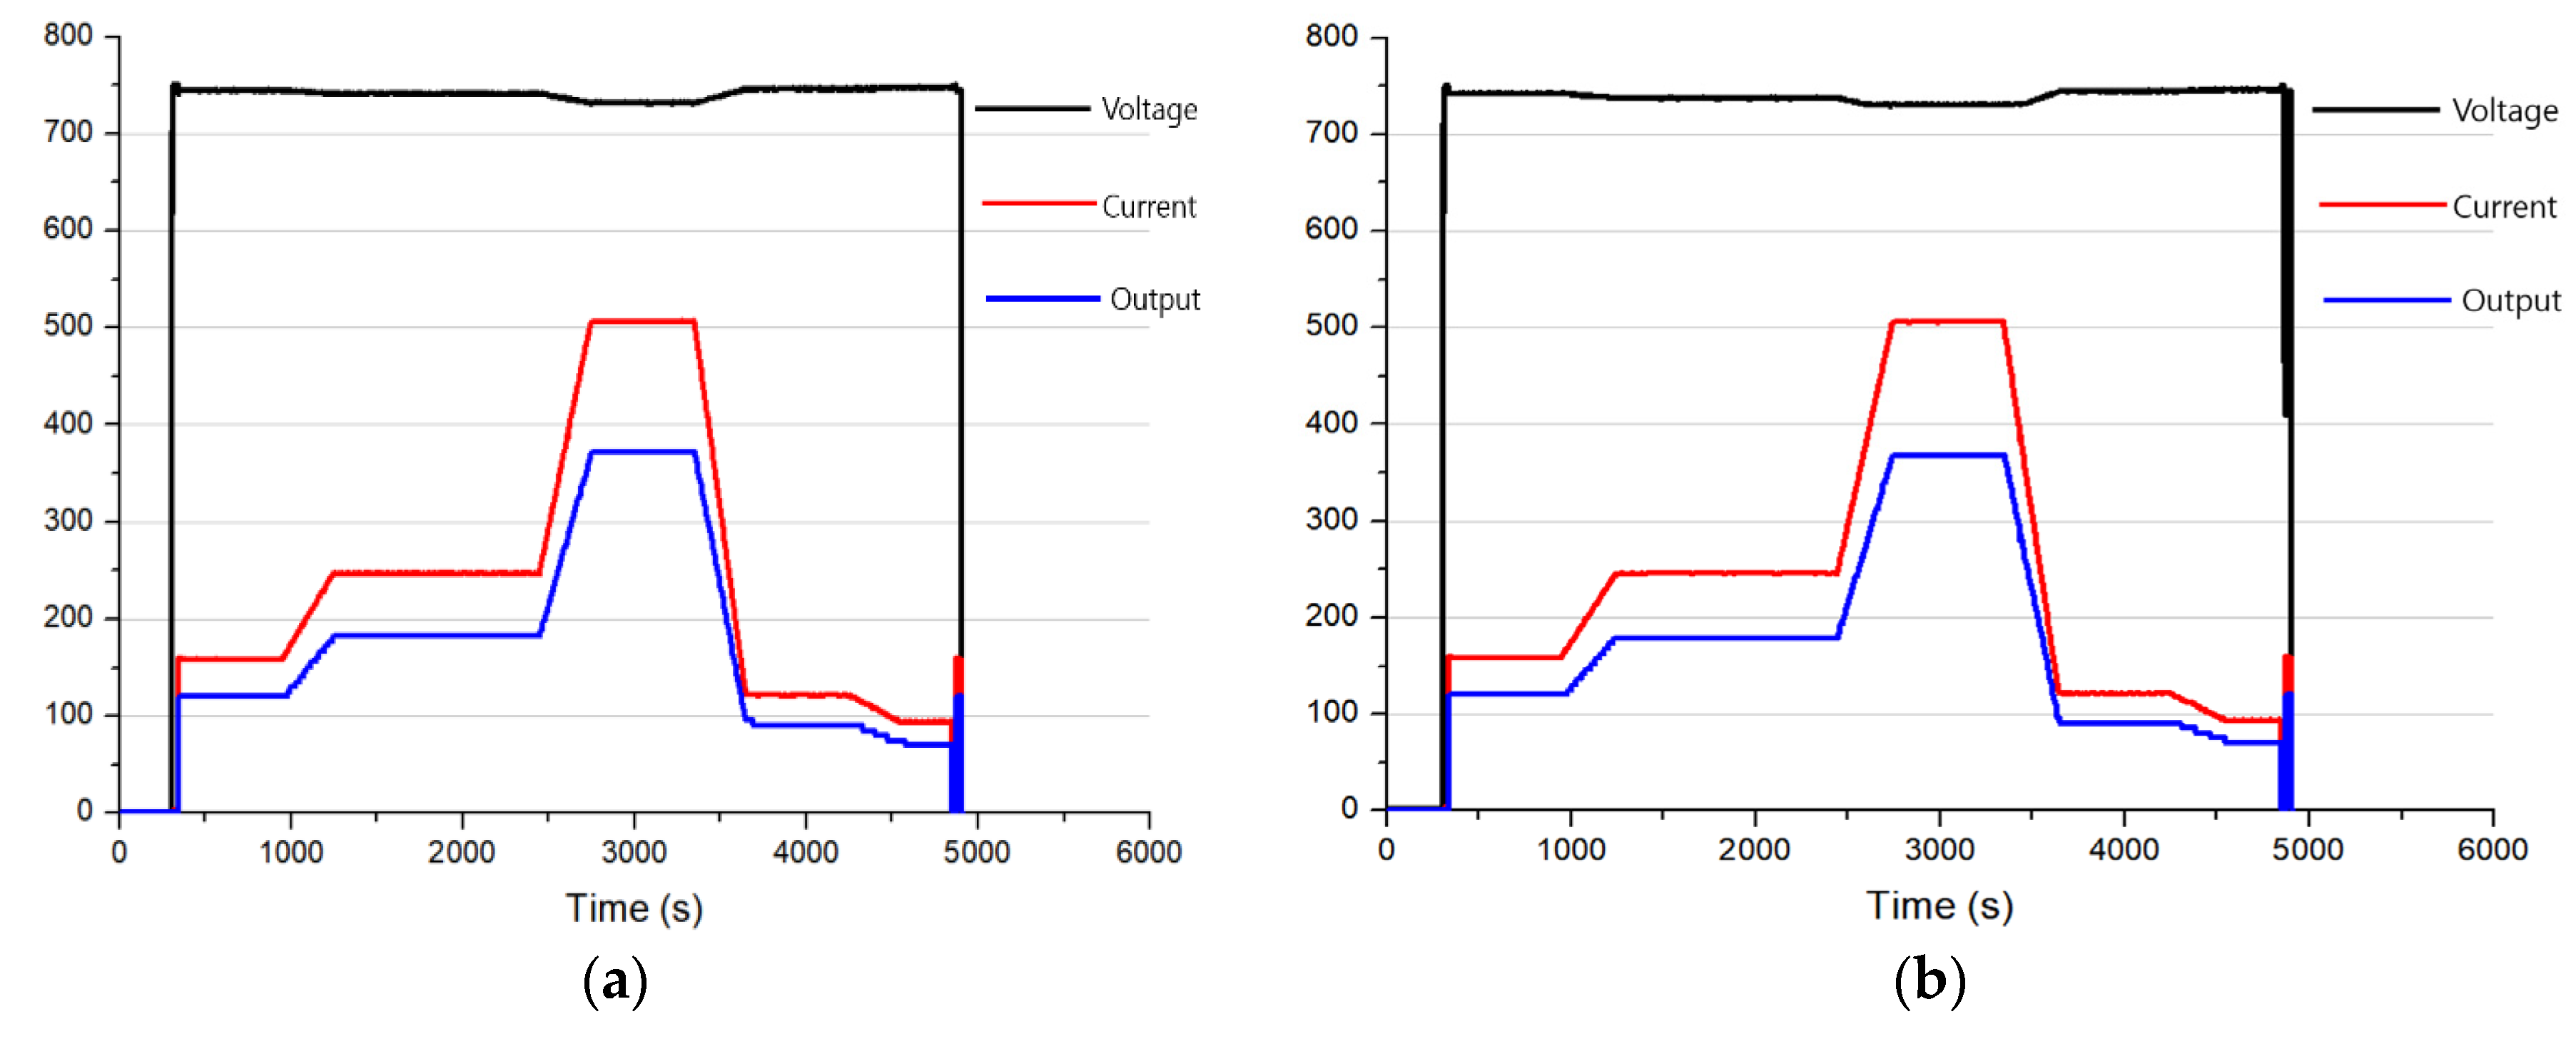
The second scenario was applied to compare the electric dynamic characteristics of two different modes in the AC-DC hybrid distribution electric propulsion system. Figure 16 shows the same power characteristics according to the given 13K TEU load profile scenario.
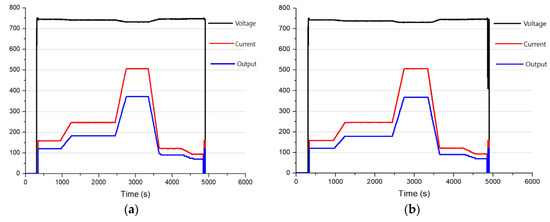
Figure 16.
Electric characteristic in voltage, current, and power for the 13K TEU scenario; (a) AC grid system (Constant speed mode), (b) DC grid system (Variable speed mode).
3.2. Characteristics of Fuel Consumption and Carbon Dioxide Emission according to the Operation Mode
3.2.1. AC Distribution System (Constant Speed Mode)
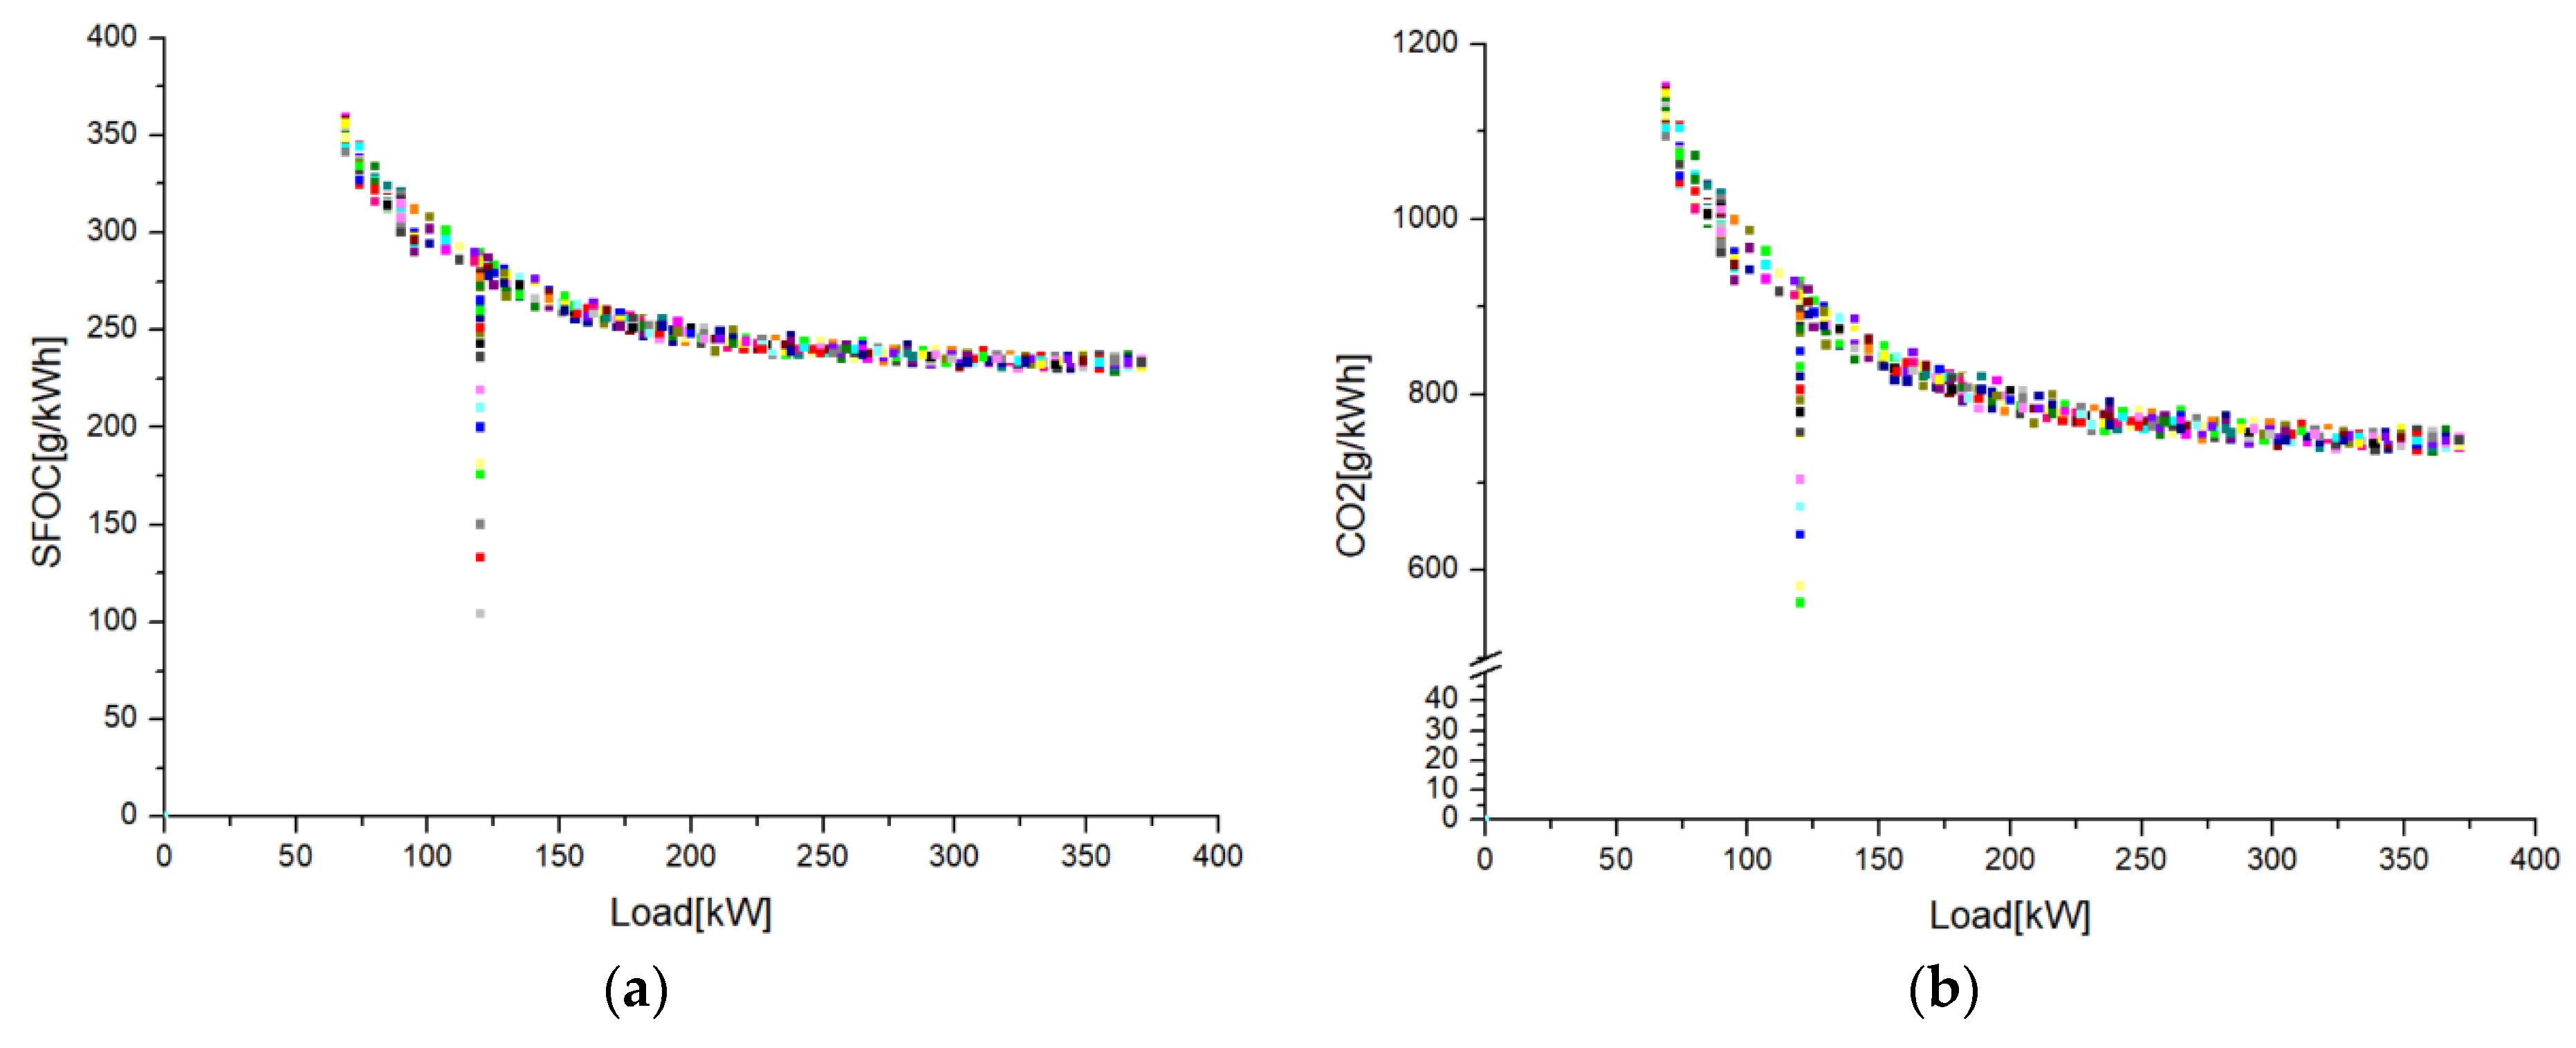
Figure 17a is an SFOC graph. The actual measured data was obtained by dividing the fuel consumption per hour and kW of about 5000 extracted from the experimental engine.
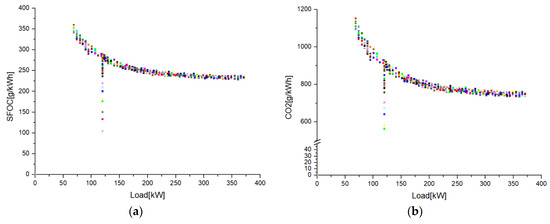
Figure 17.
The results for the AC distribution system with constant speed mode; (a) SFOC, (b) CO2 emission.
The SFOC data is greatly affected by the generator load. In the low-load region, where the turbocharger efficiency is low, it can be confirmed that the fuel consumption per hour and kW is higher than in the low-load region due to the decrease in engine efficiency. It can be seen that the SFOC is consistently low in the load region of 75% or more.
The carbon dioxide emission per-hourly horsepower is shown in Figure 17b, and a curve proportional to SFOC is demonstrated.
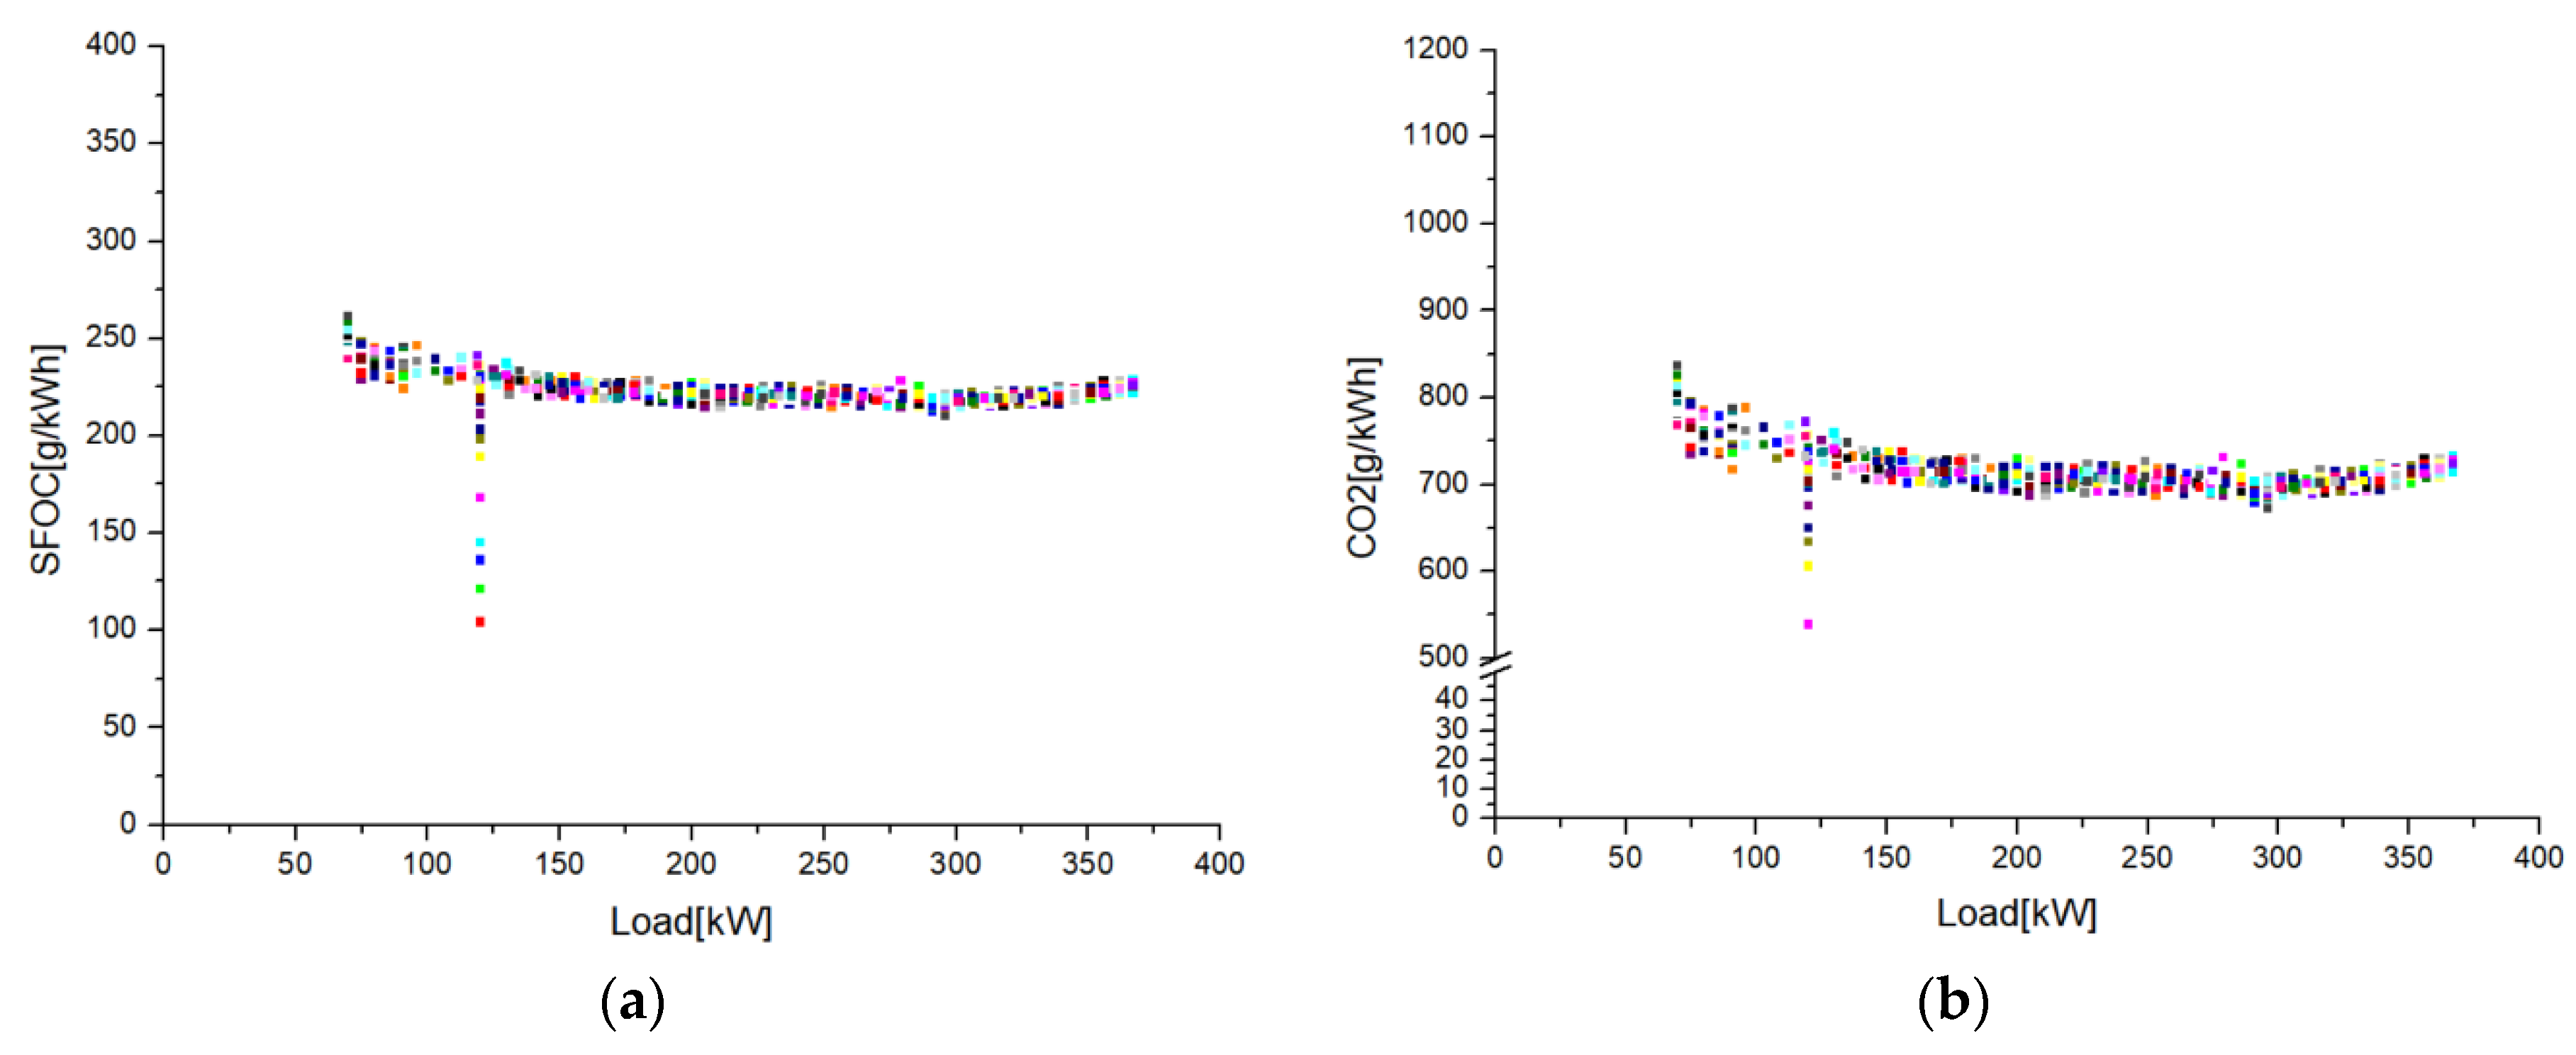
3.2.2. DC Distribution System (Variable Speed Mode)
Figure 18a shows the results of processing about the 5000 data extracted during operation in the variable speed mode. Unlike the constant-speed operation mode, since the engine’s rpm is variable, the lower the speed compared to the same load, the lower the energy consumption required to obtain the rotational power. It can be seen that it is significantly lower than the constant speed operation mode. The reduced carbon dioxide emissions can be seen due to the reduction in fuel consumption in Figure 18. Therefore, the variable speed operation mode shows an excellent carbon dioxide emission reduction in the low load region compared to constant speed operation. The high load output shows the same carbon dioxide emission as the constant speed operation mode.
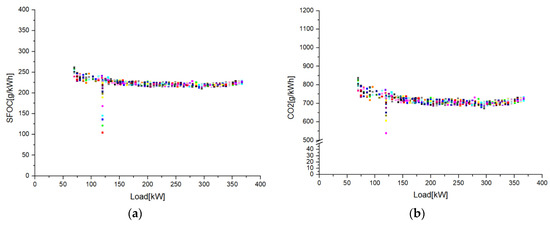
Figure 18.
The results for the DC distribution system with variable speed mode; (a) SFOC, (b) CO2 emission.
3.3. Case Study
3.3.1. Container 5500 TEU
Table 7 shows the results according to the load profile scenario of the 5,500 TEU vessel. The DC distribution system clearly showed higher efficiency (35.8%) compared with the AC distribution system (32.4%), with the observation that, where the load is variable, the constant speed generator consumes 73.6 kg of fuel, and the variable speed generator consumes 67.0 kg; an approximately 6.6 kg reduction. The cost difference was estimated at 8.9% based on the above fuel consumption. The research results are remarkable and convincing to demonstrate the excellence of the DC distribution system. Table 7 shows the amount of carbon dioxide emissions according to the fuel consumption. The DC distribution system emits 214.7 kg, and the AC distribution emits 235.9 kg, and thus it can be confirmed that 21.2 kg and 8.9% of the variable speed power generation system are lowered.
Table 7.
The comparison results of the total output, total fuel oil consumption, system efficiency, total fuel oil cost, and the total CO2 emissions for 5,500 TEU in the AC and DC distribution systems.
3.3.2. Container 13K TEU
Table 8 shows the results according to the load profile scenarios of the 13K TEU vessel.
Table 8.
The comparison results of the total output, total fuel oil consumption, system efficiency, total fuel cost, and the total CO2 emissions for 13K TEU in the AC and DC distribution systems.
The AC distribution system consumed 57.9 kg with 30.3% efficiency, and the DC distribution system consumed 50.7 kg, showing 34.9% efficiency, which is a difference of 7.2 kg.
In carbon dioxide emissions, the DC distribution system emitted 162.5 kg, and the AC distribution system emitted 185.7 kg, confirming that the emission rate of the DC distribution system was lowered by 12.4%.
3.4. Preliminary Lifecycle Assessment (LCA) in Response to Climate Change
Like other industries, the marine sector has been grappling with developing energy-saving systems to reduce business costs and respond to climate change proactively. This research is in the same line with this common goal. Given this, there still needs to be some meaningful insight into the effectiveness of using the DC distribution system with a variable speed generator engine if applied for the case vessels from the lifecycle perspective. This paper further conducted a preliminary lifecycle assessment to evaluate the lifecycle reduction in emissions.
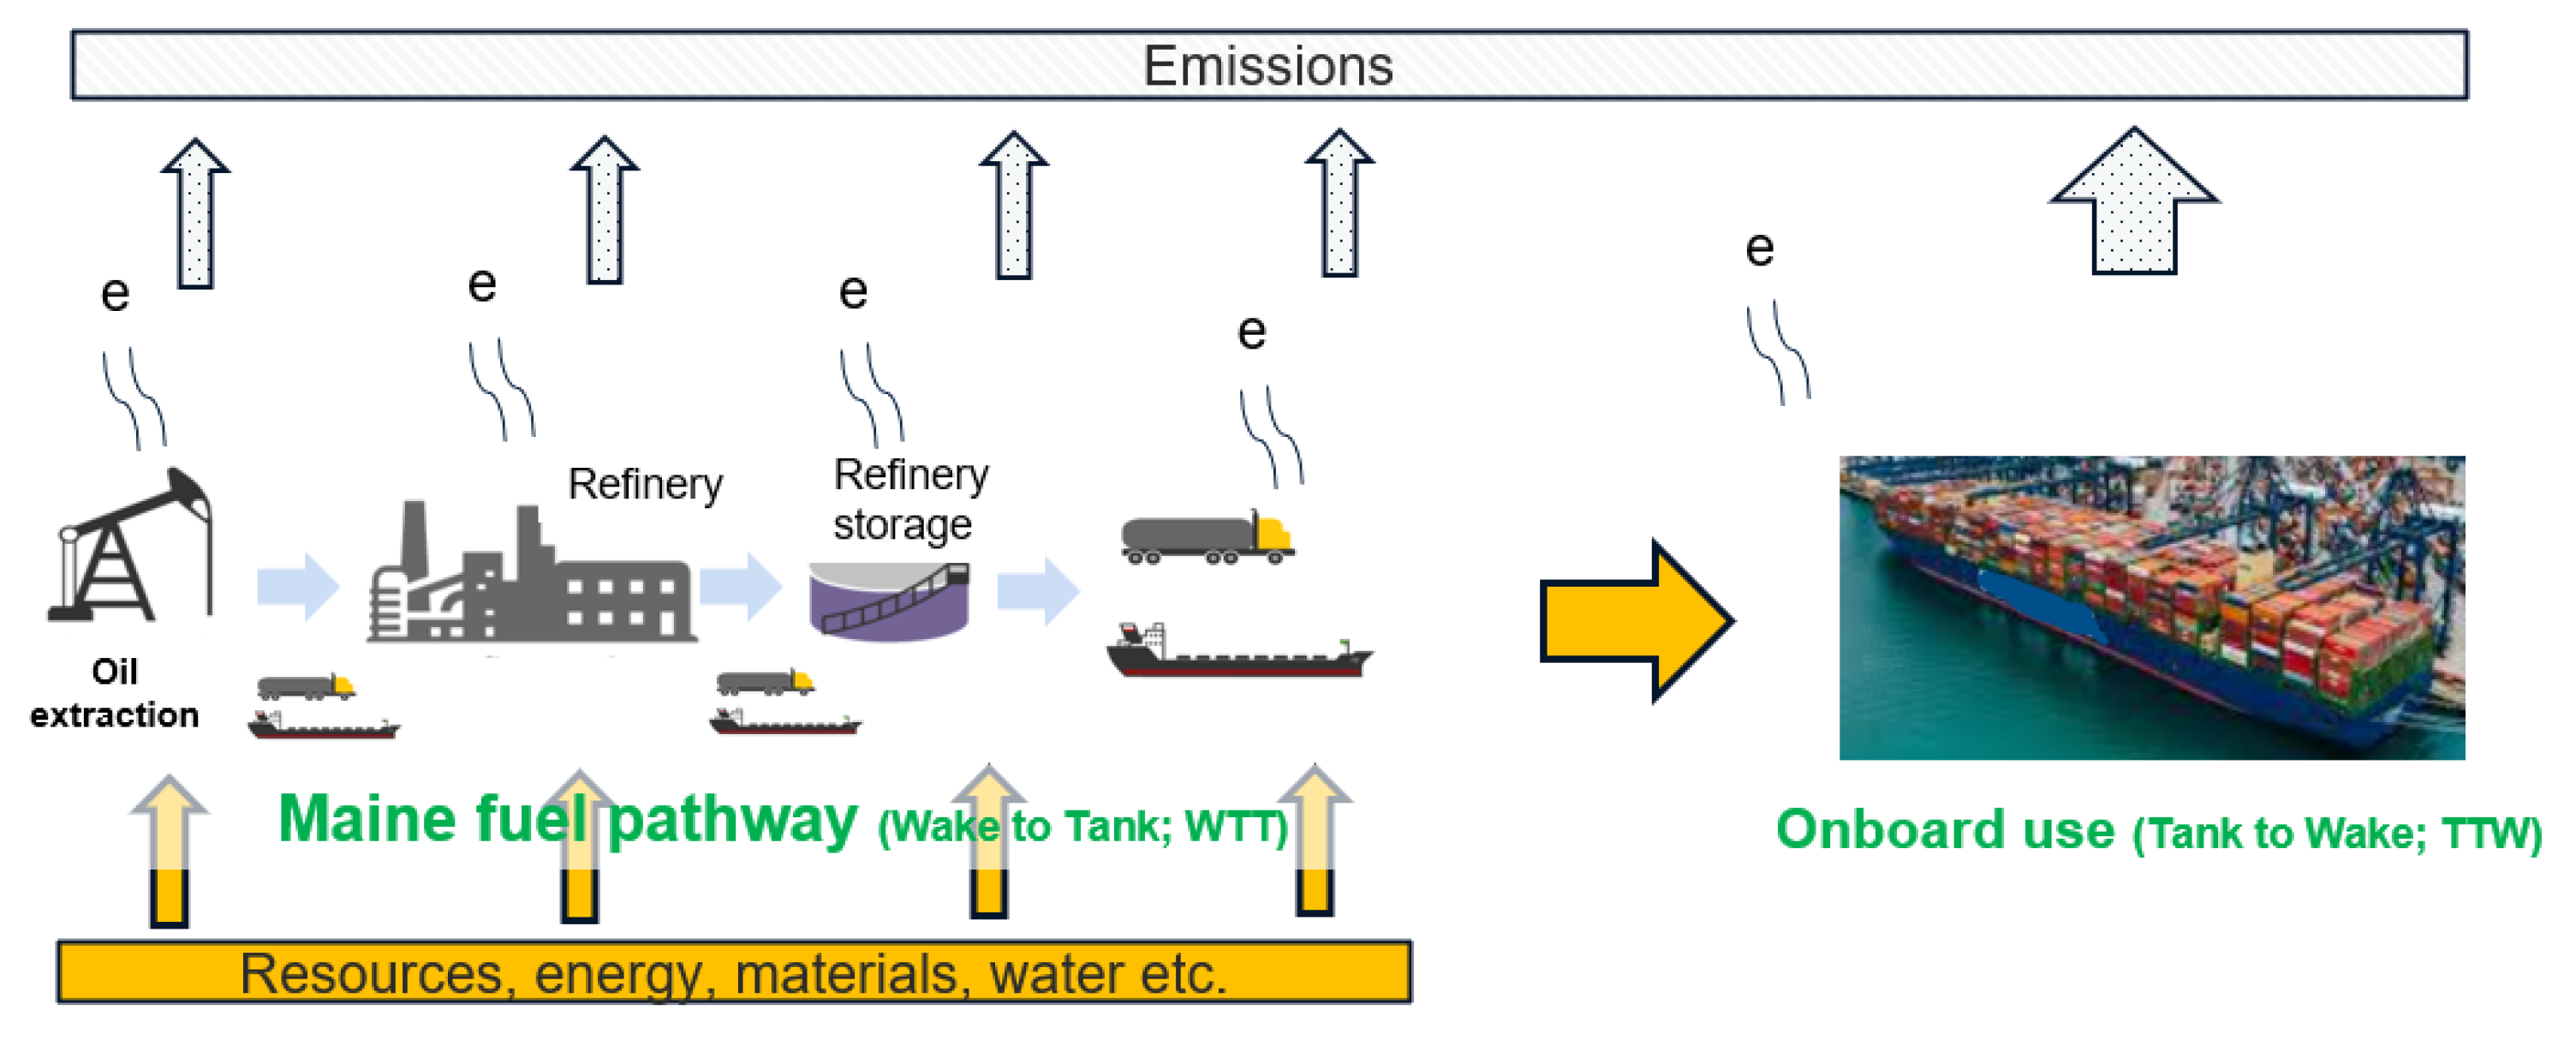
Marine fuels basically consist of two lifecycle stages: Well-to-Tank (WTT) and Tank-to-Wake (TTW). The combination of the environmental impacts between WTT and TTS represents the lifecycle potentials contributed by the case ships. Figure 19 outlines the lifecycle stages of the marine fuels that also define the scope of preliminary LCA in this paper. The analysis was aided by GaBi LCA software version 2021. This commercial software enables users to develop lifecycle models for proposed products, energies, systems, etc.

Figure 19.
Lifecycle pathway of marine fuel (scope of LCA); e means emission.
This tool is coupled with an LCA database that stores massive information on energy consumption and emissions for thousands of life cycle activities. Using this tool under a user-friendly interface, all lifecycle models in the fuel production stages were developed, and key emission data were borrowed from the GaBi database. The WTT analysis was conducted based on the country and region. The models from the Gabi database consider the national fuel production methods from refinery methods and electricity production methods.
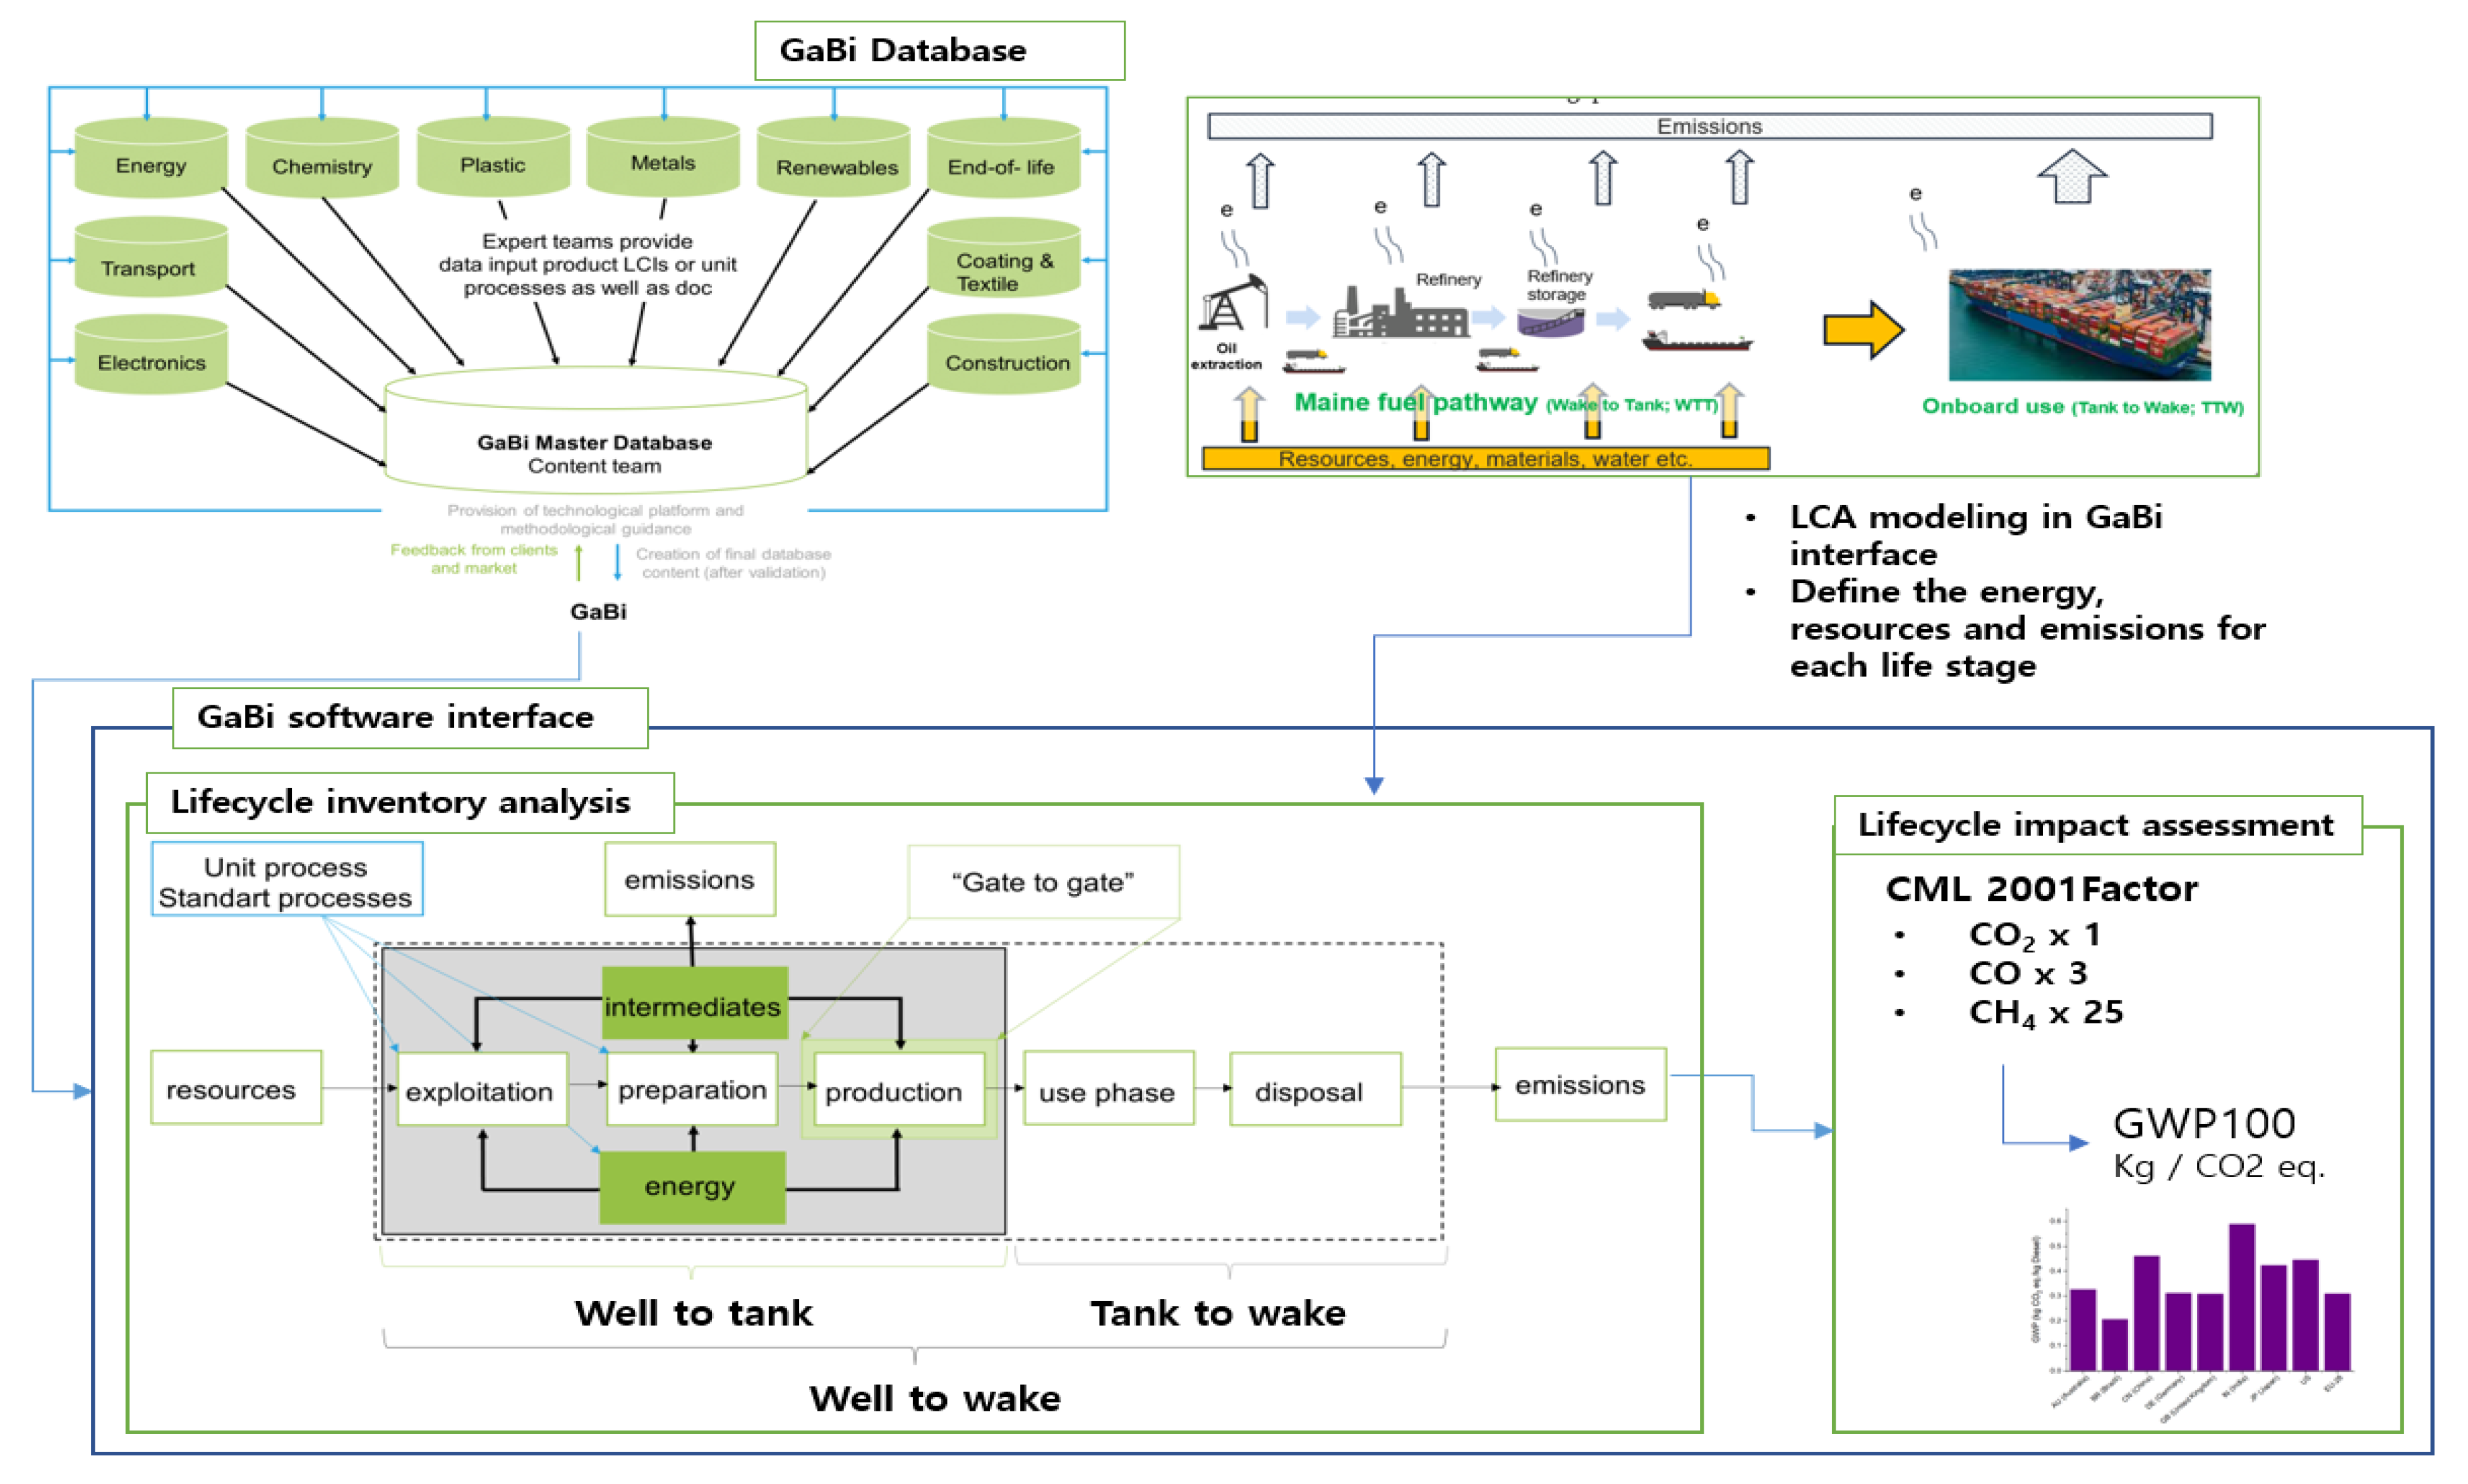
Figure 20 outlines the overall LCA process conducted under the GaBi software process.
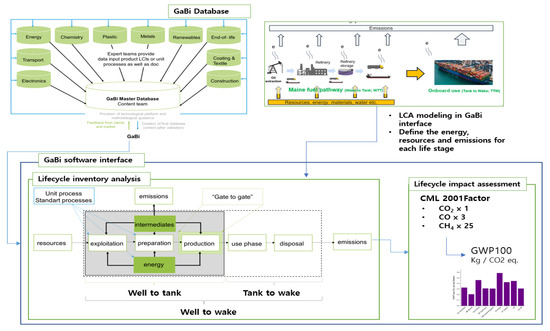
Figure 20.
The overall LCA process using GaBi Software; e means emission.
The proposed LCA model was developed in the GaBi user interface, which is directly linked to the GaBi LCA database. Using this database, the inputs (generally energies, resources, and materials) and the outputs (generally emissions) of the individual processes were determined. The quantification of those inputs and outputs of the holistic LCA process is represented as lifecycle inventory analysis. Then, the quantified emissions were then converted into global warming potential by means of CML 2001, which is a method to convert CO2, CO, and CH4 into global warming potential (GWP100 years) by proposing the normalization factors of 1 for CO2, 3 for CO, and 25 for CH4.
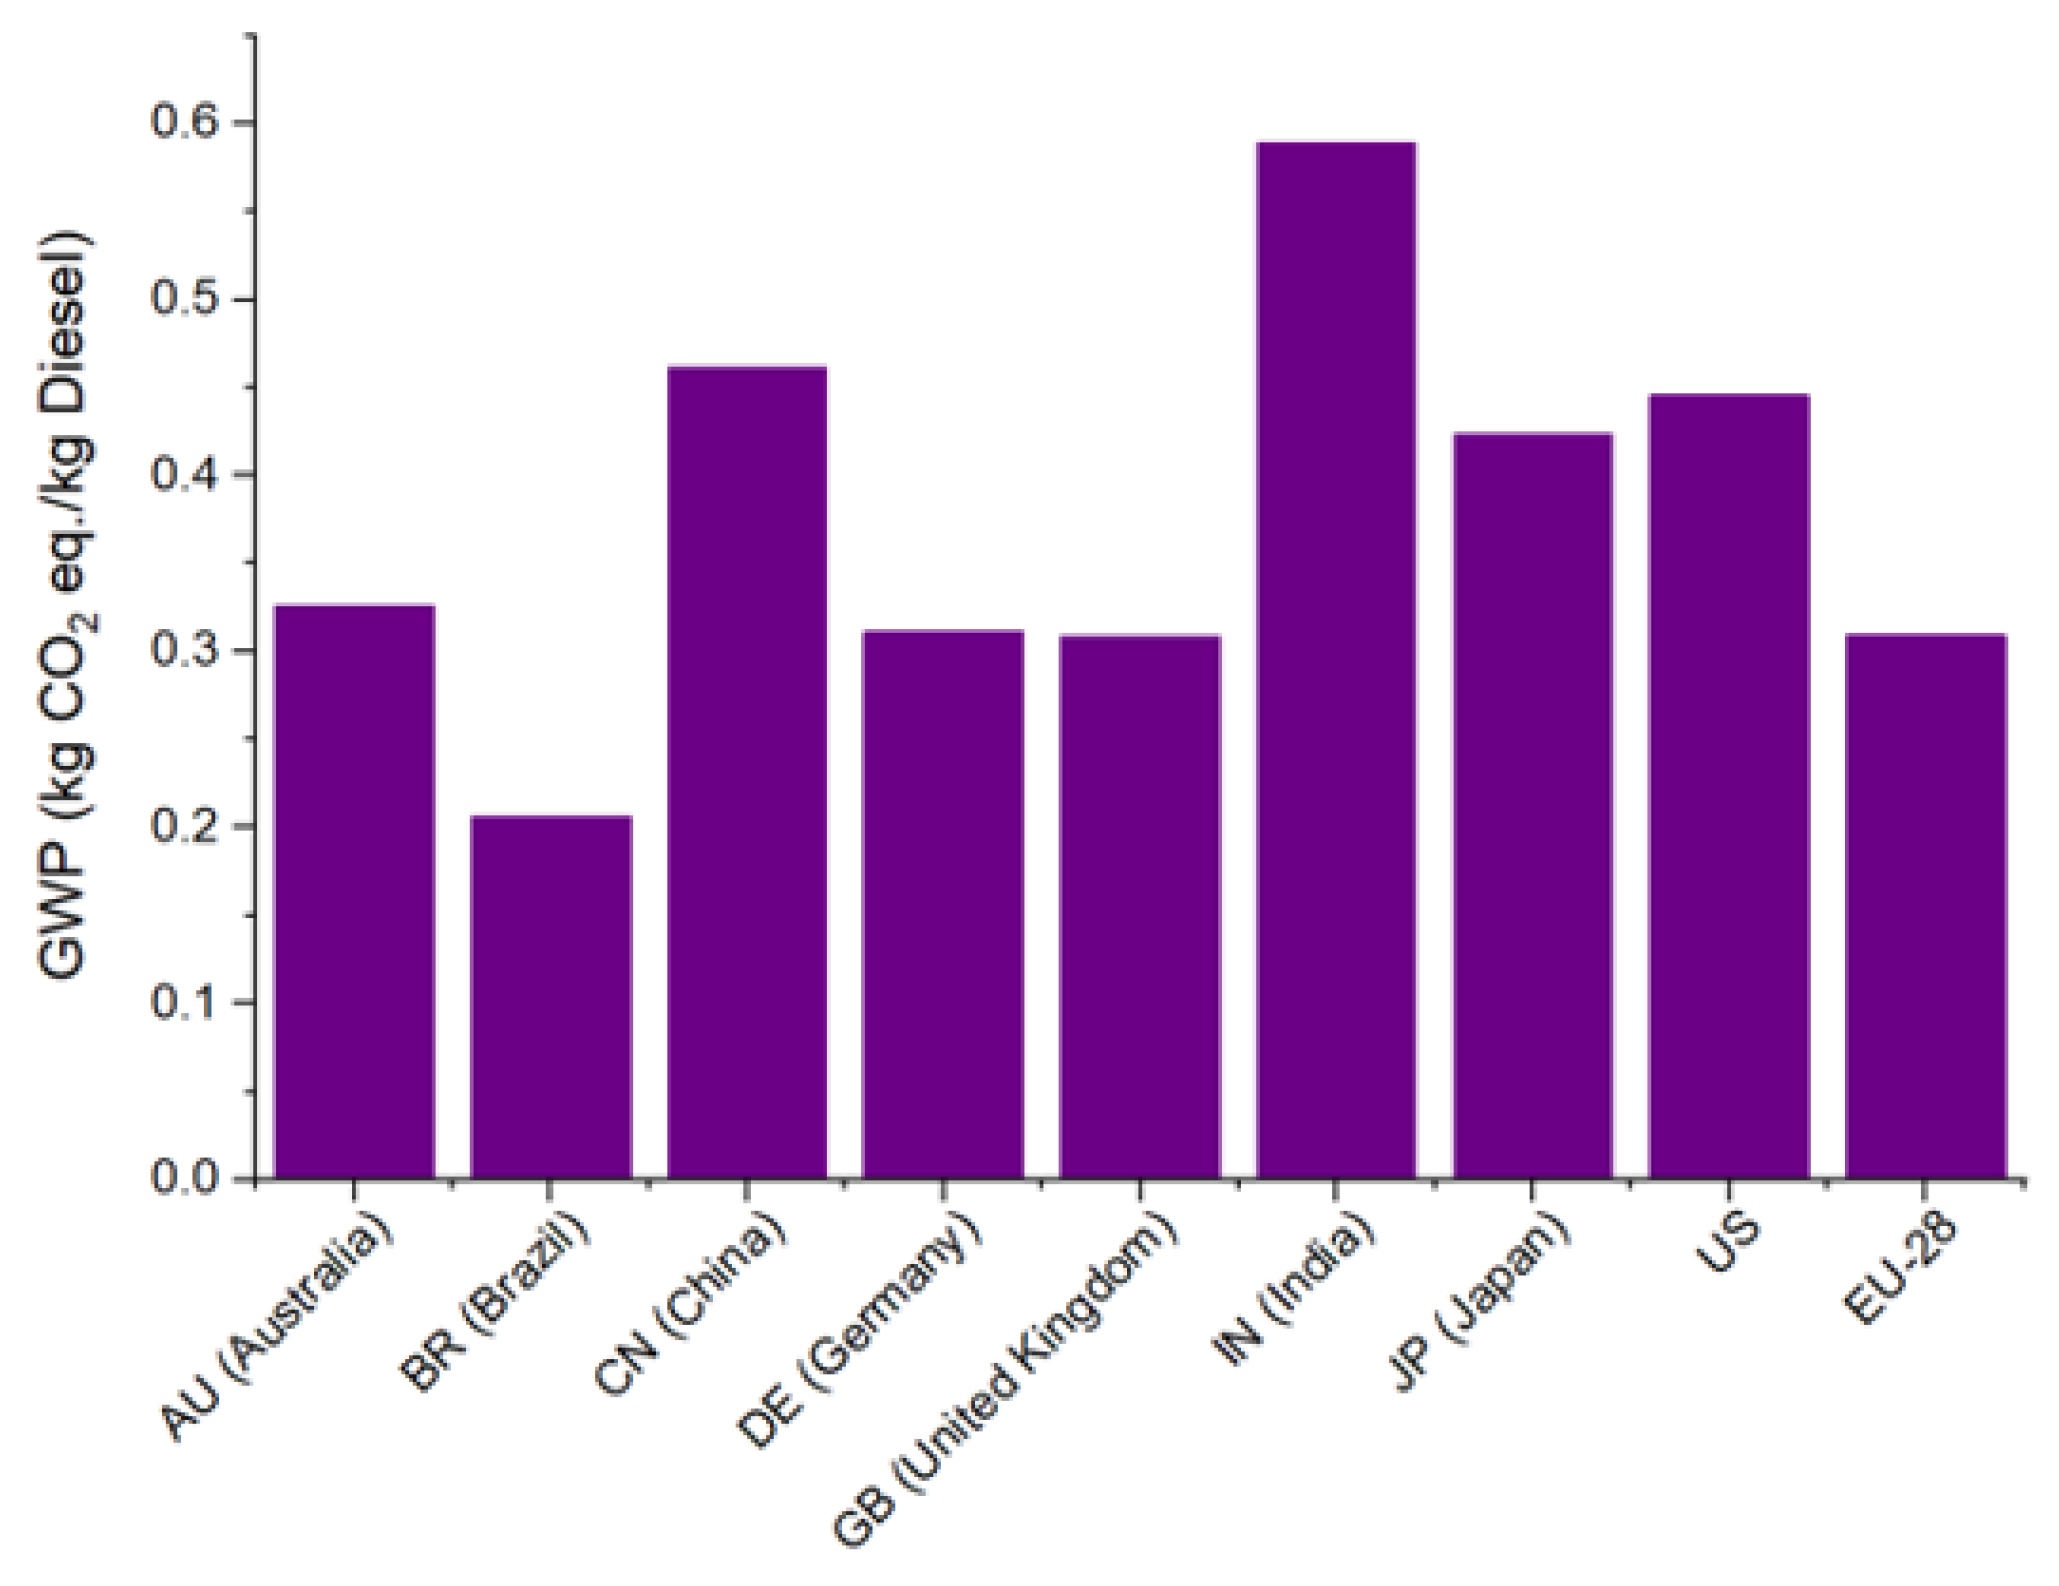
Figure 21 shows the results of the WTT analysis across nine different countries. Since the case ships are engaged in international services, they are highly likely to receive bunker oil from various nations; thus, the analysis was extended to several countries to observe their environmental gaps.

Figure 21.
The WTT environmental impacts of marine fuel vs. different nations.
For the TTW, given that the ship’s lifespan is 30 years, the lifetime fuel consumption of the case ships was estimated based on their current operating profile and fuel records. The emissions from the fuel consumption are further estimated in Table 9.
Table 9.
Emission factors as engine fuel consumption.
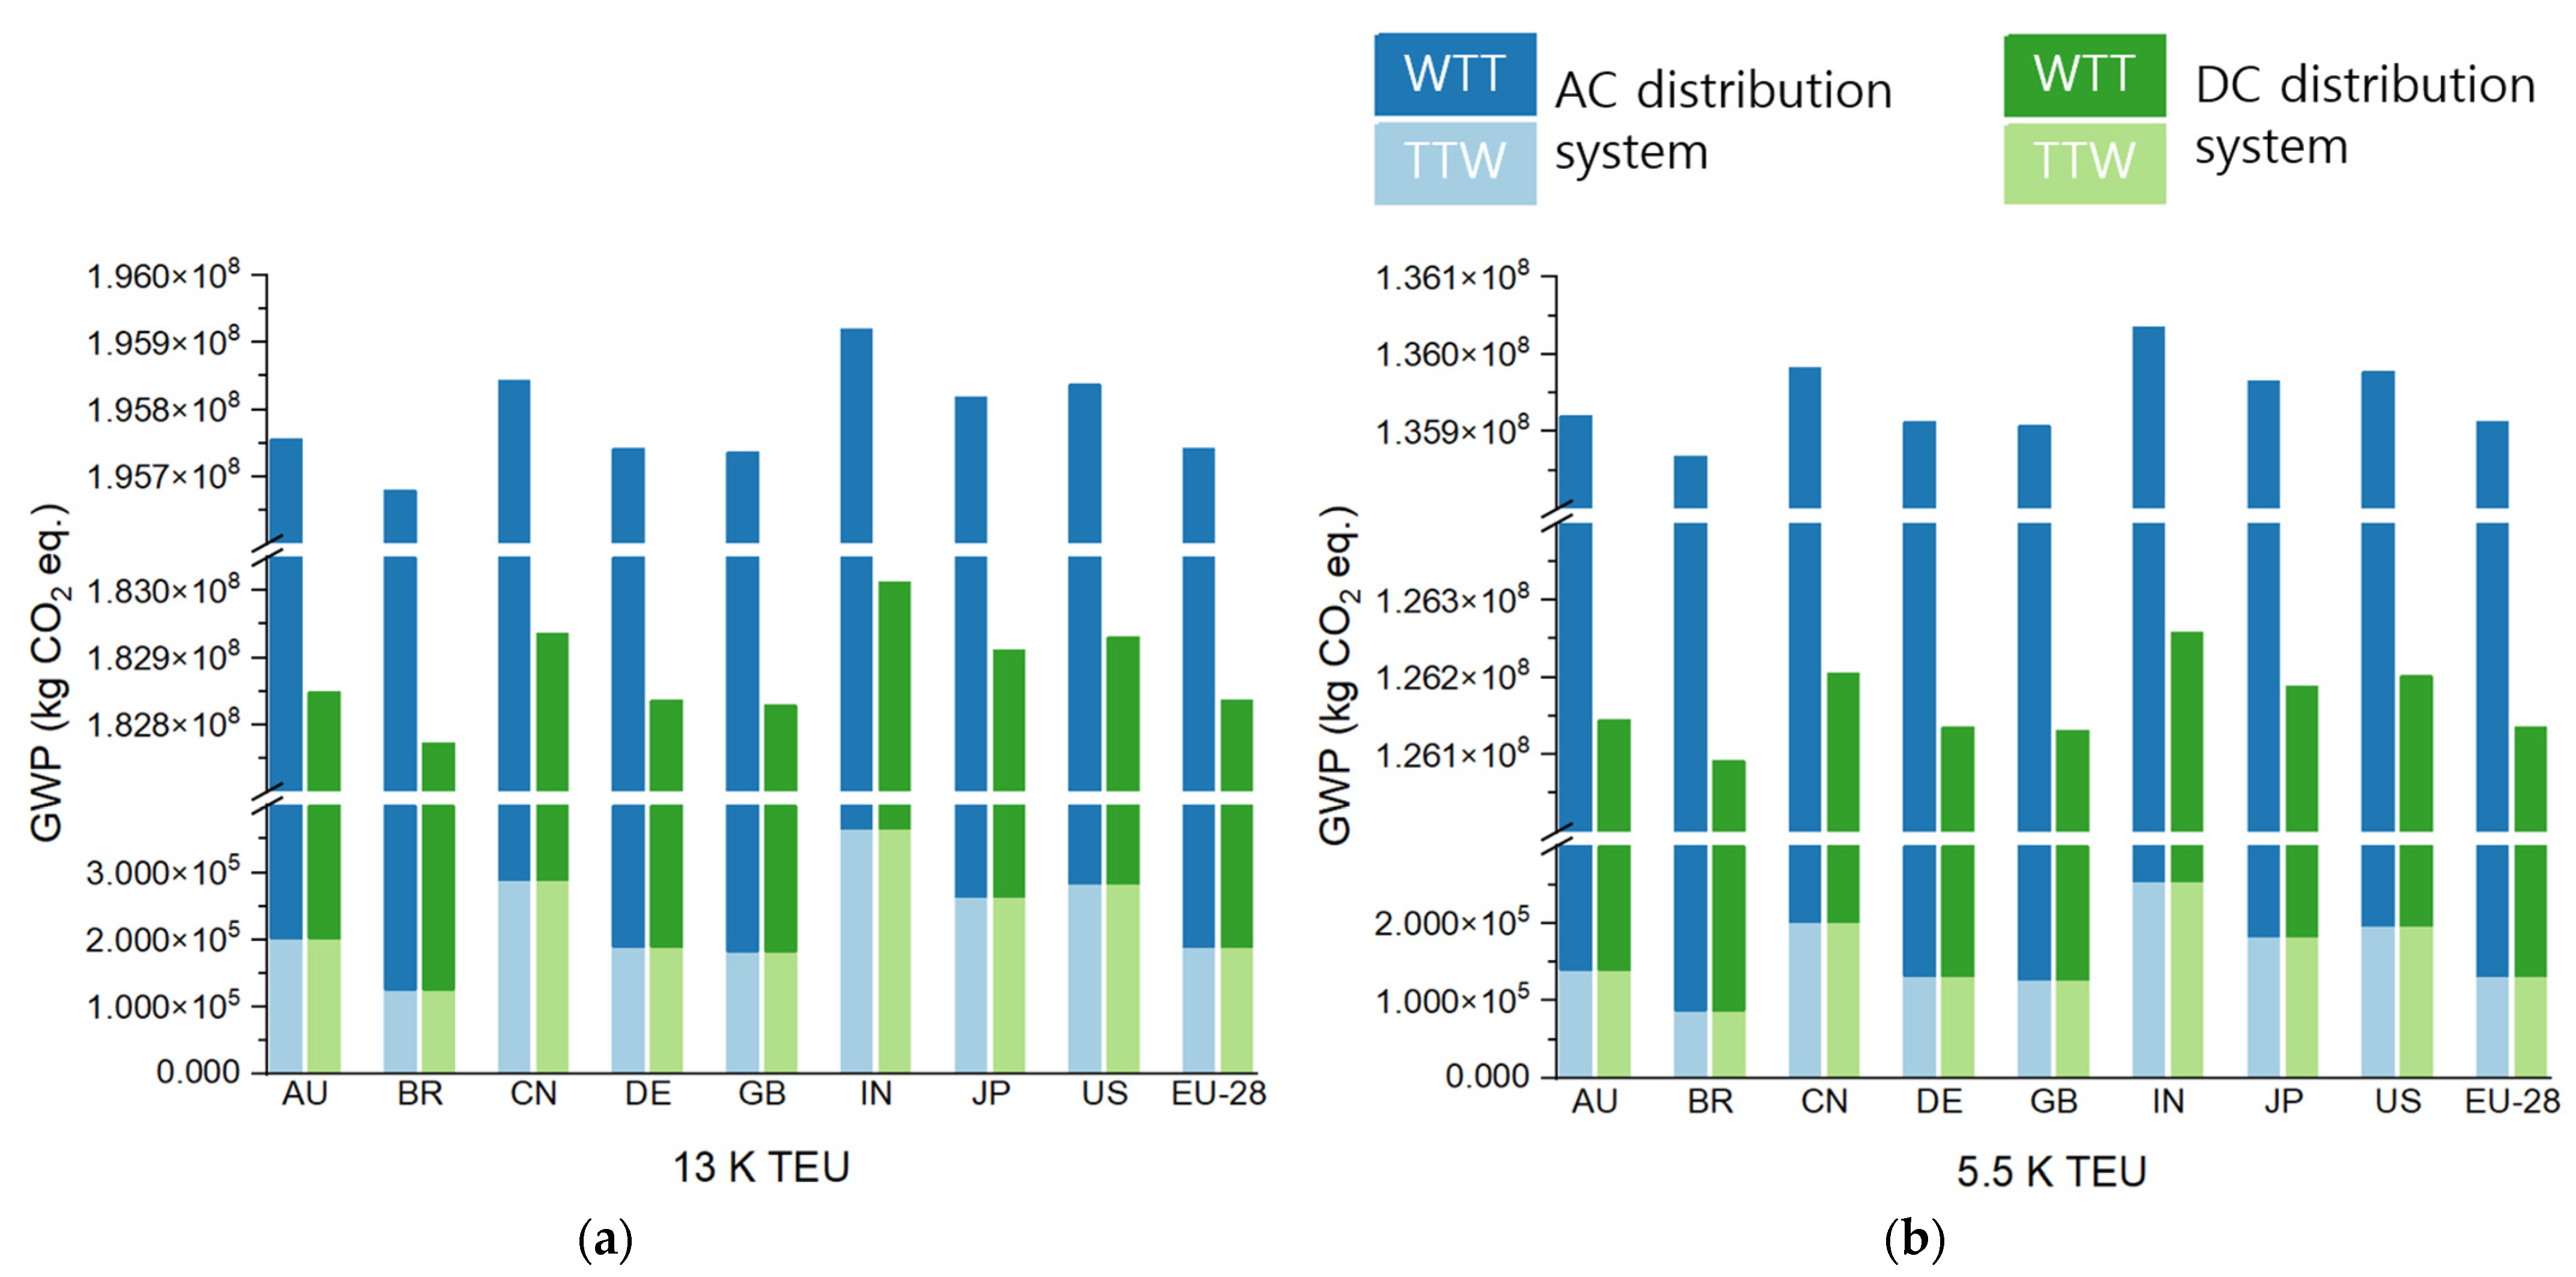
Figure 22 shows the results of the comparative analysis between the AC distribution system and the DC distribution system.
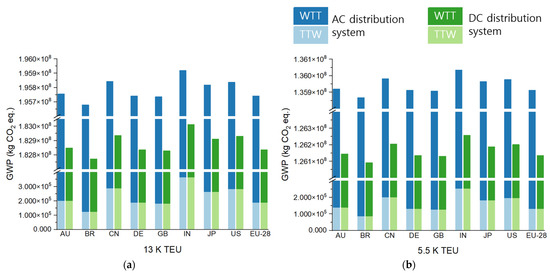
Figure 22.
Preliminary LCA results; (a) 13K TEU, (b) 5500 TEU.
The experimental results of 12.4% reductions in fuel consumption for 13K TEU and 8.9% reduction in fuel consumption for 5500 TEU ships were considered for this LCA comparison. The results suggest the importance of the distribution system in response to cost reduction and environmental protection, proving that a considerable amount of GWP emissions can be reduced by a DC distribution system with a variable speed generator engine.
On the other hand, it must be noted that this preliminary analysis was proposed to offer a brief idea of how much a proper system can reduce emissions; indeed, the results of this research must be considered indicative. Although this preliminary LCA study needs to be further elaborated with more accurate data and detailed analysis, the reduction level in emissions may be sufficiently significant so as to highly encourage the improvement of the DC distribution system in electric propulsion ships.
4. Discussion
This paper attempted to remedy the limited understanding of the performance of the DC distribution systems through simulation-based investigation. We also presented the benefits of the DC distribution systems quantitatively by comparing the AC and DC distribution system’s electrical characteristics and their differences in performance.
There has been a lack of empirical research to reveal the benefits of DC distribution systems under the same system and environment. In this regard, this study presents the results of system efficiency improvement by combining a DC distribution system with an AFE rectifier and a variable speed engine. Based on the results of this study through LCA analysis, the amounts of carbon dioxide emission reductions in nine representative countries (each country had different lifecycle environmental impacts of marine fuels) were analyzed. To this end, this study examined the electrical characteristics, economic feasibility, and environmental characteristics through an AC-DC hybrid distribution electric propulsion system that could provide the same environment and conditions.
The numerical results regarding engine efficiency and the carbon dioxide emission reduction rate with the DC distribution system were analyzed for valuable technical information in the maritime sector. These results provide empirical data that is helpful to shipyard designers, shipping company officials, and policymakers. The experimental results answer the fundamental questions presented in the study’s introduction, “Are electric propulsion systems the green solution?” and “How much does the improvement of the DC distribution system with AFE rectifier and a variable speed engine affect the decarbonization in shipping?”
In other words, an electric propulsion system can also reduce carbon dioxide emissions as an eco-friendly propulsion system through additional system improvement. In particular, through the LCA results, the electric propulsion system can reduce carbon dioxide in a country and contribute to the strategy of reducing carbon dioxide through the controller’s progress.
5. Conclusions
In this study, we conducted a comparative analysis between DC and the AC distribution systems. The load scenario extracted from the merchant ship was applied to the full-scale AC-DC hybrid distribution electric propulsion system. As a result, the excellence of the DC distribution system was demonstrated. The electrical characteristics of the electric propulsion system and fuel consumption, carbon dioxide emissions, and fuel costs were reviewed by comparing the fuel consumption per horsepower-hour. Through this study, we drew the following conclusions.
- (1)
- We found a higher efficiency of the DC distribution system with a variable speed operation mode, which has recently been in demand, over the AC distribution constant speed operation mode, in the low-load and medium-load range. In both scenarios, DC distribution systems with AFE rectifiers and a variable speed engine demonstrated about 10% to 15% improvements in the system efficiency.
- (2)
- In the case of an electric propulsion system, using a constant speed engine showed a relatively significant efficiency reduction in the low-load range that caused system efficiency problems. This can be supplemented by a variable speed engine and by controlling the AFE rectifier to make a constant voltage in DC power. Moreover, it was possible to obtain a stable voltage in the DC distribution system as well as in the AC distribution system.
- (3)
- The DC distribution system in variable speed operation mode with an AFE rectifier showed improved results and trends of 8.9~12.4 [%] in carbon dioxide emissions and fuel consumption compared with the AC distribution system. When the conventional constant speed engine was replaced with a variable speed engine, the efficiency improved by about 10 [%] with a reduction in carbon dioxide emissions.
- (4)
- Preliminary LCA results suggest the significance of developing/applying a DC distribution system for electric propulsion. Indeed, it can be confidently said that a DC distribution system with a variable speed generator engine would reduce lifecycle emission levels as much as by about 10% as given in Figure 22. The DC distribution was also revealed to be effective in response to climate change and cost reductions for electric propulsion marine vessels.
In the case of a DC distribution electric propulsion system, an AFE rectifier is required due to the voltage change according to the speed change caused by using a variable speed generator. Compared to the AC distribution system, which does not reflect this system, the DC distribution system improved by about 10% emission reduction. Still, the result may vary depending on the load conditions and operating time. In addition, even if the system efficiency assumes energy conversion loss, a factor that considers the age of the ship and the aging of the engine, it remains in the 30% range instead of the 40–50% range.
Therefore, it is necessary to calculate the amount of carbon dioxide emission reduction with this aging factor in a country. In addition, among the approximately 70,000 coastal ships in Korea, small ships cannot install all-electric propulsion systems, and DC distribution system installations are also limited. It is necessary to investigate the specifications of entire vessels. As further study for applying electric propulsion systems in small- and medium-sized vessels, the study of hybrid systems linking the battery and the existing generator will also result in the development of low-carbon ships.
Author Contributions
H.J.: Conceptualization, Funding acquisition, Project administration, Resources, Software, Writing—review & editing, Supervision. S.K.: Data curation, Formal analysis, Investigation, Methodology, Validation, Visualization, Writing—original draft. All authors have read and agreed to the published version of the manuscript.
Funding
This work was supported by the Korea Maritime and Ocean University Research Fund in 2021.
Acknowledgments
This work was supported by the Korea Maritime and Ocean University Research Fund in 2021.
Conflicts of Interest
The authors declare no conflict of interest.
References
- United Nations Framework Convention on Climate Change. Available online: https://unfccc.int/resource/docs/convkp/conveng.pdf (accessed on 15 January 2022).
- IMO. Fourth Greenhouse Gas Study 2020; IMO: London, UK, 2021. [Google Scholar]
- IMO. The 76th Session of the Marine Environment Protection Committee, MEPC 76; IMO: London, UK, 2021. [Google Scholar]
- Korea Ministry of Government Legislation, Act on Promotion of the Development and Distribution of Environmentally Friendly Vessels, 1 January 2020. Available online: https://bit.ly/3vrg0zO (accessed on 3 April 2022).
- Ship Technology, Ampere Electric-Powered Ferry. 1 January 2015. Available online: https://www.ship-technology.com/projects/norled-zerocat-electric-powered-ferry/ (accessed on 3 April 2022).
- Research, M. Electric Ship Market by Type (Fully Electric, Hybrid), System, Mode of Operation (Manned, Remotely Operated, Autonomous), Ship Type (Commercial, Defense), Power, Range, Tonnage, End-Use (Linefit and Retrofit), and Region-Global Forecast to 2030. In Advances in Transport Policy and Planning; Academic Press: Cambridge, MA, USA, 2021. [Google Scholar]
- Vantage Market Research, Marine Battery Market, Marine Battery Sourcing and Procurement Market Size to Increase by USD 1.5 Billion By 2028, 2 February 2022. Available online: https://www.vantagemarketresearch.com/industry-report/marine-battery-market-1113 (accessed on 3 April 2022).
- Wärtsilä. Wärtsilä to Deliver World’s First Hybrid Retrofit for Short-Sea Shipping Vessel; Wärtsilä: Helsinki, Finland, 2019. [Google Scholar]
- China Completes Test of Homegrown Electric Cargo Ship; Ship Technology; Springer: Berlin/Heidelberg, Germany, 2020.
- Kim, S.; Jeon, H.; Kim, J. Trend analysis of domestic and international regulations for electric propulsion system. J. Int. Marit. Safety Environ. Aff. Shipp. 2020, 4, 113–121. [Google Scholar] [CrossRef]
- Jeon, H.; Kim, J.; Yoon, K. Large-Scale Electric Propulsion Systems in Ships Using an Active Front-End Rectifier. J. Mar. Sci. Eng. 2019, 7, 168. [Google Scholar] [CrossRef] [Green Version]
- Jeon, H.; Kim, J. Application of Reference Voltage Control Method of the Generator Using a Neural Network in Variable Speed Synchronous Generation System of DC Distribution for Ships. J. Mar. Sci. Eng. 2020, 8, 802. [Google Scholar] [CrossRef]
- Hansen, J.F.; Wendt, F. History and State of the Art in Commercial Electric Ship Propulsion, Integrated Power Systems, and Future Trends. Proceed. IEEE 2015, 103, 2229–2242. [Google Scholar] [CrossRef]
- Kanellos, F.D.; Tsekouras, G.J.; Prousalidis, J. Onboard DC grid employing smart grid technology: Challenges, state of the art and future prospects. IET Electr. Syst. Transp. 2015, 5, 1–11. [Google Scholar] [CrossRef]
- Hammerstrom, D.J. AC Versus DC Distribution SystemsDid We Get it Right? In Proceedings of the 2007 IEEE Power Engineering Society General Meeting, Tampa, FL, USA, 24–28 June 2007; IEEE: Piscataway, NJ, USA, 2007; pp. 1–5. [Google Scholar]
- Planas, E.; Andreu, J.; Garate, J.I.; de Alegría, I.M.; Ibarra, E. AC and DC technology in microgrids: A review. Renew. Sustain. Energy Rev. 2015, 43, 726–749. [Google Scholar] [CrossRef]
- Prenc, R.; Cuculic, A.; Baumgartner, I. Advantages of using a DC power system on board ship. J. Marit. Transp. Sci. 2016, 52, 83–97. [Google Scholar] [CrossRef] [Green Version]
- Van Duijsen, P.J.; Zuidervliet, D.C. Structuring, Controlling and Protecting the DC Grid. In Proceedings of the 2020 International Symposium on Electronics and Telecommunications (ISETC), Timisoara, Romania, 5–6 November 2020; pp. 1–4. [Google Scholar]
- Baran, M.; Mahajan, N. DC distribution for industrial systems: Opportunities and challenges. IEEE Trans. Ind. Appl. 2003, 39, 1596–1601. [Google Scholar] [CrossRef]
- Castellan, S.; Menis, R.; Tessarolo, A.; Sulligoi, G. Power electronics for all-electric ships with MVDC power distribution system: An overview. In Proceedings of the 2014 Ninth International Conference on Ecological Vehicles and Renewable Energies (EVER), Monte-Carlo, Monaco, 25–27 March 2014; IEEE: Piscataway, NJ, USA, 2014; pp. 1–7. [Google Scholar]
- Wenig, S.; Rojas, F.; Schonleber, K.; Suriyah, M.; Leibfried, T. Simulation Framework for DC Grid Control and ACDC Interaction Studies Based on Modular Multilevel Converters. IEEE Trans. Power Deliv. 2016, 31, 780–788. [Google Scholar] [CrossRef]
- Deng, F.; Chen, Z. Control of Improved Full-Bridge Three-Level DC/DC Converter for Wind Turbines in a DC Grid. IEEE Trans. Power Electron. 2013, 28, 314–324. [Google Scholar] [CrossRef]
- Engel, S.P.; Soltau, N.; Stagge, H.; De Doncker, R.W. Dynamic and Balanced Control of Three-Phase High-Power Dual-Active Bridge DC–DC Converters in DC-Grid Applications. IEEE Trans. Power Electron. 2013, 28, 1880–1889. [Google Scholar] [CrossRef]
- Vandoorn, T.L.; Meersman, B.; De Kooning, J.D.M.; Vandevelde, L. Analogy Between Conventional Grid Control and Islanded Microgrid Control Based on a Global DC-Link Voltage Droop. IEEE Trans. Power Deliv. 2012, 27, 1405–1414. [Google Scholar] [CrossRef] [Green Version]
- Berggren, B.; Linden, K.; Majumder, R. DC Grid Control Through the Pilot Voltage Droop Concept—Methodology for Establishing Droop Constants. IEEE Trans. Power Syst. 2014, 30, 2312–2320. [Google Scholar] [CrossRef]
- Wang, S.; Ming, W.; Liu, W.; Li, C.; Loo, C.E.U.; Liang, J. A Multi-Function Integrated Circuit Breaker for DC Grid Applications. IEEE Trans. Power Deliv. 2021, 36, 566–577. [Google Scholar] [CrossRef] [Green Version]
- Khan, Z.W.; Minxiao, H.; Kai, C.; Yang, L.; Rehman, A.U. State of the Art DC-DC Converter Topologies for the Multi-Terminal DC Grid Applications: A Review. In Proceedings of the 2020 IEEE International Conference on Power Electronics, Smart Grid and Renewable Energy (PESGRE2020), Cochin, India, 2–4 January 2020; IEEE: Piscataway, NJ, USA, 2020; Volume PESGRE2020, pp. 1–7. [Google Scholar]
- Li, C.; Liang, J.; Wang, S. Interlink Hybrid DC Circuit Breaker. IEEE Trans. Ind. Electron. 2018, 65, 8677–8686. [Google Scholar] [CrossRef]
- Meyer, C.; Kowal, M.; De Doncker, R.W. Circuit breaker concepts for future high-power DC-applications. In Proceedings of the Fourtieth IAS Annual Meeting. Conference Record of the 2005 Industry Applications Conference, Hong Kong, China, 2–6 October 2005; Volume 2, pp. 860–866. [Google Scholar]
- Bingjian, Y.; Yang, G.; Xiaoguang, W.; Zhiyuan, H.; Longlong, C.; Yunhai, S. A hybrid circuit breaker for DC-application. In Proceedings of the 2015 IEEE First International Conference on DC Microgrids (ICDCM), Atlanta, GA, USA, 7–10 June 2015; IEEE: Piscataway, NJ, USA, 2015; pp. 187–192. [Google Scholar]
- Hansen, J.F.; Lindtjørn, J.O.; Vanska, K.; Abb, O. Onboard DC Grid for enhanced DP operation in ships. In Proceedings of the Dynamic Positioning Conference, Houston, TX, USA, 10–11 October 2017. [Google Scholar]
- Yuan, L.C.; Tjahjowidodo, T.; Lee, G.S.; Chan, R.; Ådnanes, A.K. Equivalent consumption minimization strategy for hybrid all-electric tugboats to optimize fuel savings. In Proceedings of the 2016 American Control Conference (ACC), Boston, MA, USA, 6–8 July 2016; pp. 6803–6808. [Google Scholar]
- Hansen, J.F.; Wendt, F.; Lindtjørn, J.O. Fuel efficient power plant featuring variable speed generation system for DP drilling units. In Proceedings of the Dynamic Positioning Conference, Houston, TX, USA, 11–12 October 2016; pp. 1–13. [Google Scholar]
- Syverud, T.H. Modeling and Control of a DC-Grid Hybrid Power System with Battery and Variable Speed Diesel Generators. Master’s Thesis, Norwegian University of Science and Technology, Trondheim, Norway, 2016. [Google Scholar]
- Kozak, M. New concept of ship’s power plant system with varying rotational speed gensets. In Proceedings of the 58th International Conference of Machine Design Departments, Prague, Czech Republic, 8–10 September 2017. [Google Scholar]
- Luo, L.; Gao, L.; Fu, H. The Control and Modeling of Diesel Generator Set in Electric Propulsion Ship. Int. J. Inf. Technol. Comput. Sci. 2011, 3, 31–37. [Google Scholar] [CrossRef]
- Mobarra, M.; Rezkallah, M.; Ilinca, A. Variable Speed Diesel Generators: Performance and Characteristic Comparison. Energies 2022, 15, 592. [Google Scholar] [CrossRef]
- Kim, Y.-W.; Son, Y.-K.; Ko, S.; Sul, S.-K. Parallel Operation of Permanent Magnet Generators and Diode Rectifiers in Maritime DC Power System Considering Fuel Economy. IEEE Trans. Transp. Electrification 2022, 1. [Google Scholar] [CrossRef]
- Rehmatulla, N.; Calleya, J.; Smith, T. The implementation of technical energy efficiency and CO2 emission reduction measures in shipping. Ocean Eng. 2017, 139, 184–197. [Google Scholar] [CrossRef]
- Yu, W.; Zhou, P.; Wang, H. Evaluation on the energy efficiency and emissions reduction of a short-route hybrid sightseeing ship. Ocean Eng. 2018, 162, 34–42. [Google Scholar] [CrossRef] [Green Version]
- He, Y.; Fan, A.; Wang, Z.; Liu, Y.; Mao, W. Two-phase energy efficiency optimisation for ships using parallel hybrid electric propulsion system. Ocean Eng. 2021, 238, 109733. [Google Scholar] [CrossRef]
- Wang, H.; Boulougouris, E.; Theotokatos, G.; Zhou, P.; Priftis, A.; Shi, G. Life cycle analysis and cost assessment of a battery powered ferry. Ocean Eng. 2021, 241, 110029. [Google Scholar] [CrossRef]
- Hardan, F.; Norman, R.; Tricoli, P. Control and operation of a ship AC/DC microgrid under transient propulsion and manoeuvring load conditions. Int. J. Electr. Power Energy Syst. 2022, 139, 107823. [Google Scholar] [CrossRef]
- Xi, J.; Pei, X.; Niu, L.; Feehally, T.; Wilson, P.; Gu, C.; Zeng, X. A solid-state circuit breaker for DC system using series and parallel connected IGBTs. Int. J. Electr. Power Energy Syst. 2022, 139, 107996. [Google Scholar] [CrossRef]
- Xiao, Z.; Zheng, X.; He, Y.; Tai, N.; Cheng, H.; Shen, J. An additional bus inductance-based protection scheme for shipboard DC zonal electric distribution systems. Int. J. Electr. Power Energy Syst. 2022, 138, 107910. [Google Scholar] [CrossRef]
- Kanellos, F.D.; Prousalidis, J.; Tsekouras, G.J. Optimal Active Power Management in All Electric Ship Employing DC Grid Technology. In Cultural and Tourism Innovation in the Digital Era; Springer Science and Business Media LLC.: Berlin/Heidelberg, Germany, 2017; pp. 271–284. [Google Scholar]
- AlAfnan, H.; Zhang, M.; Yuan, W.; Zhu, J.; Li, J.; Elshiekh, M.; Li, X. Stability Improvement of DC Power Systems in an All-Electric Ship Using Hybrid SMES/Battery. IEEE Trans. Appl. Supercond. 2018, 28, 1–6. [Google Scholar] [CrossRef] [Green Version]
- Choi, D. Numerical Methods for Engineers and Scientists; Haksan Media: Seoul, Korea, 2019; pp. 250–257. [Google Scholar]
- PE. GaBi 4 Software-System and Databases for Life Cycle Engineering Copyright, TM. Stuttgart, Echterdingen. 2018. Available online: http://www.gabi-software.com (accessed on 5 February 2022).


Publisher’s Note: MDPI stays neutral with regard to jurisdictional claims in published maps and institutional affiliations. |
© 2022 by the authors. Licensee MDPI, Basel, Switzerland. This article is an open access article distributed under the terms and conditions of the Creative Commons Attribution (CC BY) license (https://creativecommons.org/licenses/by/4.0/).