Abstract
At present, box-girder superstructures are commonly used in coastal bridges, and their hydrodynamic performance under extreme waves such as tsunamis has attracted a lot of attention. There is a lack of research focusing on the effect of lateral restraining stiffness on box-girder superstructures under the extreme wave condition. In this paper, a two-dimensional numerical model based on the RANS equation and SST k-ω turbulence model is established. Combined with the dynamic mesh updating technique, the effect of lateral restraining stiffness on the superstructure of a box-girder and the dynamic characteristics of the movable box-girder under the solitary waves were investigated. To ensure the mesh quality, the numerical computational domain is divided into several regions that correspond to specific types of body motion. The numerical model is verified by comparing it with other numerical simulation results and experimental results. The dynamic characteristics and the wave forces of the box-girder superstructure under the effect of lateral restraining stiffness under the unbroken solitary waves are discussed. The results show that the horizontal and vertical forces on the box-girder superstructure under the action of unbroken solitary waves can be reduced by reducing the lateral restraining stiffness. However, with the decrease in lateral restraining stiffness, the lateral displacement of the box-girder superstructure would increase. Therefore, the lateral restraining stiffness and lateral displacement limit of the box-girder superstructure should be fully considered in practical engineering, and the appropriate lateral restraining stiffness should be selected to reduce the wave forces on the box-girder superstructure under extreme wave action, so as to improve the safety of the coastal box-girder superstructure. It is of great importance to study the interaction between the box-girder superstructure and unbroken solitary waves, which will help to have a deeper understanding to improve the disaster resistance of bridges.
1. Introduction
With the development of the economy and society, coastal communication has become an indispensable part of people’s lives, which has driven the development of the local economy from the aspects of transportation and tourism development. However, in recent years, with the deterioration of the global environment and the frequent occurrence of extreme natural disasters around the world, such as tsunamis and hurricanes, nearby coastal facilities such as coastal bridges are easily damaged. In 2011, the Tohoku Earthquake with a magnitude of 9.0 occurred in the western Pacific Ocean. The prefectures of Iwate, Miyagi and Fukushima in northeastern Japan were devastated by the tsunami caused by the earthquake, including hundreds of coastal bridges. It has caused huge economic losses to residents and society [1,2,3,4].
The extreme wave forces caused by huge tsunamis [5,6,7] and the damming loads [8] act on the coastal bridges, resulting in different degrees of damage such as lateral displacement or collapse of bridge superstructures, which has attracted widespread attention to the safety of the bridge superstructure under extreme wave forces in recent years [9,10,11,12]. Therefore, there is an urgent need to test the safety performance of bridge superstructures under extreme waves. During the last decades, researchers have conducted extensive studies on the interaction of coastal bridge superstructures with extreme waves through experimental tests [13,14,15,16,17,18,19,20,21] and numerical simulations [22,23,24,25,26,27]. An improved simplified design procedure was proposed by Xiang and Istrati [28], and the horizontal force and vertical force of the coastal bridge superstructures under solitary waves were also studied by combining experimental tests with numerical simulation. However, the wave forces on the bridge superstructure are affected by many factors: (1) trapped air, which has a significant effect on the wave force on bridges by large-scale experiments on interaction between the bridge superstructures and waves [29,30,31]; (2) displacements of deck [32,33]; (3) deck inclination [2,5,6,34]; etc.
However, a reliable experimental test needs lots of manpower and material resources, and the numerical simulation can be more convenient and cheaper to implement the full-size analysis to avoid the effect of trapped air due to volume scaling. In recent years, with the development of computational science and numerical analysis methods, the fluid–structure coupling has received extensive attention worldwide from academia and industry. The numerical simulation based on the fluid–structure coupling has gradually become one of the most popular methods for researchers [35].
In previous research, the bridge superstructure under extreme wave action is often simplified as a rigid body to predict the wave force on the bridge superstructure, thus the dynamic characteristics of the bridge superstructure are ignored. Xu and Cai [36] developed a mass–spring–damper model to study the dynamic characteristics of a T-girder superstructure under extreme wave actions. In their study, only a total horizontal spring was considered to study the effect of the characteristics of the structural vibration on the interaction between the T-girder superstructure and waves. In addition, a 2D numerical analysis was conducted by Istrati and Buckle [37] to study the effect of flexibility of the bridge superstructure and substructure on tsunami loads and connection forces. In their study, both the horizontal and vertical spring are considered in the bridge model. These two studies indicated that the dynamic characteristics of the bridge have a significant effect on the tsunami loads on the bridges.
Nowadays, box-girder is widely used in the construction of coastal bridges due to its strong integrity, high torsional stiffness and strong adaptability. Moreover, through the experimental tests of the interaction between waves and bridge superstructure, Istrati [38], Huang et al. [21], and Chen et al. [39] illustrated that the wave forces acting on bridges of different structure forms are significantly different, so it is extremely urgent to study the dynamic characteristics of coastal box-girder superstructure under extreme wave forces [40,41,42]. However, how the lateral restraining stiffnesses of the girders affect the unbroken solitary wave force on the box-girder superstructure is currently unclear. Therefore, this study aims to numerically investigate the effects of different lateral restraining stiffnesses on the interaction between waves and a movable box-girder superstructure. The 2D numerical model is developed here because of its lower computational cost and the faster evaluation of wave forces on the bridge compared to the 3D model [2].
In the next section, the methods used in the study and the parameter settings of the model are introduced. In Section 3, the wave model base on unbroken solitary waves (represented by solitary waves below) is used to represent tsunami-like waves and verified with theoretical solutions; then the calculation results of the wave force on the box-girder superstructure are verified with the laboratory experimental results. Finally, a parametric study is conducted to study the effects of lateral restraining stiffnesses, wave height, and submersion coefficient on the wave forces on the coastal bridge with a box-girder superstructure. Then, the findings of the study are summarized and conclusions are drawn.
2. Numerical methodology
2.1. Wave Generation
Wave generation and the interaction between the bridge superstructure and waves are simulated based on the CFD package, FLUENT 21.0. After comprehensively considering the computational accuracy, computational cost and sophistication of the physical model, the widely used 2D numerical model is adopted in this study. The volume of fluid (VOF) method, which has been proved to be effective in capturing the fluctuations of the wave surface [33,43], is adopted in this study due to its good mass conservation properties. Compared with the common k-ε turbulence model which is suitable for high Reynold numbers, the shear stress transport (SST) k-ω turbulence model is more appropriate for the fluid domain near the wall with low Reynold numbers and the fluid domain with high Reynold numbers [33]. Details about the VOF method and SST k-ω turbulence model can be found in Zhan et al. [44]. Therefore, the SST k-ω turbulence model used by Xu and Cai [33,36] is used as the turbulence closure in the RANS equation in this study.
The equations of the RANS are as follows:
where ui and are the average velocities in the i and j directions, respectively. and are the fluctuation velocities along the i and j directions, respectively. xi and are the coordinate axes along the i and j directions, respectively. is the average pressure, μ is the dynamic viscosity coefficient, ρ is the density, and t is the time.
The equations of the SST k-ω model are as follows:
where k is the turbulence kinetic energy and ω is the dissipation. and are the effective diffusivity of k and ω, respectively. calculated from represents the generation of turbulence kinetic energy due to the mean velocity gradients. is the generation of ω, is the cross-diffusion term, and are the user-defined source terms, and and are the dissipation of k and ω, respectively.
The solitary wave is widely used to realistically simulate the propagation of the tsunami-like wave in the ocean by many researchers because of its energy concentration [36,38,45,46]. Therefore, the solitary wave is chosen as the incident wave in this study. The equations of the solitary wave are as follows:
where η is the wave surface profile and P is the hydrostatic pressure at the position z, which represents the distance from the position to the bottom of the seabed. u and υ are the velocity in the x direction and the y direction, respectively. c is the wave celerity, H is the wave height, d is the water depth, and g is the acceleration of gravity. From Equation (5), the wave crest at t = 0 is exactly located at x = 0 (i.e., η = H when t = 0 and x = 0). A minimum distance represents that a wave crest propagating to the inlet boundary needs to be guaranteed to ensure that the generated wave surface profile is fully developed [36], and should not be less than the effective wavelength [47], where the equation of the is as follows:
To generate the solitary waves, the User Define Function (UDF) unique to the FLUENT is used here. The UDF is composed of the Equations (5)–(8) written in the C language combined with the macro of DEFINE_PROFILE. The wave surface profile will be verified in Section 3.
2.2. Mass–Spring–Damper System
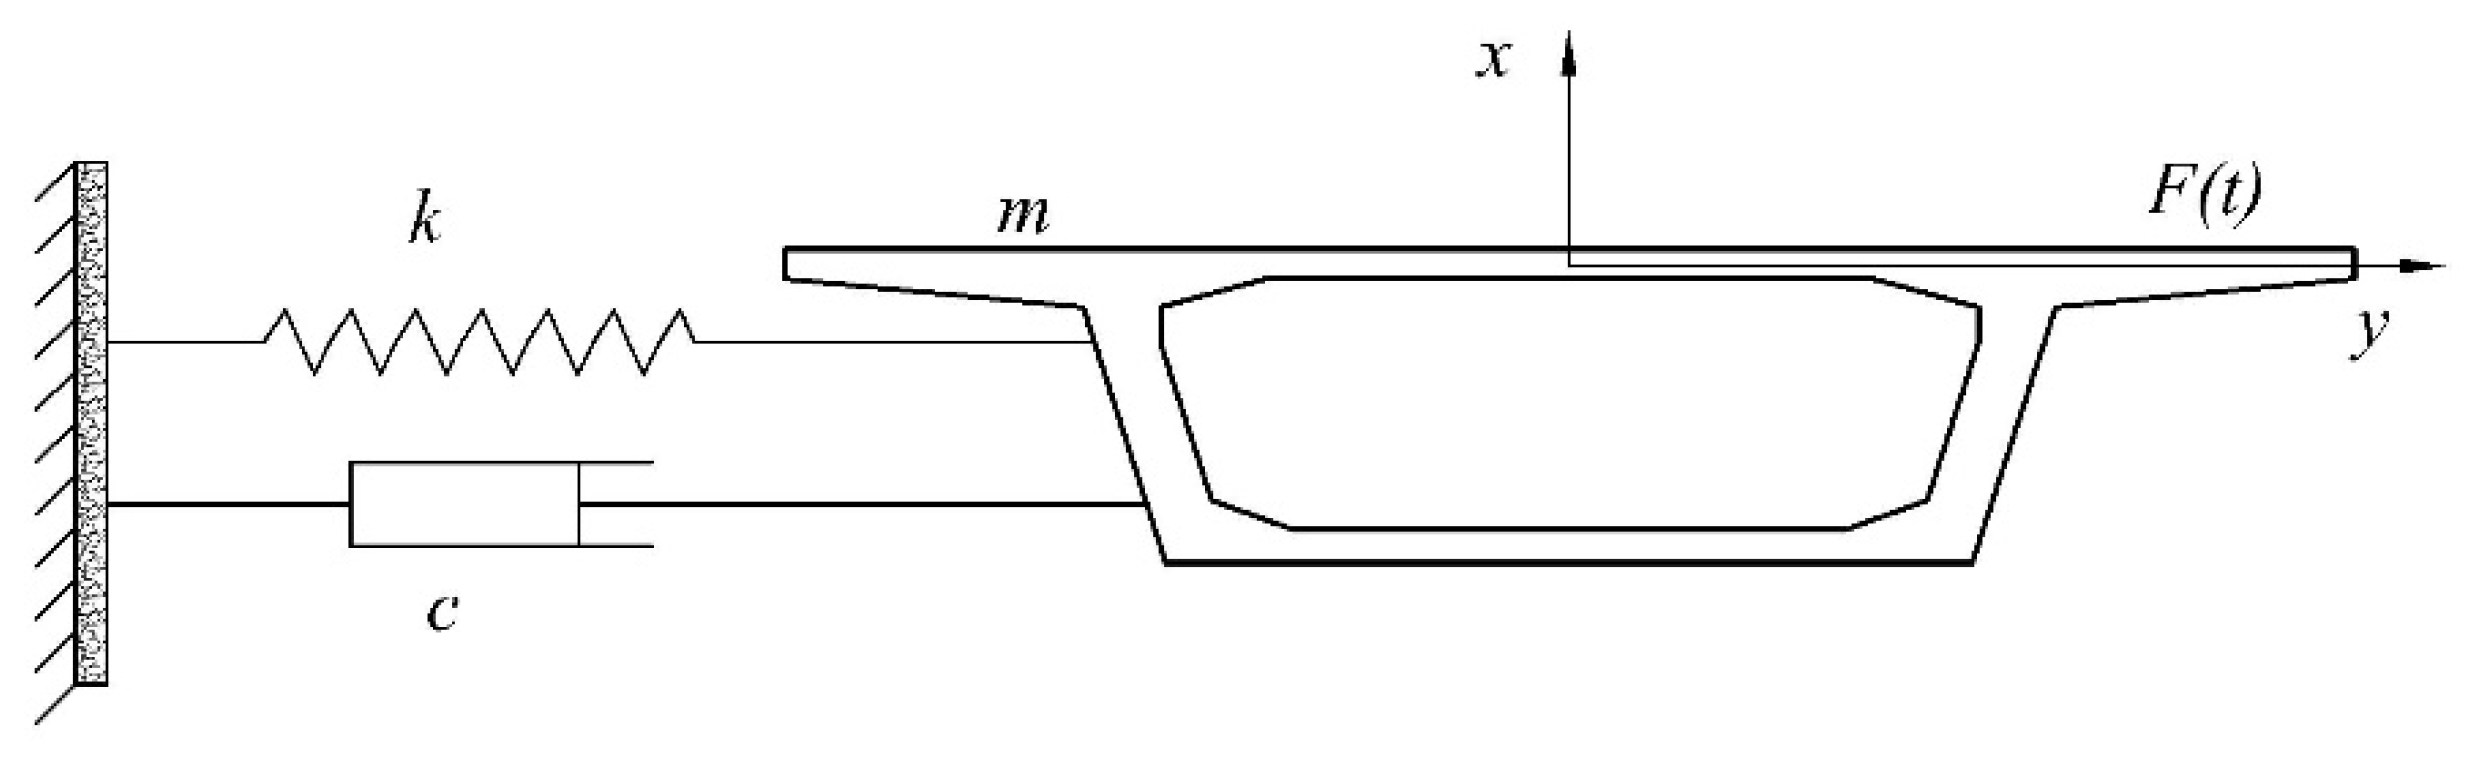
A mass–spring–damper system is used here to achieve the interaction between the box-girder superstructure and waves with different lateral restraining stiffnesses, as shown in Figure 1. In this paper, only the lateral vibration of the box-girder superstructure under wave action is considered, and the box-girder superstructure is assumed to remain intact under wave action. The vibration mechanism of the box-girder superstructure can be represented by the following equations:
where m is the weight per unit length of the bridge deck, x is the instantaneous lateral displacement of the bridge superstructure, and ξ is the damping ratio. F(t) is the instantaneous horizontal resultant force on the box-girder superstructure under the action of waves. The damping coefficient c, the lateral restraining stiffness k and the natural frequency of the box-girder superstructure can be calculated from the following equations.
where is the vibration period of the bridge superstructure.

Figure 1.
The mass–spring–damper system.
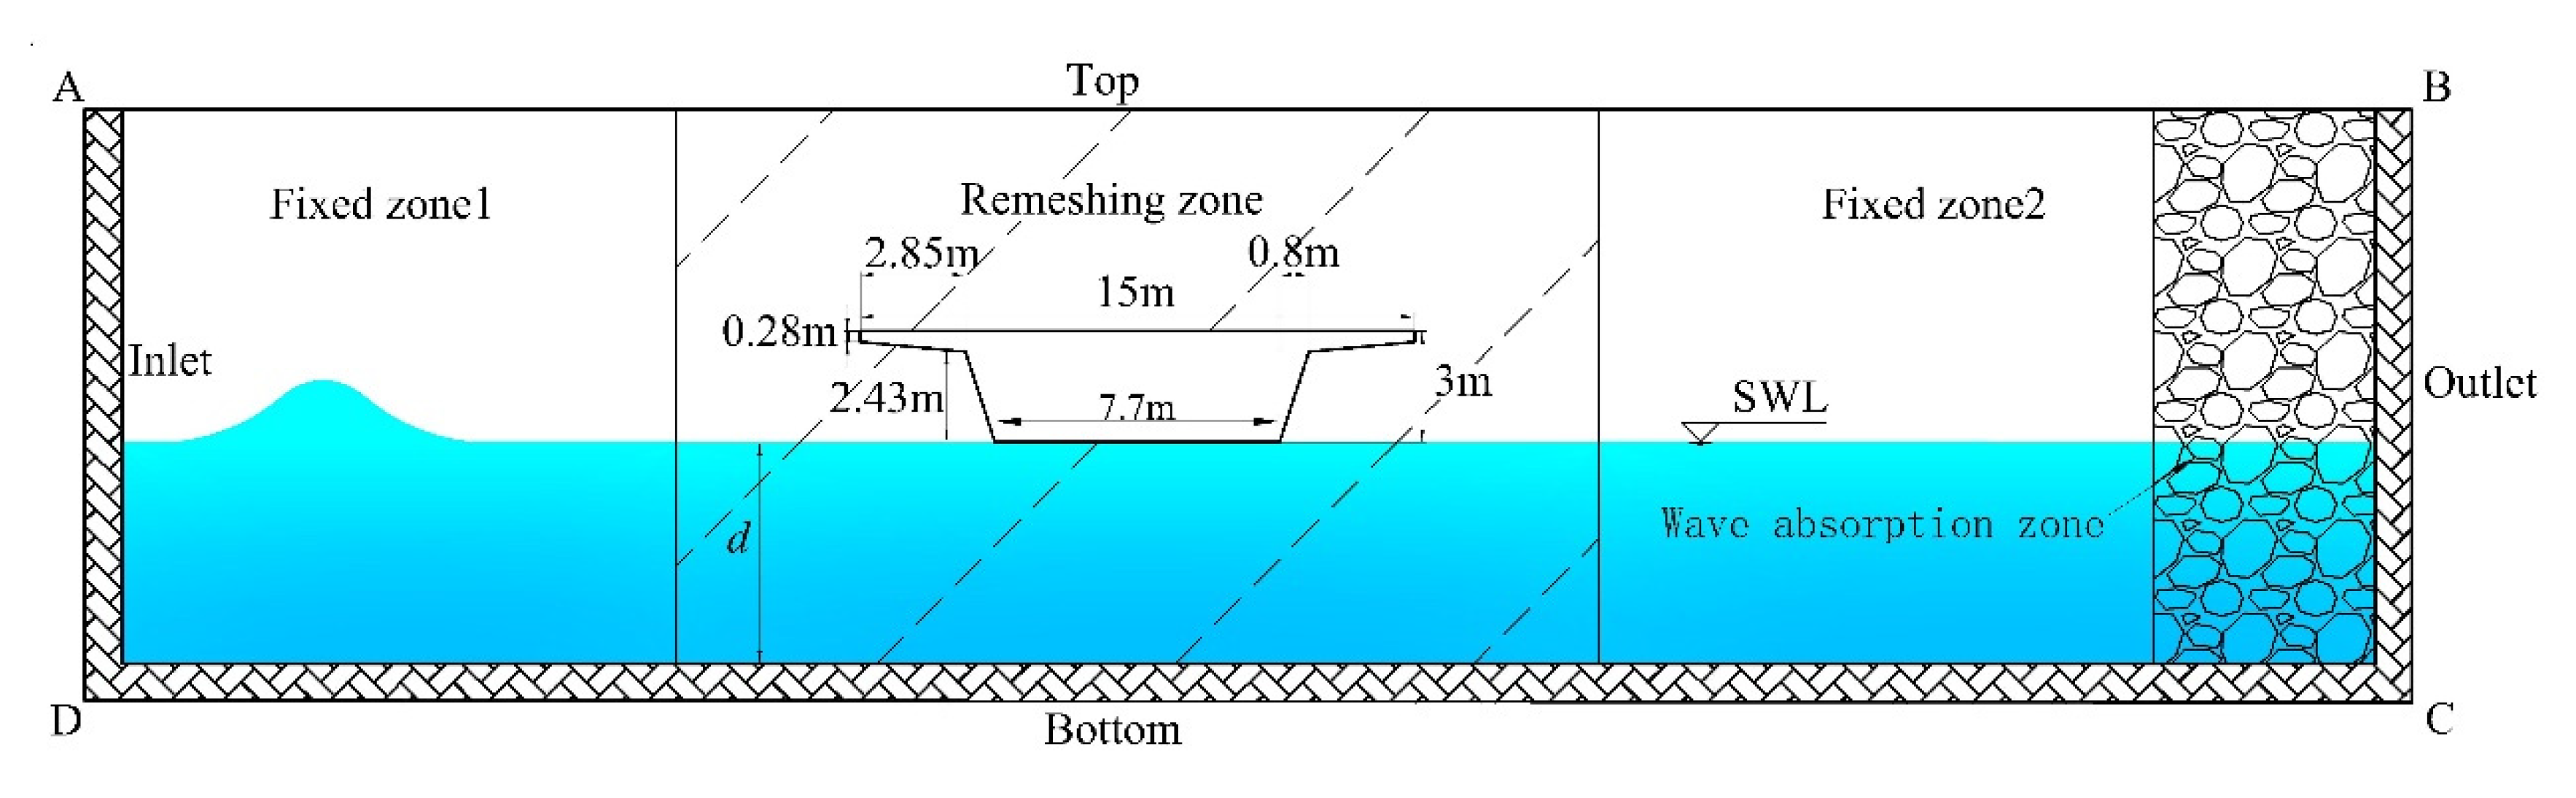
The mesh around the box-girder superstructure may be deformed or even become negative volume due to the lateral vibration of the box-girder superstructure, which will cause a poor-quality mesh and affect the accuracy of the calculation results. A dynamic mesh updating technique based on the mesh layering method in FLUENT is used by Xu and Cai [33,36], which effectively maintains the high quality of the mesh around the bridge superstructure. This method is also used in this study, as shown in Figure 2. The computational domain is divided into four zones: Fixed zone1, Fixed zone2, Remeshing zone and Wave absorption zone. In the Fixed zones, the mesh remains the same as its original mesh throughout the calculation process. The Remeshing zone forms a rigid body with the mass–spring–damper system and vibrates with the vibration of the bridge superstructure. The line AD is the velocity inlet. The boundary AB and BC is the pressure outlet, and the boundary CD is the no-slip stationary wall boundary. The setting for the laying mesh method is to select a height-based method with a split factor of 0.4 and a collapse factor of 0.2. A UDF, consisting of the Newmark-β method, the macros of Compute_Force_And_Moment and the macros of DEFINE_CG_MOTION, is used to realize a dynamic mesh update. The integral form of the conservation equation for dynamic mesh vibration is as follows:
where ρ is the fluid density, c is the flow velocity vector, and is the mesh moving velocity. Γ is the diffusion coefficient, is the source term of ϕ, and is the boundary representing the control volume, V.
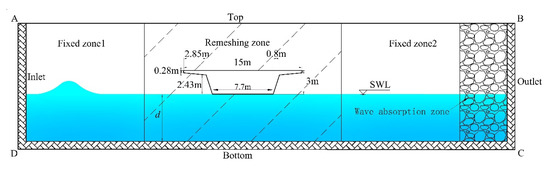
Figure 2.
The computational domain and bridge model.
3. Numerical Simulation Verification
3.1. Verification of the Wave Forces on a Fixed Box-Girder Superstructure
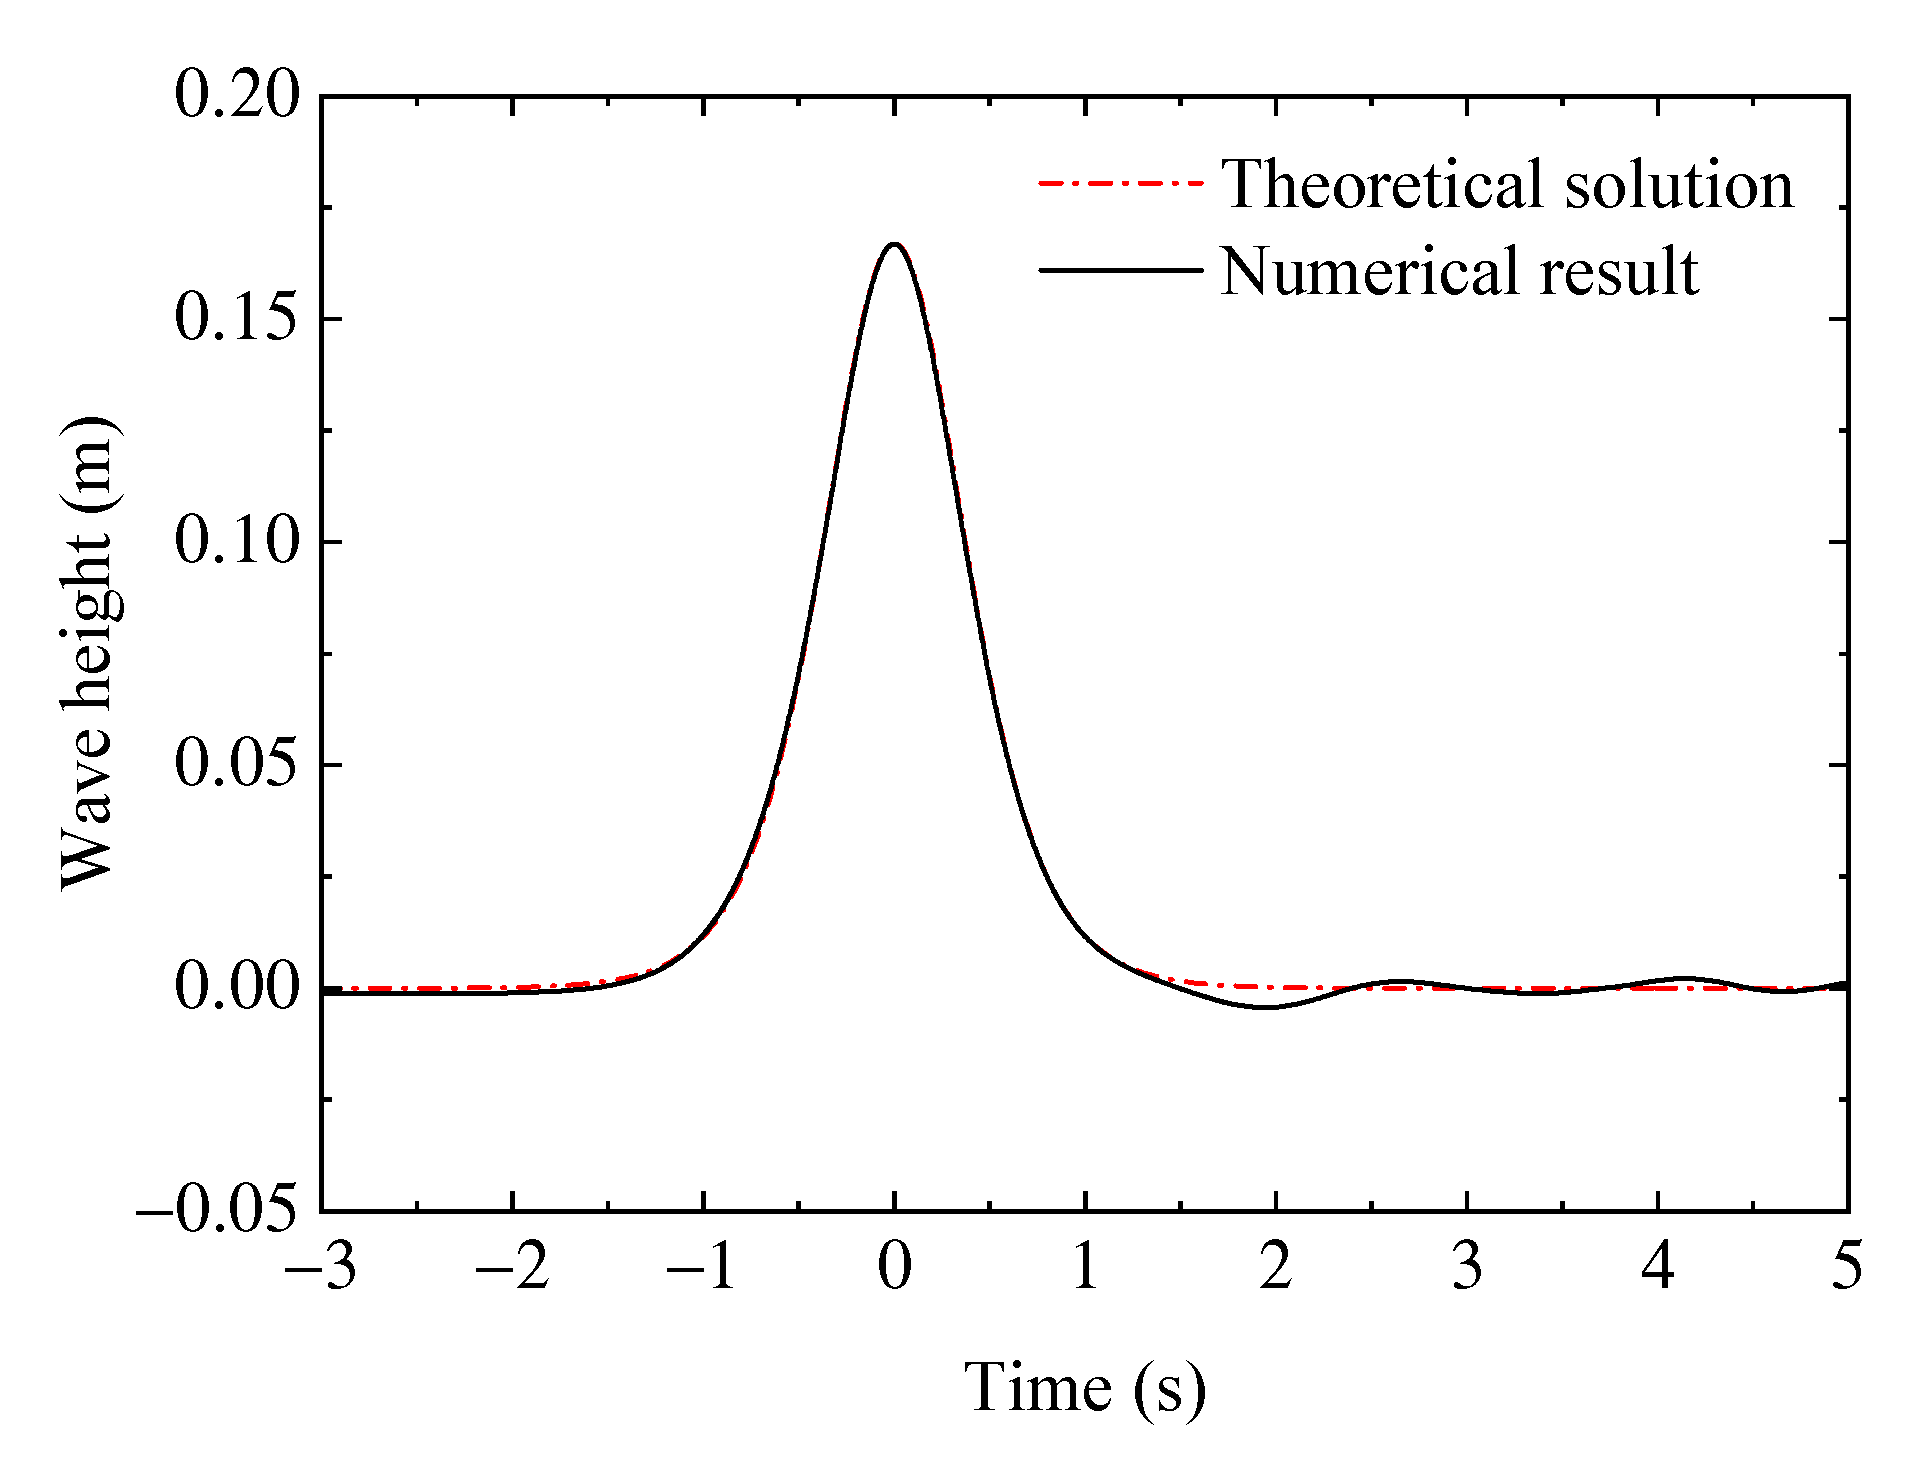
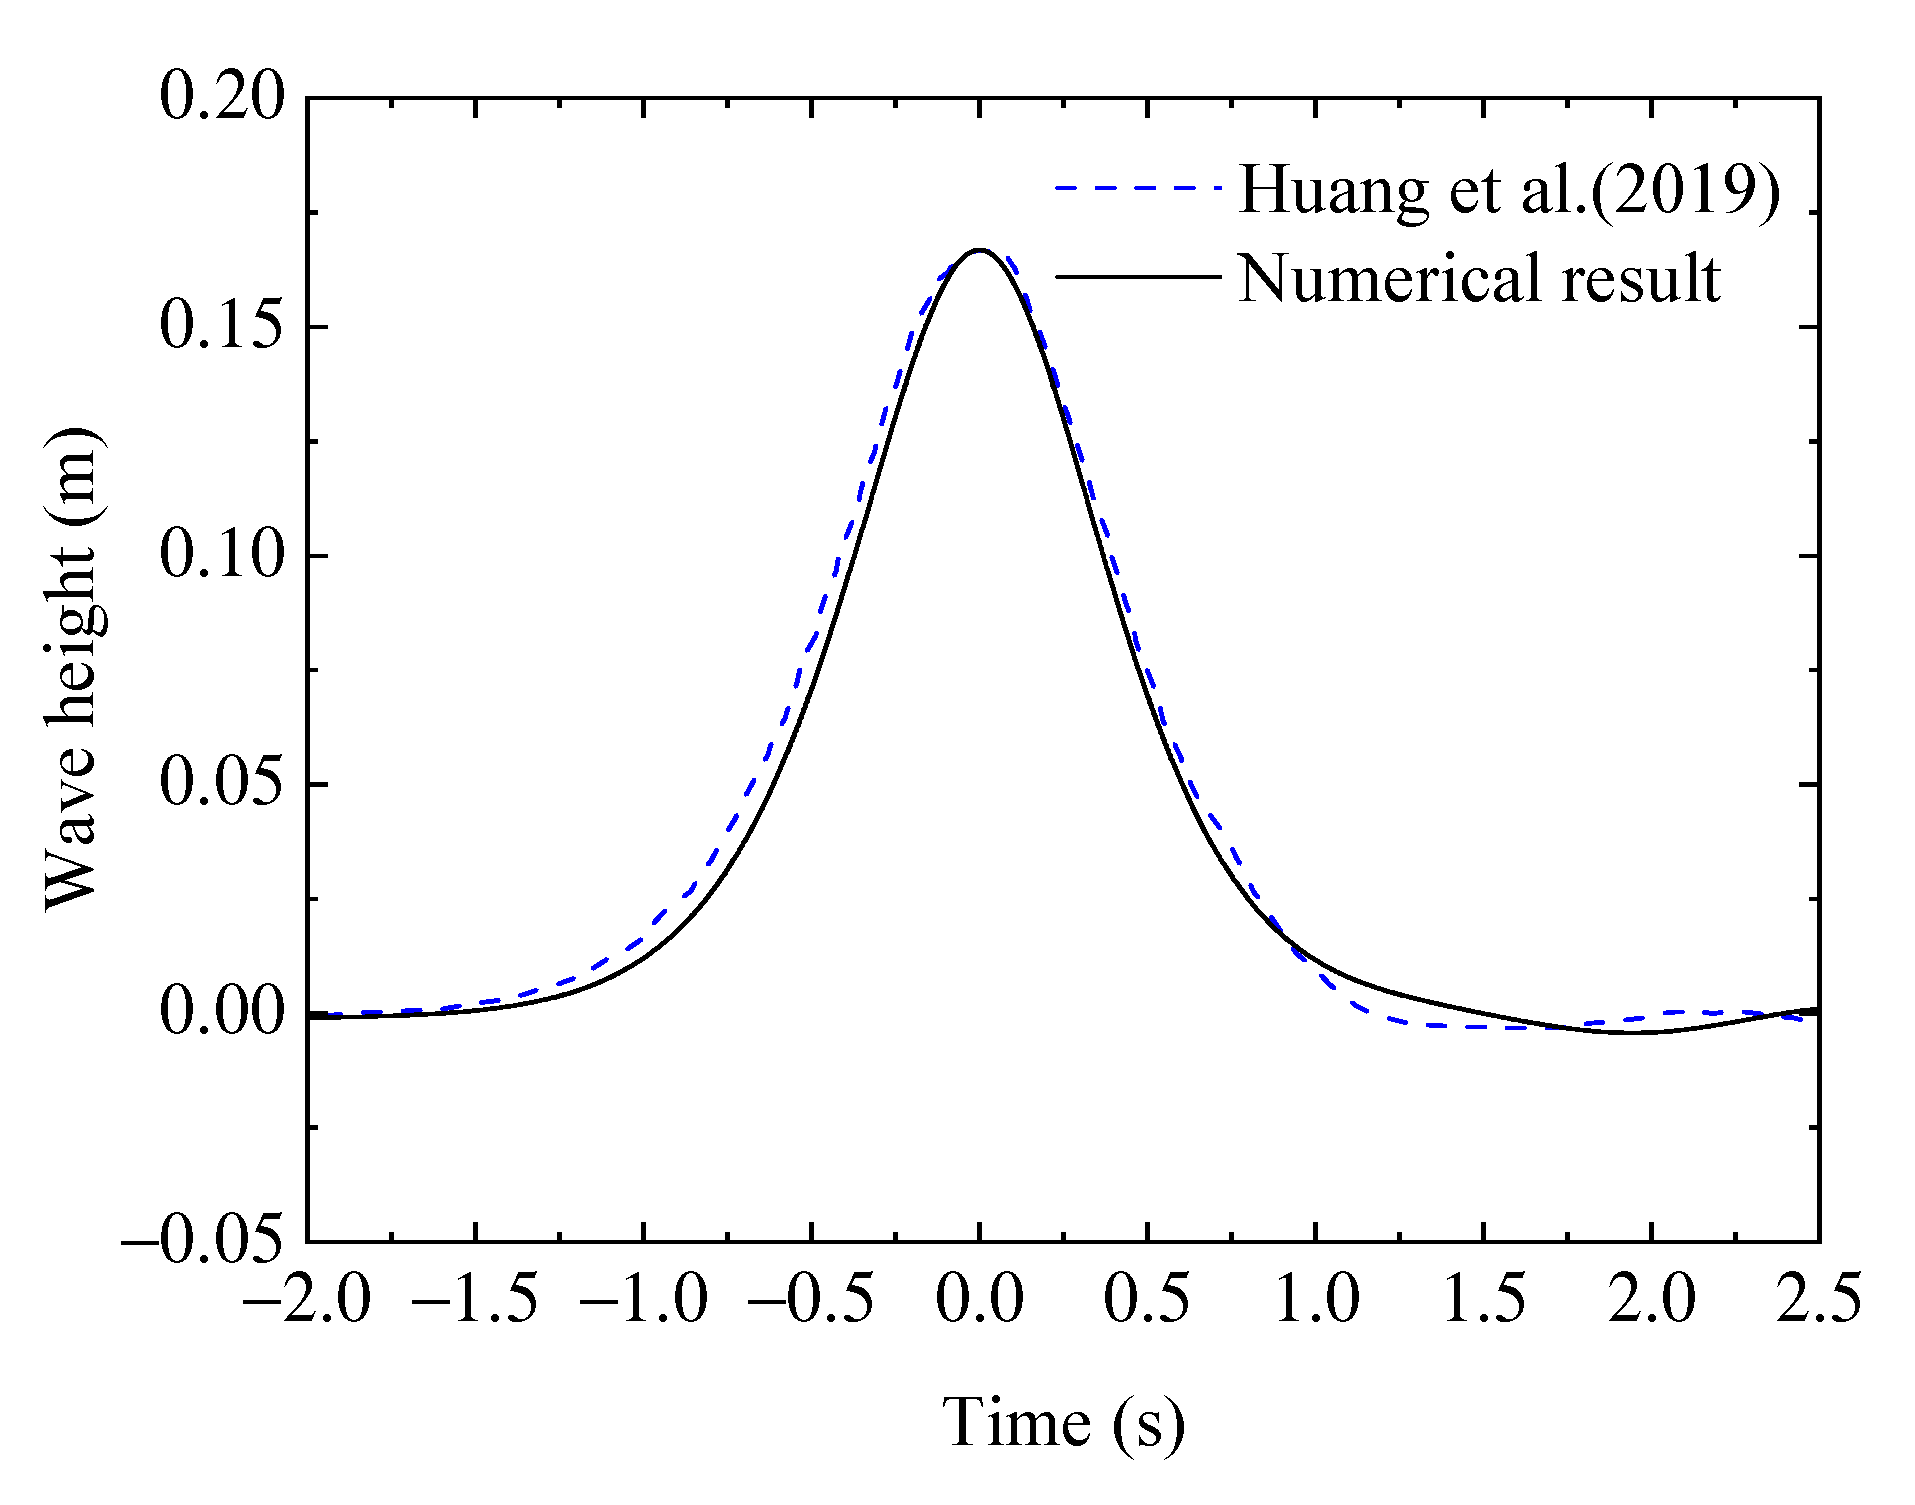
The reliability of the proposed numerical model is verified by comparing the numerical results with the experimental results of Huang et al. [45]. This experiment studied the wave forces on a selected box-girder superstructure located in the Haitan Strait of the East China Sea with a scale of 1:30 experimental test at Southwest Jiaotong University’s Deep-Water Long-Span Bridge Laboratory. The parameters of the box-girder superstructure and the wave properties are shown in Table 1. A computational domain of 20 m in length and 1.3 m in height is used for wave generation and the interaction between box-girder superstructure and solitary waves. The box-girder superstructure is 5 m away from the inlet boundary. The submersion coefficient of the bridge Cs = 0, i.e., the bottom of the box-girder superstructure is at the same elevation as the SWL, where Cs = , S is the distance from the SWL to the bottom of the box-girder which is positive along the positive y-axis, and is the height of the box-girder superstructure. The solitary wave with a wave height of 0.167 m is used as the incident wave, and the water depth is 0.623 m. The original position of the solitary wave crest is 5 m away from the inlet boundary before entering the computational domain, which ensures that the solitary wave surface profile is fully developed before reaching the box-girder superstructure. The comparison between the numerical simulation result and the theoretical solution result of the solitary wave surface profile is shown in Figure 3. The comparison between the numerical simulation result and the experimental result of the solitary wave surface profile near the structure is shown in Figure 4. It can be seen from Figure 3 and Figure 4 that the solitary wave surface profile of the numerical simulation agrees well with the theoretical solution and the experimental result. The reliability of the wave generation method is verified.

Table 1.
The parameters of the girder model and wave used in the study of Huang et al. [45].
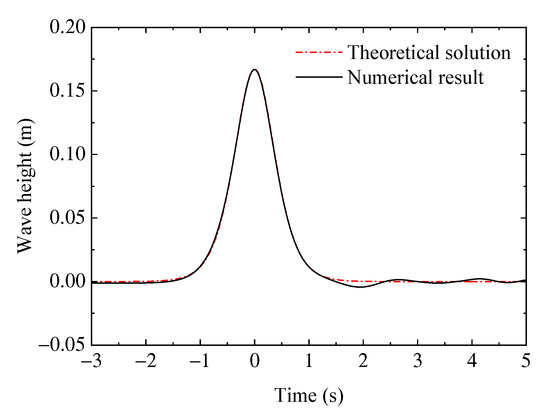
Figure 3.
Comparison of numerical simulation and theoretical wave profiles of the solitary wave.
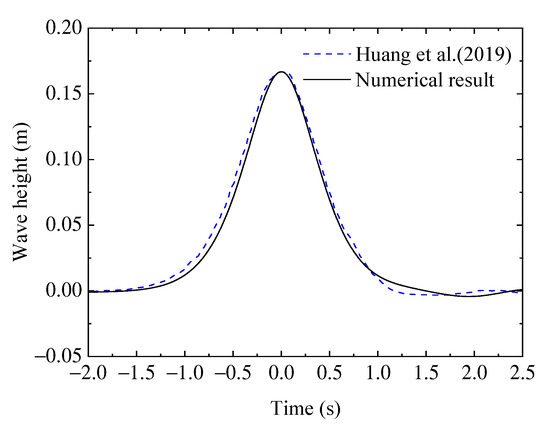
Figure 4.
Comparison of the wave profile between the numerical result of current study and the experimental result of Huang et al. [45].
The mesh resolution near the bridge superstructure has an important influence in the process of the interaction between the bridge superstructure and solitary waves. A mesh encryption method near the bridge superstructure is often used to accurately capture the characteristics of the interactions between the bridge superstructure and waves. The SST k-ω model in FLUENT discussed above is used here, and Bredberg [48] and Xiong et al. [49] proposed that the accuracy required for bridge engineering can be achieved by ensuring that y+ is in the range from 11.6 to 300, where the function of y+ is to calculate the height of the first grid cell along the wall. The y+ is about 45 in the current numerical simulation, which satisfies the accuracy requirement of the near-wall region. The gird resolutions are set as: dy = 0.04 m, 0.01 m and 0.04 m for the air zone, the zone near the water surface, and the deep-water zone, respectively; and dx = 0.02 m, 0.015 m and 0.03 m for the near inlet boundary zone, the near bridge superstructure zone, and the far from the bridge superstructure zone. The time step dt = 0.003 s is used in the current numerical simulation for satisfying the courant number.
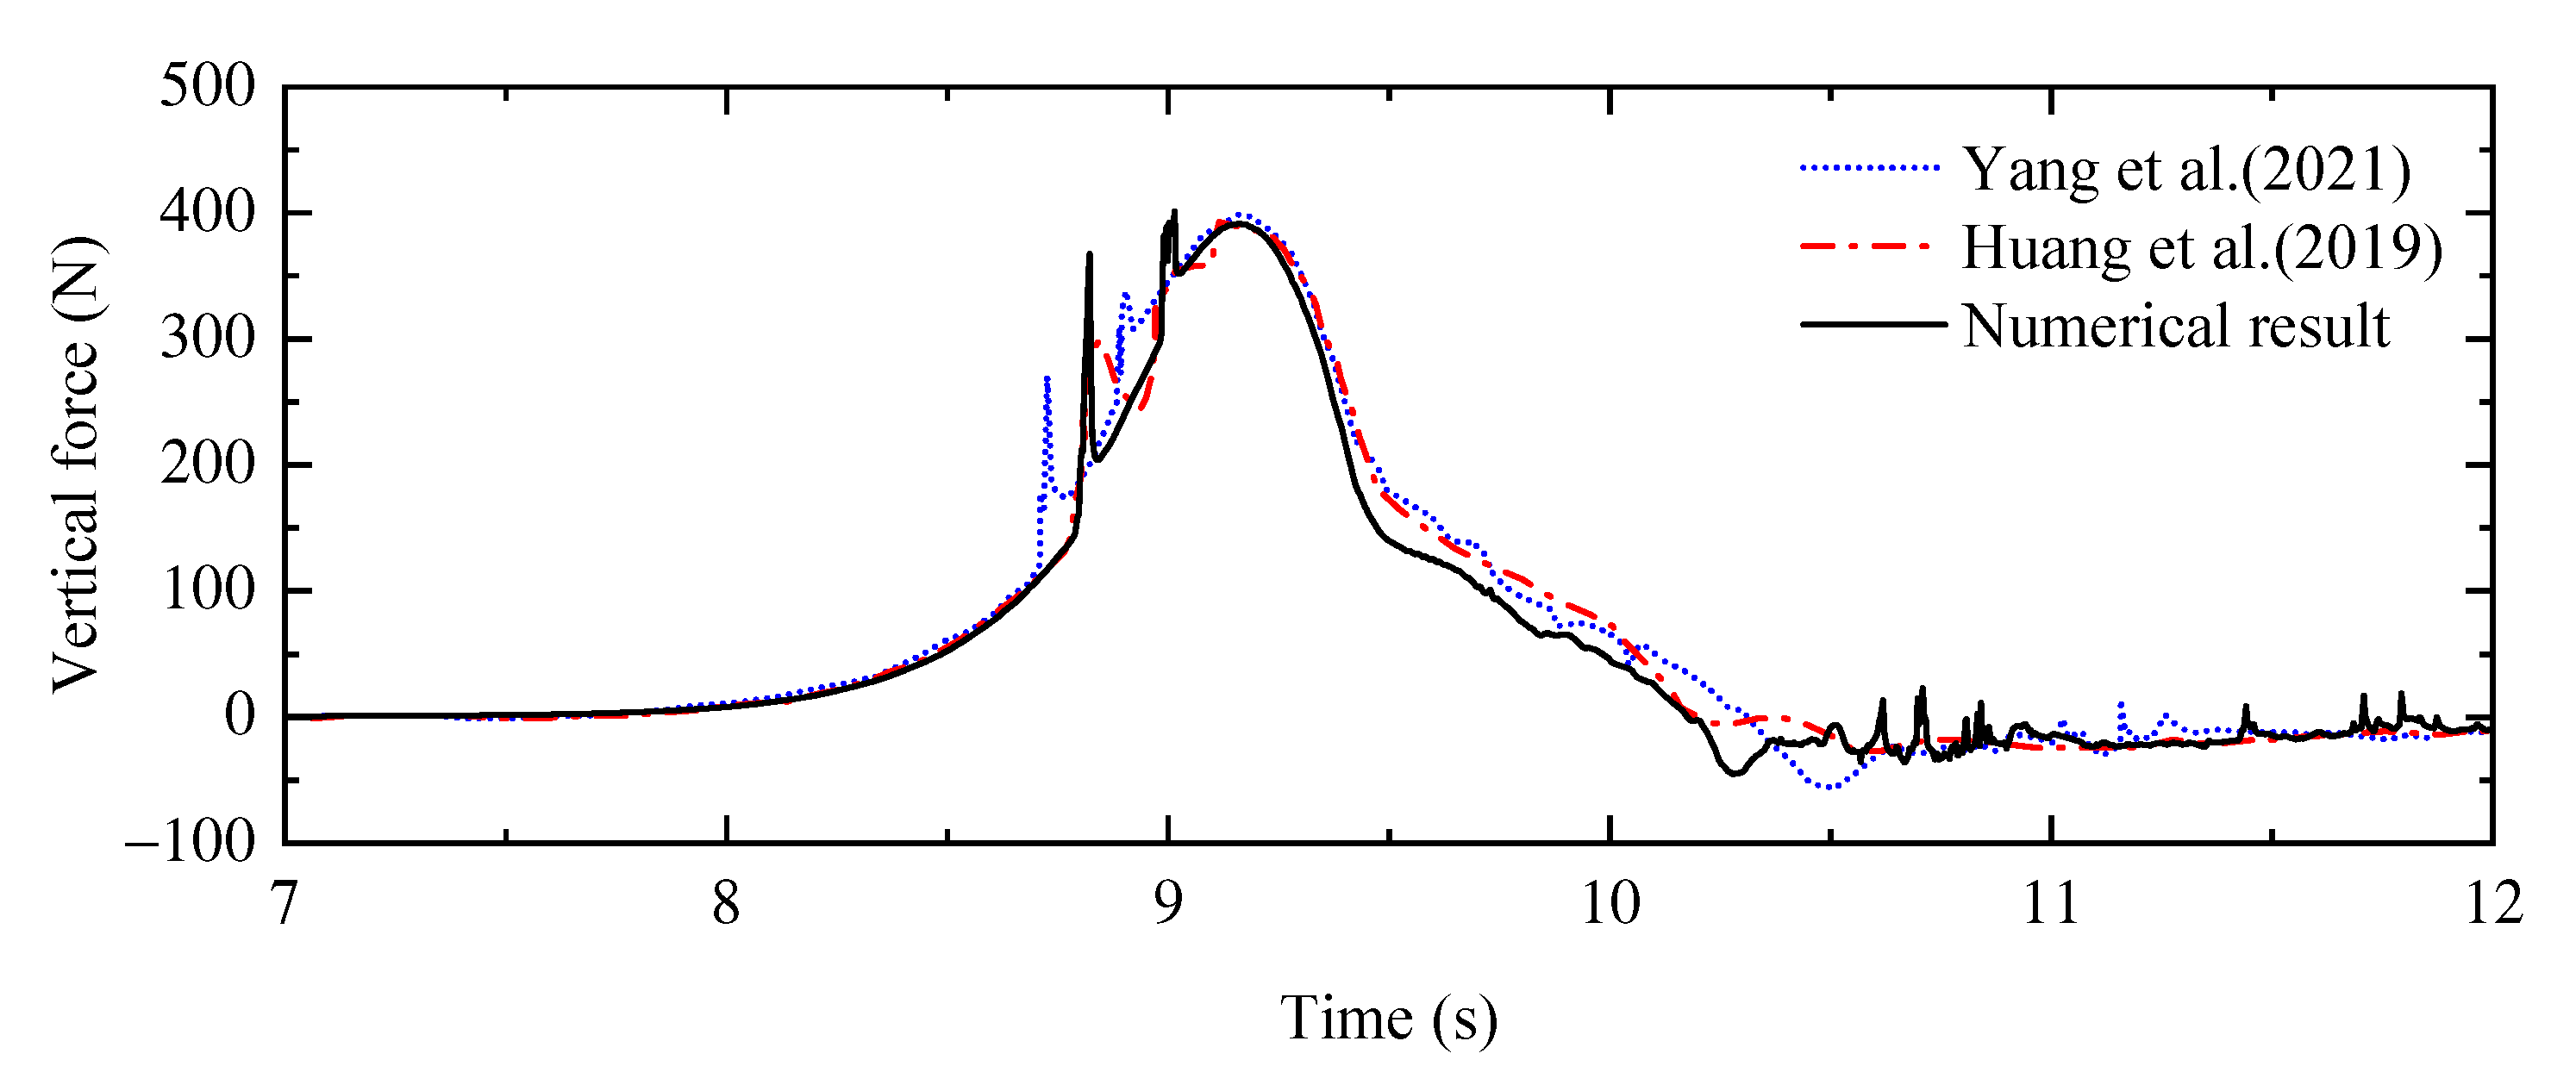
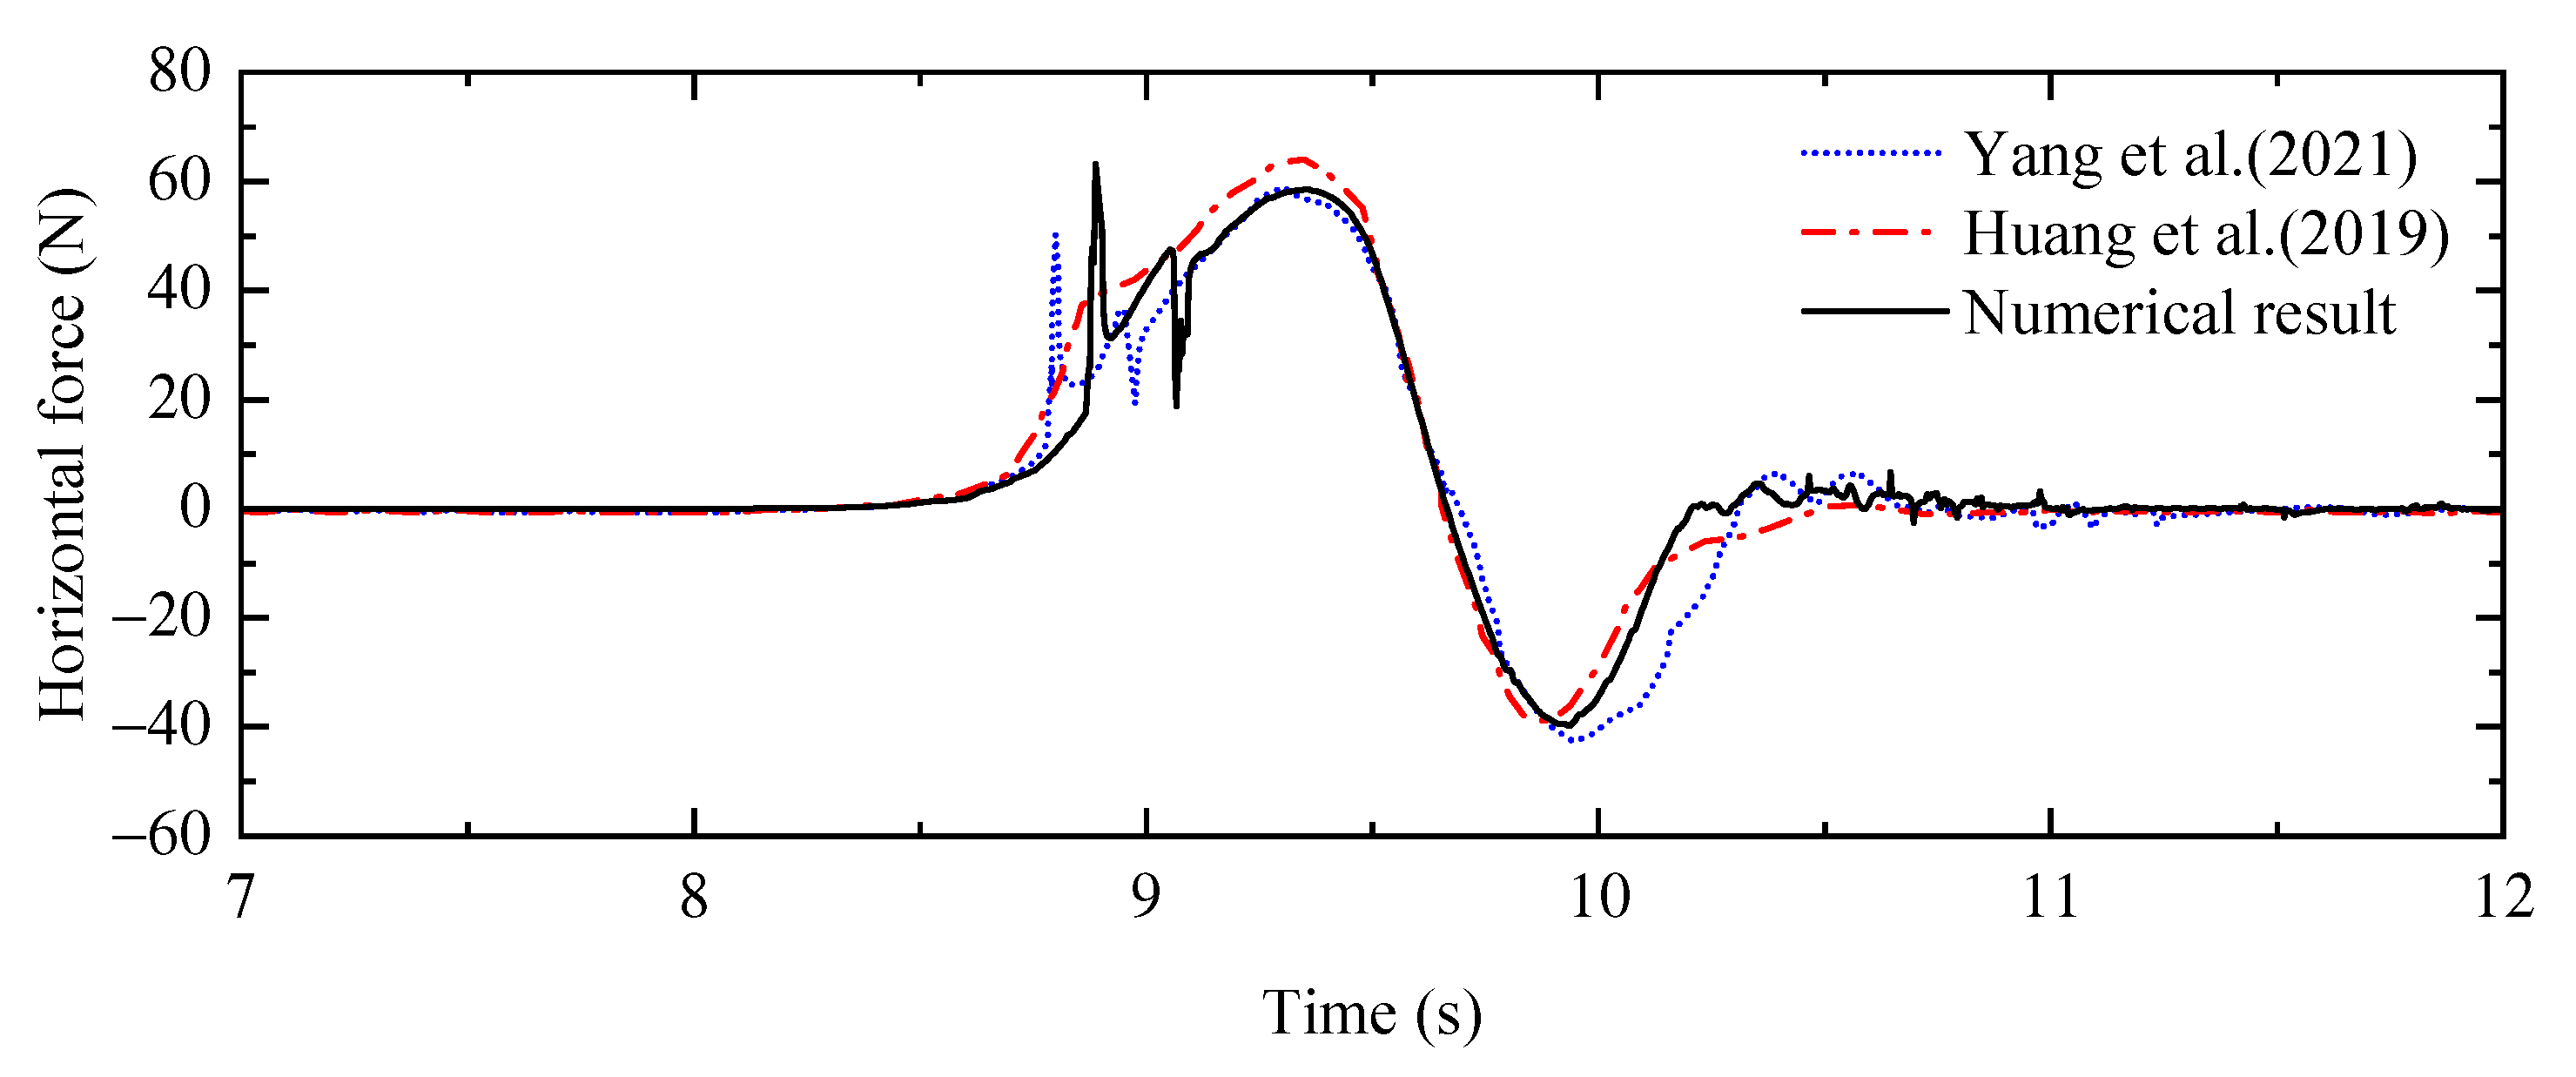
The vertical and horizontal forces on the box-girder superstructure of the current simulation are compared with the experimental results by Huang et al. [45] and the numerical simulation results of Yang et al. [50]. The comparison of the vertical force and horizontal force is shown in Figure 5 and Figure 6, respectively. It can be seen from Figure 5 that the numerical vertical force of the proposed numerical model is in good agreement with the experimental vertical force by Huang et al. [45] and the numerical vertical force of Yang et al. [50]. As shown in Figure 6, the numerical horizontal force of the proposed numerical model agrees well with the numerical results of Yang et al. [50]. It may be due to the influence of the 3D model tested in the laboratory that there is a slight difference in the maximum horizontal force between the two numerical simulation results and the experimental results. In general, the numerical results of method utilized in the present study agree well with the results of Huang et al. [45] and Yang et al. [50], indicating that the proposed numerical model is reliable in capturing the wave force on box-girder superstructures.
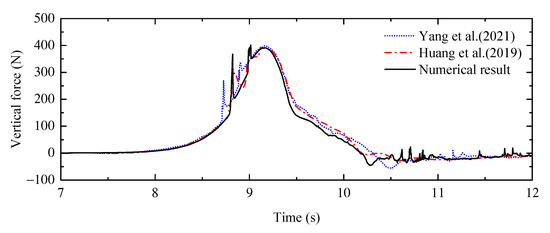
Figure 5.
Comparison of the vertical force between the numerical result of current study, the experimental result of Huang et al. [45] and the numerical result of Yang et al. [50].

Figure 6.
Comparison of horizontal force between the numerical result, the experimental result of Huang et al. [45] and the numerical result of Yang et al. [50].
3.2. Verification of the Mass–Spring–Damper System with a Movable T-Girder Superstructure
The reliability of the mass–spring–damper system is verified by numerical simulation. First, the proposed numerical model based on the numerical model by Xu and Cai [36] is established, and then its corresponding numerical simulation results are compared. The wave forces on the movable T-girder superstructure under the action of the solitary wave are simulated by the proposed numerical model. The numerical computational domain is 130 m in length and 13 m in height, in which the water is 7.2 m in depth and the wave height is 2.2 m. The T-girder superstructure consists of six AASHTO Type III girders which are simplified to a rectangle and decks, and it is 50 m from the inlet boundary and the submersion coefficient of the T-girder superstructure is −0.5. The parameters of the T-girder superstructure and the wave properties are shown in Table 2. The wave height, the water depth and the lateral restraining stiffnesses, as well as their corresponding structural vibration periods and damping coefficient, are considered in this simulation model as shown in Table 2 and Table 3.
Table 2.
The parameters of the girder model and wave used in the study of Xu and Cai [36].
Table 3.
The parameters of the mass–spring–damper system of Xu and Cai [36].
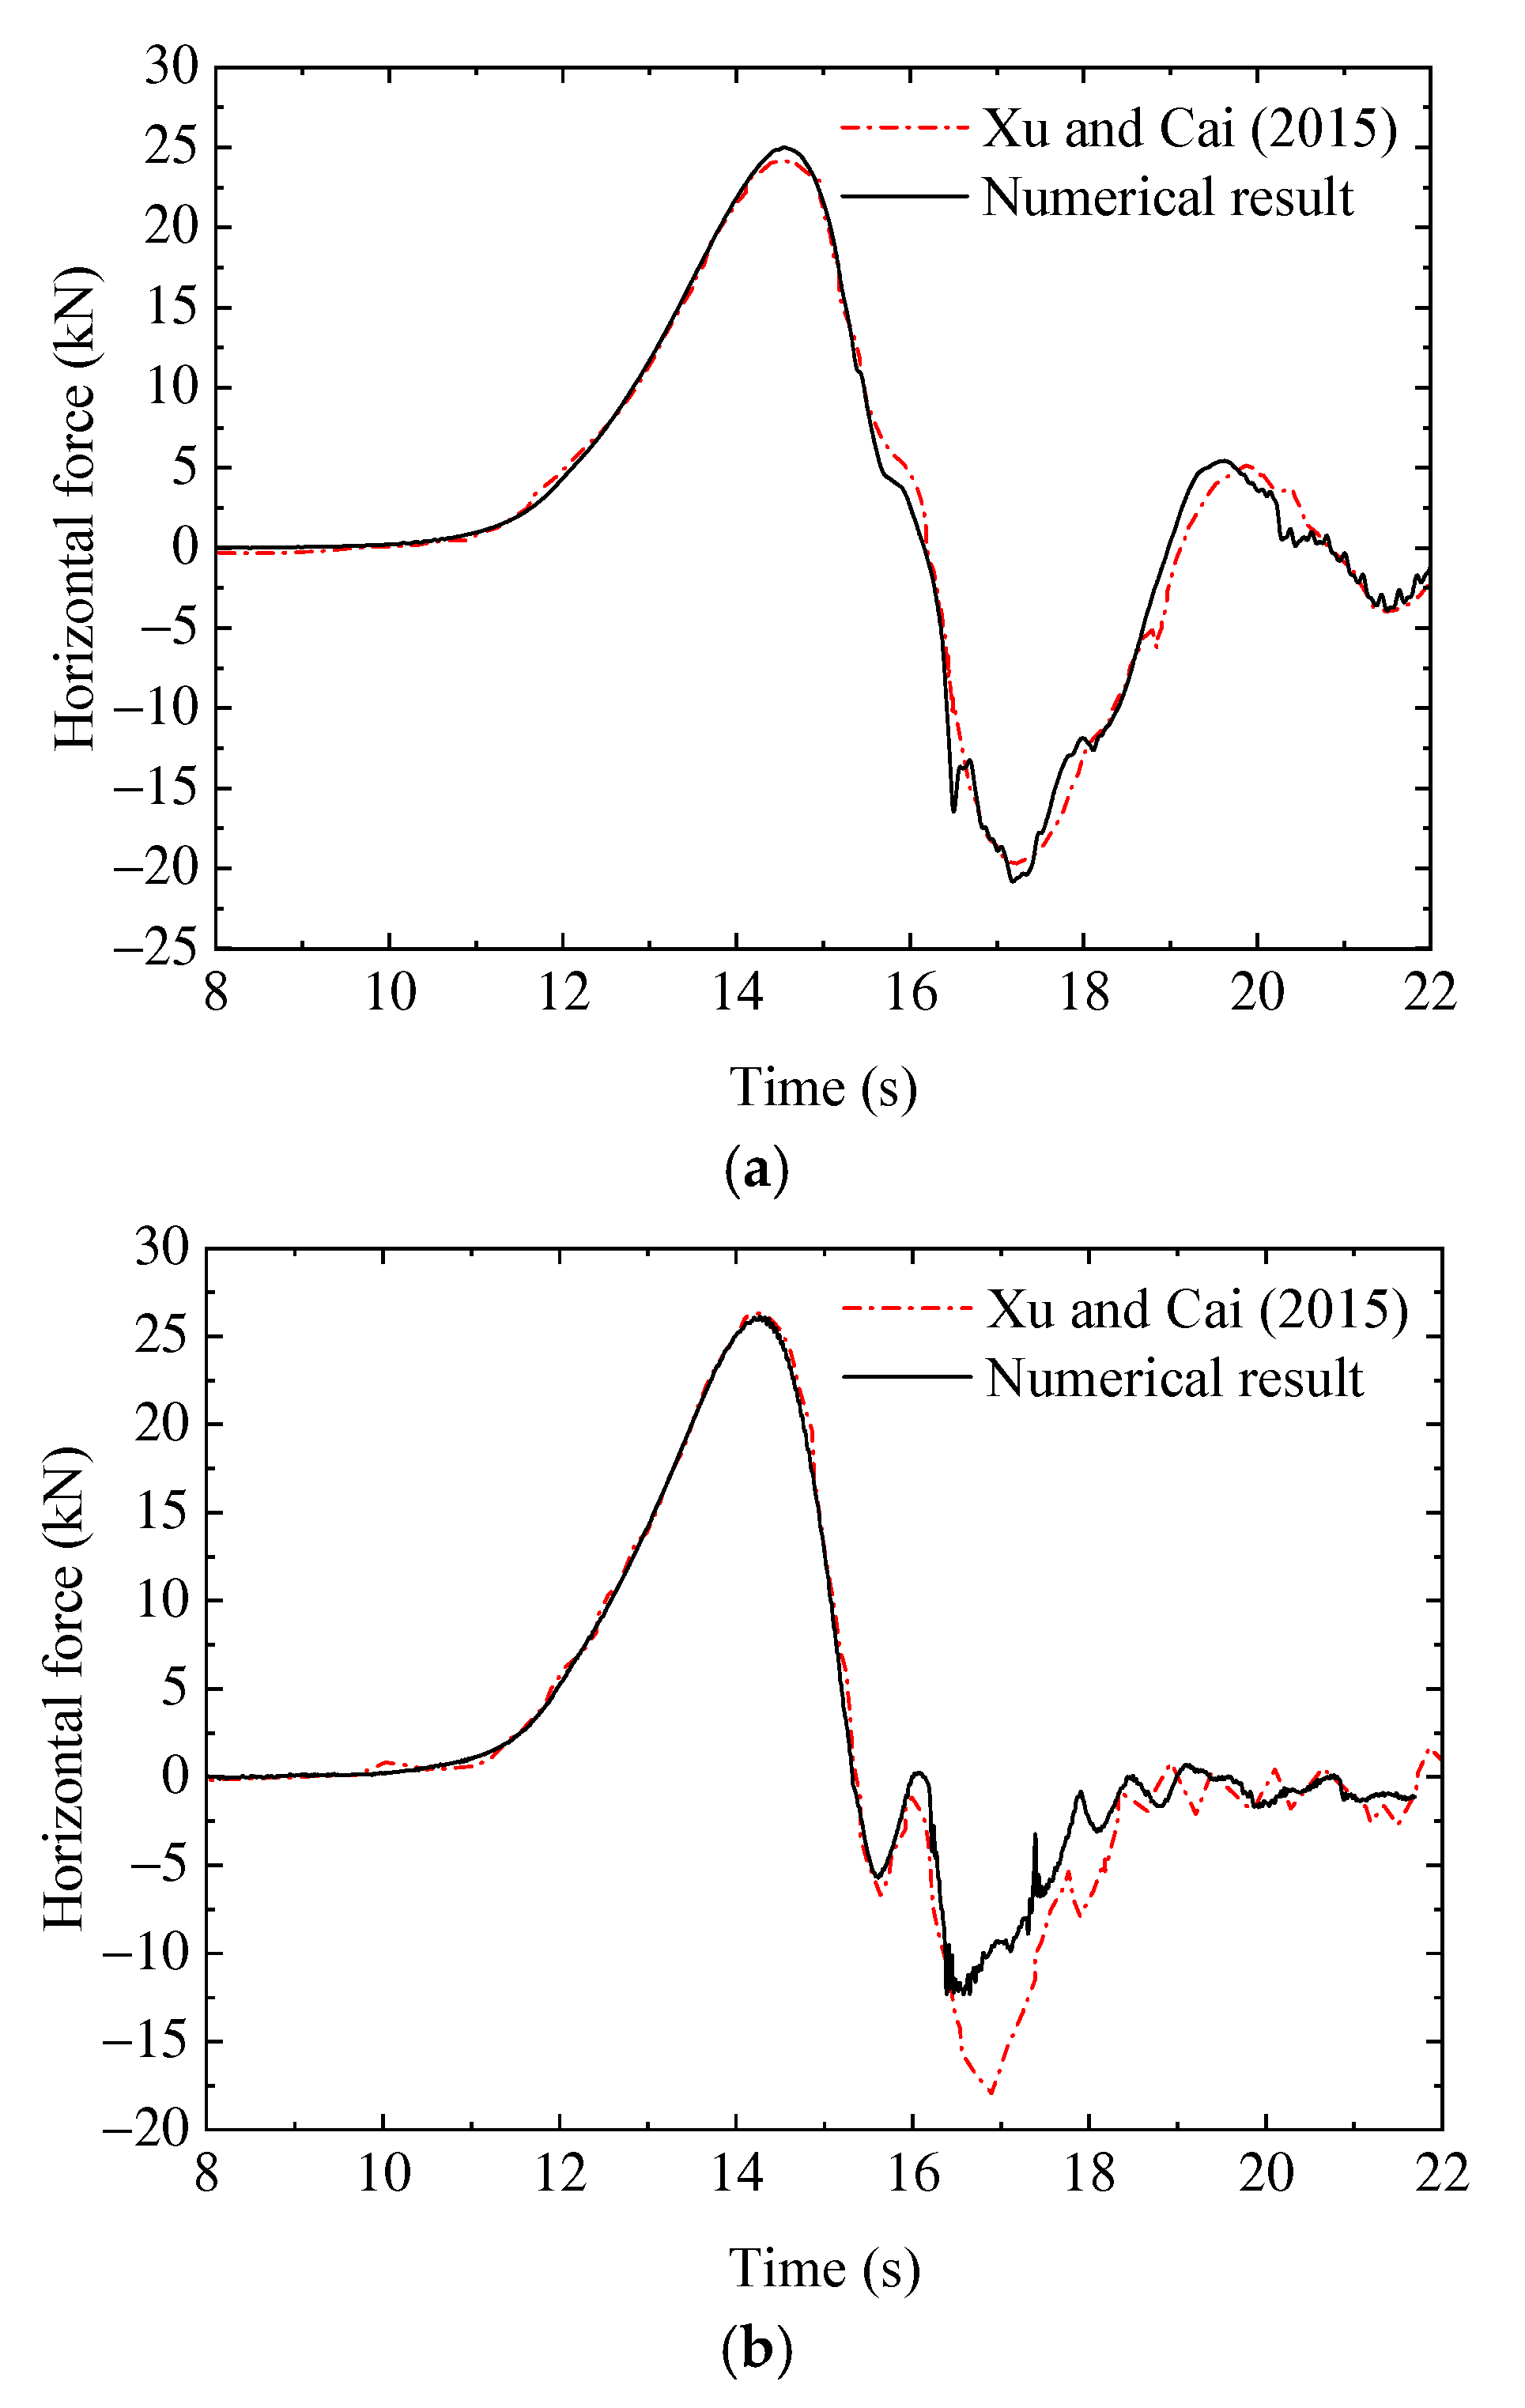
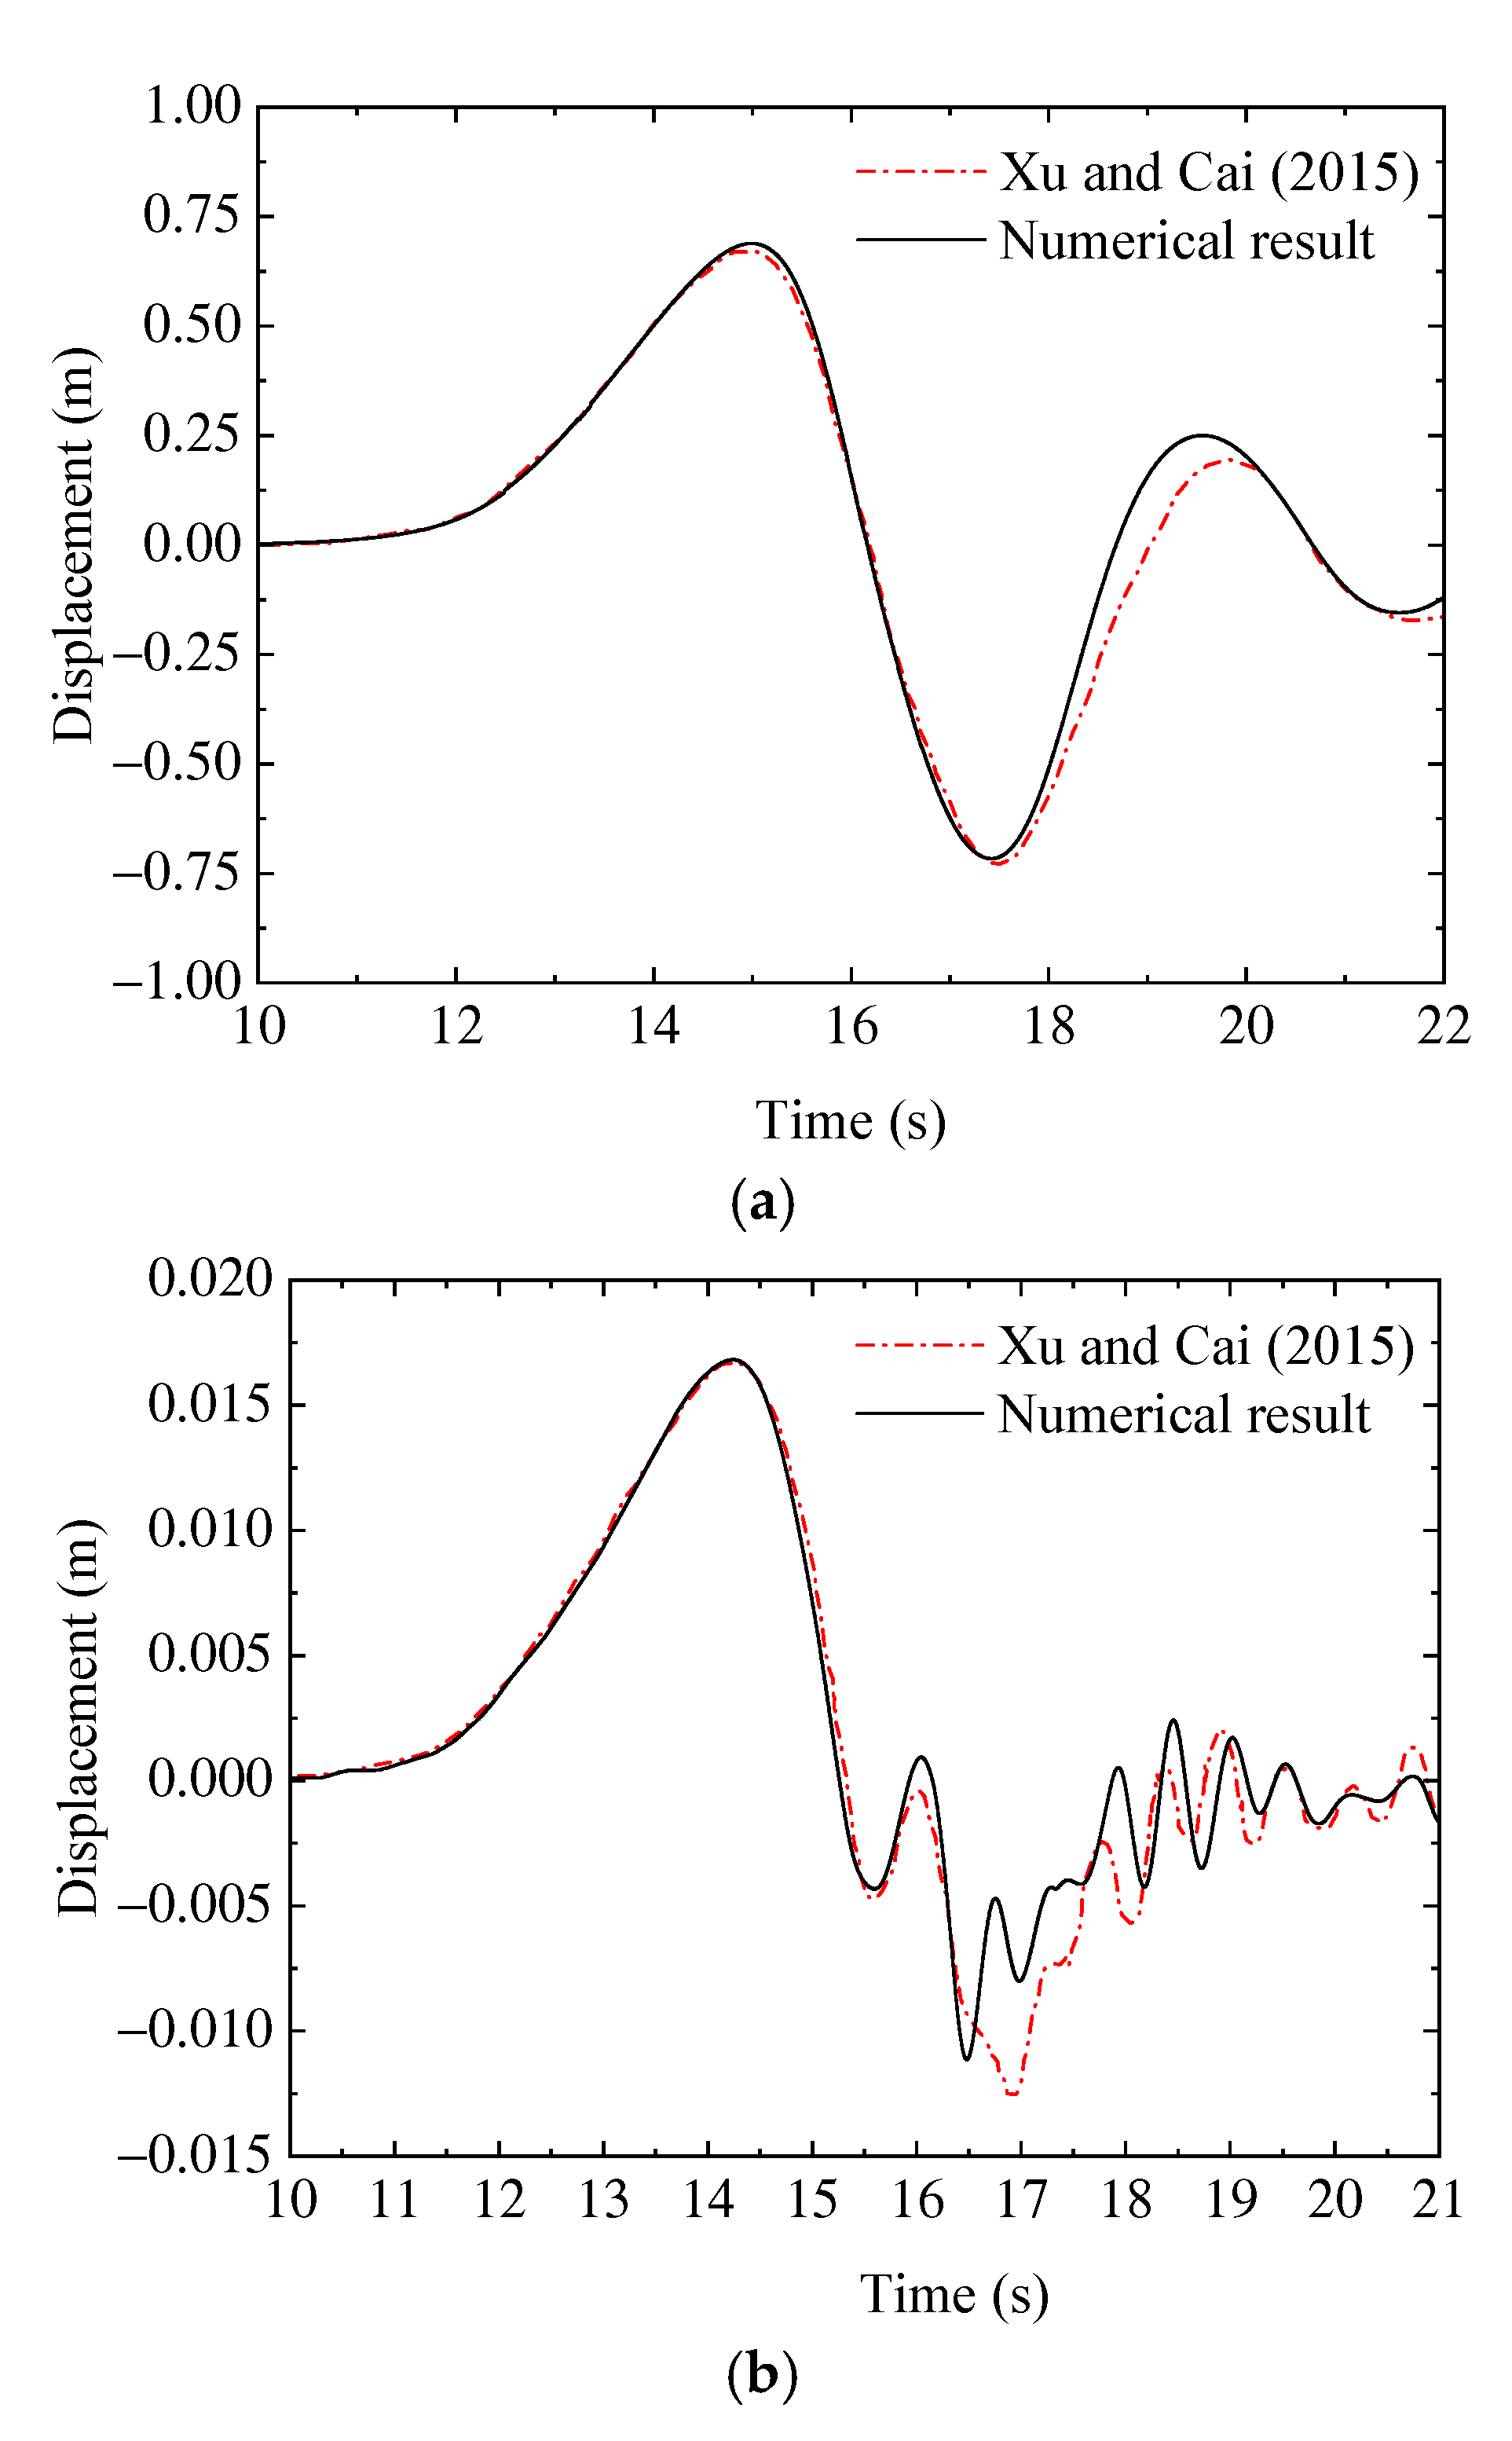
The y+ is about 30 in the numerical simulation, and the gird resolutions are set as: dy = 0.2 m, 0.1 m, 0.033 m and 0.2 m for the air zone, the zone near the wave surface profile, the zone near the wall and the deep-water zone, respectively; dx = 0.2 m, 0.15 m, 0.05 m and 0.3 m for the near inlet boundary zone, the zone close to the near-wall zone, the near-wall zone and the far from the wall zone, respectively. The time step dt = 0.003 s is used in the current numerical simulation. The numerical horizontal force and the displacement of K43 and K1534 are compared with those of Xu and Cai [36] as shown in Figure 7 and Figure 8. Overall, the horizontal force and structural displacement predicted by the current model are in good agreement with the numerical results of Xu and Cai [36].
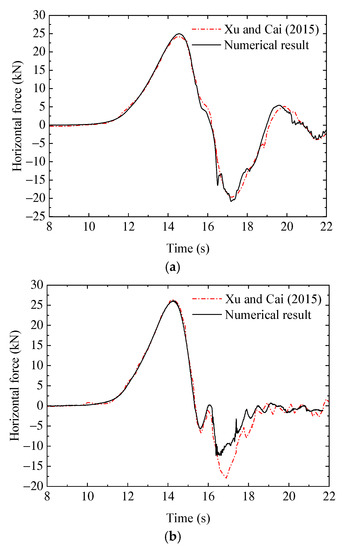
Figure 7.
Comparisons of the horizontal force between the numerical result of current study and the numerical result of Xu and Cai [36]. (a) K43; (b) K1534.
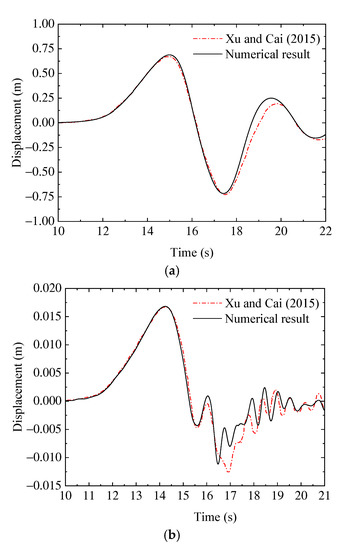
Figure 8.
Comparisons of the vertical force between the numerical result of current study and the numerical result of Xu and Cai [36]. (a) K43; (b) K1534.
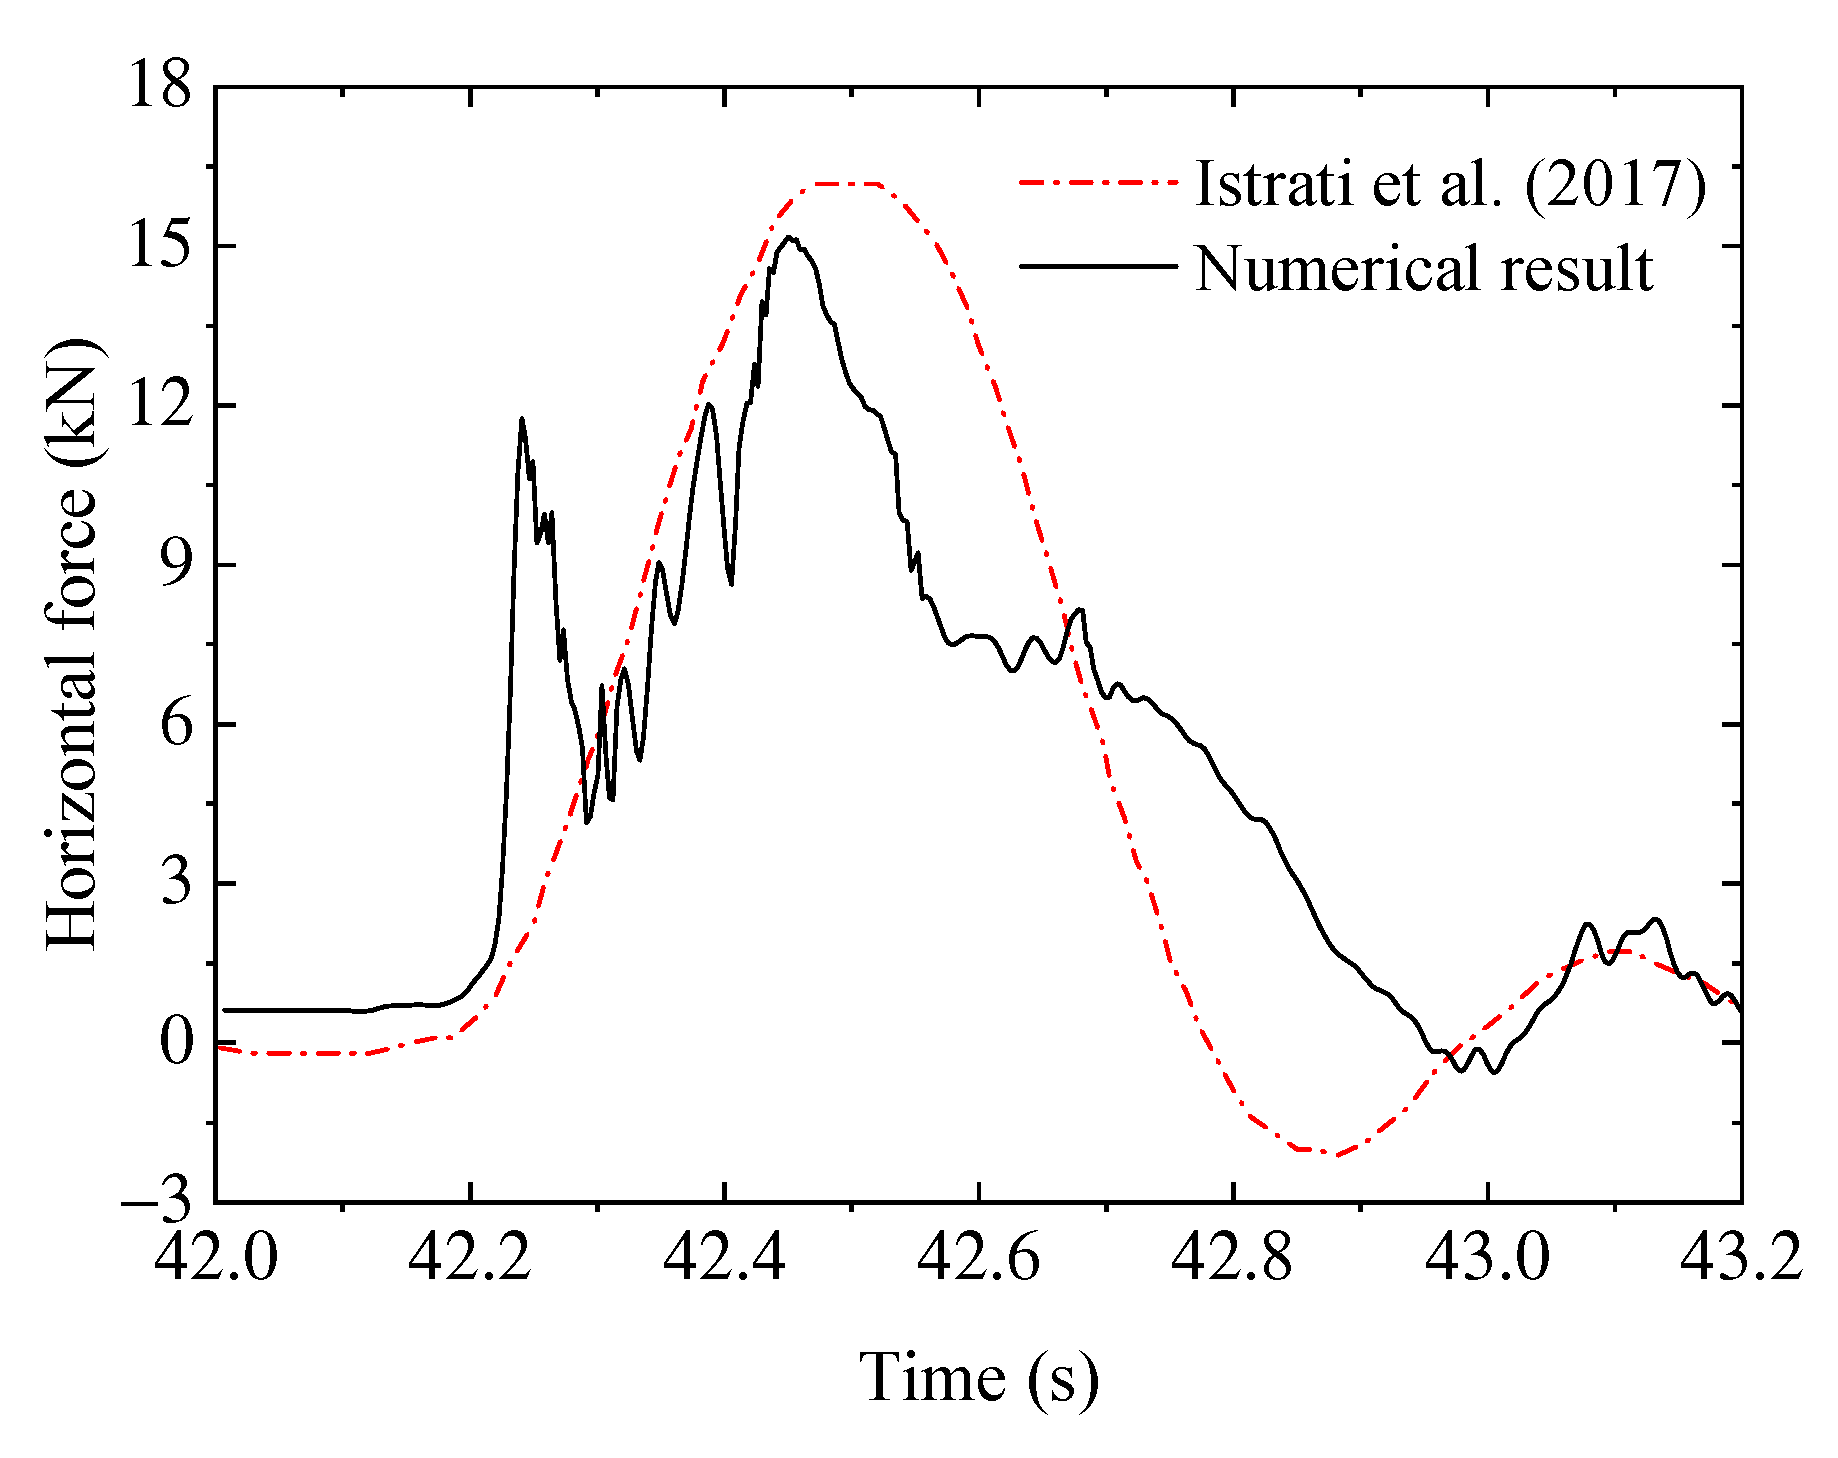
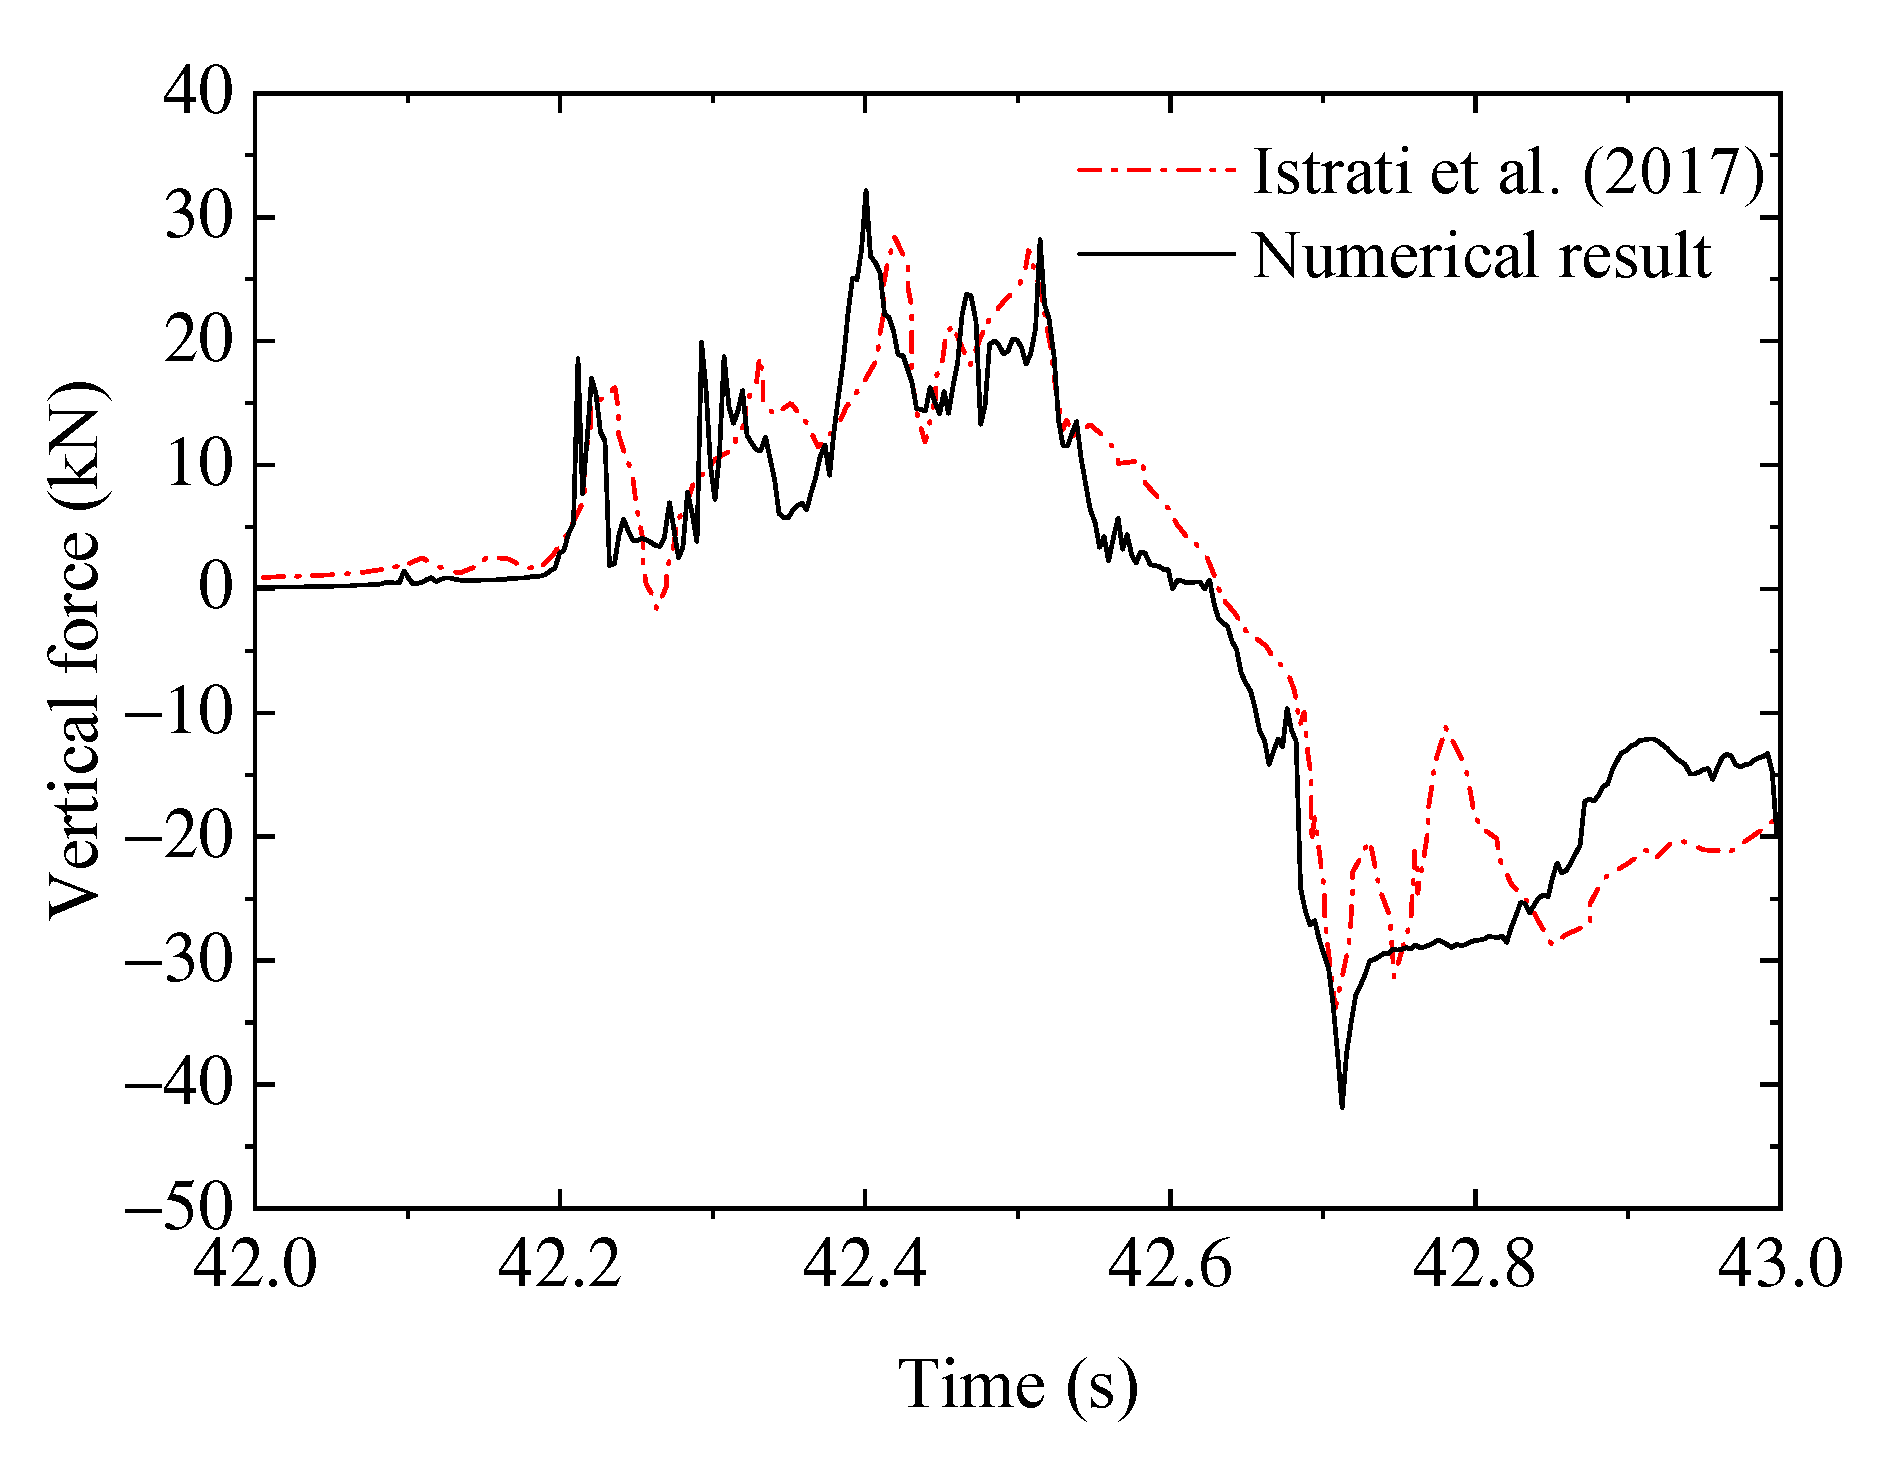
Then, to further verify the reliability of the proposed numerical model, a numerical model based on the experiment conducted by Istrati [38] is established. The experiment studied the wave forces on a representative coastal bridge with open girders with a scale of 1:5 experimental test at Oregon State University, and a composite bridge model with four I-girders is selected in their experimental test. The numerical computational domain is 59.6 m in length and 4 m in height, in which the water is 2.0 m in depth and the solitary wave height is 0.7 m. The gird resolutions are set as: dy = 0.04 m, 0.01 m and 0.04 m for the air zone, the zone close to the near-wall zone and the deep-water zone, respectively; dx = 0.04 m, 0.015 m and 0.04 m for the near inlet boundary zone, the near bridge superstructure zone and the far from the bridge superstructure zone. The time step dt = 0.003 s is used in the current numerical simulation to satisfy the courant number. A lateral restraining stiffness equivalent to a medium spring with a spring stiffness of 458 kN/m in Istrati [38] (i.e., a lateral restraining stiffness of 132.75 kN/m) is used in the current simulation model to realize the vibration of the I-girder superstructure under wave action. The comparison of horizontal and vertical wave forces between numerical results and experimental results are shown in Figure 9 and Figure 10, respectively. As shown in Figure 9, the error between the maximum of the numerical horizontal force and the experimental horizontal force is about 6.6%, which is within a reasonable range. And as shown in Figure 9 and Figure 10, the numerical horizontal and vertical force predicted by the current numerical model are different from the experimental results of Istrati [38] after 42.5 s. The reason may be due to the fact that the trapped air in the chambers between the two adjacent girders cannot escape in time due to the limitation of the two-dimensional numerical simulations. However, in the actual experimental tests, the trapped air in the chambers between the two adjacent girders can escape longitudinally along the I-girder superstructure, resulting in some differences between the numerical results and the experimental results. Overall, the numerical results and experimental results are in good agreement. It indicates that the mass–spring–damper system used in the proposed numerical model has a great capability to capture the general characteristics of the interaction between the bridge superstructure and wave. Therefore, this proposed numerical model can be used for other studies on the dynamic characteristic. In the following parametric study, this proposed numerical model is used to study the dynamic characteristics of the box-girder with different lateral restraining stiffnesses.
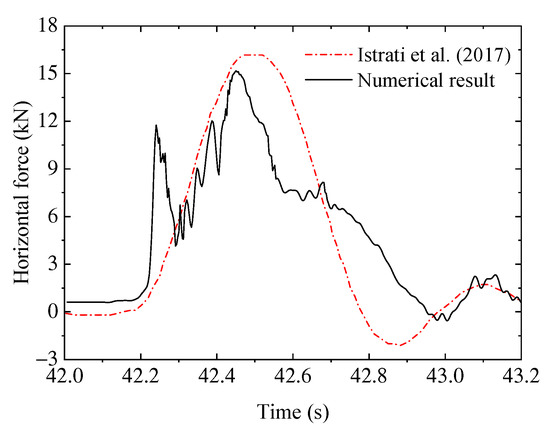
Figure 9.
Comparison of the horizontal force between the numerical result of current study and the experimental result of Istrati [38].
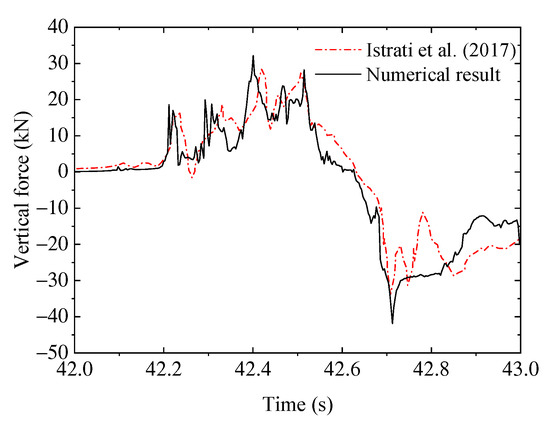
Figure 10.
Comparisons of the vertical force between the numerical result of current study and the experimental result of Istrati [38].
4. Parametric Study
A numerical model for the interaction of solitary waves and box-girder superstructure is established based on the typical bridges in the coastal areas of China, and the geometric parameters of the box-girder superstructure are shown in Table 4. Xiang and Istrati [28] in their recent investigation suggested that the structural dimensions of the bridge such as deck width can significantly affect the wave loads on the bridge. However, this study only focuses on the bridge dimension selected in this study, and the results of the study have limitations in terms of bridge dimension. In order to obtain deeper insight into the dynamic characteristics of the box-girder under the action of solitary waves, the submersion coefficients, the wave heights, and the lateral restraining stiffnesses are considered in the parametric study. This study is limited to simulating a single span bridge with a lateral flexibility corresponding to an existing bridge as done in Bradner et al. [15] and Lomonaco et al. [51]. Authoritative post-disaster investigation reports show that the wave height of tsunami generally ranges from 0 to 10 m [52,53,54]. The wave heights selected for this study in Table 4 are close to reality and roughly correspond to observations and measurements during the recent tsunami. In general, the density of concrete is always different in a certain range in actual construction. Ataei and Padgett [55] pointed out that the density of concrete is between 2211.3 kg/m³ and 2588.4 kg/m³. In this study, the density of concrete is taken as 2400 kg/m³. The cross-sectional area of the box-girder is 11 m², and the mass of the bridge can be calculated as 26,400 kg per unit length.
Table 4.
The parameters of the simulation model.
The numerical computational domain is 600 m in length and 40 m in height, and the water depth is 20 m. The computational domain is divided into three parts as described above, and the box-girder superstructure is located in the Remeshing zone and 200 m from the inlet boundary. The dimensions of the box-girder superstructure and the computational domain are shown in Figure 2.
4.1. Influence of the Submersion Coefficient
In order to understand the influence of the submersion coefficient on wave force on the box-girder superstructure under the action of solitary waves, three submersion coefficients are considered here. The vibration period of the bridge is taken as 1.0 s to study the dynamic characteristics of the box-girder superstructure under different submersion coefficients. Three elevations and the corresponding submersion coefficients of the box-girder superstructure are shown in Table 5. Based on the bridge elevation, an abbreviation name is designated for each case; for example, E20/CS (0) represents the case where the bridge bottom elevation is 20 m, and the corresponding coefficient of submersion depth Cs is 0.
Table 5.
The bridge deck elevations and corresponding coefficients.
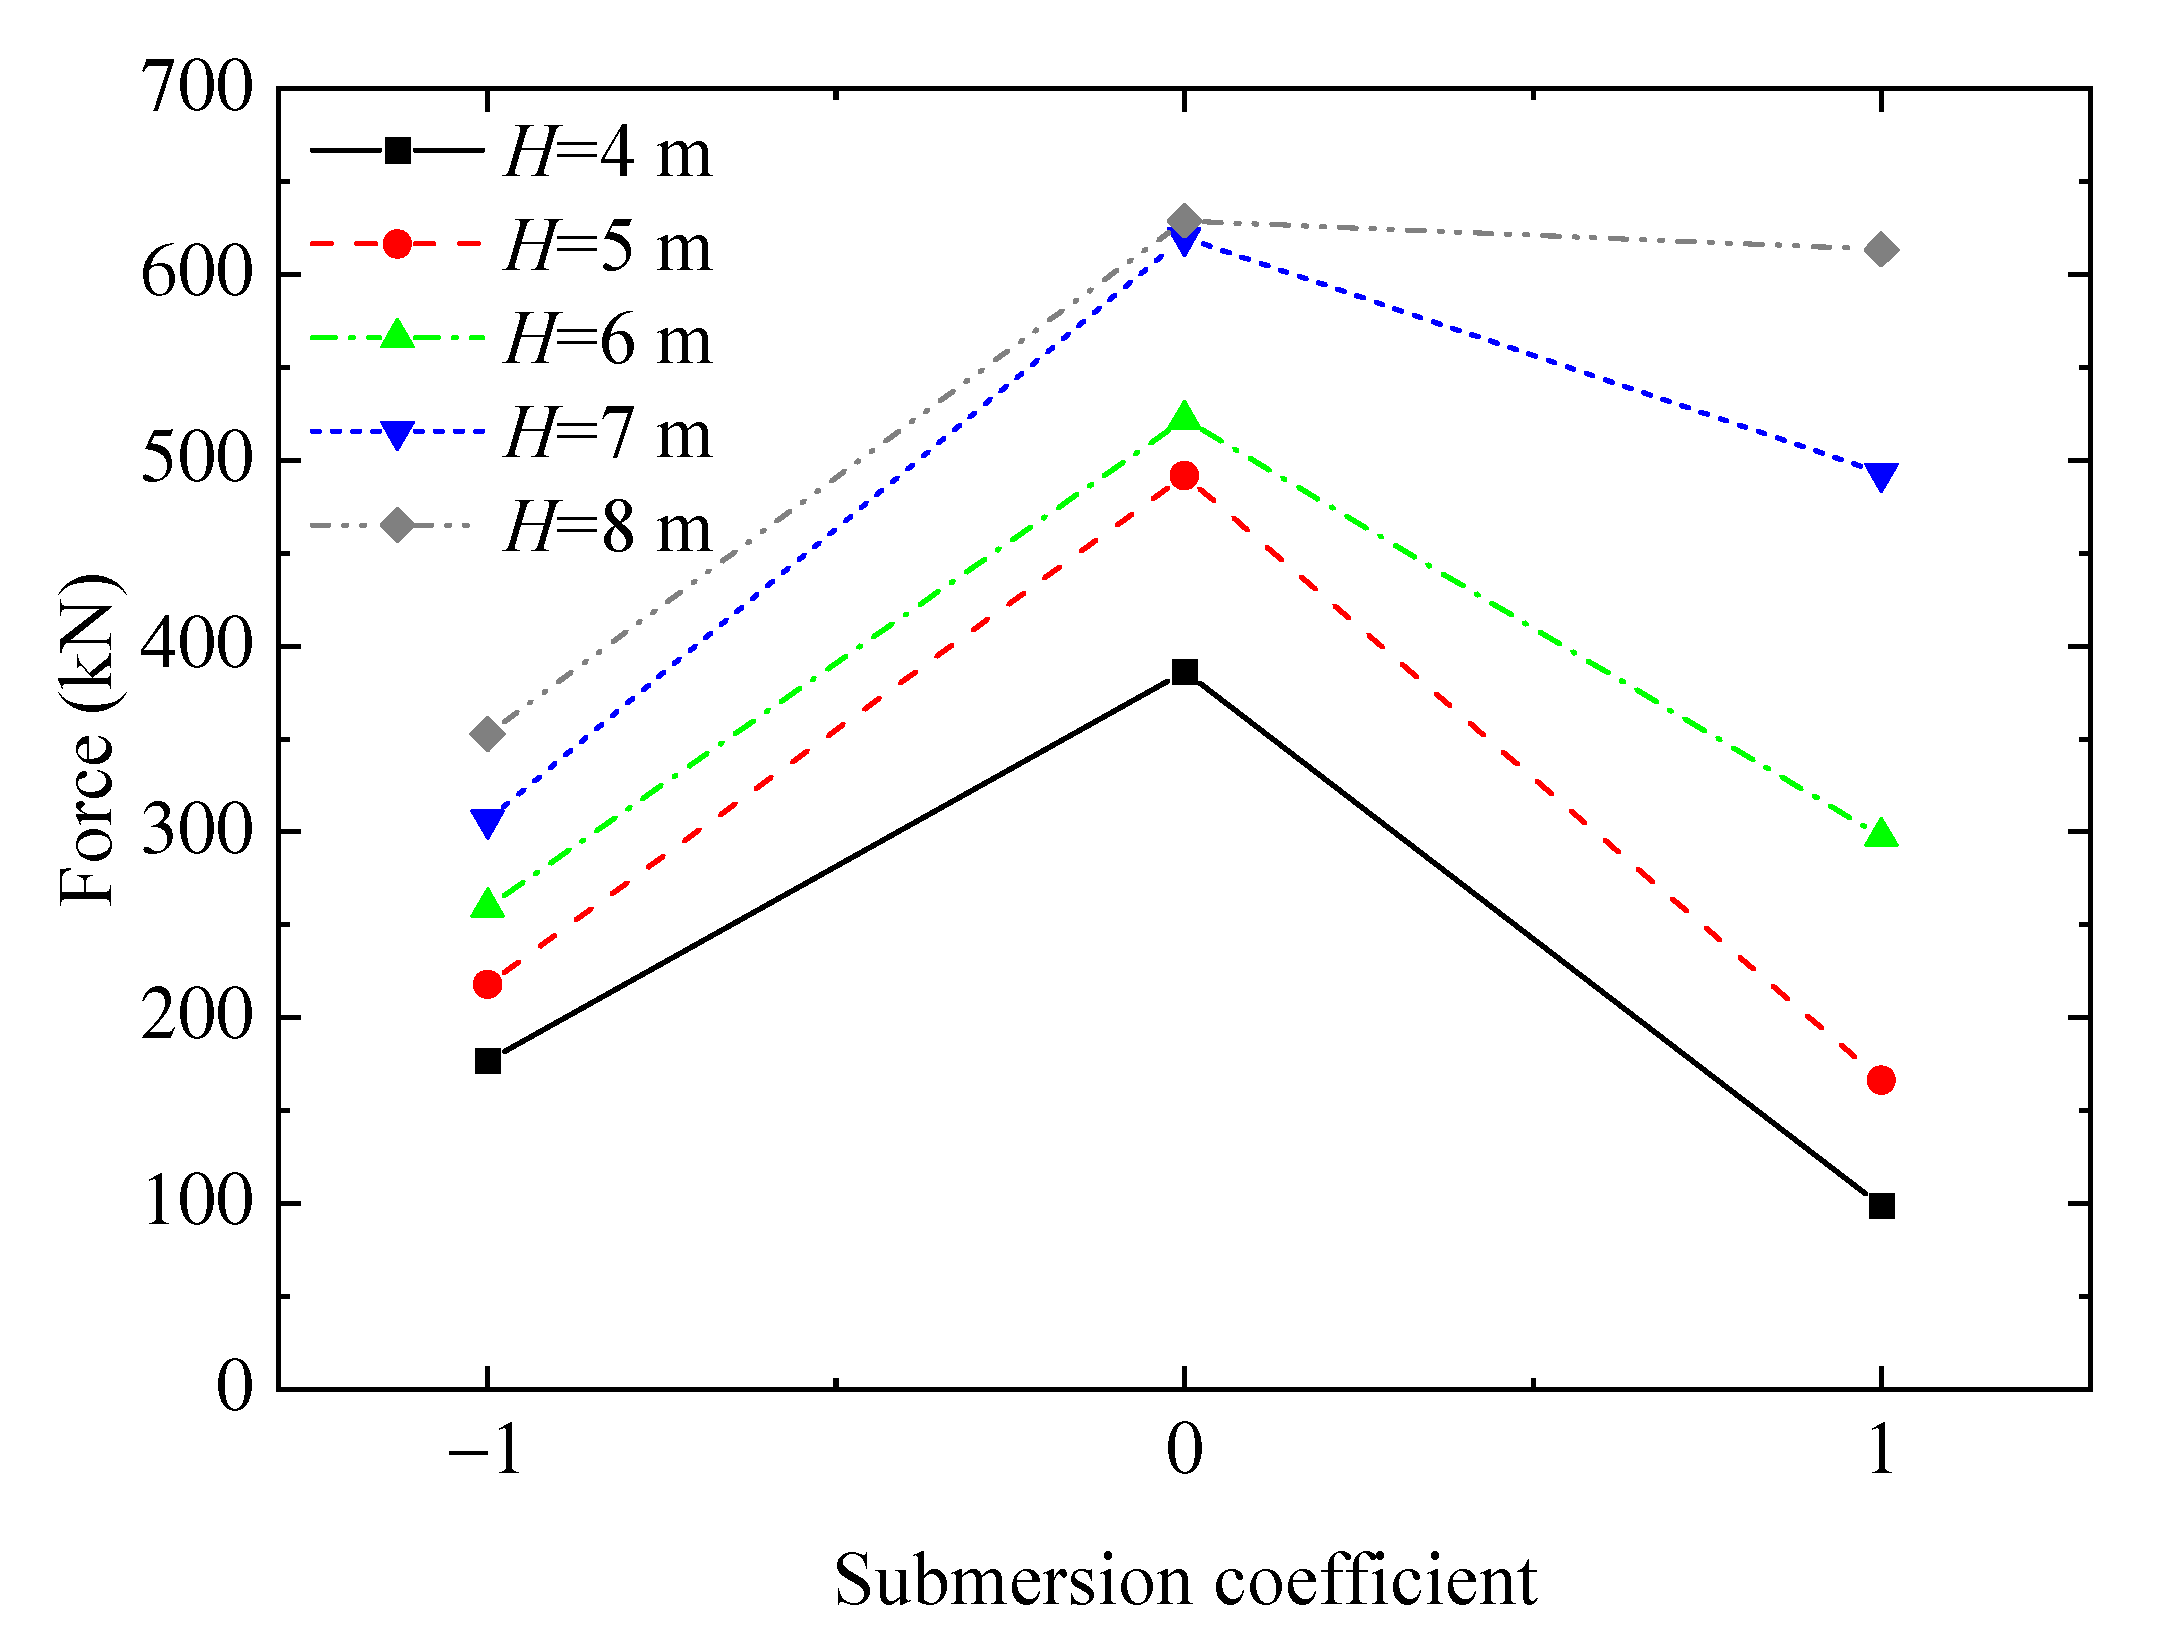
The influence of the negative vertical forces is not considered due to the fact that the negative vertical forces are significantly smaller than the positive vertical forces. Figure 11 shows the vertical peak force comparison for Case K = 1042 kN/m under the influence of three submersion coefficients and five wave heights. The vertical force in the numerical simulation is positive along the positive y-axis. Obviously, the vertical peak force of Case E20/CS (0) is larger than the other cases under the action of solitary waves. This is probably caused by the empty part of the box-girder superstructure (shown in Figure 2) and the wave impact on the side of the box-girder superstructure. The empty part below the flange plate of the box-girder superstructure prevents the wave from advancing and further makes the wave impact on the bottom of the flange plate. The clearance between the bottom of the box-girder superstructure and the water surface is zero for this specific elevation, which would lead to a significant blocking effect and therefore cause larger wave force on the bottom of the flange plate and the web of the box-girder superstructure.
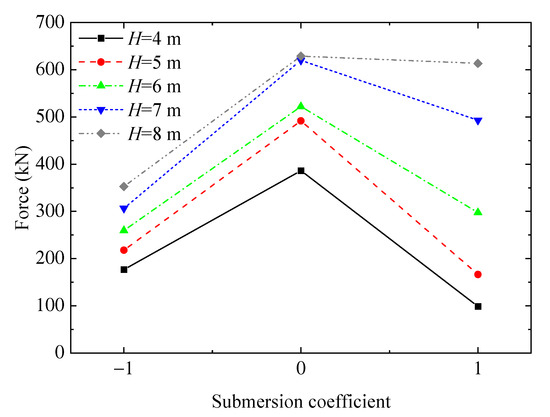
Figure 11.
Comparison of the vertical peak force for Case K = 1042 kN/m.
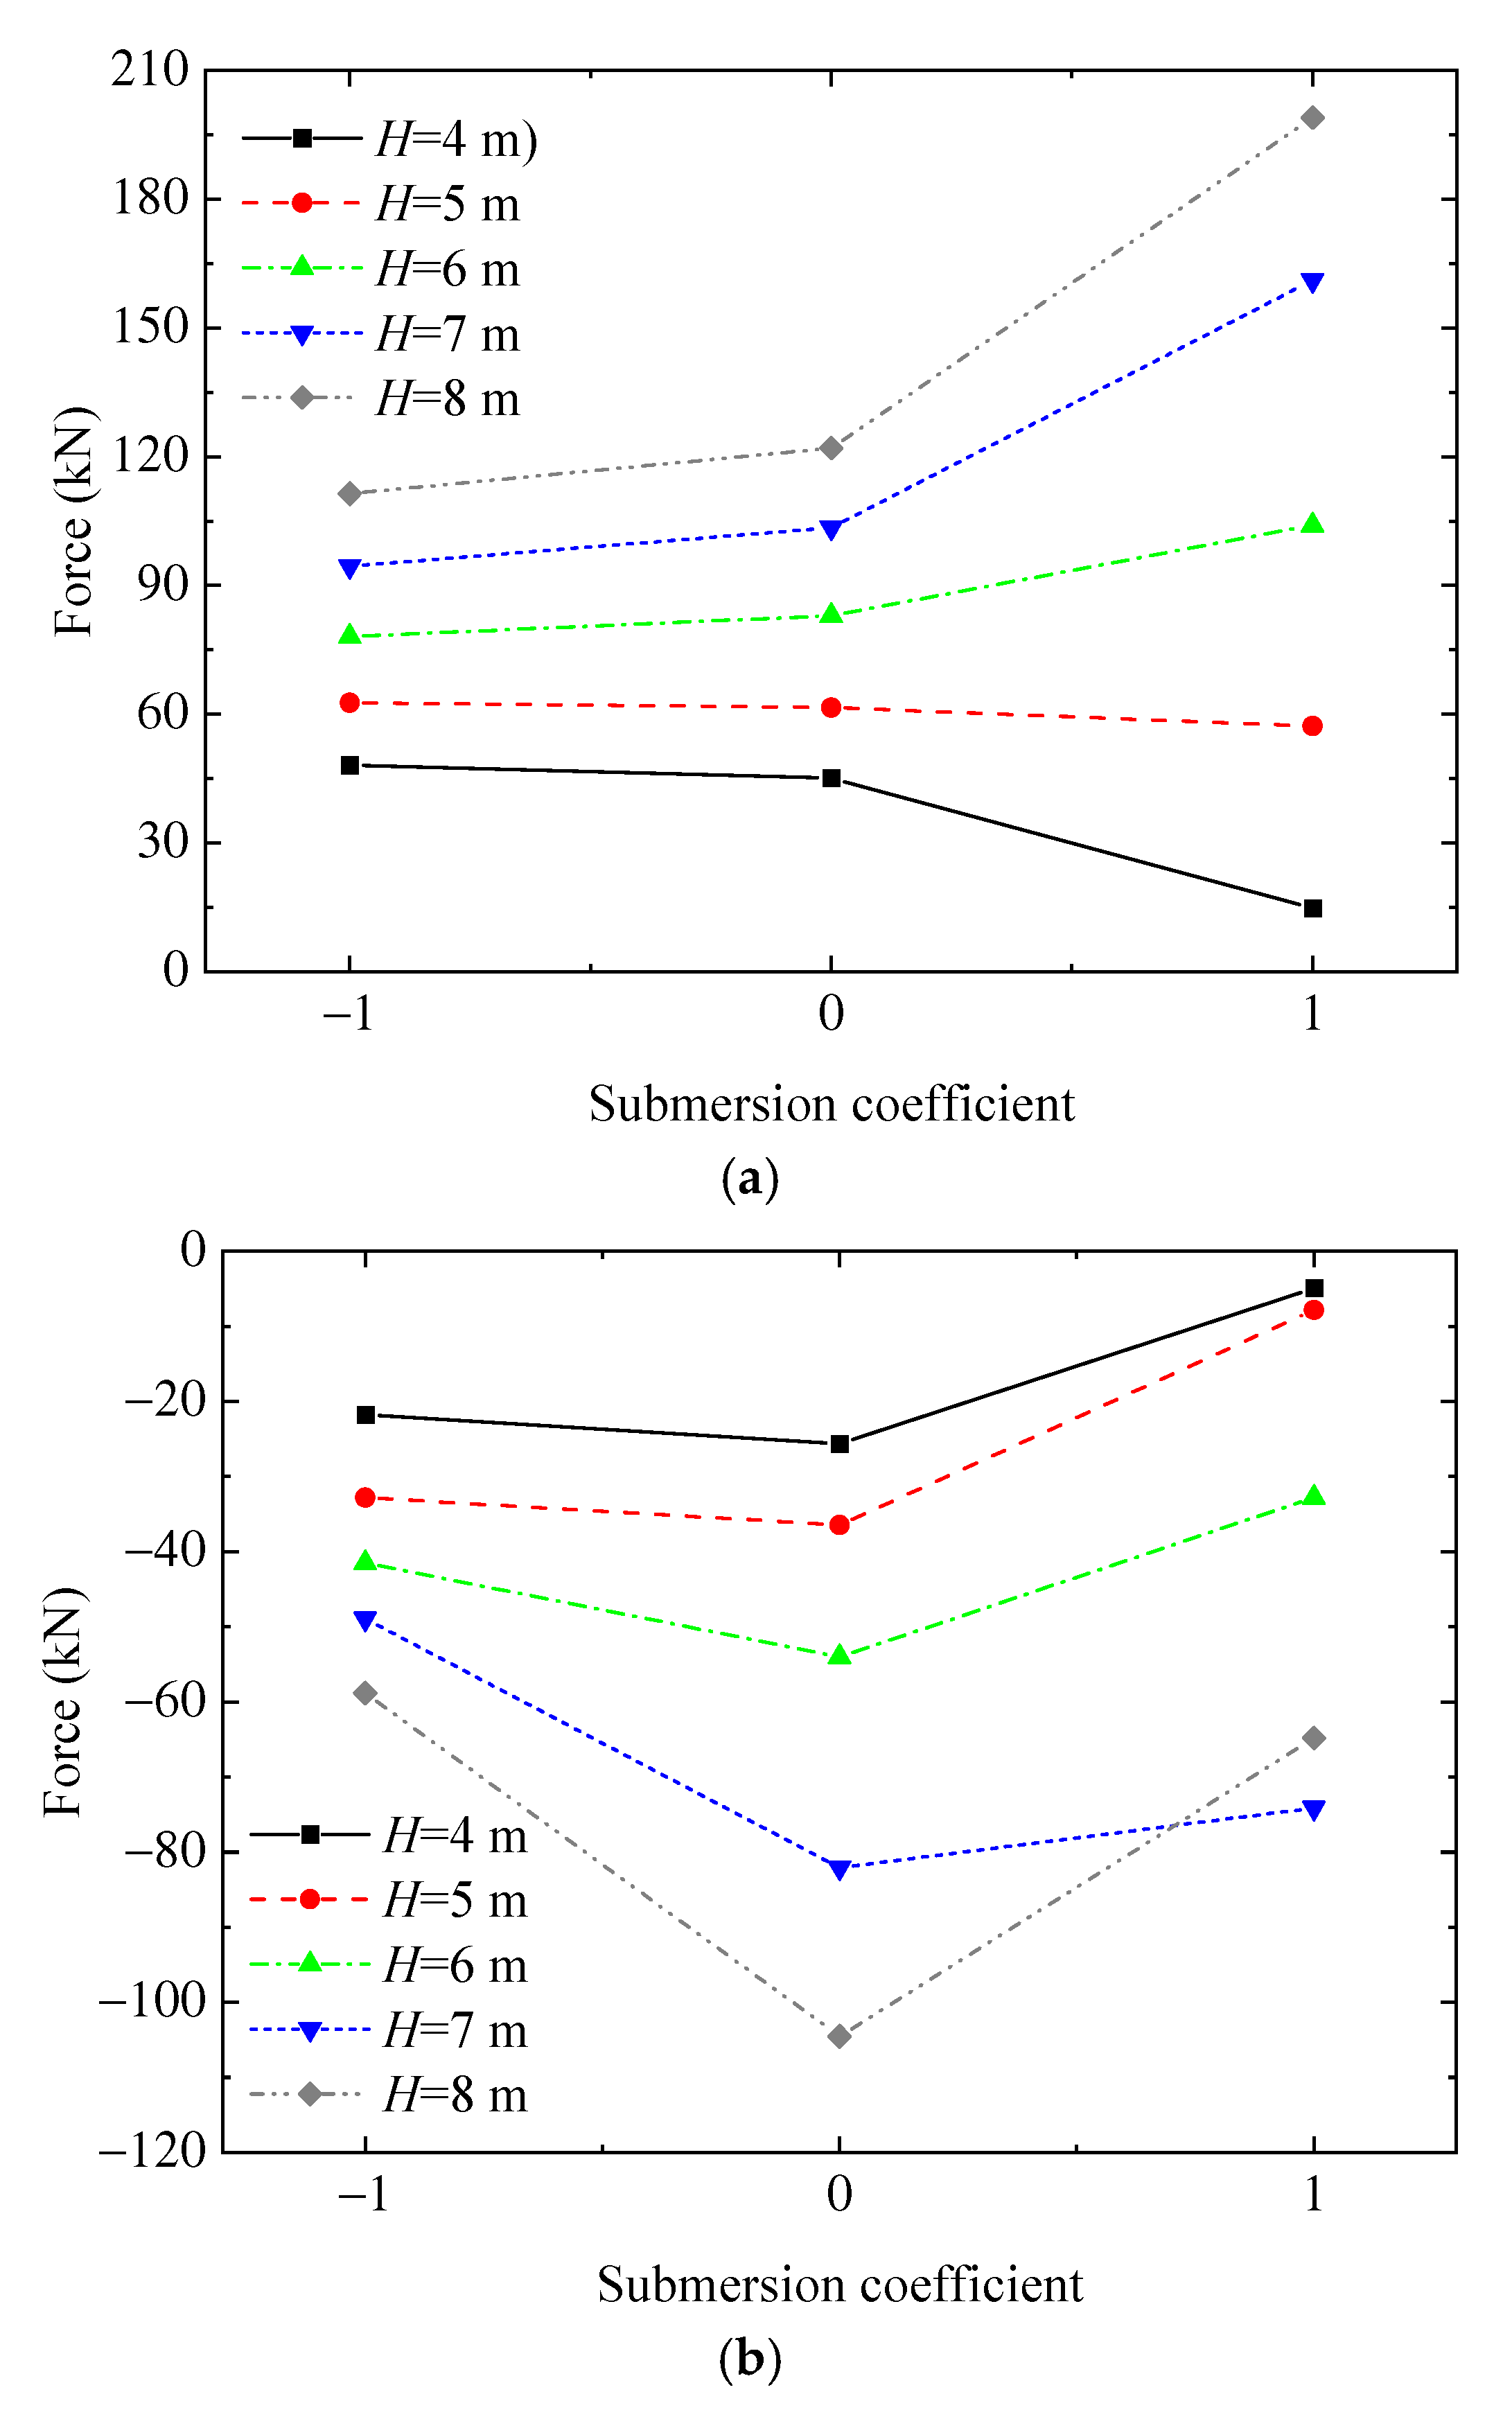
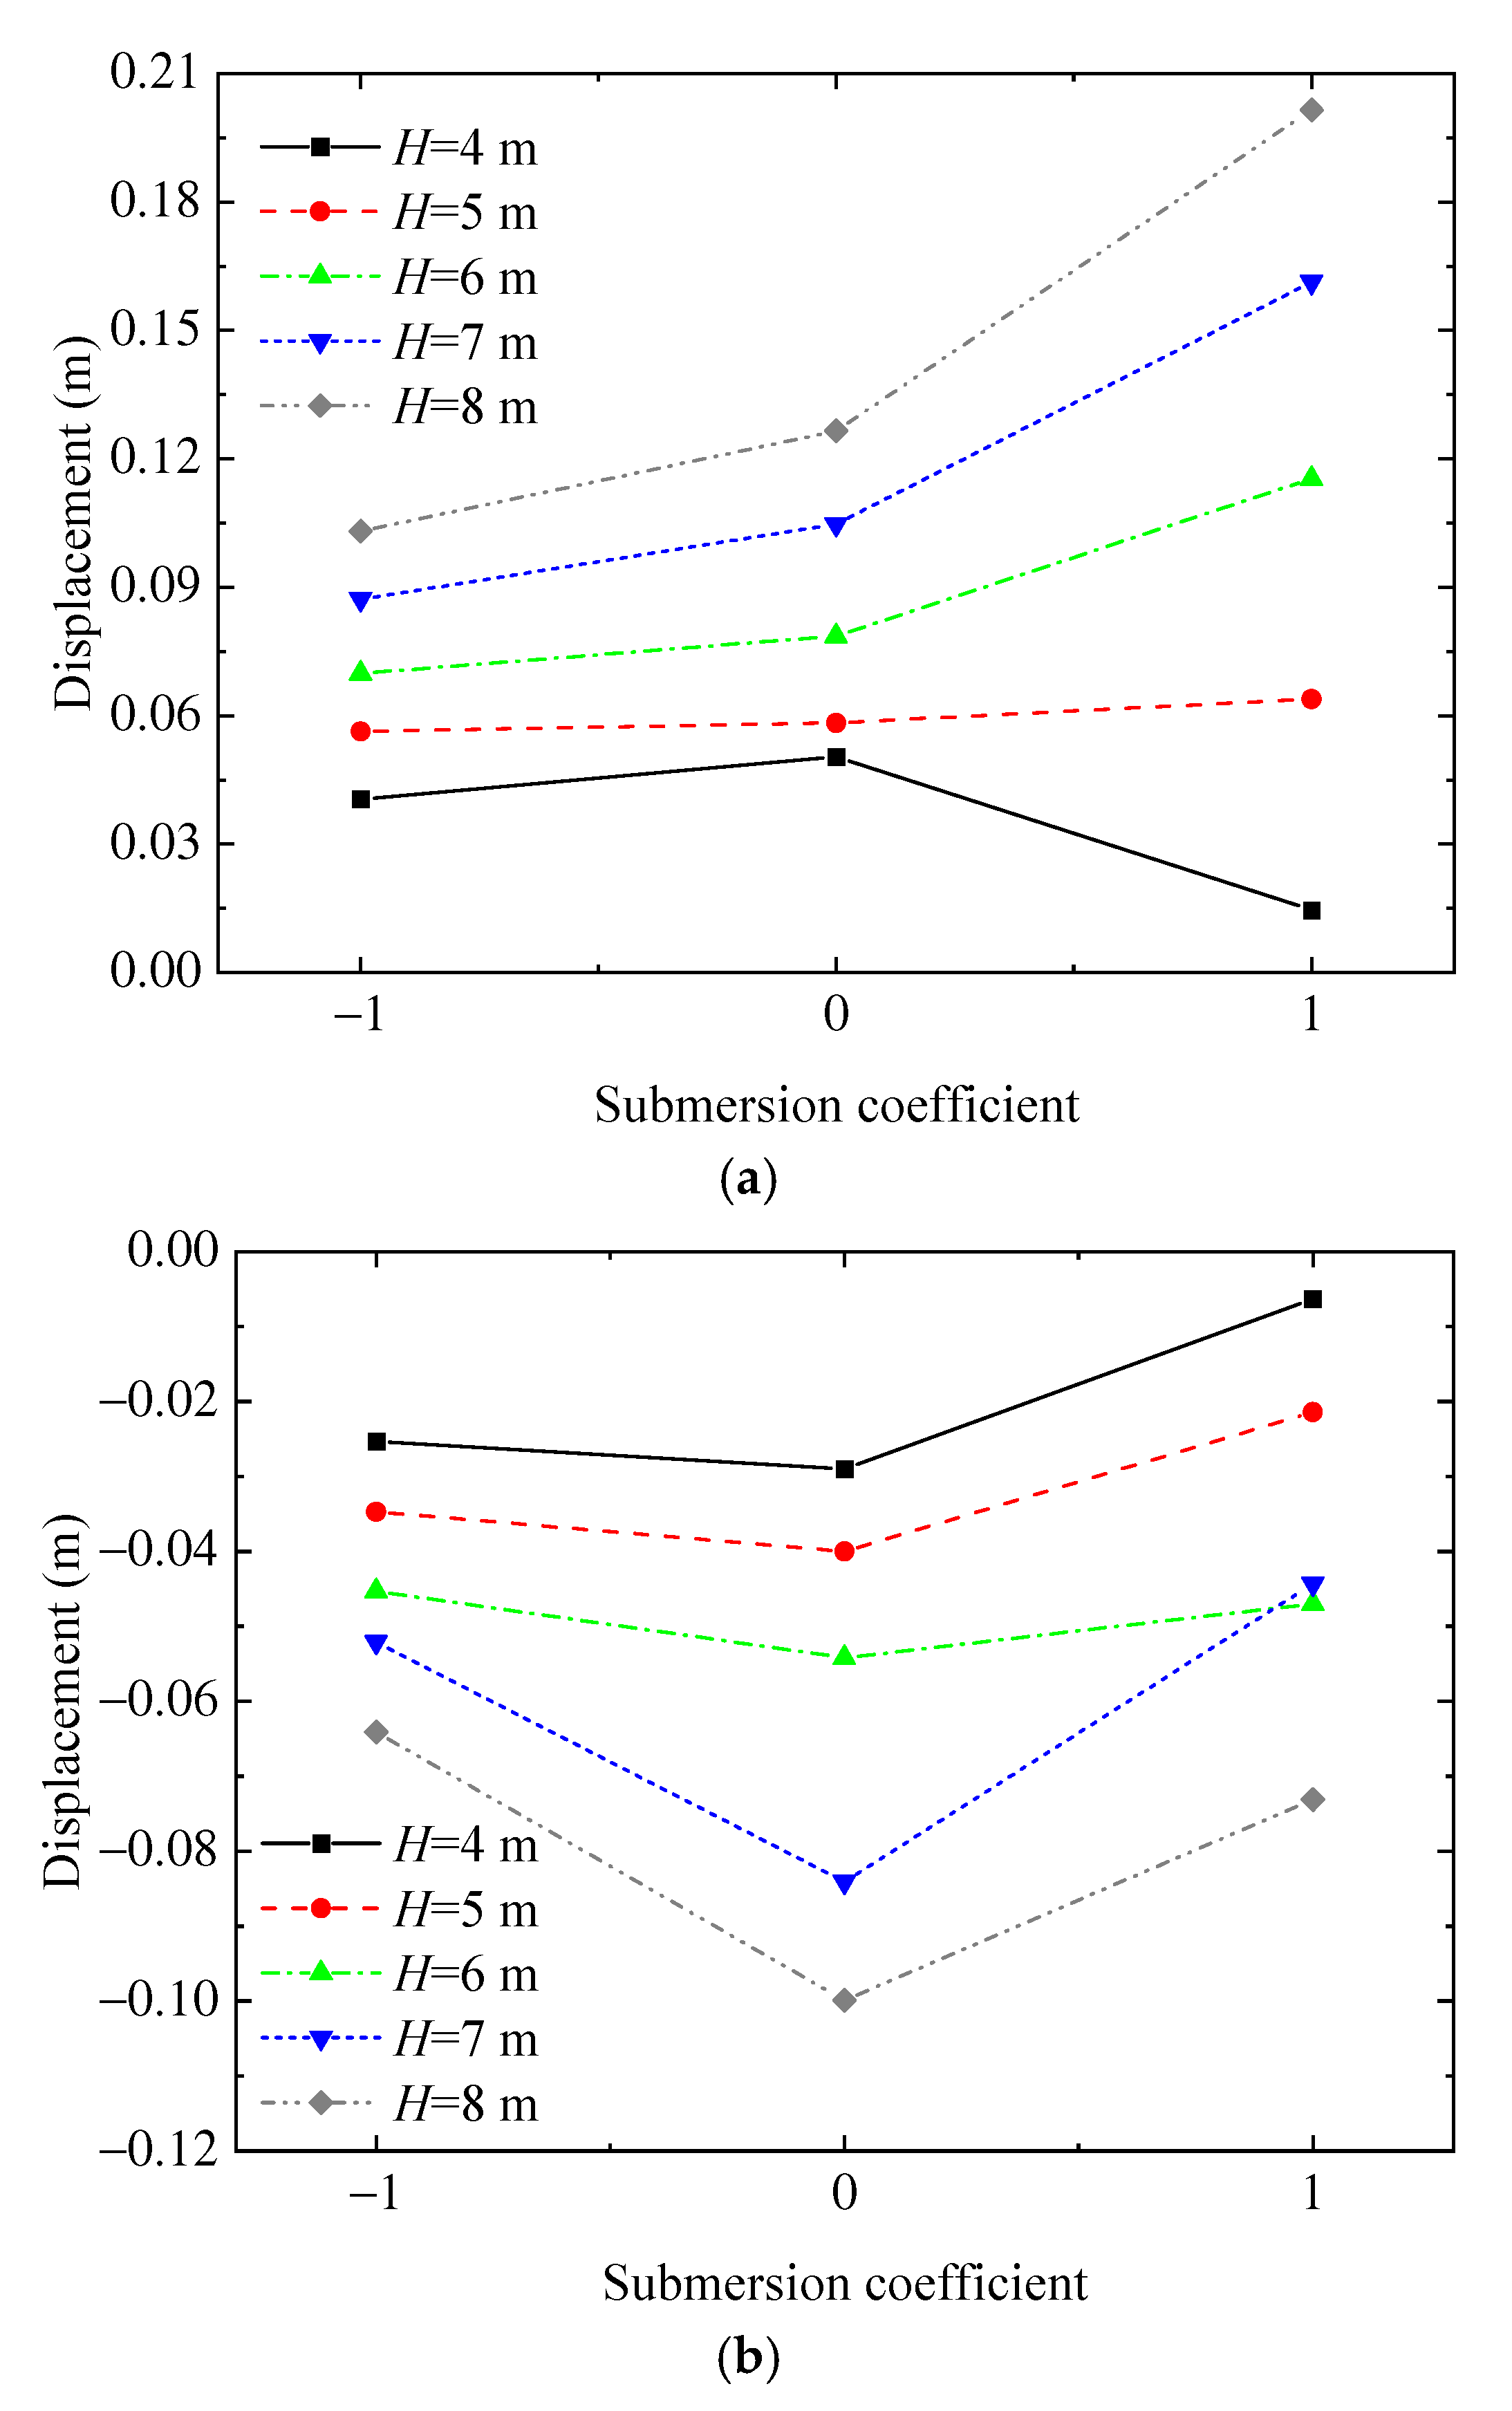
The horizontal peak force comparison and the structural displacement comparison under the influence of three submersion coefficients and five solitary wave heights are shown in Figure 12 and Figure 13. Both of them are positive along the x-axis. It can be seen that the absolute values of positive horizontal force and positive displacement on the box-girder superstructure increase with the increase in wave height. It is noteworthy that there is a very small difference between the horizontal peak force in Case E17/CS (−1) and Case E20/CS (0), indicating that the submersion coefficient has little effect on the horizontal force on the submerged box-girder superstructure, which may be due to the fact of that small difference of the wave velocity. From Figure 12a, compared with the other two cases with smaller elevations, the horizontal peak forces on the box-girder superstructure are smaller in Case E23/CS (1) for the small wave height, e.g., H < 6 m. This phenomenon occurs because the waves with smaller height can only act on fewer parts of the box-girder superstructure with a larger elevation, e.g., the elevation corresponding to Case E23/CS (1), resulting in a smaller horizontal force. However, the horizontal peak forces on the box-girder superstructure in Case E23/CS (1) are larger than the horizontal peak forces on the other two cases for the large wave height, e.g., H ≥ 6 m. This may be due to the greater wave velocity acting on the side of the box-girder superstructure and thus causing greater horizontal force. It may also be caused by the smaller water resistance on the box-girder superstructure with larger elevation in the interaction with solitary waves. It can be seen from Figure 12b that the absolute value of negative horizontal forces in Case E20/CS (0) is larger than that of the other two cases. This may be due to the box-girder superstructure near the water surface affecting the wave propagation, and further bringing more wave energy to the back of the box-girder superstructure. The box-girder superstructure moves laterally under the action of horizontal wave forces. The larger horizontal forces would lead to the larger displacement of the box-girder superstructure as shown in Figure 13. As shown in Figure 12 and Figure 13, there is a very high similarity between the comparison diagram of horizontal forces and the comparison diagram of displacement for the box-girder superstructure in all cases. There may be a coupling relationship between the horizontal forces and the displacements on the box-girder superstructure, which would be discussed later.
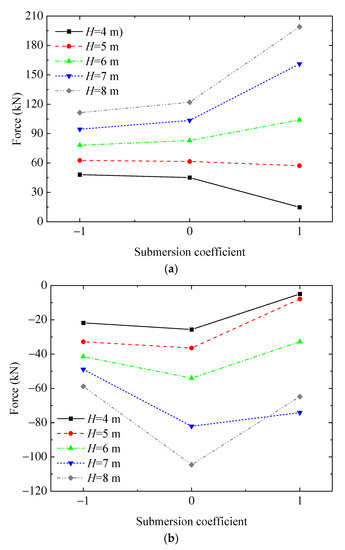
Figure 12.
Comparison of the time histories of the horizontal force for Case K = 1042 kN/m. (a) Positive force; (b) Negative force.
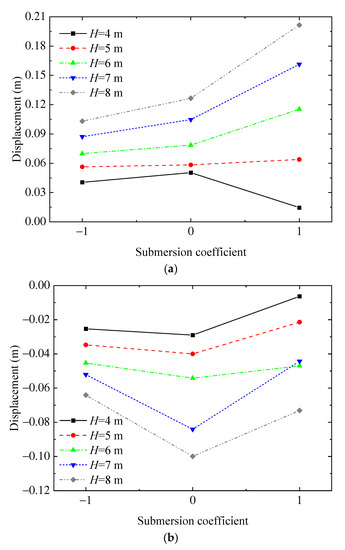
Figure 13.
Comparison of the time histories of the displacement for Case K = 1042 kN/m. (a) Positive displacement; (b) Negative displacement.
In terms of the three submersion coefficients discussed in this parametric study, the dynamic characteristics of the box-girder superstructure in Case E23/CS (1) when the wave height H ≥ 6 m and Case E20/CS (0) under five wave heights are significant. Therefore, these conditions need to be further studied to gain an in-depth understanding of the mechanical properties of the box-girder superstructure under the action of solitary waves.
4.2. Influence of the Lateral Restraining Stiffness
In the design and construction of coastal bridges, researchers are always wondering whether it is possible to improve the disaster resistance of box-girder superstructure by changing the lateral restraining stiffness of the box-girder superstructure. In the following, the effect of different lateral restraining stiffnesses on the box-girder superstructure under wave actions would be investigated. In this parametric study, five sets of lateral restraining stiffnesses corresponding to five bridge vibration periods and a damping coefficient ξ of 0.05 are considered, as shown in Table 6. An abbreviation name is designated for each case based on the lateral restraining stiffnesses of the bridge; for example, Case K = 463 means that the lateral restraining stiffness of the bridge is 463.213 kN/m.
Table 6.
The parameters of the mass–spring–damper system.
4.2.1. Case E20/Cs (0)
When the bottom elevation of the box-girder superstructure is just at the same elevation as the water surface (i.e., when the submersion coefficient Cs = 0), the dynamic characteristics of the box-girder superstructure under five lateral restraining stiffnesses and the infinite lateral restraining stiffness (i.e., the bridge deck is fixed) are investigated. Figure 14 shows the influence of different lateral restraining stiffnesses on the horizontal peak force on the box-girder superstructure when the submersion coefficient Cs = 0. The +∞ in the figure indicates that the lateral restraining stiffness tends to infinity, which means that the box-girder superstructure is fixed. As shown in Figure 14, there is no significant difference in the horizontal force on the box-girder superstructure under different lateral restraining stiffnesses. The reason may be that the coupling effect between the box-girder superstructure and water plays an important role in the box-girder superstructure–wave interaction when the box-girder superstructure is near the water surface.
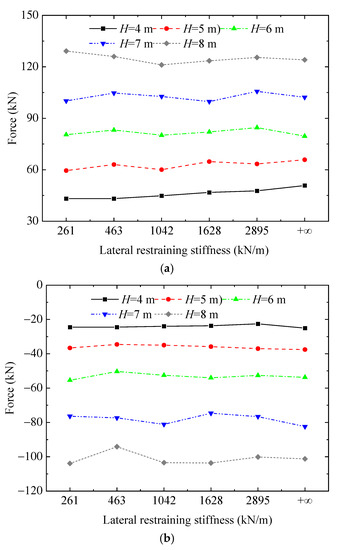
Figure 14.
Influence of the lateral restraining stiffnesses on the horizontal force for Case E20/Cs (0). (a) Positive force; (b) Negative force.
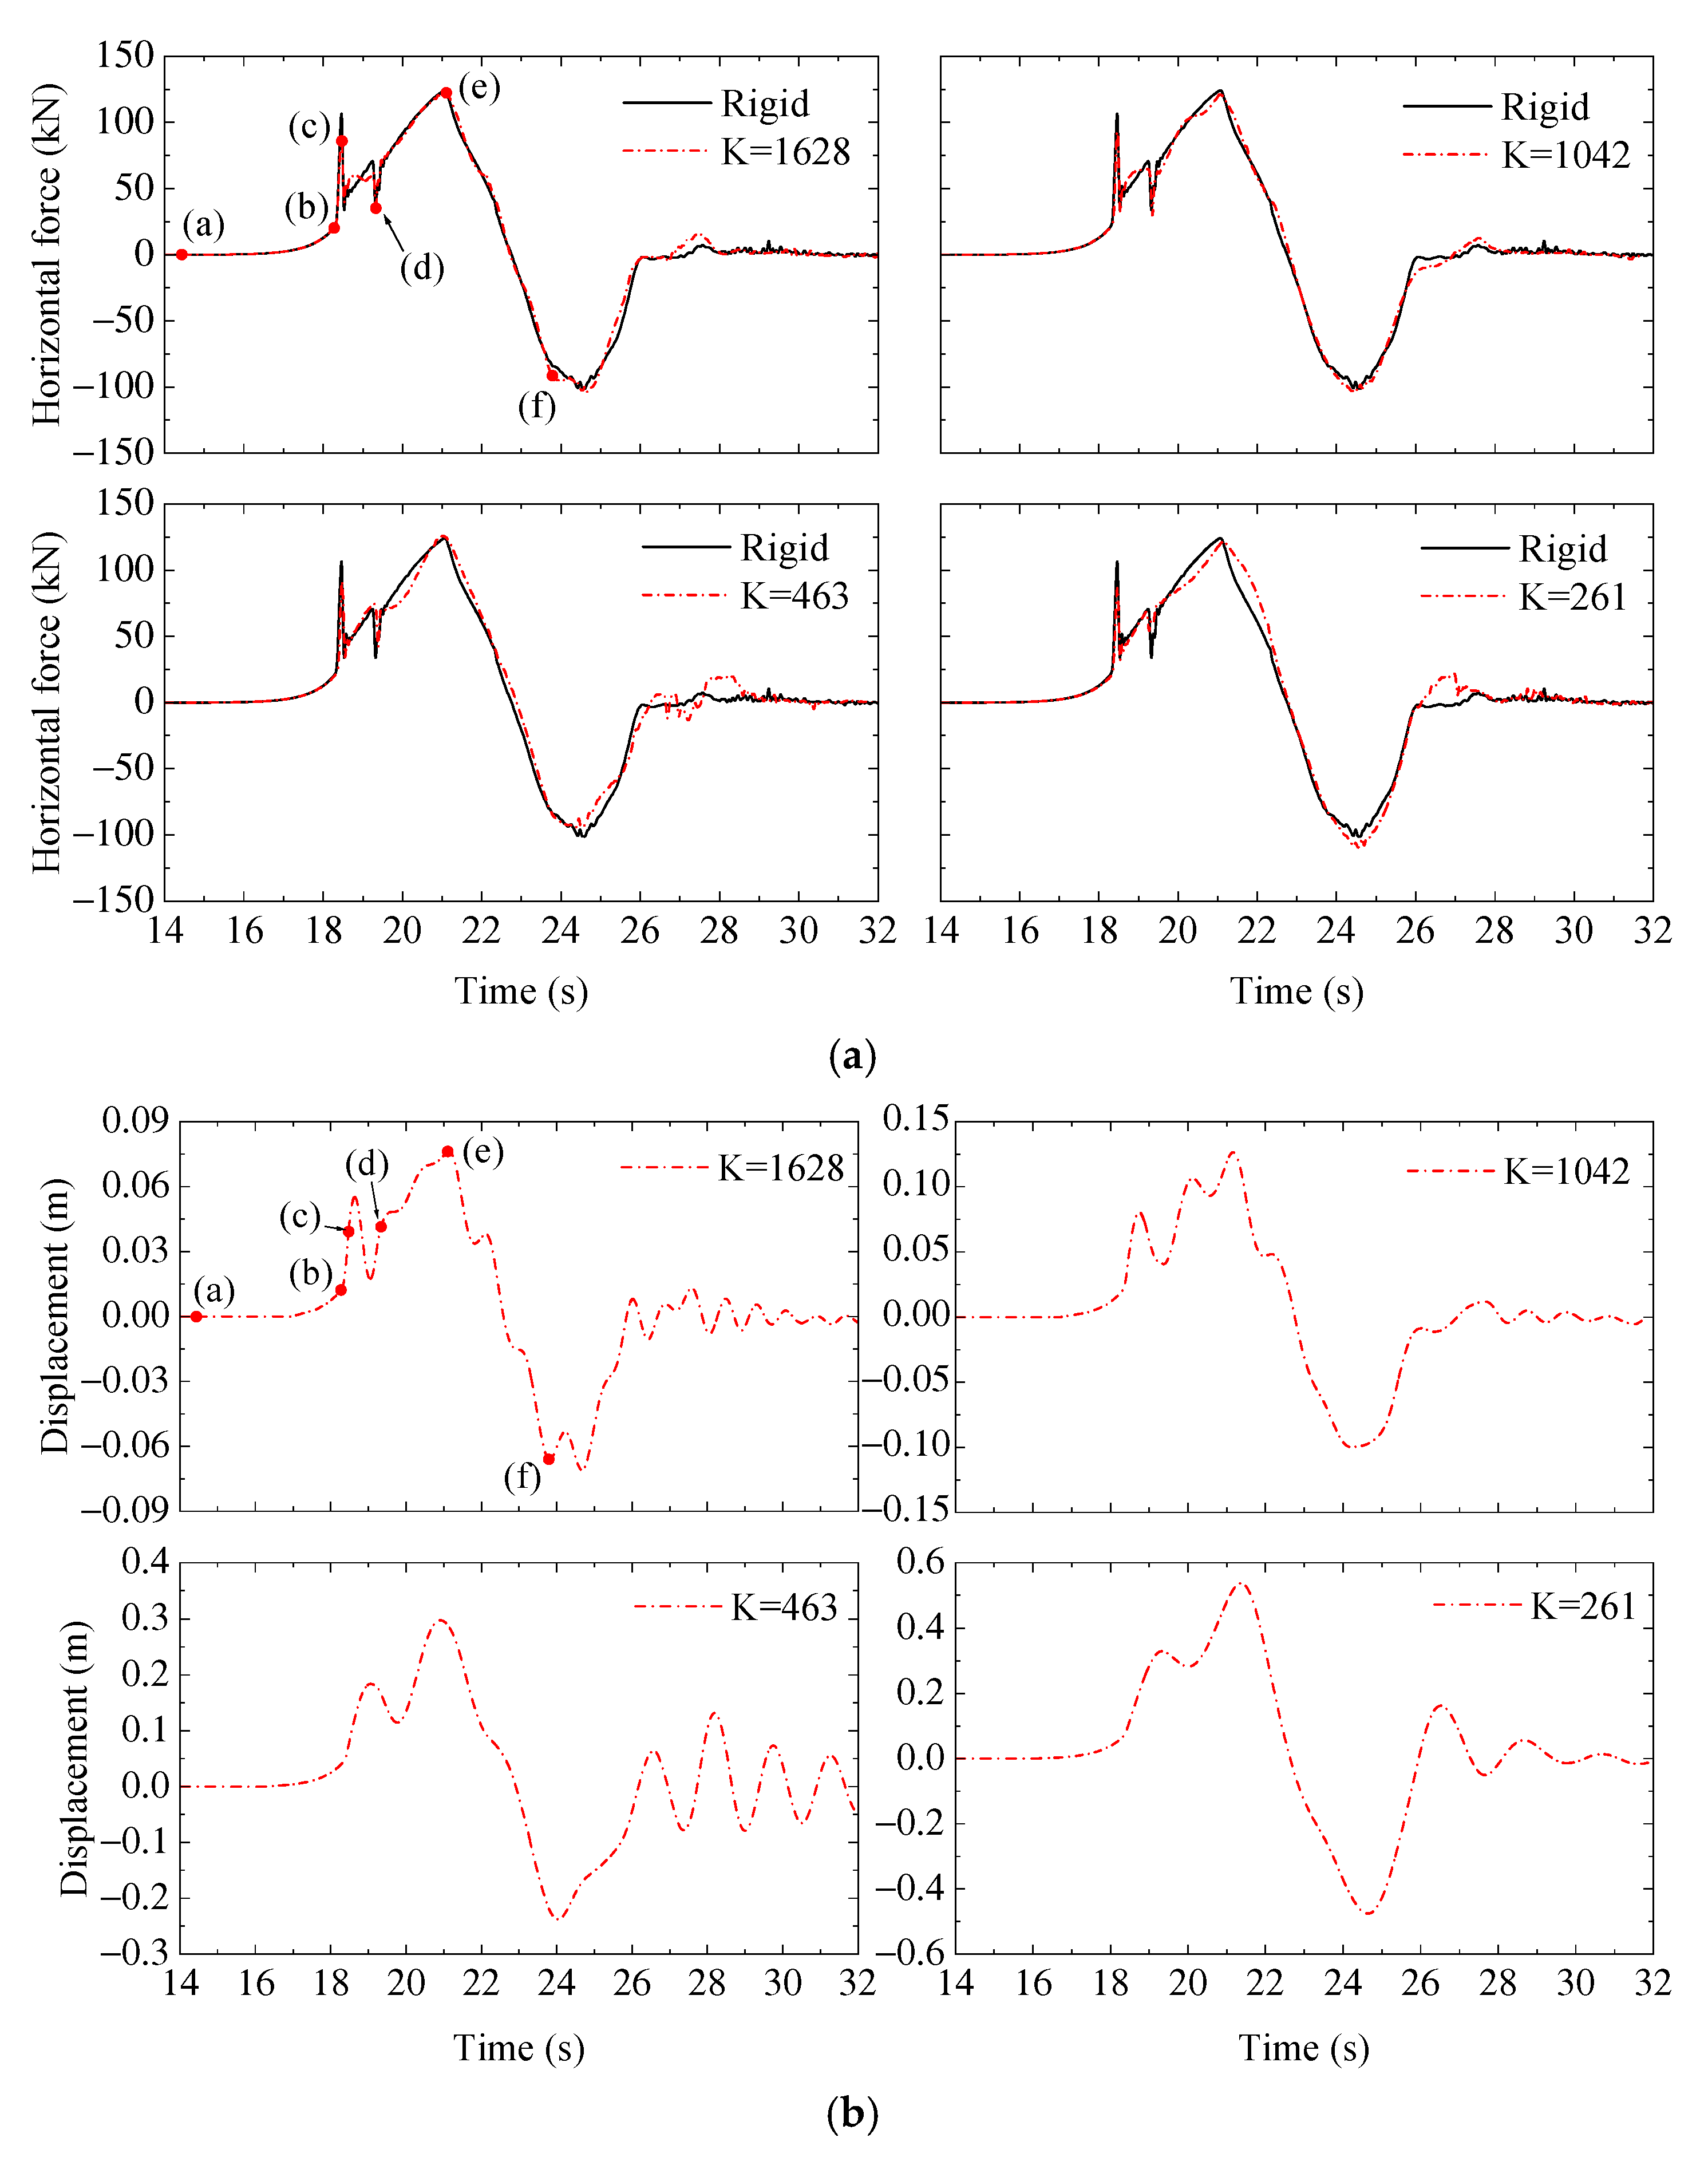
When the submersion coefficient Cs = 0, the influence of different lateral restraining stiffnesses on the vertical peak force on the box-girder superstructure is shown in Figure 15. Compared with the fixed box-girder superstructure, it is noteworthy that with the lateral restraining stiffness of the box-girder superstructure decreasing (i.e., with the flexibility of the box-girder superstructure increasing), the vertical peak forces on the box-girder superstructure have an upward trend. In addition, Istrati et al. [56] proposed in their study that the unbroken solitary wave would also provide greater uplift forces when acting on the bridge superstructure compared with the horizontal one, while for broken solitary waves the opposite is true. It shows that the type of the solitary wave (i.e., whether the solitary wave is unbroken or broken) has a significant effect on the wave force on the bridge superstructure. The conclusion of this study is only applicable when the solitary wave is not broken. The coupling effect of breaking wave and structure will be considered in the follow-up study. A larger vertical force may cause the box-girder superstructure to fall off from their supporting piers under the wave action. One example of the time histories comparison of the horizontal force and its corresponding displacement of the fixed and the flexible box-girder superstructure with the wave height of 8 m is shown in Figure 16. As shown in Figure 16: (1) When the lateral restraining stiffness is relatively large (i.e., the lateral restraining stiffness corresponding to Case K = 1628), the time history of the horizontal force on the box-girder superstructure is not significantly different from that of the fixed box-girder superstructure. With the increase in the flexibility of the box-girder superstructure, the differences in the time histories of the horizontal force become larger, i.e., the phase difference increases with the lateral restraining stiffness decreasing, e.g., the Case K = 1024, Case K = 463 and Case K = 261 in Figure 16a. (2) The displacement of the box-girder superstructure under horizontal force becomes larger due to the decrease in lateral restraining stiffness of the box-girder superstructure.
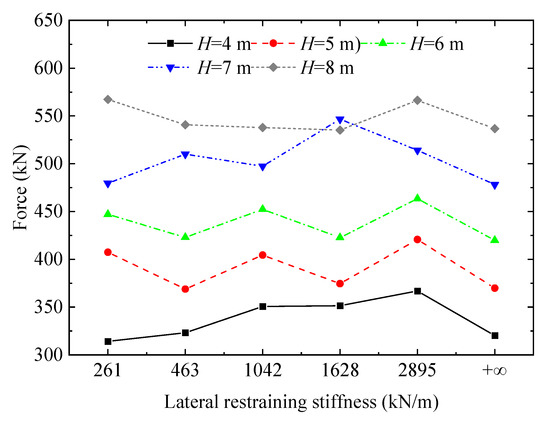
Figure 15.
Influence of the lateral restraining stiffnesses on the vertical force for Case E20/Cs (0).
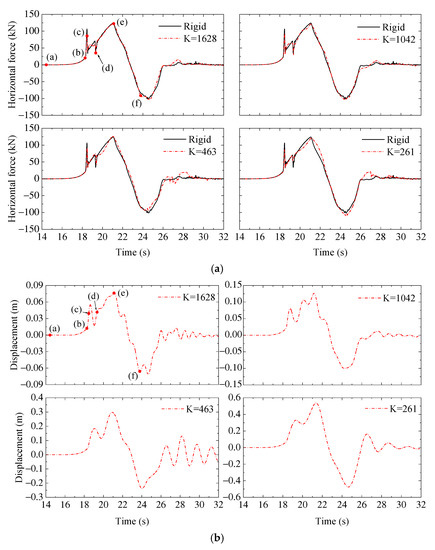
Figure 16.
Comparison of different restraining stiffnesses for E20/Cs (0), in which, letters (a–f) correspond to the moment of 14.40 s, 18.24 s, 18.48 s, 19.32 s, 21.00 s, and 24.36 s. (a) Comparison of the time theories of horizontal force; (b) Comparison of the time theories of displacement.
The lateral restraining stiffness has a negative impact on the mechanical properties of the box-girder superstructure when the submersion coefficient Cs = 0. Compared with the fixed box-girder superstructure, the flexible box-girder superstructure may lead to an increase in the vertical peak force. It is not conducive to the survival of the box-girder superstructure under extreme waves. It indicates that the setting of lateral restraining stiffness would bring negative effects when the box-girder superstructure is near the water surface. Therefore, during the design and construction of coastal box-girder bridges, it should try to keep the box-girder superstructure away from the water surface in a reasonable range. It can avoid the failure of the flexible mechanism of the box-girder superstructure due to the rise of the sea level. In some inevitable areas (e.g., where the elevation of the bridge is limited), the vertical restraining force of the box-girder superstructure should be strengthened to improve disaster resistance.
4.2.2. Case E23/Cs (1)
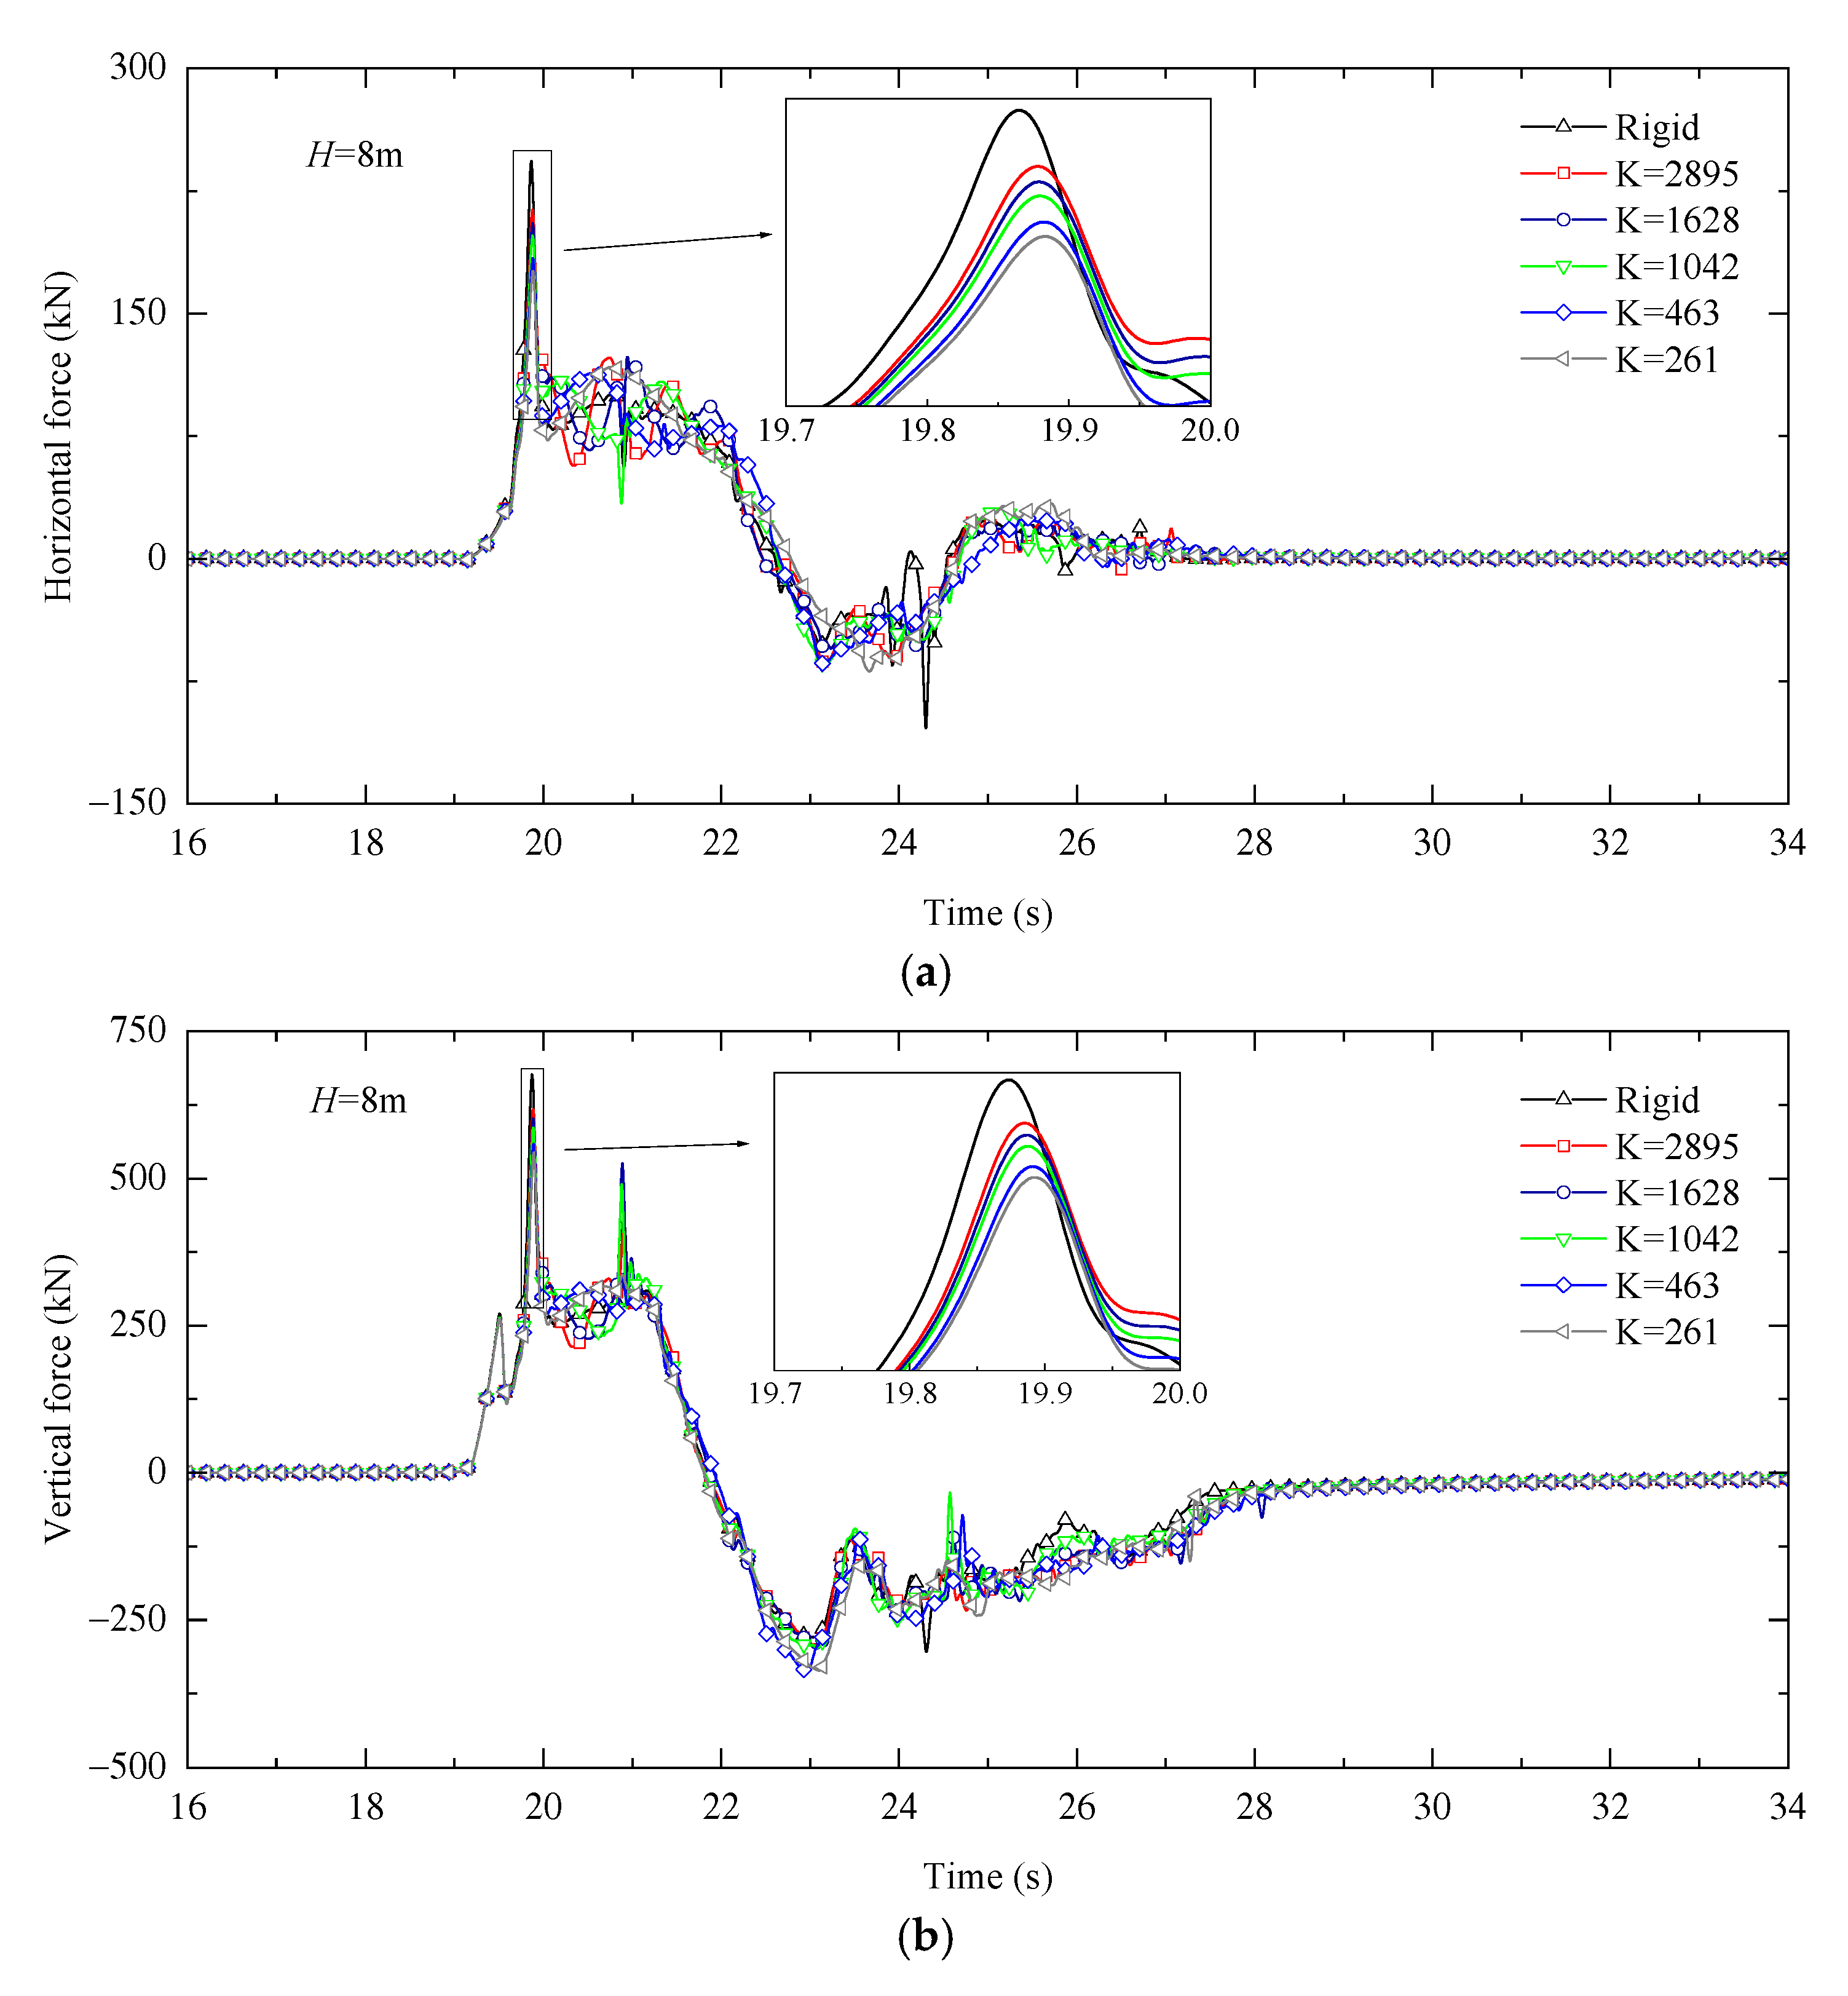
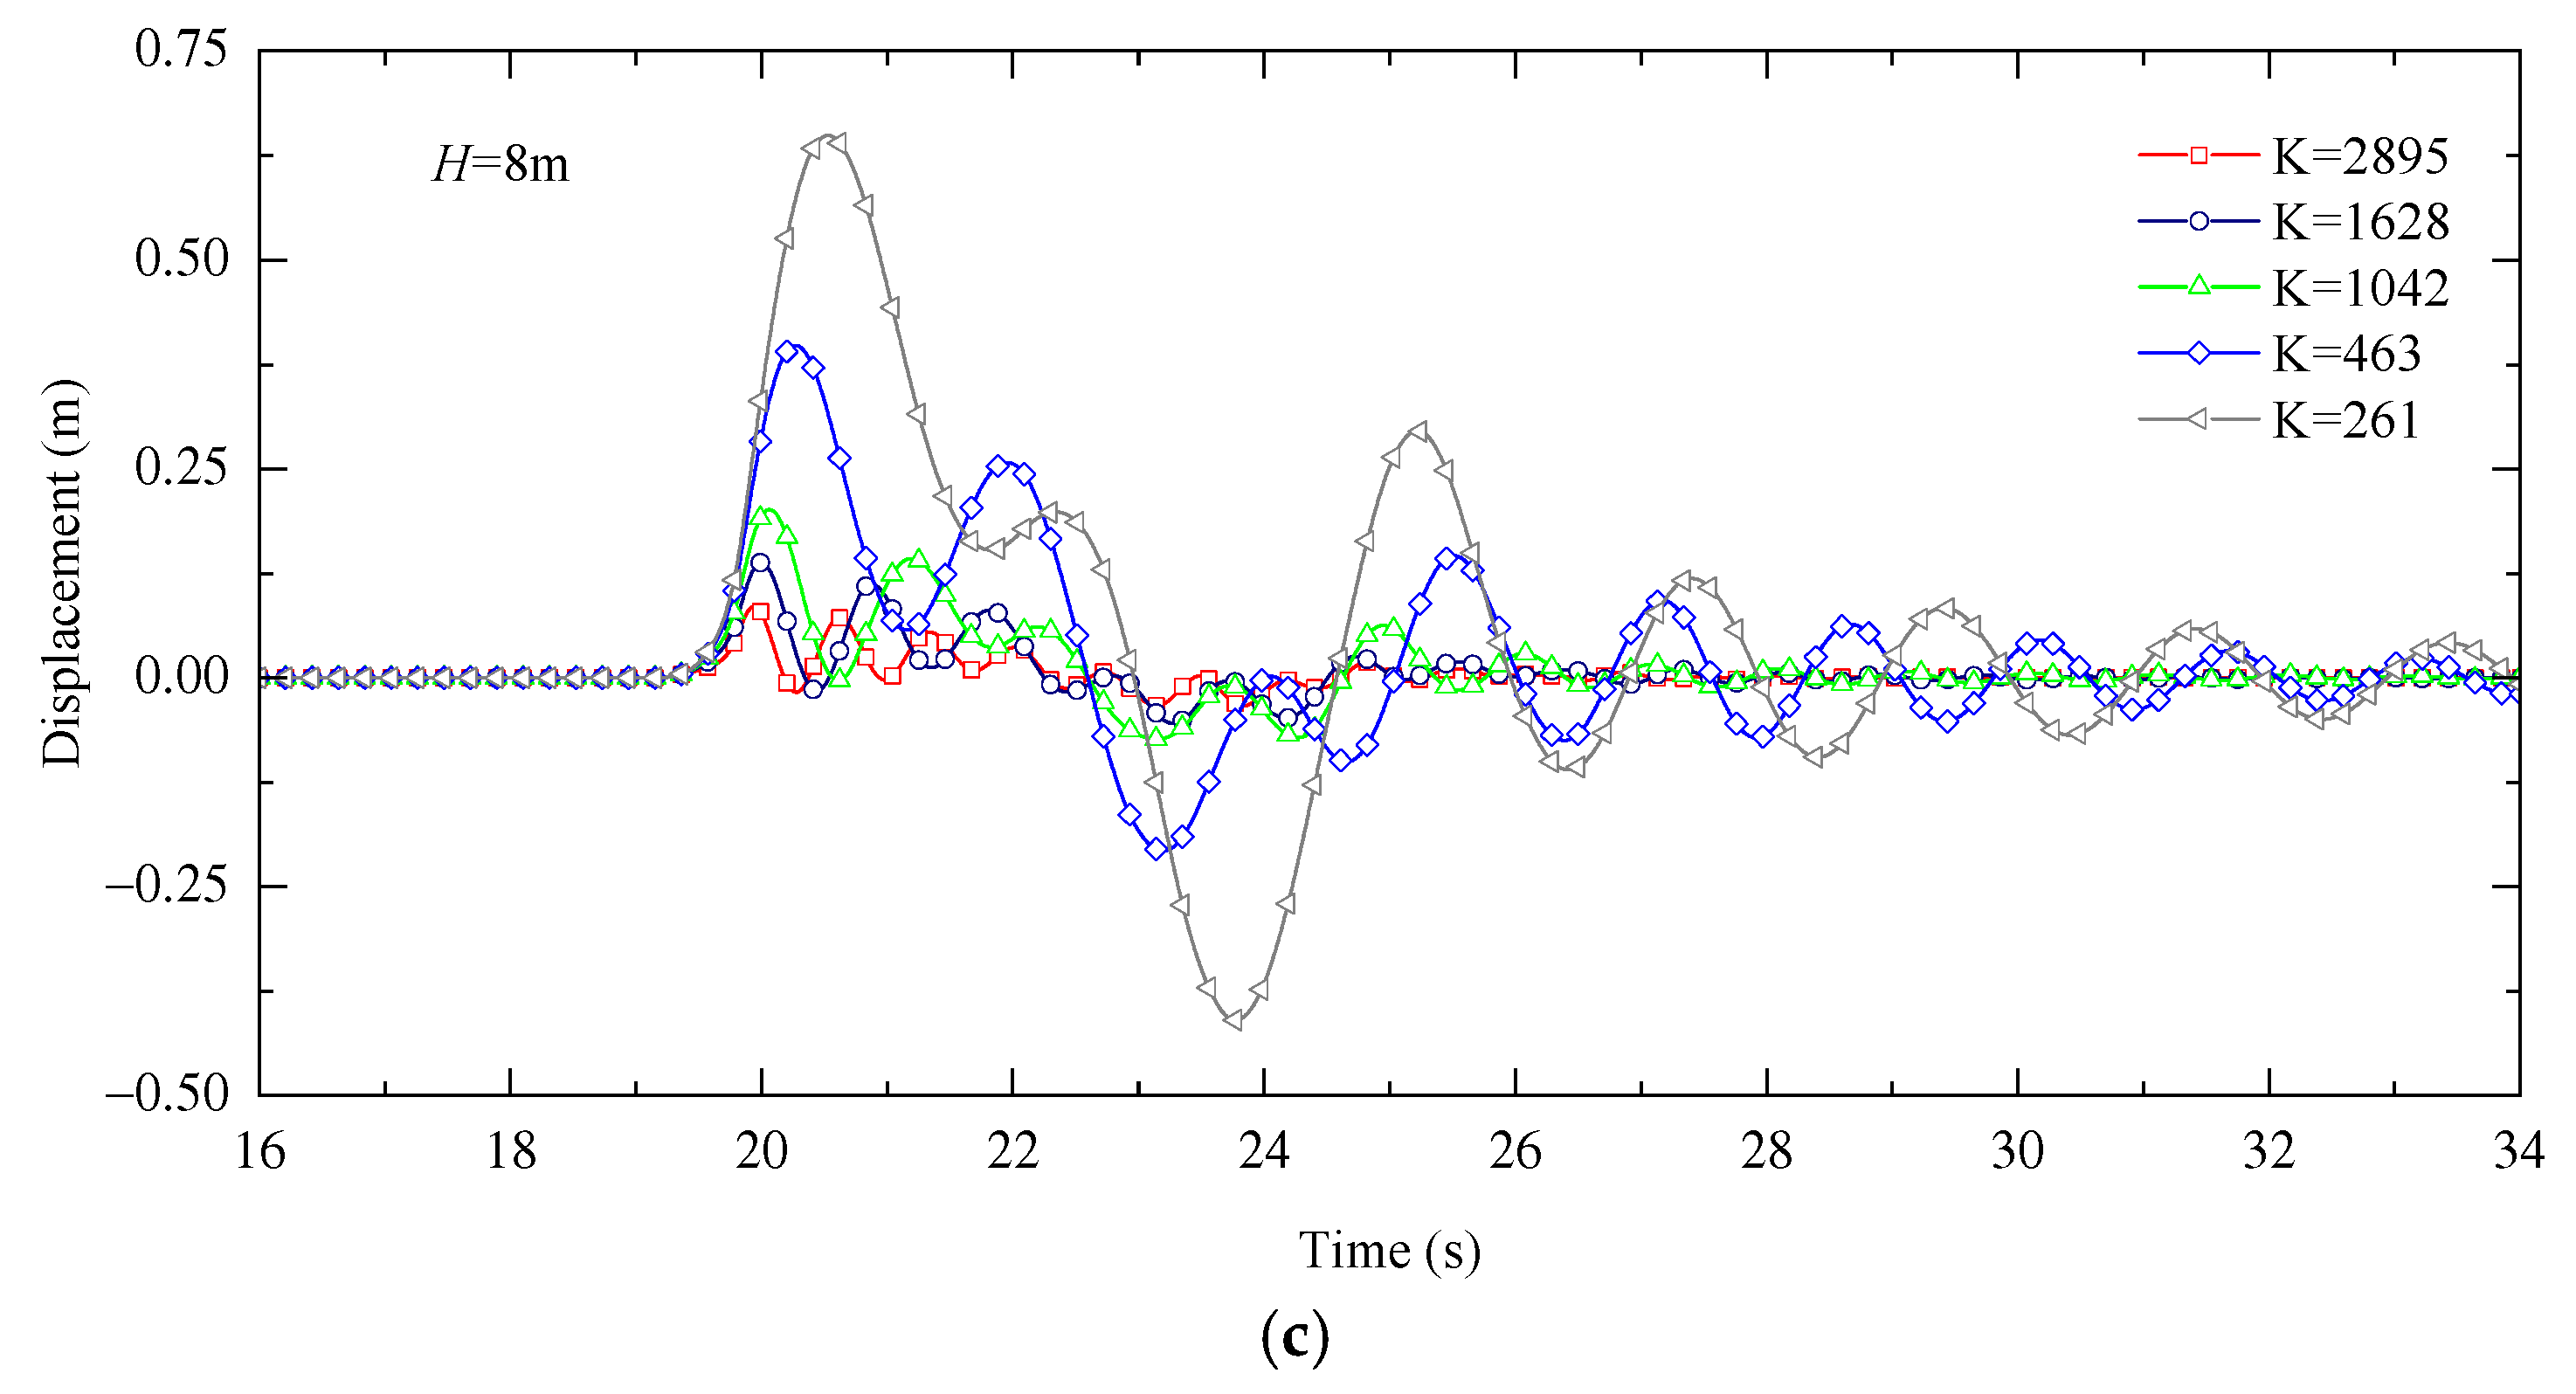
The bridge elevation chosen in Case E23/Cs (1) is closer to the actual coastal bridge. The dynamic characteristics of the box-girder superstructure with different restraining stiffnesses with the wave heights of 6 m, 7 m and 8 m are studied. The time histories of the horizontal forces and the vertical forces for the wave height of 8 m with different lateral restraining stiffnesses are shown in Figure 17. It can be seen from Figure 17 that there is only a small difference between the times when the wave force on the box-girder superstructure reaches the maximum value under different lateral restraining stiffnesses (i.e., the maximum wave force on the box-girder superstructure lags more with the decrease in the lateral restraining stiffness). Due to the small difference (i.e., the time when the wave force reaches the maximum value in all cases is between 19.85 s and 19.90 s), it is approximately assumed that the wave force on the box-girder superstructure under different lateral restraining stiffnesses reaches the maximum value at almost the same time. However, the time when the displacement of the box-girder superstructure reaches the maximum value is significantly different. The reason may be that the wave force quickly reaches the maximum value when the wave impact on the box-girder superstructure, and the displacement of the box-girder superstructure under the lateral restraining force is still small. Additionally, it is noteworthy in Figure 17a,b that the horizontal force and vertical force on the box-girder superstructure have two sudden changes between 19 s and 21 s. This may be due to the unique structural configuration of the box-girder superstructure, i.e., the flange plates on both sides of the box-girder superstructure. The horizontal forces and vertical forces on the box-girder superstructure increase significantly to the maximum value due to the wave acting on the side of the flange plate. It can be seen from Figure 17c that the lateral displacement of the box-girder superstructure even reaches about 0.65 m with the decrease in the lateral restraining stiffness. In reality, this is likely to cause the box-girder superstructure to deviate from the linear-elastic range and cause different degrees of damage to the box-girder superstructure.
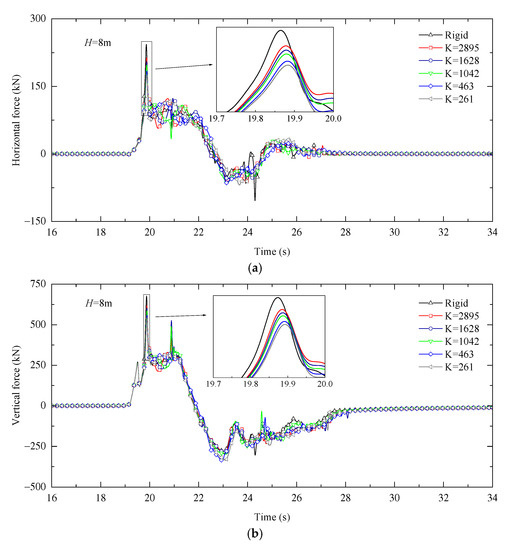
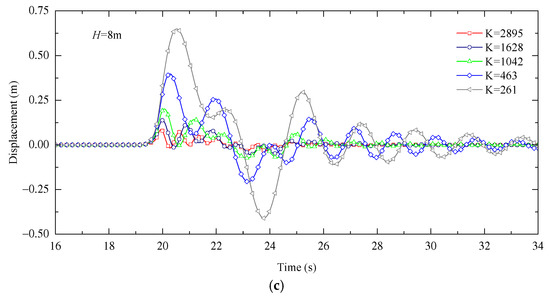
Figure 17.
Example of the box-girder superstructure–wave interaction for Case E23/Cs (1). (a) Comparison of the time histories of horizontal force; (b) Comparison of the time histories of vertical force; (c) Comparison of the time histories of displacement.
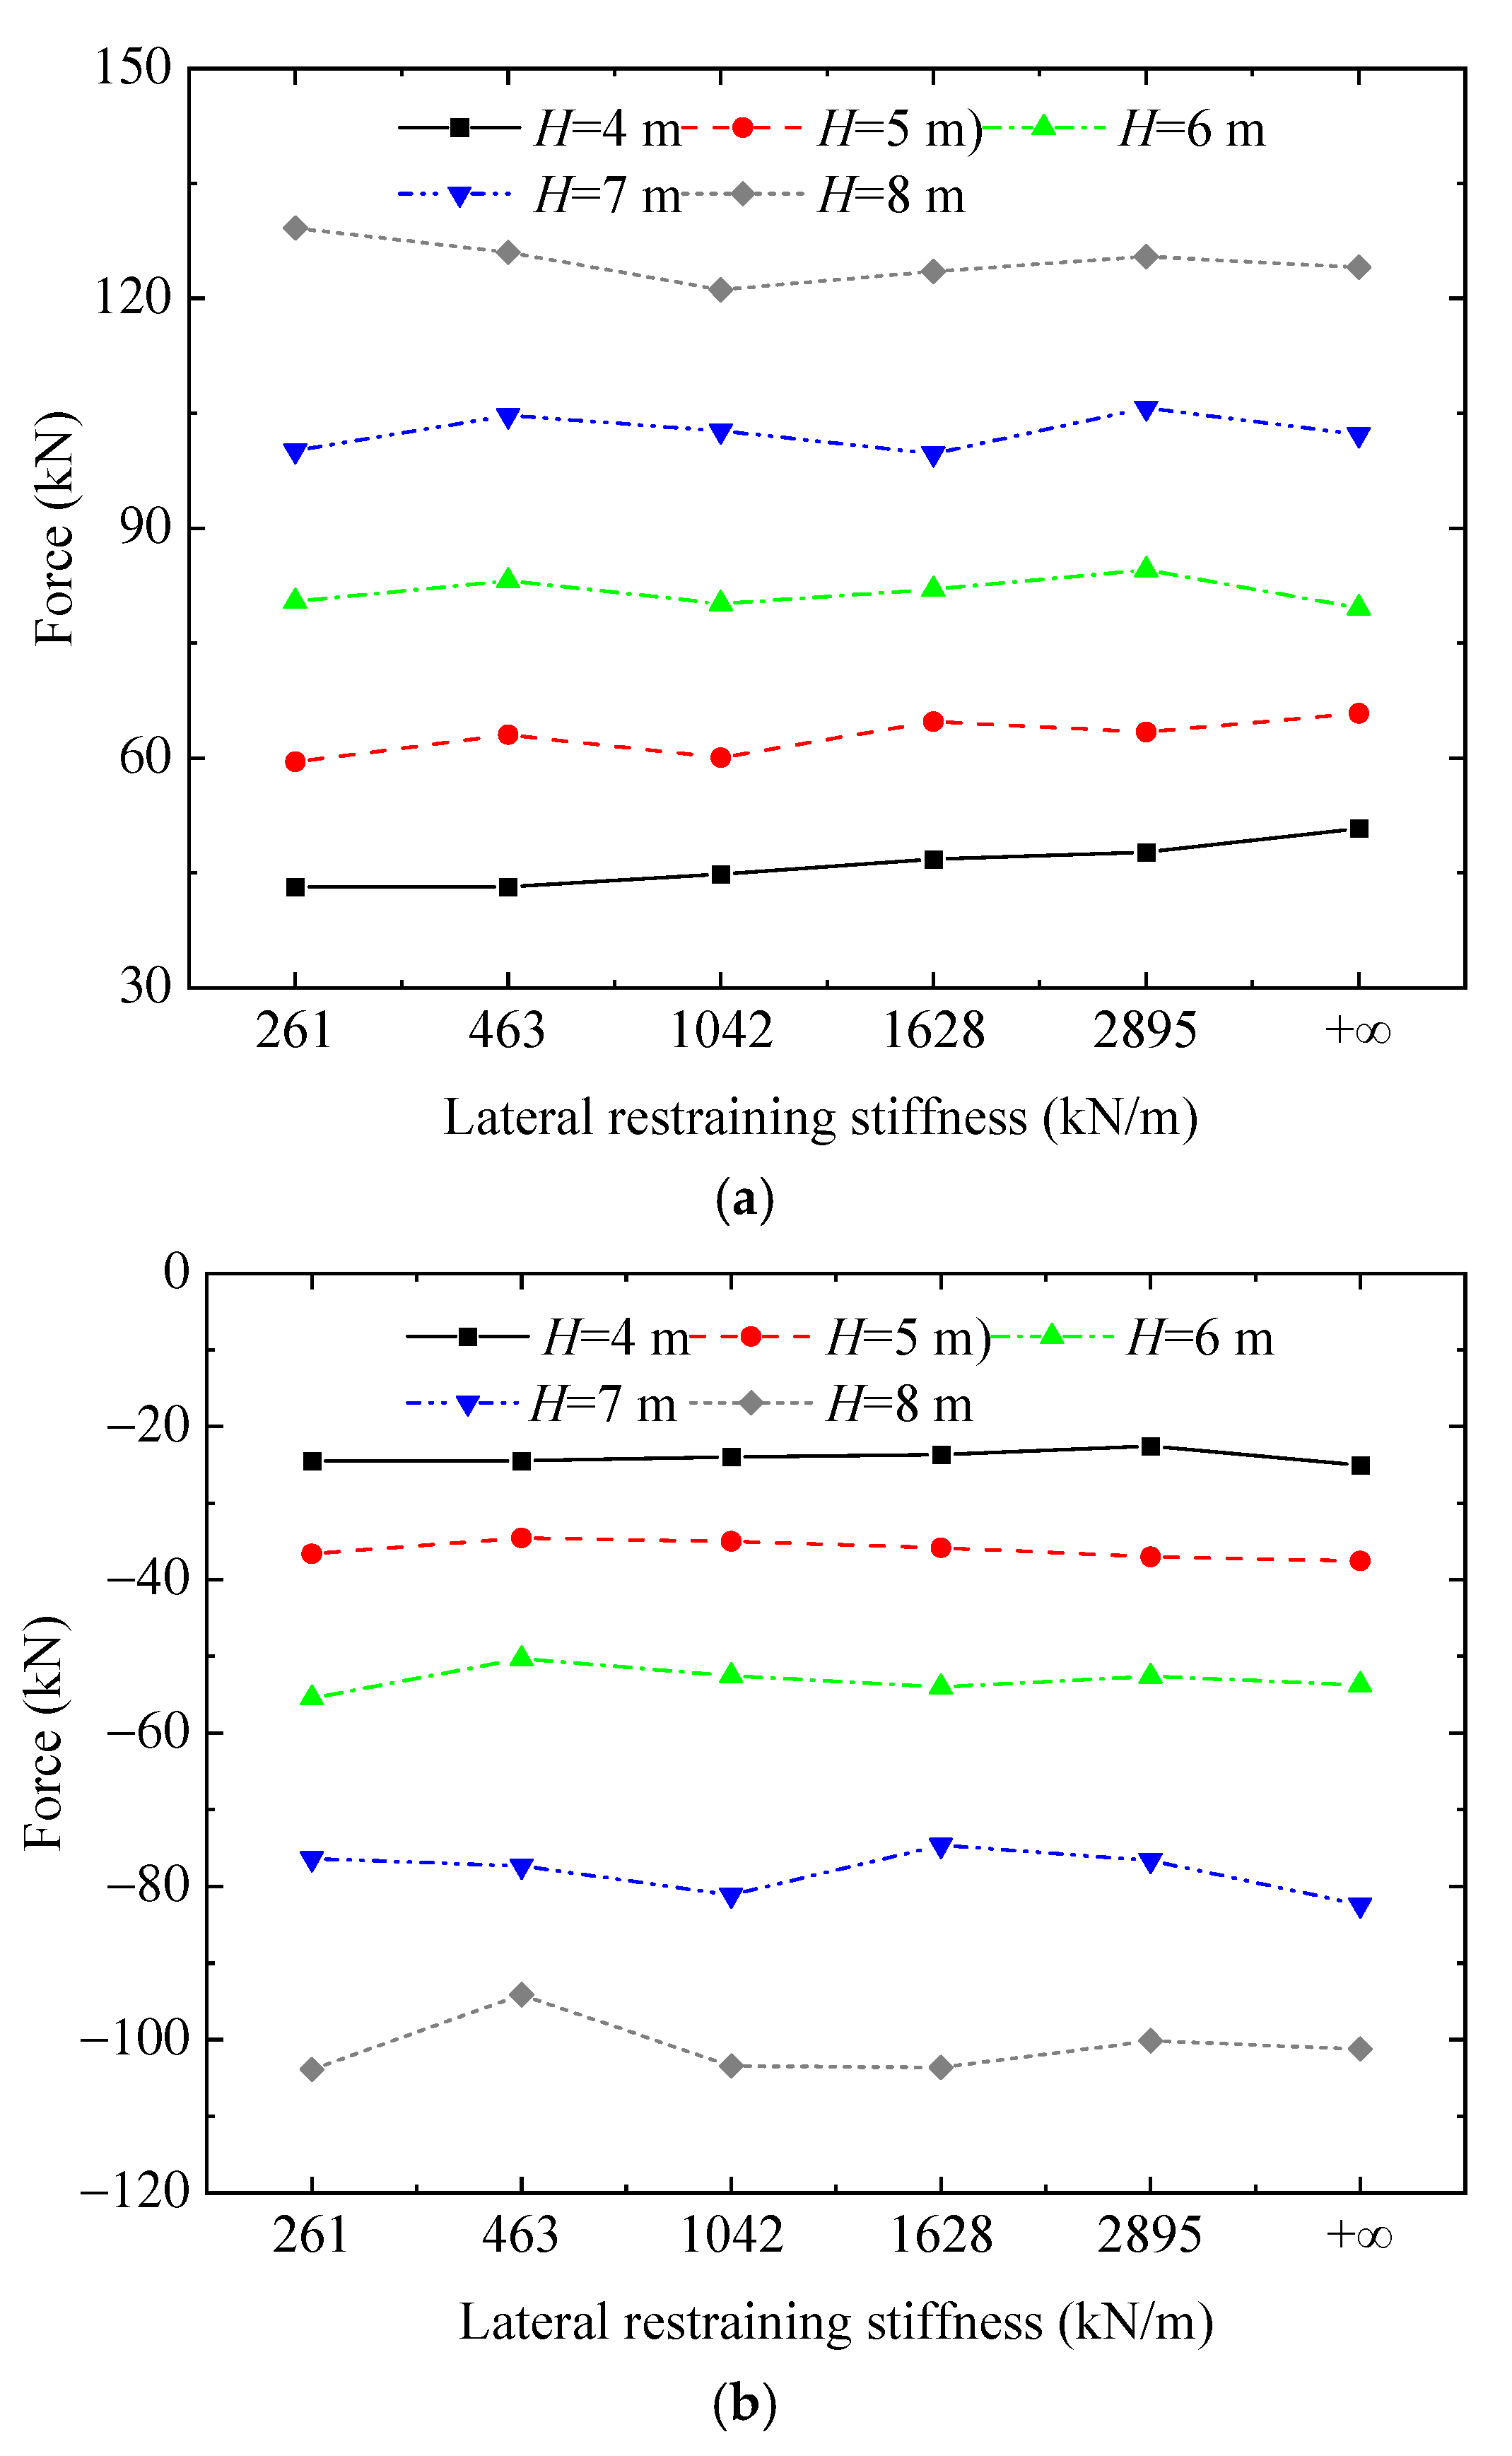
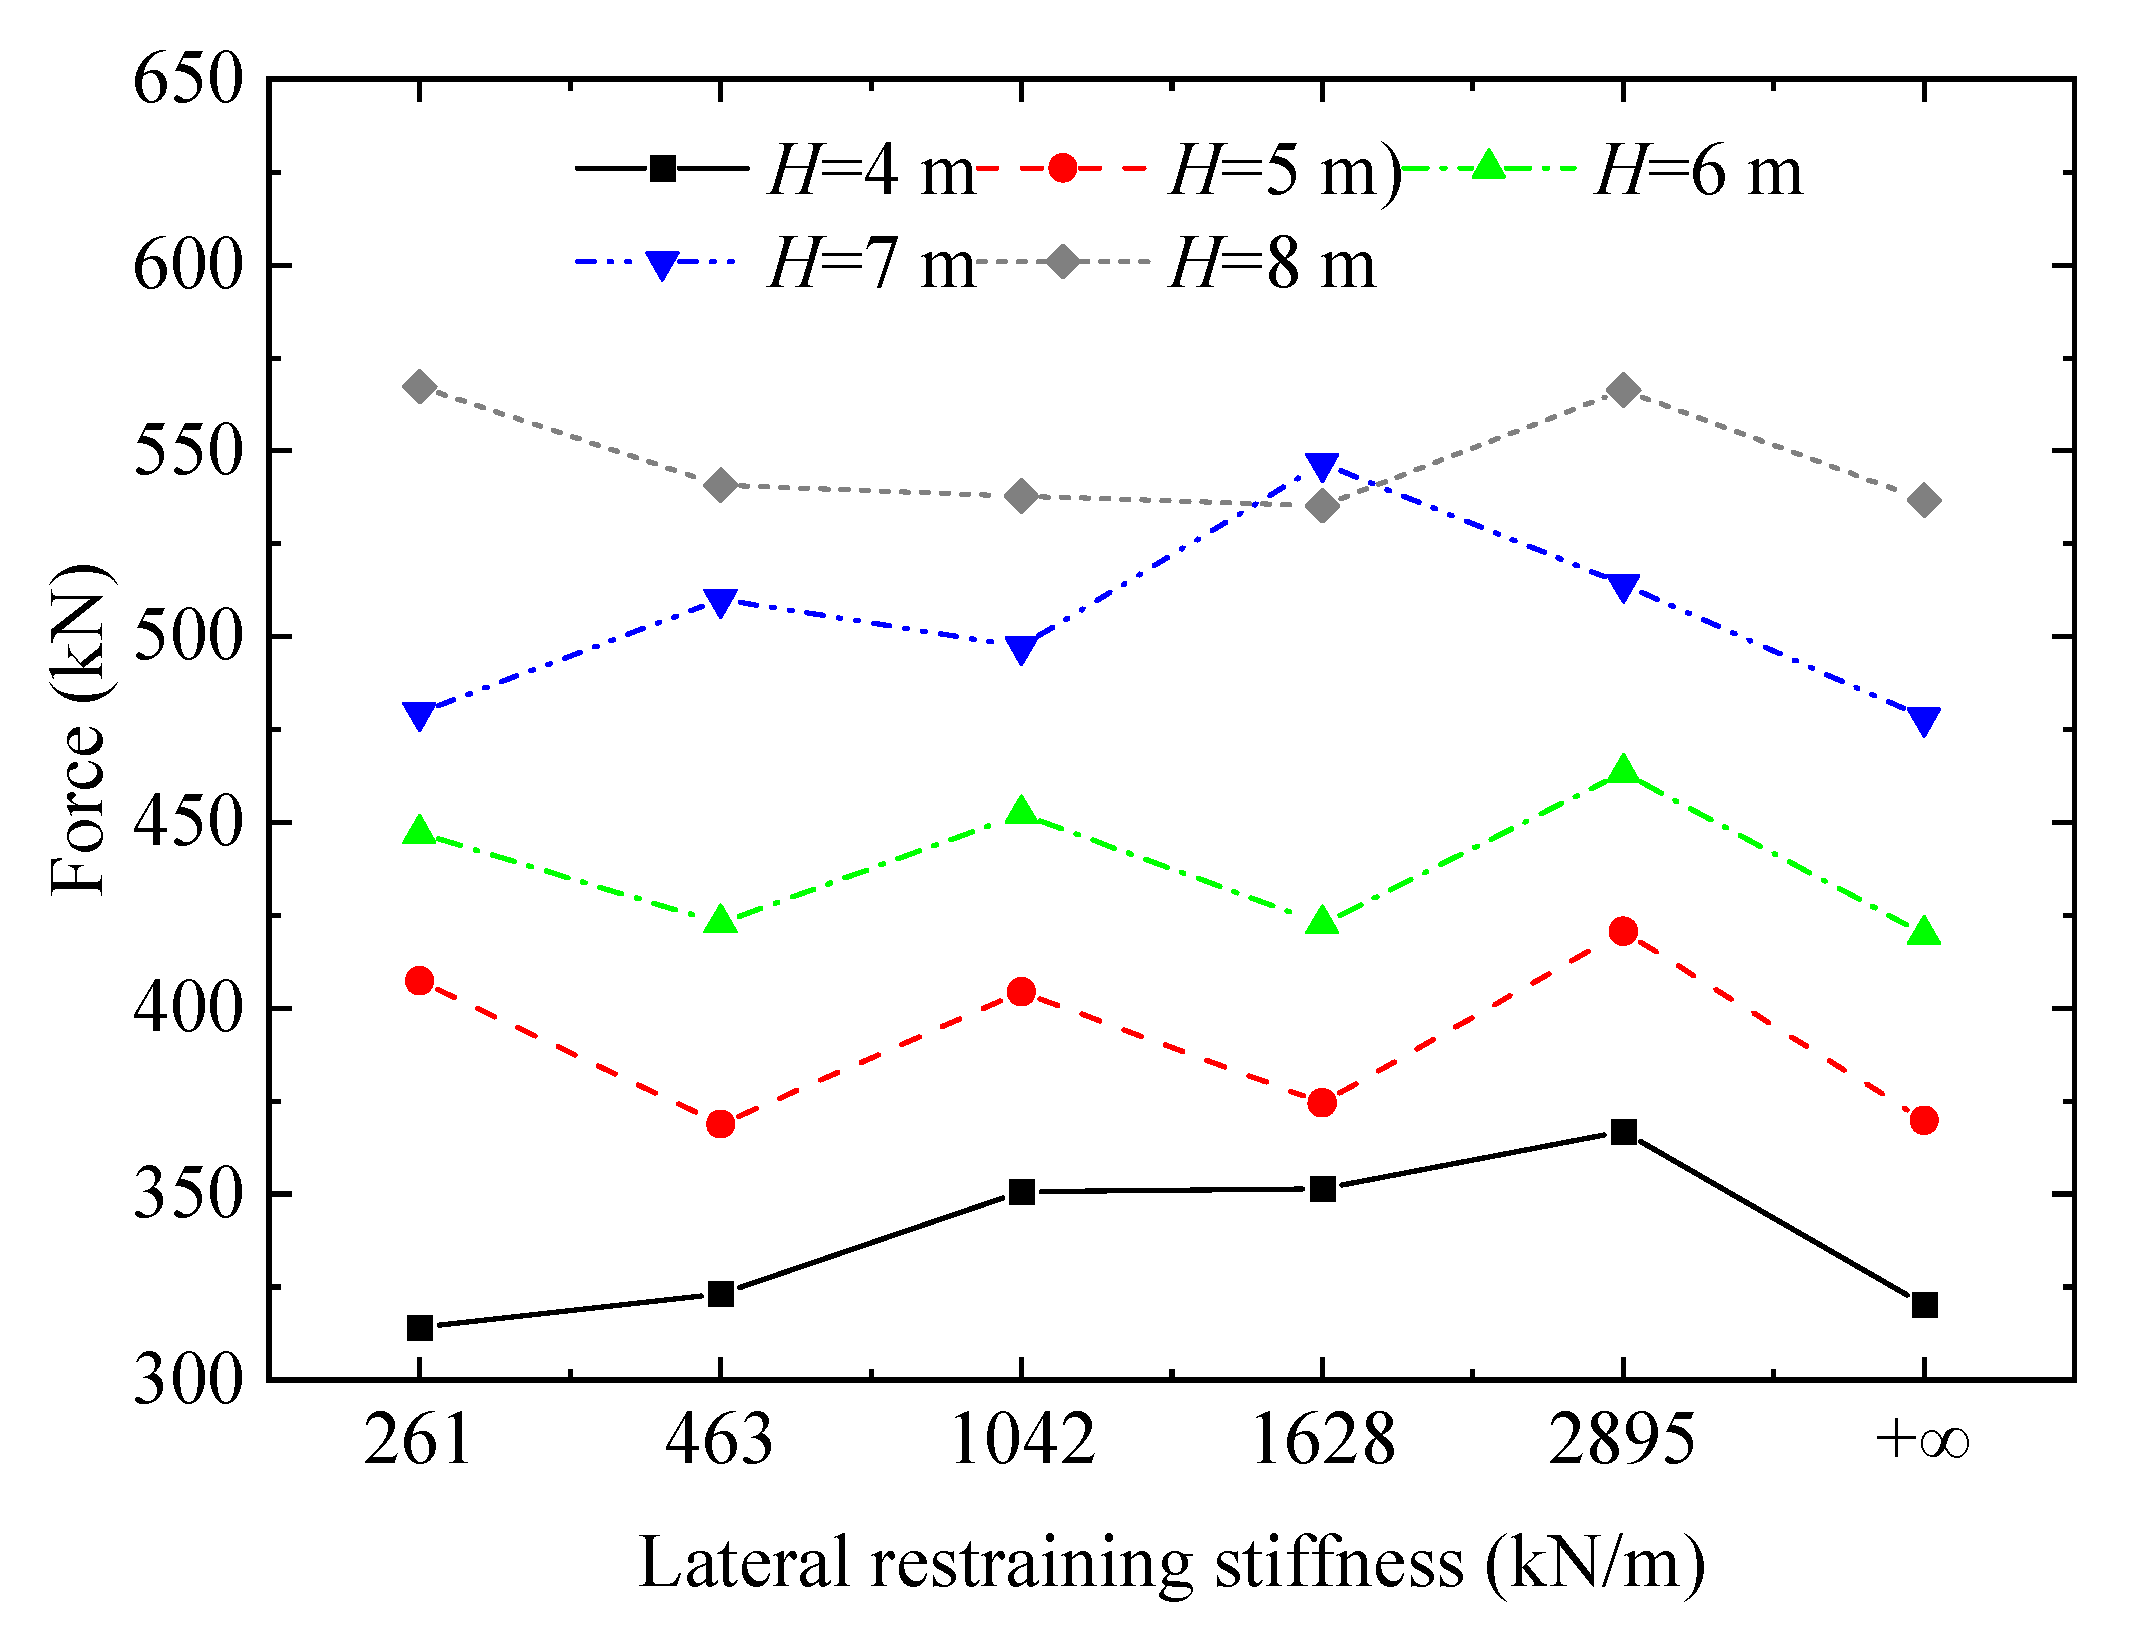
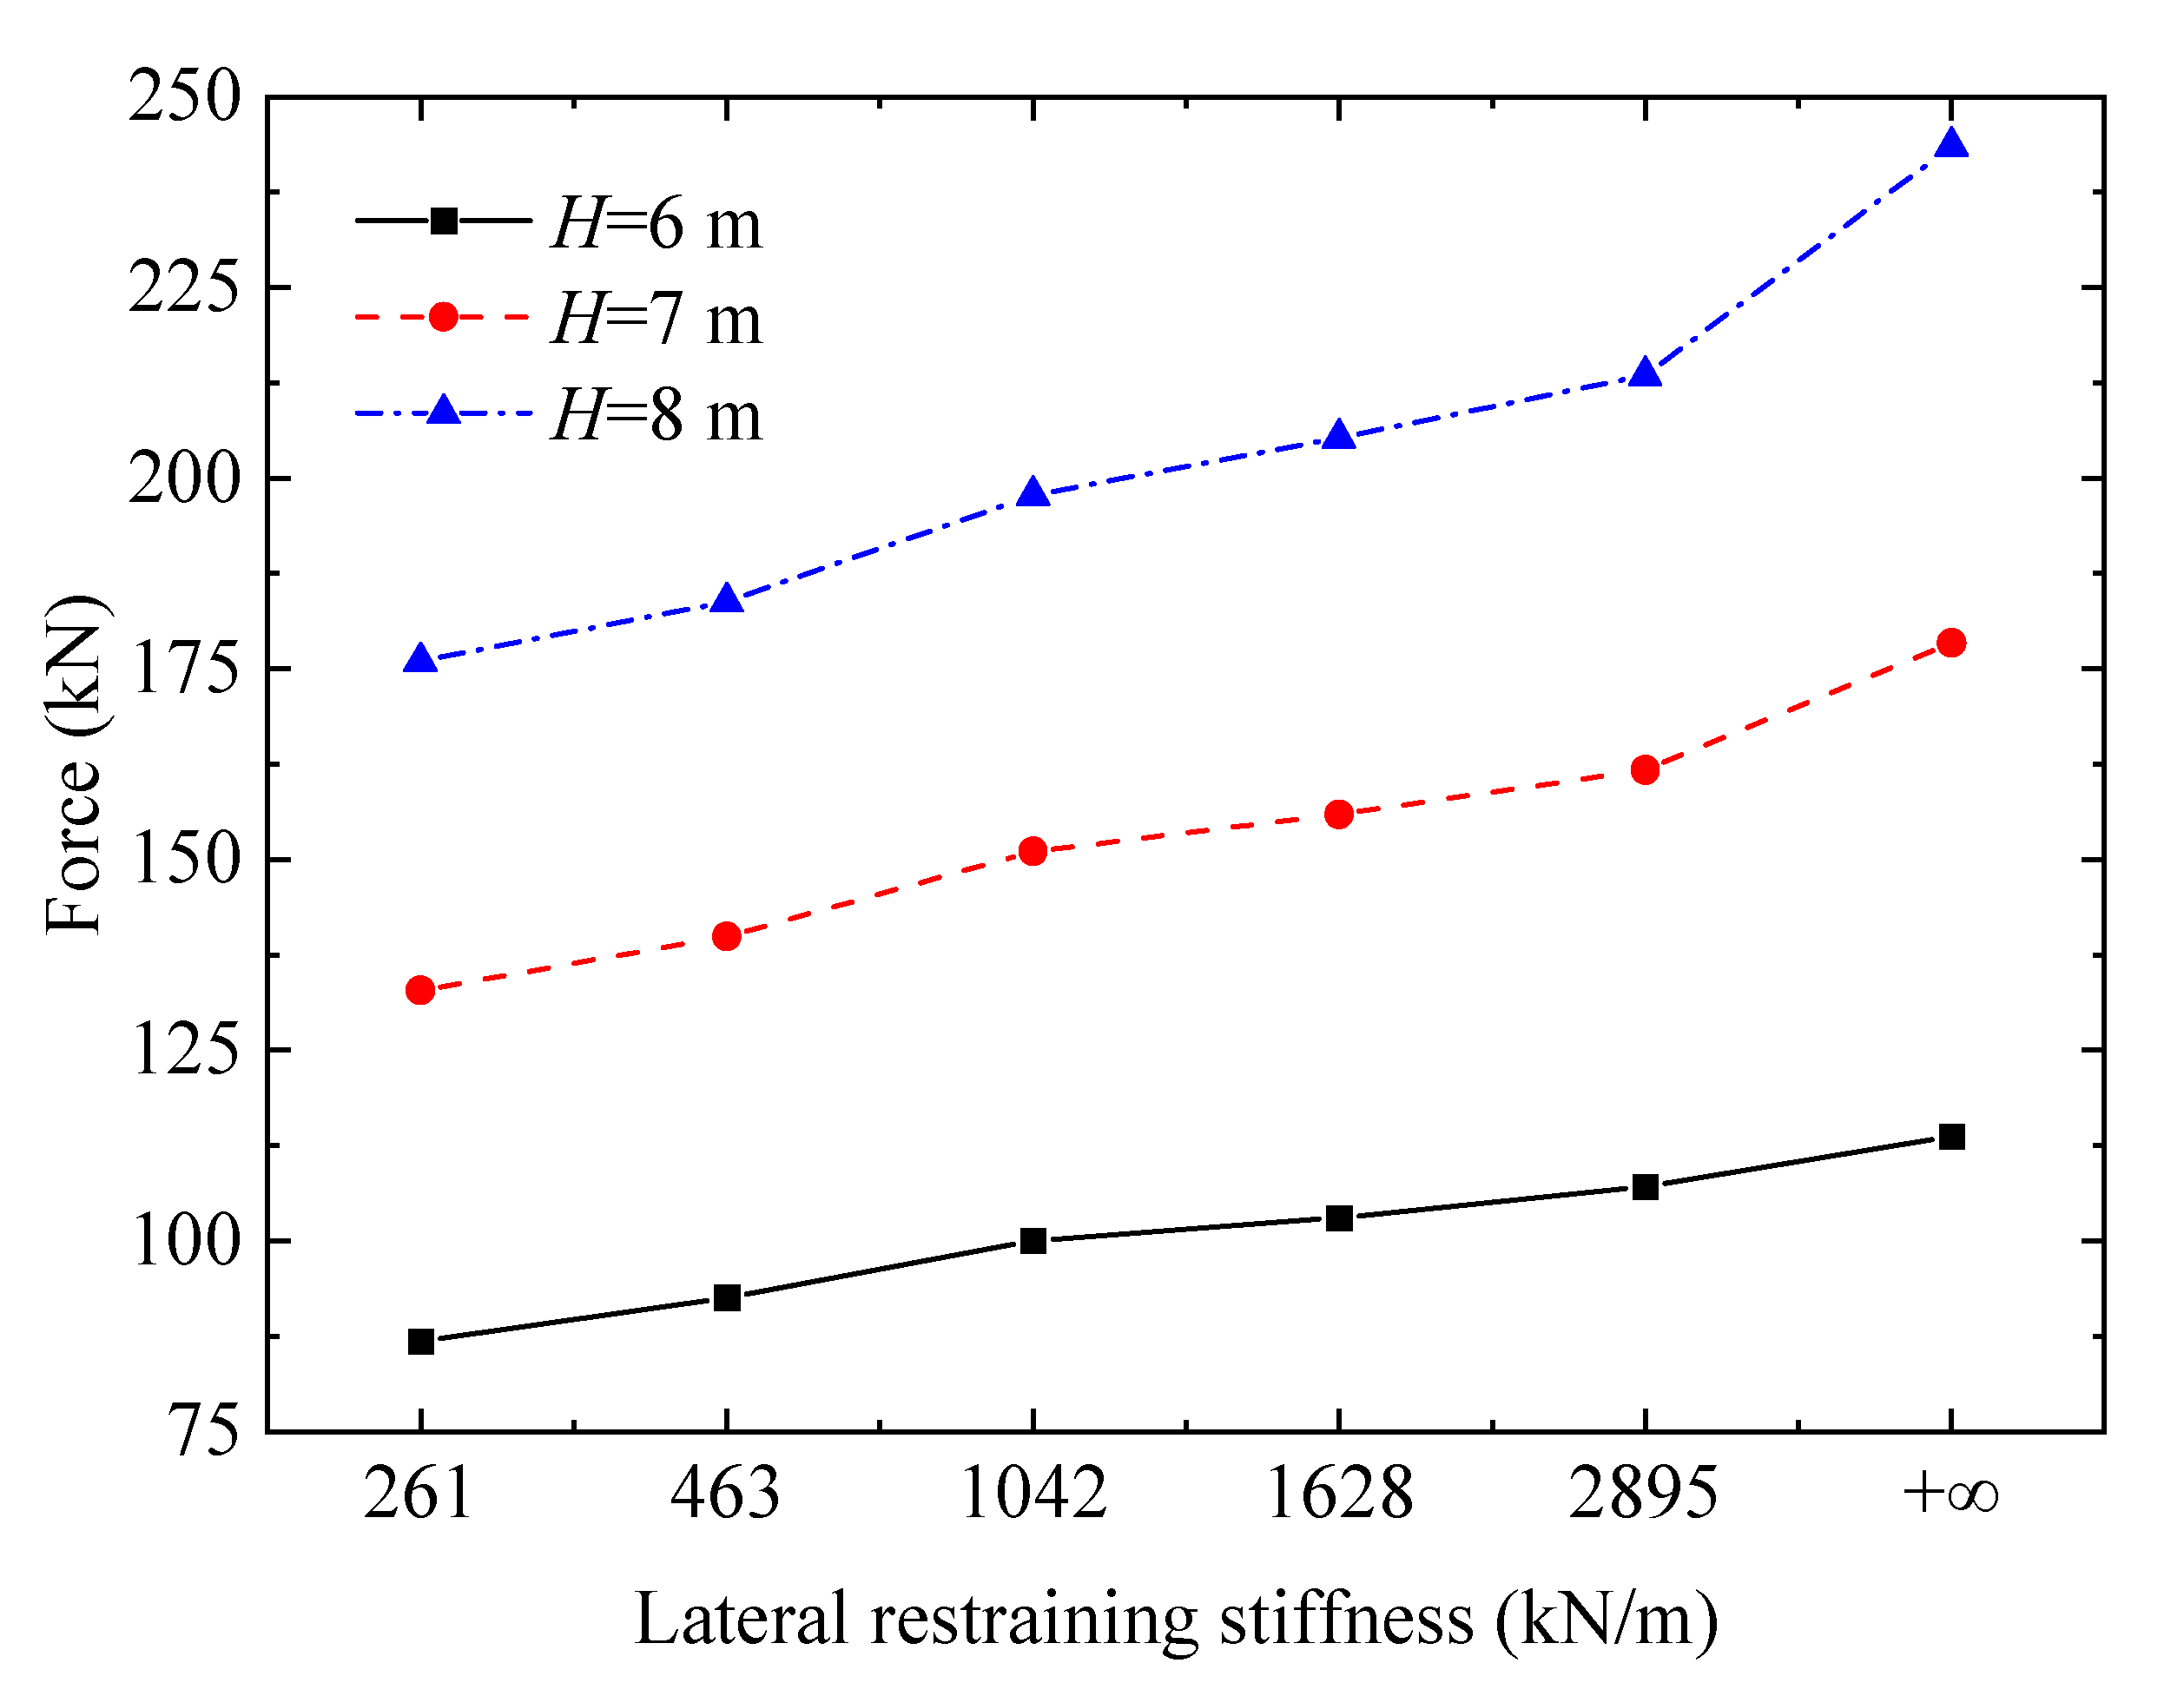
The positive horizontal force which is often used to evaluate the bridge superstructure is discussed here. The influences of different lateral restraining stiffnesses on horizontal peak force, vertical peak force, and structural peak displacement on the box-girder superstructure in Case E23/Cs (1) are shown in Figure 18, Figure 19 and Figure 20, respectively. As shown in Figure 18 and Figure 19, the horizontal peak force and the vertical peak force on the box-girder superstructure under the same wave action can be reduced by reducing the lateral restraining stiffness of the box-girder superstructure. However, with the decrease in lateral restraining stiffness, the lateral peak displacement of the box-girder superstructure would increase as shown in Figure 20. In the process of interaction between the wave and the box-girder superstructure, the wave forces rise rapidly to the maximum value due to the impact of the wave when the wave begins to act on the box-girder superstructure, which also leads to the displacement of the box-girder superstructure. Due to the displacement, the influence of lateral restraining force and the surrounding water on the box-girder superstructure leads to the decrease in the maximum wave force compared with the maximum wave force on the fixed box-girder superstructure. In the meantime, the coupling effect of box-girder superstructure and fluid also aggravates the fluctuation of wave forces.
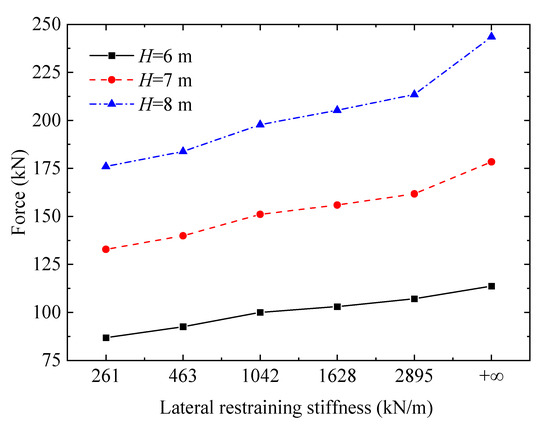
Figure 18.
Influence of the lateral restraining stiffnesses on the horizontal force for Case E23/Cs (1).
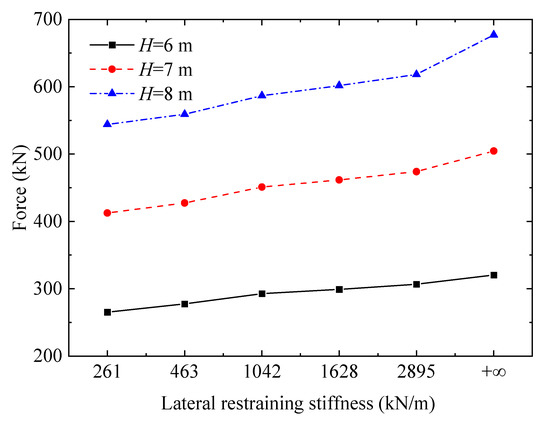
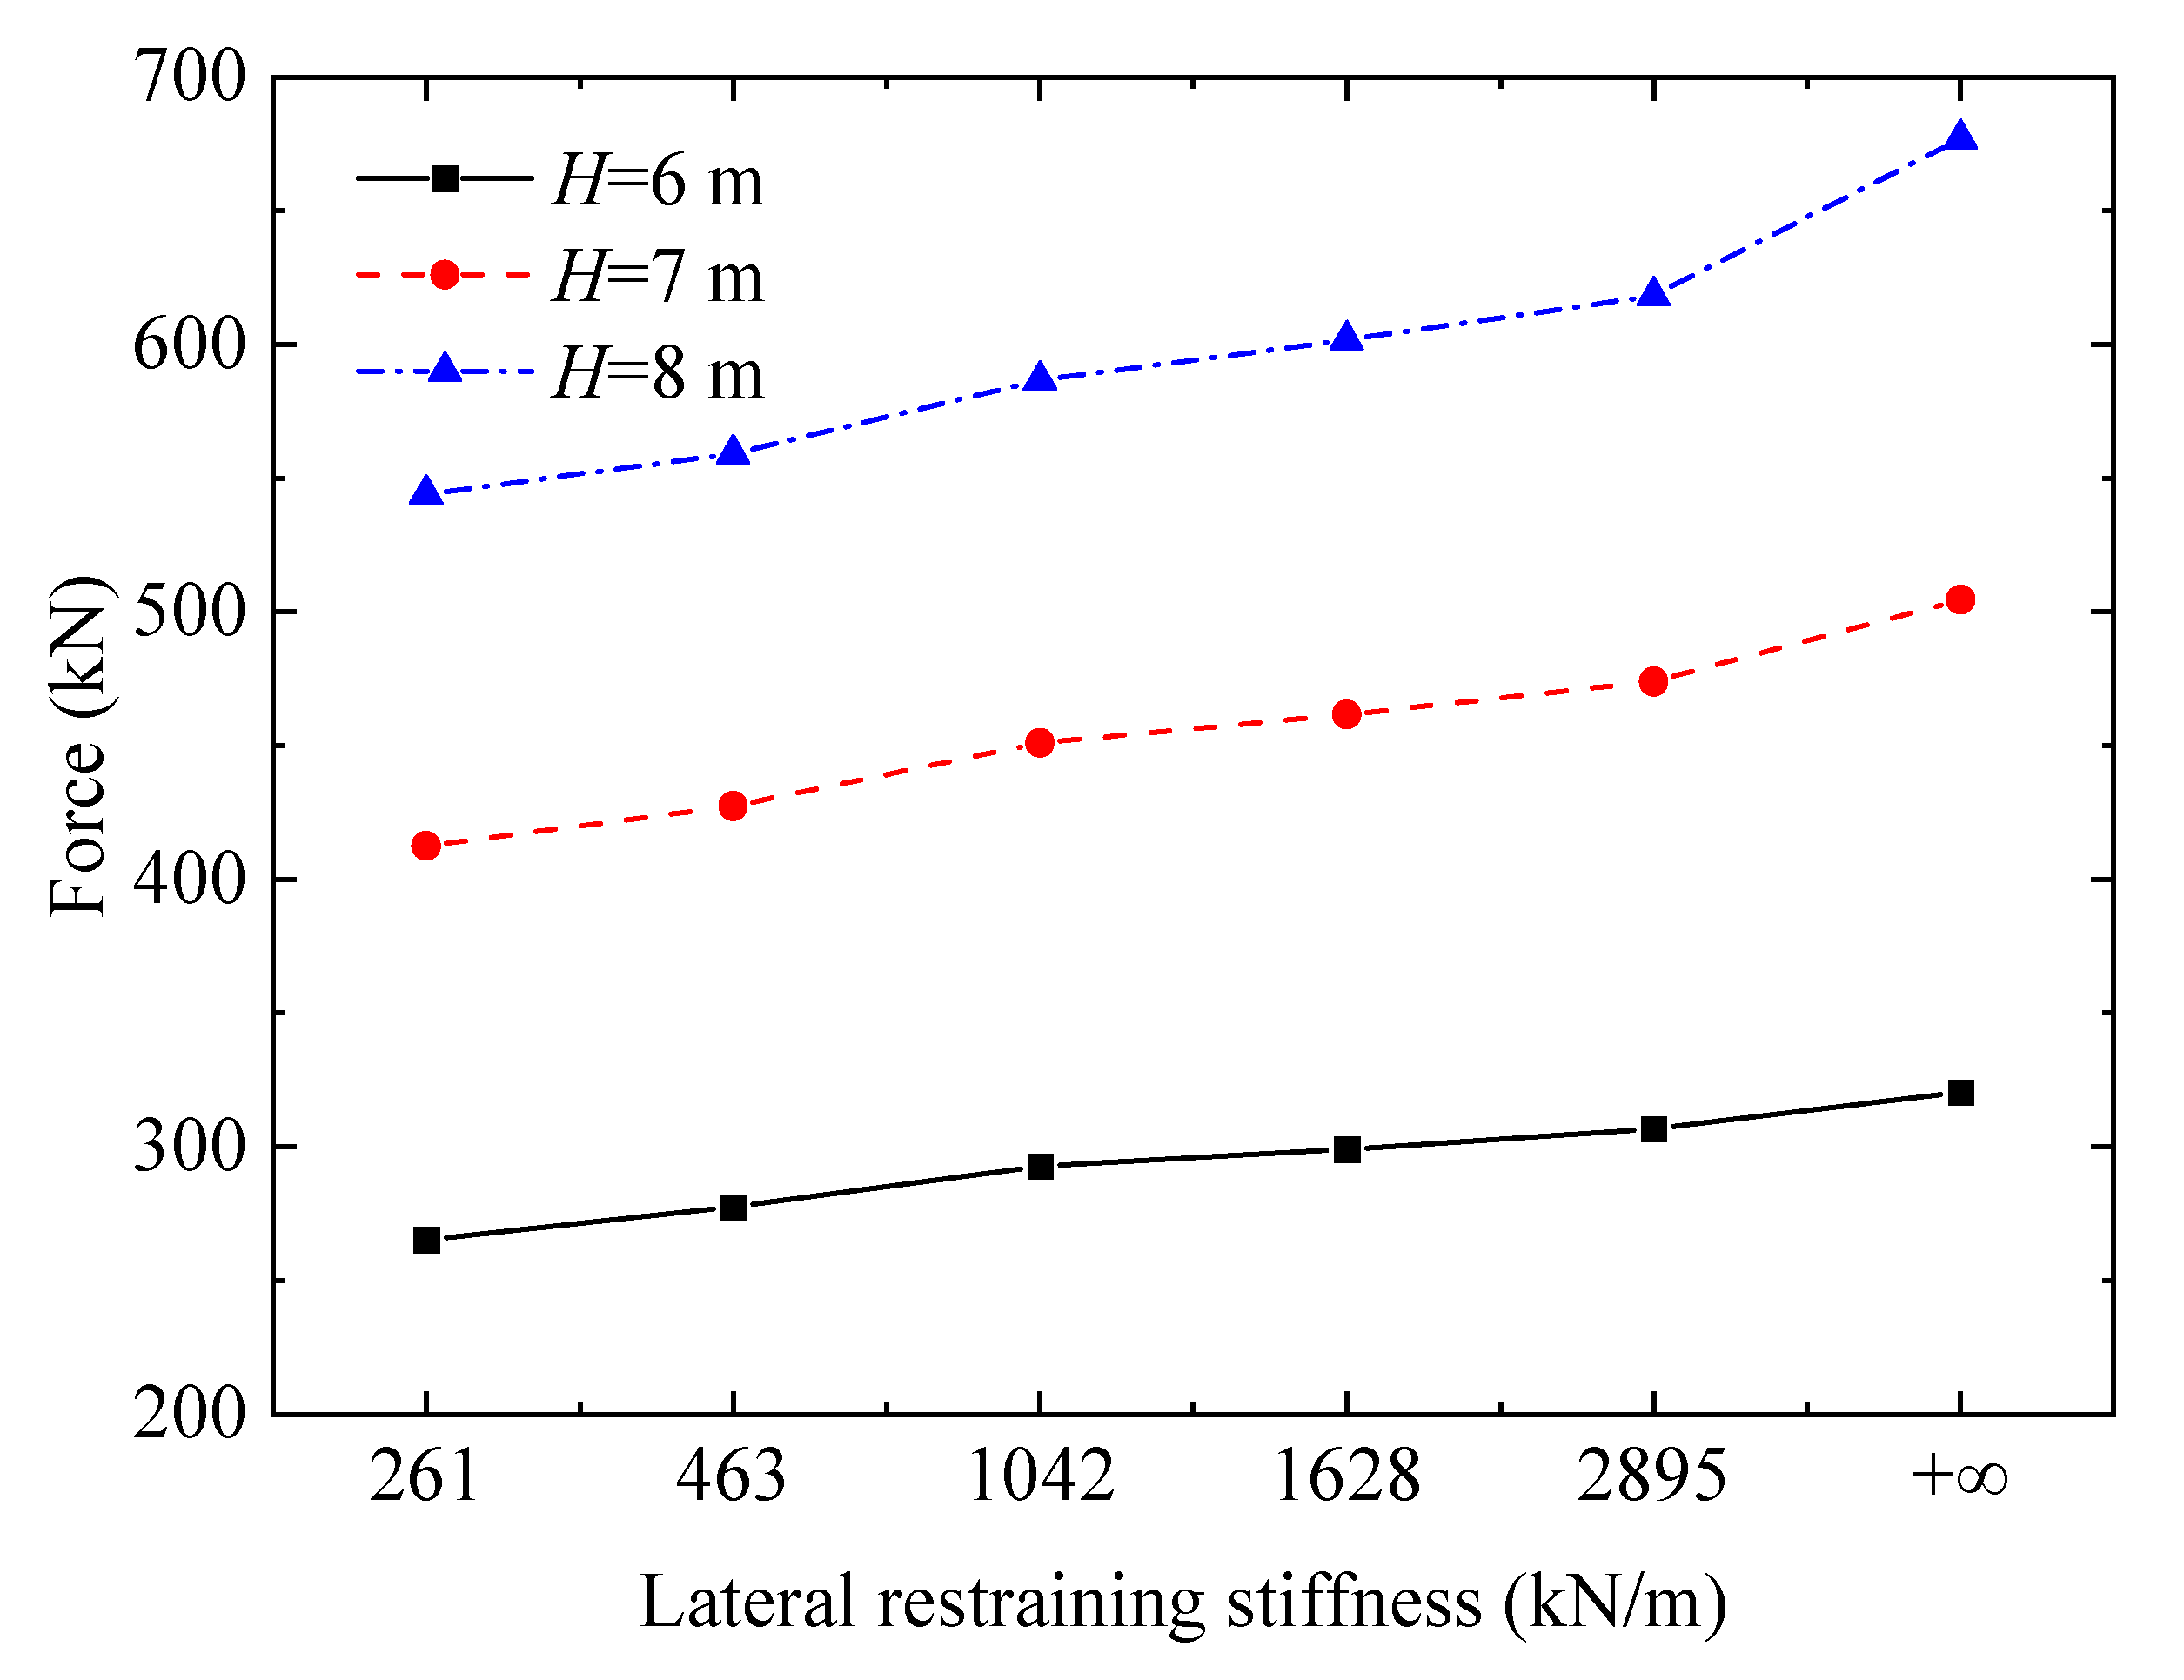
Figure 19.
Influence of the lateral restraining stiffnesses on the vertical force for Case E23/Cs (1).
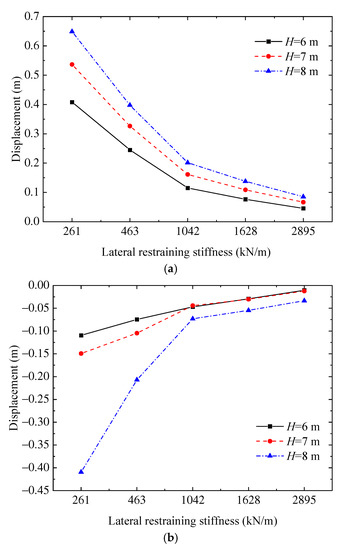
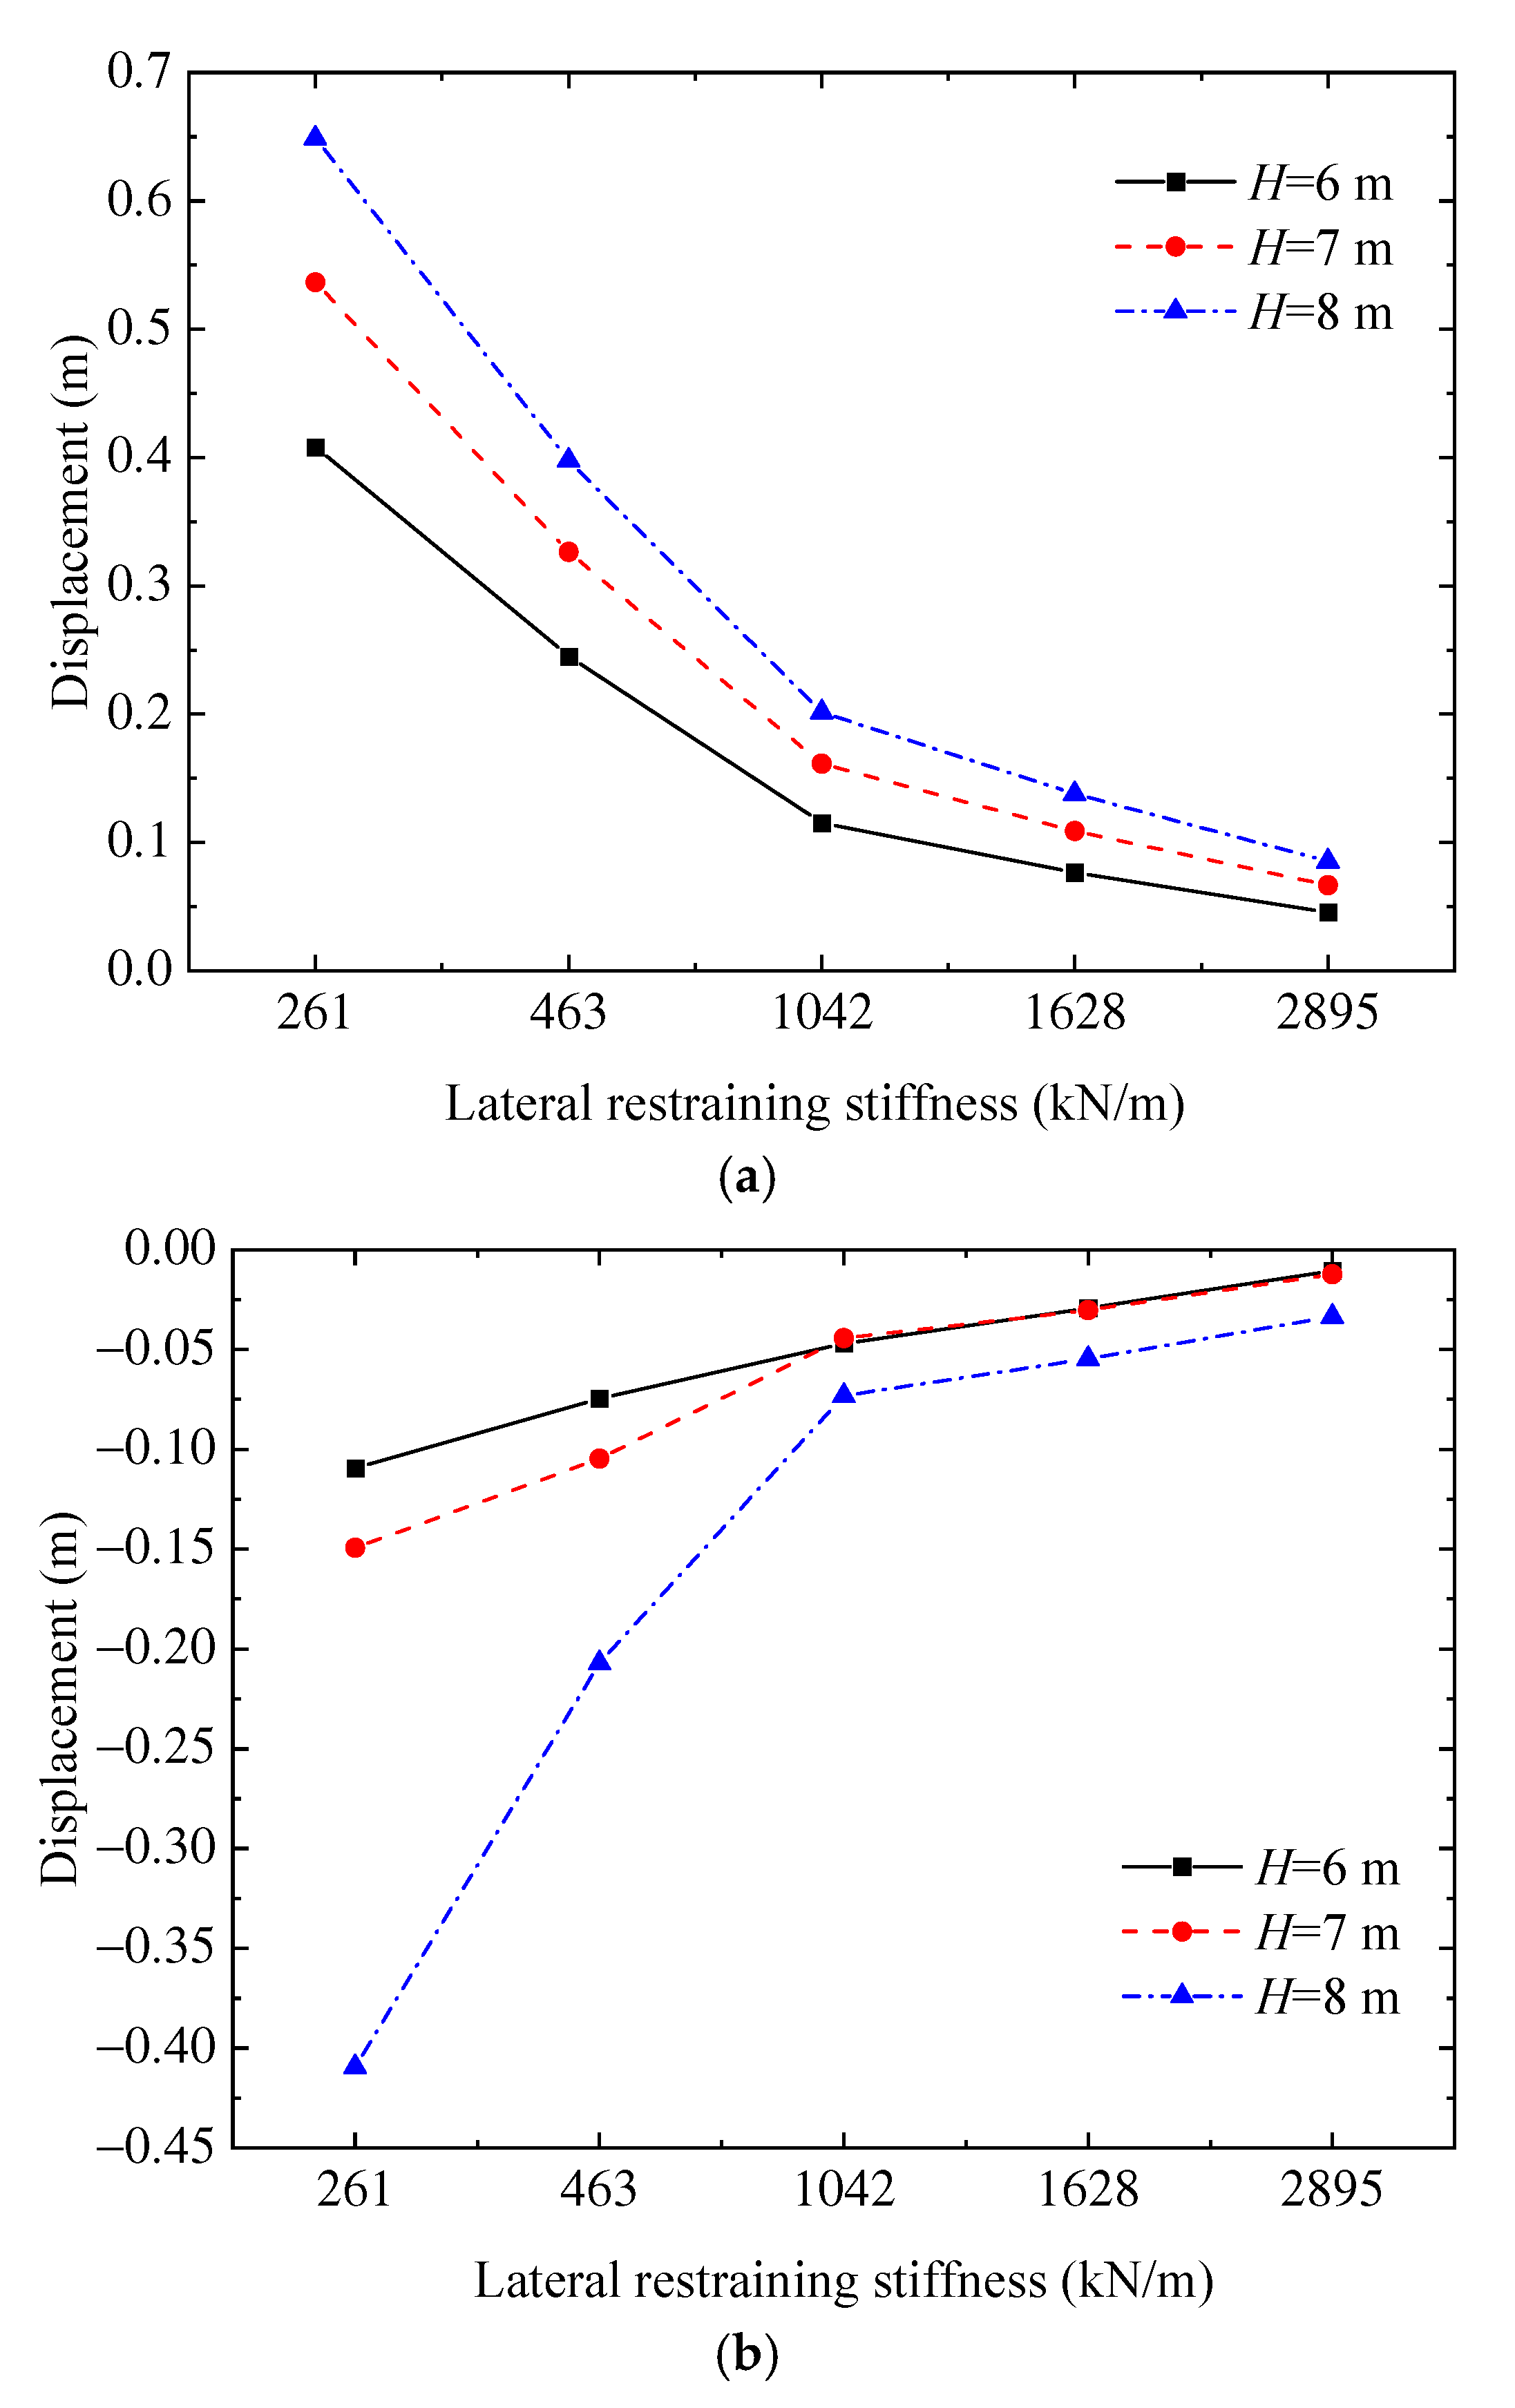
Figure 20.
Influence of the lateral restraining stiffnesses on the peak displacement for Case E23/Cs (1). (a) Positive displacement; (b) Negative displacement.
In general, the maximum wave forces on the coastal box-girder superstructure under the action of solitary waves show a decreasing trend with the decrease in the lateral restraining stiffness. The wave force in Case E23/Cs (1) under the wave action with a wave height of 8 m is shown in Figure 18 and Figure 19. Compared with the fixed box-girder superstructure, the horizontal peak force on the flexible box-girder superstructure is reduced by up to 27.21%, and the vertical peak force is reduced by up to 19.65% when the wave height is 8 m. Indicating that the wave force on the coastal box-girder superstructure can be effectively reduced by considering fluid–structure coupling in the wave force calculation process.
4.3. Coupling Behavior
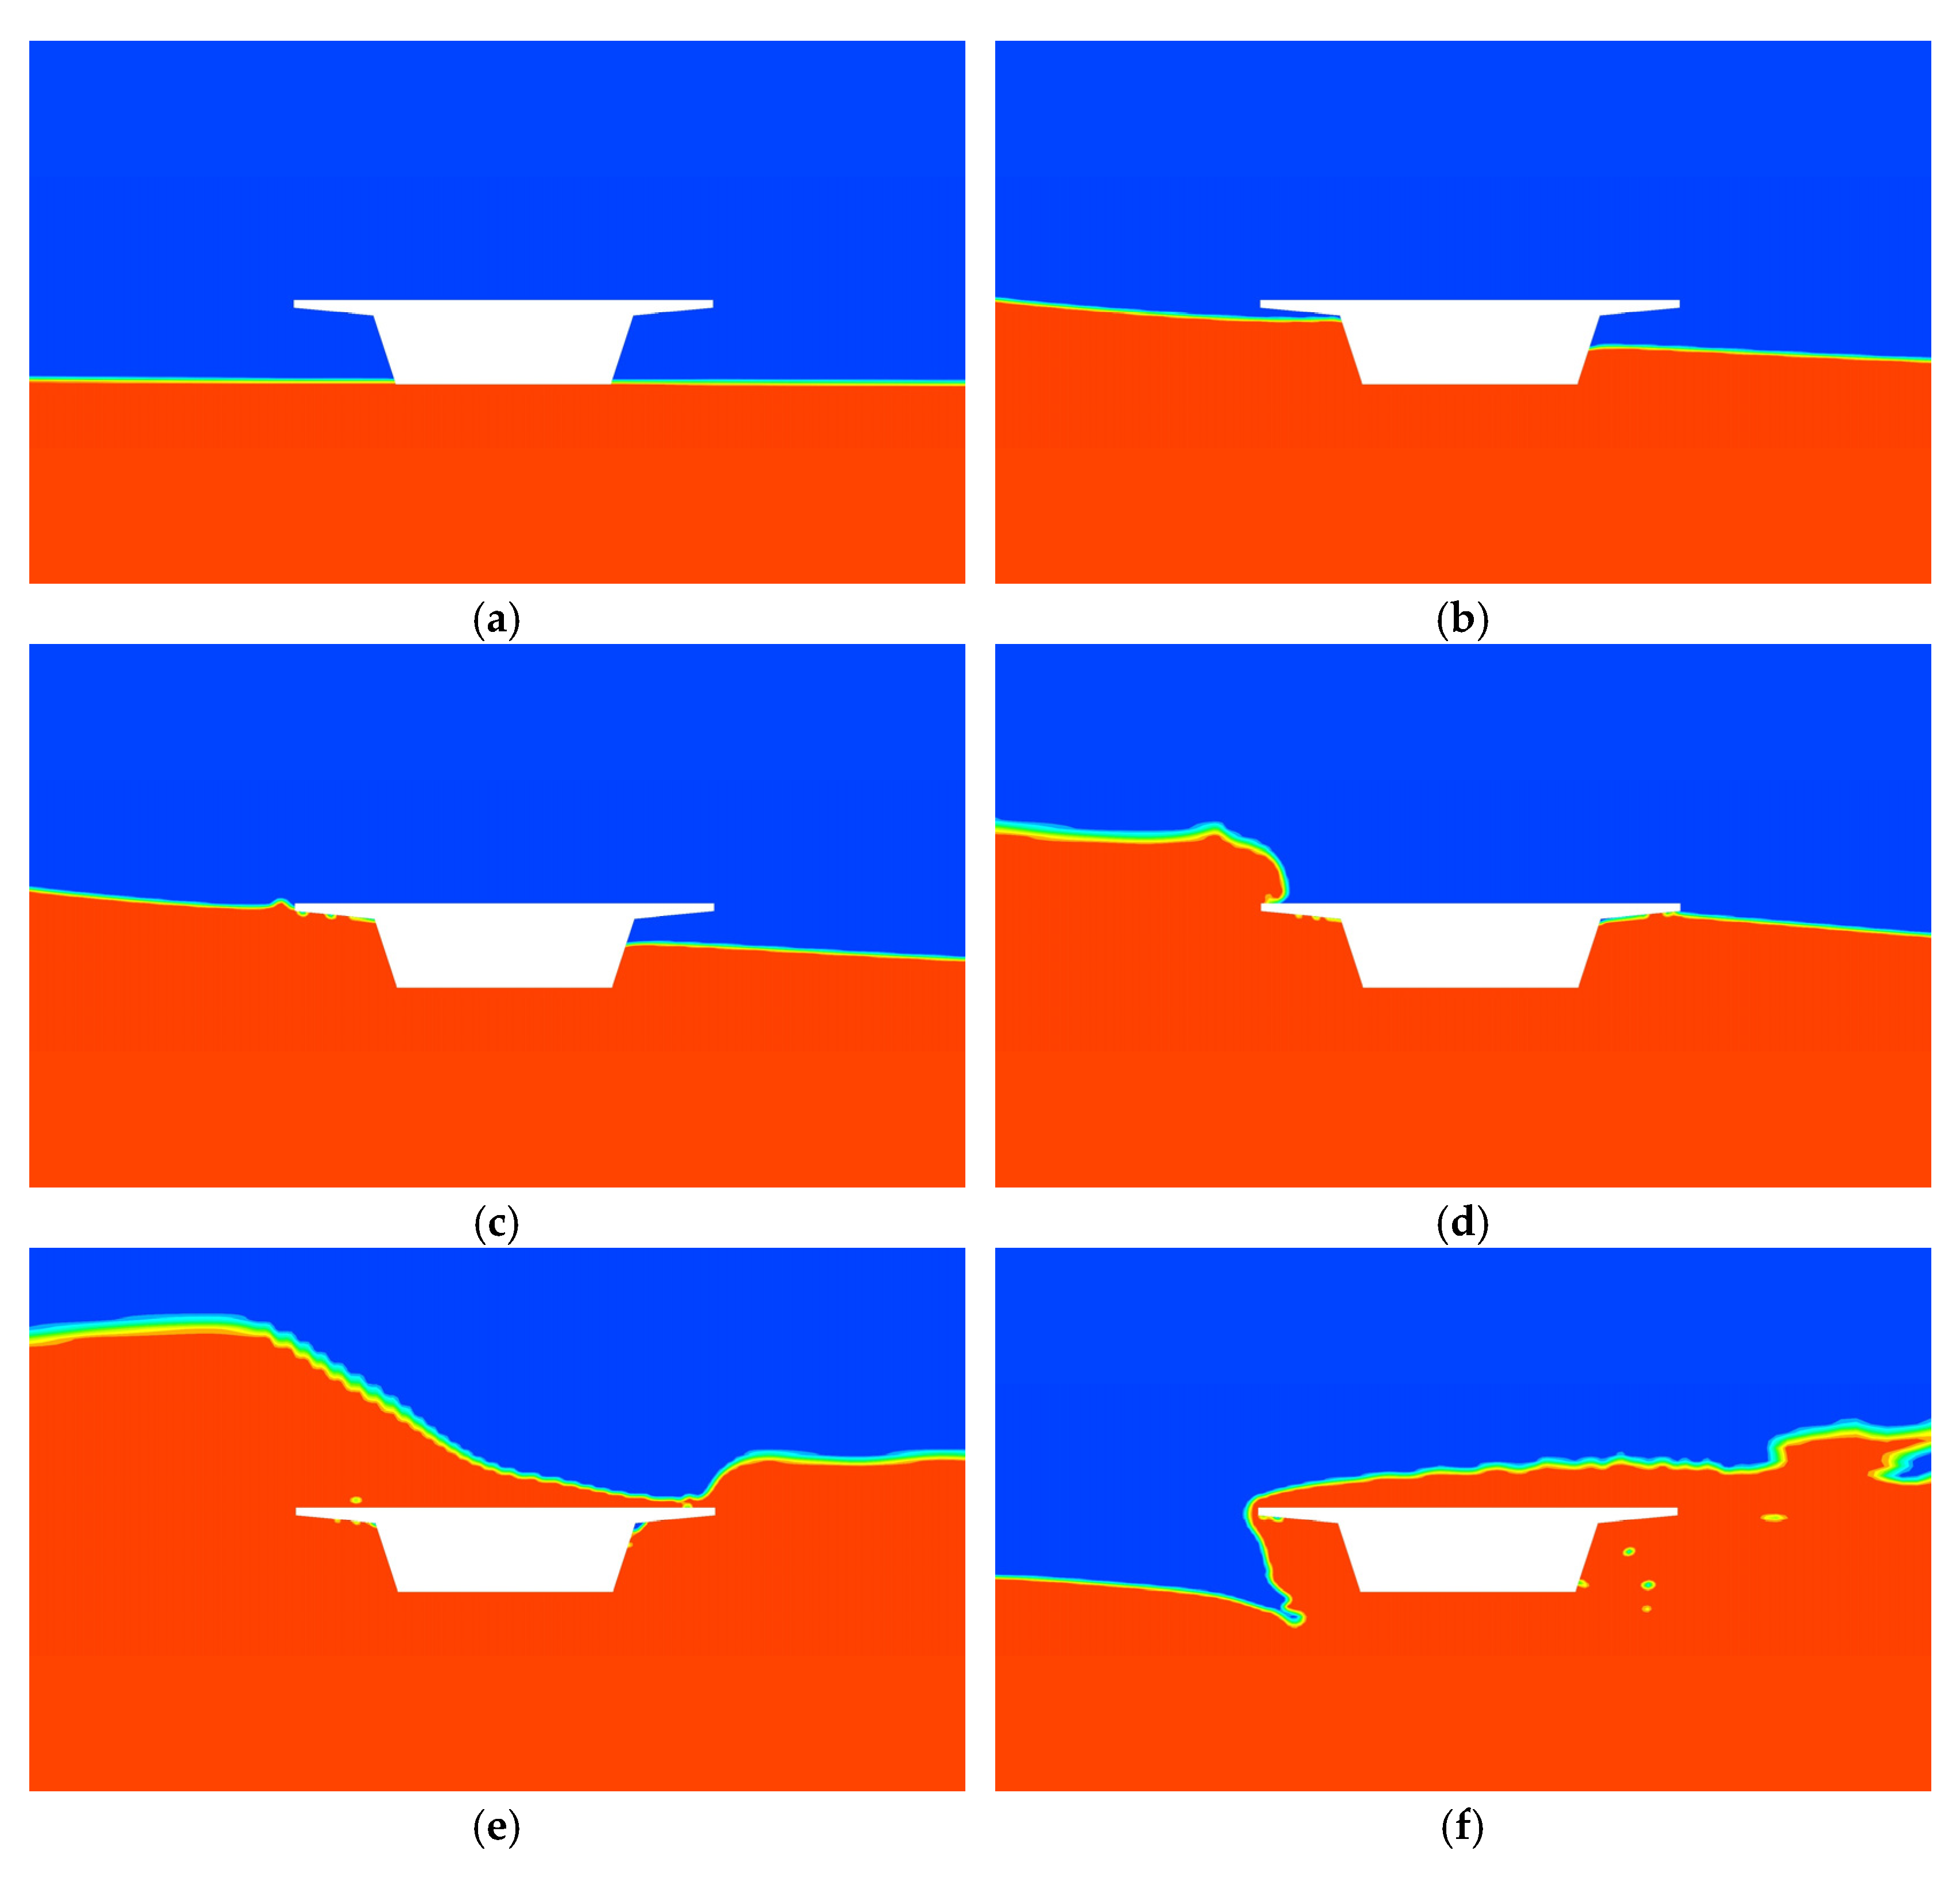
As discussed in Figure 13 and Figure 16, the displacement of the box-girder superstructure varies with the submersion coefficient, wave height, and lateral restraining stiffness. However, the time history of the horizontal force and the time history of the displacement of the box-girder superstructure almost have the same development pattern. The trend of the time-history curves is very consistent in all cases, including the mutation on the curve, a crest and a trough, indicating that there is a coupling behavior between them. Taking the time histories of horizontal force and displacement for Case E20/Cs (0) under wave action with a wave height of 8 m as an example in Figure 16, the relations between them are elaborated. The characters (a to f) in Figure 16a,b represent 10 snapshots of the box-girder superstructure–wave interaction, as shown in Figure 21.

Figure 21.
Snapshots in the bridge deck–wave interaction for K = 1628 of the Case E20/Cs (0). (a) 14.40 s; (b) 18.24 s; (c) 18.48 s; (d) 19.32 s; (e) 21.00 s; (f) 24.36 s.
When the wave surface just acts on the bottom of the flange plate, the horizontal force increases sharply as shown in the snapshot Figure 21b. The extreme value of the first abrupt change is reached when the wave acts on the bottom of the side of the flange plate of the box-girder superstructure as shown in the snapshot Figure 21c, and the extreme value of the second abrupt change is reached when the wave acts on the top of the side of the flange plate of the box-girder superstructure as shown in the snapshot Figure 21d. It shows that the two sudden changes of wave force on the box-girder superstructure under wave action are caused by the wave acting on the bottom of the unique flange plate of the box-girder superstructure. When the wave crest almost reaches the front of the box-girder superstructure and the box-girder superstructure is just submerged, the horizontal force and displacement almost reach the maximum value at the same time, as shown in the snapshot Figure 21e. Then, the horizontal force becomes smaller as the wave continues to move forward. At this time, the lateral restraining force of the box-girder superstructure is greater than the horizontal force, which causes the box-girder superstructure to move in the opposite direction. Until the maximum negative displacement is reached as shown in Figure 21f, the box-girder superstructure would move in the positive direction due to the lateral restraining force of the box-girder superstructure being greater than the negative horizontal force on the box-girder superstructure. Finally, as the wave spreads far away, the vibration of the box-girder superstructure will eventually be completely damped.
5. Conclusions
In this study, a two-dimensional numerical model is established based on the Reynolds-averaged Navier–Stokes (RANS) equations to analyze the dynamic characteristics of the box-girder superstructure under five wave heights, three submersion coefficients and six lateral restraining stiffnesses. After the parametric study, the conclusions obtained in this paper are as follows:
- (1)
- Based on the dynamic mesh updating technique and a mass–spring–damper system, a numerical model of the interaction between the box-girder superstructure and extreme waves is established in this study. After authoritative experiments and numerical simulations of a T-girder superstructure and box-girder superstructure were compared, it was verified that the proposed numerical model can well capture the dynamic characteristics of the box-girder superstructure under extreme wave action.
- (2)
- The wave forces on the box-girder superstructure under extreme wave action can be effectively reduced by reducing the lateral restraining stiffness of the box-girder superstructure.
- (3)
- In the actual design of the box-girder superstructure, while reducing the wave forces on the box-girder superstructure under extreme wave action by reducing the lateral restraining stiffness, the influence of the increase in the lateral displacement of the box-girder superstructure caused by the decrease in the lateral restraining stiffness should also be fully considered.
- (4)
- Compared with the fixed box-girder superstructure, the wave force prediction of the box-girder superstructure with consideration of the fluid–structure coupling effect under extreme wave action is more reasonable. It can truly reflect the dynamic characteristics of the box-girder superstructure under extreme waves.
- (5)
- There is a significant coupling behavior between the horizontal force and the displacement on the box-girder superstructure. Therefore, in practical engineering, the lateral displacement limit and the lateral restraining stiffness of the box-girder superstructure should be considered comprehensively. Then the appropriate lateral restraining stiffness should be selected to reduce the wave forces on the box-girder superstructure under extreme wave action, so as to improve the safety of the coastal box-girder superstructure under extreme wave action.
- (6)
- As far as the actual situation is concerned, the 2D numerical simulation used in this study may not fully capture the dynamic characteristics of the box-girder superstructure–wave interaction due to its limitations. To obtain more realistic results of the interaction between the flexible bridge superstructure and wave, a 3D numerical model can be used in the future.
- (7)
- In future related studies, we will consider the effect of the tributary mass associated to the stiffness of the pier-bearing system and additional pavement and other road-related permanent loads on the bridge–wave coupling.
Author Contributions
Writing—original draft preparation, data curation, M.C.; visualization, B.H.; conceptualization, writing—review and editing, Z.Y. and B.H.; supervision, Q.R. and B.Z. All authors have read and agreed to the published version of the manuscript.
Funding
The authors are grateful for the support of this research by the National Natural Science Foundation of China (52008065), the Postdoctoral Research Foundation of China (2020M683229), the General Project of Chongqing Natural Science Foundation (cstc2021jcyj-msxmX1082), the Research Innovation Foundation Designated for Graduate Students of Chongqing Jiaotong University (2022S0011), the Chongqing Municipal Education Commission Science and Technology Research Project (KJQN202000706), the Venture and Innovation Support Program for Chongqing Overseas Returnees (cx2020104), the Key Project of National Key Research and Development Project (2016YFC0802206-3), the Program for Innovation Team Building at Institutions of Higher Education in Chongqing (CXQT19021) and the High-Level Technical Personnel Training Project of Transportation Industry.
Institutional Review Board Statement
Not applicable.
Informed Consent Statement
Not applicable.
Data Availability Statement
The reader can ask for all the related data from the first author (990201900089@cqjtu.edu.cn) and the corresponding author (zhiyingyang@my.swjtu.edu.cn).
Conflicts of Interest
The authors declare no conflict of interest.
References
- Kawashima, K.; Kosa, K.; Takahashi, Y.; Akiyama, M.; Nishioka, T.; Watanabe, G.; Koga, H.; Matsuzaki, H. Damages of bridges during 2011 great east Japan earthquake. In Proceedings of the 43rd Joint Meeting: US-Japan Panel on Wind and Seismic Effects, Tsukuba, Japan, 19–30 August 2011. [Google Scholar]
- Motley, M.R.; Wong, H.K.; Qin, X.; Winter, A.O.; Eberhard, M.O. Tsunami-induced forces on skewed bridges. J. Waterw. Port Coast. Ocean. Eng. 2015, 142, 04015025. [Google Scholar] [CrossRef]
- Wong, H. Three-Dimensional Effects of Tsunami Impacts on Bridges. Ph.D. Thesis, University of Washington, Washington, DC, USA, 2015. [Google Scholar]
- Carey, T.J. Multi-Hazard Framework and Analysis of Soil-Bridge Systems: Long Duration Earthquake and Tsunami Loading. Master’s Thesis, Oregon State University, Corvallis, OR, USA, 2015. [Google Scholar]
- Istrati, D.; Buckle, I.G. Tsunami Loads on Straight and Skewed Bridges-Part 1: Experimental Investigation and Design Recommendations; No. FHWA-OR-RD-21-12; Oregon Department of Transportation, Research Section: Eugene, OR, USA, 2021.
- Istrati, D.; Buckle, I.G. Tsunami Loads on Straight and Skewed Bridges-Part 2: Numerical Investigation and Design Recommendations; No. FHWA-OR-RD-21-13; Oregon Department of Transportation, Research Section: Eugene, OR, USA, 2021.
- Istrati, D.; Buckle, I.; Lomonaco, P.; Yim, S. Deciphering the tsunami wave impact and associated connection forces in open-girder coastal bridges. J. Mar. Sci. Eng. 2018, 6, 148. [Google Scholar] [CrossRef] [Green Version]
- Istrati, D.; Hasanpour, A.; Buckle, I.G. Numerical Investigation of Tsunami-Borne Debris Damming Loads on a Coastal Bridge. In Proceedings of the 17th World Conference on Earthquake Engineering, Sendai, Japan, 27 September–2 October 2021. [Google Scholar]
- Shoji, G.; Moriyama, T. Evaluation of the structural fragility of a bridge structure subjected to a tsunami wave load. J. Nat. Disaster Sci. 2007, 29, 73–81. [Google Scholar] [CrossRef] [Green Version]
- Yeh, H.; Francis, M.; Prterson, C.; Katada, T.; Latha, G.; Chadha, R.K.; Singh, J.P.; Raghuraman, G. Effects of the 2004 great Sumatra tsunami: Southeast Indian coast. J. Waterw. Port Coast. Ocean Eng. 2007, 133, 382–400. [Google Scholar] [CrossRef]
- Douglass, S.L.; Krolak, J. Highways in the Coastal Environment; Publication No FHWA-NHI-07-096; Office of Bridge Technology Federal Highway Administration: Washington, DC, USA, 2008. [Google Scholar]
- Bricker, J.D.; Nakayama, A. Contribution of trapped air, deck superelevation, and nearby structures to bridge deck failure during a tsunami. J. Hydraul. Eng. 2014, 140, 05014002. [Google Scholar] [CrossRef]
- Cuomo, G.; Shimosako, K.; Takahashi, S. Wave-in-deck loads on coastal bridges and the role of air. Coast. Eng. 2009, 56, 793–809. [Google Scholar] [CrossRef]
- Sheppard, D.M.; Marin, J. Wave Loading on Bridge Decks; University of Florida: Gainesville, FL, USA, 2009. [Google Scholar]
- Bradner, C.; Schumacher, T.; Cox, D.; Higgins, C. Experimental Setup for a Large-Scale Bridge Superstructure Model Subjected to Waves. J. Waterw. Port Coast. Ocean. Eng. 2011, 137, 3–11. [Google Scholar] [CrossRef] [Green Version]
- Hayatdavoodi, M.; Seiffert, B.; Ertekin, R.C. Experiments and computations of solitary-wave forces on a coastal-bridge deck. Part II: Deck with girders. Coast. Eng. 2014, 88, 210–228. [Google Scholar] [CrossRef]
- Seiffert, B.R.; Hayatdavoodi, M.; Ertekin, R.C. Experiments and calculations of cnoidal wave loads on a coastal-bridge deck with girders. Eur. J. Mech. B Fluid. 2015, 52, 191–205. [Google Scholar] [CrossRef]
- Guo, A.; Fang, Q.; Bai, X.; Li, H. Hydrodynamic Experiment of the Wave Force Acting on the Superstructures of Coastal Bridges. J. Bridge Eng. 2015, 20, 04015012. [Google Scholar] [CrossRef]
- Fang, Q.; Hong, R.; Guo, A.; Li, H. Experimental investigation of wave forces on coastal bridge decks subjected to oblique wave attack. J. Bridge Eng. 2019, 24, 04019011. [Google Scholar] [CrossRef]
- Zhu, D.; Dong, Y. Experimental and 3D numerical investigation of solitary wave forces on coastal bridges. Ocean Eng. 2020, 209, 107499. [Google Scholar] [CrossRef]
- Huang, B.; Zhu, B.; Cui, S.; Duan, L.; Zhang, J. Experimental and numerical modelling of wave forces on coastal bridge superstructures with box girders, Part I: Regular waves. Ocean Eng. 2018, 149, 53–77. [Google Scholar] [CrossRef]
- Hayatdavoodi, M.; Ertekin, R.C. Wave forces on a submerged horizontal plate. Part II: Solitary and cnoidal waves. J. Fluids Struct. 2015, 54, 580–596. [Google Scholar] [CrossRef]
- Shoji, G.; Hiraki, Y.; Fujima, K.; Shigihara, Y. Evaluation of tsunami fluid force acting on a bridge deck subjected to breaker bores. Procedia Eng. 2011, 14, 1079–1088. [Google Scholar] [CrossRef] [Green Version]
- Wei, Z.; Dalrymple, R.A. Numerical study on mitigating tsunami force on bridges by an SPH model. J. Ocean Eng. Mar. Energy 2016, 2, 365–380. [Google Scholar] [CrossRef] [Green Version]
- Xu, G.; Cai, C.S.; Chen, Q. Countermeasure of air venting holes in the bridge deck–wave interaction under solitary waves. J. Perform. Constr. Facil. 2016, 31, 04016071. [Google Scholar] [CrossRef]
- Huang, B.; Zhu, B.; Cui, S.; Duan, L.; Cai, Z. Influence of current velocity on wave-current forces on coastal bridge decks with box girders. J. Bridge Eng. 2018, 23, 04018092. [Google Scholar] [CrossRef]
- Chen, X.; Zhan, J.; Chen, Q.; Cox, D. Numerical modeling of wave forces on movable bridge decks. J. Bridge Eng. 2016, 21, 04016055. [Google Scholar] [CrossRef]
- Xiang, T.; Istrati, D. Assessment of Extreme Wave Impact on Coastal Decks with Different Geometries via the Arbitrary Lagrangian-Eulerian Method. J. Mar. Sci. Eng. 2021, 9, 1342. [Google Scholar] [CrossRef]
- Istrati, D.; Buckle, I.G. Role of trapped air on the tsunami-induced transient loads and response of coastal bridges. Geosciences 2019, 9, 191. [Google Scholar] [CrossRef] [Green Version]
- Istrati, D.; Buckle, I.G.; Lomonaco, P.; Yim, S.; Itani, A. Large-scale experiments of tsunami impact forces on bridges: The role of fluid-structure interaction and airventing. In Proceedings of the 26th International Ocean and Polar Engineering Conference, Rhodes, Greece, 21–26 June 2016. [Google Scholar]
- Istrati, D.; Buckle, I.G.; Lomonaco, P.; Yim, S.; Itani, A. Tsunami induced forces in bridges: Large-scale experiments and the role of air-entrapment. Coastal Eng. Proc. 2017, 1, 30. [Google Scholar] [CrossRef] [Green Version]
- Cai, Y.; Agrawal, A.; Qu, K.; Tang, H.S. Numerical investigation of connection forces of a coastal bridge deck impacted by solitary waves. J. Bridge Eng. 2017, 23, 04017108. [Google Scholar] [CrossRef]
- Xu, G.; Cai, C.S. Numerical investigation of the lateral restraining stiffness effect on the bridge deck-wave interaction under Stokes waves. Eng. Struct. 2017, 130, 112–123. [Google Scholar] [CrossRef] [Green Version]
- Xu, G.; Cai, C.S. Wave forces on Biloxi bay bridge decks with inclinations under solitary waves. J. Perform. Constr. Facil. 2014, 29, 04014150. [Google Scholar] [CrossRef]
- Luo, W.; Huang, B.; Tang, Y.; Ding, H.; Li, K.; Cheng, L.; Ren, Q. Numerical simulation of dynamic response of submerged floating tunnel under regular wave conditions. Shock Vib. 2022, 2022, 4940091. [Google Scholar] [CrossRef]
- Xu, G.; Cai, C.S. Numerical simulations of lateral restraining stiffness effect on bridge deck–wave interaction under solitary waves. Eng. Struct. 2015, 101, 337–351. [Google Scholar] [CrossRef]
- Istrati, D.; Buckle, I.G. Effect of Fluid-Structure Interaction on Connection Forces in Bridges Due to Tsunami Loads. In Proceedings of the 30th U.S.-Japan Bridge Engineering Workshop, UJNR Panel on Wind and Seismic Effects, Washington, DC, USA, 21–23 October 2014. [Google Scholar]
- Istrati, D. Large-scale Experiments of Tsunami Inundation of Bridges Including Fluid-Structure-Interaction. Ph.D. Thesis, University of Nevada, Reno, NV, USA, 2017. Available online: https://scholarworks.unr.edu//handle/11714/2030 (accessed on 18 March 2022).
- Chen, X.; Xu, G.; Lin, C.; Sun, H.; Zeng, X.; Chen, Z. A comparative study on lateral displacements of movable T deck and Box dec k under solitary waves. J. Struct. 2021, 34, 1614–1635. [Google Scholar] [CrossRef]
- Huang, B.; Duan, L.; Yang, Z.; Zhang, J.; Kang, A.; Zhu, B. Tsunami forces on a coastal bridge deck with a box girder. J. Bridge Eng. 2019, 24, 04019091. [Google Scholar] [CrossRef]
- Huang, B.; Ren, Q.; Cui, X.; Zhang, J.; Zhu, B. Study of wave forces acting on the box-girder superstructure of coastal bridges in the submerged condition based on potential flow theory. Adv. Bridge Eng. 2020, 1, 16. [Google Scholar] [CrossRef]
- Huang, B.; Luo, W.; Ren, Q.; Cui, X.; Zhang, J.; Zhu, B. Random wave forces on the submerged box-girder superstructure of coastal bridges based on potential flow theory. Ocean Eng. 2022, 248, 110739. [Google Scholar] [CrossRef]
- Chen, X.B.; Chen, Z.W.; Cai, S.Q.; Xu, W.; Zhuo, X.R.; Lv, J.G.; Zhao, J.J. Numerical investigation of dynamic responses and mooring forces of submerged floating tunnel driven by surface waves. Sci. Rep. 2020, 10, 18836. [Google Scholar] [CrossRef] [PubMed]
- Zhan, J.M.; Yu, L.H.; Li, C.W.; Li, Y.S.; Zhou, Q.; Han, Y. A 3-D model for irregular wave propagation over partly vegetated waters. Ocean Eng. 2014, 75, 138–147. [Google Scholar] [CrossRef]
- Huang, B.; Yang, Z.; Zhu, B.; Zhang, J.; Kang, A.; Pan, L. Vulnerability assessment of coastal bridge superstructure with box girder under solitary wave forces through experimental study. Ocean Eng. 2019, 189, 106337. [Google Scholar] [CrossRef]
- Goseberg, N.; Wurpts, A.; Schlurmann, T. Laboratory-scale generation of tsunami and long waves. Coast. Eng. 2013, 79, 57–74. [Google Scholar] [CrossRef]
- Dong, Z.; Zhan, J. Numerical modeling of wave evolution and runup in shallow water. J. Hydrodyn. 2009, 21, 731–738. [Google Scholar] [CrossRef]
- Bredberg, J. On the Wall Boundary Condition for Turbulence Models; InternalRep. 00/4; Department of Thermo and Fluid Dynamics, Chalmers University of Technology: Gothenburg, Sweden, 2000. [Google Scholar]
- Xiong, W.; Cai, C.S.; Kong, B.; Kong, X. CFD Simulations and analyses for bridge-scour development using a dynamic-mesh updating technique. J. Comput. Civil Eng. ASCE 2014, 30, 04014121. [Google Scholar] [CrossRef]
- Yang, W.; Li, S.; Liu, J.; Wu, W.; Li, H. Numerical study on breaking solitary wave force on box-girder bridge. Adv. Bridge Eng. 2021, 2, 28. [Google Scholar] [CrossRef]
- Lomonaco, P.; Istrati, D.; Maddux, T.; Buckle, I.; Yim, S.; Xiang, T. Large-scale testing of tsunami impact forces on bridges. In Proceedings of the 6th International Conference on the Application of Physical Modelling in Coastal and Port Engineering and Science (Coastlab16), Ottawa, ON, Canada, 10–13 May 2016. [Google Scholar]
- Chock, G.; Robertson, I.; Carden, L.; Yu, G. Tohoku tsunami-induced building damage analysis including the contribution of earthquake resistant design to tsunami resilience of multi-story buildings. In Proceedings of the International Symposium on Engineering Lessons Learned, Tokyo, Japan, 1–4 March 2012; pp. 492–503. [Google Scholar]
- Fritz, H.M.; Borrero, J.C.; Synolakis, C.E.; Yoo, J. 2004 Indian ocean tsunami flow velocity measurements from survivor videos. Geophys. Res. Lett. 2006, 33, L24605. [Google Scholar] [CrossRef]
- Hayashi, S.; Koshimura, S. The 2011 Tohoku tsunami flow velocity estimation by the aerial video analysis and numerical modeling. J. Disaster Res. 2013, 8, 561–572. [Google Scholar] [CrossRef]
- Ataei, N.; Padgett, J.E. Influential fluid–structure interaction modelling parameters on the response of bridges vulnerable to coastal storms. Struct. Infrastruct. Eng. 2015, 11, 321–333. [Google Scholar] [CrossRef]
- Istrati, D.; Buckle, I.G.; Itani, A.; Lomonaco, P.; Yim, S. Large-scale FSI experiments on tsunami-induced forces in bridges. In Proceedings of the 16th World Conference on Earthquake Engineering, Santiago, Chile, 9–13 January 2017. [Google Scholar]
Publisher’s Note: MDPI stays neutral with regard to jurisdictional claims in published maps and institutional affiliations. |
© 2022 by the authors. Licensee MDPI, Basel, Switzerland. This article is an open access article distributed under the terms and conditions of the Creative Commons Attribution (CC BY) license (https://creativecommons.org/licenses/by/4.0/).