Abstract
Ship routeing systems (e.g., traffic separation schemes) have been established worldwide to ensure ship traffic safety. There are no specific measures to establish an effective ship route. We have previously proposed a method to design and assess the route comparison with the present traffic flow in the interest to establish an effective ship routeing system, particularly for recommended routes. The method consists mainly of the following procedures: understanding the existing phenomena and the issues in the target area by analyzing target traffic flow; designing safety measures; assessing the safety measures; and determining the optimal safety measure. This method was used to design and assess the recommended route off the western coast of Izu O Shima Island. This route has been in service since January 2018. The purpose of this study is to validate the proposed method. First, the technical details of the method are described. An automatic identification system (AIS) observation was conducted before and after the implementation to validate the effectiveness of the recommended route for reducing collisions. The results show that the recommended route effectively reduces the risk of collisions. More specifically, the proposed method was found to be useful when establishing an effective recommended route.
1. Introduction
Collisions are the most common type of marine accident, and their prevention is crucial for safe ship navigation. In the automotive field, a simulation study revealed that collision frequency in the intersection was related to the fraction of length and velocities of vehicles, that is, traffic density [1]. In the marine traffic field, collision frequency generally relates to traffic density [2], and Itoh shows that traffic density is the most influential variable in ship encounter frequency compared to ship length and velocity [3]. In Japanese maritime traffic, there are three types of sea areas with frequent collision accidents: (i) congested sea areas such as major bays and the Seto Inland Sea; (ii) quasi-congested sea areas connected with the congested sea areas, i.e., entrance of Tokyo Bay–off Iro Saki–entrance of Ise Bay–off Shionomisaki–off Muroto Misaki–off Ashizuri Misaki–the Seto Inland Sea; and (iii) port areas in which many ships arrive, depart, and anchor in a very narrow space. In these areas, more safety measures are required and are implemented than in other areas. Conventional safety measures have been adopted based on past experiences and expert opinions. As a result, the areas that have been targeted are the congested areas and port areas where marine accidents occur frequently and information can be collected relatively easily by radar and visual observations.
In quasi-congested sea areas, a collision accident often results in a serious marine disaster with fatalities, missing persons, sinking, total losses, and oil spills [4]. In recent years, the installation of facilities at sea, including in coastal areas, has been increasing due to the increasing demand for renewable energy [5]. This has led to the traffic environment for ships becoming more complex. Therefore, taking measures to improve the navigational environment by accumulating ship activity data for the entire area and considering the ships’ movement as a flow (hereafter referred to as “traffic flow”) is also essential. Radar observations have long been the primary means of gathering information. However, they have not been able to provide sufficient information on a wide range of traffic flows. Although the effects of new safety measures in quasi-congested sea areas are expected to be far-reaching, there is little data to predict the change accompanying the measures. It is also unclear whether past knowledge to establish new safety measures can be used. For these reasons, it is difficult to determine whether the existing measures can be applied.
For the past few decades, all ships of 300 gross tonnage (GT) or more engaged in international voyages, all passenger ships engaged in international voyages, and all ships of 500 GT or more not engaged in international voyages have been required to have an automatic identification system (AIS). This makes it possible to obtain information more easily on a wide range of navigational conditions with a high degree of accuracy.
Considering these recent changes in navigation and information environment, there is an urgent need for a method of developing safety measures based on understanding the present state of marine traffic and its future trajectory. Therefore, we have systematized the procedure to quantitatively evaluate the navigation environment. We have also established a method to objectively evaluate the effect of the new route designations as a safety measure [6,7]. This method was applied to a model sea area, the western sea area of Izu O Shima Island in Japan [8], and the recommended route (RR) has been in service since January 2018 [9,10]. The motivation was a collision that occurred on 27 September 2013 [11]. Six crew members were dead when one ship capsized after a collision. In addition, traffic volume in that area is usually heavy, and thus collisions frequently occur. Our previous study reported the observation of the change in traffic safety accompanying the implementation of the RR [12]. However, none of those studies describes the validity of the method applied to design and safety assessment. To clarify it through examining the RR effect, this study focuses specifically on the technical details of the method and the change in collision likelihood after the implementation of the RR.
The remainder of the paper is organized as follows: Section 2 introduces an overview of the RR off the western coast of Izu O Shima Island and summarizes provisions for its planning and design methods. Section 3 describes a brief outline of the method of design and safety assessment for establishing the RR. Section 4 presents in detail the consequences of the design and safety assessment for the RR. Subsequently, Section 5 discusses the validity of the RR based on observations of collision occurrence and safety assessment of collision likelihood, as relevant to the implementation of the RR. Finally, Section 6 presents the conclusions.
2. Overview of the RR
2.1. The Target Area
The RR off the western coast of Izu O Shima Island is located in the waters off the east coast of the Izu peninsula in Shizuoka, Japan. It is a 15-km route governed by a non-mandatory regulation based on the rules for navigation established by the International Convention for Safety of Life at Sea (SOLAS), 1974. It is not defined by width but by two endpoints that show a center line (Figure 1). It was adopted by the International Maritime Organization (IMO) Maritime Safety Committee (MSC) in 2017; it was implemented in January 2018 [9,10].
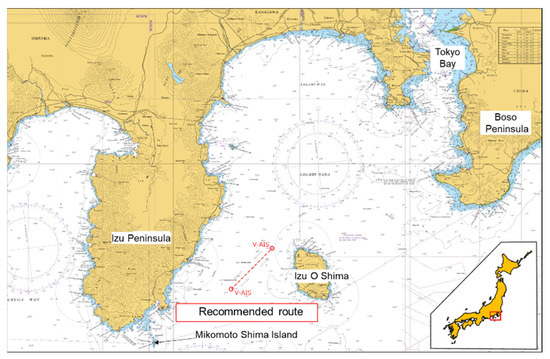
Figure 1.
RR off the western coast of Izu O Shima Island (provided by the Japan Coast Guard (JCG)).
2.2. Description of IMO Regulations
2.2.1. Approaches for Separating Traffic Flows
According to the guidelines issued by the IMO [13,14], there are three approaches to separating traffic flow: (i) a traffic separation scheme (TSS), which is used in accordance with the preventive measures in rule 10 of the International Regulations for Preventing Collisions at Sea, 1974 (COLREGS), and is expected to have a powerful effect; (ii) an RR, which has fewer legal restrictions than the TSS but is specified on nautical charts; and (iii) a voluntary route, such as the voluntary routes recommended by the Japan Captains’ Association, which has no legal restrictions and is not specified on nautical charts.
However, there are a few issues when it comes to establishing the approaches of (i) and (iii) in the target area. The TSS has very strict legal limits and restricts the free activities of small ships, such as fishing boats. Therefore, it is difficult to adopt a TSS in a target area where many fishing boats operate. The target area is large and deep, and the TSS could cause an unnecessary concentration of traffic, leading to an increased risk of collision. Regarding the voluntary route, there are many ships without a Japanese crew in the target area; it is globally known that it is difficult to ensure the existence of a voluntary route by domestic captains’ associations, which is not drawn on nautical charts. Therefore, a voluntary route is not appropriate. As a strategy to resolve the aforementioned issues, the RR approach was selected.
2.2.2. Design Method of RRs
The RR is defined by the IMO [13] based on regulation V/10 of SOLAS 1974, along with other ship routeing systems. The planning, and design criteria of ship routeing systems are described in the general provisions. For the planning, it is stated that the following factors should be considered: the existing traffic pattern in the target area (including coastal traffic and crossing traffic), the presence of fishing grounds, environmental factors (including weather conditions and tidal streams), and so on. For the design, it is stated that the following criteria should be applied: the route should follow the existing traffic flow pattern determined by a traffic survey; course alterations should be as few as possible and should be avoided when approaching convergence areas, heavy crossing areas, and so on.
Establishing a new ship routeing system requires these factors to be considered. However, no concrete process for this has been described yet. Miyake et al. [6,7] proposed a design and assessment method for the effectiveness of a ship routeing system. This paper describes the procedures for the proposed method and its application to the RR off the western coast of Izu O Shima Island.
3. Method of Design and Safety Assessment
3.1. Overview of the Safety Assessment Method
The proposed safety assessment method for establishing a ship’s routeing is conducted in the following steps [6,7]:
- Preliminary analysis of the navigational environment
- Detailed analysis of the navigational environment
- Design of new RR candidates
- Quantitative assessment based on the present and predicted future traffic flows
- Determination of the optimal ship routeing
Step 1 is conducted to identify the problems in the target area. In this method, the occurrence of collisions, the traffic density of ships, and the operation of fishing boats are targeted. Step 2 is to consider a basic plan for the RR candidates. More specifically, the origin and destination (OD) survey is conducted, and the encounter frequency distribution is calculated. In addition, from the OD survey, a traffic flow model for marine traffic simulation is generated. In step 3, candidates are designed considering the results of the preliminary and detailed analyses. Subsequently, in step 4, the safety assessment of the RR candidates is conducted based on the ship behaviors to the present and future traffic flows predicted by marine traffic simulation. Since the consequences of steps 3 and 4 will determine the effectiveness of the RR after its implementation, these are the most important steps of this method. Finally, the most reasonable RR is determined from among the candidates.
The marine traffic simulation was conducted using the Marine Traffic Flow Simulation System (MTFSS), which was developed in our institute [15]. MTFSS is a generic term and consists of the following software applications: an AIS data analysis application (used in Section 4.2.1); an application for generating ship data used for simulations as an input file (used in Section 4.2.3 and Section 4.4.1); an application for marine traffic simulation; an application for generating traffic flow prediction models (used in Section 4.4.1); an application for calculating traffic density and encounter frequency (used in Section 4.2.2, Section 4.4.2, and Section 5.1); and an application for calculating Obstacle Zone by Target (OZT) (used in Section 4.4.2 and Section 5.2). In this study, all simulation cases were calculated under no collision avoidance to observe the potentially dangerous encounter occurrences, as described in Section 3.2.1.
3.2. Safety Assessment Method
3.2.1. Concept
Traffic volume includes traffic density indices, such as L-converted scales [16], and traffic capacity includes ship domain [17,18]. They have been commonly utilized for the safety assessment of ship navigation in very congested areas such as harbors and narrow straights [1,19]. However, the target area in this study has heavy traffic but is relatively wide. For example, 420 ships sail through the area every day [20], but the distance between them is about 20 kilometers. In view of the traffic situation, we discerned that changes in the traffic volume and capacity by the RR would generate different encounters and result in a navigational environment with a high collision risk.
Therefore, this study used two quantitative methods of assessing safety in the target area, namely the encounter frequency and the OZT, focused on dangerous encounters for collision. These methods are calculated based on the ship’s dynamic data (e.g., position and speed) and static data (e.g., ship length). Calculation data can be obtained from the AIS data and marine traffic simulation results.
In this study, the safety assessment in Section 4.4.2 was estimated from the prediction traffic model including the fishing boats and the merchant ships with AIS; the rest was based on the AIS data to observe the dangerous encounter occurrences for the collision of the actual traffic flows.
3.2.2. Encounter Frequency
The encounter frequency method is based on the collision frequency estimation method, which was proposed in the 1970s [21]. The collision frequency estimation method is one of the most commonly used methods because of its simple concept. According to it, the frequency of collision of ships, , can be represented as
where NG is the number of geometric collision candidates, and PC is the probability of failing to avoid the collision [22,23]. Equation (1) indicates that individually decreasing the values of NG and PC is essential to reduce the number of collisions. Implementing a ship’s routeing is a way to reduce NG in the target area. The variable NG is defined as
where ρi and ρj are the densities of the two flows of ship traffic; Vr is the relative velocity of the two flows; Dij is the cross-section of the two flows of ship traffic and is expressed as with Li and Lj as the mean lengths of the ships in two flows of ship traffic; S is the space of the area, and T is the time length. It indicates the number of collision candidates in the target area in a given time window. To assess the frequency of collision candidates in a unit of time and space, the encounter frequency Ef was introduced by modifying Equation (2) to obtain Equation (3) [3,24].
The encounter frequency can be calculated for all encounter situations, including crossing and overtaking [25]. However, the main issue in the target area was collisions with head-on encounter ships. As such, this study focused on the encounter frequency of head-on encounters.
The encounter frequency is calculated for head-on encounters in each of the small regions between two gate lines, as illustrated in Figure 2. The length of each gate line was approximately 370 [m] (1/300 deg in latitude), and the spacing between the gate lines was approximately 305 [m] (1/300 deg in longitude of the target area). Using them, the number of ships, mean velocity, and size of the ships were calculated for each traffic flow. The traffic density was derived using , where A is the gate line length. Then, the encounter frequency was individually calculated for a specific unit of time (e.g., one month) by using Equation (3).
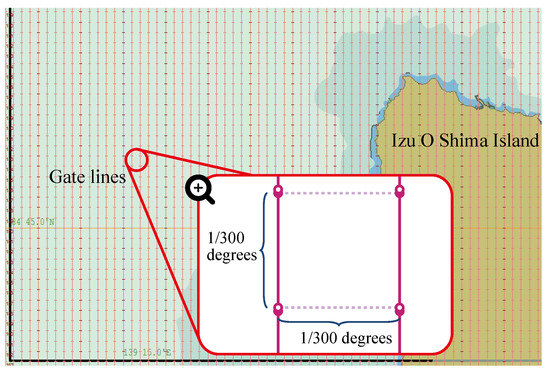
Figure 2.
Gate line settings for the target area.
3.2.3. Obstacle Zone by Target (OZT)
OZT [26,27,28,29] was developed for the purpose of navigational-aid to prevent collisions. Therefore, it is represented as positional information of the relationship between an own ship and a target ship. OZT is a zone where the own ship is obstructed by the presence of the target ship and its motion. Figure 3a shows the geometrical calculation procedure [28,29]. The process is roughly divided into two parts: obtaining collision courses and OZT.
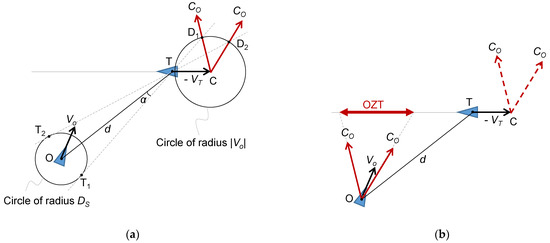
Figure 3.
Method of obtaining OZT in geometric: (a) Collision courses. (b) OZT. Plotted from the explanation in [28,29].
First, the collision courses are obtained by the following approach. Here, DS is a safety passing distance (SD) between the two ships; d is the distance between the two ships; AZ is the azimuth angle of the target ship; and CT is the course angle of the target ship.
- Draw a circle of radius DS centered on the own ship (point O).
- Draw tangent lines from the target ship (point T) to this circle. Let the contact points be T1 and T2.
- Draw the negative motion vector of ship T (−VT) behind ship T. Let the endpoint of the vector be C.
- Draw a circle of radius of the own ship speed (|VO|) centered on point C.
- Let the intersections of the tangent lines and the circle of radius of VO be D1 and D2.
The directions of and are called collision courses (CO). Here, the collision course means the own ship’s course having the distance of the closest point of approach (DCPA), which is equivalent to SD. Besides, the course between CD1 and CD2 means that DCPA is less than SD. From the law of sines for the triangle CTD1 and CTD2, Equation (4) is established. As a result, the collision courses CO can be obtained from Equation (6) [30].
Secondly, in Figure 3b, the process to obtain OZT is as follows:
- Shift the and to point O.
- Cut out a part of the course line from the target ship by these collision courses.
The cut zone is equivalent to OZT. To assess the safety in the target area, it is necessary to calculate all combinations of ships sailing in the target area. Incidentally, some OZTs have no danger of collision. This is because the OZT is calculated for all directions around the own ship, and thus it may be shown in a direction that cannot actually be the direction of travel for the own ship. For example, if the course of the target ship is behind the own ship, OZT exists behind the own ship. Considering such cases, the dangerous OZT with a high collision risk for the own ship is identified from all calculated OZTs. Then, a safety assessment is conducted by analyzing the change of the positions and the number of dangerous OZTs. In this study, the following procedure and calculation conditions of OZT were applied.
According to the calculation conditions, SD was set at 0.1 nautical miles (185.2 [m]), and the OZT was calculated every 300 [s] when the target ship was within 3 nautical miles (approximately 5556 [m]).
The dangerous OZT is identified using an evaluation zone (EZ) by the following procedure:
- Define EZ as a wedge-shaped area with threshold values of the angles and distance from the own ship.
- The OZT that was at least partially within the EZ is considered a dangerous OZT.
- The number of dangerous OZTs was accumulated for each small grid.
Figure 4 shows an example of a dangerous OZT. Since the OZT is partially in the EZ, it is regarded as a dangerous OZT, and the number of the dangerous OZT is counted as 1 in the grids “A-2,” and “B-2”. In this study, the EZ is defined by its angle and length. The angle is 10 [deg] from the own ship’s course to both sides. The length is the distance going with the own ship’s speed for 300 [s]. The length and width of the grid were set to approximately 370 [m] and 305 [m], respectively (1/300 deg in latitude and longitude in the target area).
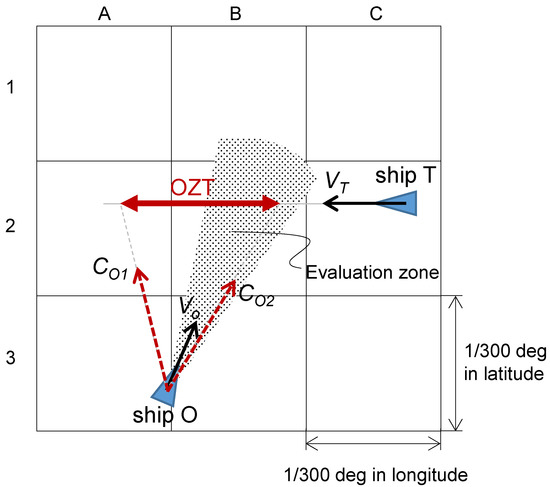
Figure 4.
Identification of the dangerous OZT using EZ for safety assessment.
4. Design and Safety Assessment of the RR
4.1. Preliminary Analysis of the Navigational Environment
4.1.1. Collisions
Figure 5 shows the collision locations by encounter type. In and around the target area, 35 collisions occurred over a period of 10 years (2005–2014). Among them, 19 cases were collisions between merchant ships; 11 cases were between merchant ships and returning fishing boats; and 5 cases were between merchant ships and fishing boats in operation. Of the 19 cases involving two merchant ships, 17 occurred between 6 p.m. and 6 a.m. the following day. Of the 11 cases involving a merchant ship and a returning fishing boat, four occurred between 9 a.m. and 3 p.m.
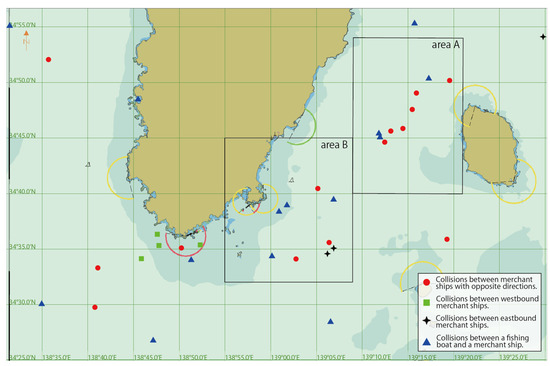
Figure 5.
Collision locations by encounter type from 2005–2014. (Source: collision accident data in [8]) Note: the description of area A and B are in Section 5.3.
Within the target area, 11 collisions occurred out of a total of 35 collisions that occurred. Among these 11 collisions, 7 collisions involved two merchant ships, while the remaining 4 collisions occurred between a merchant ship and a fishing boat. Of the seven collisions involving the two merchant ships, six occurred in head-on situations.
In summary, the characteristics of the casualties in the target area are as follows: in terms of encounter situations, the collisions are divided into two main types: (i) the collision involving two merchant ships in a head-on situation, and (ii) the collision involving a merchant ship and a fishing boat in a crossing situation, especially when the fishing boat is on its way back to the fishing harbor. Incidentally, the two rectangles named areas A and B are discussed in Section 5.3.
4.1.2. Traffic Density
According to a literature survey on ship movements in Tokyo Bay [31], where most of the ships in the target area are expected to enter and leave, the traffic volume and the number of port arrivals are the highest in March. Therefore, we used the AIS data in March to obtain detailed navigational information. In addition, hourly traffic analysis around the target area revealed that the eastbound and westbound traffic volume peaks between 1 a.m. and 2 a.m. and between 8 p.m. and 9 p.m., respectively. This trend was consistent throughout the year.
Figure 6 shows the traffic density distribution analyzed from the AIS data in March 2014. The traffic density was calculated per day in every small region, as described in Section 3.2.2. From Figure 6a, the traffic density of the eastbound ships is high in the west of Izu O Shima Island, where ships from both the north and south of Mikomoto Shima Island (hereinafter called Mikomotoshima) meet. From Figure 6b, the traffic density in the same location seems relatively low for the westbound ships. This is because the ship diverged into northern and southern paths, i.e., close to the Izu peninsula and Izu Oshima Island, after leaving Tokyo Bay.
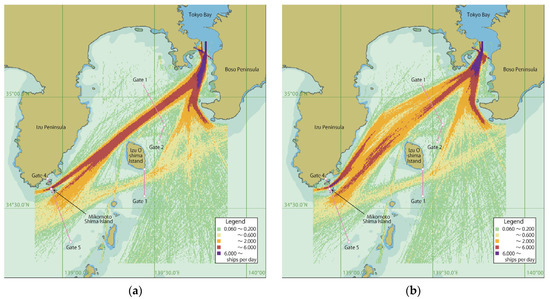
Figure 6.
Traffic density distribution of navigating ships in the waters west of Izu O Shima Island. (Analyzed using the AIS data in March 2014). (a) Eastbound ships. (b) Westbound ships. Note: the description of Gates 1 to 5 is in Section 4.2.1 (Source: AIS data from 1 March to 31 March 2014, provided by Toyo-shingo-tsushinsha (TST) [32]).
4.1.3. Activities of Fishing Boats
In the target area, the fishing boats are active and often involved in collisions. According to a questionnaire survey on the operation of fishing boats by JCG [8], up to 65% of the fisheries in the target area operate with standing nets, and up to 78% mentioned splendid alfonsino, the deep-sea fish, as their main catch. Since their main fishing grounds are located in the middle of the eastbound and westbound traffic flows, most of the fishing boats cross at least one of the traffic flows when accessing the fishing grounds. For the most part, the fishing boats leave between 2 a.m. and 6 a.m. and return between 12 p.m. and 2 p.m. During fishing activities, they need to watch out for the two traffic flows. These results indicate that the activity of the fishing boats is consistent with the collision characteristics as shown in Section 4.1.1.
4.2. Detailed Analysis of the Navigational Environment
4.2.1. OD Survey
To analyze the traffic behavior in detail, an OD survey was conducted using AIS data for 31 days from 1–31 March 2014. Based on traffic density distribution and trajectory maps, five gate lines were settled as pink lines in Figure 6. Using these lines, the main traffic flows in the target area were analyzed in terms of ship volume, passage time, ship type composition, ship size composition, and speed distribution. In addition, waypoint (WP) lines were set at the locations where ships mainly change their course, and the distribution of the passage positions on the lines was analyzed. The positions of the WP lines are described in Section 4.2.3 (4).
Figure 7 shows the composition of the types of ships that passed through gate lines 2 and 3, located on the north of Izu O Shima Island, as well as gate lines 4 and 5, located to the north and south of Mikomotoshima, respectively. Most of the ships passing through gate line 2 navigate around the Boso peninsula that is located east of Tokyo Bay, while those passing through gate line 3 go and come to Tokyo Bay. Therefore, ships of various lengths sail both gate lines. Most of the ships passing through gate line 4 are less than 100 m in length, while those passing through gate line 5 are more than 100 m in length. The OD survey also revealed the following features: cargo ships sailed at an approximate speed of 10–20 knots proportionate to the ship length; tankers maintained an constant speed of 12 knots; most of the passenger ships were on a regular schedule at a high speed.
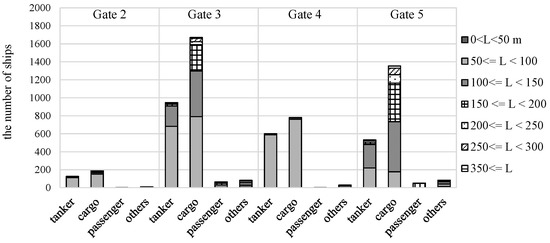
Figure 7.
Ship volume and composition of ship length and ship type. The gates are shown in Figure 6.
Some ships with less than 500 GT are voluntarily equipped with AIS. Therefore, to confirm the gross tonnage of each ship, the OD analysis was also checked against the data of the Japanese Register of Ships [33] to identify ships with less than 500 GT.
4.2.2. Encounter Frequency Distribution
Encounter frequency was analyzed from AIS data to identify areas with high collision risk. Figure 8 shows the encounter frequency distribution along with the major fishing grounds. It was found that a large part of the area west of Izu O Shima Island has a high encounter frequency, and the two fishing grounds (indicated by the arrows A and B, respectively) are located in the area with a high encounter frequency.
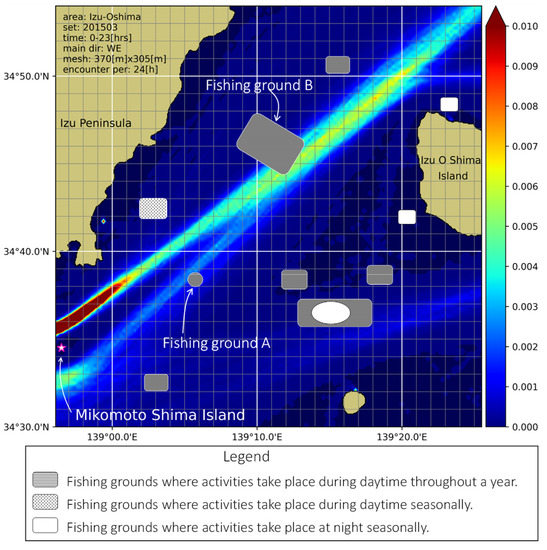
Figure 8.
Fishing grounds and encounter frequency distribution from AIS data. (Sources: fishing grounds data in [8] and AIS data from 1 March to 31 March 2015, provided by TST [32]).
4.2.3. Generation of Traffic Flow Model
The quantitative assessment for the RR needs traffic flow data after the implementation. In this study, future traffic is predicted using the traffic flow prediction method proposed in [3]. The method provides the future traffic behavior with a new rule of traffic restrictions, such as the following procedures: generating an estimation model from the observation data of the present traffic; creating a prediction model based on the estimation model and a new rule; and generating a future traffic flow using the prediction model. To create the prediction model, basic elements of traffic, such as traffic volume, passage time, ship type composition, ship size composition, and speed distribution are predicted with appropriate precision, depending on the degree of impact of the new rule and its effects on traffic safety. Local traffic density in the vicinity of a ruled area is determined by passage positions, which are strongly influenced by the rule. Contrarily, the passage positions far from the restricted area are not affected much. Therefore, passage positions in the vicinity of the RR are predicted with higher accuracy. The prediction model for the passage positions is represented as a probabilistic distribution using a three-parameter gamma distribution function.
Based on this concept, an estimation model of traffic flow was generated by referring to the present traffic, as shown in this subsection. Then, the prediction model was generated by predicting the ship’s passage positions under the new RR using a probabilistic distribution, as shown in Section 4.4.1. The estimation and prediction models were used to generate ship traffic flow in the simulation.
In the target area, fishing activities are also essential. Based on the questionnaire survey, we have developed a fishing traffic model that reflects multiple patterns of fishing behavior, including leaving/returning to port and operation in fishing grounds. For more details, please refer to [6,8].
- (1)
- Simulation time window of the day
In this study, the traffic simulation was conducted for time windows when collisions between merchant ships and collisions between a merchant ship and a fishing boat were likely to occur. The purpose of this was to focus on the safety issues in the target area.
Considering the results reported in Section 4.1.2 and Section 4.1.3, the simulation time window for the safety assessment targeting the merchant ships was decided to be from midnight to 2 a.m. (hereafter, this will be referred to as “nighttime.”) For the analysis of the merchant ships and returning fishing boats, considering the results of the above survey by JCG [8], the simulation time was chosen as 12 p.m. to 2 p.m. (hereafter, this will be referred to as “daytime”), when the number of fishing boats was high. Each simulation was conducted for one month (30 days).
- (2)
- Ship classification for ship generation
Ships are classified by length, speed, type, and route. Referring to the OD survey in Section 4.2.1, the ships were consolidated into six categories:
- Category ID 0 is small tanker, cargo, and others equipped with AIS, whose speed are approximately low;
- Category ID 1 is for medium-sized tanker, cargo, and others equipped with AIS, whose speed is approximately medium;
- Category ID 2 is large tanker, cargo, and others equipped with AIS, whose speed are approximately high;
- Category ID 3 is passenger ships equipped with AIS that travel on a regular schedule;
- Category ID 4 is small tanker, cargo, and others without AIS;
- Category ID 5 is fishing boats.
- (3)
- Number of sailing ships
From the OD survey, it was found that the number of ships varies within a given month. In this study, safety assessment was focused on situations where the number of ships was the highest. This was to determine which traffic condition was the most dangerous. We investigated the number of ships for 7 days of the surveyed month, with the highest number of ships during the nighttime and daytime. The average number of ships per hour passing through the entrance gate to the target area was 17.4 during the nighttime and 9.4 during the daytime.
In addition, AIS data did not include information on small ships that are not equipped with AIS. Therefore, the number of small merchant ships without AIS was estimated based on a radar and visual traffic survey conducted by the JCG in 2005 [20]. Specifically, we estimated the total number of entire ships with less than 500 gross tonnage (GT) by the following method.
First, the ratio of the number of ships equipped with an AIS of less than 500 GT to the number of ships observed in the JCG’s 2005 observations (i.e., 208 ships) was calculated; this was used as an interpolation coefficient. Next, we analyzed the number of ships with an AIS of less than 500 GT at each time period from the OD survey results. Finally, the number of ships with an AIS of less than 500 GT was multiplied by the interpolation coefficient to estimate the total number of entire ships less than 500 GT. In addition, the number of fishing boats was estimated based on their questionnaire survey.
Table 1 shows the number of ships and ship statistics according to the simulation categories. The left side shows ship type and size, and the right shows the ship statistics of each category. The ship statistics were analyzed from the OD survey. Additionally, the ship statistics of ships without AIS were analyzed from the databases of ships, such as the Japanese Register of Ships.

Table 1.
The number of ships and ship statistic in the simulation.
- (4)
- Passage position
Figure 9 shows the ships’ trajectories extracted from the OD survey and the position of the gate lines (indicated by blue lines) and WP lines (indicated by violet lines). The trajectories are those of category ID 0 eastbound ships passing from Mikomotoshima North to Tokyo Bay (Gates 4 to 3). From these trajectories, the passage position distributions were analyzed by the passage route and the category using gate lines and WP lines. The details are described in Section 4.4.1.
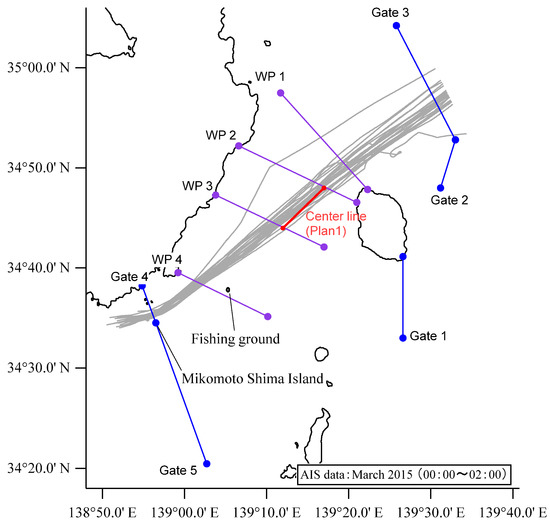
Figure 9.
Gate and WP lines. Gray lines are the trajectories of category ID 0.
4.3. Design of New RR Candidates
In this study, three candidates for the center line with different angles and lengths were designed, considering the following:
- The direction of the center line should divide the area with high encounter frequency into two parts;
- Positions of major fishing grounds should be in a one-way traffic flow of sailing ships so that fishing boats can carefully concentrate in one direction where the ships come from;
- Ships navigating along the RR should not be significantly diverted compared to the present situation;
- In the case when ship traffic has waypoints in the target area, the center line should be set away from such waypoints to avoid disrupting the ships;
- The direction of the center line should be close to the course angle of the current traffic flow.
The encounter frequency distribution in Figure 8 can be used to identify areas with high encounter frequency. Additionally, from the traffic density distribution in Figure 6 and the trajectories by direction, an overlap area can be identified as the area shared by ships traveling in both directions, namely the area with high encounter frequency. The traffic density distribution and trajectories can also be used to understand the course angle and routes of the traffic flow.
In consideration of the above, the center line of Plan 1 was designed as a line connecting the northern end (34°48′ N, 139°17′ E) and the southern end (34°44′ N, 139°12′ E) that has a direction of 45° (225°). Plans 2 and 3 were designed based on Plan 1. Plan 2 is a route extended from the south end for safety and efficiency, while Plan 3 is a route moved from the south end toward the east in consideration of separation from the fishing grounds. Considering the load of data entry into the Electronic Navigational Chart (ENC), etc., the angles of the candidates were set in at least in units of 1 degree, and the latitude and longitude of the end points were to the first decimal place.
Figure 10 shows the RR candidates on the encounter frequency distribution. In addition, the fishing ground is shown, which is required to observe the change in encounter frequency after the implementation of the RR because it is located on an extension of the RR candidates.
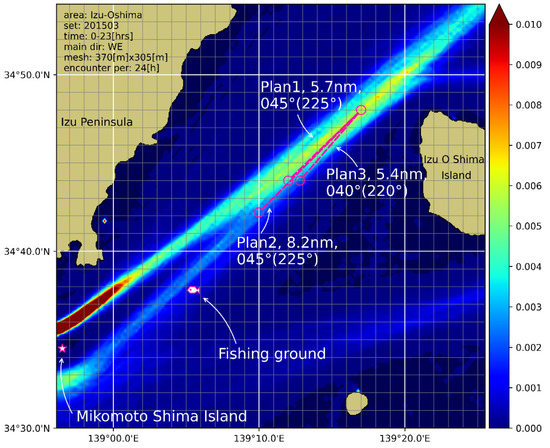
Figure 10.
The RR candidates. (Source: AIS data from 1 March to 31 March 2015, provided by TST [32]).
4.4. Quantitative Assessment Based on the Present and Predicted Future Traffic Flows
4.4.1. Prediction of Future Traffic
In this section, future traffic behavior under a new RR is predicted. The traffic behavior is represented using a new set of waypoints determined by the relationship between the present waypoints of the ship category and the given RR. Then, the behavior of each ship is represented by a set of waypoints calculated by giving probabilistic variations to the waypoints of the category to which the ship belongs.
- Eastbound ships passing Mikomotoshima North first sail toward the southern end of the center line and then follow the course toward the next way point;
- Eastbound ships passing Mikomotoshima South change their courses off at the southern tip of Izu peninsula and sail along the extension of the center line;
- Westbound ships passing Mikomotoshima North change their courses at the north of Izu O Shima Island and sail toward the northern waterway of Mikomotoshima;
- Westbound ships passing Mikomotoshima South first pass through the north of Izu O Shima Island and then take a course parallel to the center line;
- Most of the ships comply with the RR. However, there are partial number of ships that are unaware of its existence for some reason.
In addition, ships that are unaware of the existence of the RR, naturally, may not comply with the RR. The ratio of ships unaware of the RR was defined as 5%.
Figure 11 shows the composition ratio of the ships to the passage position by gate and WP lines in the present situation and Plan 1. The passage position corresponds to the trajectories shown in Figure 9, and the gate and WP lines are also set in common. The distance measured from the landward starting point on the gate or WP lines is presented as passage position. The composition ratios are obtained for every 1000 m of the passage position. Additionally, in Figure 11c,d, the end-point position of the RR located on each WP line is shown as the thin line, and the legend is the center line.
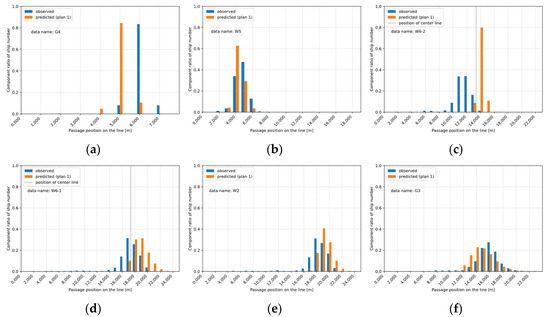
Figure 11.
The present and future passage position distribution of category ID 0 for Plan 1: (a) Gate 4; (b) WP 4; (c) WP 3; (d) WP 2; (e) WP 1; and (f) Gate 3. Gates and WPs are shown in Figure 9.
From Figure 11c, it is obvious that the traffic will be concentrated near the southern end under Plan 1. This is because the ships passing through Gate 4 and WP 4 originally sailed on the west (left) side of the RR and were predicted to shift to the east (right) side. On the other hand, Figure 11d, shows that the distribution around the northern end of the center line, i.e., WP 2, will be less concentrated because the ships are assumed to sail on the right side of the center line to each destination (inside Tokyo Bay or east of the Boso peninsula). It is noted that the ratio of the ships unaware of the RR in Figure 11c,d looks like 10% of the total, not 5%; this was caused by the increment of every 1000 m.
4.4.2. Safety Assessment of the RR
Traffic simulation was conducted using the present and future traffic models described in Section 4.4.1, as well as a fishing activity model described in Section 4.2.3, to generate ship behavior data for each of the three RR center line options. Next, the safety effects of the options were estimated from the behavior data. Finally, we compared their advantages and disadvantages and selected one. Here, we briefly introduce a summary of the assessment. For more information, please refer to [7,8].
- (1)
- Encounter frequency
Figure 12 shows the distribution of head-on encounter frequency between merchant ships for 24 h. Figure 12a corresponds to the present traffic, and the Figure 12b–d correspond to the future traffic in the three plans. They were converted from 2 h at nighttime. By comparing the Figure 12a–d, we can deduce that each of the plans will have
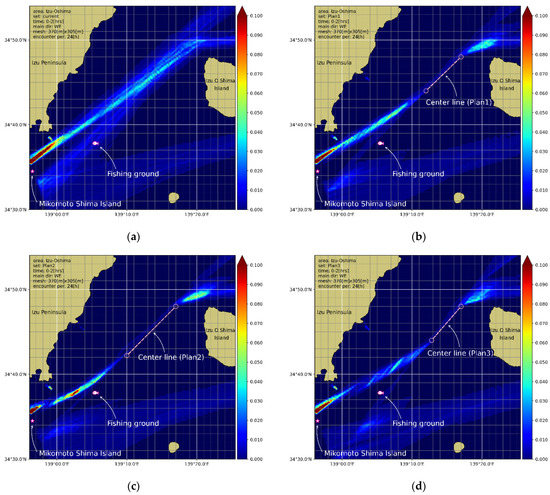
Figure 12.
Distribution map of the encounter frequency for 24 h at nighttime: (a) present traffic, (b) Plan 1, (c) Plan 2, and (d) Plan 3. (Sources: simulation results data of [8]).
- remarkably smaller size of the high encounter frequency area;
- remarkably lower encounter frequency around the fishing ground;
- slightly higher encounter frequency at the northern end of the center line.
The first item is because the majority of merchant ships are separated in the navigation area by their directions by the RR.The second is that the merchant ships passing through the south of Mikomotoshima sail on the extension of the recommended area by the RR; thus, the RR’s southern area would also benefit from the RR’s effect. The last is because the intersection of the paths of ships heading northeast and west is concentrated in a space limited by the center line and the Izu O Shima Island. It is noted that Figure 12 has more encounters than Figure 8, which is based on AIS data, because it is calculated based on traffic data that includes ships without AIS, as described in Section 4.2.3.
- (2)
- OZT
Figure 13 shows the distribution of dangerous OZT for 24 h in all encounter types between the merchant ships and fishing boats, and also between merchant ships. Figure 13a corresponds to the present traffic, and Figure 13b–d correspond to the future traffic in the three plans. They were converted from 2 h daytime. By comparing the four subfigures, we can deduce that each of the plans will have
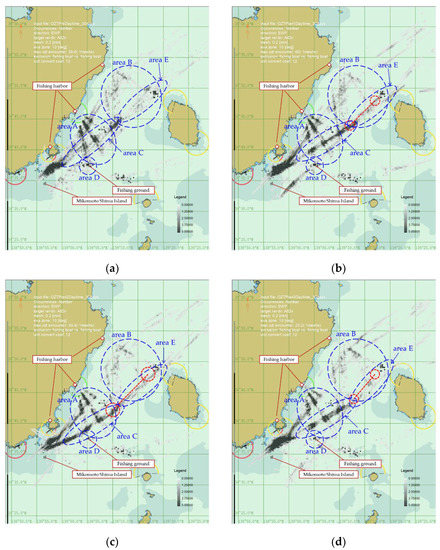
Figure 13.
Distribution map of dangerous OZT occurrences between two merchant ships or a merchant ship and a fishing boat for 24 h during daytime per day: (a) present traffic, (b) Plan 1, (c) Plan 2, and (d) Plan 3. (Sources: simulation results data of [8]).
- high-frequency areas at the intersections of the trajectories similar to the present traffic, which are indicated in areas A and B;
- narrower high-frequency areas under each plan, which are indicated in area C and E;
- new middle–high-frequency areas in the southern area under each plan, which are indicated in area C;
- a slightly smaller high-frequency area in the fishing ground under each plan, which is indicated in area D.
The first item is because the fishing boat’s behavior is assumed to be unaffected by the route and follow the present route; therefore, crossing encounter occurs in the areas where the fishing boats and merchant ships cross. Regarding the second and the third, it is because the northern merchant ships are coming from Mikomotoshima North, confluent in a narrow space at the southern endpoint due to the RR; therefore, crossing and overtaking higher encounters occur in the narrower spaces. The last reason is that merchant ships passing through the south of Mikomotoshima sail on the RR’s recommended extension of the recommended area; thus, the area around the fishing ground would also have the effect of separating traffic.
4.5. Selection of the Optimal Ship Routeing
Taking into consideration Section 4.4.2, Plan 2 was selected as the optimal plan for the RR. The following effects were expected:
- the major routes of merchant ships would be separated by direction of travel, reducing head-on collisions;
- the traffic environment of fishing boats would be simplified, reducing the watch-keeping load and thus collisions against merchant ships.
5. Discussion
5.1. Effectiveness in Encounter Frequency Perspective
To validate the implemented RR, its effectiveness was investigated in terms of encounter frequency, OZT, and number of collisions. Encounter frequency and OZT were calculated using AIS data. Therefore, it should be noted that the data may not include majority of small ships, fishing boats, and ships with less than 500 GT.
Figure 14 shows the distribution map of the head-on encounter frequency per day after the implementation of the RR. Compared to Figure 10, it is obvious that the encounters in the vicinity of the RR in Figure 14 are less and smaller, although not completely eliminated. Furthermore, Figure 14 shows that encounters are reduced on the route passing Mikomotoshima North near the fishing ground; encounters are slightly reduced on the route passing Mikomotoshima South near the fishing ground.
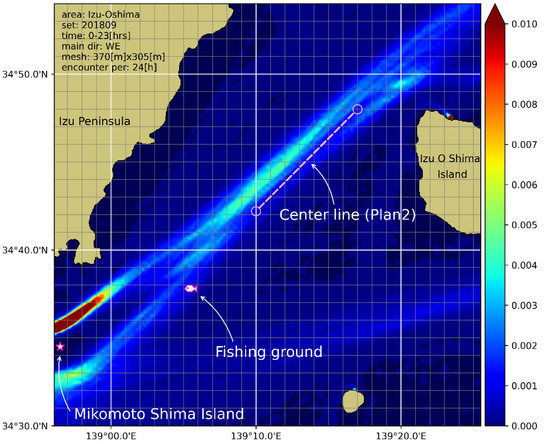
Figure 14.
Distribution map of the encounter frequency of sailing ships with opposite directions (8 months after the implementation (September 2018)). (Sources: AIS data from 1 September to 30 September 2018, provided by TST [32]).
Although Figure 12c and Figure 14 have different value scales, some different trends were observed; for instance, degrees of high encounter frequency remained in the western area of the RR. It is possible that this is due to the calculation conditions that assumed a too-high compliance rate for the RR. These fine adjustments remain for future work.
5.2. Effectiveness in OZT Perspective
Figure 15 shows the distribution map of the number of dangerous OZT per day before and after the implementation. The number of OZT with all encounter types was counted every 300 s in each mesh, as described in Section 3.2.3. It is obvious that the number of dangerous OZTs decreased around the RR. Additionally, dangerous OZT has been slightly reduced in the area around the northern end point of the RR, and the route passing through Mikomotoshima North near the fishing ground. Further work is needed to investigate its effectiveness, considering the number of fishing boats that cross the traffic flow of merchant ships.
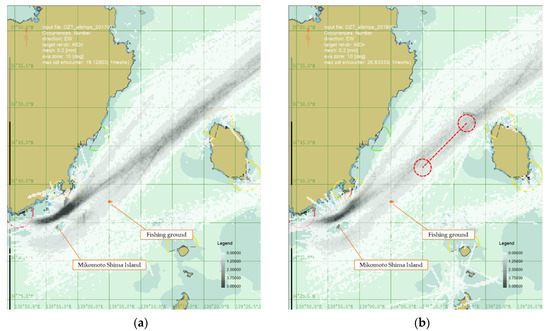
Figure 15.
Distribution map of occurrences of the dangerous OZT: (a) before the implementation (March 2017) and (b) 8 months after the implementation (September 2018). (Sources: AIS data from 1 March to 31 March 2017 and 1 September to 30 September 2018, provided by TST [32]).
5.3. Effectiveness in the Number of Collisions
Figure 16 shows collision locations that occurred from Jan. 2018–March 2022 after the implementation. Table 2 compares the collision occurrences by encounter type before and after implementation in the vicinity of RR (area A) and its southern waters (area B). The upper numerals are the number of collisions based on Figure 5 and Figure 16, and the lower ones are the means of collisions per year.
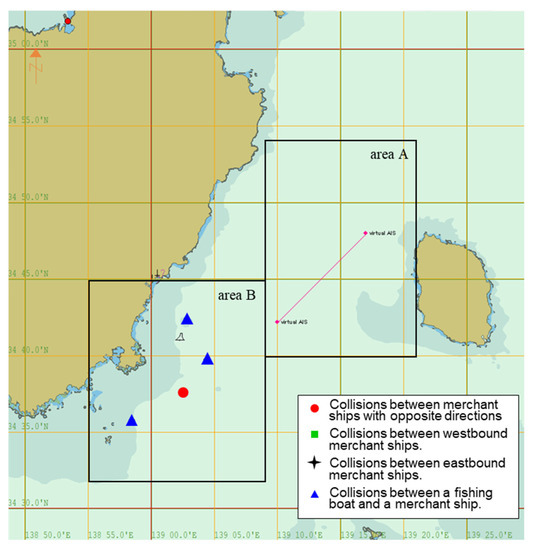
Figure 16.
Collision locations in the period after the implementation of the RR (January 2018–March 2022). (Source: Japan-Marine Accident Risk and Safety Information System (J-MARIS) [34]).
Table 2.
Collision occurrences by encounter type.
In area B, four collisions have occurred. Regarding the breakdown, there was one collision that involved two merchant ships going in opposite directions, and three that involved a fishing boat and a merchant ship. From Table 2, it is found that the mean number of collisions between merchant ships per year before and after this implementation is slightly less in area B. Meanwhile, no collision has occurred in area A. Although collisions have not been completely prevented in the whole target area, it can be said that the RR is effective in reducing collisions per year, at least in the area around the RR, which is also shown in Table 2.
6. Conclusions
The recommended route (RR) off the western coast of Izu O Shima Island was developed by applying our method for designing candidate routes and safety assessment to select an optimal route among them. Four years have passed since the start of the operation, and the RR has become well known. It is considered that the changes in ships’ behavior have stabilized. In this study, to describe the validity of the method, the effect of the RR on navigational safety is analyzed in terms of the change in collision likelihood. Although further work is necessary to describe the impact on small ships such as fishing boats, observations from AIS data before and after the implementation of the RR showed that the RR reduced the likelihood of a collision, based on encounter frequency and occurrences of dangerous OZT. In addition, no collisions occurred after the implementation in the water surrounding the RR. These results indicate that the RR is capable of reducing the number of collisions. Therefore, it is considered that our method is useful to establish an effective recommended route. In addition, our safety assessment technique can be used in the discussion of ship traffic safety accompanied by a change in the marine traffic environment, such as new offshore wind farms.
In this study, we used the area off the west coast of Izu O Shima Island as a model sea area for evaluation. However, we believe that the proposed safety assessment method can be applied to other sea areas in different situations, such as the areas where there are many crossings or where fishing boats move at low speed while fishing. For generalization, it is necessary to further investigate the validity of the method, especially the validity of the assumptions for predicting future traffic; we leave this open for future investigation.
Author Contributions
Conceptualization, R.M.; methodology, R.M. and H.I.; software, R.M. and H.I.; validation, R.M. and H.I.; writing—original draft preparation, R.M.; writing—review and editing, R.M. and H.I. All authors have read and agreed to the published version of the manuscript.
Funding
This research received no external funding.
Institutional Review Board Statement
Not applicable.
Informed Consent Statement
Not applicable.
Data Availability Statement
The datasets analyzed or generated in this study are available from the corresponding author upon reasonable request.
Acknowledgments
We are deeply grateful to the Japan Coast Guard for providing us with precious information and comments for our study. We give special thanks to the Japan Association of Marine Safety for giving us comments and support.
Conflicts of Interest
The authors declare no conflict of interest.
References
- Marzoug, R.; Ez-Zahraouy, H.; Benyoussef, A. Simulation study of car accidents at the intersection of two roads in the mixed traffic flow. Int. J. Mod. Phys. C 2015, 26, 1550007. [Google Scholar] [CrossRef]
- Fujii, Y. Chapter 4 Maritime Traffic Accidents. In Introduction of Marine Traffic Engineering, 1st ed.; Kaibundo: Tokyo, Japan, 1971. (In Japanese) [Google Scholar]
- Itoh, H. Method for prediction of ship traffic behaviour and encounter frequency. J. Navig. 2022, 75, 106–123. [Google Scholar] [CrossRef]
- JCG. Current Status of Marine Accidents and Countermeasures. Available online: https://www6.kaiho.mlit.go.jp/info/keihatsu/20180314_state_measure29.pdf (accessed on 20 June 2022). (In Japanese).
- Ministry of Land, Infrastructure, Transport and Tourism. Summary of the White Paper on Land, Infrastructure, Transport and Tourism in Japan 2021. Available online: https://www.mlit.go.jp/statistics/content/001442571.pdf (accessed on 20 June 2022).
- Miyake, R.; Itoh, H.; Nishizaki, C.; Fukuto, J. Method of safety assessment for establishing ship routeing system with marine traffic simulation. In Proceedings of the 7th International Conference on Collision and Grounding of Ships and Offshore Structures (ICCGS), Ulsan, Korea, 15–18 June 2016. [Google Scholar]
- Miyake, R.; Itoh, H.; Nishizaki, C.; Fukuto, J. Safety assessment for establishing ships’ routeing—Recommended route off the western coast of Izu O Shima island. In Proceedings of the 4th Asian Conference on Defense Technology (ACDT), Tokyo, Japan, 29 November–1 December 2017. [Google Scholar]
- Japan Association of Marine Safety. The Investigation on Development of Safety Measures off the Western Coast of Izu O Shima Island; The Japan Association of Marine Safety: Tokyo, Japan, 2016. (In Japanese) [Google Scholar]
- NCSR4/3; Routeing Measures and Mandatory Ship Reporting Systems—Establishment of a Recommended Route off the Western Coast of Izu o Shima Island, Japan. The Sub-Committee on Navigation, Communications and Search and Rescue (NCSR): London, UK, 2016.
- SN.1/Circ.335; Routeing Measures Other than Traffic Separation Schemes. IMO: London, UK, 2017.
- Japan Transport Safety Board. Investigation Report. Available online: https://www.mlit.go.jp/jtsb/eng-mar_report/2015/2013tk0026e.pdf (accessed on 20 June 2022).
- Itoh, H.; Miyake, R. Research on Change of Traffic Safety Accompanying the Implementation of a New Recommended Route. In Proceedings of the 8th International Conference on Collision and Grounding of Ships and Offshore Structures (ICCGS), Lisbon, Portugal, 21–23 October 2019. [Google Scholar]
- IMO. Part A—General provisions on ships’ routeing. In SHIPS’ Routeing 2008 Edition, 9th ed.; IMO: London, UK, 2008; ISBN 978-92-801-4232-7. [Google Scholar]
- MSC/Circ.1060; Guidance Note on the Preparation of Proposals on Ships’ Routeing Systems and Ship Reporting Systems for Submission to the Sub-Committee on Safety of Navigation. The Maritime Safety Committee (MSC): London, UK, 2003.
- Miyake, R.; Itoh, H.; Nishizaki, C.; Fukuto, J. Establishment of an Assessment Method for New Ship s’ Routeing System with a Marine Traffic Simulation System. Pap. Natl. Marit. Res. Inst. NMRI 2017, 16, 267–282. (In Japanese) [Google Scholar]
- Kang, W.; Park, Y. A Study on the Design of Coastal Fairway Width Based on a Risk Assessment Model in Korean Waterways. Appl. Sci. 2022, 12, 1535. [Google Scholar] [CrossRef]
- Pietrzykowski, Z.; Uriasz, J. The ship domain—A criterion of navigational safety assessment in an open sea area. J. Navig. 2009, 62, 93–108. [Google Scholar] [CrossRef]
- Liu, J.; Zhou, F.; Li, Z.; Wang, M.; Liu, R.W. Dynamic Ship Domain Models for Capacity Analysis of Restricted Water Channels. J. Navig. 2015, 69, 481–503. [Google Scholar] [CrossRef]
- Fujii, Y.; Makishima, T.; Hara, K. Chapter 2 Traffic Investigation. In Marine Traffic Engineering, 1st ed.; Kaibundo: Tokyo, Japan, 1981; ISBN 978-4-303–23401-0. (In Japanese) [Google Scholar]
- Japan Association of Marine Safety. The Investigation on Development of Safety Measures for Accident-Prone Locations; The Japan Association of Marine Safety: Tokyo, Japan, 2012. (In Japanese) [Google Scholar]
- Macduff, T. The probability of vessel collisions. Ocean. Ind. 1974, 9, 144–148. [Google Scholar]
- Fujii, Y. Integrated study on marine traffic accidents. In Proceedings of the IABSE Colloquium on Ship Collision with Bridges and Offshore Structures, Copenhagen, Denmark, 30 May–2 June 1983; Volume 42, pp. 91–98. [Google Scholar] [CrossRef]
- Pedersen, P.T. Collision and Grounding Mechanics. In Proceedings of the WEMT Conference 1995, Kopenhagen, Denmark, 17–19 May 1995; pp. 125–157. [Google Scholar]
- Kawashima, S.; Itoh, H.; Kimura, A. Collision frequency to offshore floating installation based on analysis of ship traffic flow. J. Japan Inst. Navig. 2017, 136, 80–87. (In Japanese) [Google Scholar]
- Kawashima, S.; Itoh, H. Assessment of ship encounter and collision in congested sea areas. In Proceedings of the 8th International Conference on Collision and Grounding of Ships and Offshore Structures (ICCGS), Lisbon, Portugal, 21–23 October 2019. [Google Scholar]
- Imazu, H.; Fukuto, J.; Numano, M. Obstacle Zone by Target and its Expression. J. Jpn. Inst. Navig. 2002, 107, 191–197. [Google Scholar] [CrossRef]
- Imazu, H.; Fujisaka, T.; Shouji, R.; Ootake, Y. The Crossing Maneuver Characteristic Seen from Obstacle Zone by Target. J. Jpn. Inst. Navig. 2003, 108, 259–265. [Google Scholar] [CrossRef]
- Imazu, H. Computation of OZT by using Collision Course. Navig. Jpn. Inst. Navig. 2014, 188, 78–81. [Google Scholar]
- Imazu, H. Evaluation Method of Collision Risk by Using True Motion. TransNav Int. J. Mar. Navig. Saf. Sea Transp. 2017, 11, 65–70. [Google Scholar] [CrossRef][Green Version]
- Sawada, R.; Sato, K.; Majima, T. Automatic ship collision avoidance using deep reinforcement learning with LSTM in continuous action spaces. J. Mar. Sci. Technol. 2021, 26, 509–524. [Google Scholar] [CrossRef]
- Japan Association of Marine Safety. The Investigation on Unification of Control Center in Tokyo Bay; The Japan Association of Marine Safety: Tokyo, Japan, 2015. (In Japanese) [Google Scholar]
- Toyo-Shingo-Tsushinsha, AIS Data Feed. Available online: https://www.toyoshingo.co.jp/en/service/information/ais_data.html (accessed on 1 August 2022).
- Japan Shipping Exchange, Inc. Japanese Register of Ships; Japan Shipping Exchange, Inc.: Tokyo, Japan, 2014. (In Japanese) [Google Scholar]
- Japan Transport Safety Board. Japan-Marine Accident Risk and Safety Information System (J-MARISIS). Available online: https://jtsb.mlit.go.jp/hazardmap/index_en.html (accessed on 20 June 2022).


Publisher’s Note: MDPI stays neutral with regard to jurisdictional claims in published maps and institutional affiliations. |
© 2022 by the authors. Licensee MDPI, Basel, Switzerland. This article is an open access article distributed under the terms and conditions of the Creative Commons Attribution (CC BY) license (https://creativecommons.org/licenses/by/4.0/).