4.2. Incidence of Waves on the Overtopping WEC
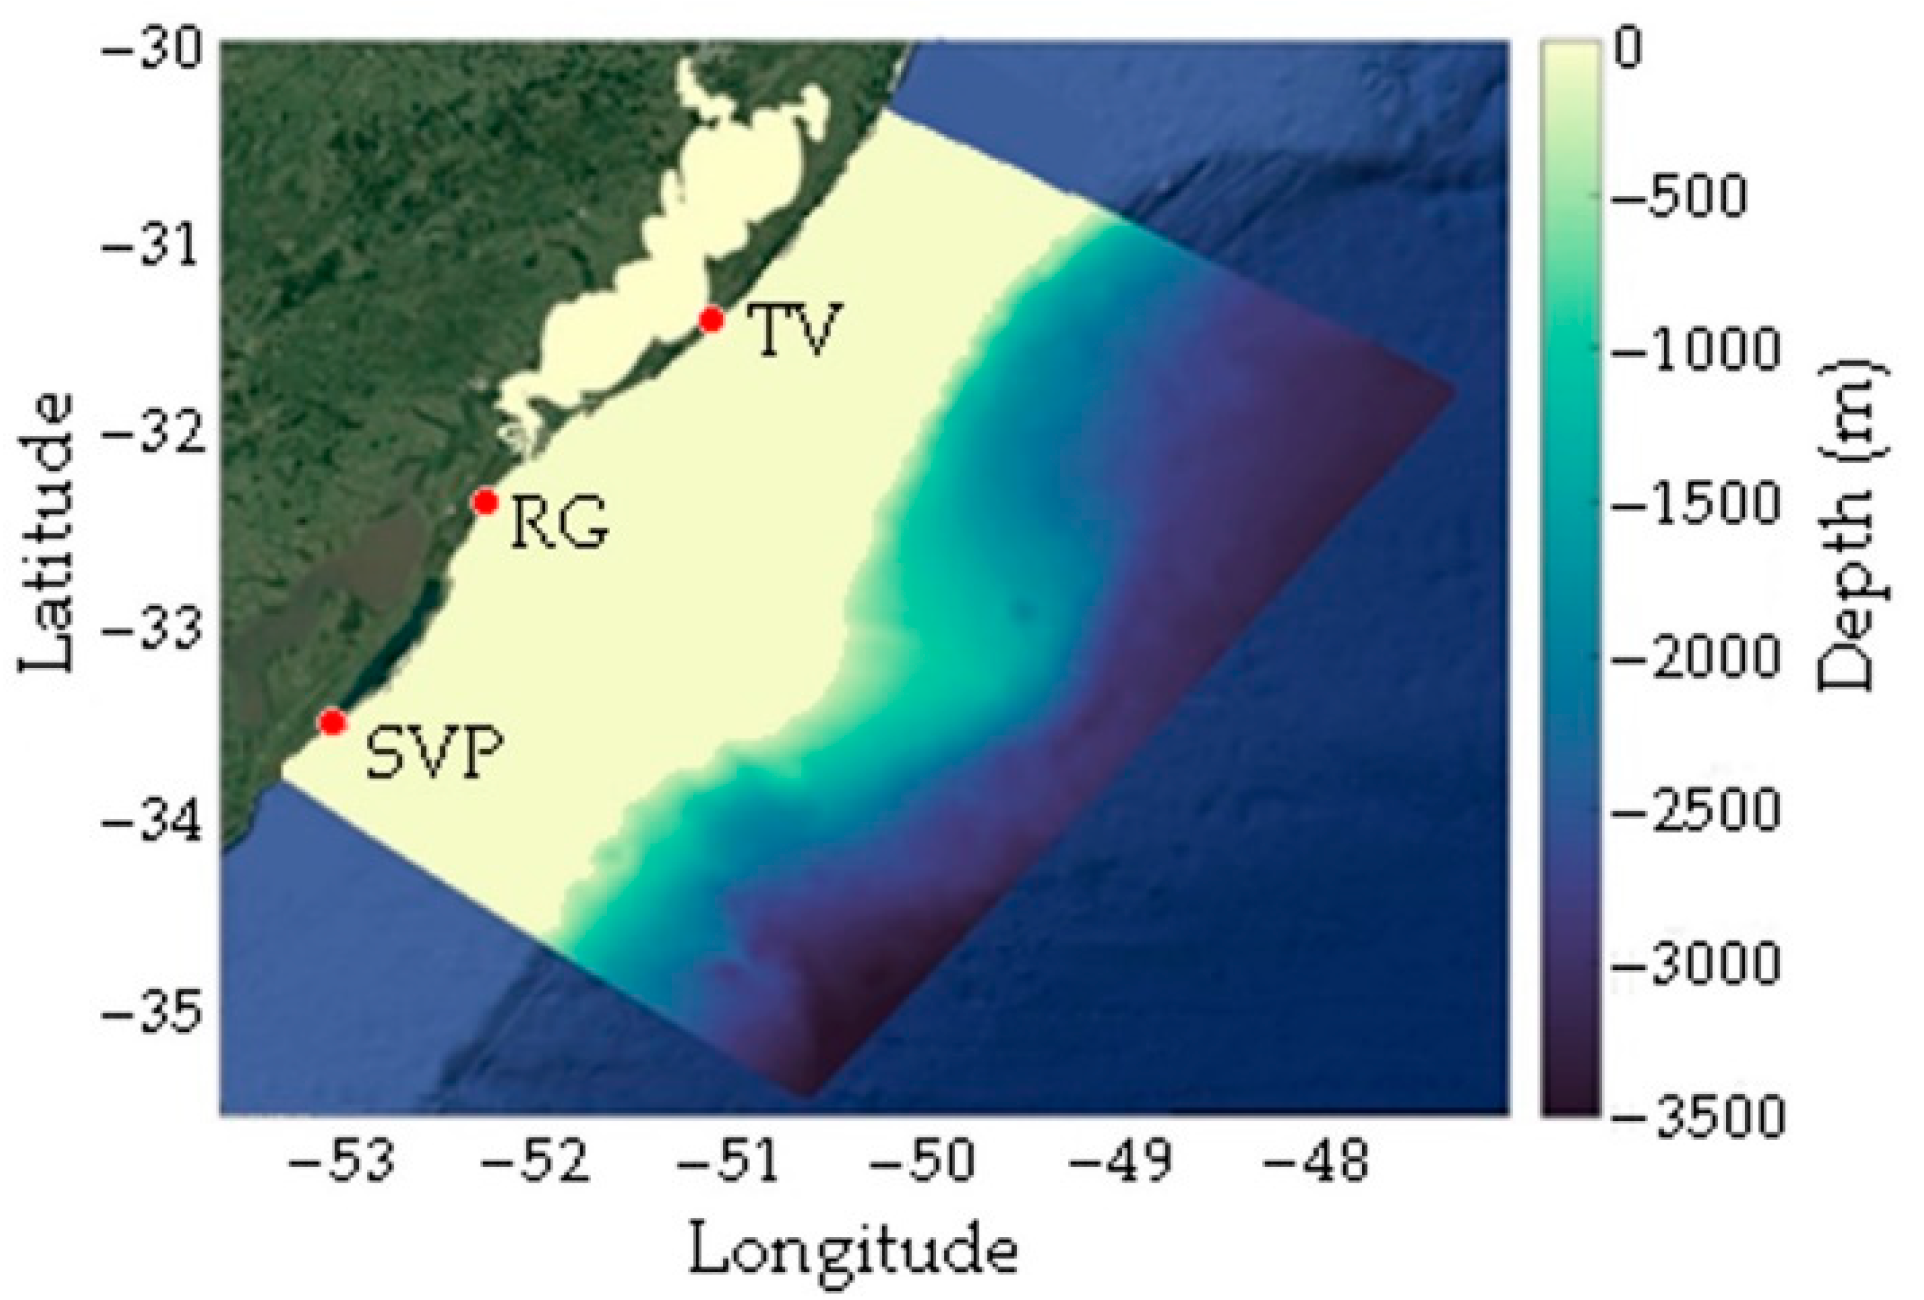
The numerical analysis of the operational principle of the overtopping WEC consisted of calculating the amount of water that enters its reservoir. The main objective here was to compare the performance of this device when subjected to realistic irregular waves with its performance under the incidence of representative regular waves, for the three different coastal locations indicated in
Figure 1.
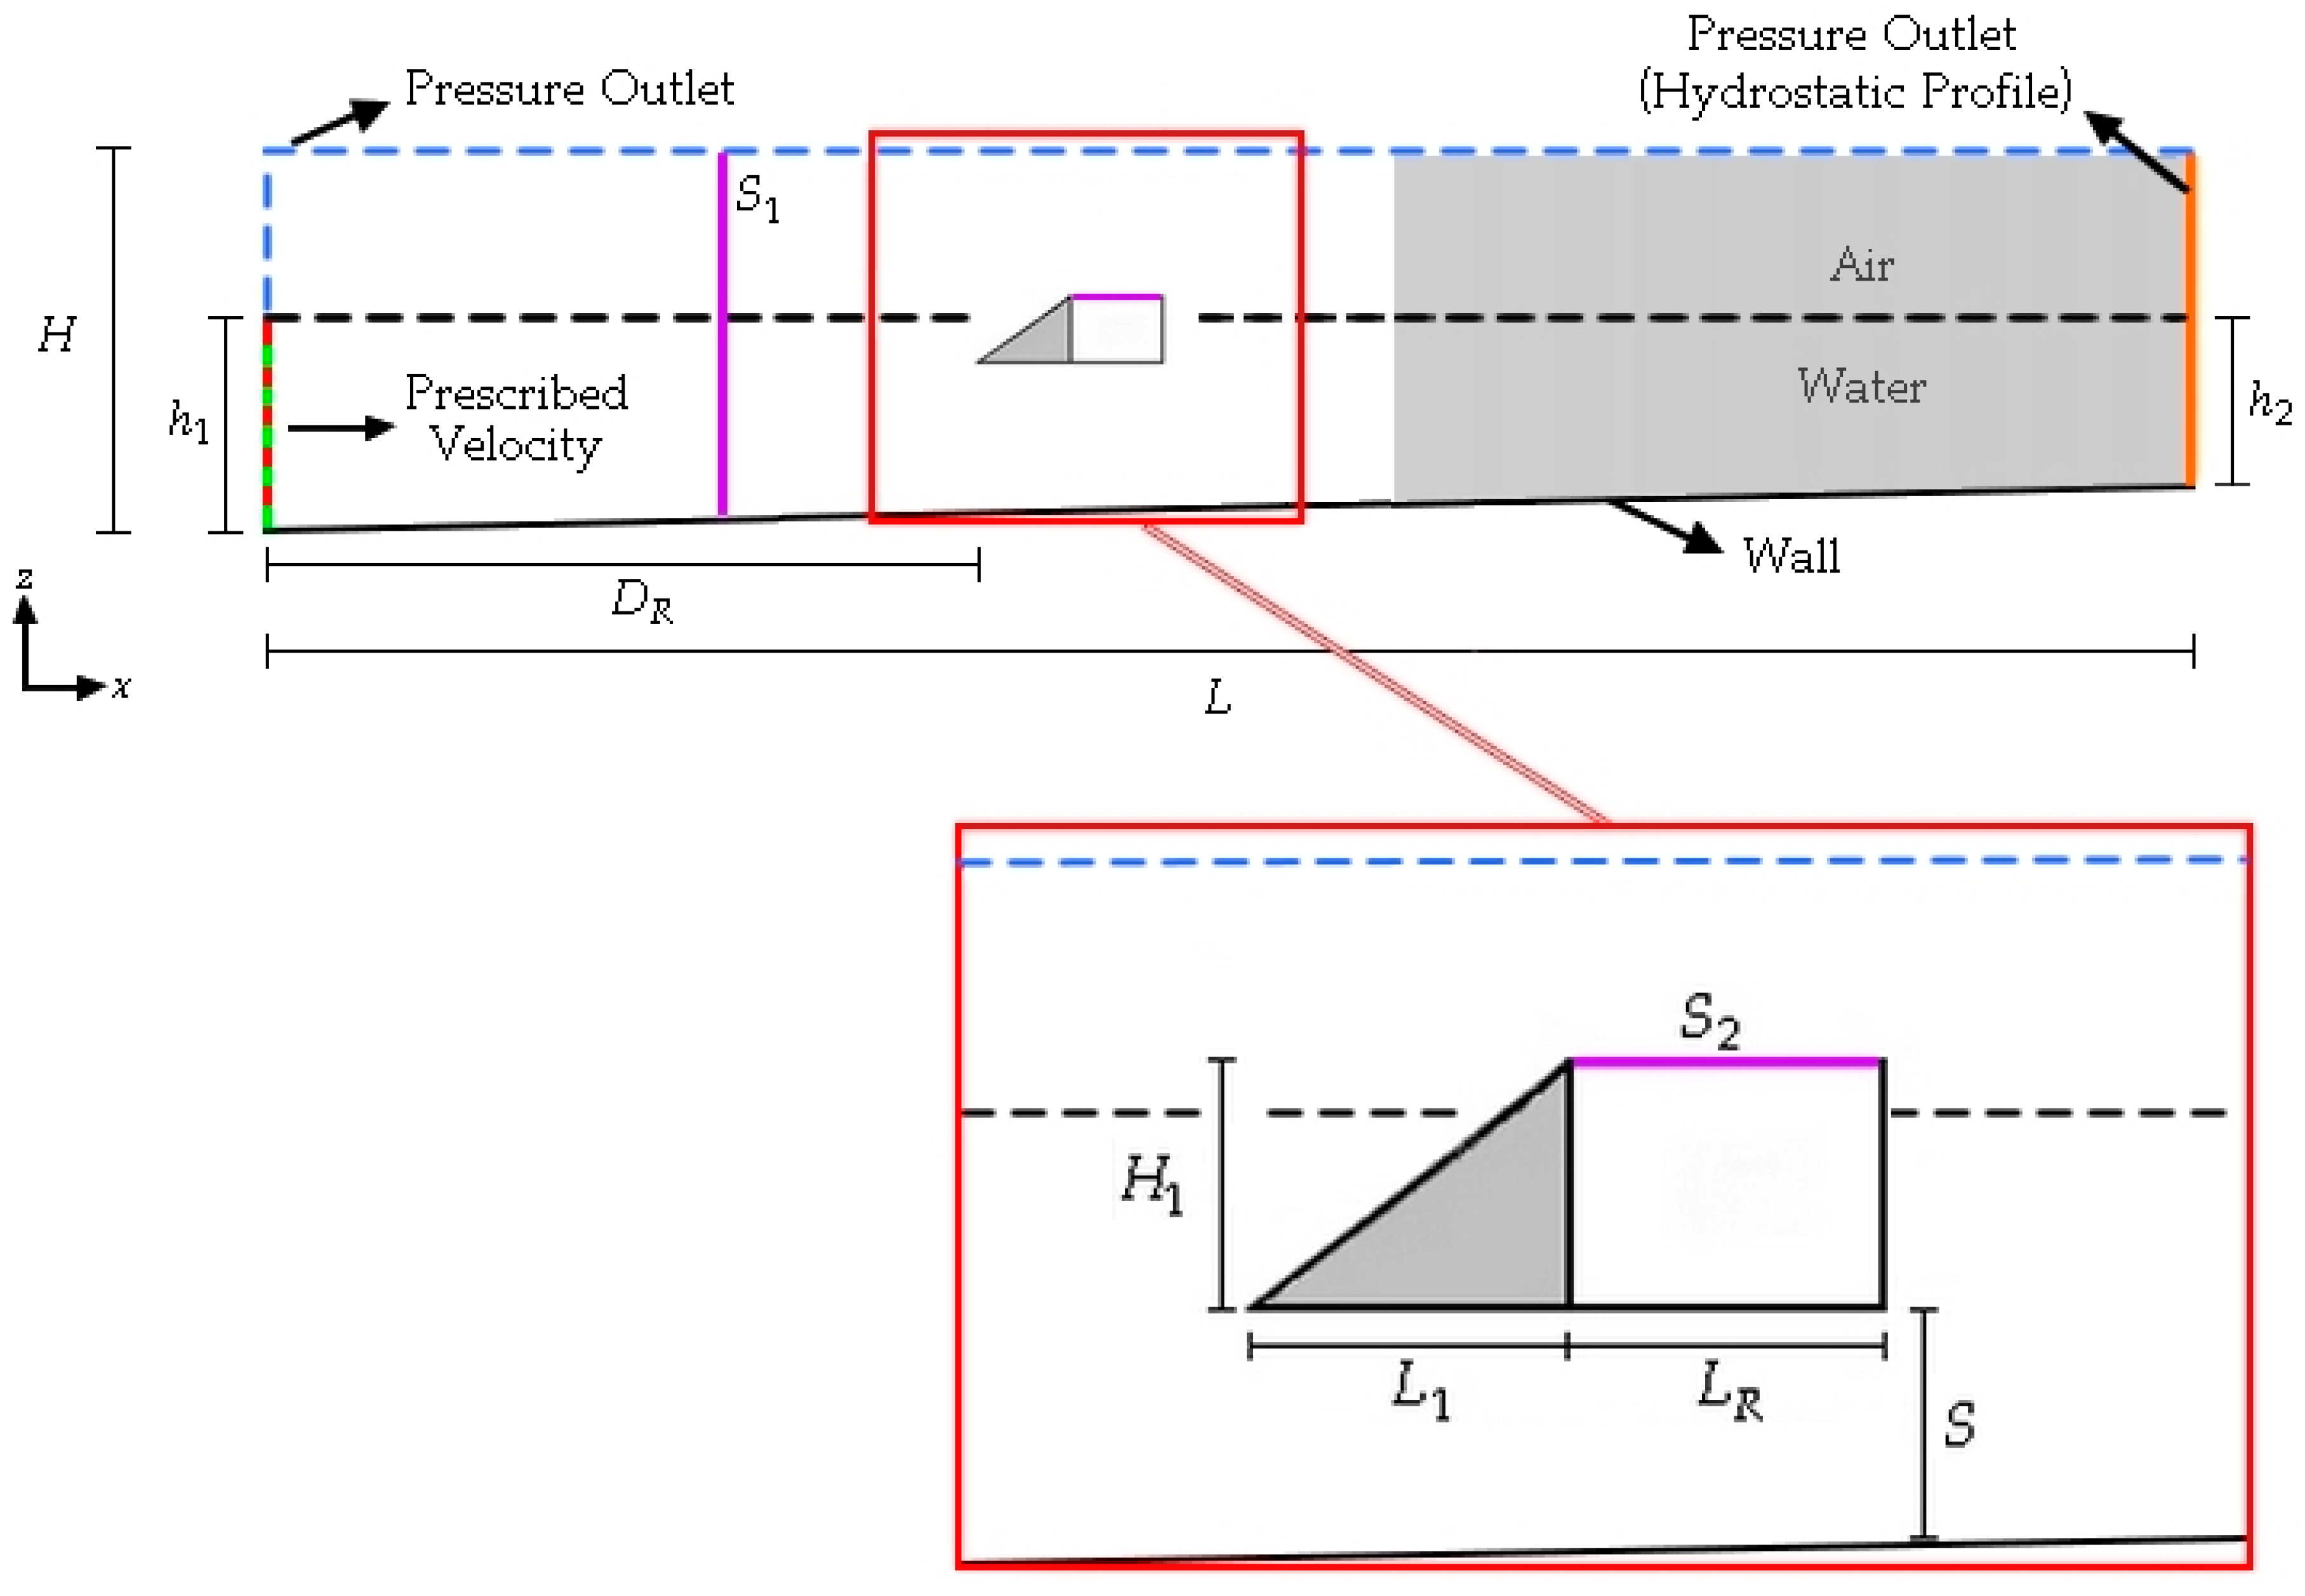
Initially, probe S
1 (located at
m, see
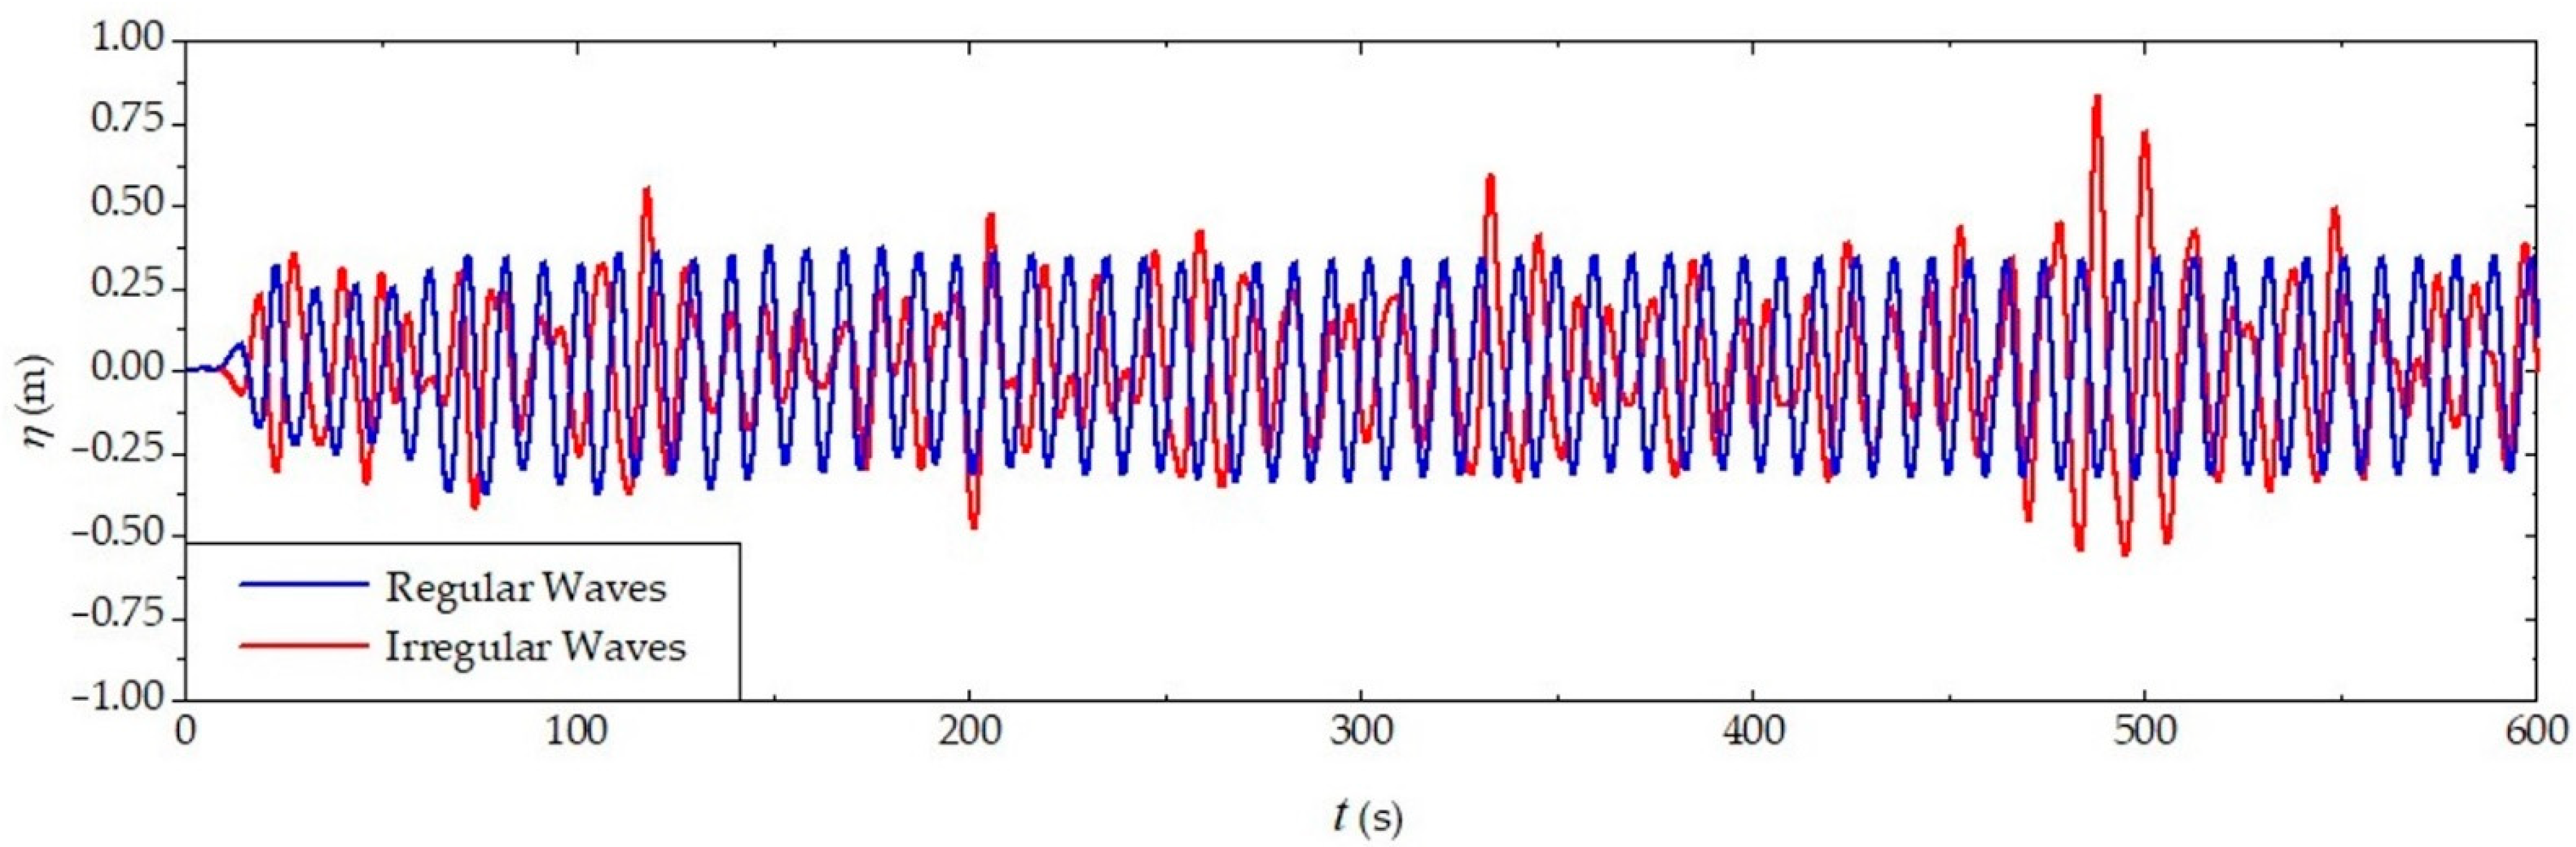
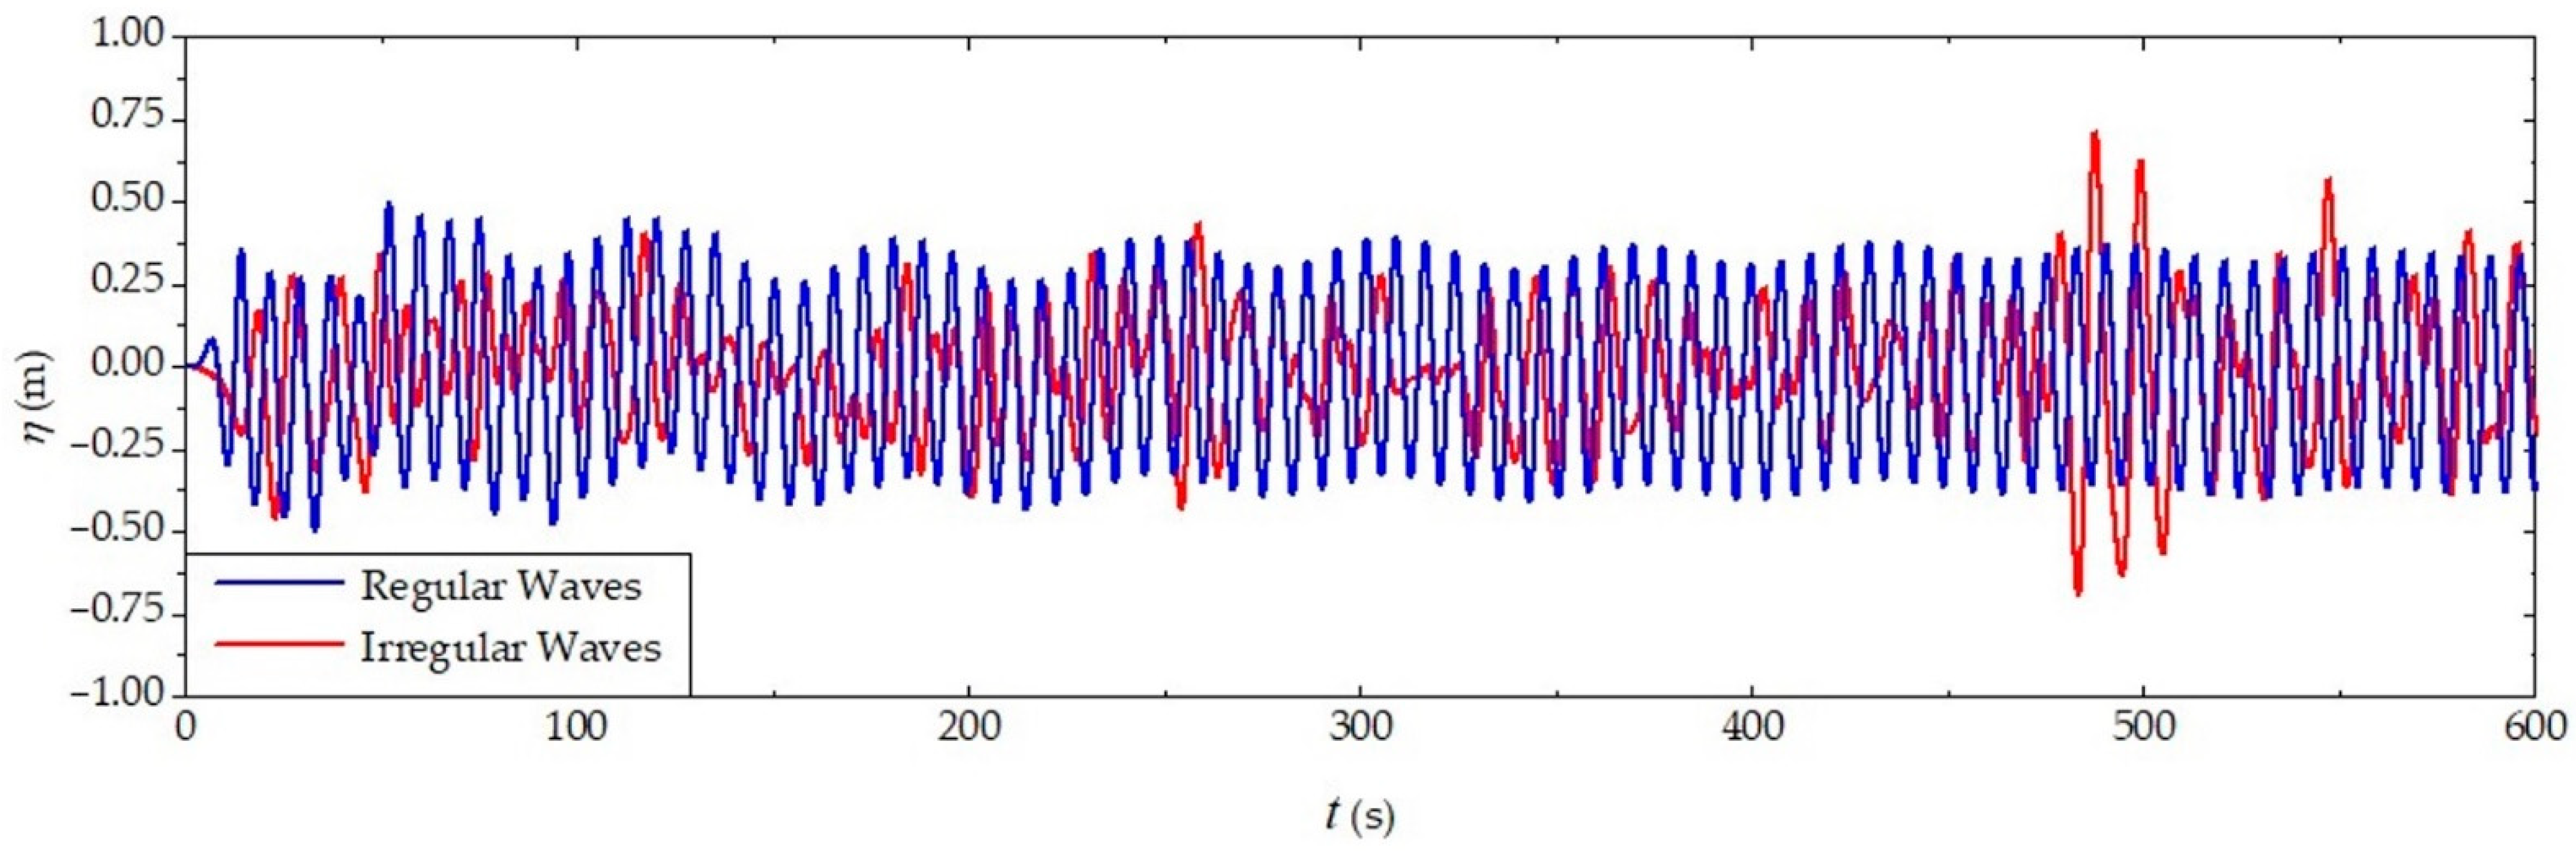
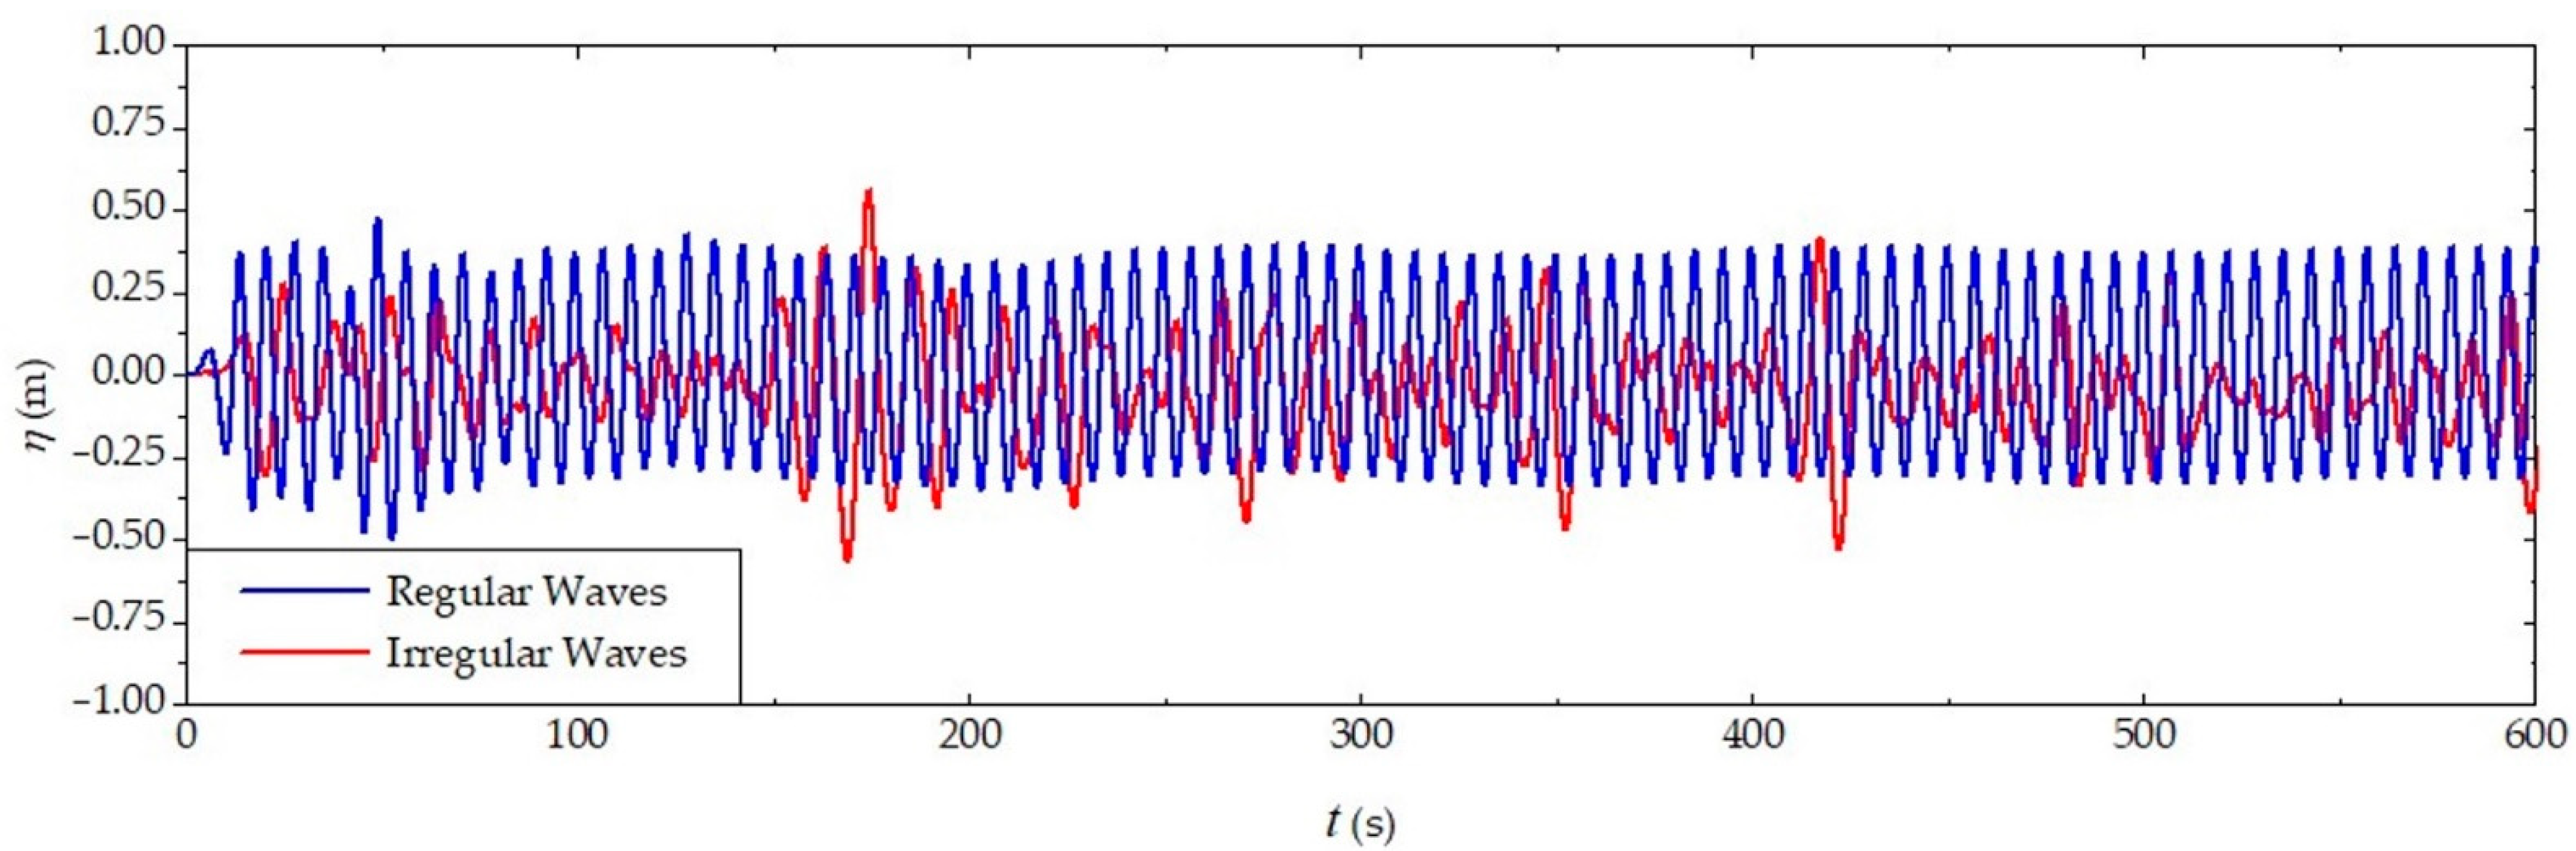
Figure 5) was used to monitor the free-surface elevation in the wave channel. Thus,
Figure 10,
Figure 11 and
Figure 12 illustrate a qualitative comparison between the free-surface elevation that occurred with the representative regular waves and the realistic irregular waves for the sea state that occurred in RG, SVP, and TV, respectively.
From
Figure 10,
Figure 11 and
Figure 12, as expected, the free-surface elevation caused by the generation of representative regular waves presents constant wave peaks for the three cases. On the other hand, the elevation caused by the generation of realistic irregular waves presents variable wave peaks, sometimes larger, sometimes smaller than those caused by the simulation of regular waves, reproducing in a more accurate way the behavior of the ocean waves.
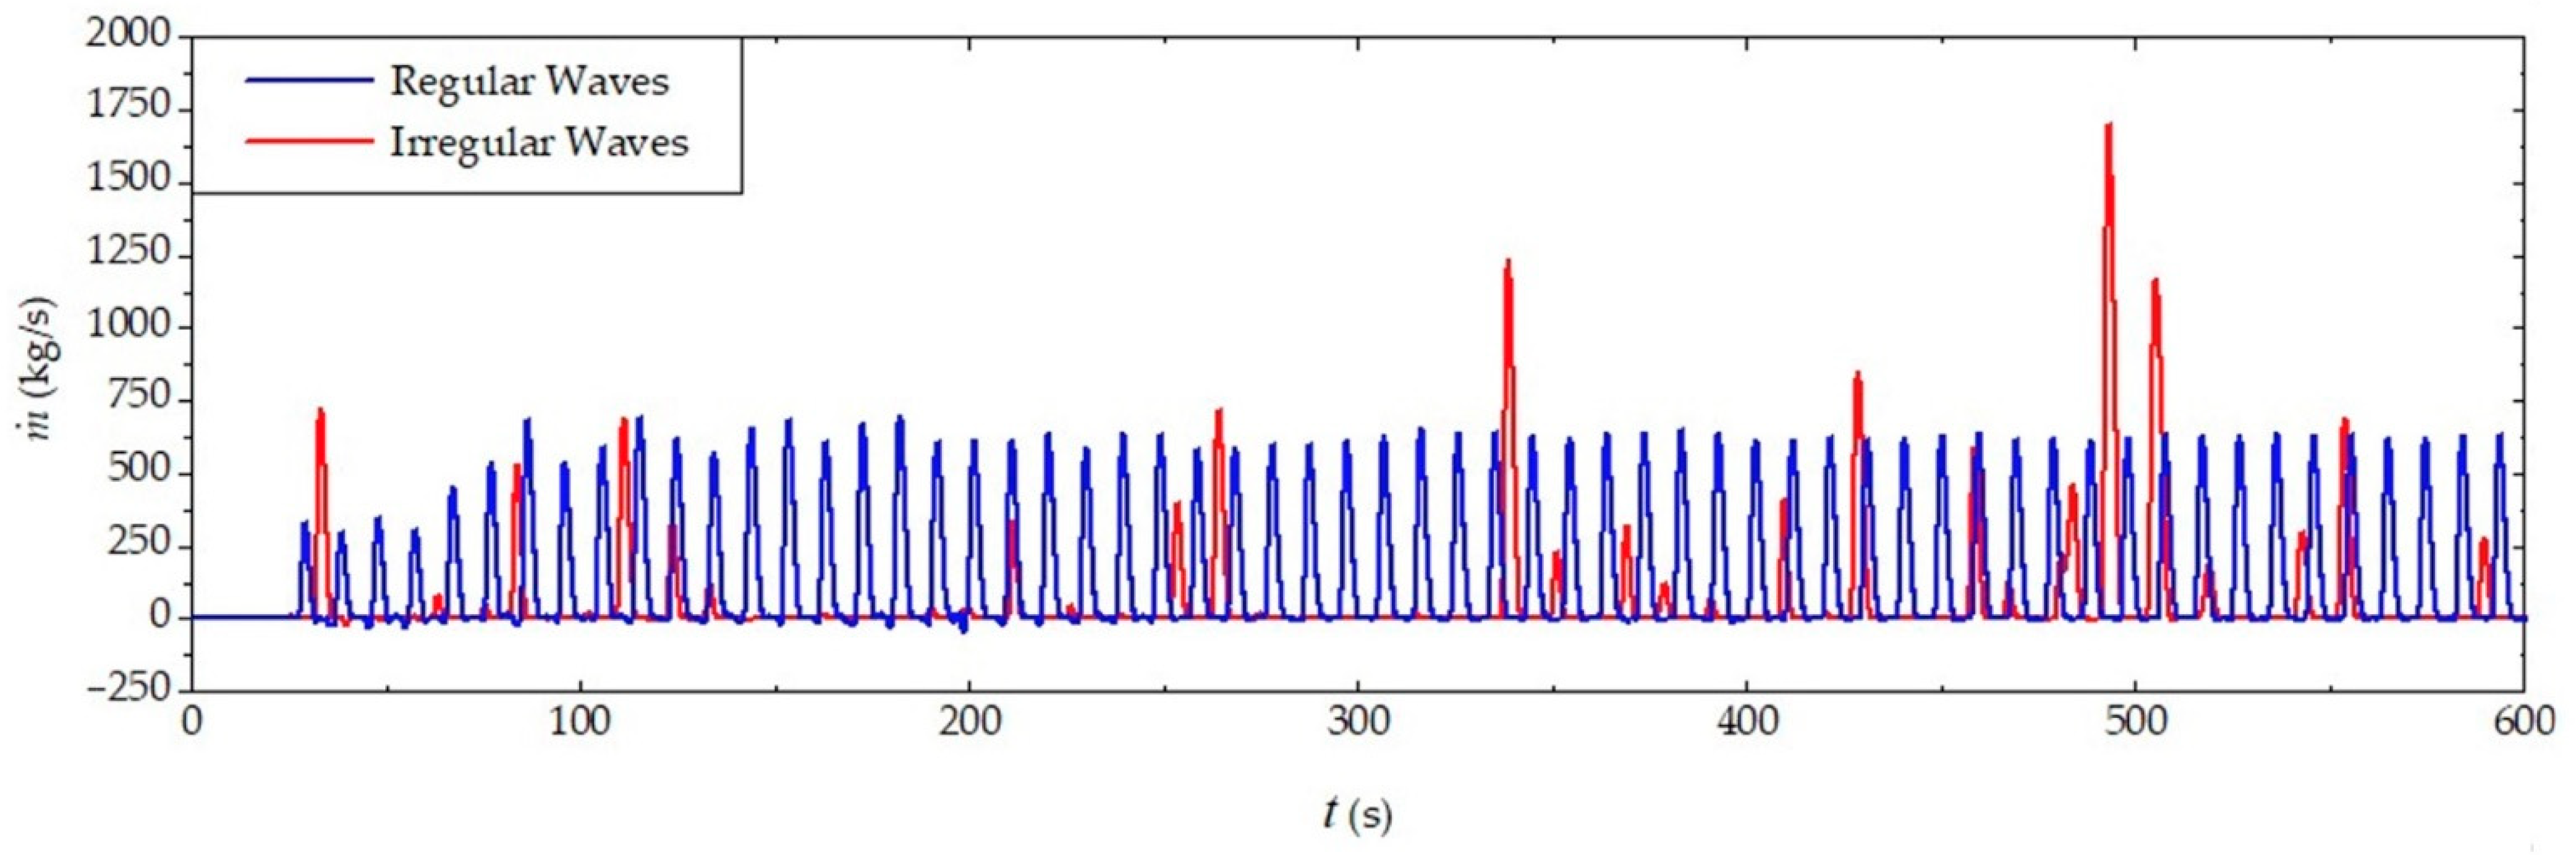
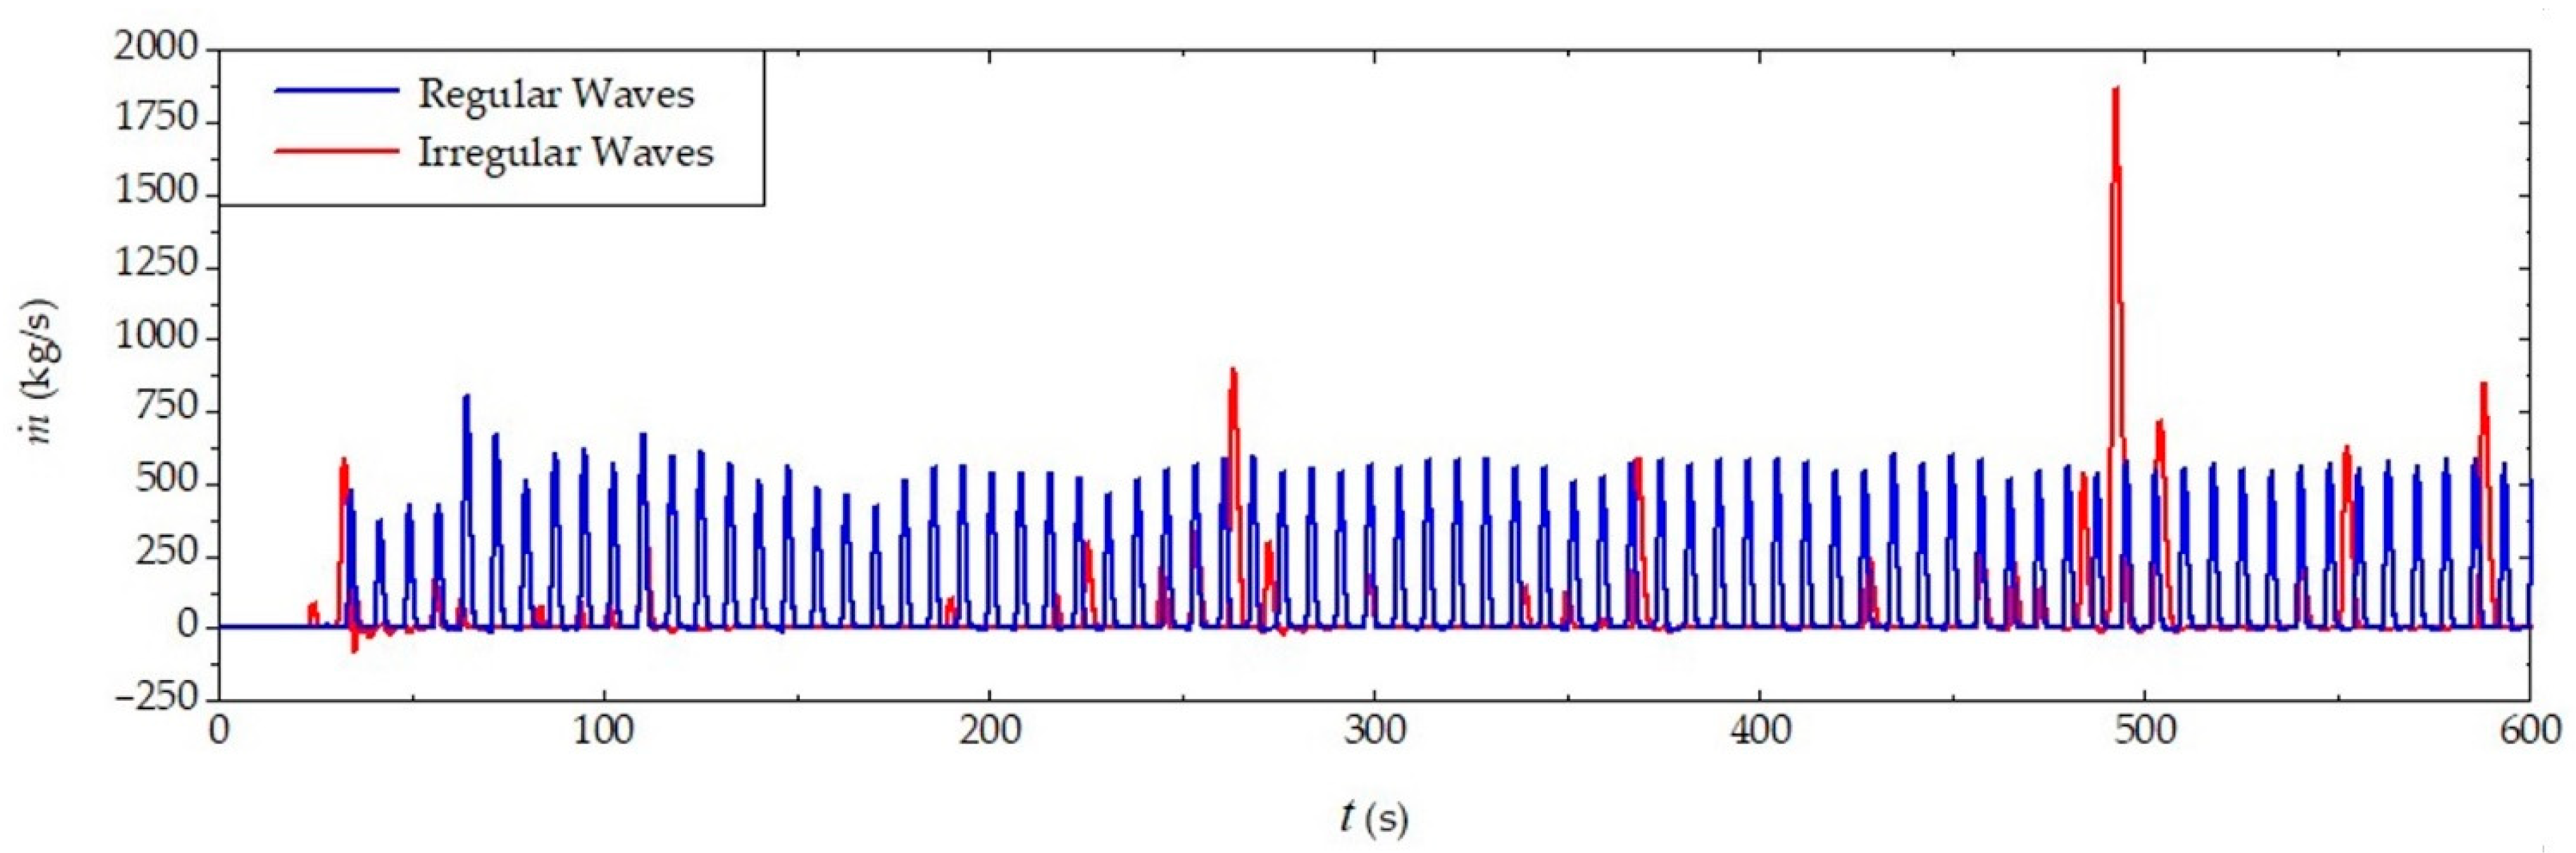
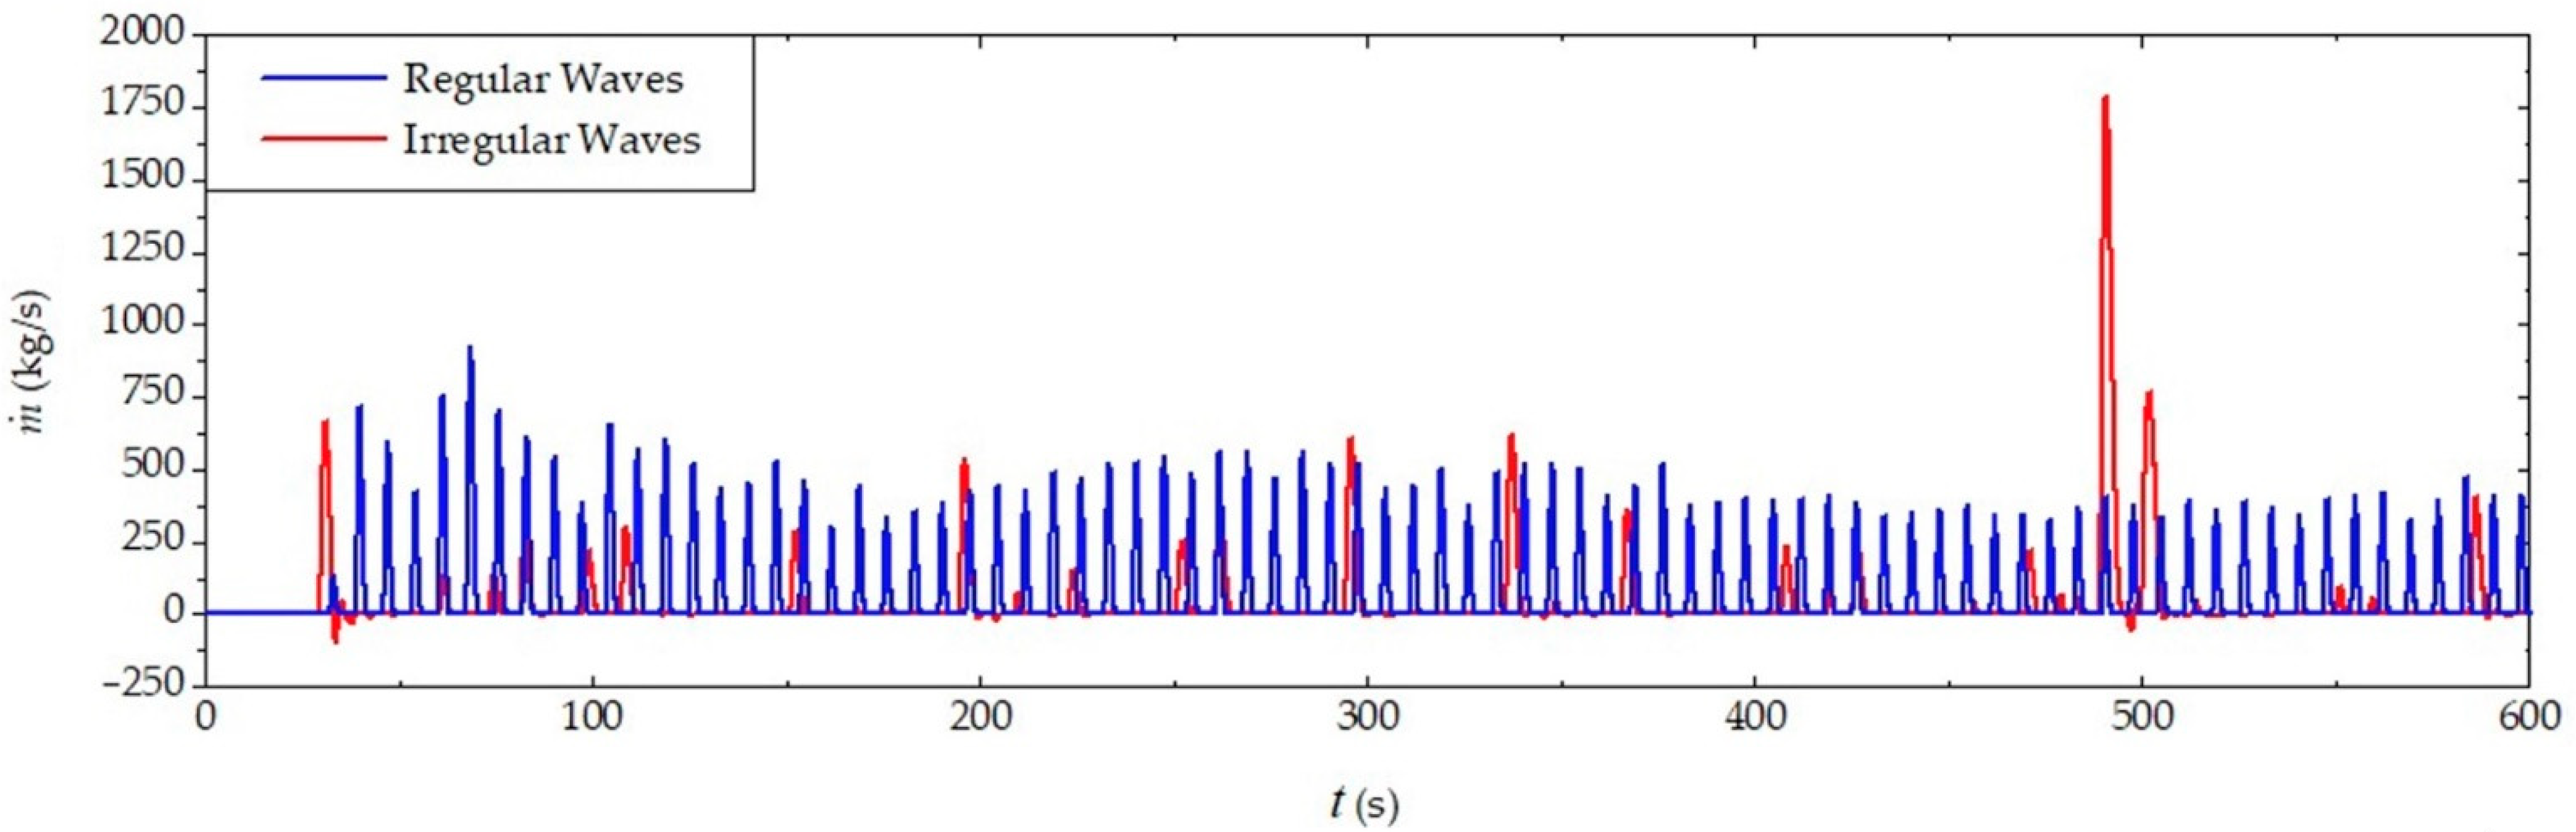
To determine whether the simplification performed using regular waves adequately represents the fluid-dynamic behavior of the overtopping WEC, the mass of water accumulated in the device reservoir was monitored and compared in each coastal region. A qualitative analysis of the results can be seen in
Figure 13,
Figure 14 and
Figure 15, which present the comparison between the mass flow rate (
) that enters the device reservoir during the simulated 600 s due to the incidence of regular and irregular waves, for the points localized in RG, SVP, and TV, respectively.
Regarding the incidence of representative regular waves on the overtopping WEC, it is possible to observe in
Figure 13,
Figure 14 and
Figure 15 that before assuming a practically constant behavior of mass flow entering the reservoir, there are lower flow peaks at the simulation start that increase until the stabilization. This fact occurs due to the initial condition of the wave channel, where the fluids are considered in rest, making the first propagated waves smaller than the others, as can be seen at the beginning of the free-surface elevation lines (blue lines) of
Figure 10,
Figure 11 and
Figure 12.
On the other hand, concerning the incidence of the realistic irregular waves, the occurrence of overtopping and the instantaneous mass flow do not present a stable behavior, as with regular waves. Additionally, it is possible to notice that at several time intervals there was no entry of water into the reservoir, which is explained by the fact that in the realistic sea state there are waves with a shorter period and height and, consequently, less energy, which makes the overtopping of the ramp unfeasible. Finally, it is worth noting that, coincidentally, the highest overtopping peak during the considered 600 s occurred, for all simulated cases, at approximately 500 s.
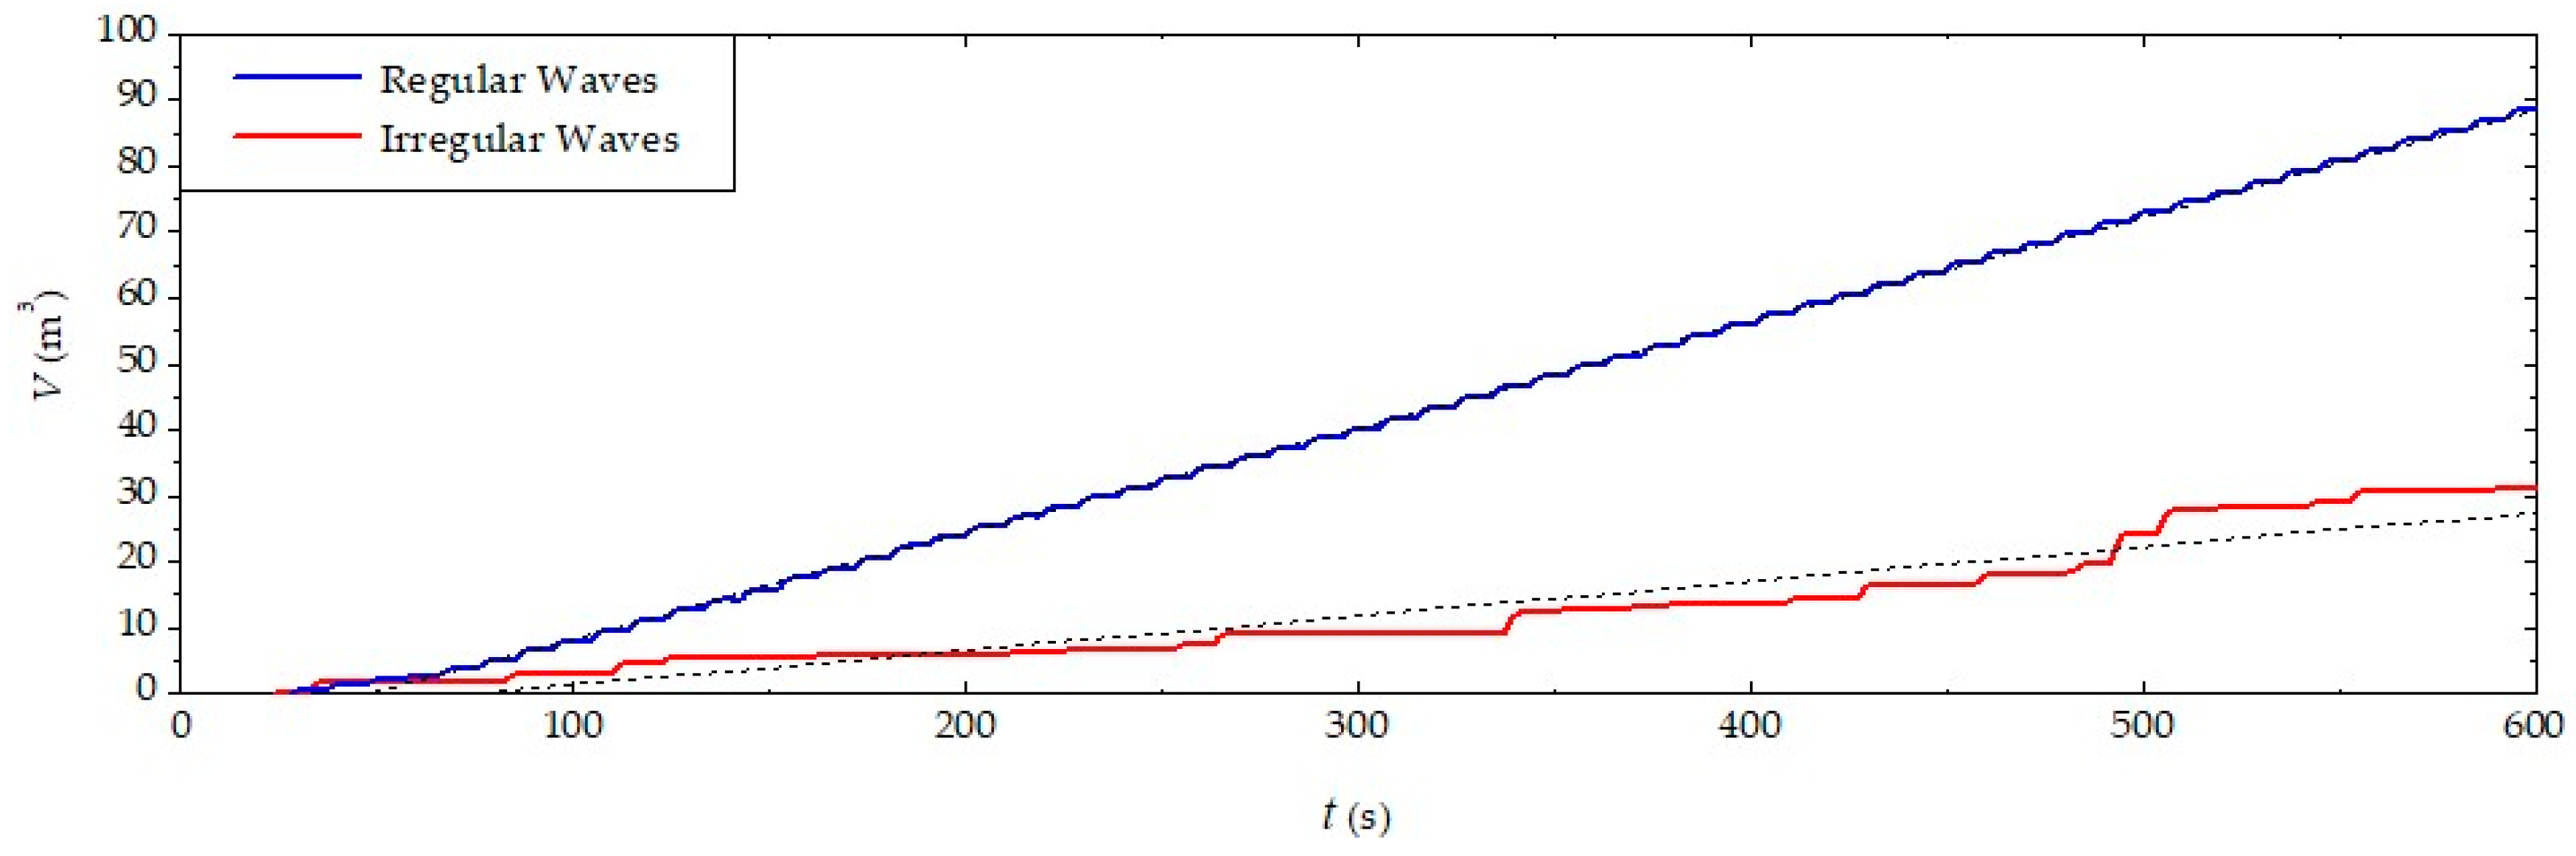
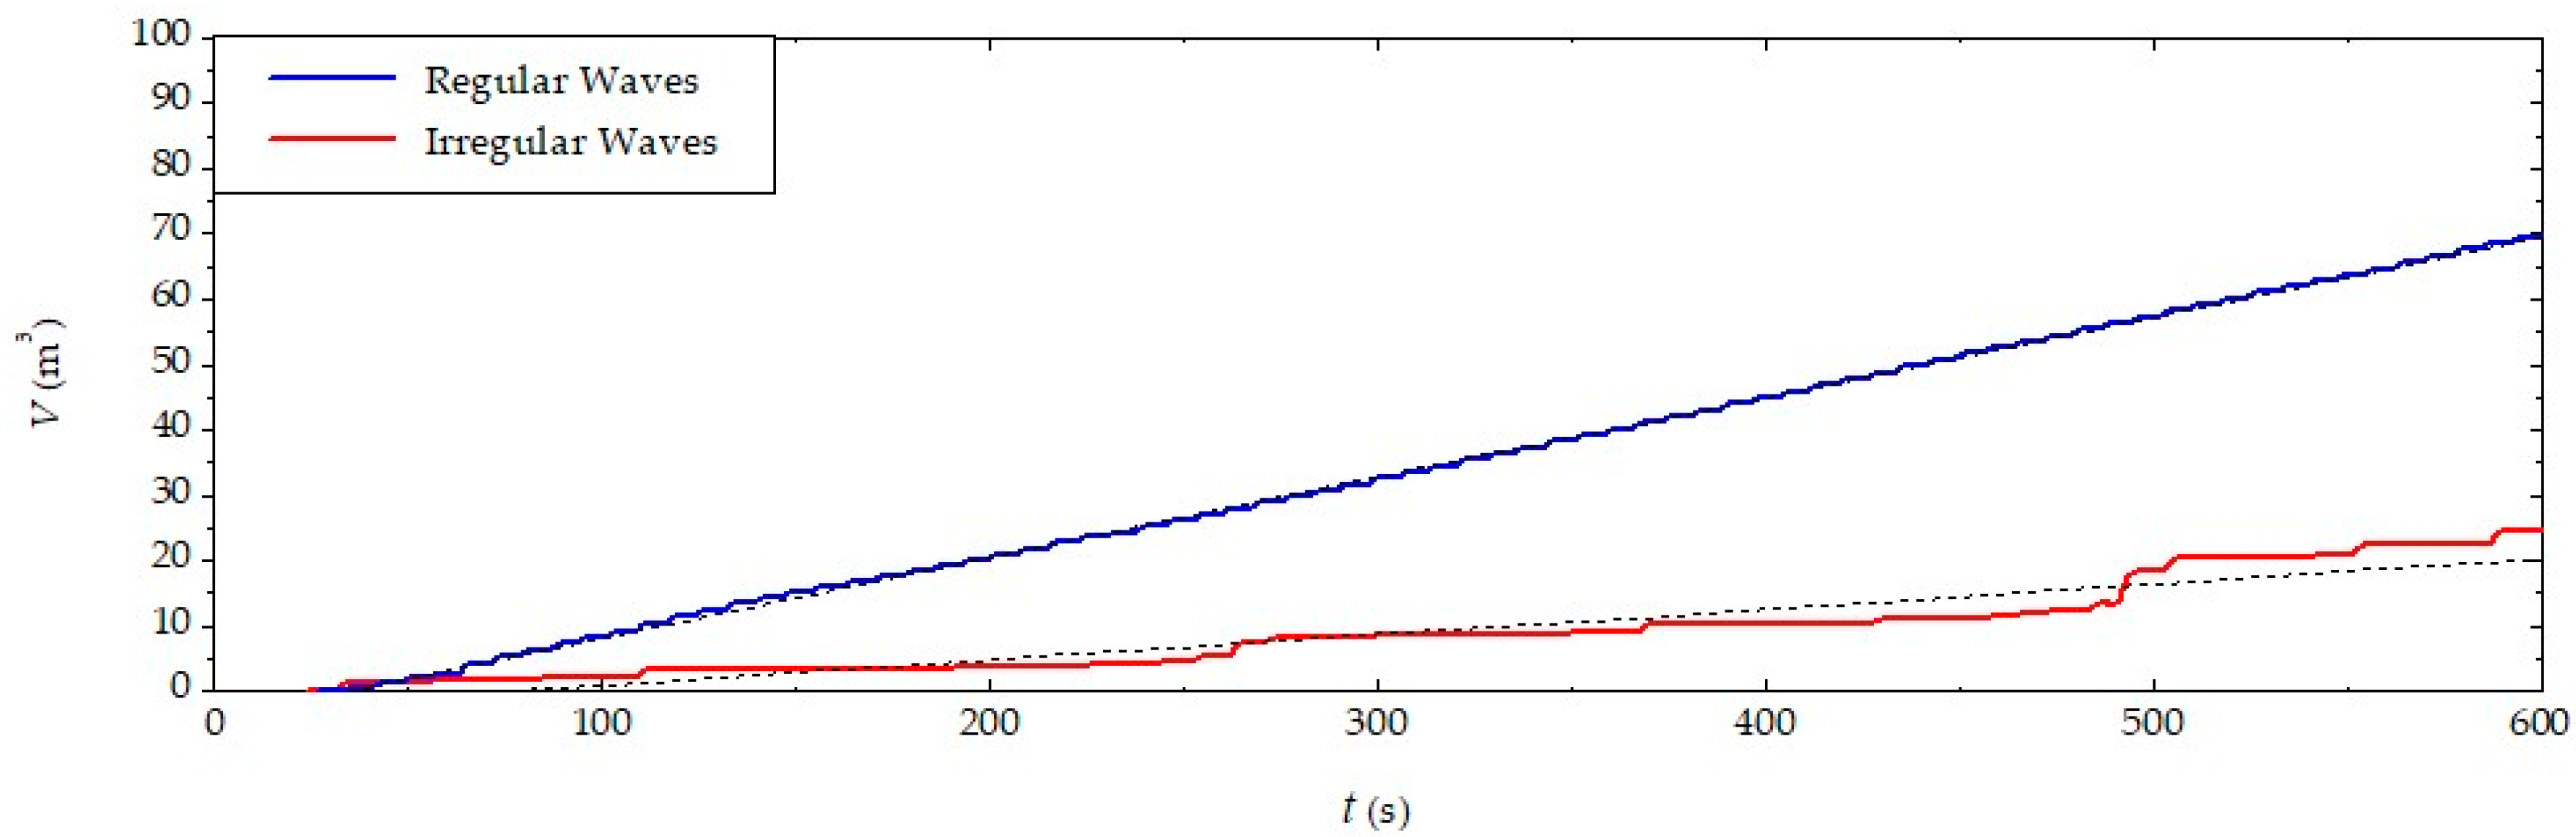
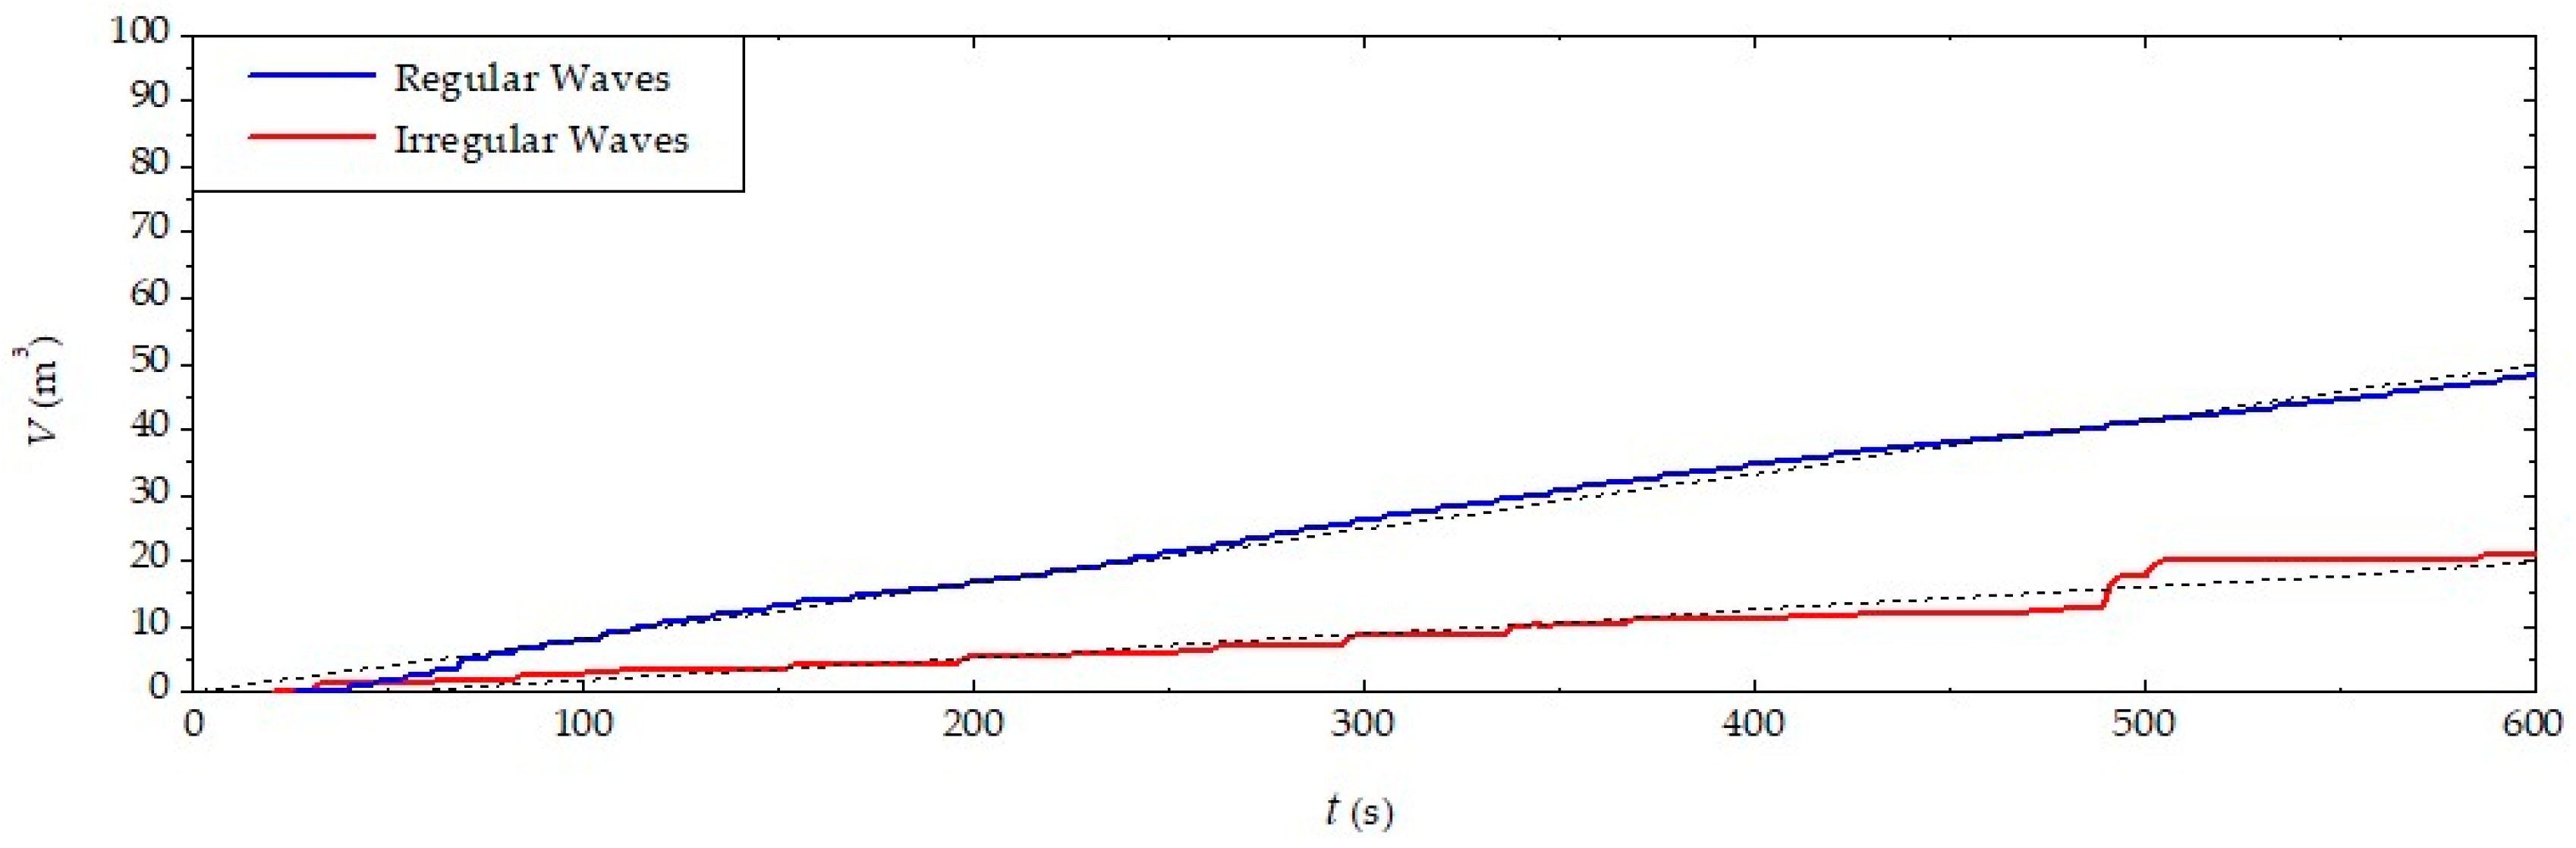
Figure 16,
Figure 17 and
Figure 18 show the variation of water volume (
V) accumulated in the reservoir of the overtopping device over time due to the incidence of the representative regular waves and realistic irregular waves, respectively, for RG, SVP, and TV. It is possible to observe that for the cases numerically simulated with the representative regular waves, a greater volume of water was accumulated in the reservoir when compared to the cases with the realistic irregular waves, a trend that occurs in all analyzed locations. This behavior is in agreement with the results presented in
Figure 13,
Figure 14 and
Figure 15.
Moreover, one can note in
Figure 16,
Figure 17 and
Figure 18 a fitted curve (black dashed line) to the obtained results for each case. A first-degree polynomial equation for each fitted curve was defined by relating the water volume that enters the reservoir and the elapsed time, characterizing a linear correlation. The correlation coefficient (
r), or Pearson coefficient, was also obtained, indicating a linear correlation between two variables [
49].
Table 3 presents the fitted equation, time range, and Pearson coefficient for all studied cases. The time range covers the interval between the first overtopping and the final simulation time.
From
Table 3, one can infer that
represents a strong linear relationship between
V and
t [
49], allowing the employment of the fitted equations in future investigations considering longer overtopping device uptimes.
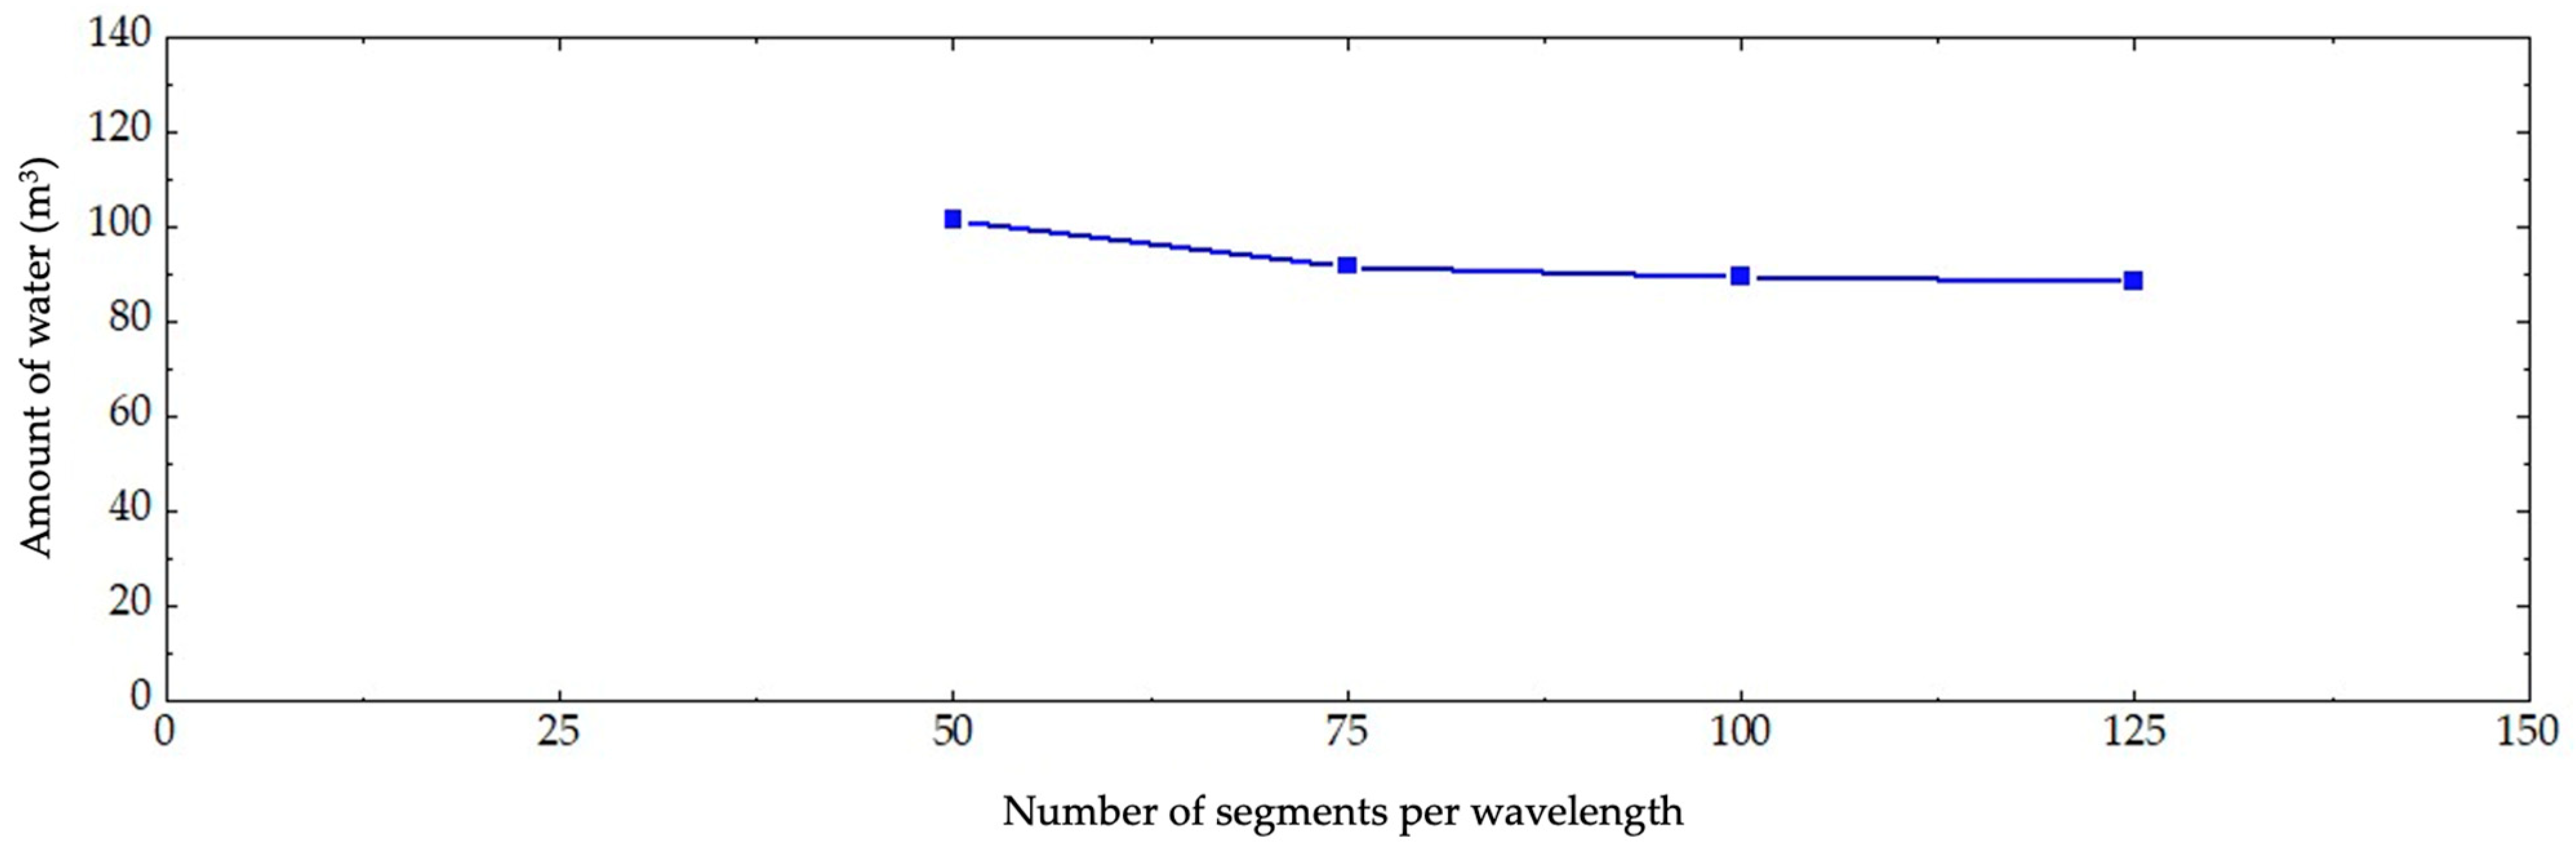
In order to quantitatively evaluate the performance of the overtopping device under the incidence of representative regular waves and realistic irregular waves, calculations were performed for the total amount of water accumulated in its reservoir over the 600 s simulated.
Table 4 presents these results as volume of water for the evaluated cases.
One can note in
Table 4, as well as in
Figure 16,
Figure 17 and
Figure 18, that for the cases numerically simulated with the representative regular waves, a greater amount of water was accumulated in the reservoir when compared to the cases with the realistic irregular waves, a trend that occurs in all analyzed locations. It was also observed that, although the regular waves representing SVP and TV are identical, the difference in bathymetry and in the depth of the wave channel, of approximately 2.80 m between these cases, influenced the incident water volume in the device reservoir. A possible reason for this is related to the fact that the representative regular wave of SVP propagates in a shallower water layer, which increases the energy flow when compared to the propagation of this same wave in a deeper water layer, as occurs in the case of TV.
Furthermore, an investigation was carried out in order to analyze the fluid–dynamic behavior of the overtopping device aiming to completely fill the reservoir due to the action of regular waves. Thereunto, the case referring to the municipality of RG was simulated for 900 s.
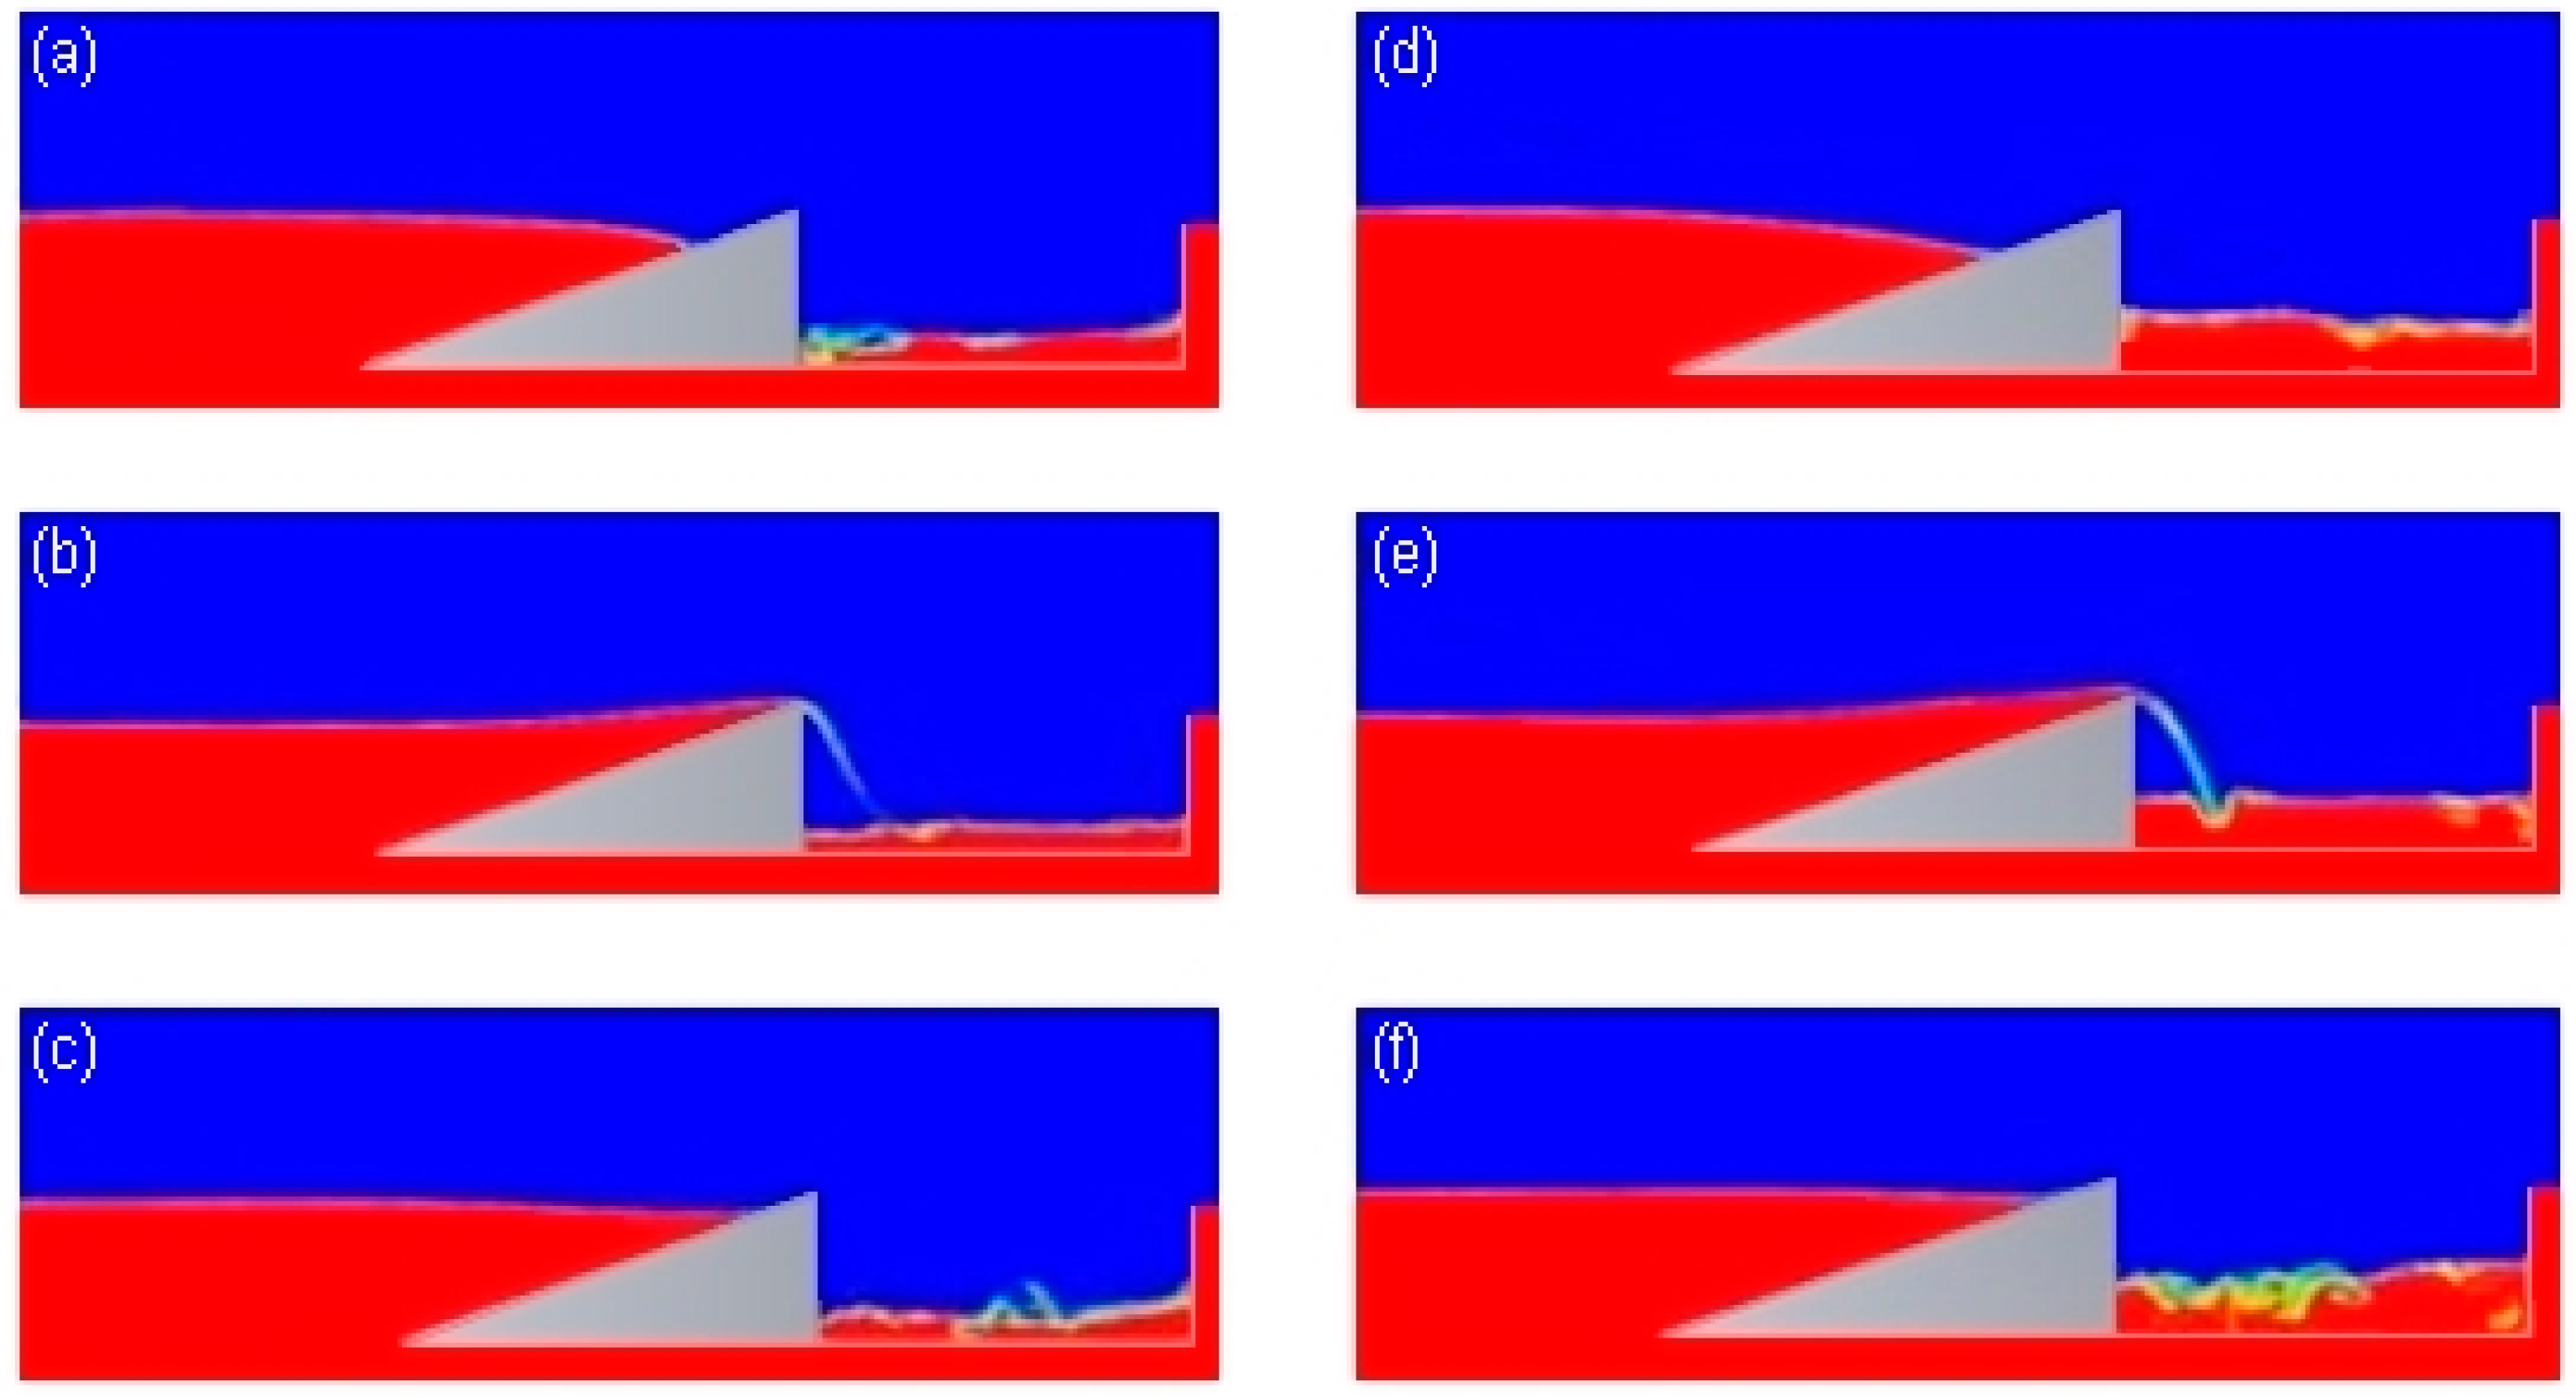
Figure 19 shows the maximum mass flow peak that occurred for the representative regular waves (
Figure 19a–c) and for the realistic irregular waves (
Figure 19d–f), during the simulation with 900 s. The water is represented in red color, while the air is represented in blue color.
As can be seen in
Figure 19a,d, respectively, for
s and
s, in the instant before the overtopping, a mass of water incident on the device ramp can be observed. After that, in
Figure 19b,e, respectively, for
s and
s, one can infer that the wave overcame the resistance imposed by the ramp to the flow, climbing it and dropping into the reservoir. It is also noted that the overtopping discharge is greater for the realistic irregular wave (
Figure 19e). Finally,
Figure 19c,f, respectively, for
s and
s, present instants after the overtopping discharges when the water masses return down the ramp at the same time there is an agitation in the water accumulated inside the reservoirs.
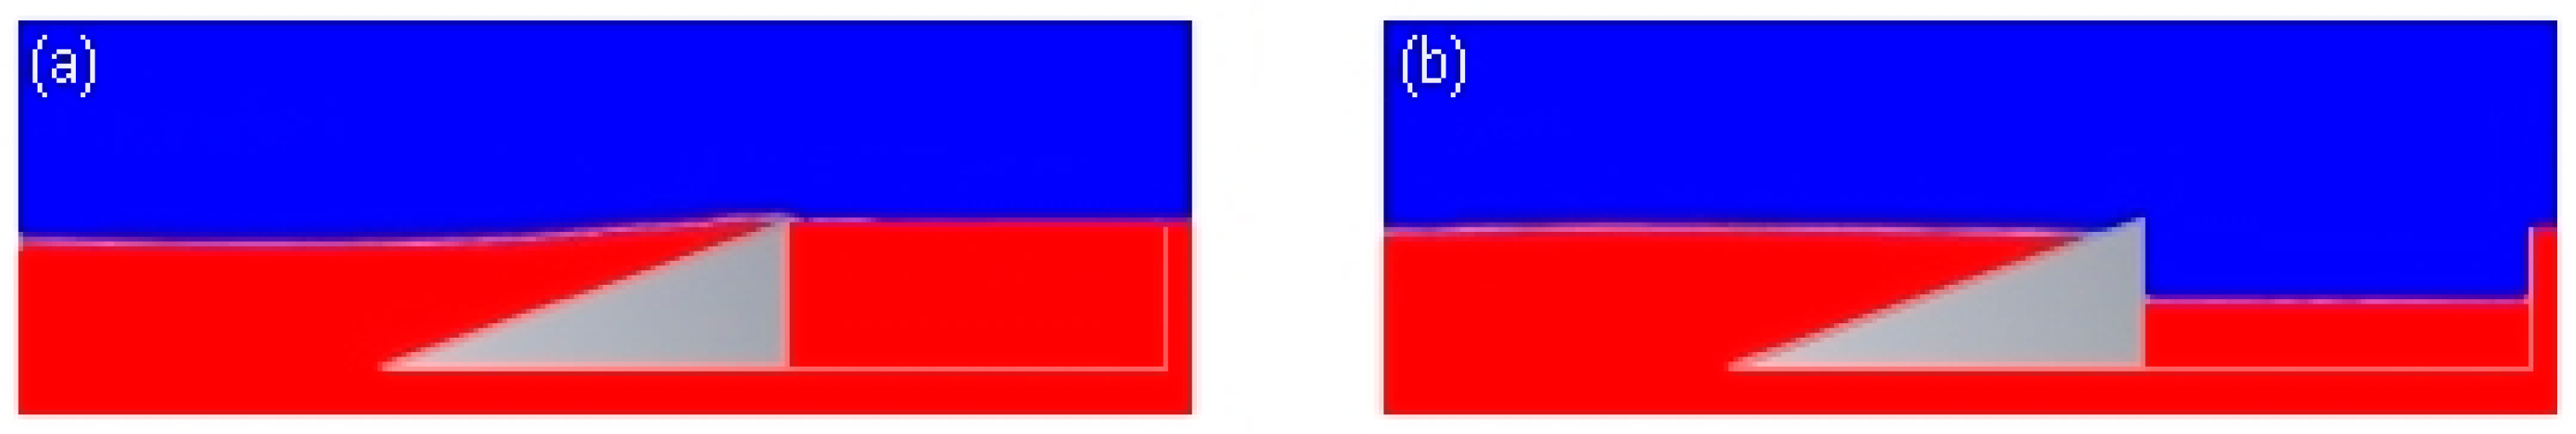
Still referring to the accumulation of water in the reservoir,
Figure 20 presents the phase topology for
s due to the incidence of representative regular waves (
Figure 20a) and realistic irregular waves (
Figure 20b). As can be seen in
Figure 20a, the reservoir was filled with water for the case that considers the incidence of regular waves. Instead, in
Figure 20b, the case that considers the incidence of realistic irregular waves, the reservoir would require the incidence of a significant volume of water until its full filling. Therefore, qualitatively, it is evident that the analysis considering the incidence of regular waves leads to an accumulation of water in the reservoir that is considerably higher than that obtained through the incidence of irregular waves, with this trend quantitatively confirmed in
Table 4 and
Figure 16,
Figure 17 and
Figure 18.
Finally, the results obtained here were compared with a previous study by Martins et al. [
50], which numerically analyzed the incidence of regular waves (with period of 7.5 s and height of 1 m) and irregular waves from the Pierson–Moskowitz wave spectrum over an onshore overtopping WEC. To do so, only the first 100 s of numerical simulations for RG, SAP, and TV were considered, aiming for an adequate comparison with results of Martins et al. [
50].
Table 5 shows the values for the total water amount accumulated inside the reservoirs, with the difference defined by the ratio between the water volumes obtained with regular and irregular waves.
It can be seen in
Table 5 that the magnitude of water volumes obtained in Martins et al. [
50] is greater (by approximately 2 times) than those of the present work. Taking as reference the regular waves, and considering that their period and wavelength are similar in both studies, one possible reason for this discrepancy is related to the wave high of 1 m adopted by Martins et al. [
50], which is around 50% higher than the representative regular waves of RG and 30% higher than the representative regular waves of SVP and TV. On the other hand, if the difference of accumulated water in each case due to the incidence of regular and irregular waves (see
Table 5) is compared, one can observe the same order of magnitude among the cases. Therefore, the present results are in agreement with an analogous previous study.


 ,
, 


