Article

A Recognition Algorithm of Seismic Signals Based on Wavelet Analysis

1
School of Oceanography, Shanghai Jiao Tong University, Shanghai 200240, China
2
The Second Institute of Oceanography, Ministry of Natural Resources of the China, Hangzhou 310012, China
*
Author to whom correspondence should be addressed.
J. Mar. Sci. Eng. 2022, 10(8), 1093; https://doi.org/10.3390/jmse10081093
Submission received: 8 June 2022 / Revised: 14 July 2022 / Accepted: 15 July 2022 / Published: 10 August 2022

Abstract

:
In order to meet the requirements of mobile marine seismometers to observe and record seismic signals, a study of fast and accurate seismic signal recognition was carried out. This paper introduces the use of the wavelet analysis method for seismic signal processing and recognition, and compares and analyzes the abilities of different wavelet basis functions to detect the seismic signal. By denoising and reconstructing the signal, the distribution law of the wavelet coefficients of seismic signal at different scales was obtained. On this basis, this paper proposes an identification model of seismic signals based on wavelet analysis and thereby solves the conflict between high speed and high accuracy of seismic signal recognition methods. In this study, the simulation was carried out in the Matlab2020b environment, and the feasibility of wavelet recognition algorithm was proven by applying this algorithm to the seismic signal database for experimental verification.

1. Introduction

Understandings of the deep structure and dynamics of the Earth mainly come from seismic imaging observations, i.e., observations of seismic waves that originate from earthquakes propagating through the Earth’s interior and reaching the surface, which is where they are observed [1]. Seismic stations are usually used to observe earthquakes on land, and many countries around the world have built a network of seismic monitoring stations that basically cover the land. However, it is impossible to lay seismic stations in the ocean, which accounts for two-thirds of the Earth’s surface, resulting in a huge gap in the imaging of the Earth’s depths. Ocean-bottom seismometer (OBSs) are one of the main means of detecting the deep structure of the seafloor. However, OBSs have limitations such as a short working time, small coverage, and high survey cost, making it impossible to carry out large-scale, long-term seismic tomography worldwide [2].
In response to the above problems, in recent years, the international academic community has proposed a new technical concept, namely, the use of mobile marine seismometers to record and observe natural earthquakes. These marine seismometers differ from traditional fixed land seismic stations or sit-down submarine seismometers, because they are suspended at a certain depth in the sea and move with the ocean current. After recording the seismic P–wave signal, they can automatically float to the surface and transmit data to ground base stations through satellites, so as to achieve long-term, quasi-real-time, and low-cost observations of natural seismic P–wave signals and form a seismic network covering a wide area of the sea. Based on the above concept, France has developed the first Mobile Earthquake Recording in Marine Areas by Independent Divers, the MERMAID system [3] and has carried out networking observations in the Indian Ocean and the South Pacific Ocean. China has also successfully developed a mobile oceanic seismic recording system (the “Dolphin” system) [4] and conducted experimental networking observations in the South China Sea.
Regardless of the type of marine seismometer, the most critical factor is the accurate identification the seismic P–wave signals. If the mobile marine seismometer misses the seismic P–wave signal, this will cause the original data to be lost. In contrast, when it misjudges the seismic P–wave signal, it will float to transmit invalid data, resulting in wasted battery power and a reduction in working life. Therefore, a fast and accurate recognition algorithm of natural seismic P–wave signal is particularly necessary.
At present, the identification methods for seismic signals mainly include the STA/LTA algorithm [5], the neural network method [6], the AIC algorithm [7], the wavelet analysis method [8], etc., each of which has its own advantages and disadvantages. The STA/LTA algorithm is relatively simple and fast, but less accurate than the other methods, and its results are too rough to analyze the detailed characteristic information of a seismic signal, which is only suitable for seismic signals with a high SRN [9]. The neural network method and the AIC algorithm have high accuracy, but the complex model requires a lot of computation, has a very slow speed [10], and has relatively high hardware requirements, making it difficult to use on the control chips equipped in the mobile marine seismometers. The wavelet analysis method can obtain the time–frequency domain change information of the seismic P–wave signal, has dynamic resolution, is sensitive to the non-stationary signal [11], and can perform accurate identification in the case of large amounts of noise pollution [12]. At the same time, the wavelet analysis method involves a moderate degree of calculation, which can read, convert, calculate, and identify the seismic P–wave signal on the low-power DSP chip, so as to meet the actual needs of mobile marine seismometers.
This study used the wavelet analysis method. The main parameters of the wavelet basis function were determined, and processing of the seismic P–wave signal was performed, including decomposition, denoising, and reconstruction, so as to obtain the wavelet coefficient of the seismic P–wave signal at different frequency scales. The power distribution of seismic P–wave signals was obtained through wavelet coefficient analysis, and the accurate identification of natural seismic P–wave signals was realized.

2. Principle

Natural seismic P–wave signals are typical time-varying non-stationary signals, which provide observation data accompanied by large amounts of noise, such as marine biological signals, air gun signals, propeller signals, etc. [13]. The distribution of signals of different frequencies in the time domain is also constantly changing. Therefore, when analyzing and identifying seismic P–wave signals, it is necessary to transform signals, eliminate noise interference, and separate the information of different frequencies.
Traditional Fourier transform uses a sine function of infinite-length isobaric magnitude as a basis function, which is suitable for analyzing periodic stationary signals; however, it is difficult to fit it to non-stationary signals. After being Fourier-transformed, singularities in complex seismic P–wave signals form numerous peaks and burrs, resulting in waveform distortion.
To overcome these shortcomings, Morlet proposed a method of wavelet analysis and applied it to the processing of seismic P–wave signals [14,15]. Wavelet analysis is performed in the time–frequency domain, using a basis function of finite width change frequency to transform seismic P–wave signals, called wavelets. The energy of wavelets in the time domain is very concentrated and is mainly distributed near the center point, making it suitable for processing non-stationary signals. Wavelet analysis has high resolution in the time–frequency domain, can separate the signal and noise of seismic P–wave signals, extract weak signal features, realize feature analysis at different scales, and preserve the characteristics of the original signal well after denoising [16], so as to achieve the accurate identification of natural seismic P–wave signals.
The multilayer decomposition of seismic P–wave signals is achieved by multiple telescopic translations of the wavelet function and internal product calculations with the observed seismic signal; each layer is also called a scale, as shown in Figure 1.
Assuming that S ( n ) , a discrete seismic P–wave signal with a length of n, is observed, each decomposition layer halves the length of the signal. The obtained wavelet coefficient C is divided into two parts: the approximate coefficient C A corresponds to the low-frequency part of the signal, whereas the detail coefficient C D corresponds to the high-frequency range, of which the low-frequency part is used as the original data of the next layer decomposition. Taking the three-layer decomposition as an example, the wavelet coefficient C of discrete seismic P–wave signal S ( n ) can be expressed as follows:
C = C A 1 + C D 1 = C A 2 + C D 2 + C D 1 = C A 3 + C D 3 +   C D 2 +   C D 1
Then, the seismic P–wave signal is transformed from the time domain to the time–frequency domain, which is convenient for multi-scale analysis, so as to obtain the local details. By performing threshold processing on the high-frequency part where the noise signal is located, and strengthening the low-frequency part where the seismic P–wave signal is located, the denoising and recognition of the natural seismic P–wave signal is realized.

3. Parameter Setting

3.1. Decomposition Layer

When performing the wavelet decomposition of seismic P–wave signals, more layers of decomposition result in more wavelet coefficients of each layer, and the differences between the seismic P–wave signal and noise are gradually shown. Too few layers will not completely separate the seismic P–wave signal and the noise, making the denoising effect not ideal. In contrast, too many layers will increase the amount of calculation and reduce the efficiency [17], and the wavelet coefficient will lose more information, increasing the error after signal reconstruction, which may eventually lead to the distortion of seismic P–wave signals. Therefore, an appropriate number of decomposition layers should be chosen, which can effectively eliminate noise pollution and accurately preserve the details of the seismic signal.
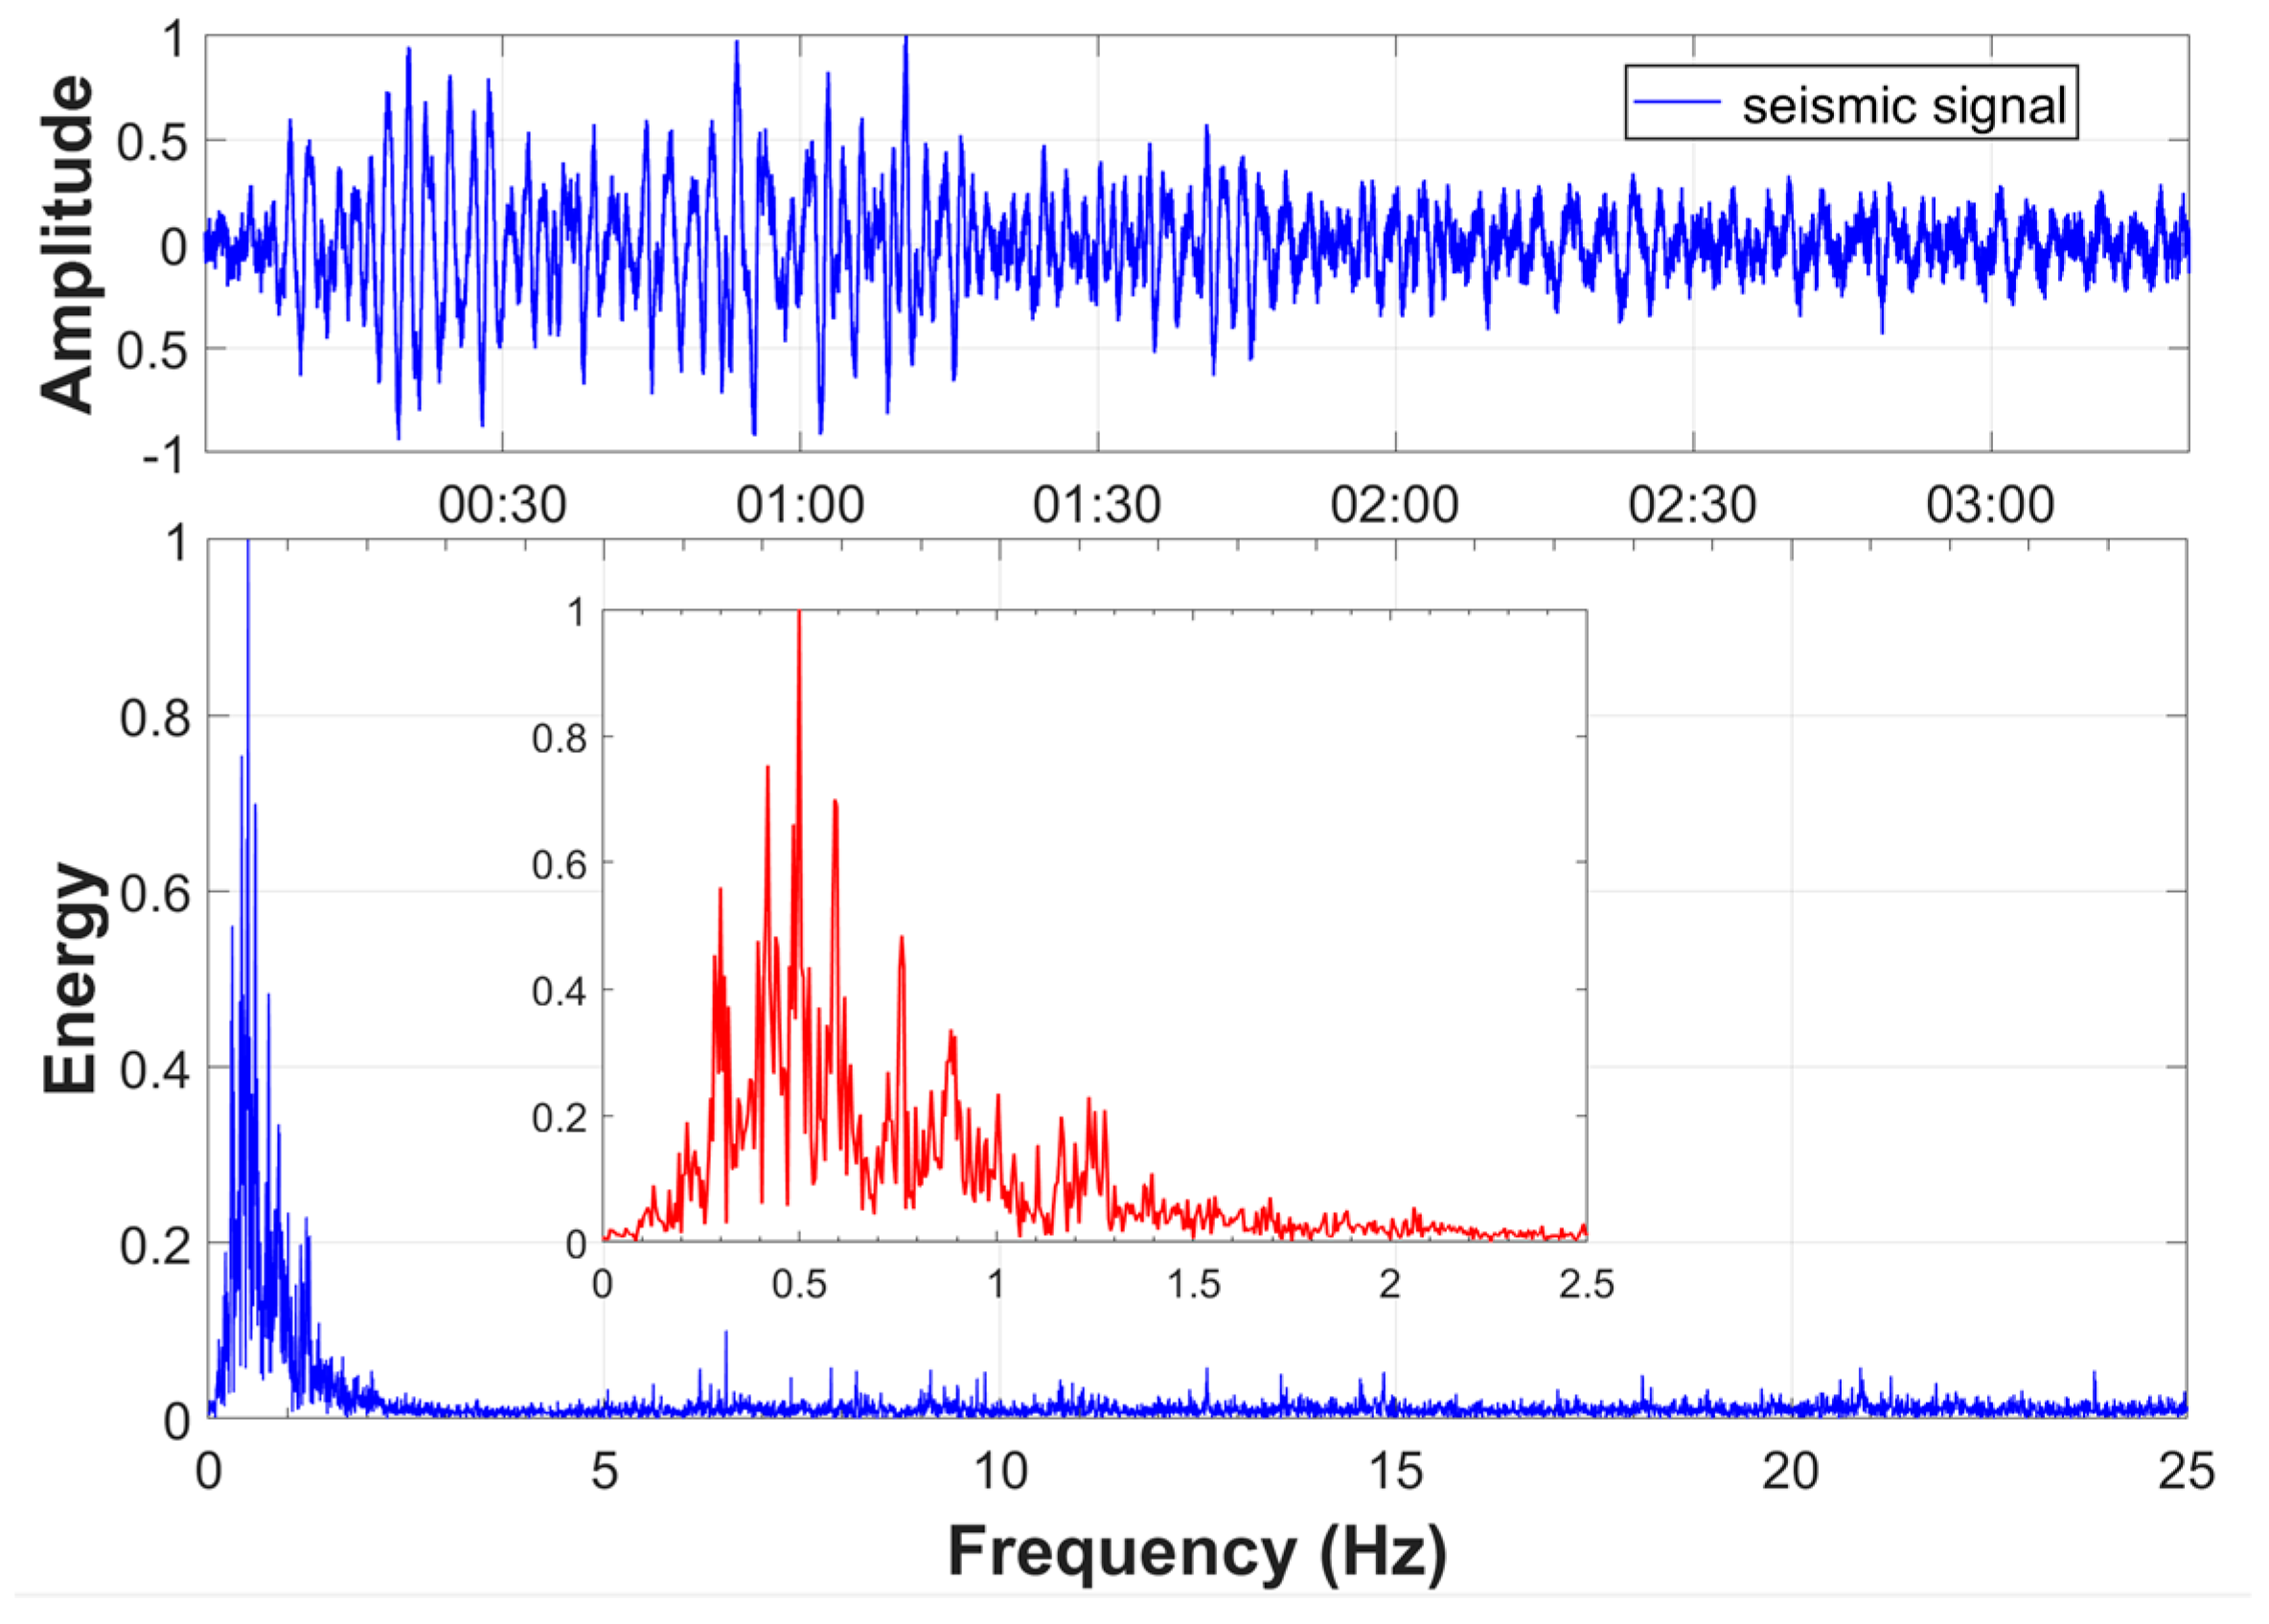
Natural seismic P–wave signals are low-frequency, and their energy is concentrated in the lower range. The observed seismic P–wave signal waveform and its frequency distribution are shown in Figure 2; the signal amplitude and energy values in Figure 2 are normalized according to their respective maximum modulus values. It can be seen that most of the energy is concentrated between 0.2 and 1.2 Hz, and the energy of other frequency bands is relatively uniform and maintained at a low level.
Each time a wavelet decomposition is performed, the frequency of the signal is halved, and the number of wavelet decomposition layers is calculated using the following formula:
N = 1 + [ log 2 ( f 1 / f 2 ) ] = 1 + [ ln f 1 ln f 2 ln 2 ]  
where f 1 is the effective frequency of the sensor carried by the mobile marine seismometer when sampling and f 2 is the lowest frequency of the seismic signal expected to be observed. The result of the calculation is rounded up. The mobile marine seismometer used in this paper used a sampling frequency of 50 Hz; according to the Shannon sampling theorem, the effective frequency range is 0~25 Hz. In order to achieve a low frequency of 0.2 Hz, and considering the baseline drift, the energy distribution of the 0.1~0.2 Hz range is used as the boundary of wavelet decomposition. The calculation shows that the observation signal needs to be decomposed by wavelets with N = 8 layers.

3.2. Wavelet Basis

When performing wavelet transformation on an earthquake signal, the selection of the wavelet base directly affects the results of seismic signal identification. Different wavelet basis functions have different characteristics and computational complexity, and the degree of fit and mutation sensitivity of seismic P–wave signals are also different, and it is necessary to select the most appropriate wavelet base according to the characteristics of the specific signal [18,19].
When wavelet transformations are performed, the selected wavelet basis function should have orthogonality, tight support, symmetry, regularity, and high-order vanishing moments [20]. However, Haar is the only symmetrical wavelet among these with orthogonal tight support, and the tight support conflicts with high-order disappearing moments. This means that a perfect wavelet satisfying all the above properties does not exist. At present, practical experience is still needed to select wavelet bases. Some classical and widely used wavelet basis functions and their properties are shown in Table 1.
A typical wavelet basis function was individually selected from the above clusters of wavelets: Haar wavelet, db4 wavelet, bior2.6 wavelet, coif3 wavelet, and sym3 wavelet. We used a piece of unitized seismic data to detect the sensitivity of these wavelet basis functions to the arrival of earthquakes, as shown in Figure 3. The total duration of this signal was 40 s, and the seismic signal arrived at about 20 s.
The signal was sampled at 40 Hz, and six-layer wavelet decomposition was performed; then, we acquired C D 6 , the detail coefficient of the sixth scale, whose frequency band just included the main energy distribution frequency band of seismic signal. Waveforms of C D 6 are shown in Figure 4.
Figure 4 shows the waveform diagram of the sixth layer detail coefficient under different wavelet basis functions, and the red box indicates that these coefficients detected the sudden change when the low-frequency seismic signal arrived. By observing the waveform plots above, it can be found that several wavelets have different abilities to detect sudden changes in seismic P–wave signal. The Haar wavelet is less sensitive to seismic P–wave signals and cannot accurately label mutant coordinates. The bior2.6 wavelet and coif3 wavelet can detect the seismic signal quickly at its first arrival and show a more obvious sudden change in the amplitude of the C D 6 waveform, which can meet the observation needs of seismic P–wave signals. In contrast, the first abrupt change of sym3 and db4 at the arrival of seismic signal is not as obvious as that of coif3 and bior2.6, but it can also accurately locate the arrival time. However, after the arrival of the seismic signal, the signal frequency is no longer abrupt, but the C D 6 waveforms of these four wavelet basis functions have different oscillation performance. We used their normalized mean square error based on the modulus maximum to express their ability to converge after the abrupt change, as shown in the following formulas:
Y i = X i M
Y ^ = 1 N i = 1 N Y i
M S E = 1 N i = 1 N ( Y i Y ^ ) 2
where M is the maximum modulus of C D 6 waveform oscillation when the seismic signal arrives, X i is the data points after this time, there are N points in total. Normalizing these points based on M to obtain Y i , Y ^ is the average value of Y i , and MSE is the mean square error of Y i .
After calculation, the MSE of sym3 and coif3 was the largest, bior2.6 was the smallest, and db4 was between them; thus, the convergence of bior2.6 is better, and was selected as the wavelet base function of seismic signals in this paper. At the same time, both coif3 and bior2.6 could realize strong sensitivity to the sudden change in seismic signal, but bior2.6 had fewer filter coefficients, which is convenient for reducing the amount of calculation. The bio2.6 wavelet exhibited regularity, tight support, and biorthogonality, and the two dual wavelets were responsible for the decomposition and reconstruction of the signal, taking into account the linear phase and orthogonality, and at the same time making a good compromise between the calculation amount and the filtering performance of the wavelet [21].

4. Data Processing

4.1. Pre-Detection

When a seismograph works normally, in order to prolong the working time of the battery, only one main, low-power control chip is usually allowed to work first. This chip is responsible for the motion control, data acquisition and storage of the seismograph, and can preprocess the data. However, the chip has a slow operation speed and cannot complete the complex operation of large capacity data. It can only run some simple algorithms to pre-detect seismic signals.
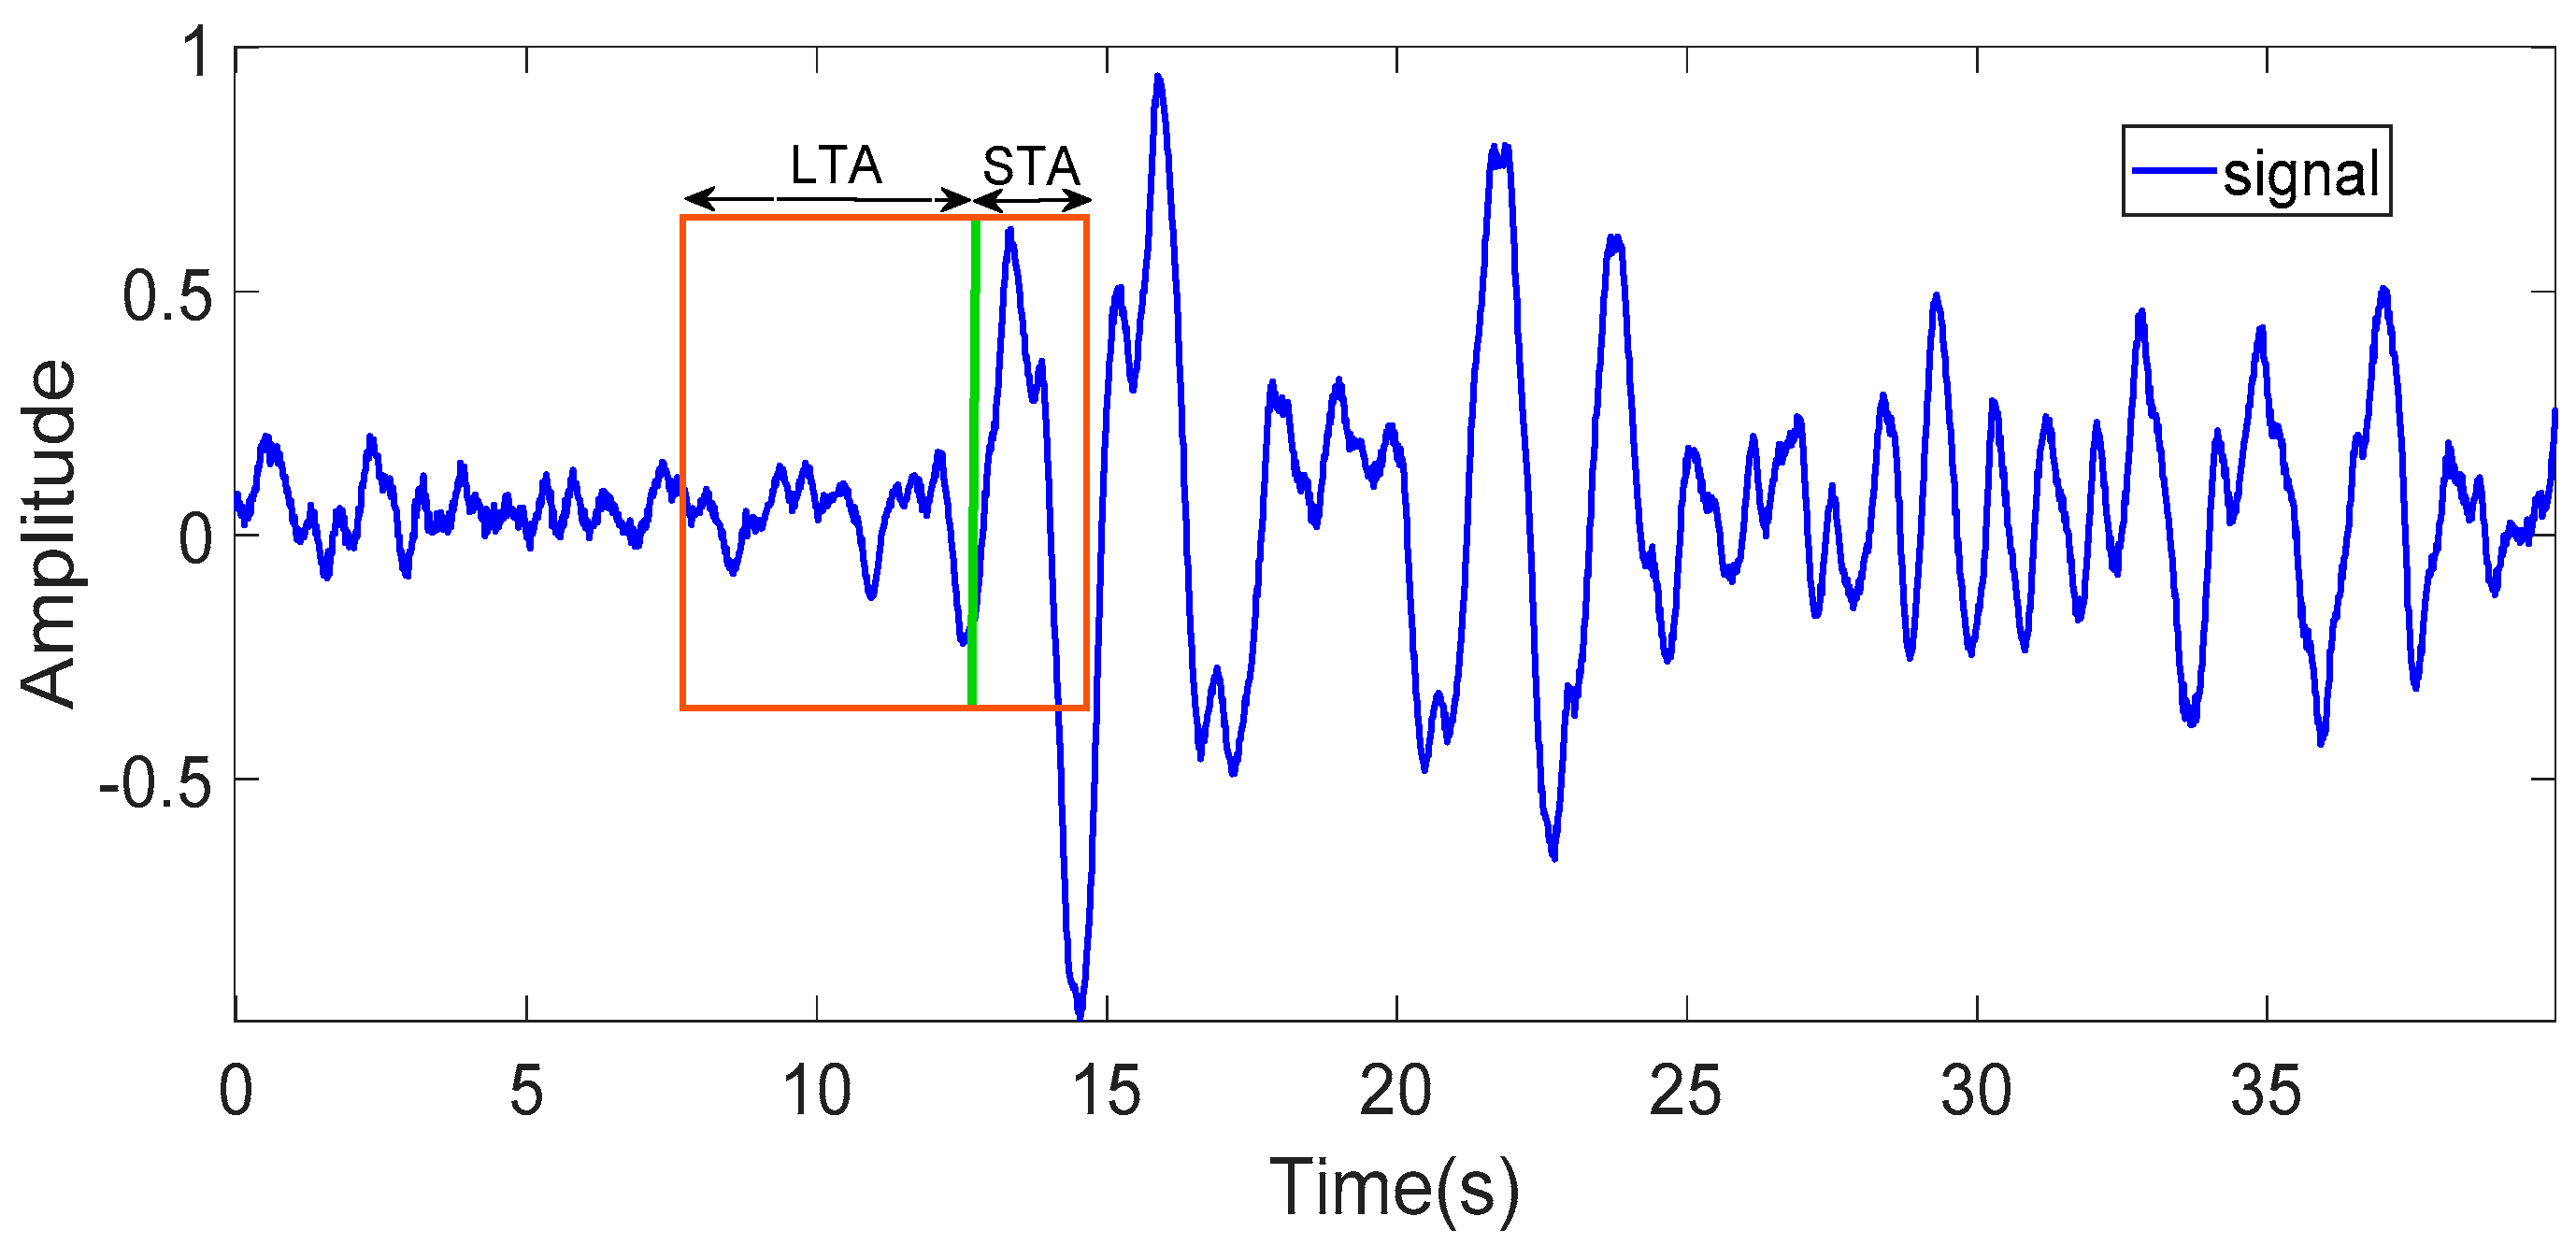
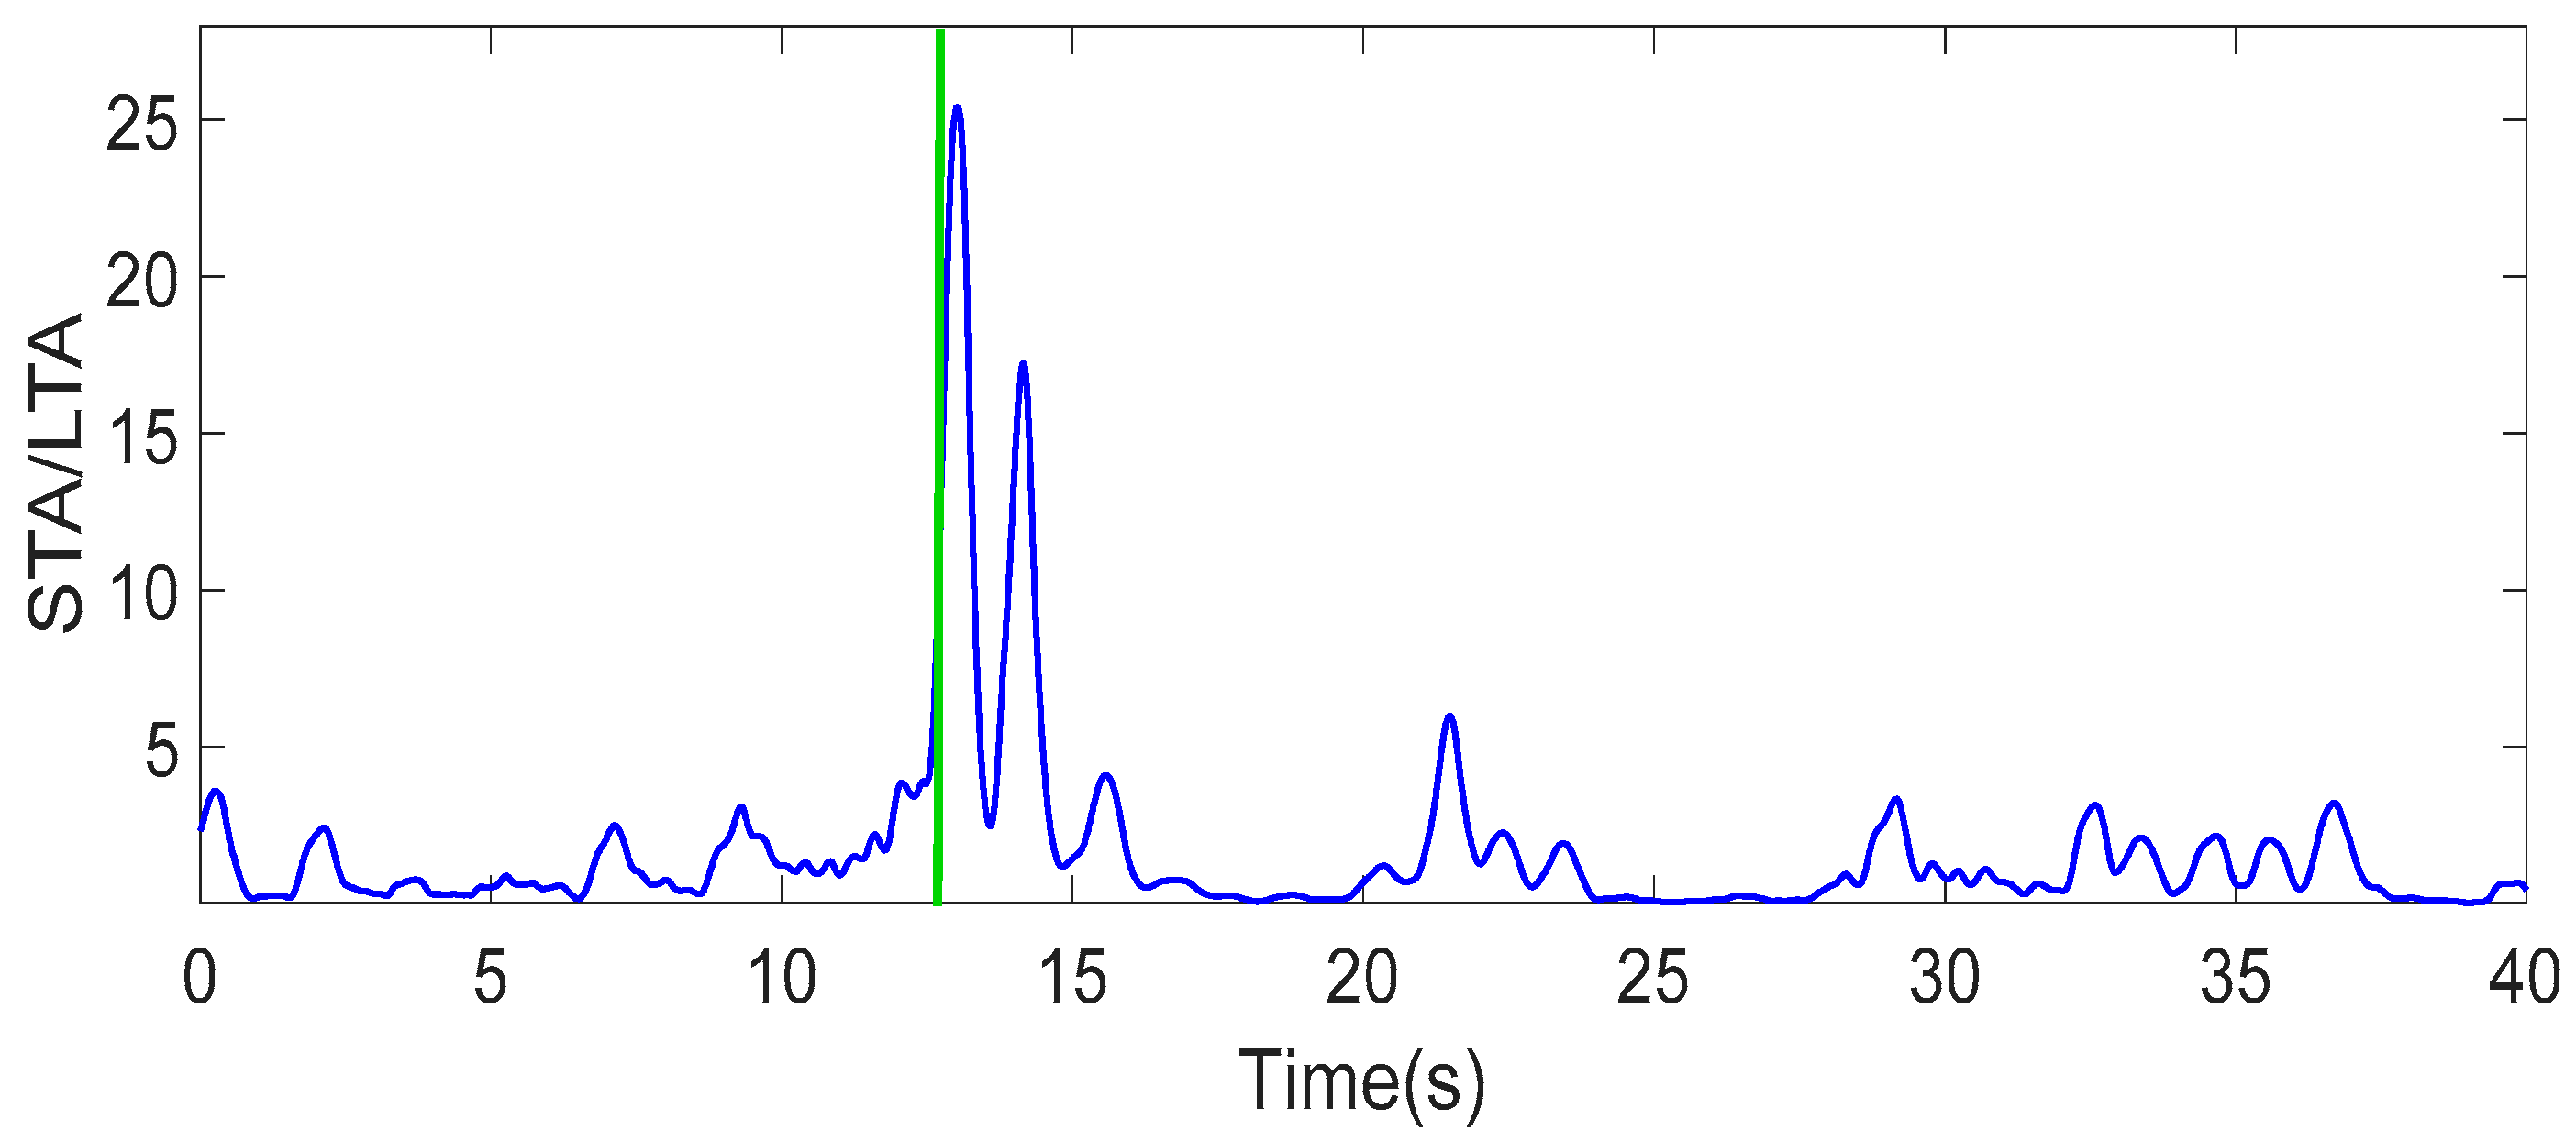
The pre-detection algorithm used in this study was the STA/LTA algorithm, which is a simple and effective algorithm, suitable for running on low-power control chips. The STA/LTA algorithm reflects the characteristic changes in seismic signal amplitude and frequency by calculating the signal ratio of STA and LTA. STA (short-time average) mainly reflects the average value of seismic signal, and LTA (long-time average) mainly reflects the average value of background noise. When the seismic signal arrives, the ratio of STA/LTA will suddenly change. When the ratio R is greater than a set threshold, it is determined as a seismic signal.
For the collected data, at a certain time, there are N data points in the short-time window, expressed as X(N), and M data points in the long-time window, expressed as Y(M); thus, the formulas of the STA/LTA algorithm are as follows:
S T A = 1 N k = 1 N ( X k ) 2
L T A = 1 M k = 1 M ( Y k ) 2
R = S T A L T A     μ
where X k represents the data in the short time window, Y k represents the data in the long-time window, and μ is the preset trigger threshold; when the ratio R is greater than μ , the signal in the short time window is judged as the seismic signal, and the time of the first data point in STA is determined as the arrival time of the earthquake, as shown in Figure 5.

4.2. Wavelet Transformation

After the pre-detection of the first algorithm, the waveform of the suspected seismic wave was found. However, because the first algorithm is relatively simple and rough, it can easily be disturbed by other noises, such as ships, air guns, etc., resulting in incorrect judgments. Therefore, we used a DSP chip with better computing performance but higher power to detect the suspected waveform by wavelet algorithm to determine whether it was a seismic wave.
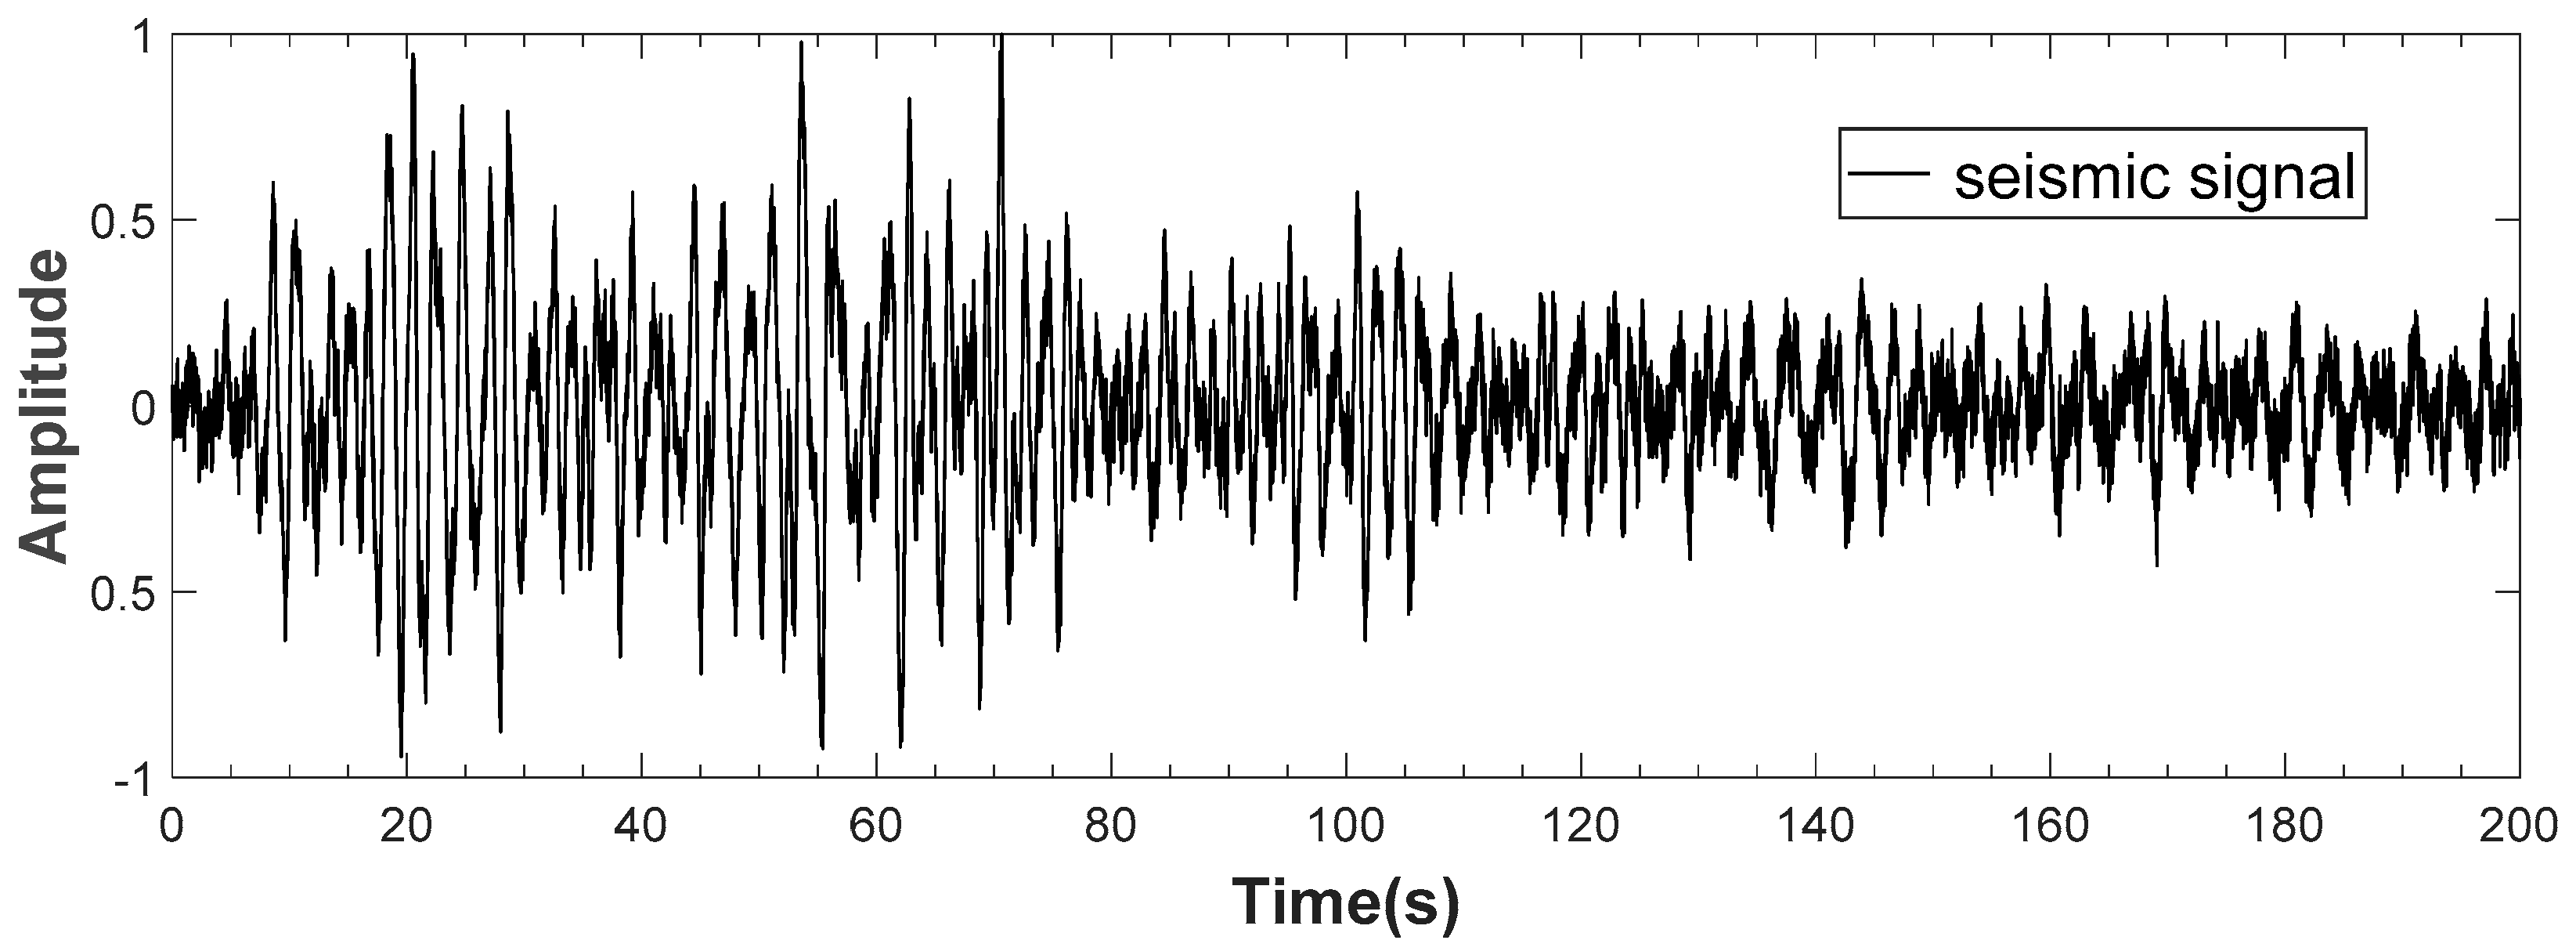
Starting from the arrival time of STA/LTA algorithm, we selected 200 s of signal data. This signal was normalized based on the maximum modulus, and the vertical axis represents the relative amplitude. Figure 6 shows that the signal strength reached its peak in the previous small period, where the energy was more concentrated, and then slowly decayed until the end. From the previous analysis and calculation, we selected the bior2.6 wavelet and performed decomposition of the observation signal under N = 8 layers.
Using the bio2.6 wavelet and wavedec function in the MATLAB environment, wavelet decomposition of the suspected seismic signal containing noise was performed under N = 8 layers; then, the corresponding coefficients were obtained. The wavelet coefficient C of each layer can be divided into two parts, where the approximate coefficient C A corresponds to the low-frequency part of the signal, whereas the detail coefficient C D corresponds to the high frequency range.
In order to remove noise from the suspected seismic signal, thresholds of each layer need to be set to process the wavelet coefficients. This paper proposes a method of setting each layer separately and combining the soft and hard thresholds. For layer 1, the detail coefficient C D 1 represents the high-frequency noise interference, and for layer 8, the approximate coefficient C A 8 represents the baseline drift of the low-frequency hydrophone, which is set directly to zero to eliminate all interference. Additionally, for other coefficients, the following soft threshold function is used:
C j ( n ) = { C j ( n ) λ × Max C j ( n ) λ × Max 0 λ × Max < C j ( n ) < λ × Max C j ( n ) + λ × Max C j ( n ) λ × Max
where C j ( n ) represents the wavelet coefficient at the j scale, containing the approximate coefficient C A and the detail coefficient C D , Max represents the maximum absolute value of the wavelet coefficient at this scale, and λ represents an adjustable relative coefficient that differs for different wavelet coefficients.
Other simple threshold functions only consider the mathematical characteristics of the waveform to be processed, making them more concise, and the selection of threshold λ is often uniform for wavelet coefficients of all scales. The threshold function proposed in this paper not only considers the mathematical characteristics of the waveform, but also considers its physical significance. According to the distribution law of noise signal, different thresholds λ are selected for the wavelet coefficients of different scales. In the higher frequency band, i.e., in the lower scale, there are more noise distributions; thus, a large threshold λ is selected to filter out most of the noise signals. With the increase in the scale, the frequency band continues to decline, as does the distribution of noise; then, the threshold λ is also gradually reduced. Through such threshold processing, the waveform becomes concise, and the noise signal is well filtered out.
The reconstructed signal removes noise and baseline drift, reinforcing the characteristics of the seismic signal, which can be used to analyze and accurately identify natural seismic P–wave signals.

4.3. Power Calculation

The denoised reconstructed suspected seismic signal had a frequency range of 0.1~12.5 Hz. Then, a six-layer wavelet transform based on the binary spline was carried out, and its waveforms at each layer were obtained. Table 2 shows the layers of these waveforms and their corresponding frequency ranges; each layer is also called a scale. Ideally, the energy of the seismic P–wave signal should be concentrated on the fourth, fifth, and sixth scales.
For signal power calculation and processing, Sukhovich et al. [13] proposed an amplitude-based second normalization method. This method is fast and convenient, and at the same time, it highlights the relationship between the effective signal and the noise signal, reduce the interference of the irrelevant factors, and makes it easy to compare the power characteristics of different signals.
To compare the energy of the signal at each scale, the power at the corresponding scale needs to be calculated, which can be estimated by calculating the average of the squares of the wavelet coefficients of that scale:
p k = 1 N k i = 1 N k ( C i k ) 2
where k is the scale serial number, i is the time sequence number, p k represents the signal power at the kth scale, N k is the total number of wavelet coefficients at the kth scale, and C i k is the ith wavelet coefficient at the kth scale.
The power of the signal was summed at each scale; then, the total power P was obtained:
P = k = 1 N p k
where N is the total scale of the signal, N = 6 in this paper. To inhibit the influence caused by signal strength, distance, and other irrelevant factors, when performing the wavelet analysis of different signals, the absolute power of the signal at each scale was not used here. Instead, the signals were normalized based on their total power; thus, the relative power of each scale is obtained:
p k ˜ = p k P
At the same time, the same processing was carried out for the noise signal before the arrival of the suspected seismic P–wave, and the relative power of the noise signal at each scale was obtained. Thereby, the relative power of the signal was normalized for the second time to obtain the standard value of the signal power at each scale:
P k = p k ˜ n k ˜
where P k represents the ratio of signal power to noise at a certain scale: a larger P k means a relatively larger signal power, and the energy is more concentrated at this scale. Ideally, the energy of the seismic P–wave signal should be concentrated in the low-frequency portion, i.e., at the higher scales.

5. Validation and Analysis

5.1. Data Sources

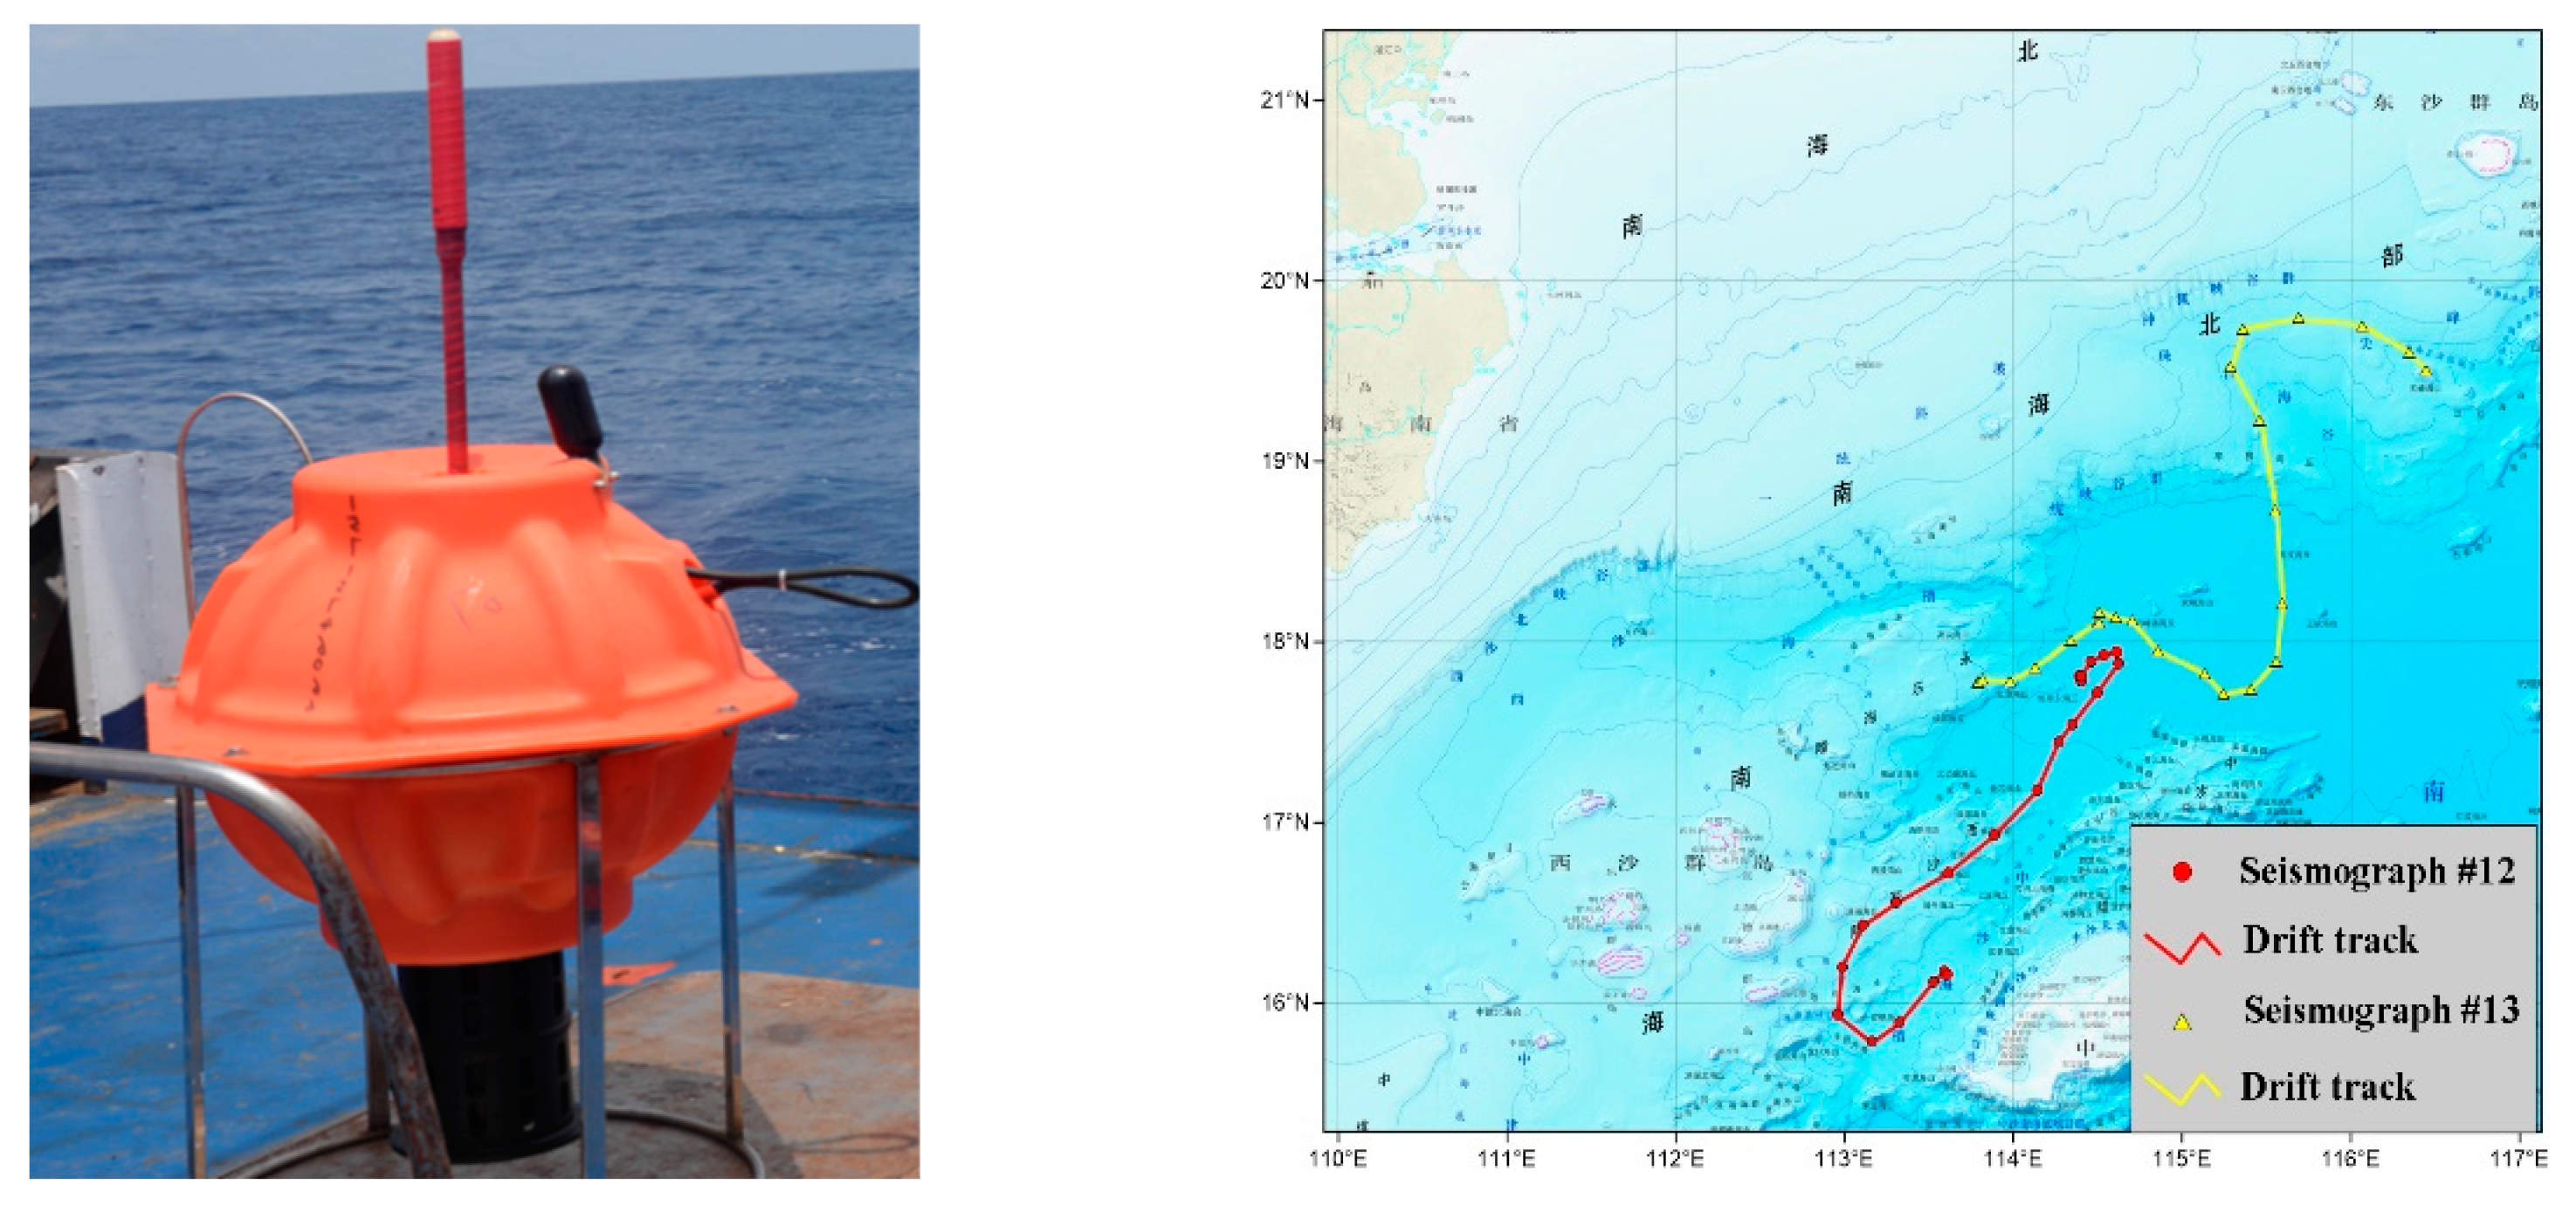
In this study, the data were recorded by the Dolphin seismometer released by The Second Institute of Oceanography, Ministry of Natural Resources of China. On 25 April 2021, two Dolphin seismometers, No. 12 and No. 13, were dropped into the South China Sea at (16° N, 113° E) and (19° N, 116° E), respectively. The two Dolphin seismometers and their travel paths are shown in Figure 7. During the experiment, the two Dolphin seismometers operated safely for 95 days, obtained a total of 44 profiles, detected 29 earthquakes of magnitude 6 or above, traveled 532 nautical miles, and collected 2.2 GB of raw acoustic data.

5.2. Result

The original acoustic data obtained by the Dolphin seismometer were processed on the host computer, and the fragments of suspected natural seismic P–wave signals were preliminarily screened out by executing the STA/LTA algorithm. In this study, a suspected seismic P–wave signal waveform with a duration of 200s, a sampling frequency of 50 Hz, and a total of 10,000 data points was intercepted. The start time of this section was 22 May 2021 02:09:17, when the coordinates of the No. 12 Dolphin seismometer were (17.86° N, 115.04° E).
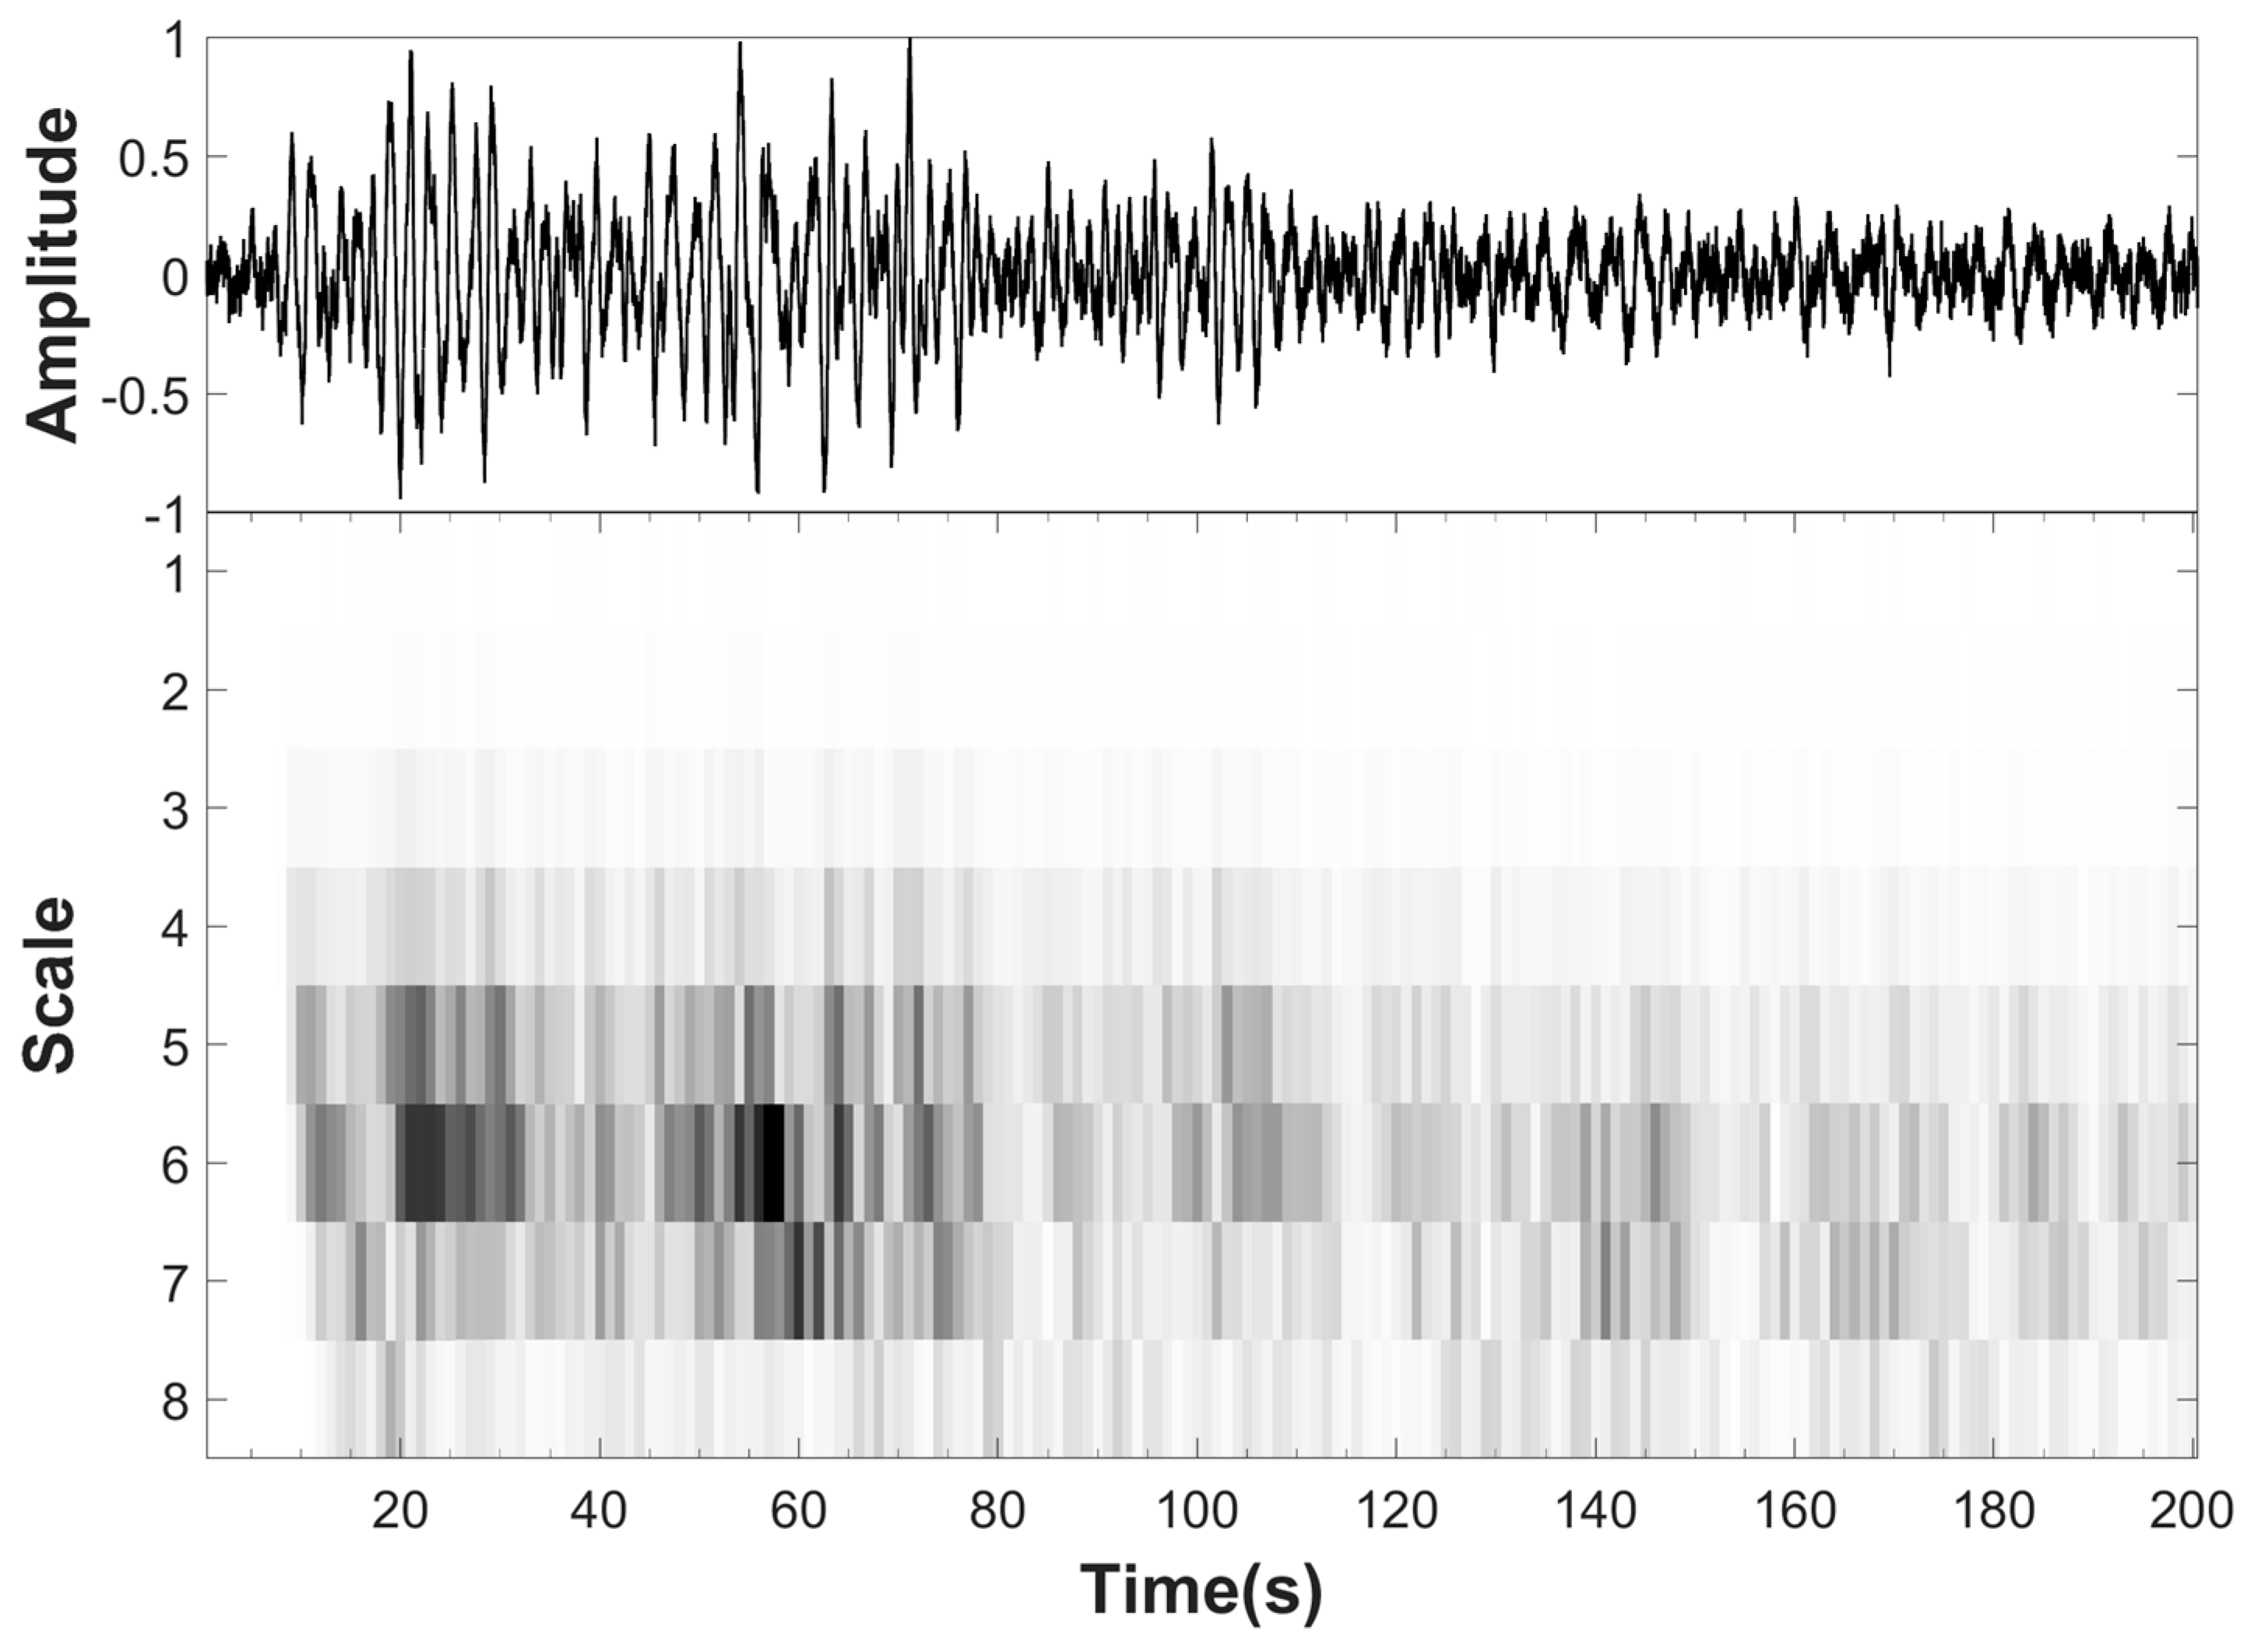
The wavelet coefficients of each scale of the suspected seismic signal were obtained by eight-layer wavelet decomposition of the suspected seismic signal; then, the energy variation with time at each scale was calculated. As shown in Figure 8, the upper half is the suspected seismic signal waveform, and the lower is the grayscale map of energy at various scales. The stronger the energy at a given moment, the darker the pigment color. It can be seen that the first and second scale grayscale maps are almost all white, indicating that little energy was contained. Nevertheless, the maps at the fifth to seventh scales are much darker, indicating a large amount of energy distribution. The frequency range contained in these scales is 0.2~1.6 Hz, which coincides with the frequency distribution map of the seismic signal in Figure 2.
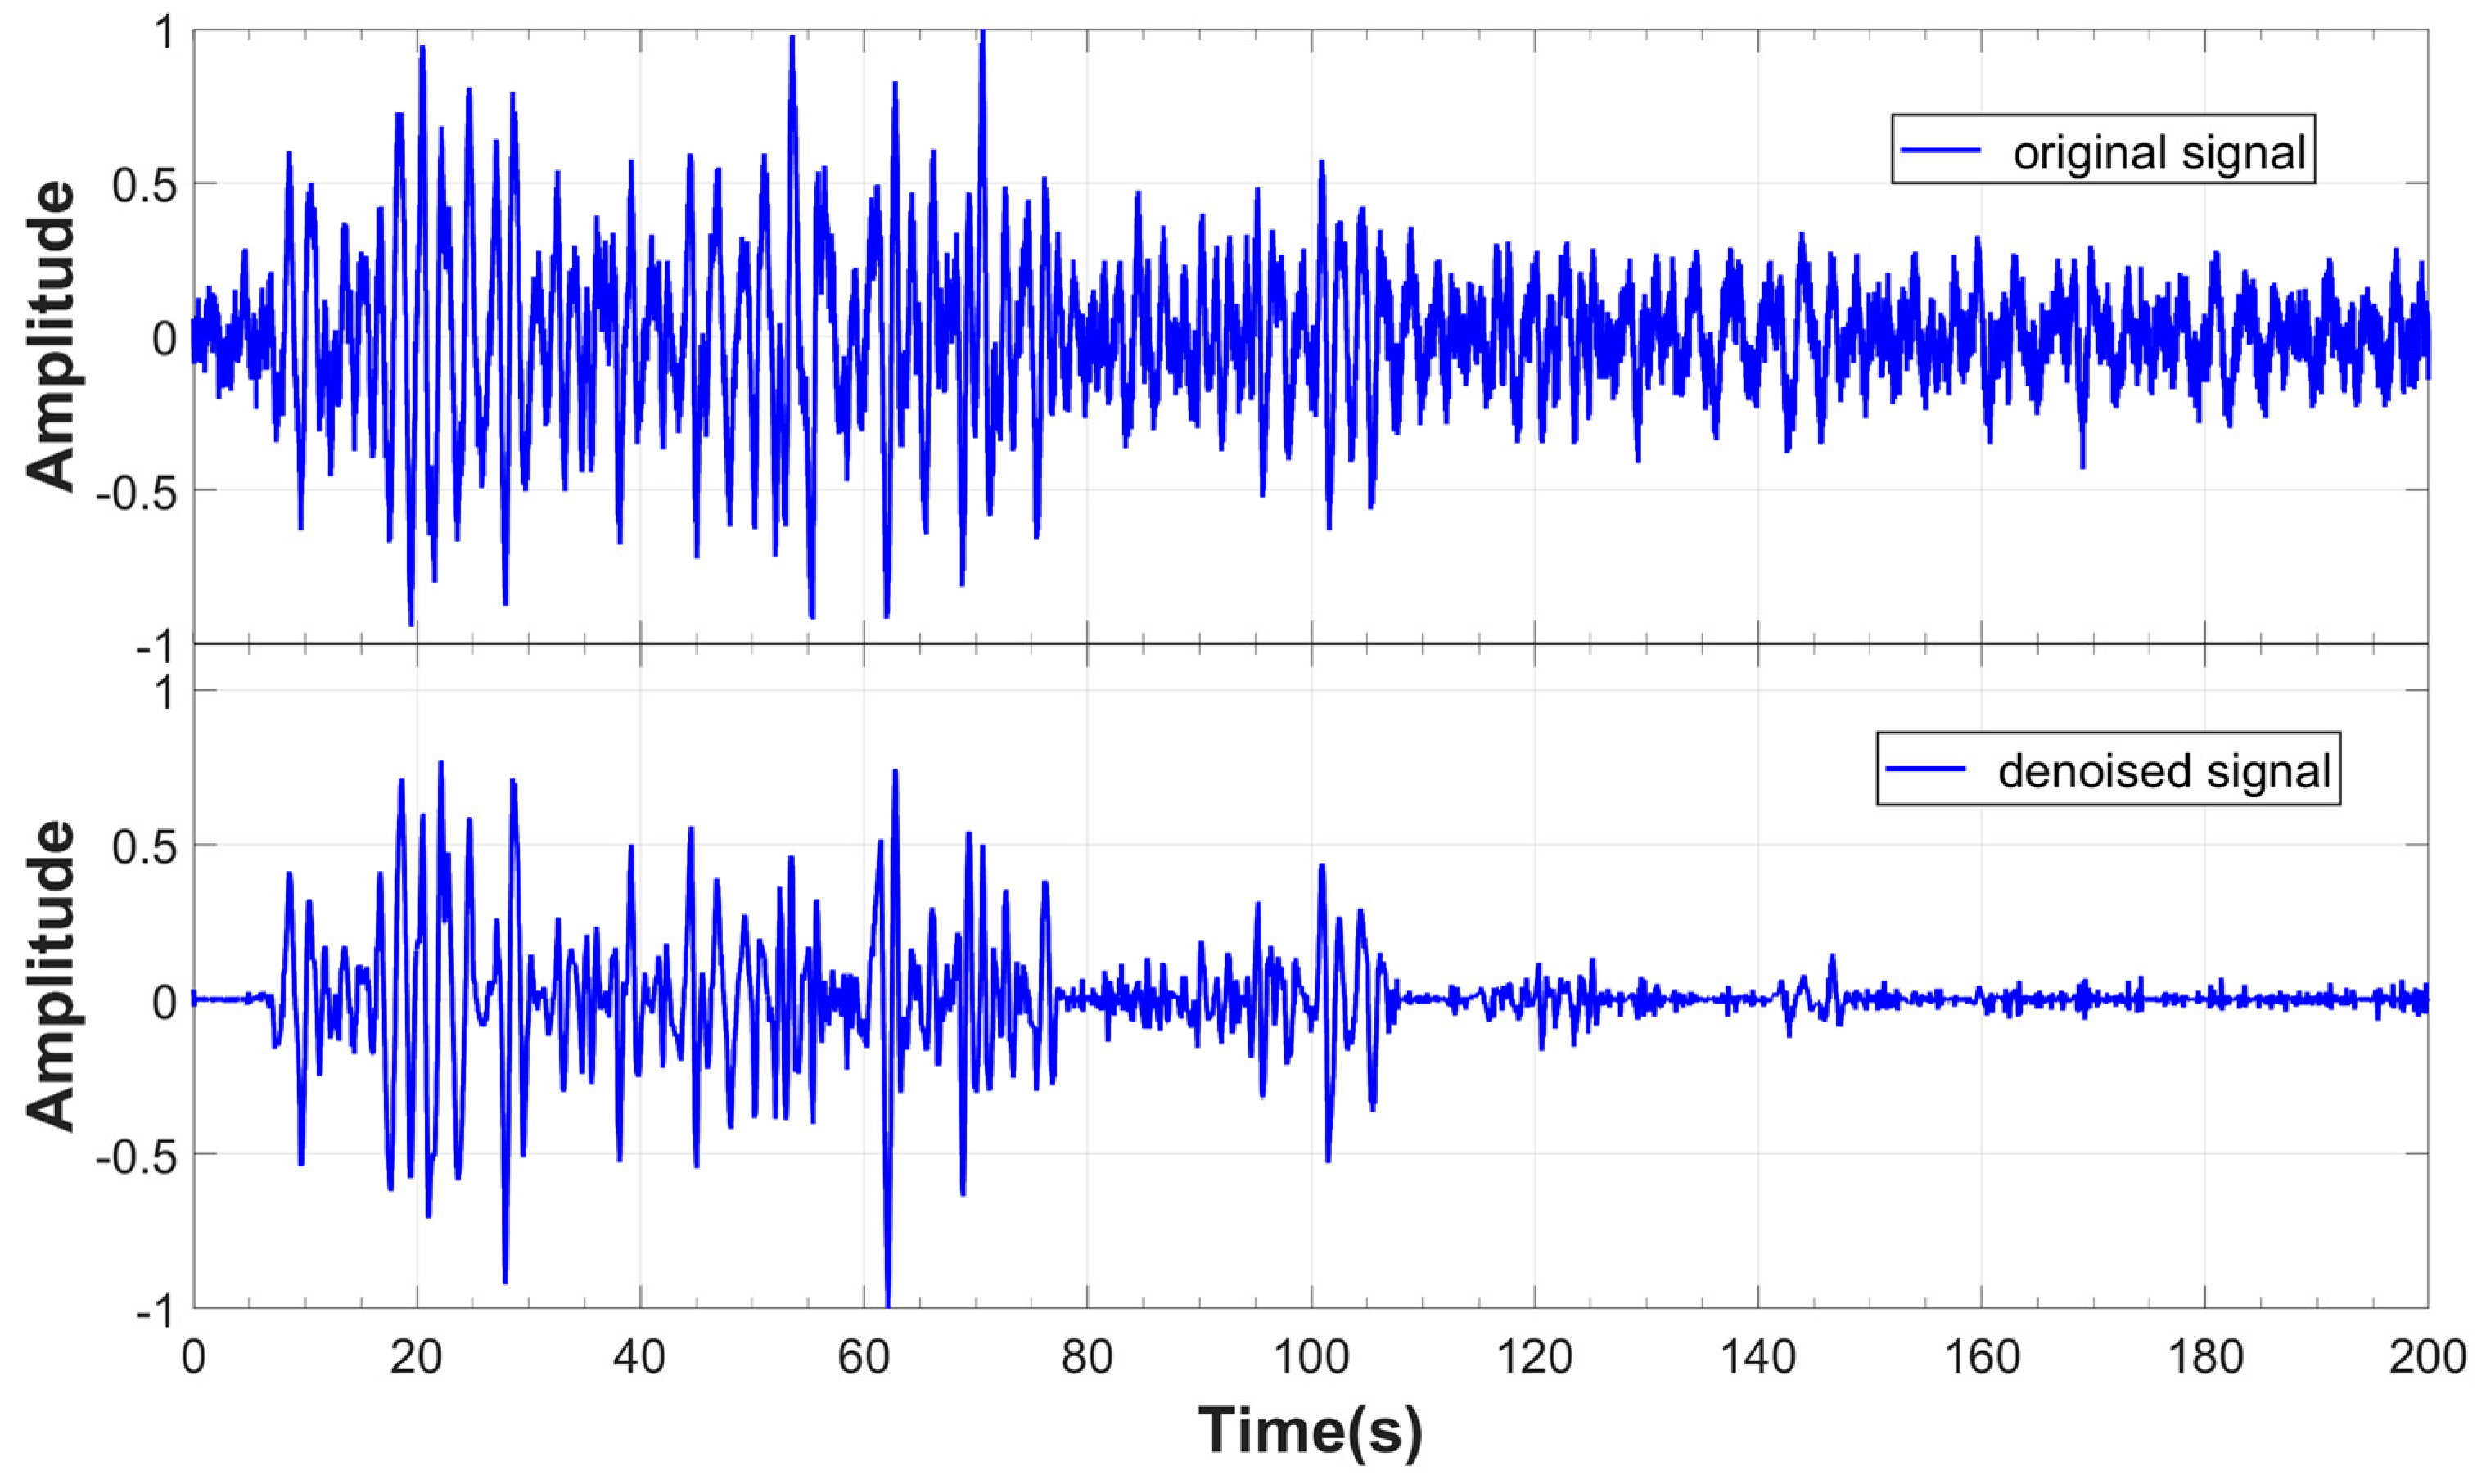
Threshold processing was performed on the wavelet coefficient of each layer; then, wavelet reconstruction of the waveform was carried out to obtain the denoised suspected seismic signal, as shown in Figure 9.
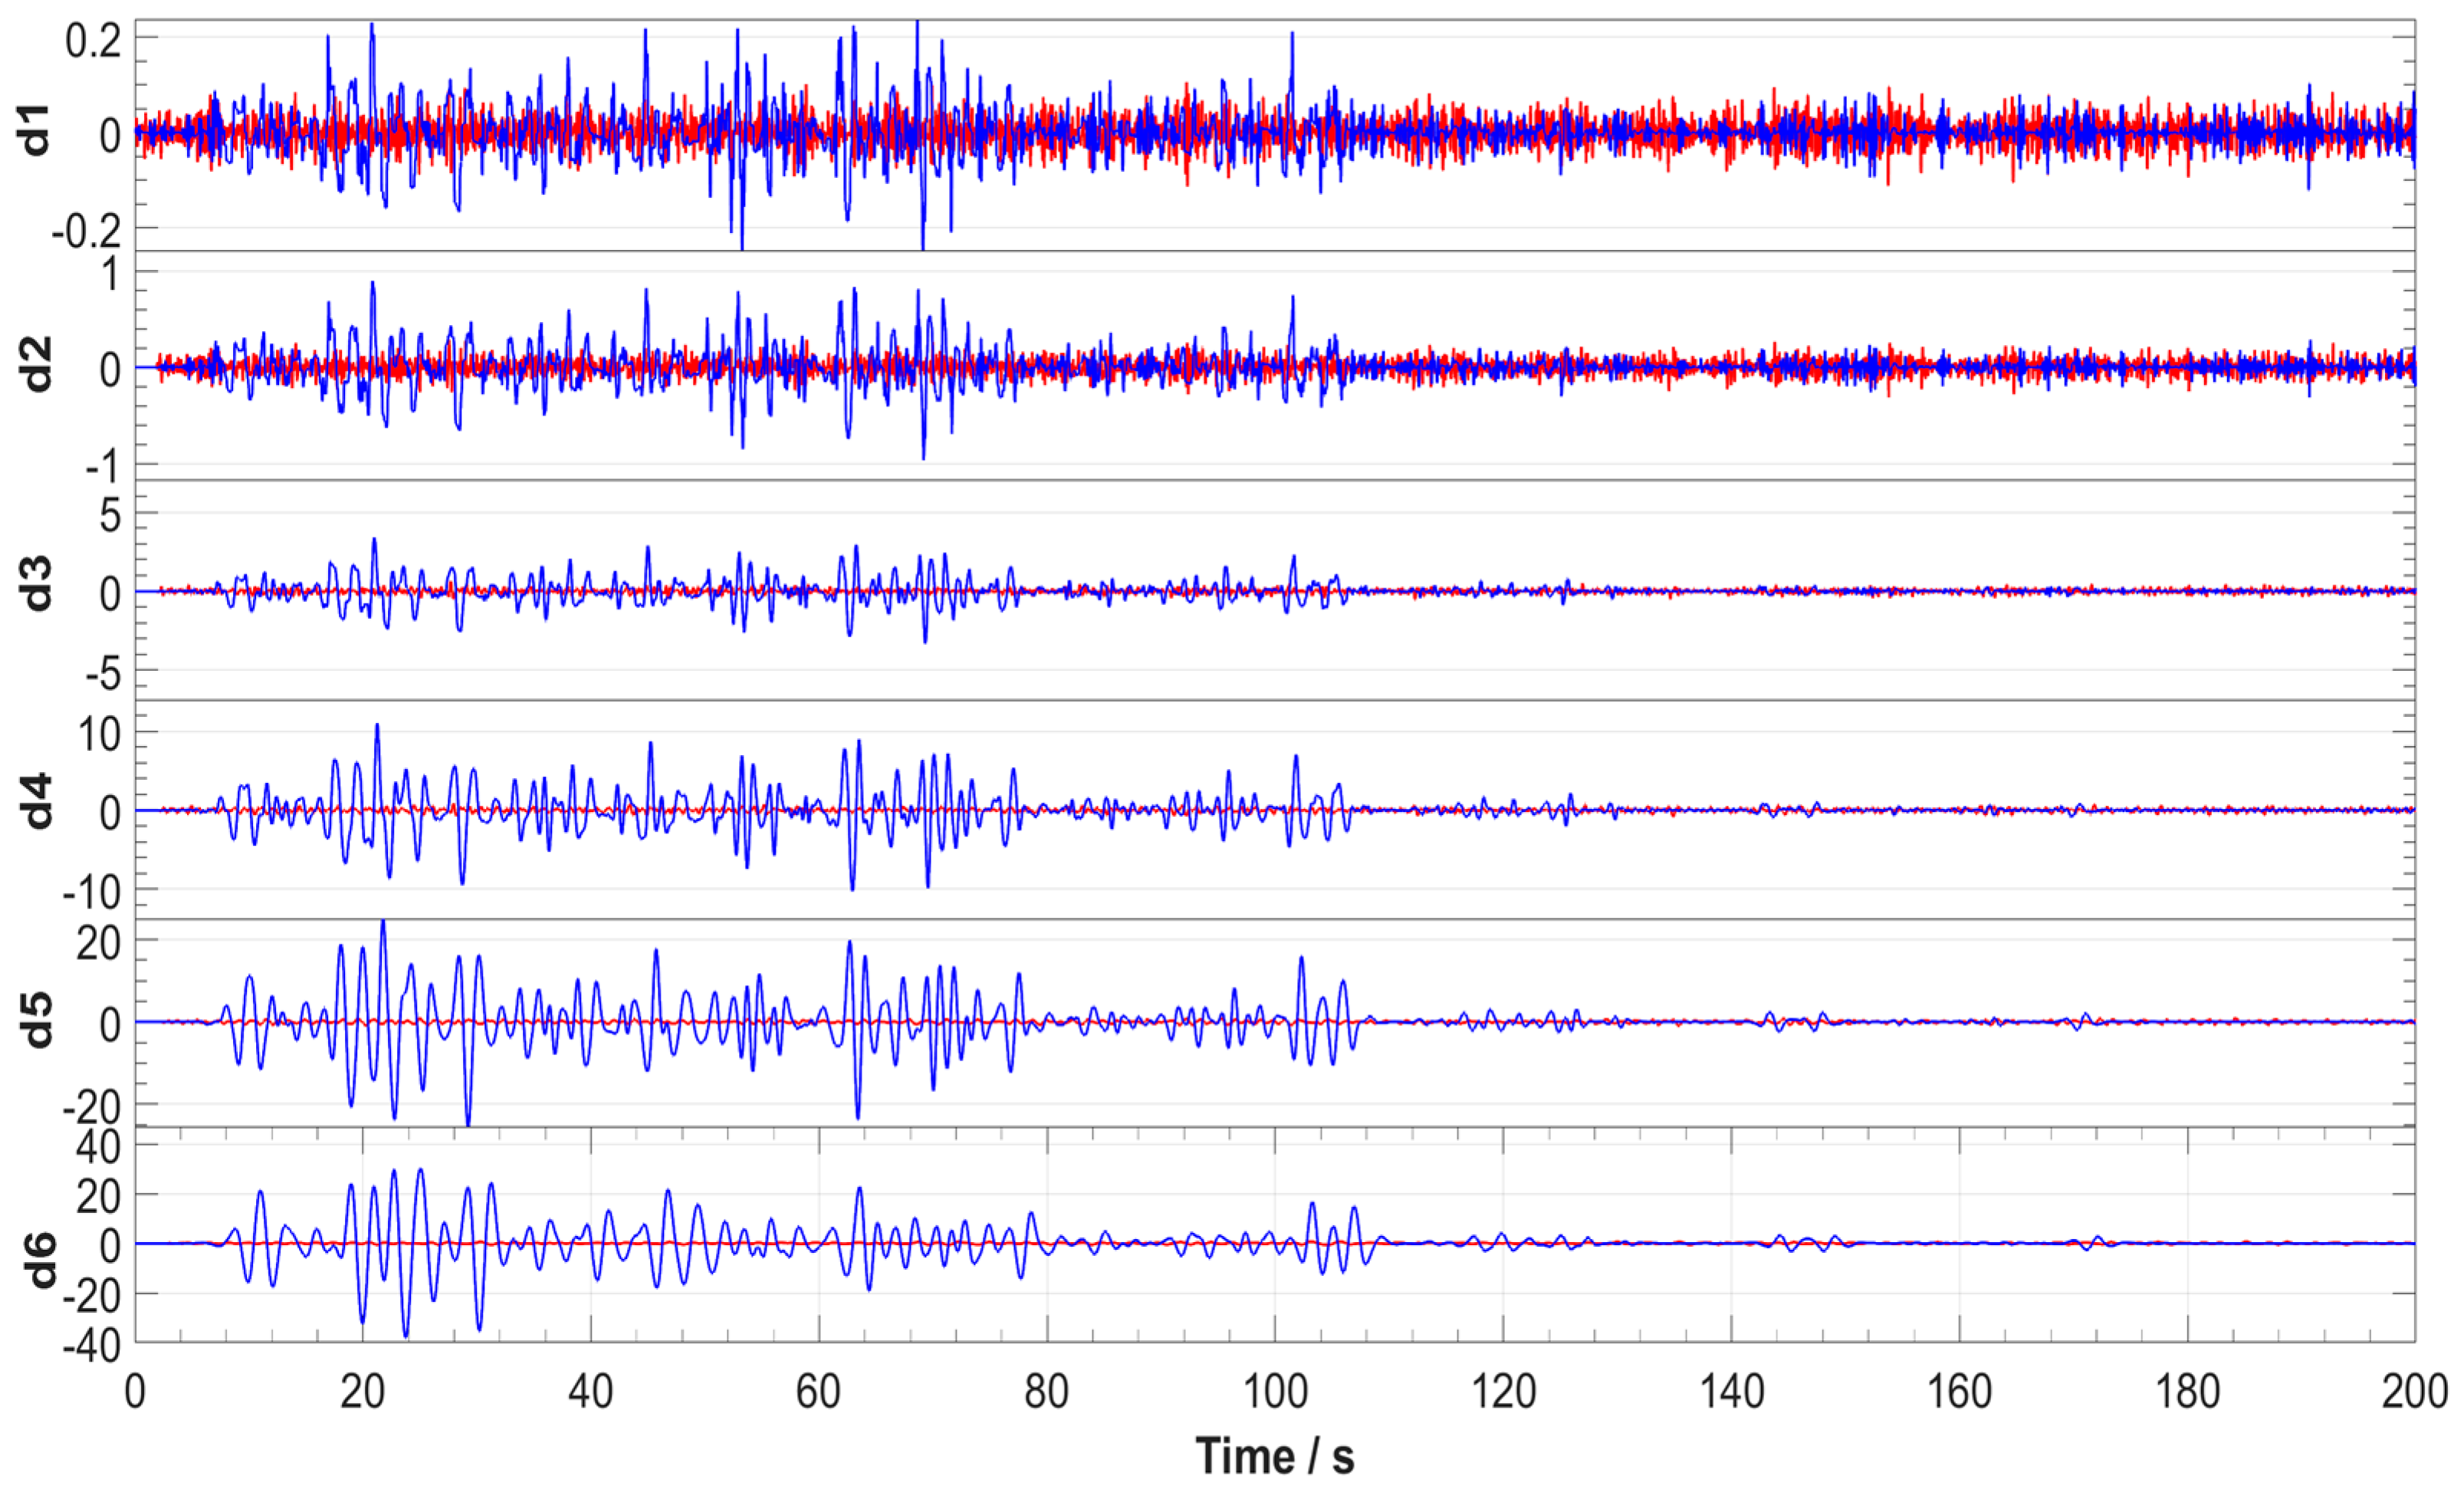
A piece of the background noise signal was intercepted before the arrival of the suspected seismic, and the same processing was performed, including wavelet decomposition, threshold denoising, reconstruction, and calculations of power at various scales. For these two segments of denoised reconstructed signals, their waveforms were plotted at each scale, as shown in Figure 10. The red line is the background noise signal waveform, the blue line is the suspected seismic signal waveform, the abscissa coordinate represents the number of points of the signal, and the vertical coordinate indicates the amplitude of the waveform. The amplitude of the background noise signal waveform of each scale was between only 0.1 and 0.5, and the energy distribution was relatively uniform. The amplitude of the suspected seismic signal increased from 0.2 at a scale of 1 to 40 at a scale of 6; this trend indicates that the low-frequency fraction aggregates the vast majority of energy, which is the same as the energy distribution of the seismic signal.
The wavelet coefficients and power of each scale of these two signals were calculated, and they were normalized to obtain the standard value of the seismic signal power at each scale, which is called signal power. The change curve is plotted in Figure 11. Before that, the identified seismic signals in the database were processed in the same way, and the power standard values of these signals at different scales were calculated to obtain a probability model called average power, which is also depicted in Figure 11. The average power is drawn in the form of a candle diagram. The solid part is the middle 50% of the standard value of the scale power. The upper vertical line represents the larger 20%, and the lower vertical line represents the smaller 20%. For the values that were too large or too small at both ends of the statistical power standard value, we removed 5% each to avoid the influence of special values. Finally, a line chart passing through the median of the power standard value was used to connect the candle chart, so as to show the changing trend of the average power with the scale.
As can be seen in Figure 11, the power of the suspected seismic signal increased with the scale and was mainly concentrated in the fourth, fifth, and sixth scales. The frequency range was 0.3~1.7 Hz, and the power distribution is in line with the statistical model of seismic P–waves. In the experiment performed by Sukhovich et al. [13], the hydrophone sampling frequency was 40Hz, and the power of the seismic P–wave signal was mainly distributed in the frequency domain range of 0.3–1.25 Hz, which is consistent with the range calculated in this paper. At the same time, this study analyzed the signals observed by the No. 13 Dolphin seismometer in the same time period, and the same conclusion was obtained, as shown in Figure 12.
By querying the records of the seismic station network, on 22 May 2021, at 02:04:11, it was shown that an earthquake with a depth of 17 km and a magnitude of 7.4 occurred in Maduo County, Guoluo Prefecture, Qinghai Province, China, with coordinates of (34.59° N, 98.34° E). The straight-line distance on the surface between the site and the No.12 Dolphin seismometer was 2492.235 km, and the time difference was 5:06. Thus, the average transmission speed was calculated to be 8145 m/s. Considering that the actual transmission distance of seismic signals in the crust is shorter than that on the surface, it can be considered that this speed conforms to the transmission speed of a seismic P–wave.
Several remote ocean seismometers have monitored similar signals in real time. Through wavelet analysis, it was found that these signals were consistent with the characteristics of seismic P–waves. At the same time, by querying the data of the seismic network and using the plate tectonic model software to simulate and calculate the time when these seismic waves arrived at the corresponding marine seismograph, we could find qualified seismic events. When the data of multiple marine seismometers and seismic stations were mutually confirmed, it can be judged that the signal detected is a seismic P–wave.
Using the same method, this study also identified a magnitude 5.9 earthquake signal that occurred at a depth of 20 km in the Maluku Sea on 3 June 2021, at 18:09:57. By analyzing the hydrophone data of the two Dolphin seismometers and querying the relevant seismic records of the seismic network, the wavelet analysis method was verified, and the experimental discovery recognition rate was high, which proved that the wavelet analysis method can indeed be used for the identification of natural seismic P–wave signals.

6. Conclusions

Here, we studied the identification of natural seismic P–wave signals. Using the wavelet analysis method to calculate and process the coefficients of seismic P–wave signals, we obtained a statistical model of the power distribution of seismic P–wave signals so as to realize the rapid and accurate identification of seismic P–wave signals. In this paper, the data observed by the Dolphin seismometer were verified, and the natural seismic P–wave signal was successfully identified, which proved the feasibility of the wavelet analysis method.
This study analyzed and verified the observed seismic data, but the simulation experiments were only carried out in the MATLAB environment. In a follow-up study, we will research the hardware part of the mobile marine seismometer and build a control system built based on the ARM + DSP dual-core structure. Then, we ran the identification algorithm in the control chip of the mobile marine seismometer and monitored the seismic P–wave signal on the lake and in the sea in order to test the actual effect of the identification algorithm and continually improve the algorithm.

Author Contributions

Conceptualization, W.J. and X.Z.; methodology, W.J.; software, W.J. and F.H.; validation, W.J. and F.H.; formal analysis, W.J.; investigation, W.D. and X.Z.; resources, W.D., X.Z. and F.H.; data curation, X.Z. and F.H.; writing—original draft preparation, W.J.; writing—review and editing, W.D., X.Z., and F.H.; visualization, W.J.; supervision, W.D. and X.Z.; project administration, W.D. and X.Z.; funding acquisition, W.D. and X.Z. All authors have read and agreed to the published version of the manuscript.

Funding

The research was carried out by the support of National Key R&D Program of China (No. 2021YFC3101401), Key R&D Program of Zhejiang Province (No. 2021C03186), Oceanic Interdisciplinary Program of Shanghai Jiao Tong University and the Scientific Research Fund of Second Institute of Oceanography (No. SL2103), and State Oceanic Administration Program on Global Change and Air–sea Interaction (No. GASI-02-SHB-15).

Institutional Review Board Statement

Not applicable.

Informed Consent Statement

Not applicable.

Data Availability Statement

Not applicable.

Acknowledgments

The authors would like to thank the editors and reviewers for their many constructive suggestions and comments that helped improve the quality of the paper.

Conflicts of Interest

The authors declare no conflict of interest.

References

  1. Sukhovich, A.; Bonnieux, S.; Hello, Y.; Irisson, J.-O.; Simons, F.J.; Nolet, G. Seismic monitoring in the oceans by autonomous floats. Nat. Commun. 2015, 6, 8027. [Google Scholar] [CrossRef] [PubMed] [Green Version]
  2. Nolet, G.; Hello, Y.; van Der Lee, S.; Bonnieux, S.; Ruiz, M.C.; Pazmino, N.A.; Deschamps, A.; Regnier, M.M.; Font, Y.; Chen, Y.J.; et al. Imaging the Galapagos mantle plume with an unconventional application of floating seismometers. Sci. Rep. 2019, 9, 1326. [Google Scholar] [CrossRef] [PubMed] [Green Version]
  3. Simons, F.J.; Nolet, G.; Georgief, P.; Babcock, J.M.; Regier, L.A.; Davis, R.E. On the potential of recording earthquakes for global seismic tomography by low-cost autonomous instruments in the oceans. J. Geophys. Res. 2009, 114, B5307. [Google Scholar] [CrossRef] [Green Version]
  4. Ding, W.; Huang, H.; Zhu, X.; Sun, G.; Niu, X. New mobile oceanic seismic recording system and its application in marine seismic exploration. Prog. Geophys. 2019, 34, 292–296. [Google Scholar]
  5. Stevenson, P.R. Microearthquakes at Flathead Lake, Montana: A Study using automatic earthquake processing. Bull. Seism. Soc. Am. 1976, 66, 61–80. [Google Scholar] [CrossRef]
  6. Murat, M.E.; Rudman, A.J. Automated first arrival picking: A neural network approach. Geophys. Prospect. 1992, 40, 587–604. [Google Scholar] [CrossRef]
  7. Leonard, M. Comparison of manual and automatic onset time picking. Bull. Seism. Soc. Am. 2000, 90, 1384–1390. [Google Scholar] [CrossRef]
  8. Anant, K.S.; Dowla, F.U. Wavelet transform method for phase identification in three-component seismograms. Bull. Seism. Soc. Am. 1997, 87, 1598–1612. [Google Scholar] [CrossRef]
  9. Bai, C.; Kennett, B.L.N. Phase identification and attribute analysis of broadband seismograms at far-regional distances. J. Seismol. 2001, 5, 217–231. [Google Scholar] [CrossRef]
  10. Wang, C.; Bai, C.; Wang, X. Review of automatic onset time picking for seismic arrivals. Prog. Geophys. 2013, 28, 2363–2375. [Google Scholar]
  11. Zhao, R.; Song, G. An improved method for white noise reduction based on wavelet transform. J. Xidian Univ. 2000, 5, 619–622. [Google Scholar]
  12. Sweldens, W. The lifting scheme: A custom-design construction of biorthogonal wavelets. Appl. Comput. Harmon. Anal. 1996, 3, 186–200. [Google Scholar] [CrossRef] [Green Version]
  13. Sukhovich, A.; Irisson, J.-O.; Simons, F.J.; Ogé, A.; Hello, Y.M.; Deschamps, A.; Nolet, G. Automatic discrimination of underwater acoustic signals generated by teleseismic P–waves: A probabilistic approach. Geophys. Res. Lett. 2011, 38, L18605. [Google Scholar] [CrossRef] [Green Version]
  14. Grossmann, A.; Morlet, J. Decomposition of Hardy functions into square integrable wavelets of constant shape. SIAM. J. Math. Anal. 1984, 15, 723–736. [Google Scholar] [CrossRef]
  15. Goupillaud, P.; Grossmann, A.; Morlet, J. Cycle-octave and related transforms in seismic signal analysis. Geoexploration 1984, 23, 85–102. [Google Scholar] [CrossRef]
  16. Li, G. Application of wavelet analysis technology in turbine fault diagnosis. Mech. Eng. 2012, 12, 41–42. [Google Scholar]
  17. Chen, S.; Zhu, J.; Meng, Q. Identification of sedimentary cycles using multi-scale wavelet transform based on seismic data. Glob. Geol. 2021, 40, 140–145. [Google Scholar]
  18. Gao, Y.; Wang, H.; You, S.; Feng, L.; He, Y.; Liu, K. A pulsar signal denoising algorithm based on wavelet basis function selection and improved threshold function. Electron. Opt. Control. 2020, 27, 15–19. [Google Scholar]
  19. Zeng, Y.; Wu, Y.; Song, R.; Hu, W. Study on Wavelet De-noising Parameters of Track Vibration Signal for Metro with the Train Traveling on at Low Speed. Noise Vib. Control. 2019, 39, 151–155. [Google Scholar]
  20. Luo, L. Application Research of Wavelet Transform in Deformation Monitoring Data Denoising and Information Extraction. Master’s Thesis, Southwest Jiaotong University, Chengdu, China, 2017. [Google Scholar]
  21. McGuire, J.J.; Simons, F.J.; Collins, J.A. Analysis of seafloor seismograms of the 2003 Tokachi-Oki earthquake sequence for earthquake early warning. Geophys. Res. Lett. 2008, 35, L14310. [Google Scholar] [CrossRef] [Green Version]
Figure 1. Steps of wavelet transform.
Jmse 10 01093 g001
Figure 2. Seismic signal waveform and frequency distribution.
Jmse 10 01093 g002
Figure 3. Seismic signal waveform and its arrival time.
Jmse 10 01093 g003
Figure 4. Waveforms of C D 6 under different wavelet basis functions.
Jmse 10 01093 g004
Figure 5. Signal waveform and STA/LTA waveform diagram.
Jmse 10 01093 g005aJmse 10 01093 g005b
Figure 6. Observed suspected seismic P–wave signal.
Jmse 10 01093 g006
Figure 7. Dolphin seismometers and their travel paths.
Jmse 10 01093 g007
Figure 8. Suspected seismic P–wave signal waveform and its energy distribution.
Jmse 10 01093 g008
Figure 9. Original signal and denoised signal waveform.
Jmse 10 01093 g009
Figure 10. Denoised waveform signal of each scale.
Jmse 10 01093 g010
Figure 11. Standard values of the signal power of each scale.
Jmse 10 01093 g011
Figure 12. Seismic P–wave signal detected by two “Dolphin” seismometers.
Jmse 10 01093 g012
Table 1. Basic properties of some classical wavelets.
Wavelet
Function
HaarDaubechiesBiorthogonalCoifletsSymlets
Wavelet
abbreviation
haardbbiorcoifsym
OrthogonalityYesYesNoYesYes
BiorthogonalityYesYesYesYesYes
Tight supportYesYesYesYesYes
Support length12N-1reconstruction: 2Nr + 16N-12N-1
decomposition: 2Nd + 1
Filter length22NMax (2Nr, 2Nd) + 26N2N
SymmetryYesApproximate symmetryNoApproximate symmetryApproximate symmetry
RegularityNoNoNoNoNo
The order of
the vanishing moment
1NNr-12NN
Table 2. Frequency range of each scale of reconstructed signal.
ScaleFrequency Range
16.3~12.5 Hz
23.2~6.3 Hz
31.7~3.2 Hz
40.9~1.7 Hz
50.5~0.9 Hz
60.3~0.5Hz
Publisher’s Note: MDPI stays neutral with regard to jurisdictional claims in published maps and institutional affiliations.