Article

Subaqueous and Subaerial Beach Changes after Implementation of a Mega Nourishment in Front of a Sea Dike

1
Department of Hydraulic Engineering, Faculty of Civil Engineering and Geosciences, Delft University of Technology, P.O. Box 5048, 2600 GA Delft, The Netherlands
2
Svašek Hydraulics, Kratonkade 23, 3024 ES Rotterdam, The Netherlands
*
Author to whom correspondence should be addressed.
J. Mar. Sci. Eng. 2022, 10(8), 1152; https://doi.org/10.3390/jmse10081152
Submission received: 14 July 2022 / Revised: 12 August 2022 / Accepted: 16 August 2022 / Published: 20 August 2022
(This article belongs to the Special Issue Sediment Dynamics in Artificial Nourishments)

Abstract

:
Sandy nourishments can provide additional sediment to the coastal system to maintain its recreational or safety function under rising sea levels. These nourishments can be implemented at sandy beach systems, but can also be used to reinforce gray coastal infrastructure (e.g., dams, dikes, seawalls). The Hondsbossche Dunes project is a combined shoreface, beach, and dune nourishment of 35 million m 3 sand. The nourishment was built to replace the flood protection function of an old sea-dike while creating additional space for nature and recreation. This paper presents the evolution of this newly created sandy beach system in the first 5 years after implementation based on bathymetric and topographic surveys, acquired every three to six months. A significant coastline curvature is created by the nourishment leading to erosion in the central 7 km bordered by zones with accretion. However, over the five-year period, net volume losses from the project area were less than 5% of the initial nourished sand volume. The man-made cross-shore beach profile rapidly mimics the characteristics of adjacent beaches. The slope of the surfzone is adjusted within two winters to a similar slope. The initially wide beaches (i.e., up to 225 m) are reduced to about 100 m-wide. Simultaneously, the dune volume has increased and the dune foot migrated seaward at the entire nourished site, regardless of whether the subaqueous profile gained or lost sediment. Our results show that the Hondsbossche Dunes nourishment, built with a natural slope and wide beach, created a positive sediment balance in the dune for a prolonged period after placement. As such, natural forces in the years after implementation provided a significant contribution to the growth in dune volume and related safety against flooding.

Graphical Abstract

1. Introduction

Acceleration of sea level rise will require an increasing capacity to adapt to adverse changes e.g., [1,2] due to coastal erosion or reduced safety against flooding. At eroding coastlines, sandy (beach) nourishments have been used to mitigate the loss of sediment [3,4] to preserve recreational or safety functions. Nourishments can be implemented at beach systems, but can also be used to adapt gray coastal infrastructure (e.g., dams, dikes, seawalls) to new coastal management views, e.g., [5,6,7]. Coastal management views in which soft, nature-inclusive, and adaptive measures are preferred over more traditional hard protection measures [8,9], often referred to as Building with Nature, Engineering with Nature, or Living Shorelines.
In the Netherlands, nourishments are a key part of the coastal zone management. Nourishment strategy has become more large-scale and proactive in the last decades, including the use of mega-nourishments [10,11]. These mega-nourishments are sandy interventions in the coastal zone where large amounts of sediment (i.e., >500 m 3 /m alongshore for beach nourishment or >1000 m 3 /m alongshore for shoreface nourishment) are implemented. When mega nourishments are added to a beach, both cross-shore profile and alongshore shoreline curvature are strongly altered. This brings the coastal system out of equilibrium compared with its long-term average topography [12].
The Hondsbossche Dunes mega-nourishment project is a man-made sandy beach system constructed of 35 million m 3 sand. It is placed in front of a sea dike that was considered a weak link in the Dutch sea defense (Figure 1). The new sandy coastal defense consists of a shoreface, beach, and dune, aimed to increase safety against flooding while creating space for nature and recreation. As such, this project transferred (part of) the safety function from gray infrastructure to a soft sandy defense. The nourishment project significantly altered the coastal system in both along- and cross-shore directions. After placement, the newly created beach was on average 1.5–2 times wider, the subaqueous slope 1.5–2.5 times steeper, and the coastline curvature about 4 times larger than the adjacent coastal sections. The addition of large sediment volumes and the new cross-shore profile in a region that was protected by a dike for decades are bound to invoke a strong coastline response.
The planform adaptation of nourishments on the timescales of years is generally assumed to be governed by wave-driven alongshore sediment transport gradients [3,13]. Planform adaptation herein is symmetric in the alongshore, resulting in sediment accumulation in both adjacent beaches. Ludka et al. [14] show that this spreading can also be asymmetric, with wave direction correlating to the displacement of the center of mass of the nourishment.
Cross-shore profile equilibration after nourishment implementation occurs typically in the order of weeks to years [3]. Steep post-nourishment profiles adapt initially fast with sediment from the subaerial beach moving downslope [3,12,15]. This first adaptation in the cross-shore can be strongly impacted by high-energy events [16]. Over time, the profile equilibration slows down as the profile approaches a new dynamic equilibrium shape and steepness.
The beach width of the nourished beach is an important profile indicator from an economic and recreational perspective, e.g., [17,18,19]. After implementation of a beach nourishment, the beach is often at its widest and the reduction in beach width thereafter can be attributed to either horizontal movement of the waterline position, changes in dune foot position, or both. The variations in dune foot position originate from dune erosion during storms and deposition of aeolian sand transport. Aeolian transport can bring sediment from the intertidal zone and beach to the dunes at different timescales [20,21], with many processes influencing the magnitude of wind-driven sediment transport [22]. The resulting beach width is closely related to the shape of the dynamic equilibrium profile, as described by [23,24]. As such, the remaining dry beach width after nourishment can depend significantly on the size of nourished grains compared with native [3,24].
Large beach widths at mega-nourishments could lead to an increased dune volume over time [25] and create accommodation space for embryo-dune development [26]. Yet, [27] report that at least half of the subaerial sediment deposits at a dune landward of a mega-nourishment may originate from the intertidal zone. Intertidal beach geomorphology may therefore be as important as the total beach width. Moreover, complex subaerial beach configurations (e.g., variability in dune front orientation) can cause (locally) increased or decreased deposition [28]. Spatial differences in wave energy have also been related to differences in dune volume increase [29,30]. High-energy events with wave run-up and storm surge can furthermore result in sediment deposition near the dune foot [31].
Expectations on the evolution of coastal state indicators, such as beach width (as proxy for recreation) and subaerial sediment volume (as proxy for coastal safety), are important in engineering practice and creating stakeholder support of (mega-)nourishments. Our aim is to document the subaqueous and subaerial beach changes at the Hondsbossche Dunes nourishment as a nature-based solution for integrated coastal development. Therefore, we investigate how beach width and profile volumes coevolve in the first five years after implementation of the Hondsbossche Dunes mega nourishment. We analyze the change in profile volume, beach width, and profile steepness at 250 m spaced transects measured on a quarterly to yearly basis and compare this evolution with that of the adjacent coast.
The next section will describe the Hondsbossche Dunes nourishment in more detail. In Section 3, the data and method are elaborated on, followed by the results of the data analysis in Section 4. In Section 5, the results are discussed and, in Section 6, the conclusions can be found.

2. Case Study

2.1. Coastal Setting

The Hondsbossche Dunes nourishment is situated at the Northern North-Holland (NNH) coast in the Netherlands. The NNH coast is a sandy, wave-dominated coast bounded by the Marsdiep tidal inlet in the north and the breakwaters of IJmuiden harbour in the south (Figure 2b).
Prior to 2015, the NNH the sandy coastline was interrupted in the middle by the Hondsbossche and Pettemer sea defense. The sea dike had protected the low-lying hinterland since 1887. This location protruded seaward with respect to the surrounding coastline, making it an erosional hotspot and a location where human interventions date back several centuries [32]. Both this sea dike and the adjacent sandy coastal sections contained regular-spaced shore parallel beach groins (Figure 1). The nearshore bathymetry south of the sea dike (km 24–55, Figure 2c) is characterized as a cyclic multiple (2–3) bar system, with offshore migration in a cyclic period of approximately 15 years [33]. The section north of the original sea dike (km 8–23, Figure 2c) is characterized by a single nearshore bar without cyclic behavior. In this northern section, a shoreface shoal (the Pettemer Polder, km 20, Figure 2c) is also present at a depth of about 10 m.
The native sand has a gradation between 250 and 300 μm around the waterline [33]. The material found in the dune ranges between 220 and 280 μm [34]. At deeper water (i.e., −5 to −10 m + NAP), the material is, in general, finer [35], ranging between 170 and 200 μm.
Figure 2. Location of case study site and an overview of the survey transects from available datasets. (a) Location of Dutch coastline within Europe. (b) Location of Hondsbossche Dunes nourishment (yellow line) at the Dutch coast including local nearshore wave climate at HD at −10 m + NAP depth based on a 20-year hindcast time-series derived by Kroon et al. [36]. (c) Location of transects from Jarkus (red), contractor survey transects (green), and 11 constructor high-temporal-resolution transects (black); the blue star indicates the location of the nearshore wave climate.
Jmse 10 01152 g002
The NNH coast is exposed to a semidiurnal tide with a range of about 1.6 m. Mean low and mean high water are at ± 0.8 m + NAP [37] (NAP is the Dutch reference level, roughly equal to mean sea level). Wind waves are mainly approaching from a southwesterly and northwesterly direction with longer period waves arriving mostly from the north [33]. The annual mean wave height H s is 1.0 m, coinciding with wave periods typically of 4.3 s, at a depth of −10 m + NAP in the central part of the project site (location indicated with blue star in Figure 2c). More extreme wave heights with a 1/20 y recurrence, at the same location, have a height H s = 4.7 m and period of T m 1 , 0 = 8 s. The full wave rose based on a 20-year time-series of hindcast waves [36] is presented in Figure 2b. The spatial variation in the offshore wave climate along the Holland coast is small.
The net alongshore sand transport is estimated to increase over the NNH coast from 250,000 south to 550,000 m 3 /m/y north [38]. According to this estimate, the gradient over the project area is about 100,000–250,000 m 3 /y. Since the 1980s, almost 70 nourishments have been placed along the NNH coast within the framework of the Dutch coastal maintenance program [10]. Before 2015, the nourishment volume was, on average, 1.55 million m 3 / y at the NNH coast and 250,000 m 3 / y at the project area, Table 1. In the post-construction period of the Hondsbossche Dunes project evaluated here, five nourishments have been implemented along the NNH coast: a combined beach and shoreface nourishment was placed between 12.13 and 14.21 km in 2017 with a combined volume of 720 m 3 /m; this was repeated in 2019 for the shoreface with a volume of 530 m 3 /m. A shoreface nourishment with a volume of 280 m 3 /m was placed between km 31 and 40 in 2015 and repeated in 2019. Two beach nourishments with a volume of 220 m 3 /m were placed between km 32 and 34 and between km 37 and 39 in 2015 [39,40].

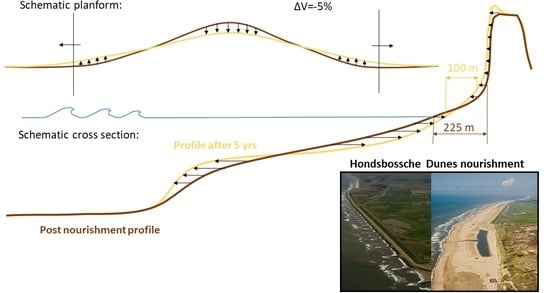
2.2. Hondsbossche Dunes Nourishment

The Hondsbossche and Pettemer sea dike was marked as a weak link in the Dutch sea defense with safety against flooding being below the desired level. Instead of dike reinforcement (e.g., heightening, widening), it was decided to increase safety against flooding by placing a sandy beach and (multirow) dune system in front of the dike. To achieve this purpose, a nourishment was designed that could meet the desired safety standard. This resulted in a nourishment of 35 million m 3 sand, with an average nourished volume of over 4000 m 3 /m that exceeds locally 5000 m 3 /m. The Hondsbossche Dunes nourishment is placed over a length of approximately 9 km coastline and covers almost 800 ha of subaqueous and 350 ha of subaerial domain.
The subaqueous profile was designed as a Dean [24] profile fitted to observed profiles of the adjacent coast. Although in practice placed steeper, the placed subaqueous volume was sufficient to accommodate adjustment to a profile slope close to this expected dynamic equilibrium slope. This design philosophy was adopted to prevent large subaerial readjustments, albeit with uncertainty regarding the applicability of a Dean [24] profile for a nourishment of this magnitude. The subaqueous profile is supplemented with a spatially varying buffer layer to compensate for expected alongshore losses, resulting in a design with wide beaches. The subaerial design is primarily based on a safety assessment with Duros+ [42] and an additional surcharge to account for the curved coastline [43]. Furthermore, the design included a dune valley, lagoon, and lookout dune to meet ecological and recreational demands (Figure 1b).
Placement of the nourishment took almost a year, and finished in April 2015. The construction works were phased from south to north and from shoreface to dune. The nourished sand was dredged 10–15 km offshore of the project site. The nourishment is constructed with a sediment grain size varying between 225 and 350 μm to match the native sediment size as best as possible. After placement of the sand, the dune was immediately planted with marram grass and dune foot fences were installed to prevent nuisance of sand transport over to the landward side of the dike. In February 2018, an additional nourishment was placed in the south of the Hondsbossche Dunes project area between km 25 and 26.5 to increase the local beach width for recreation. This extra nourishment had a volume of approximately 1 million m 3 and was placed on the beach.

3. Methodology

3.1. Morphological Datasets

Beach width and profile volume response are examined using monthly to quarterly surveys acquired in the first five years after construction. The available data originate from three different sources (Figure 3).
The first is the JARKUS dataset from Rijkswaterstaat covering the entire Dutch coast with transects spaced approximately 250 m-apart (red lines, Figure 2c) and acquired on a yearly basis [44]. These surveys display the response of the entire coastal cell, ranging from the port of IJmuiden to the Marsdiep tidal inlet. The second dataset is acquired more frequently (approximately four subaerial and two subaqueous surveys per year) by the contractor and maps the response of the 9-km project site. These surveys consist of cross-shore transects spaced 250 m-apart. Originally, these were surveyed perpendicular to the newly created coastline and, therefore, deviated slightly in position and orientation from the JARKUS transects. To enable better comparisons, the transect locations were revised in summer 2017 to match the JARKUS lines (green lines in Figure 2c). The third dataset contains 11 transects approximately 1 km-apart on which monthly to two-monthly measurements were taken by the contractor for a period of 1.5 years since the end of construction of each transect (black lines in Figure 2c). For several southern transects, data are already available from the end of 2014 while construction at the northern transects was only finished in April 2015. These 11 transects follow the orientation of the postconstruction coastline. The surveys obtained by the contractor (dataset 2 and 3) use single beam echosounder for the subaqueous data and the subaerial data are gathered mostly with LIDAR scans with occasionally walking GPS-RTK measurements.
The surveys that cover the entire nourished site in both the subaerial and subaqueous domain are gridded with a resolution of 2 m to examine the temporal evolution of the total volume change.

3.2. Data Reduction

To analyze the subaqueous and subaerial changes, the complex bathymetrical datasets are reduced to indicators that can be tracked in space and time and correlated to each other. First, these indicators are derived in the transect system of each dataset. Next, for overlapping or close positioned transects, these indicators are combined.

3.2.1. Sediment Volumes at Different Elevations in the Profile

The sediment budget of the nourishment and the adjacent coast are analyzed for various vertical slices representing the different subsections of the profile (dunes, beach, shoreface). The total profile-integrated volume is defined as the volume above −10 m + NAP, the level beyond which no significant bed level change is visible ( σ Δ z < 20 cm) and seaward of the landward boundary. The lower shoreface volume is the lowest subsection analyzed, defined as the volume slice between −10 m + NAP and −4.8 m + NAP. The −4.8 m + NAP level represents the level above which 90% of the waves in the local long-term wave climate break, and is used to delineate between shoreface and surfzone subsections. The morphologically most active cross-shore section, the beach and surfzone, is bounded by −4.8 m + NAP and 3 m + NAP. Finally, the dune volume subsection is analyzed from the bed levels above 3 m + NAP and seaward of the landward boundary, Figure 4. The landward boundary is chosen sufficiently far into the dune such that there is no significant sediment transport over it and its position does not affect the computed volume changes. Not all measurements extend until the landward boundary at each time step, for each transect. If not, these measurements are discarded for the total and dune volume change.

3.2.2. Beach Width, Shoreline Position, and Dune Foot

The beach width is defined as the distance between the waterline position and the dune foot position, Figure 4. The waterline position is taken from the average of the cross-shore positions of the bed at the MHW and MLW levels, similar to the definition used by de Vries et al. [45]. The dune foot elevation is taken constantly at a level of 3 m + NAP, and dune foot position follows from the intersect with the cross-shore profile with the 3 m + NAP. There are many alternative definitions of dune foot, e.g., using a maximum slope change criterion [46]. The volume change analysis in this paper is only marginally affected by this definition and, for simplicity, a fixed horizontal level is assumed. Similarly, beach width changes on the time scales considered are hardly affected by the definition; however, absolute values of beach width can be more sensitive.

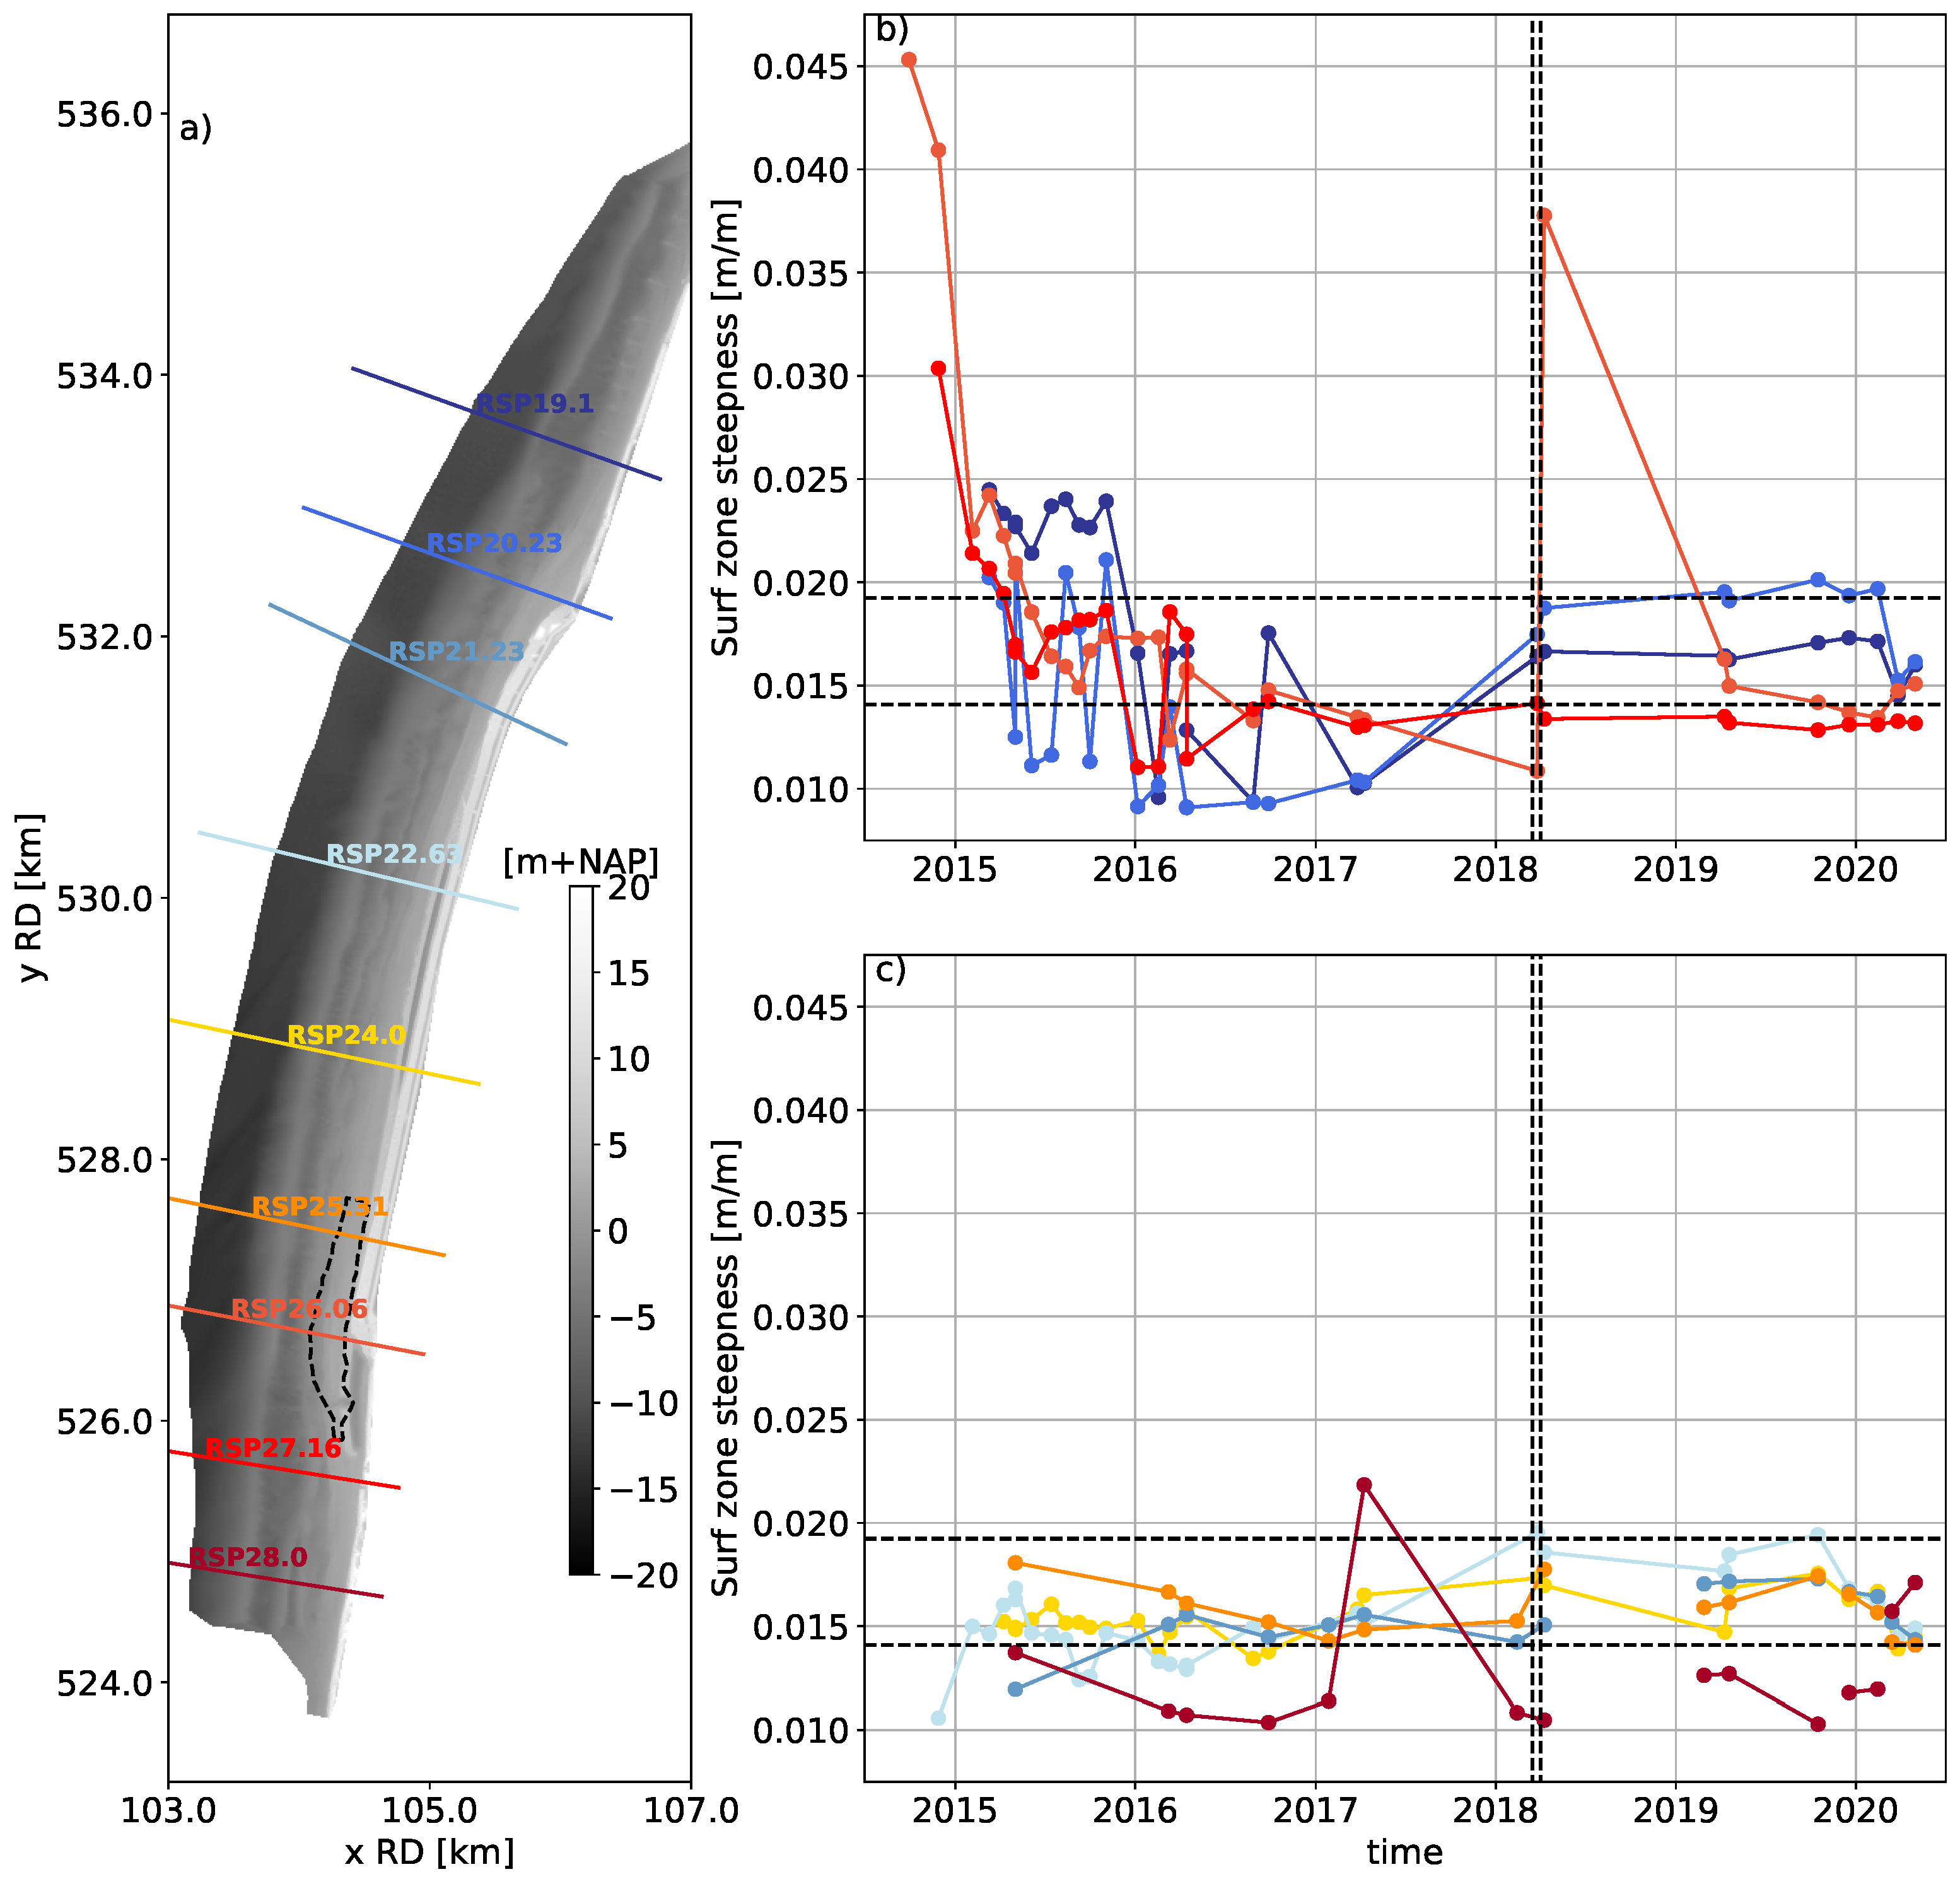
3.2.3. Surfzone Slope

The surfzone slope is determined to examine cross-shore adaptation in the period directly following the construction. The slope is obtained from a least squares linear fit through the vertical elevations of the beach and surfzone bounded by the closest crossings with −4.8 and 1.5 m + NAP levels (Figure 4), similar to the approach of de Vries et al. [45]. The upper level of +1.5 m NAP is chosen well-above the high water level to increase the robustness of the determined slope to inaccuracies around the interface of the subaqueous and subaerial measurements. Nevertheless, cross-shore slope values are sensitive to sandbars moving in and out of the evaluated elevation points. For the temporal evolution of the surfzone slope, the surveys before the formal end of construction are also included to map the response rapidly after the nourishment works.

3.2.4. Coastline Curvature

Coastline curvature is defined as the gradient in the orientation of the shoreline curve. This shoreline curve is obtained by connecting the cross-shore shoreline positions (as defined in Section 3.2.2) in the different transects. Before determination of the gradient, the shoreline curve is filtered with a uniform filter with an alongshore length of 1 km and averaged over the five-year evaluation period to remove small fluctuations. Finally, the gradient is computed using a second-order accurate central difference scheme.

4. Results

This section presents the data analysis of the Hondsbossche Dunes nourishment project. First, an overview of the morphological development in the five years after implementation of the nourishment is given. Second, the volumetric evolution over time is discussed with focus on different vertical zones (dunes, beach, surfzone, shoreface) and in the context of the larger coastal cell. Next, profile adjustment is presented and the subaerial evolution of the nourishment is assessed in more detail. Finally, the relationship between sediment budgets and concurrent changes in beach width and planform coastline curvature are examined.

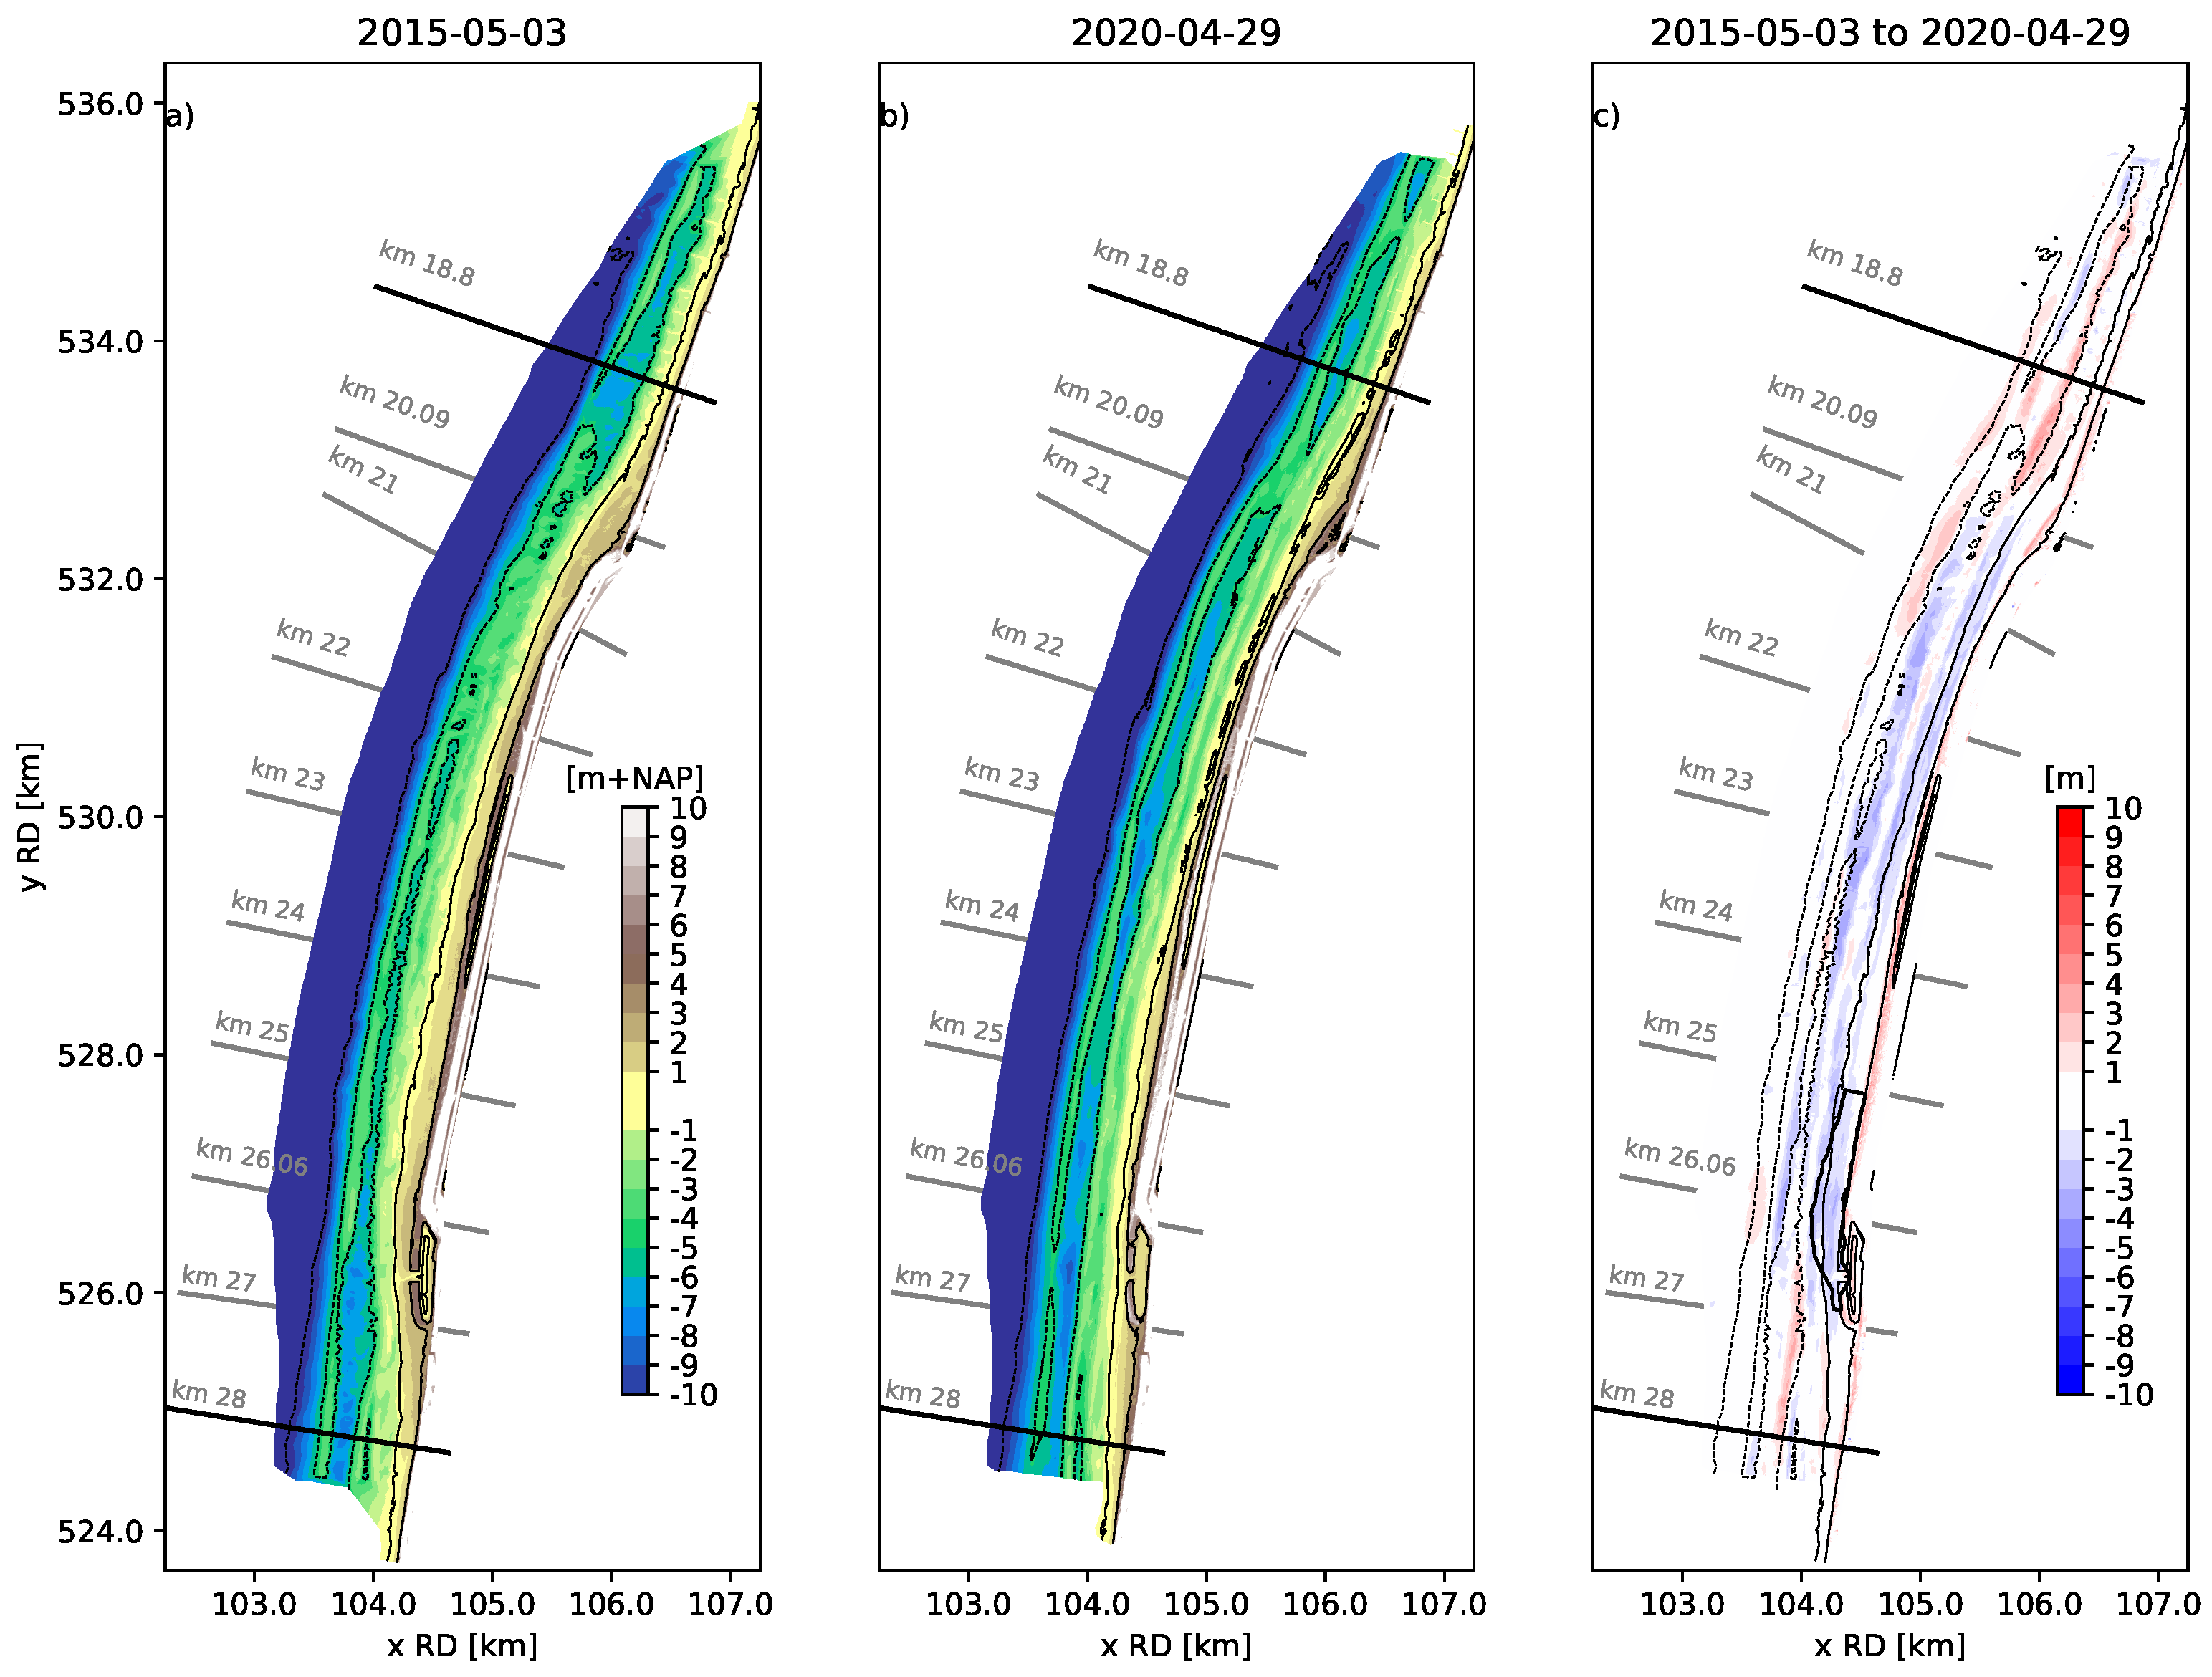
4.1. General Morphodynamic Response of the Nourished Beach in Five Years

The bathymetric change in the five years after the nourishment works is illustrated using gridded plan view topographies (Figure 5a,b) and profiles of selected transects (Figure 6). The placement of the nourishment in front of the sea dike created a curved coastal section, protruding seaward with respect to adjacent beaches (Figure 5a). The central part of this new beach system eroded (7 km out of the 9 km) in the first years after implementation of the project. This erosion is focused around the waterline and in the surfzone (Figure 5c). During these years, both adjacent coastline sections experienced accretion. This accretion is present in the lower shoreface at the coastline sections where erosion transitions to accretion (km 20 and km 26) and extends in the cross-shore to the surfzone in sections further north and south. The coastline section with, predominantly, accretion in the north is larger in magnitude and intensity compared to the accretive section in the south.
The cross-shore profiles at the nourished site show the development of a double barred system with an outer bar approximately 500 m from the waterline with a crest height around −4 m + NAP and a more dynamic inner bar around 200 m from the waterline with a crest around −2 m + NAP (Figure 6). Bed level variations extend until a depth of approximately −10 m + NAP (Figure 5c). Dune growth can be observed along the entire nourished site, either in the form of embryo dune establishment on the nourished beach, or dune face progradation and heightening of the first dune row (Figure 5c and Figure 6).

4.2. Volumetric Changes

Although large volumes of sediment are displaced, the majority of the added sediment in the project area can be retraced over the five-year period. A volumetric budget of the entire 9 km placement area shows a loss of 1.6 × 10 6 m 3 by 2018 (Figure 7, black symbols), which is less than 5% of the 35 × 10 6 m 3 initially added to the region. The 2018 nourishment of 1 × 10 6 m 3 resulted in a positive jump in volumes, but a small negative trend remained and, by 2020, (after 5 years) a loss of 1.4 × 10 6 m 3 is observed. Small fluctuations in volumes can be observed, which are likely due to survey inaccuracies and gridding of the transect data.
The 9 km-long sediment budget area is subdivided in the alongshore into a central section and two lateral sections to examine lateral diffusion of the nourishment. The central part of the nourishment shows a negative trend (Figure 7, orange symbols) with exception of the moment of placement of the 2018 nourishment. After five years, the 7 km-long central area has lost a volume of ∼3 × 10 6 m 3 . The erosion from the center of the nourishment in the first year is ∼1.3 × 10 6 m 3 , about twice as high as the following second and third years (Figure 7, orange symbols). After the third year, the volume in the central section increases with the additional 2018 nourishment. After this intervention, the central volume decreases further in the fourth and fifth years.
Opposed to the erosive central part, both lateral sides show a gradual accumulation of sediment with small fluctuations. The gained volume in the northern (Figure 7, blue symbols) sediment budget section is about three times larger than in the south (Figure 7, green symbols), while the coastal section is 1.5 times longer in the alongshore direction. This asymmetry is in agreement with the northward direction of the alongshore transport in this region [38].
To obtain insight in the alongshore and cross-shore variations in time, the volumetric changes are further examined using seven transects. The profile-integrated volume changes of the transects located near the edges of the project area show accretion up to 1000 m 3 /m alongshore (Figure 8b, red and blue symbols), where transects in the center of the project area show a loss in volume varying between 300 and 700 m 3 /m after 5 years (60 to 140 m 3 /m/y). Especially, the first two surveys after construction show large changes, followed by several surveys with more moderate adaptation (Figure 8b).
Regardless of whether profiles are eroding or accreting (based on the profile-integrated volume), dune volumes mostly increase from survey to survey (Figure 8c). The dune volume growth shows a significant variation among transects, between 40 to 300 m 3 /m after 5 years (i.e., 8 to 60 m 3 /m/y). The dune volume growth is largest for a profile at the center of the nourishment (km 24, yellow symbols in Figure 8c). Here, volume gain in the dune is a significant part of the cross-shore sediment balance and of the same order of magnitude as volume losses below 3 m + NAP. At transects with a more moderate dune volume increase (e.g., km 21.23, 22.63, and 26.06) the dune volume increase is about five times smaller than the profile-integrated volume decrease.
Likewise, the volume change in the lower shoreface (−10 to −4.8 m + NAP) can locally be a significant contribution to the profile-integrated volume change (Figure 8d). Especially for the central transects (km 22.63 to 26.06), the magnitude of the lower shoreface losses is ∼50% of the profile-integrated sediment loss.

4.3. Changes in Perspective of the Morphodynamics of the Coastal Cell

The coastline curvature at the nourishment is stronger than that of the coastal cell (Figure 9a). The original coastline slowly rotates 10° from 285 to 275° N over approximately 20 km (∼0.5°/km) to the south of the nourishment project, and 20° from 295 to 275° N over 15 km to the north of the nourished site (∼1.3°/km), while at the center of the nourishment, the coastline orientation changes 25° from 275 to 300° N in less then 7 km (∼4°/km) (Figure 9b).
Expansion of the sediment budget analysis to a larger 45 km-long coastal stretch shows that average annual volume changes per cross-shore profile vary in the alongshore direction between +250 and −250 m 3 /m/y over the period of 2015–2020 (Figure 9c, blue line), with large fluctuations between years (Figure 9c, blue shading), particularly for locations where nourishments have been implemented. The central beach of the Hondsbossche Dunes stands out as an erosional zone, with large volume losses of 100 m 3 /m/y (Figure 9c,d). This erosional zone is consistent with the area where the coastline is strongly curved (Figure 9b, km 20 to 27). Volume variations at adjacent coastal sections are, in general, of a smaller order of magnitude. Repeated nourishments (km 12.13–14.21 and 31–40, gray blocks in Figure 9c,d,f) at the adjacent coast are visible as sections with a positive volume balance averaged over the 5 years. Sections with a positive volume balance are also visible next to the Hondsbossche Dunes nourishment and are related to spreading of the earlier-placed nourishment, feeding the adjacent coast (Figure 9c, km 17–20 and 27–28).
Subdivision in the different elevations shows that, at the nourished site, profile-integrated volumetric changes (Figure 9c) are dominated by variations in the beach and surfzone elevations (Figure 9d). Beach and surfzone changes are, respectively, 5 and 3 times larger than the average volume changes in the dunes or lower shoreface (Figure 9e,f), but this ratio varies strongly alongshore. For instance, at the center of the nourishment (between km 24 and 25), a peak in deposition in the dune is observed, in combination with a reduction in beach and surfzone volumes resulting in a ratio of almost 1.

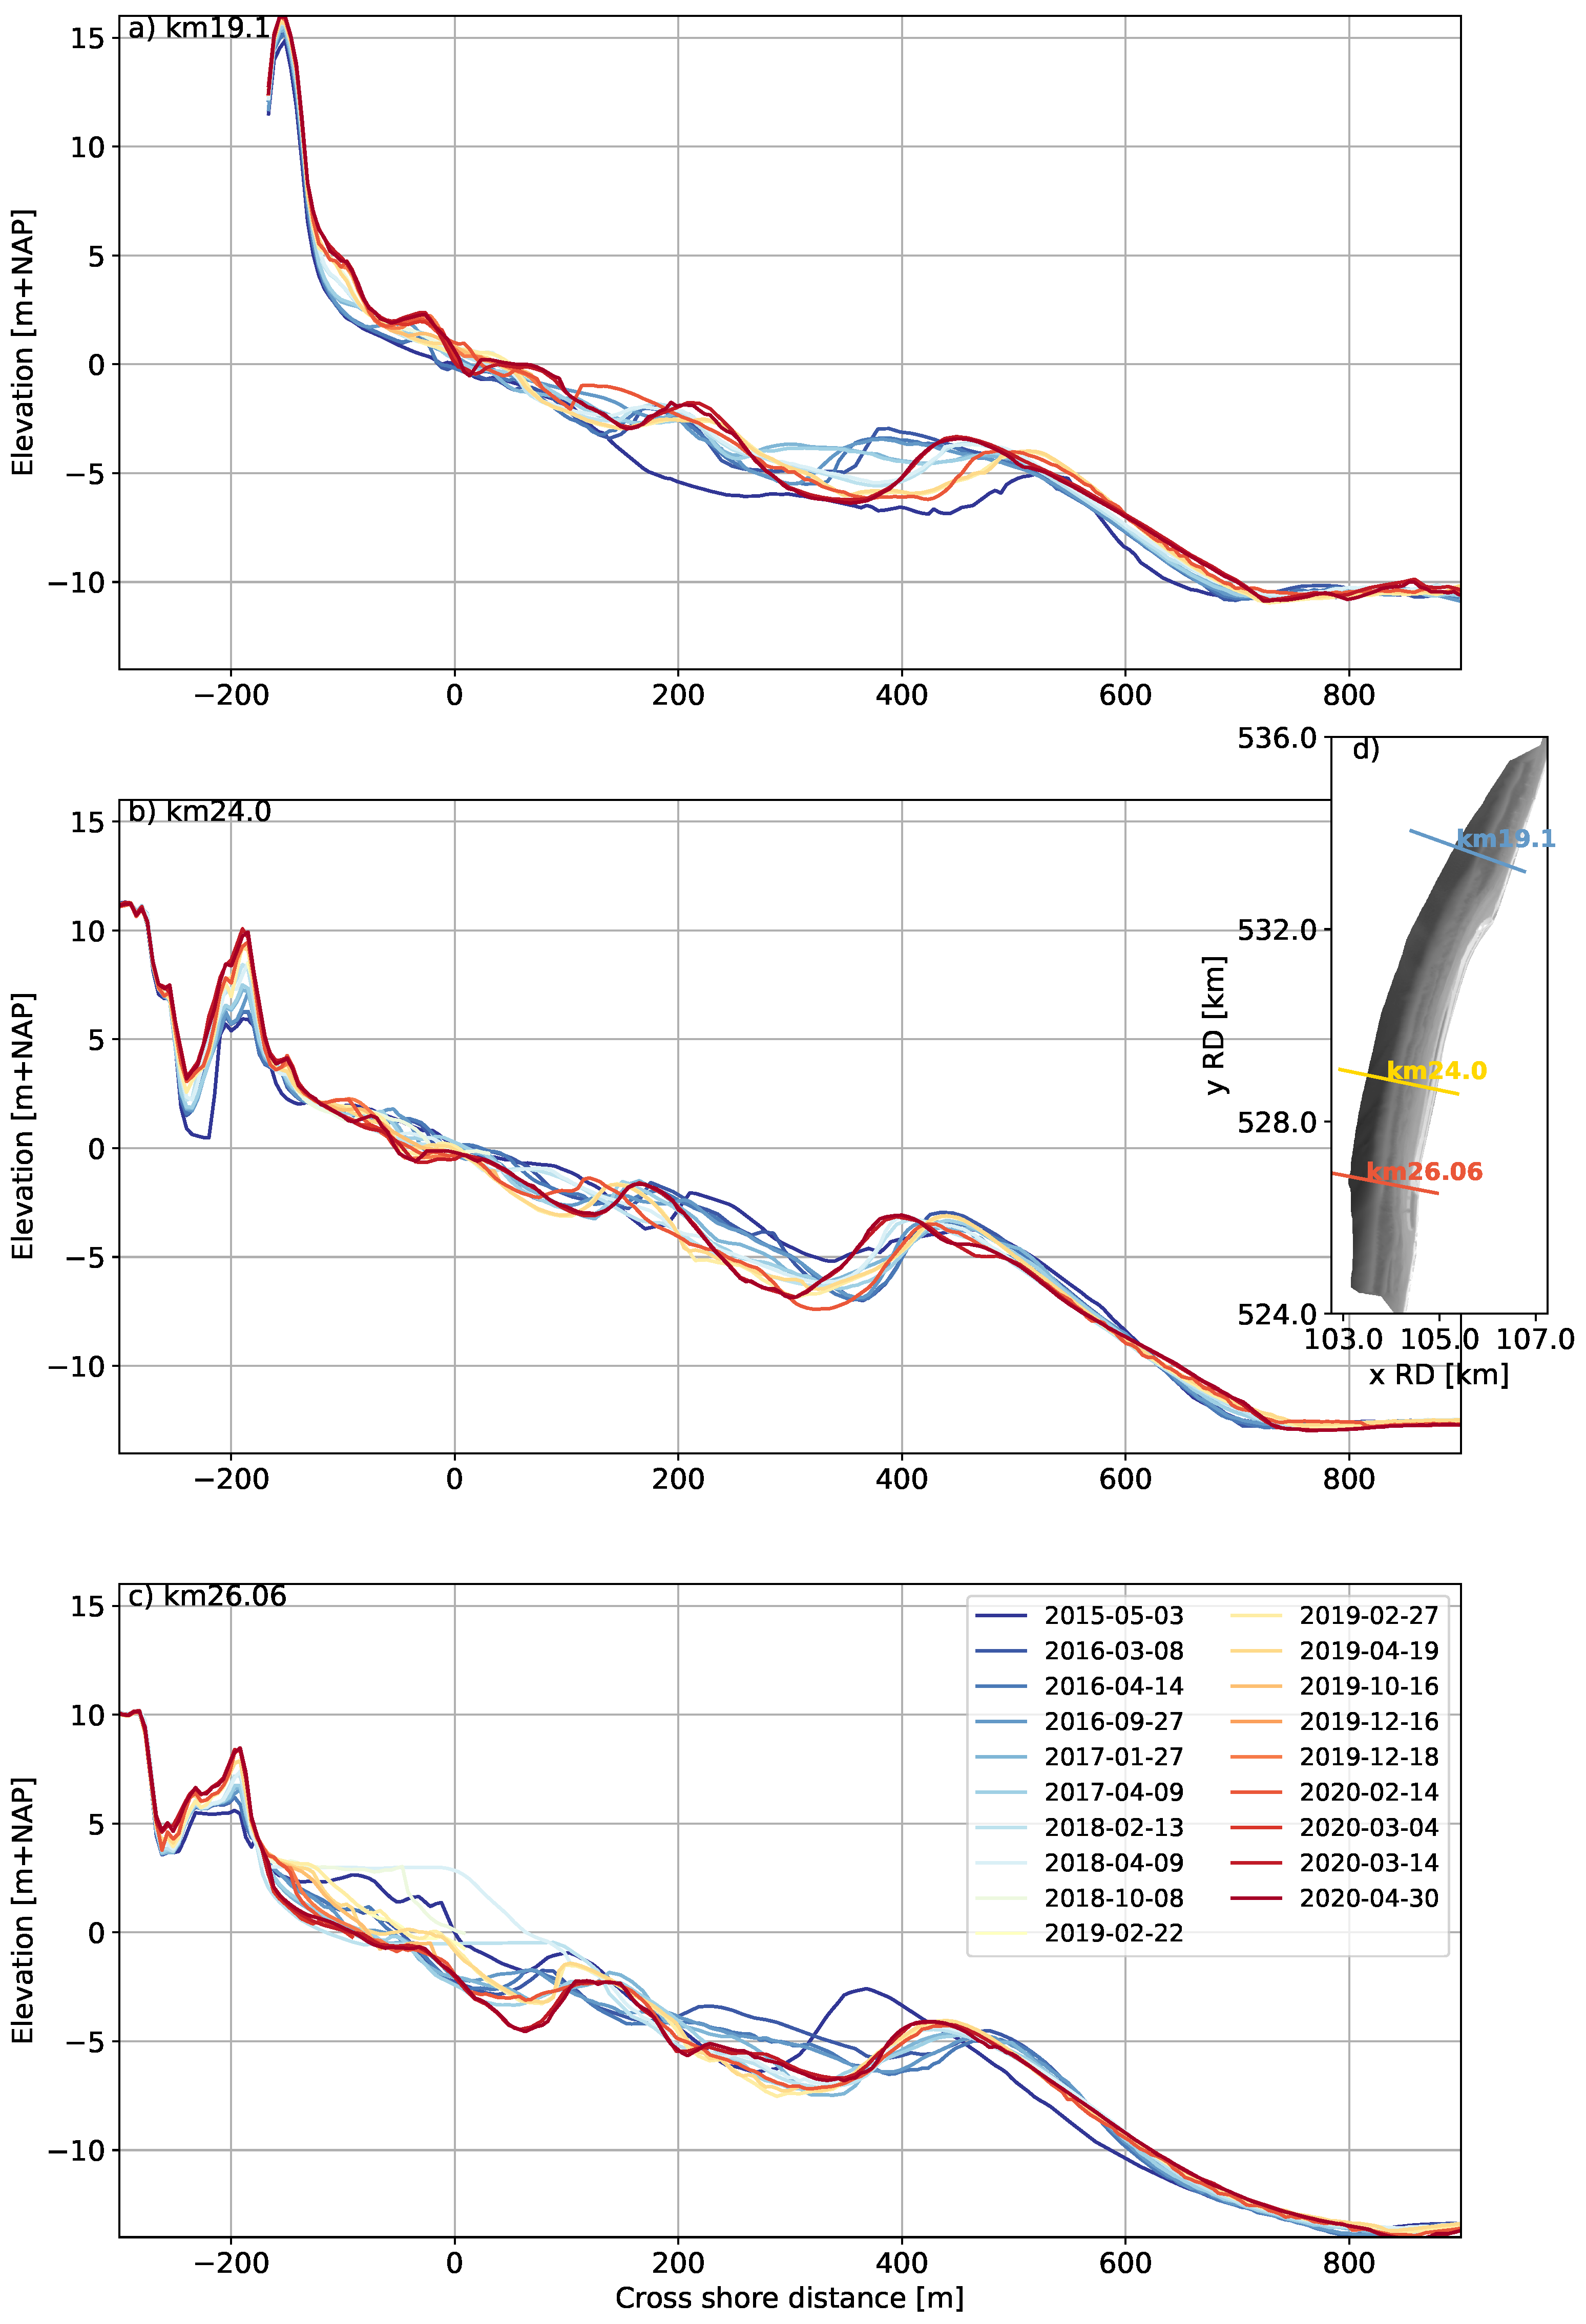
4.4. Cross-Shore Adaptation

The steepness of the cross-shore profile over time is examined and compared with values of the surrounding coast. The datasets contain several transects that are initially steeper than the adjacent coast. These steeper slopes adapt to a similar magnitude as the adjacent coast in the first two winters, Figure 10b. This is not observed for all transects, as for some transects, monitoring started several months after construction had finished. Moreover, not all transects were constructed with the same initial steepness. For transects where the first surveys indicated a profile steepness similar or lower than the adjacent coast, no large change in slope is observed, Figure 10c. The southern transects are initially very steep, two to four times steeper as the adjacent coast, but readjust and flatten over the first winter period (2014/2015) to a steepness about the maximum of that of the adjacent coast. In the next year, the profiles remain quite constant to become even flatter in the second winter. Placement of the 2018 nourishment steepens the local transect in the south, yet, also this is temporary and the profile steepness returns to its previous range. Construction at the more northern transects was still ongoing in the winter of 2014/2015. Nevertheless, these transects show a similar pattern with steepness values outside the range of the adjacent coast that decrease after the winter of 2015/2016.

4.5. Subaerial Evolution

Subaerial volume changes are relatively small compared with subaqueous zones but can be important for the assessment of safety against flooding or recreation potential. In this section, we examine the evolution of the subaerial beach through the spatial and temporal patterns in dune foot position and volume, and beach width.
The average dune volume increase over 5 years at the nourished beach is about 30 m 3 /m/y (Figure 11c) and peaks at almost 60 m 3 /m/y at the center of the nourished section (km 24.0), showing there is a significant alongshore variation of deposition in the dune. In comparison, during the same period, dune growth at the adjacent coast is 15 m 3 /m/y. Dune growth can occur through lateral expansion of the dune (i.e., seaward change in dune foot position), heightening of the dune, or both. At the Hondsbossche Dunes, both elements are visible. Dune growth in volume is, however, not always connected to lateral expansion (Figure 11c,d). In the nourished section, the dune foot position changes on average 4 m/y seaward (Figure 11d), twice as high as at the adjacent coast, at which the dune foot position changes 2 m/y seaward. Two nourished sections in the larger coastal section (km 12.13–14.21 and 31–40) stand out as zones with a large seaward movement of the dune foot. An exceptionally large dune foot change is found at the northern transition zone of the nourishment (±km 20), where the local dune foot has progressed with over 50 m. This is the result of the local infill of a discontinuity in the first dune row. This discontinuity resulted from a stepback in the constructed dune at the transition to the adjacent coast. Although the dune foot migrates forward by 50 m at this location, this is not reflected in larger dune volume changes (Figure 11c, ±km 20).
The nourished beach at the Hondsbossche Dunes is on average 180 m-wide directly after construction. This is about twice the width of the surrounding beaches where the average beach to the south is 83 m and to the north is 101 m-wide (Figure 11e). The beach width adapts rapidly over the years as a consequence of both fluctuations in the land–water interface, and seaward migration of the dune foot (Figure 12c,d). The contribution of dune foot migration to the changes in the beach width is substantial at the nourished site—on average, 20% of the total beach width change and, locally, more than 35%.
At the eroding part of the nourished site, between km 20.23 and 27, the beach width decreases by about 80 m (Figure 12b, round markers). The majority of the reduction occurs in the first two years, after which the beach width adaptation slows down and converges to beach width values similar to the adjacent coastal sections. Transects 25.31 and 26.06 are an exception as the beach width is disturbed by the placement of the additional nourishment in 2018. The beach width reduction at the eroding transects is primarily caused by a landward change in waterline position (60 m of the 80 m reduction in beach width). This change in waterline position is initially fast but slows down over time (Figure 12c). From the landward end, beach width is reduced by a more constantly prograding dune foot of, on average, 20 m seaward.
The beach width in the accretive lateral sections of the nourishment displays no clear trend (Figure 12b, triangular markers). At these transects, the seaward migration of the waterline (20–50 m) is similar to the seaward migration of the dune foot (30–40 m) (Figure 12c,d).

4.6. Profile Volumes and Beach Width Changes as Function of Coastline Curvature

The observations of volume change and beach width change at the Hondsbossche Dunes are correlated to evaluate their dependence. This is performed using the JARKUS dataset only, because it is the most consistent dataset to cover both the subaqueous and subaerial domains for the entire evaluation period. For the nourished section, the beach width change Δ W b and total profile-integrated volume changes Δ V are well-correlated ( r 2 = 0.75 , Figure 13a). Changes in waterline position Δ x s l correlate even better with the volume change ( r 2 = 0.84 ) as noise introduced by dune foot position changes is excluded from the relation (Figure 13c). The coastline curvature is an important driver of nourishment adjustment, e.g., [3,13]. For the Hondsbossche Dunes, both volume change and beach width change indeed correlate well with curvature ( r 2 = 0.47 and r 2 = 0.54 , respectively, Figure 13b,d), confirming the importance of alongshore wave-driven sediment transport for both indicators.
The least squared linear regression line relating beach width and volume change intersects the Δ V = 0 m 3 line at negative values, estimating around 50 m reduction in beach width for profiles with no net volume change (Figure 13a). Similarly, the regression line relating volume change and waterline position crosses Δ x s l = −30 m at Δ V = 0 m 3 (Figure 13b). These offsets are considerable compared to the range of beach width changes observed (±100 m). Suggesting that, next to profile volume changes, cross-shore redistribution of volume is an important contribution to beach width change in the first five years.

5. Discussion

5.1. Beach Width and Dune Growth

The initially wide beach at the Hondsbossche Dunes project significantly reduced over the five years investigated. The landward trend in waterline position is found to be the main contribution to the beach width changes (in the order of several meters per year) and about two to four times the magnitude of the seaward shift in the horizontal dune foot position (Figure 8). This dominance of waterline position changes over fluctuations in dune foot are similar to observations at a nearby natural beach [47]. In general, fluctuations and trends in waterline position occur on a range of scales (i.e., seasonal and storm scales to interannual scales, e.g., [47,48,49,50]).
The observed net landward migration of the waterline after implementation of a nourishment may be caused by alongshore gradients in sediment transport as well as redistribution of the (nourished) sand downslope in the cross-shore direction. The cross-shore adaptation at smaller nourishments is reported to occur primarily in the first months or year after implementation [51,52,53], with high-energy wave events playing an important role [16,54]. Volume and beach width changes at the Hondsbossche Dunes in the last years are also smaller than the first year (Figure 12b), which is in line with results of these earlier studies where cross-shore redistribution is initially strongest. Further, the rapid adjustment of the cross shore slope in the first two winters (Figure 10) is in line with reported reductions in slope adjustment at other nourished sites [16,55]. For the large nourishment investigated here, the cross-shore equilibration of the profile is not limited to the subaqueous profile and sediment moving downslope, as sketched by Dean [3], Elko and Wang [16]. Dune growth is a substantial part of the sediment budget and postnourishment equilibration (Figure 14).
Alongshore sediment transport gradients impact waterline position through both the planform adaptation of the nourishment and the pre-existing background erosion rate [56,57]. We observe a total shoreline retreat of up to 100 m for transects with large net volume losses (Figure 13c), about 70 m more than locations with minimal volume losses (Figure 13c, points near Δ V = 0 ). This underlines that alongshore effects are critical to understand changes in terms of beach width at this nourishment.
Furthermore, the analysis reveals contrasting trends of the waterline migration (driven by marine processes) and dunefoot migration (dominated by aeolian processes), resulting in a reduction in the beach width from both land and seaward sides over the past years. This is indicative of nourished beaches during the first period with no or minimal dune erosion, and similar to findings of Bezzi et al. [58]. At these wide, nourished beaches, the dune foot may move seaward (Figure 15b) due to aeolian transport, but as the beach erodes in the following years the dunes become more prone to erosion [45,59,60]. More severe and frequent dune erosion events will likely shift the dune foot landward and can bring the waterline seaward. Several transects have reached beach widths similar to the adjacent coast (within the μ ± σ range of 89 to 107 m) after five years (Figure 12a). At these locations, some initial retreat in dune foot position (Figure 12c) and an increase in beach width suggests stabilization after the last winter (Figure 12a). These observations are early signs that future beach widths at the nourished site may fluctuate within a similar range as the adjacent coast.
In the cross-shore direction, an increase in dune volume is observed regardless of the net trend in the profile volume below ( r 2 = 0.06 , Figure 15a). While dune volume gains are up to five times smaller than total volume change (50 m 3 /y compared to 250 m 3 /y, Figure 9), sediment accumulation in the dune can locally be a significant component in the cross-shore sediment balance and contribute to the safety against flooding. The observed average dune volume increase over the nourished site is 30 m 3 /m/y (Figure 11), which is similar to the upper limit of measured dune growth at the Dutch coast [45]. In contrast to earlier observations of larger dune growth in the first year after implementation of a nourishment e.g., [27,61], we observe no significant difference in dune volume gains between the subsequent years. From an engineering perspective, the observed average growth of 150 m 3 /m in the postnourishment period is significant and an important contribution to safety against flooding. To put the observed dune growth in perspective of the Dutch coast, the average dune erosion is estimated to be around 20–100 m 3 /m during a 1/30 year event [62] and 100–800 m 3 /m (100–250 m 3 /m at the NNH coast) in case of an extreme event (1/10,000 y) [63].
The dune volume increase shows significant variability in the alongshore direction and peaks in the center of the nourishment around km 24 (Figure 11). Dune development can be sensitive to beach width, beach sediment budget, shoreline orientation, vegetation and sediment, or surface properties amongst others, e.g., [29,64,65,66]. For the Hondsbossche Dunes, we observe that dune foot migration is correlated to beach width ( r 2 = 0.44 , Figure 15b), where larger beach widths result in more seaward migration of the dunefoot. A similar correlation between beach width and changes in dune volume cannot be found at the nourishment. However, Figure 15d shows that the behavior of the nourishment compared to the adjacent coast by including the entire coastal cell into the evaluation does result in a correlation. Although small, the larger dune growth at the Hondsbossche Dunes does show a positive correlation with the locally large beach width ( r 2 = 0.26 , Figure 15d). The variation in dune growth at the nourishment itself is correlated with the width ( W i b ) of the intertidal beach instead ( r 2 = 0.34 , Figure 15c). This is in line with previous observations that large parts of aeolian sediment deposits originate from the low-lying beach that is regularly reworked by waves [27].

5.2. Predicting Beach Width and Volume Change

Predictions of coastal dynamics are complex due to the large range of phenomena involved—e.g., [67]—and remain a challenge despite the advances made in the last decade [68]. Simple curve-fitting methods can provide good results to describe aggregated parameters of nourished beaches, such as remaining volume in the project area [69].
For a detailed view of the shoreline behavior, one-line type coastline models— e.g., [13,70,71,72,73]—can provide information on postnourishment development of the beach in a computationally efficient manner [4]. These models simulate the redistribution of sediment alongshore based on alongshore gradients in wave action, coastline gradient, or sediment availability. At the Hondsbossche Dunes, volume changes are indeed correlated with shoreline curvature ( r 2 = 0.47 , Figure 13d), confirming one of the key underlying assumptions of one-line models. One of the important parameters in these one-line models is selecting an active profile height, which is often estimated from an upper limit on the beach (e.g., the dunefoot or berm height at 3 m above MSL) and a depth of closure. At the Hondsbossche Dunes, the inner and outer closure depth are approximately 8 to 12 m below MSL using Hallermeier’s formulas [74,75]. This roughly coincides with the observations of the lowest point of observed bed level changes at ± 10 m + NAP (Figure 6). The Hondsbossche Dunes analysis also gives an additional option to estimate the active profile height based on the the linear regression line between profile volume change and shoreline position (Figure 13c). The reciprocal of the slope of the regression line can be interpreted as a representative active profile height of 14 m (i.e., 1/0.07). The similarity in values indicates that Hallermeier’s formulas could have been used to estimate the closure depth in the nourishment’s design phase.
The obtained correlations between volume change, coastline curvature, and beach width indicate that one-line models can be used to predict the response of nourishments on the scale of the Hondsbossche Dunes. Nevertheless, several limitations of one-line models can be illustrated with the data of the Hondbossche Dunes. First, the correlation between volume change and coastline curvature for several subsections of the nourishment is significantly higher ( r 2 > 0.6 ) than the averaged value ( r 2 = 0.47 ) for the project site, suggesting that the relative importance of coastline gradient as a driver of volume changes varies alongshore. Alongshore variations in offshore wave conditions, grain size d 50 , or lower shoreface slope may potentially explain part of the remaining variance. Not all these parameters are or can be captured by a one-line model. Secondly, one-line models typically do not include cross-shore redistribution of sediment. Considering the significance of the cross-shore equilibration on initial waterline position changes, it is important to calibrate a one-line model on net volume changes rather than waterline position changes for nourished beaches. Calibrating on waterline positions may result in an overestimation of shoreline retreat since the initial cross-shore adjustment could falsely be extrapolated to a longer time-scale. Furthermore, the subaerial response and dune foot migration is often not resolved separately by one-line models, while this is essential to estimate the beach width development and dune growth.
For the aforementioned nourishment aspects, planform process-based modeling techniques may potentially be used, such as in previous mega-nourishment design studies, e.g., [36,76,77]. To predict the beach width response including alongshore variability and dunefoot migration, as observed at the Hondsbossche Dunes site, an explicit representation of the subaerial beach may be necessary. The recently developed coupled hydrodynamic and aeolian processed-based models [59,78,79] show potential to predict this behavior in the near future.

5.3. Implications for Design

In the Hondsbossche Dunes project, a beach dune system was created in front of an old sea dike. The man-made sandy system was aimed to increase safety against flooding while adding additional value. The design was inspired by Building with Nature principles, amongst others aiming to use natural forces to support our human objectives [9].
Our analysis suggests that after an initial adjustment period, the man-made beach system obtains comparable characteristics to the adjacent coast in terms of beach width and surfzone slope, despite the large quantities of added sand. Its exposed location in front of the sea dike and inherent coastal curvature will likely result in continued redistribution of sediment to the adjacent coast. The adjacent coast will benefit from the spreading of this sediment similar to the feeding effect of the sand engine [12,55]. The sediment supply to the adjacent coast could be considered an amenity of reinforcement of gray infrastructure with a seaward sandy extension.
For creating and maintaining safety against flooding with a coastal nourishment, sediment volume above storm surge level is critical. Adding sediment at higher elevations in the profile during construction is often costly due to the machinery shaping the profile. Rapid downslope transport of this sand during erosion events is undesired and inefficient. Our results show that the design of the Hondsbossche Dunes nourishment, with a natural slope and wide beach, proved to be successful in creating a positive sediment balance in the dune for a prolonged period after placement. With a dune volume increase at the nourished site three times higher than the surrounding beach sections, natural forces are indeed partaking in the building of strong flood defenses.

6. Conclusions

Sandy nourishments have been applied as coastal engineering interventions for decades. Lately, projects using millions of m 3 of added sand to replace gray coastal infrastructure (e.g., dams, dikes, seawalls) have been initiated. This paper presents the morphological development of the Hondsbossche Dunes (the Netherlands), a nourishment of 35 million m 3 in front of an old sea-dike. The Hondsbossche Dunes is a unique area of newly created beach and dunes, aimed to increase safety against flooding while creating space for nature and recreation. Nearly twenty topographic surveys in the first 5 years after placement are used to examine the redistribution of sediment volume in both the along- and cross-shore directions and the adaptation of the postnourishment profiles with initially wide beaches.
In the first years after implementation, large local volume changes up to 1000 m 3 per meter alongshore were observed. Yet, net volume losses in the 9 km coastal section were less than 5%, indicating that reworking was mostly local. The central part of the nourished site stands out as an erosive zone, with large (60 to 140 m 3 /m/y) erosion. This erosion is predominantly in the subaqueous part of the profile and coincides with a shoreline retreat of about 80 m. Lateral coastal sections on the other hand show large accretion and a waterline migration of around 30 m-seaward. The man-made cross-shore beach profile rapidly mimics the adjacent beaches, as the surfzone slope is adjusted within two winters to a similar slope.
The seaward sandy extension of the sea dike creates a significant coastline curvature. The observed net profile volume change is, at several sections of the nourishment, strongly correlated ( r 2 > 0.6 ) with this planform curvature. In our observations, the local change in waterline position, Δ X s , correlates well with the volume change in the full profile Δ V p ( r 2 = 0.84 ). Finding this strong correlation suggests that the use of one-line models is appropriate when predicting the volume and coastline change of mega-nourishments.
An important observation is that the subaerial and subaqueous parts of profiles display contrasting behavior in the first years after placement. The dune volume increases in the first years after implementation with 30 m 3 /m/y; for many profiles, this net gain in volume is found regardless of the erosive trend in the lower part of the profile. The magnitude of the dune volume increase at the nourished site is three times higher than at the adjacent coast. This implies that the nourishment is bringing additional sediment volume above surge level, which is key to coastal safety.
As the dune foot migrates in the seaward direction and the shoreline moves landward, the beach width is reduced from two sides. The initially wide beaches (i.e., up to 225 m) are transformed in five years to about 100 m-wide, similar to adjacent beaches. The similarity in beach widths near the end of the five years investigated suggests that upcoming storm events may be able to erode sediment from the dunes, potentially reducing the excessive net growth of dune volume in the near future. Our results demonstrate that several years may be needed for the sandy cross-shore profile to reach characteristics similar to the nearby coast, after reinforcement of gray infrastucture. Natural forces can provide a significant additional contribution to the building of dunes during these years, further increasing the safety against flooding.

Author Contributions

Conceptualization, A.K., M.d.S., S.d.V. and S.A.; methodology, A.K. and M.d.S.; software, A.K.; validation, A.K., M.d.S., S.d.V. and S.A.; formal analysis, A.K.; resources, M.d.S. and S.A.; data curation, A.K.; writing—original draft preparation, A.K.; writing—review and editing, A.K., M.d.S., S.d.V. and S.A.; visualization, A.K.; supervision, M.d.S.; project administration, M.d.S.; funding acquisition, S.A. All authors have read and agreed to the published version of the manuscript.

Funding

This research was funded by TKI Deltatechnology, Rijkswaterstaat and Hoogheemraadschap Hollands Noorderkwartier. Van Oord/Boskalis and Svašek Hydraulics provided in-kind funding to the study.

Data Availability Statement

The JARKUS dataset used in this research is publicly available at https://opendap.deltares.nl/thredds/catalog/opendap/rijkswaterstaat/jarkus/profiles/catalog.html, accessed on 9 February 2021. Restrictions apply to the availability of the contractor datasets. These data were obtained from Van Oord and Boskalis and are available from the authors with the permission of Van Oord/Boskalis only.

Acknowledgments

The authors want to thank TKI Deltatechnology, the Dutch government Rijkswaterstaat, the water board Hoogheemraadschap Hollands Noorderkwartier, Svašek Hydraulics, and Msc students Linde de Jongh and Tom Pak for their support of this research. Finally, a special thanks is for the contractors Van Oord and Boskalis, who made their survey data from the Hondsbossche Dunes project available for this research.

Conflicts of Interest

The funders had no role in the design of the study; analyses, or interpretation of data; in the writing of the manuscript, or in the decision to publish the results. Van Oord, Boskalis, and Rijkswaterstaat collected the data used in this study.

References

  1. Nicholls, R.J.; Cazenave, A. Sea-level rise and its impact on coastal zones. Science 2010, 328, 1517–1520. [Google Scholar] [CrossRef]
  2. Hinkel, J.; Aerts, J.C.; Brown, S.; Jiménez, J.A.; Lincke, D.; Nicholls, R.J.; Scussolini, P.; Sanchez-Arcilla, A.; Vafeidis, A.; Addo, K.A. The ability of societies to adapt to twenty-first-century sea-level rise. Nat. Clim. Chang. 2018, 8, 570–578. [Google Scholar] [CrossRef]
  3. Dean, R.G. Beach Nourishment: Theory and Practice; World Scientific: Singapore, 2002. [Google Scholar]
  4. de Schipper, M.A.; Ludka, B.C.; Raubenheimer, B.; Luijendijk, A.P.; Schlacher, T.A. Beach nourishment has complex implications for the future of sandy shores. Nat. Rev. Earth Environ. 2021, 2, 70–84. [Google Scholar] [CrossRef]
  5. Ton, A.; Vuik, V.; Aarninkhof, S. Longshore sediment transports by large-scale lake circulations at low-energy, non-tidal beaches: A field and model study. Coast. Eng. 2022, submitted.
  6. Perk, L.; van Rijn, L.; Koudstaal, K.; Fordeyn, J. A rational method for the design of sand dike/dune systems at sheltered sites; Wadden Sea Coast of Texel, The Netherlands. J. Mar. Sci. Eng. 2019, 7, 324. [Google Scholar] [CrossRef] [Green Version]
  7. Vuik, V.; Jonkman, S.N.; Borsje, B.W.; Suzuki, T. Nature-based flood protection: The efficiency of vegetated foreshores for reducing wave loads on coastal dikes. Coast. Eng. 2016, 116, 42–56. [Google Scholar] [CrossRef] [Green Version]
  8. Bridges, T.S.; Bourne, E.M.; King, J.K.; Kuzmitski, H.K.; Moynihan, E.B.; Suedel, B.C. Engineering with Nature: An Atlas; U.S. Army Engineer Research and Development Center: Vicksburg, MI, USA, 2018. [Google Scholar] [CrossRef]
  9. de Vriend, H.J.; van Koningsveld, M.; Aarninkhof, S.G.J.; de Vries, M.B.; Baptist, M.J. Sustainable hydraulic engineering through building with nature. J. Hydro-Environ. Res. 2015, 9, 159–171. [Google Scholar] [CrossRef]
  10. Brand, E.; Ramaekers, G.; Lodder, Q. Dutch experience with sand nourishments for dynamic coastline conservation—An operational overview. Ocean. Coast. Manag. 2022, 217, 106008. [Google Scholar] [CrossRef]
  11. Stive, M.; de Schipper, M.; Luijendijk, A.; Aarninkhof, S.; van Gelder-Maas, C.; van Thiel De Vries, J.; de Vries, S.; Henriquez, M.; Marx, S.; Ranasinghe, R. A New Alternative to Saving Our Beaches from Sea-Level Rise: The Sand Engine. J. Coast. Res 2013, 29, 1001–1008. [Google Scholar] [CrossRef]
  12. de Schipper, M.A.; de Vries, S.; Ruessink, G.; de Zeeuw, R.C.; Rutten, J.; van Gelder-Maas, C.; Stive, M.J.F. Initial spreading of a mega feeder nourishment: Observations of the Sand Engine pilot project. Coast. Eng. 2016, 111, 23–38. [Google Scholar] [CrossRef] [Green Version]
  13. Pelnard-Considère, R. Essai de théorie de l’évolution des formes de rivage en plages de sable et de galets. Journées de l’hydraulique 1957, 4, 289–298. [Google Scholar]
  14. Ludka, B.C.; Guza, R.T.; O’Reilly, W.C. Nourishment evolution and impacts at four southern California beaches: A sand volume analysis. Coast. Eng. 2018, 136, 96–105. [Google Scholar] [CrossRef]
  15. Liu, G.; Cai, F.; Qi, H.; Zhu, J.; Lei, G.; Cao, H.; Zheng, J. A method to nourished beach stability assessment: The case of China. Ocean. Coast. Manag. 2019, 177, 166–178. [Google Scholar] [CrossRef]
  16. Elko, N.A.; Wang, P. Immediate profile and planform evolution of a beach nourishment project with hurricane influences. Coast. Eng. 2007, 54, 49–66. [Google Scholar] [CrossRef]
  17. Chang, J.I.; Yoon, S. The economic benefit of coastal erosion control in Korea. J. Coast. Res. 2016, 1, 1317–1321. [Google Scholar] [CrossRef]
  18. Liu, Z.; Cui, B.; He, Q. Shifting paradigms in coastal restoration: Six decades’ lessons from China. Sci. Total. Environ. 2016, 566–567, 205–214. [Google Scholar] [CrossRef] [Green Version]
  19. Gopalakrishnan, S.; Smith, M.D.; Slott, J.M.; Murray, A.B. The value of disappearing beaches: A hedonic pricing model with endogenous beach width. J. Environ. Econ. Manag. 2011, 61, 297–310. [Google Scholar] [CrossRef] [Green Version]
  20. de Vries, S.; Arens, S.; De Schipper, M.; Ranasinghe, R. Aeolian sediment transport on a beach with a varying sediment supply. Aeolian Res. 2014, 15, 235–244. [Google Scholar] [CrossRef]
  21. Walker, I.J.; Davidson-Arnott, R.G.; Bauer, B.O.; Hesp, P.A.; Delgado-Fernandez, I.; Ollerhead, J.; Smyth, T.A. Scale-dependent perspectives on the geomorphology and evolution of beach-dune systems. Earth-Sci. Rev. 2017, 171, 220–253. [Google Scholar] [CrossRef]
  22. Bauer, B.; Davidson-Arnott, R.; Hesp, P.; Namikas, S.; Ollerhead, J.; Walker, I. Aeolian sediment transport on a beach: Surface moisture, wind fetch, and mean transport. Geomorphology 2009, 105, 106–116. [Google Scholar] [CrossRef]
  23. Bruun, P. Coast Erosion and the Development of Beach Profiles; Beach Erosion Board: Washington, DC, USA, 1954. [Google Scholar]
  24. Dean, R.G. Equilibrium beach profiles: Characteristics and applications. J. Coast. Res. 1991, 7, 53–84. [Google Scholar]
  25. Galiforni Silva, F.; Wijnberg, K.M.; de Groot, A.V.; Hulscher, S.J. The effects of beach width variability on coastal dune development at decadal scales. Geomorphology 2019, 329, 58–69. [Google Scholar] [CrossRef] [Green Version]
  26. van Puijenbroek, M.E.; Limpens, J.; de Groot, A.V.; Riksen, M.J.; Gleichman, M.; Slim, P.A.; van Dobben, H.F.; Berendse, F. Embryo dune development drivers: Beach morphology, growing season precipitation, and storms. Earth Surf. Process. Landf. 2017, 42, 1733–1744. [Google Scholar] [CrossRef]
  27. Hoonhout, B.; de Vries, S. Aeolian sediment supply at a mega nourishment. Coast. Eng. 2017, 123, 11–20. [Google Scholar] [CrossRef] [Green Version]
  28. Smyth, T.A.; Hesp, P.A. Aeolian dynamics of beach scraped ridge and dyke structures. Coast. Eng. 2015, 99, 38–45. [Google Scholar] [CrossRef] [Green Version]
  29. Moulton, M.A.; Hesp, P.A.; Miot da Silva, G.; Keane, R.; Fernandez, G.B. Surfzone-beach-dune interactions along a variable low wave energy dissipative beach. Mar. Geol. 2021, 435, 106438. [Google Scholar] [CrossRef]
  30. Thornton, E.B.; MacMahan, J.; Sallenger, A.H. Rip currents, mega-cusps, and eroding dunes. Mar. Geol. 2007, 240, 151–167. [Google Scholar] [CrossRef]
  31. Cohn, N.; Ruggiero, P.; de Vries, S.; Kaminsky, G.M. New insights on coastal foredune growth: The relative contributions of marine and aeolian processes. Geophys. Res. Lett. 2018, 45, 4965–4973. [Google Scholar] [CrossRef]
  32. Wijnberg, K.M.; Terwindt, J.H.J. Extracting decadal morphological behaviour from high-resolution, long-term bathymetric surveys along the Holland coast using eigenfunction analysis. Mar. Geol. 1995, 126, 301–330. [Google Scholar] [CrossRef]
  33. Wijnberg, K.M. Environmental controls on decadal morphologic behaviour of the Holland coast. Mar. Geol. 2002, 189, 227–247. [Google Scholar] [CrossRef]
  34. Technische Adviescommissie voor de Waterkeringen. Leidraad voor de Beoordeling van Duinen als Waterkering; Technische Adviescommissie voor de Waterkeringen: The Hague, The Netherlands, 1984. [Google Scholar]
  35. van Alphen, J. De Morfologie en Lithologie van de Brandingszone Tussen Terheijde en Egmond aan Zee; Technical Report NZ-N-87.28; Rijkswaterstaat: Utrecht, The Netherlands, 1987.
  36. Kroon, A.; van Leeuwen, B.; Walstra, D.J.; Loman, G. Dealing with Uncertainties in Long-term Predictions of a Coastal Nourishment. In Coastal Management: Changing Coast, Changing Climate, Changing Minds; ICE Publishing: London, UK, 2016; pp. 9–18. [Google Scholar] [CrossRef]
  37. Rijkswaterstaat. Kenmerkende Waarden, Getijgebied 2011.0; RWS Centrale Informatievoorziening: Delft, The Netherlands, 2013.
  38. van Rijn, L.C. Sediment transport and budget along the Dutch coastal zone. Coast. Eng. 1997, 32, 61–90. [Google Scholar] [CrossRef]
  39. Rijkswaterstaat. Kustlijnkaartenboek 2019; Ministerie van Infrastructuur en Waterstaat, Rijkswaterstaat: Utrecht, The Netherlands, 2018.
  40. Rijkswaterstaat. Kustlijnkaartenboek 2021; Ministerie van Infrastructuur en Waterstaat, Rijkswaterstaat: Utrecht, The Netherlands, 2020.
  41. Rijkswaterstaat. Nourishments along the Dutch Coast Since 1952. Available online: https://opendap.deltares.nl/thredds/catalog/opendap/rijkswaterstaat/suppleties/catalog.html (accessed on 12 April 2021).
  42. van Gent, M.R.; van Thiel de Vries, J.S.; Coeveld, E.M.; de Vroeg, J.H.; van de Graaff, J. Large-scale dune erosion tests to study the influence of wave periods. Coast. Eng. 2008, 55, 1041–1051. [Google Scholar] [CrossRef]
  43. Den Heijer, C.K.; Baart, F.; van Koningsveld, M. Assessment of dune failure along the Dutch coast using a fully probabilistic approach. Geomorphology 2012, 143–144, 95–103. [Google Scholar] [CrossRef]
  44. Rijkswaterstaat. Annual Cross-Shore Transect Bathymetry Measurements along the Dutch Coast Since 1965. Available online: https://opendap.deltares.nl/thredds/catalog/opendap/rijkswaterstaat/jarkus/profiles/catalog.html (accessed on 9 February 2021).
  45. de Vries, S.; Southgate, H.N.; Kanning, W.; Ranasinghe, R. Dune behavior and aeolian transport on decadal timescales. Coast. Eng. 2012, 67, 41–53. [Google Scholar] [CrossRef]
  46. Smith, A.; Houser, C.; Lehner, J.; George, E.; Lunardi, B. Crowd-sourced identification of the beach-dune interface. Geomorphology 2020, 367, 107321. [Google Scholar] [CrossRef]
  47. Quartel, S.; Kroon, A.; Ruessink, B.G. Seasonal accretion and erosion patterns of a microtidal sandy beach. Mar. Geol. 2008, 250, 19–33. [Google Scholar] [CrossRef]
  48. Ludka, B.C.; Gallien, T.W.; Crosby, S.C.; Guza, R.T. Mid-El Niño erosion at nourished and unnourished Southern California beaches. Geophys. Res. Lett. 2016, 43, 4510–4516. [Google Scholar] [CrossRef] [Green Version]
  49. Yates, M.L.; Guza, R.T.; O’Reilly, W.C. Equilibrium shoreline response: Observations and modeling. J. Geophys. Res. Ocean. 2009, 114. [Google Scholar] [CrossRef] [Green Version]
  50. Griggs, G.B.; Patsch, K. Natural changes and human impacts on the sand budgets and beach widths of the Zuma and Santa Monica littoral cells, Southern California. Shore Beach 2018, 86, 1–14. [Google Scholar]
  51. Park, J.Y.; Gayes, P.T.; Wells, J.T. Monitoring Beach Renourishment along the Sediment-Starved Shoreline of Grand Strand, South Carolina. J. Coast. Res. 2009, 25, 336–349. [Google Scholar] [CrossRef]
  52. Marinho, B.; Coelho, C.; Larson, M.; Hanson, H. Short- and long-term responses of nourishments: Barra-Vagueira coastal stretch, Portugal. J. Coast. Conserv. 2018, 22, 475–489. [Google Scholar] [CrossRef]
  53. Larson, M.; Hanson, H.; Kraus, N.C.; Newe, J. Short- and long- term responses of beach fills determined by eof analysis. J. Waterw. Port Coasta Ocean Eng. 1999, 125, 285–293. [Google Scholar] [CrossRef]
  54. Browder, A.E.; Dean, R.G. Monitoring and comparison to predictive models of the Perdido Key beach nourishment project, Florida, USA. Coast. Eng. 2000, 39, 173–191. [Google Scholar] [CrossRef]
  55. Roest, B.; de Vries, S.; de Schipper, M.; Aarninkhof, S. Observed changes of a mega feeder nourishment in a coastal cell: Five years of sand engine morphodynamics. J. Mar. Sci. Eng. 2021, 9, 37. [Google Scholar] [CrossRef]
  56. Verhagen, H.J. Analysis of beach nourishment schemes. J. Coast. Res. 1996, 12, 179–185. [Google Scholar]
  57. Dean, R.G.; Yoo, C. Beach-Nourishment Performance Predictions. J. Waterw. Port Coast. Ocean. Eng. 1992, 118, 567–586. [Google Scholar] [CrossRef]
  58. Bezzi, A.; Fontolan, G.; Nordstrom, K.F.; Carrer, D.; Jackson, N.L. Beach nourishment and foredune restoration: Practices and constraints along the venetian Shoreline, Italy. J. Coast. Res. 2009, 1, 287–291. [Google Scholar]
  59. Cohn, N.; Ruggiero, P.; García-Medina, G.; Anderson, D.; Serafin, K.A.; Biel, R. Environmental and morphologic controls on wave-induced dune response. Geomorphology 2019, 329, 108–128. [Google Scholar] [CrossRef] [Green Version]
  60. Itzkin, M.; Moore, L.J.; Ruggiero, P.; Hacker, S.D.; Biel, R.G. The relative influence of dune aspect ratio and beach width on dune erosion as a function of storm duration and surge level. Earth Surf. Dyn. 2021, 9, 1223–1237. [Google Scholar] [CrossRef]
  61. van der Wal, D. Beach-Dune Interactions in Nourishment Areas along the Dutch Coast. J. Coast. Res. 2004, 20, 317–325. [Google Scholar] [CrossRef]
  62. Athanasiou, P.; van Dongeren, A.; Giardino, A.; Vousdoukas, M.; Antolinez, J.A.; Ranasinghe, R. A Clustering Approach for Predicting Dune Morphodynamic Response to Storms Using Typological Coastal Profiles: A Case Study at the Dutch Coast. Front. Mar. Sci. 2021, 8, 747754. [Google Scholar] [CrossRef]
  63. den Heijer, C. The Role of Bathymetry, Wave Obliquity and Coastal Curvature in Dune Erosion Prediction. Ph.D. Thesis, Delft University of Technology, Delft, The Netherlands, 2013. [Google Scholar]
  64. Silva, F.G.; Wijnberg, K.M.; de Groot, A.V.; Hulscher, S.J.M.H. On the importance of tidal inlet processes for coastal dune development. Coast. Dyn. Proc. 2017, 104, 106–110. [Google Scholar] [CrossRef]
  65. Wijnberg, K.; Poppema, D.; Mulder, J.; van Bergen, J.; Campmans, G.; Galiforni-Silva, F.; Hulscher, S.; Pourteimouri, P. Beach-dune modelling in support of Building with Nature for an integrated spatial design of urbanized sandy shores. Res. Urban. Ser. 2021, 7, 241–259. [Google Scholar] [CrossRef]
  66. de Vries, S.; van Thiel de Vries, J.S.; van Rijn, L.C.; Arens, S.M.; Ranasinghe, R. Aeolian sediment transport in supply limited situations. Aeolian Res. 2014, 12, 75–85. [Google Scholar] [CrossRef]
  67. Thieler, E.R.; Pilkey, O.H.; Young, R.S.; Bush, D.M.; Chai, F. The use of mathematical models to predict beach behavior for U.S. coastal engineering: A critical review. J. Coast. Res. 2000, 16, 48–70. [Google Scholar]
  68. Ranasinghe, R. On the need for a new generation of coastal change models for the 21st century. Sci. Rep. 2020, 10, 2010. [Google Scholar] [CrossRef] [PubMed]
  69. Weathers, H.; Voulgaris, G. Evaluation of beach nourishment evolution models using data from two South Carolina, USA beaches: Folly Beach and Hunting Island. J. Coast. Res. 2013, 69, 84–98. [Google Scholar] [CrossRef]
  70. Hanson, H. Genesis-A Generalized Shoreline Change Numerical Model. J. Coast. Res. 1988, 5, 1–27. [Google Scholar]
  71. Dabees, M.; Kamphuis, J.W. ONELINE, a numerical model for shoreline change. Proc. Int. Conf. Coast. Eng. 1998, 1, 2668–2681. [Google Scholar]
  72. Hurst, M.D.; Barkwith, A.; Ellis, M.A.; Thomas, C.W.; Murray, A.B. Exploring the sensitivities of crenulate bay shorelines to wave climates using a new vector-based one-line model. J. Geophys. Res. Earth Surf. 2015, 120, 2586–2608. [Google Scholar] [CrossRef] [Green Version]
  73. Roelvink, D.; Huisman, B.; Elghandour, A.; Ghonim, M.; Reyns, J. Efficient Modeling of Complex Sandy Coastal Evolution at Monthly to Century Time Scales. Front. Mar. Sci. 2020, 7, 535. [Google Scholar] [CrossRef]
  74. Hallermeier, R.J. A profile zonation for seasonal sand beaches from wave climate. Coast. Eng. 1981, 4, 253–277. [Google Scholar] [CrossRef]
  75. Hallermeier, R.J. Sand Transport Limits in Coastal Structure Design. In Coastal Structures’83; American Society of Civil Engineers: Reston, VA, USA, 1983; pp. 703–716. [Google Scholar]
  76. Mulder, J.P.; Tonnon, P.K. “Sand Engine”: Background and Design of a Mega-Nourishment Pilot in the Netherlands. Coast. Eng. Proc. 2011, 1, 35. [Google Scholar] [CrossRef]
  77. Bodde, W.; McCall, R.; Jansen, M.; van den Berg, A.; Roelvink, J. Long-term morphological modelling: Combining storm impact and daily conditions in an integrated modeling framework. In Proceedings of the Coastal Dynamics 2017, Helsingør, Denmark, 12–16 June 2017; pp. 1809–1820. [Google Scholar]
  78. Luijendijk, A.; Velhorst, R.; Hoonhout, B.; de Vries, S.; Ranasinghe, R. Integrated Modelling of the Morphological Evolution of the Sand Engine Mega-Nourishment. Proc. Coast. Dyn. 2017 2017, 1874–1885. [Google Scholar]
  79. Itzkin, M.; Moore, L.J.; Ruggiero, P.; Hovenga, P.A.; Hacker, S.D. Combining process-based and data-driven approaches to forecast beach and dune change. Environ. Model. Softw. 2022, 153, 105404. [Google Scholar] [CrossRef]
Figure 1. (a) Hondsbossche sea dike before placement of the nourishment (courtesy of Rijkswaterstaat, https://beeldbank.rws.nl/, accessed on 6 September 2021) and (b) the Hondsbossche Dunes Nourishment just after placement in April 2015 (courtesy of Aannemerscombinatie Zwakke Schakel–Van Oord-Boskalis). The orange line marks the crest of the original sea dike.
Jmse 10 01152 g001
Figure 3. Timeline of the survey data. Three datasets are used: 1. JARKUS surveys covering the full coastal cell; 2. Contractor surveys covering the 9 km project site; 3. Contractor transect surveys of 11 profiles with high temporal resolution shortly after the construction period. Red vertical line indicates the formal end of construction; black vertical lines bound the additional 2018 beach nourishment period. Yellow dots indicate subaerial surveys; blue dots indicate surveys that include both subaerial and subaqueous data.
Jmse 10 01152 g003
Figure 4. Schematic cross-shore profile to illustrate the various profile parameters extracted from the survey data. NAP is the Dutch reference level, roughly equal to mean sea level.
Jmse 10 01152 g004
Figure 5. Bed elevation data shortly after construction in May 2015 (panel (a)) and after five years in April 2020 (panel (b)). Colors show the bed elevation in meters with respect to the NAP datum (approximately MSL). Panel (c)) represents the erosion (blue colors) and sedimentation (red colors) between the two surveys five years apart. The black dotted contour lines are based on the bed elevation of May 2015 (in panel (a)/(c)) or 2020 (in panel (b)) and indicate the −10, −4.8, 0, and 3 m + NAP isobaths. The black solid lines delineate the nourishment boundaries (km 18.8–28). The location of the additional 2018 beach nourishment is indicated with the black polygon.
Jmse 10 01152 g005
Figure 6. Bed levels on three cross-shore transects. (a) Northern transect at km 19.1. (b) Central transect at km 24.0. (c) Southern transect at km 26.06. Colors show the different surveys in time. (d) the location of the transects in plan view. 0 m + NAP is approximately MSL.
Jmse 10 01152 g006
Figure 7. Volume change above −10 m + NAP since April 2015 in three alongshore sections. (a) The center of the project (km 20.23 to 27) (orange), the adjacent beach north (km 18.8 to 20.23) (blue), the adjacent beach south (km 27 to 28) (green), and the total volume change for all sections combined (black). The black arrow indicates the moment and size of the additional 2018 nourishment of ±1·10 6 m 3 . (b) Top view of the nourishment and locations of the volume polygons.
Jmse 10 01152 g007
Figure 8. Volume change over time for transects at km 19.1, 21.23, 22.63, 24, 25.31, 26.06, and 28. (a) Location of transects (colored lines) and 2018 nourishment (dashed contour), (b) Profile-integrated volume change (>−10 m + NAP), (c) Dune volume change (>3 m + NAP), and (d) lower shoreface volume change (between 10 and −4.8 m + NAP). The black dotted vertical lines indicate the period of the additional 2018 beach nourishment between km 25 and 27.
Jmse 10 01152 g008
Figure 9. Volumetric evolution of North-Holland coast with the nourished section in between the black vertical lines (JARKUS dataset only). (a) Cross-shore position of the waterline (relative to the waterline position at km 0.2), the position the prenourishment waterline in black stripes. (b) Orientation of the waterline. (c) Yearly profile-integrated volume change (>−10 m + NAP). (d) Yearly volume change in the beach and surfzone (−4.8 m + NAP and 3 m + NAP). (e) Yearly dune volume change (above 3 m + NAP). (f) Yearly volume change on the shoreface (−10 m + NAP to −4.8 m + NAP). Blue shadings gives the ± σ interval and solid blue lines the average over the period April 2015–April 2020. The gray blocks indicate the nourishment volumes placed within the coastal cell in the period April 2015–April 2020.
Jmse 10 01152 g009
Figure 10. Surf and intertidal zone slope (−4.8/1 m + NAP) adaptation in time. (a) Location of transects and 2018 nourishment; (b) slope at initially steeper profiles at km 19.1, 20.23, 26.06, and 27.16; (c) slope at initially smoother profiles at km 21.23, 22.63, 24.0, 25.31, and 28.0. The black dotted horizontal lines indicate the μ ± σ profile steepness of the adjacent coast. The black dotted vertical lines indicate the period of additional beach nourishment between km 25 and 27.
Jmse 10 01152 g010
Figure 11. Dune evolution of North-Holland coast with the nourished section in between black lines (JARKUS dataset only). (a) Cross-shore position of the waterline (relative to the waterline position at km 0.2); the position of the prenourishment waterline is in black stripes. (b) Orientation of the dune foot. (c) Dune volume change, above 3 m + NAP. (d) Dune foot position change. (e) Beach width.
Jmse 10 01152 g011
Figure 12. Beach width in time for transects 19.1, 21.23, 22.63, 24, 25.31, 26.06, and 28. (a) Location of transects. (b) Beach width. (c) Waterline position change. (d) Dune foot position change. The black dotted horizontal lines indicate the μ ± σ beach width at the adjacent coast. The black dotted vertical lines indicate the period of the additional 2018 beach nourishment. Eroding and accretive transects are marked with circle and triangle symbols, respectively.
Jmse 10 01152 g012
Figure 13. Correlations of profile volume change, beach width, coastline position, and coastline gradient. (a) Correlation of profile volume change and beach width change, (b) coastline gradient and beach width change, (c) coastline position change and volume change, and (d) coastline gradient and volume change. Data points are for the project area only and based on JARKUS dataset, for the period between April 2015 and 2020. Observations marked with a cross are treated as outliers in the determination of the correlation coefficients. Beach width changes at these locations are dominated by alongshore infilling of a local stepback in the dunefront at the edge of the original sea dike (see Figure 11a,d km 20–20.5).
Jmse 10 01152 g013
Figure 14. Schematic view of observed cross-shore behavior at the Hondsbossche Dunes nourishment including an increase in dune volume and equilibration of beach width, modified from [16].
Jmse 10 01152 g014
Figure 15. Correlations of beach width and volume changes. (a) Correlation of volume change below 3 m + NAP and volume change above 3 m + NAP; (b) average beach width and dune foot position change; (c) average intertidal beach width and volume change above 3 m + NAP at the Hondsbossche Dunes; and (d) average beach width and volume change above 3 m + NAP at the NNH coast for the period between April 2015 and 2020. All values are based on the JARKUS dataset only. Observations marked with a cross are treated as outliers in the determination of the correlation coefficient. At these locations, dune foot changes are dominated by an alongshore infilling of a local stepback in the dune front at the edge of the original sea dike (Figure 11a,d km 20–20.5) or beach width and dune volume cannot be determined appropriately according to our definition due to a local opening in the dune in front of the lagoon (Figure 11e km 26.5).
Jmse 10 01152 g015
Table 1. Total nourishment volumes [ × 10 6 m 3 / y] at the NH coast [41].
SectionNorthHDSouthTotal
Period\KM5–18.818.8–2828–505–50
1986–20150.650.250.651.55
2015–20200.5571.48.95
Publisher’s Note: MDPI stays neutral with regard to jurisdictional claims in published maps and institutional affiliations.

