Abstract
In this paper, a hydraulic model experiment was conducted to investigate the mechanism of longshore sediment transport on a sloping beach of 1:7 using a circular wave tank equipped with a spiral wave maker. The experimental results revealed that cross-shore sediment transport was predominant up to the formation of equilibrium cross-section. Then the longshore sediment transport was actively dominant near the bar after the development of equilibrium topography. The wave-breaking positions and the characteristics of sand displacement in the vicinity of the wave-breaking zone were observed throughout the installation of fluorescent sands in different cross-sections under several wave conditions on the same terrain to presume the coastal erosion. From the outcomes, it was confirmed that the gradient of the average water level due to the obliquely incident waves breaking and the differences in breaking positions along the shoreline accelerated the generation of longshore currents and longshore sediment transport in the sloping beach profile. Moreover, the actively longshore sediment transport tendency throughout the breaking waves and the longshore current had been confirmed in this study where the gradually increasing wave heights influenced the stronger degree of wave breaking on the sloping beach, which enhanced the sediment transport procedure to deform the beach profile.
1. Introduction
Coastal erosion and nearshore beach profile changes are becoming important issues in coastal protection and disaster prevention for their devastating characteristics on beach deformation and the declination of coastal areas and drawing more attention from coastal and marine engineering researchers to find out the effective countermeasures against the coastal erosion. Several researchers have represented the bad impact of coastal erosion on coastal areas and suggested functional procedures to control the extremity of coastal erosion and coastal management [1,2,3,4,5]. The displacement of the sediment is typically driven by the action of waves, currents, winds, and other natural or human factors. Generally, the wind-generated waves break on the surf zone and move on the shore angularly and parallelly along the shoreline and displace the sand following the mechanisms of cross-shore and longshore sediment transport, which are the main factors of beach deformation. Although coastal erosion has already been identified, there stills remains room for research to propose effective resistance against beach erosion and coastal management. Several researchers have studied sand displacement procedures and beach deformation in different circumstances based on field observations, hydraulic model experiments, and numerical modeling’s. Past field studies, it was reported that coastal erosion depends on hydraulic forces, wave propagation, breaker type, and mean offshore directed current (undertow) velocity [1,6,7]. Puleo et al. [8] found the profiles of backwash and uprush were different at the same temporal phases; the offshore directed current velocity and the imbalance of sediment flux were also the factors of sediment distribution and beach erosion [5,9]. Besides field studies, researchers have also investigated the coastal erosion processes in the laboratory using a rectangular wave tank [10,11,12,13,14,15,16,17] and represented a relationship between accretion and erosion with wave breaking position and wave propagation [11,12]. Ozolcer [13] studied the geometric characteristics of the eroded beach profiles in a wave flume, and Kobayashi [14] observed that the sediment transport rate approached a steady state, whereas the beach profile approached the equilibrium state and the transportation rates in coarser sand and fine sand were different [15]. However, it is difficult to generate the longshore current in the rectangular wave tank avoiding the sidewall disturbance that should be minimized to ensure the uniformity of the longshore current and explain the sedimentation process properly. To minimize the sidewall effects, a passive recirculation system was considered by researchers [18,19,20,21], as far Mizuguchi et al. [18] firstly introduced the passive system, and Visser [19] gave suggestions about the longshore current circulation to maintain longshore uniformity. Hamilton et al. [20] observed the maximum longshore current velocity located on the bar, whereas the wave breaking was most severe, and the characteristics of longshore currents on mild and steep slopes cases were studied in [21]. Although the water recirculation system could not ensure the uniformity of longshore current properly, however, this system was helpful in clarifying the sedimentation differences in different sloping conditions. On the other hand, beach profile changes were investigated numerically by several researchers [22,23,24,25,26,27,28]; among whom the influence of generated turbulence and the incident wave angles on the beach profile changes and wave nonlinearity were explained in [22,23]. Sasaoka et al. [24] and Xiao et al. [25] figured out the significant impact of sediment grain size, bottom slope, and downstream flow on accretion and erosion procedure on the upper beach face cross-sectional area. Huang et al. [27] considered a piston-type wave maker to simulate the small and large amplitude wave generation. The simulation time needed relatively longer for berm formation than for berm erosion [28]. However, the longshore current generation and uniformity were not considered in the above studies, which were investigated in the physical experiment studies. Furthermore, the reproduction of longshore current is difficult due to the lack of enough longshore length in a rectangular basin, which could be overcome by replacing the wave generator and wave tank with a circular type and reproducing the longshore current along the circumference without the effect of wave tank boundary. Dalrymple and Dean [29] firstly proposed a circular wave-making tank that allowed waves to be obliquely incident on the shoreline without the effects of sidewall boundary. They suggested that the wave maker should be non-rotational, and the eccentricity of the wave maker needed to be smaller to ensure wave harmony. Mei [30] introduced a shoaling formula for spiral wave generation. Trowbridge et al. [31] derived a relationship between wavelength, wave maker radius and water depth. Still, the gap between the basin floor and the bottom of the cylindrical wave maker was not considered in the analysis. Williams and McDougal [32] considered the analysis and observed that the required power for wave generation was decreased with the increase of the gap and this gap should be controlled carefully to obtain consistent results. On the other hand, Suh and Dalrymple [33] reported that the incident wave angle and wave amplitude were decayed on the milder sloping beach. Within the existing studies, most of the researchers used off-center rotating solid circular cylinders to generate spiral waves, whereas wave amplitude and incidence wave angle was fixed by the cylinder diameter; also, a larger and heavier cylinder was required to keep the eccentricity smaller to obtain the desired wave height. Moreover, eccentricity limits the generation of waves in different wave conditions. Not many experimental studies have considered the non-rotational spiral wave maker to generate spiral waves and propagate angularly along the beach. So far, the University of Delaware and Oregon State University [34] have set up circular wave-making tanks for studying longshore drift.
In this study, the mechanisms of longshore and cross-shore sediment transport and beach profile changes have been investigated in different wave conditions on a sloping beach using a circular wave tank. This tank has enough longshore length to reproduce the longshore current along the alongshore direction without the influence of wave reflection by the sidewall edges during the experiment, which was not possible in a rectangular wave tank. Considering this circular wave tank, it has been possible to ensure the recirculation and uniformity of the generated longshore current along the circular beach profile during the experiment, which was addressed as a problem in the previous research on beach deformation where a passive recirculation system was considered [18,19,20,21], although the water recirculation system could not ensure the uniformity of longshore current properly and minimize the sidewall effects. A non-rotating spiral wave maker has been considered to generate spiral waves along the circular beach profile without the influence of a significant gap between the wave maker and the basin floor, which was a problem in off-rotating solid circular cylinder wave-maker cases reported in previous studies [32,33]. The experimental setup and the measurement procedures have been discussed in Section 2. The wave heights, wave periods, and wave amplitude are controlled by the rotation speed of the wave-making device in the experiment in which the wave amplitude was fixed by the cylinder diameter in the previously considered solid cylinder wave-making cases [29,31]. Section 3 presents the experimental results of wave characteristics, topographical changes, and sediment transport in the cases, whereas the two types of topography were considered during the experiments. The processes of wave generation and propagation, wave breaking properties, and bar and berm formation are described in this section. Besides these, the stable wave formation during the experiment has been confirmed in each case, and the mechanism of longshore sediment transport in different wave conditions has been explained clearly in this section. The sand displacement procedures suggest a relationship between the downstream and the longshore sediment transport on the sloping beach profile. Finally, an assumption has been given about the future research of longshore sediment transport in the conclusion section.
2. Experiment Model Set-Up and Wave Conditions
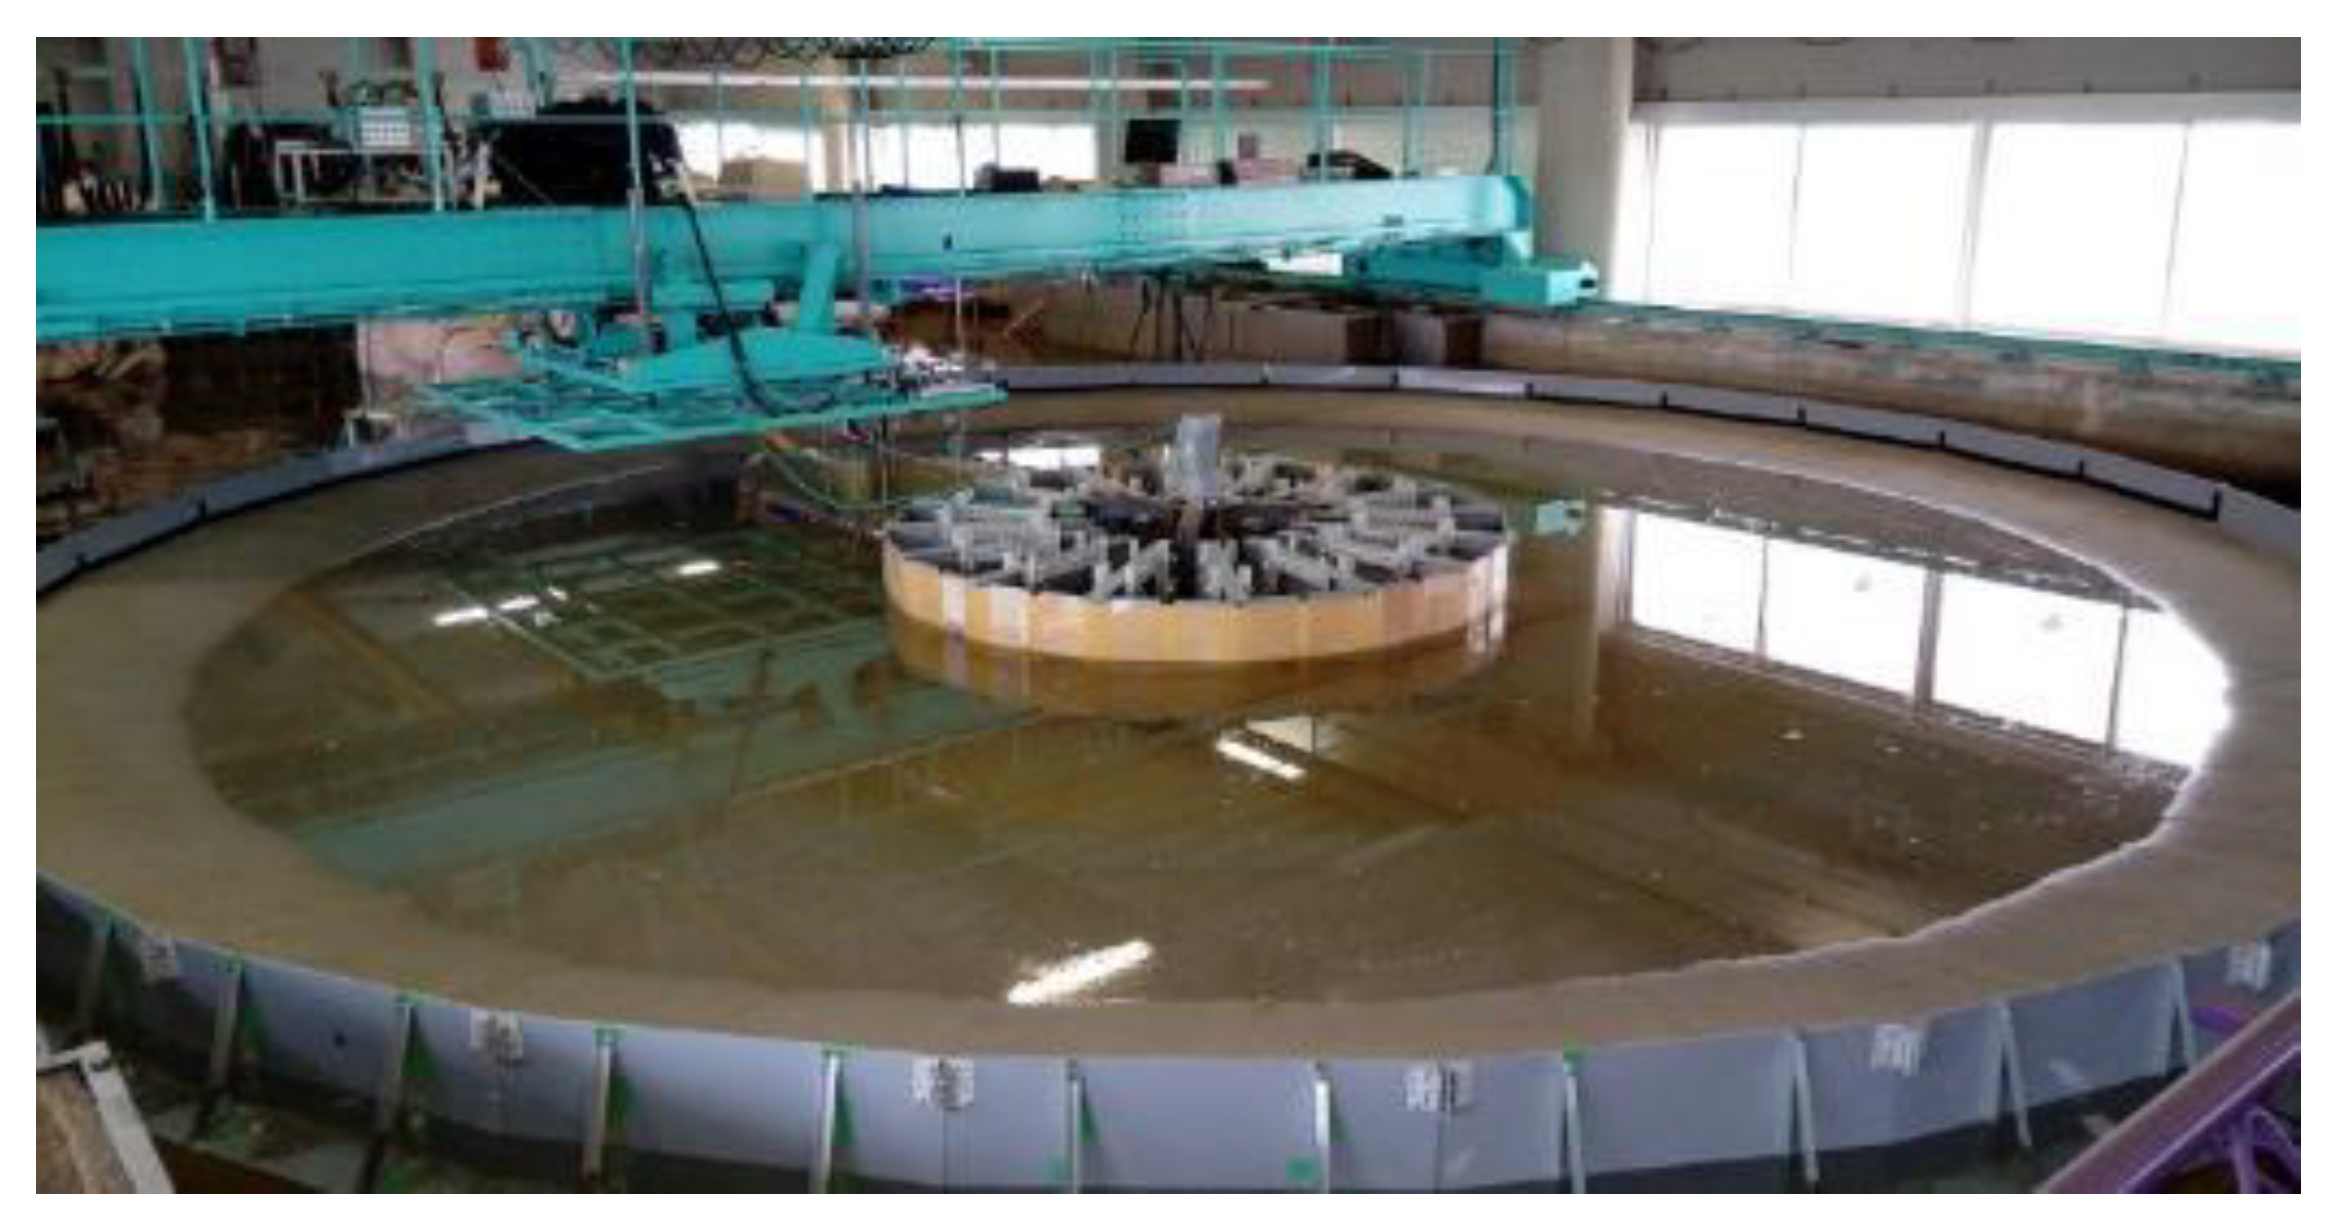
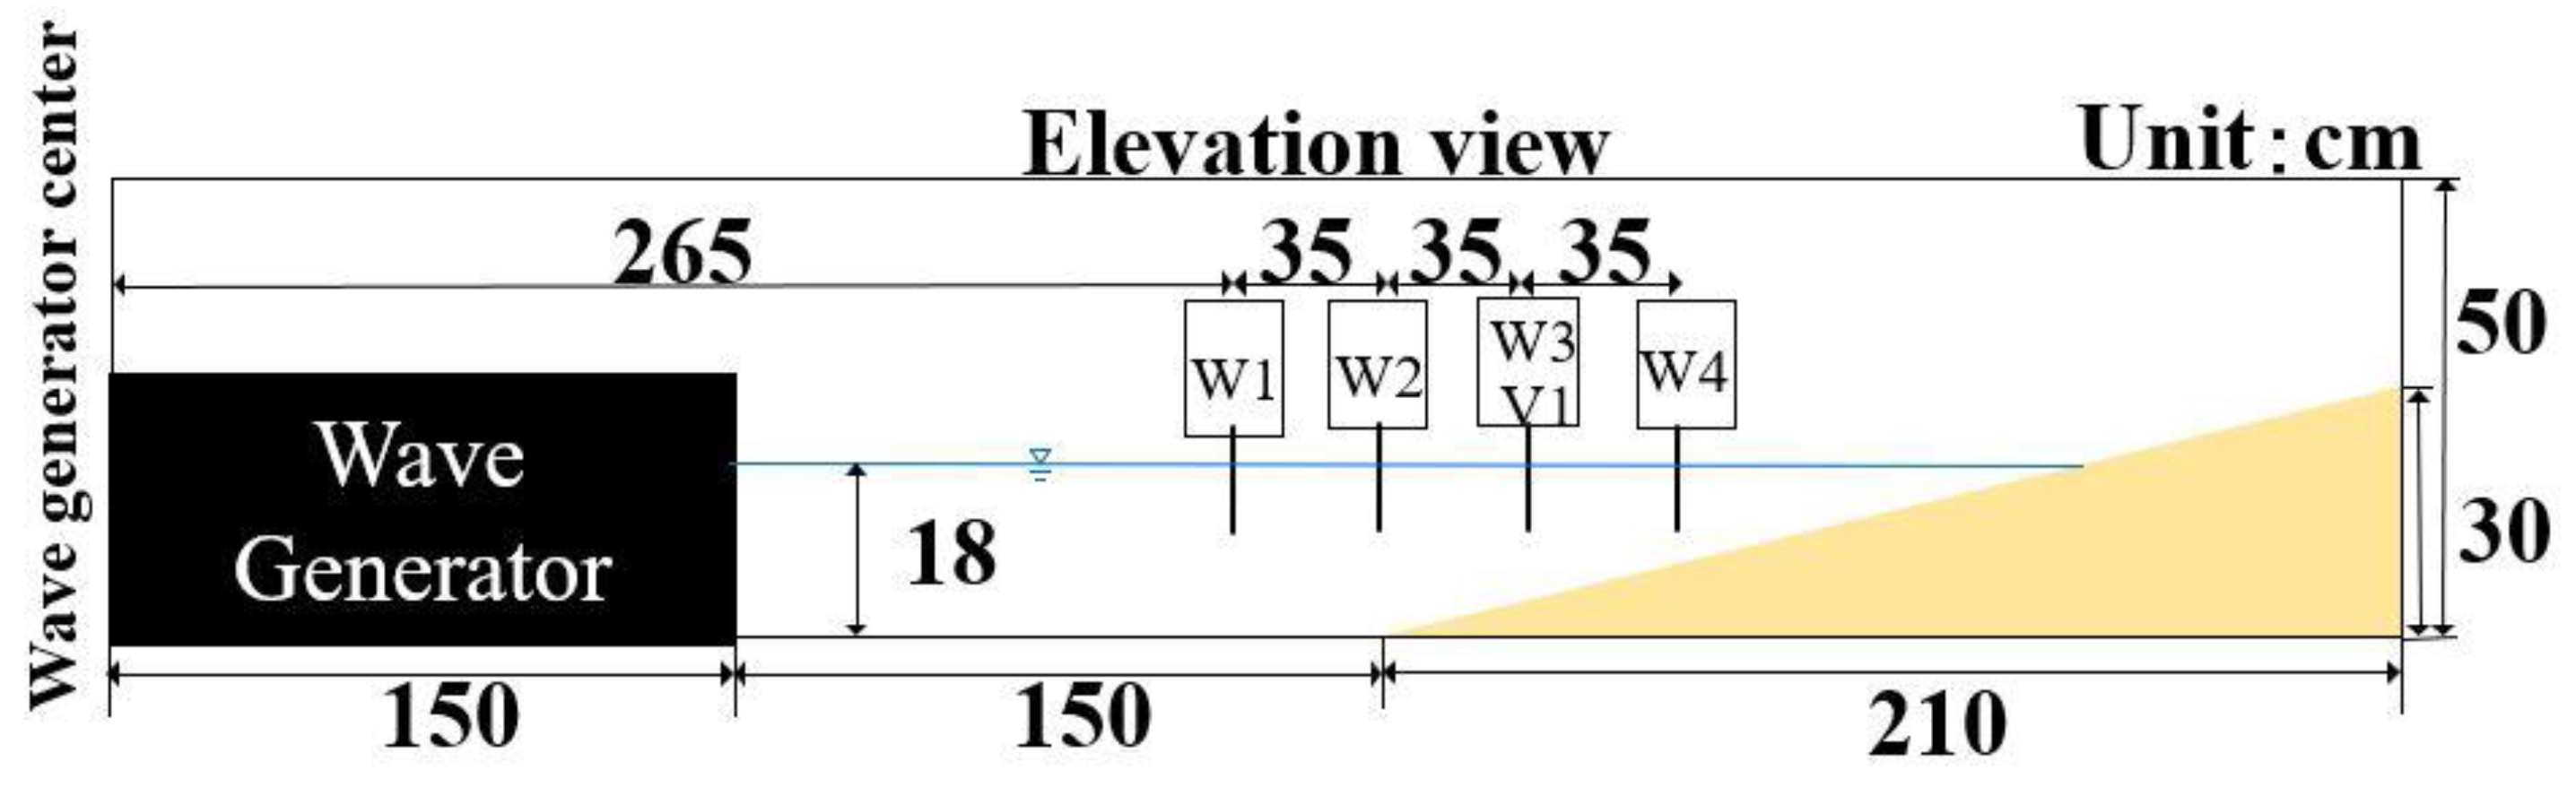
The experiments were performed with a circular wave tank, set up in the hydraulic experiment laboratory at Nagoya University, with a diameter of 10.2 m and 0.5 m in height, as shown in Figure 1. A non-rotating spiral wave-making device of 3 m in diameter, consisting of 16 piston-type wave-making paddles, was installed in the central position of the wave tank to generate the spiral waves that were obliquely incident on the sloping beach. The position and shifting procedures (back and forth) of paddles were set up in the following way that could generate waves on a circular beach without sidewall edges, similar to the proposed circular wave-making tank of Dalrymple and Dean [29]. The outer peripheral wall of the water tank was made of 32 vertical vinyl chloride boards, fixed with the same measured another 32 horizontal vinyl chloride boards and reinforced by aluminum frames. A motor (Model-G3F32N20-MD15TNNTN, Nissei Corporation, Aichi, Japan) with a crankshaft was placed in the central position of the wavemaker; the crankshaft was attached with pistons for moving the wave paddles and paired with an inverter (Yaskawa-J1000, Yaskawa Electric Corporation, Fukuoka, Japan) to control the rotational speed of the motor. The incident wave period was adjusted throughout the rotation speed of the paddles. The stroke length of the wave-making paddles was fixed at a constant value, so it was not possible to control the wave height and period independently, which were determined only by the rotational speed of the motor. A sloping beach topography with silica sands of a median grain size of approximately 0.4 mm (d50) was set up along the outer circumference of the basin, and the horizontal distance from sidewall to the toe of the slope was 210 cm with a maximum vertical length of 30 cm. Two types of initial topography were targeted in this study, one a uniform slope of 1:7 (Figure 2) and another topography that formed after experimenting on the uniform slope for up to 60 min. Sand displacement was observed by setting fluorescent sands with different colored fluorescent paints in the radial direction on the surface of the beach topography, and fluorescent sands irradiation was visualized by setting black light in the vicinity of the fluorescent sand cross-sectional area. Topographical changes were measured through a laser displacement meter (KEYENCE-LR-TB5000C, Keyence Corporation, Osaka, Japan) on the cross-sectional area before and after the experiments named cross-section 1 and confirmed that the initial topography had a predetermined shape. The experiments were captured by cameras (Panasonic-DMC-GH4; FUJIFILM-FinePix-XP140, Japan) set up in different locations to record the situation of drifting sands. The topography was also measured in the cross-sectional area where the berm development and shoreline receding were remarkable. Besides these, the wave characteristics, water surface fluctuations, and flow velocities were measured by a capacitance-type wave gauge (KENEK: CHT6-30, Kenek Corporation, Tokyo, Japan) positioned at four points W1 to W4 and an electro-magnetic velocimeter (KENEK: VMT2-200-04PL, Kenek Corporation, Tokyo, Japan) at V1 in the same cross-section typical to the coastline as shown in Figure 2. In this study, a total number of 8 cases (Table 1) were conducted, whereas the uniform slope cases were denoted by cases 1, 2, 3, and 4, and the cases in which the final terrains of cases 1 to 4 were considered as the initial terrains, denoted by case 1a, 2a, 3a, 4a, respectively; the water depth was fixed at 18 cm in all cases. The wave periods were measured by considering the rotation speed (RPM) of the wave generator per min. For example, under the condition of 30 rpm, 30 rotations are performed per minute, so the period of the generated wave is 2.0 s. The incident wave angle, mean water level, and wave set-up were not measured in this study. Still, an additional set-up of the wave and velocity gauges was considered to confirm the axial symmetry of the circular water tank at 22.5° away from cross-section 1, defined as cross-section 2, as shown in Figure 3. Within the experimental time, the sand displacement procedures and the profiles of velocity and water surface fluctuations were settled down after a while, and the beach deformation due to erosion and deposition was sufficiently smaller during the experiment. The wave formation in the settled-down situation was defined as the stable wave formation, and the topography is considered the equilibrium topography in this study.

Figure 1.
Circular wave-making water tank.

Figure 2.
Initial topographic cross-section, W: wave gauge, V: velocity gauge.

Table 1.
Experimental conditions.
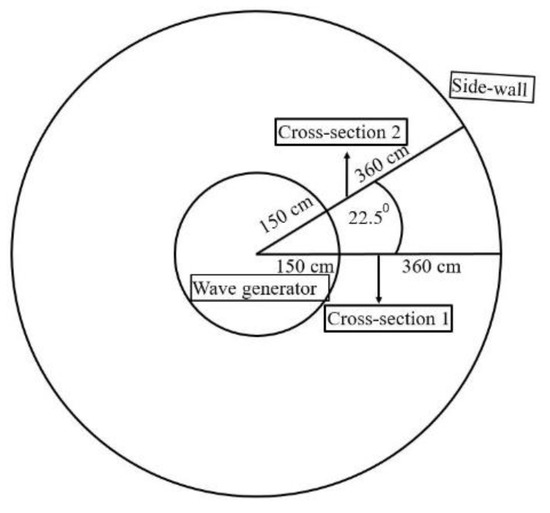
Figure 3.
Plain view with two-cross-sectional measurement locations.
3. Results and Discussions
The experimental results have been investigated from the viewpoint of wave characteristics, topographical changes, and dynamic characteristics of sand displacement under two sloping conditions in the circular wave-making tank.
3.1. Wave Characteristics
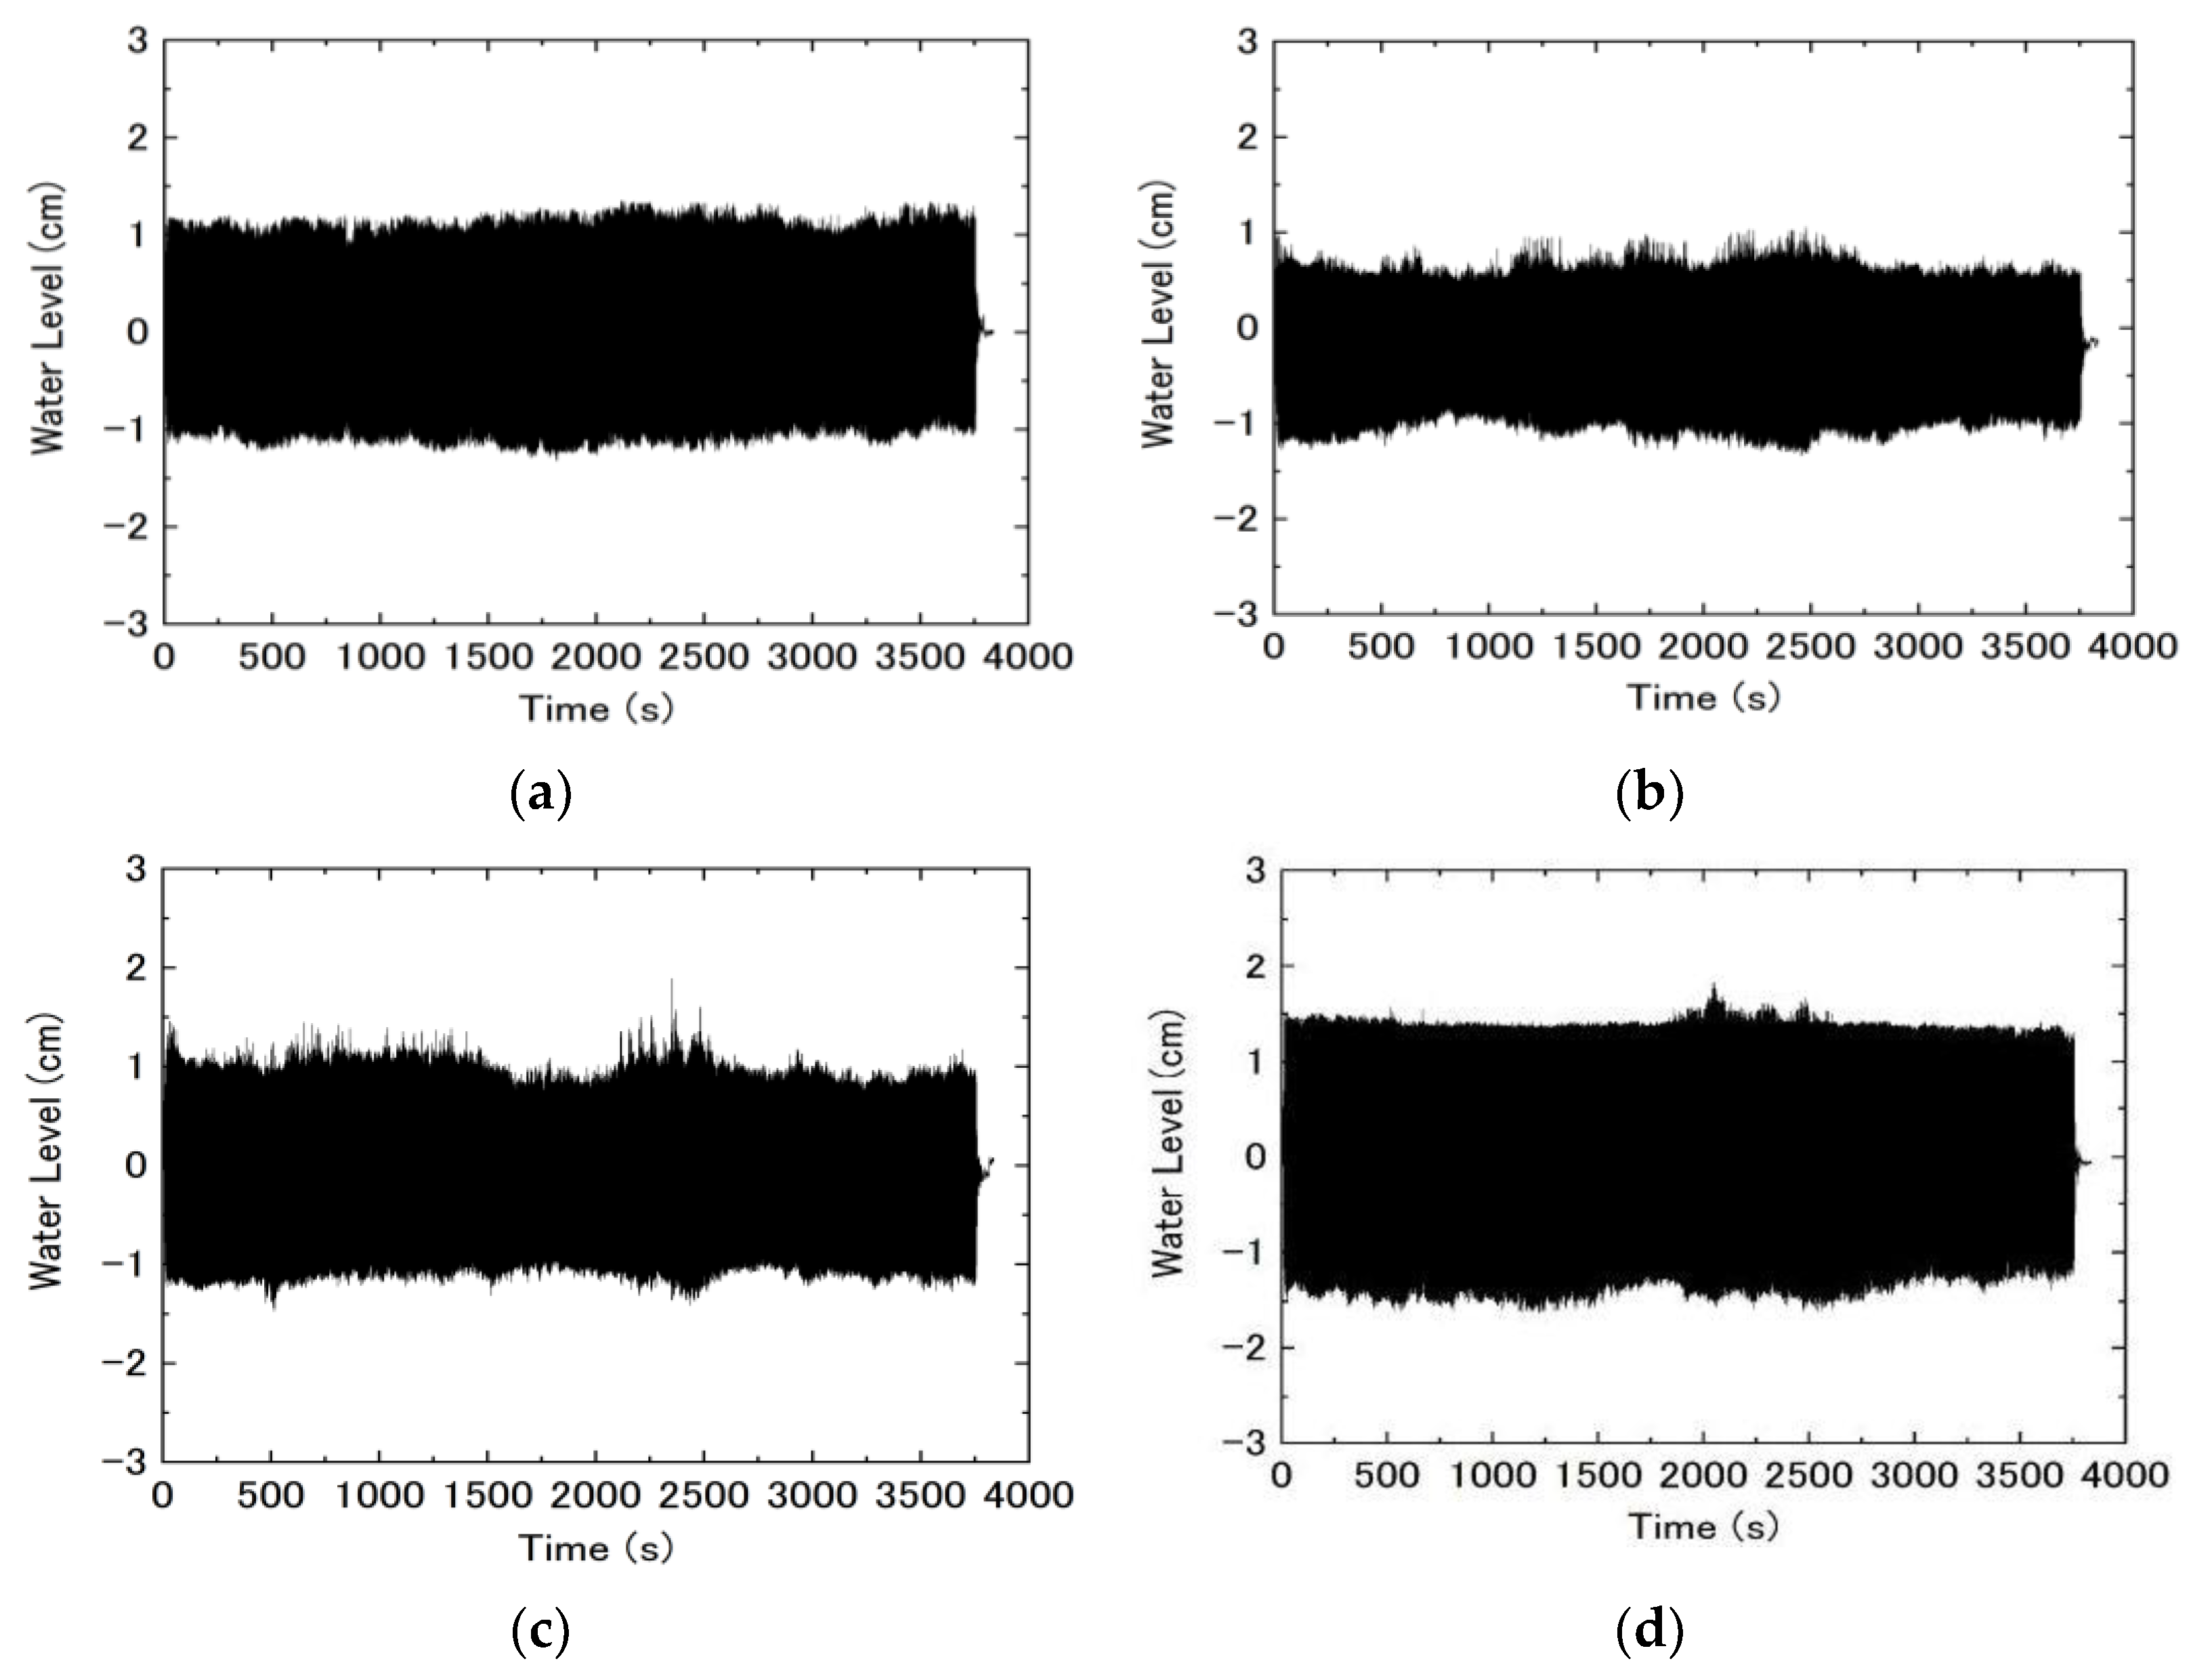
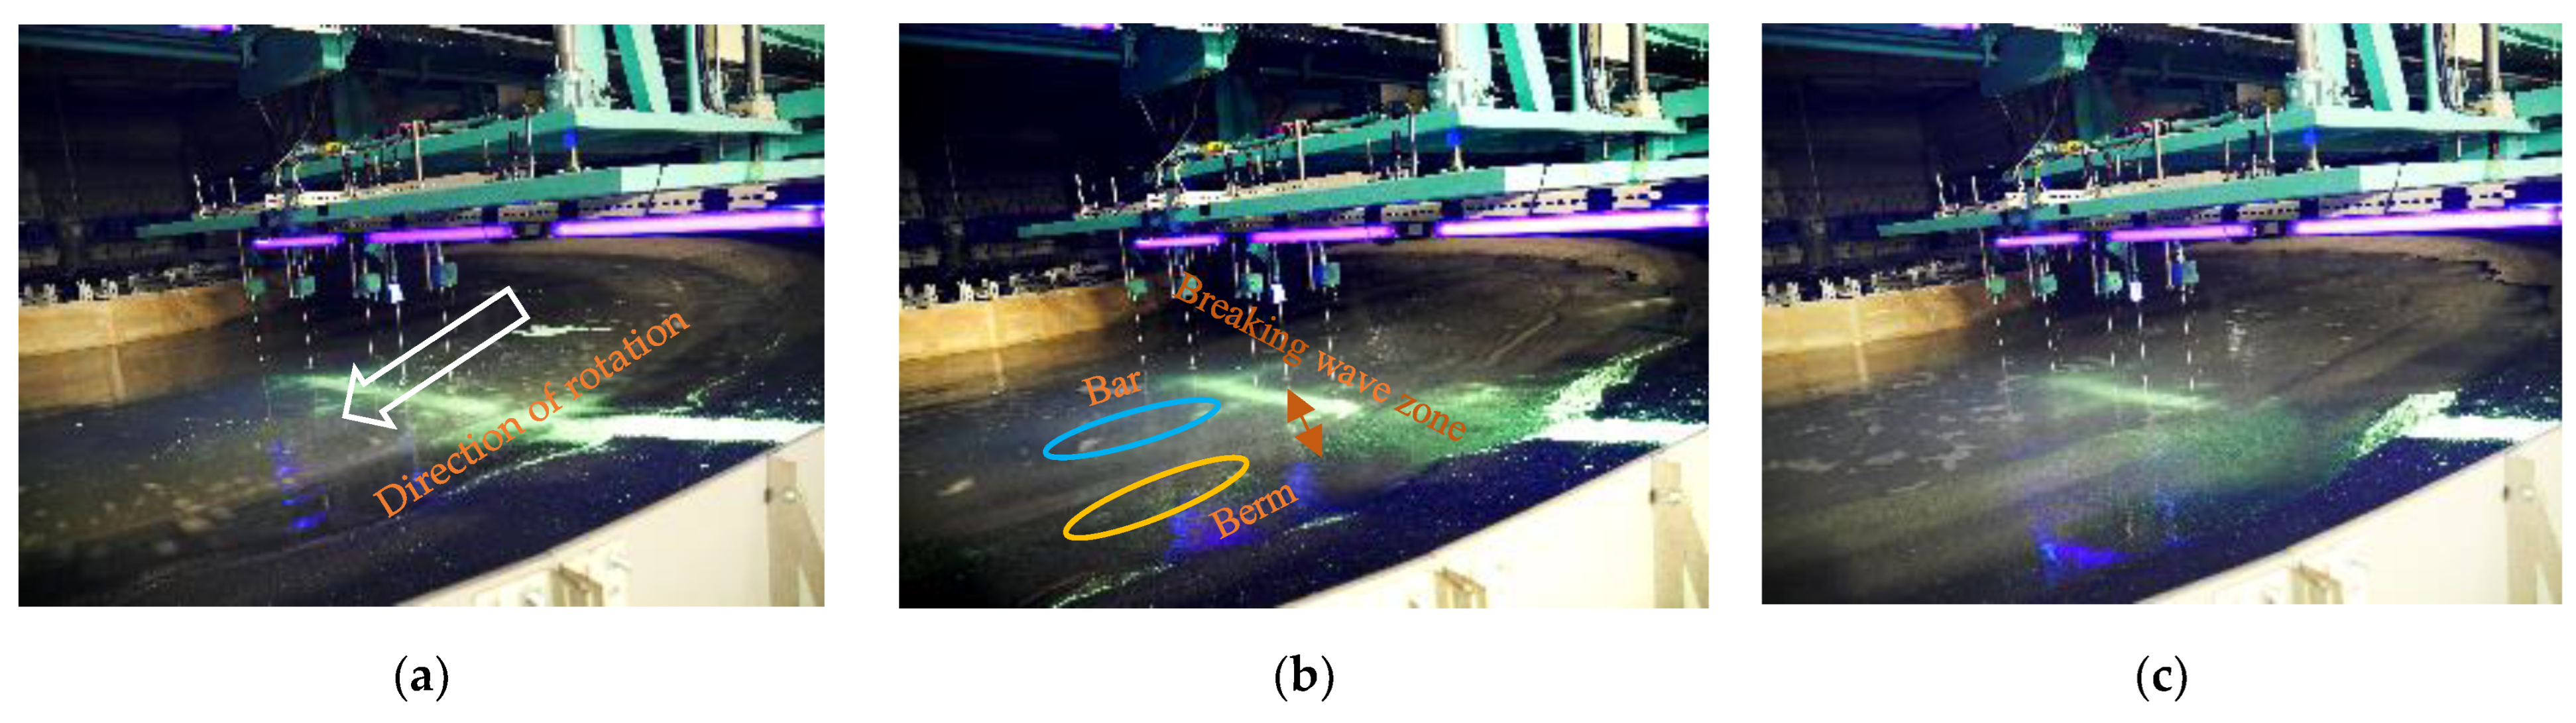
The water surface fluctuations were measured in w1 to w4 at all measurement locations in the cases, whereas the uniform gradient of 1:7 (cases 1 to 4) and final terrains of cases 1 to 4 (case 1a to 4a) were considered as the initial terrain to observe the generated waves characteristics during the experiment in the circular wave-making tank. Figure 4 shows water surface fluctuations at w1, w2, w3, and w4 wave gauges positions in case 2a, where 0 cm defines the still water level. From the outcomes in all cases, it was observed that the water surface fluctuation tended to be increased with the increase of the rotation speed of the wave-making device and this tendency was remarkable at the w1 position, which was closest to the wave-making device compared with the w2 position (Figure 4a,b) in individual cases. The water surface fluctuation increased again at w4 positions measured at the most shoreside (shallow water depth) which could have occurred due to wave deformation on the shallow water depth. The bars were formed between the w4 position to the shoreline in all cases, which was confirmed from the visual observation and photographs taken at the end of the experiment. It was also found that the water surface fluctuations tended to be almost stable at all points in cases 1 to 4 after a while. The stability was also remarkable in cases 1a to 4a, in which the beach topography changes were not significant compared with cases 1 to 4. The stability could be confirmed from the measured water surface fluctuations in different positions w1 to w4 in case 2a, respectively (Figure 4). The following stable water surface fluctuations data indicates that the sediment transport was settled down during the experiment, and the initial topography was transformed to the equilibrium topography, which could be considered as the factor of the tendency of wavefield stability and stable water surface fluctuations in all cases. From the visual observation and photographs, it was found that the waves were breaking between the w4 position to the shoreline, whereas the water surface fluctuations were measured only in the four wave gauges positions. As a result, it was difficult to show the spatial changes of wave height from w1 to shoreline due to the limitation of wave gauge data between these distances and determine a relationship between wave breaking position and bar position. On the other hand, it was found that the variations of the wave amplitudes were sufficiently slight immediately after the start of wave generation in all cases, which indicates that the wave reflections seemed to be relatively smaller in the experiment; however, the reflection coefficient could not be evaluated due to the lack of experimental data.

Figure 4.
Water surface fluctuations at (a) w1, (b) w2, (c) w3, and (d) w4 wave gauges position in case 2a.
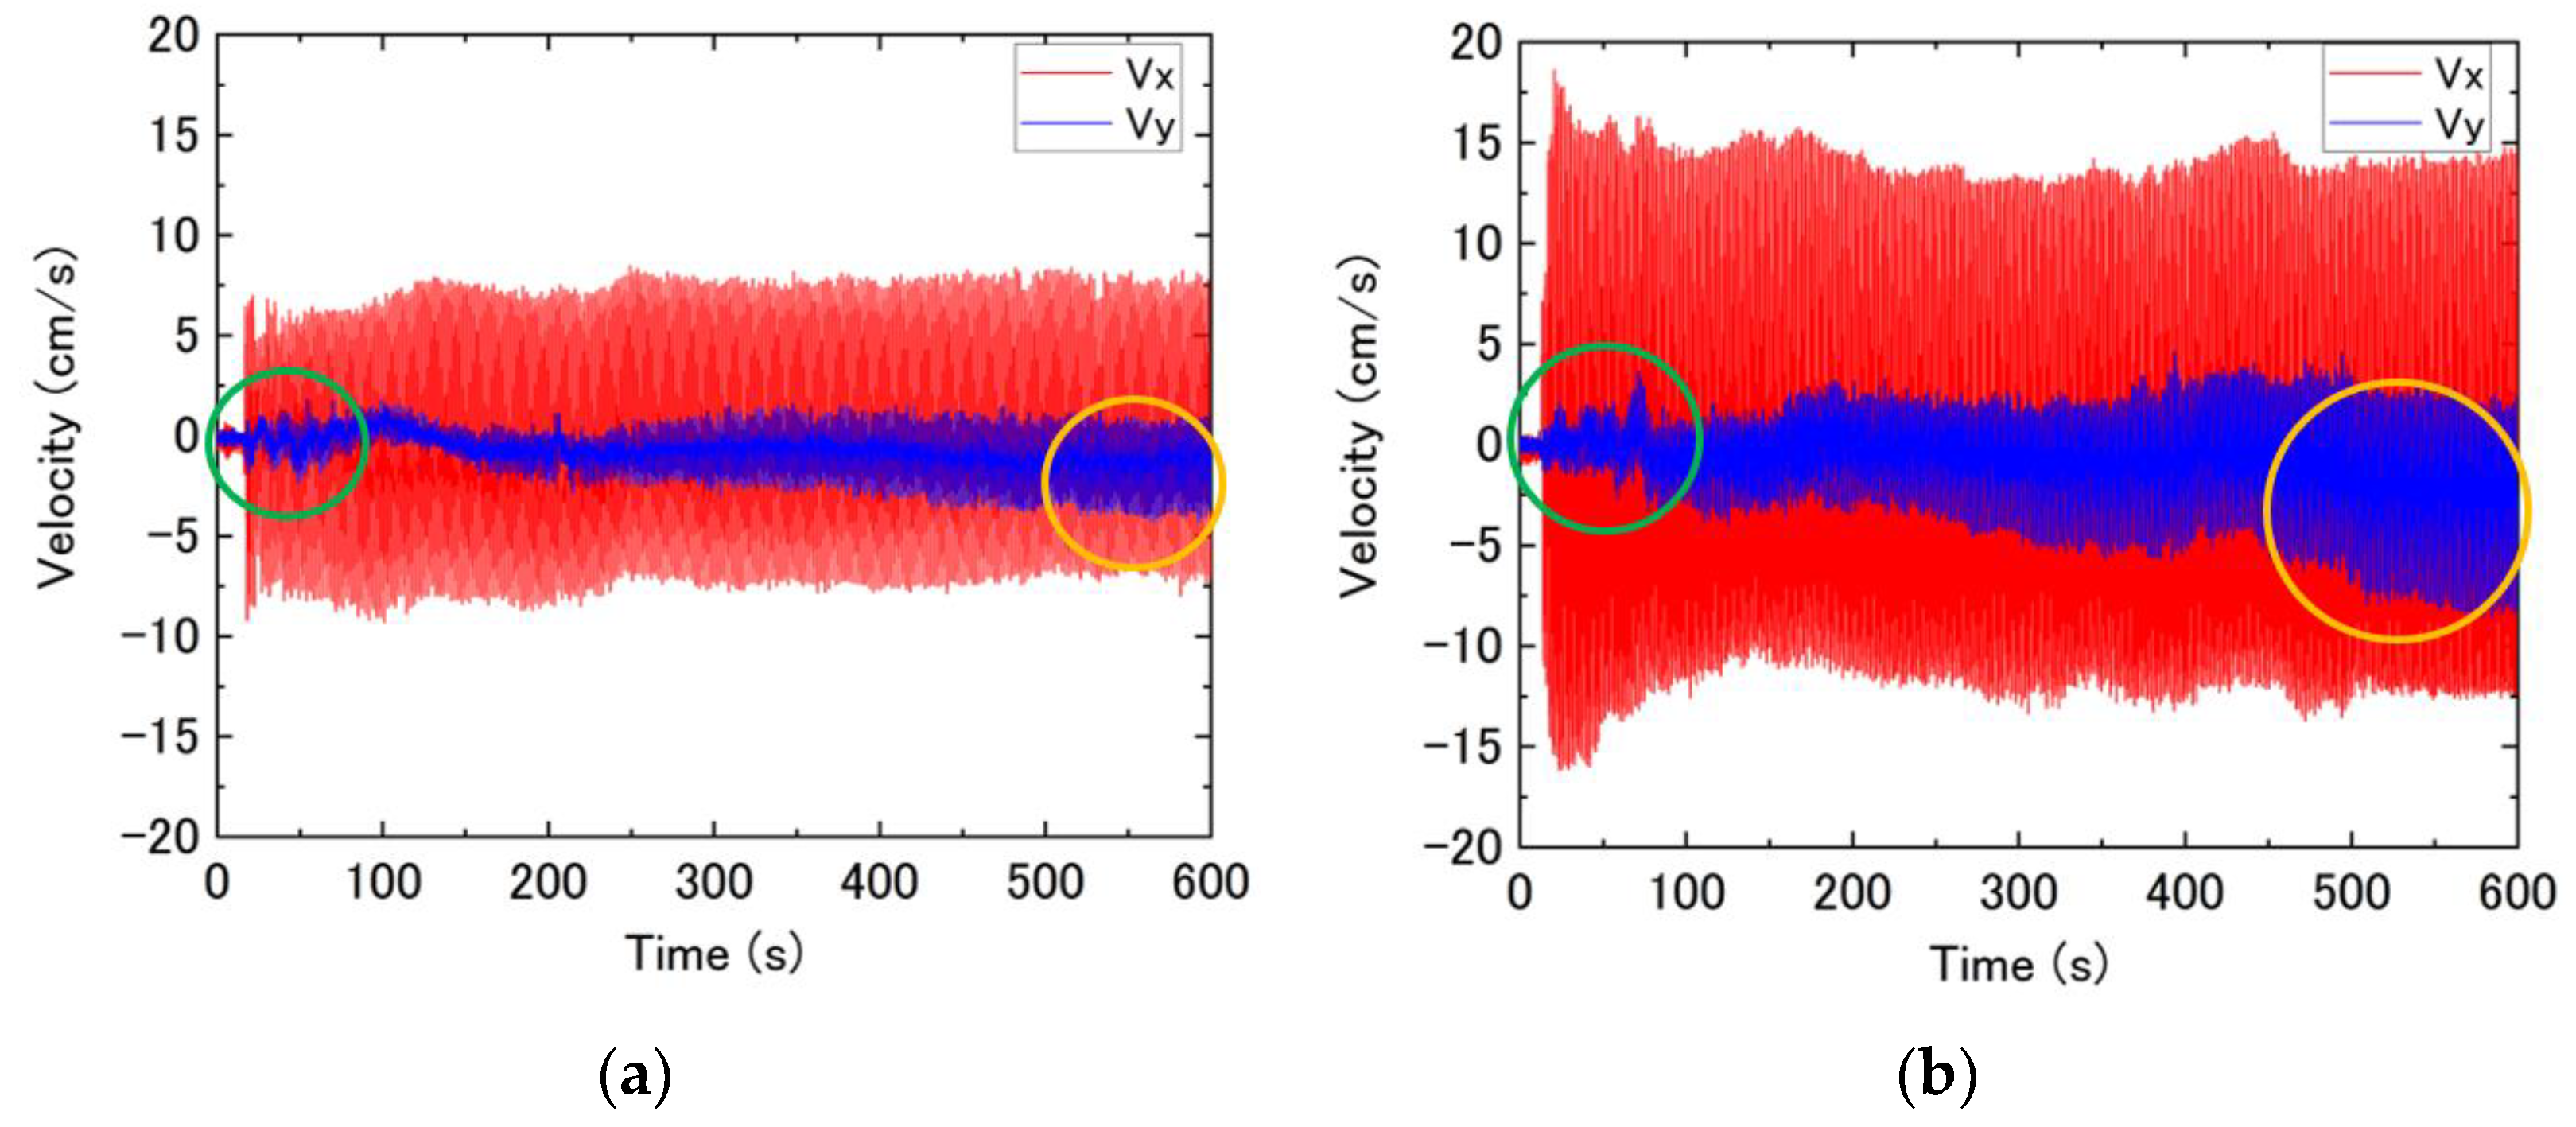
Figure 5 shows the flow velocity measurements in case 2 and case 4, in which the positive and negative components of cross-shore flow velocity (Vx) represent the flow velocity of the upstream and downstream flow in the onshore and offshore directions and the positive and negative components of longshore flow velocity (Vy) represent the flow velocity in the opposite and the following direction of rotation of the wave maker device, respectively. From the outcomes of the flow velocities, it was observed that the cross-shore flow velocity (Vx) was generated almost stable in all cases. The magnitudes of the cross-shore flow velocity increased as the number of revolutions increased. The amount of increase was particularly remarkable from case 2 (27 rpm) to case 4 (33 rpm), in which the wave breaking was significantly observed in these cases. On the other hand, the longshore flow velocity (Vy) was small, and the flow velocity waveform was almost symmetrical (green frame) after the start of wave formation. The longshore flow velocity in the opposite direction of rotation (positive component) was generated in all cases. However, the longshore flow velocity (negative component) in the direction of rotation was gradually increased as time passed, and a larger velocity component in the direction of rotation was seen in case 4 where the rotation speed of the wave generator was higher compared with the other cases. In all cases, the sand displacement was observed after the start of the experiment, and the breaking waves eroded and transported the sands in the offshore direction due to the backwash processes that changed the topography. This process continued until the deformed topography reached the equilibrium topography and enhanced the stability of alongshore flow velocity through the topography deformation. As the stroke length of the wave maker was fixed for all cases, only the differences in the wave periods in each case, it was found that the flow velocities profiles along the cross-shore and alongshore directions were relatively stable after 500 s in case 2 to case 4 (Figure 5) (yellow frame), which indicates that the stable waves were formed during the experiment and the waveform stability enhanced the transformation of initial topography to equilibrium topography in all cases. The velocity profile changes along the cross-shore and longshore directions were significantly smaller after the equilibrium topography formation compared with the transformation periods, and the sediment transports were almost zero until the end of the experiment.

Figure 5.
Flow velocity in two different cases: (a) Case 2; (b) Case 4.
3.2. Topographical Changes before Equilibrium
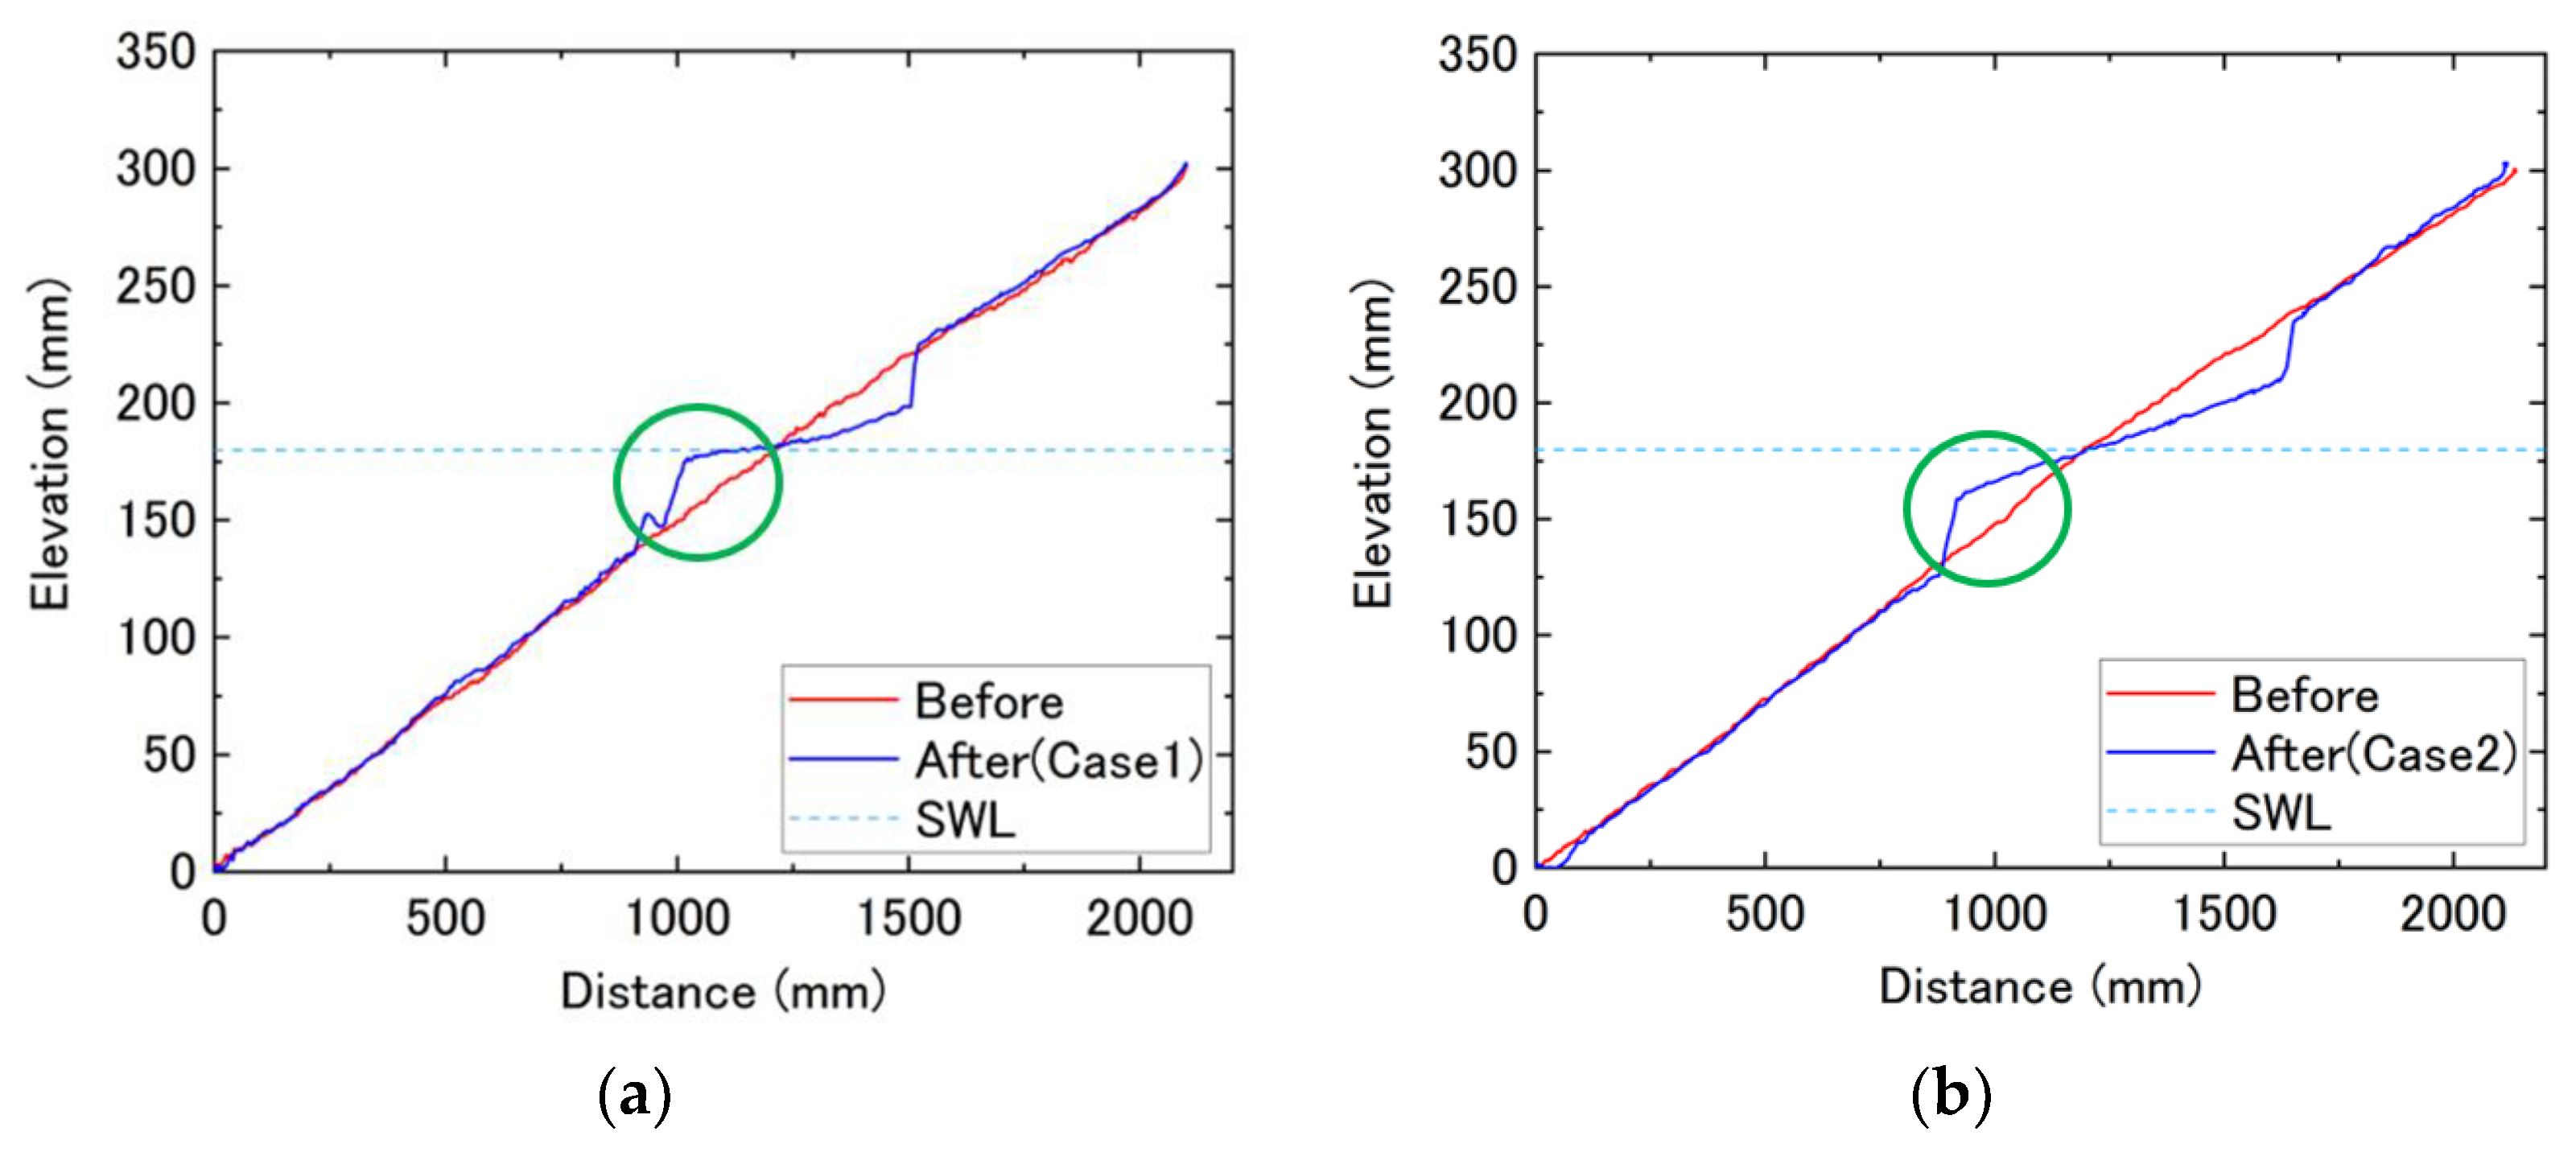
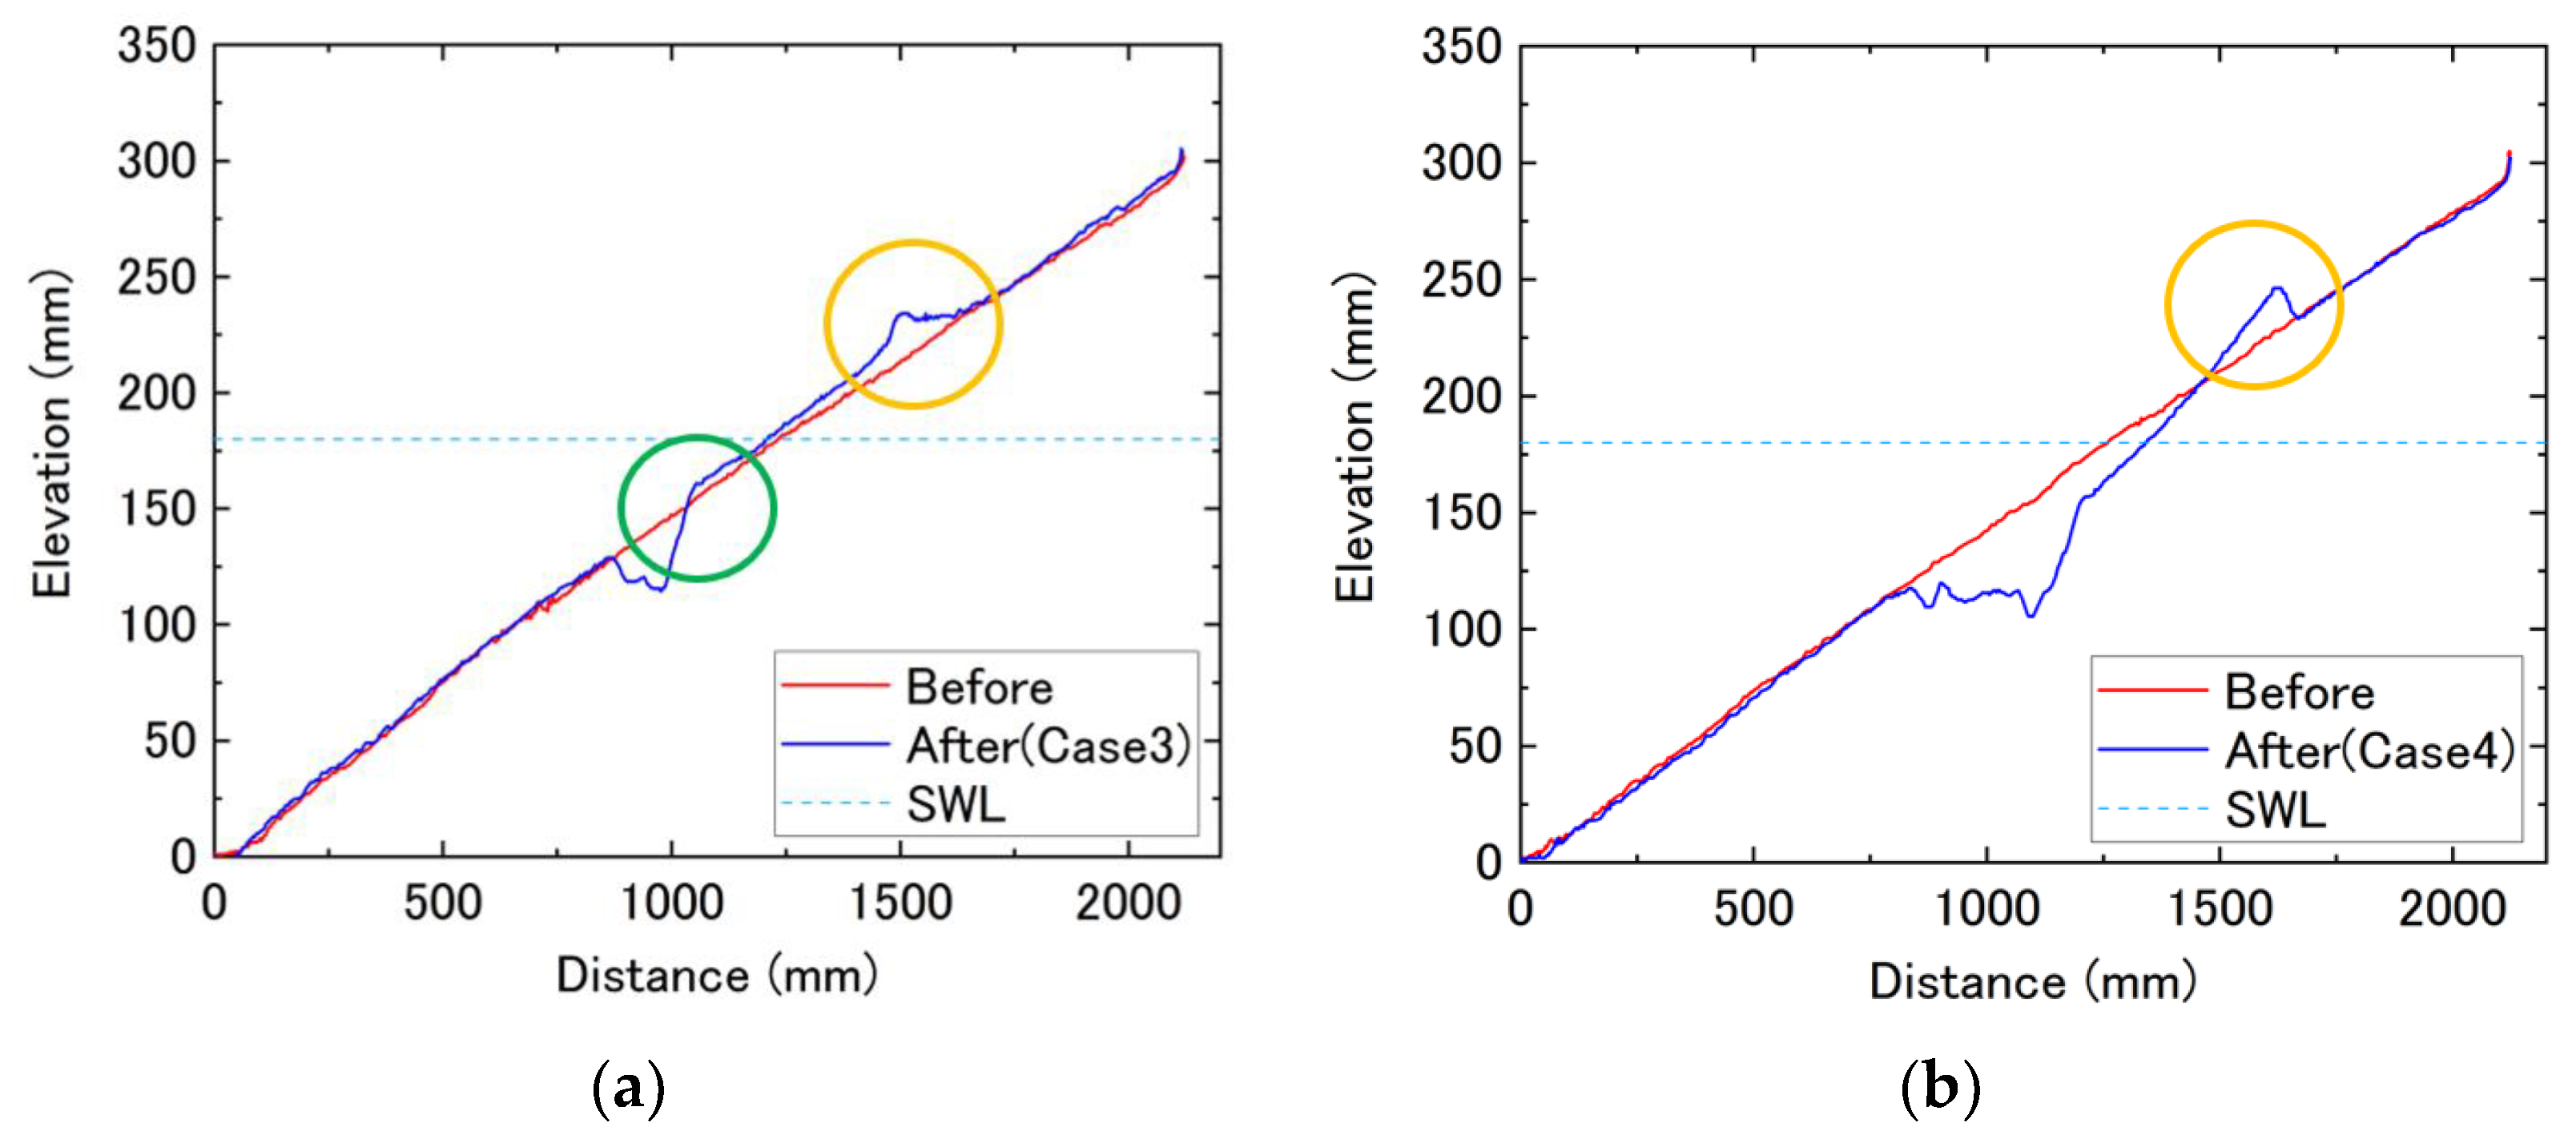
The topography was measured by the laser displacement meter before and after the experiment represented by a solid blue and red line, respectively, while the still water level was indicated by a light blue dashed line shown in Figure 6 and Figure 7. The topography on the cross-section of fluorescent sand installation (cross-section 1) was measured in all cases, but in case 2 and case 4, the wave breaking positions and the beach profile changes were different compared with other cases on cross-section 1, so the topography was measured on another cross-section (cross-section 2). From the outcomes, it could be observed that the terrain was a steep type at the end of the experiment in which the sedimentation occurred on the offshore side of the shoreline and erosion on the shore side in all cases, and the displaced sands were accumulated on the offshore and foreshore during the experiment. The protruding part at the offshore end of the steep would be referred to as the “bar” (green frame), and the progressed part above the shoreline accumulated on the foreshore end would be referred to as the “berm” (orange frame). The bar and berm were formed during the experiment, and the offshore sediment transport became dominant in bar formation. The onshore sediment transport became dominant in berm formation, similar to [35,36]. Furthermore, the waves were breaking near the bar in all cases; the breaking positions and the locations of the bar were regarded as the same.

Figure 6.
Topographical changes before and after the experiment: measurement of (a) cross-section 1 of case 1; (b) cross-section 2 of case 2.

Figure 7.
Topographical changes before and after the experiment: measurement of (a) cross-section 1 of case 3 and (b) cross-section 2 of case 4.
At the measurement point at which the bar was developed (case 1-cross-section 1, case 2-cross-section 2, case 4-cross-section 1), the breaking waves had a strong tendency for erosion on the shoreside of the shoreline and deposition (sedimentation) on the offshore side on the vicinity of the bar due to the downstream flow and the wave breaking point extended (protruded) to the offshore side at the same cross-section. On the other hand, there was an erosion tendency near the bar, and the breaking point receded to the shoreside while the eroded sand tended to accumulate (for deposition) at a point located on the shoreside of the shoreline in those cases where the berm development (case 2-cross-section 1, case 3-cross-section 1, case 4-cross-section 2) was confirmed, although the berm development was not noticeable in the measured cross-section in all cases. It was also observed that the bar was developed in the area where the range of the wave-breaking zone was wide, and the steep topography was formed by the sand flowing and accumulating on the offshore side from the shoreline, which tended to be eroded. The development of the berm was remarkable in the area where the range of the wave-breaking zone was narrow, and the foreshore was steep. Moreover, the bar and berm development were related to incident wave heights, wave breaking positions, and sedimentation processes.
From the investigation of topographical changes in individual cases, it was found that a gentle steep topography with a bar was formed in case 1 (Figure 6a), and the amount of erosion and deposition were almost equal in the measured cross-section that might be occurred due to the stable wave formation and longshore current uniformity during the experiment. In case 2, a berm developed on cross-section 1 in which the bar was locally receded to the shore side at the same cross-section; similar topography was also observed in case 3. On the other hand, a bar was formed on cross-section 2 (Figure 6b), and the amount of erosion and deposition were almost equal at the measured cross-section as in case 1. In case 4, a strong sedimentation tendency was found with a developed bar on cross-section 1, and the bar advanced to the offshore side. A well-developed berm was formed on cross-section 2 (Figure 7b), and the bar receded locally to the shore side, forming a steep wave-breaking zone similar to the measured topography on cross-section 1 in case 2. From the comparison of the generated bar positions in individual cases, it was found that the positions were different, and the bar was mostly receded to the offshore side in case 4 compared with the other cases. Since the wave height was gradually increased with the increase of rotational speed of the wave maker in case 4 compared with other cases, the gradually increased wave height could have a significant influence on the degree of wave breaking and the strong degree of wave breaking eroded a comparatively large amount of sand from the shoreline and accreted on the offshore side due to the strong downstream flow which could be a reason for bar recession during the experiment although the exact position of wave breaking in individual cases was not identified due to the lack of measurement data in the area of wave breaking ranges, however, a relationship between the wave breaking position and the bar position could be assumed from the visual observation and the measured bar position at the end of the experiment in all cases. On the other hand, the berm position was receded to the shoreline mostly in the measured cross-section 2 in case 4 compared with the others. The erosion tendency was higher on the offshore side of the bar at the same cross-sectional area, which might be occurred due to the changes of wave breaking positions in the onshore direction and relatively strong upstream flow that enhanced the sediment transport above the shoreline than before, which also indicates that the incident wave heights had a significant effect on wave breaking and the sedimentation process. As the amounts of sedimentations were not approximately the same in the same cross-sectional line, the variations indicate that the sands were not displaced only due to the swash and backwash process; the longshore current might be generated and carried out the sand throughout the longshore sediment transport process that was also visually observed during the experiment in all cases.
Furthermore, from the visual observation and the captured photos during the experiment in all cases, it was observed that the bar was dented with a curved shape toward the shoreline in the vicinity of the fluorescent sand cross-section. As the stroke length of the wave paddles was fixed and the wave period was the same during the experiment in each case, the bar positions differences confirm that the wave breaking positions were not the same on the same radius of the same sloping condition that was shifted during the time zone resulting in the formation of the trough and the deviation of the wave breaking points had a great influence on the movement of sand and topography deformation. On the other hand, the generated waves were breaking in the vicinity of the bar, and the berms were formed between the wave set-up and the maximum run-up level. The gradient of the wave-breaking zone from the bar to the berm tended to become steeper, indicating that the strong downstream flow (offshore flow) was active during the experiment.
3.3. Topographical Changes after Equilibrium
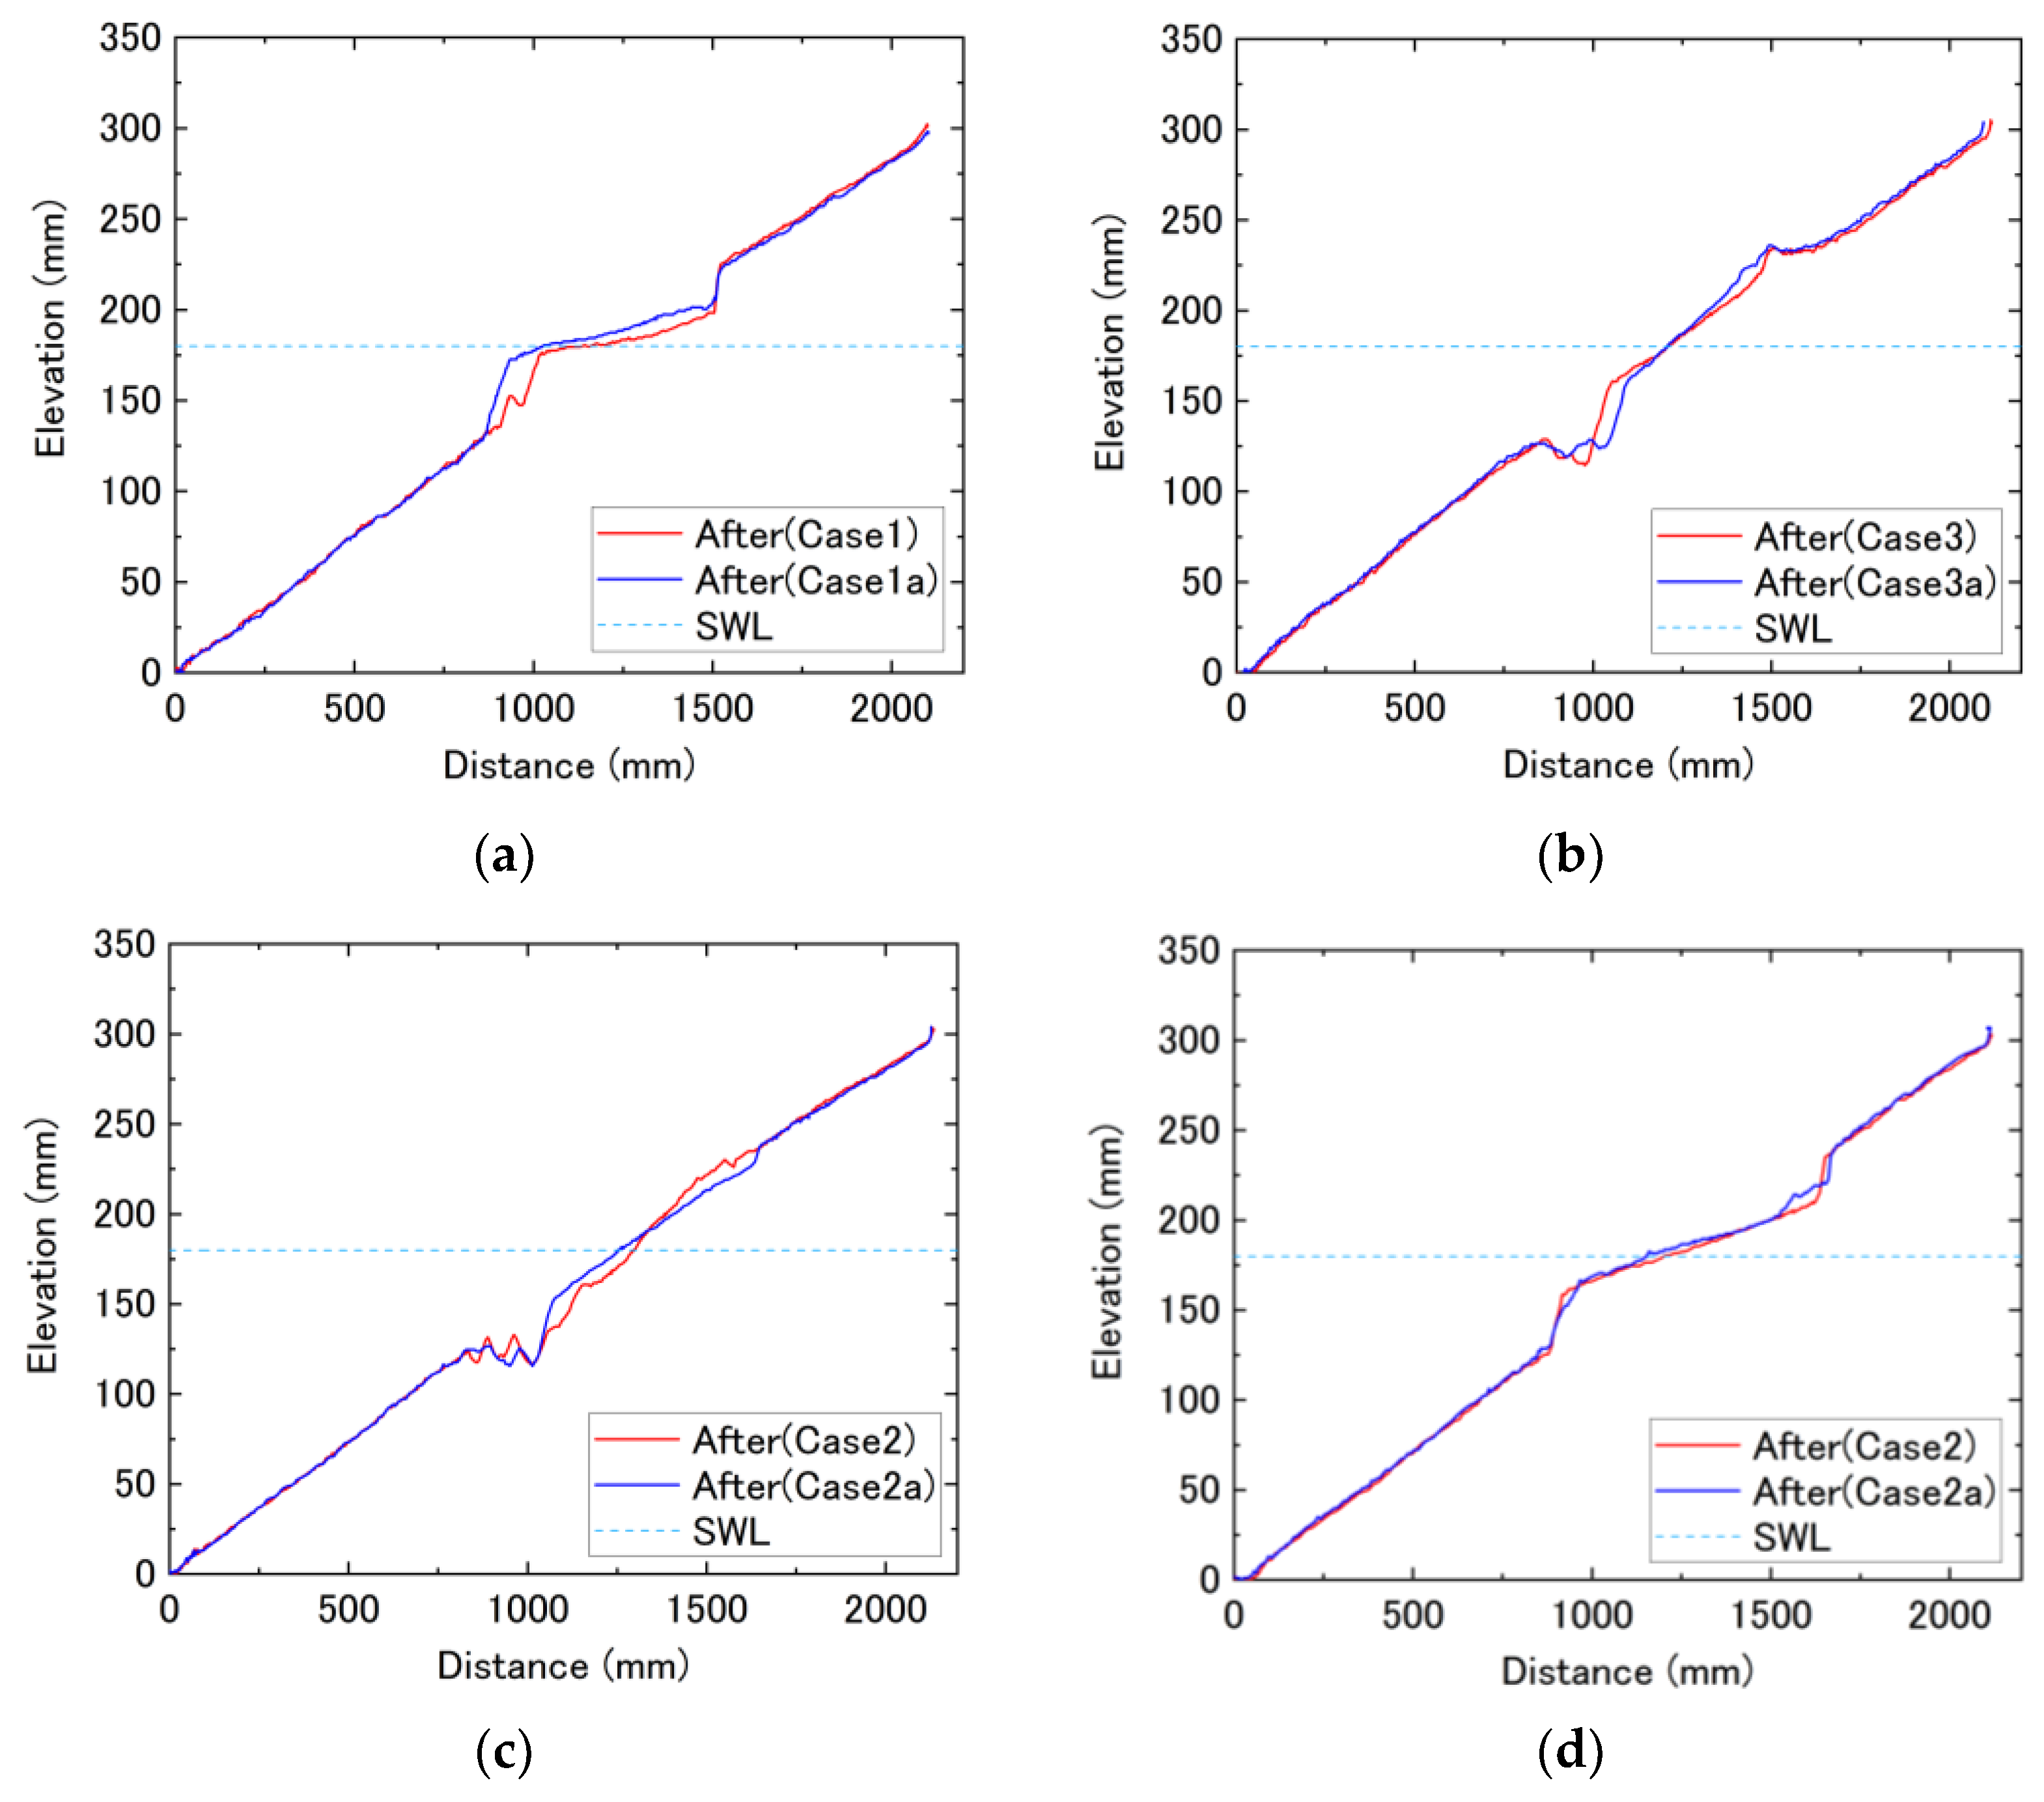
Wave generations were performed again by considering the final topography of case 1 to case 4 as the initial topography and investigated the changes in equilibrium terrain in each case. From the outcomes, it can be observed that the topographical changes were small compared with the previously considered uniform topography cases. However, the mean water level was not measured in the experiment to confirm the equilibrium topography exactly except by the comparison of water surface fluctuations, flow velocity, and topography changes in different positions before and after the experiment in case 1a to case 4a, respectively. Within the four individual cases, the measured topographical changes before and after the experiments in case 1a to case 4a were shown in Figure 8 and Figure 9, respectively.

Figure 8.
Topographical changes before and after the experiment: measurement of (a) cross-section 1 of case 1a, (b) cross-section 1 of case 3a, (c) cross-section 1 and (d) cross-section 2 of case 2a.
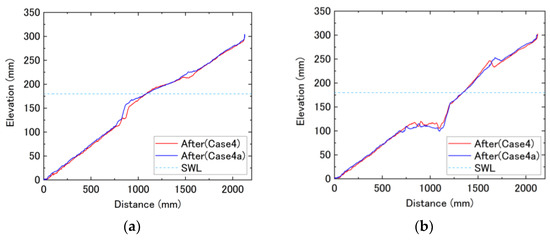
Figure 9.
Topographical changes before and after the experiment: measurement of (a) cross-section 1 and (b) cross-section 2 of case 4a.
Comparing the results in individual cases, no significant erosion was observed in the measured cross-section in case 1; only the deposition progressed, and along with this, the deposition advanced to the offshore side, especially near the bar. In case 3a, the bar receded slightly to the shore side, and the deposition progressed slightly from the shoreline to the berm (Figure 8b). A different characteristic of sands movement was found in case 2a, in which the sands were deposited on the offshore side and eroded on the shore side of the steep terrain in cross-section 1 and the berm near the cross-section of the fluorescent sand disappeared during the experiment. The steep part was in the offshore direction, which indicates the berm was eroded by the strong downstream flow, and the eroded sand accumulated at the offshore end of the steep near the bar. On the other hand, there was almost no terrain change on the offshore side of cross-section 2, and a stable steep terrain was formed on the lower side compared with case 2. In case 4a, there was a tendency of sand deposition near the bar and berm in both measured cross-sections, and a small amount of erosion in the vicinity of the trough-like topography was found in cross-section 2. However, the amount of topography change was not significant in this case.
Although the equilibrium topography was considered during the experiment, the deposition and erosion occurred in the measured cross-section, which revealed that the longshore current was generated in the experiment and the sand displacement was continued due to the combined influence of longshore current and downstream flow even in the equilibrium topography cases. As the spiral waves were propagated obliquely in the clockwise direction, the erosion and deposition occurred by the displacement of the sands from the vicinity of cross-section 2 to cross-section 1 due to the longshore current and strong downstream flow, and it was visually observed during the experiment.
3.4. Dynamic Characteristics of Sand Displacement before Equilibrium
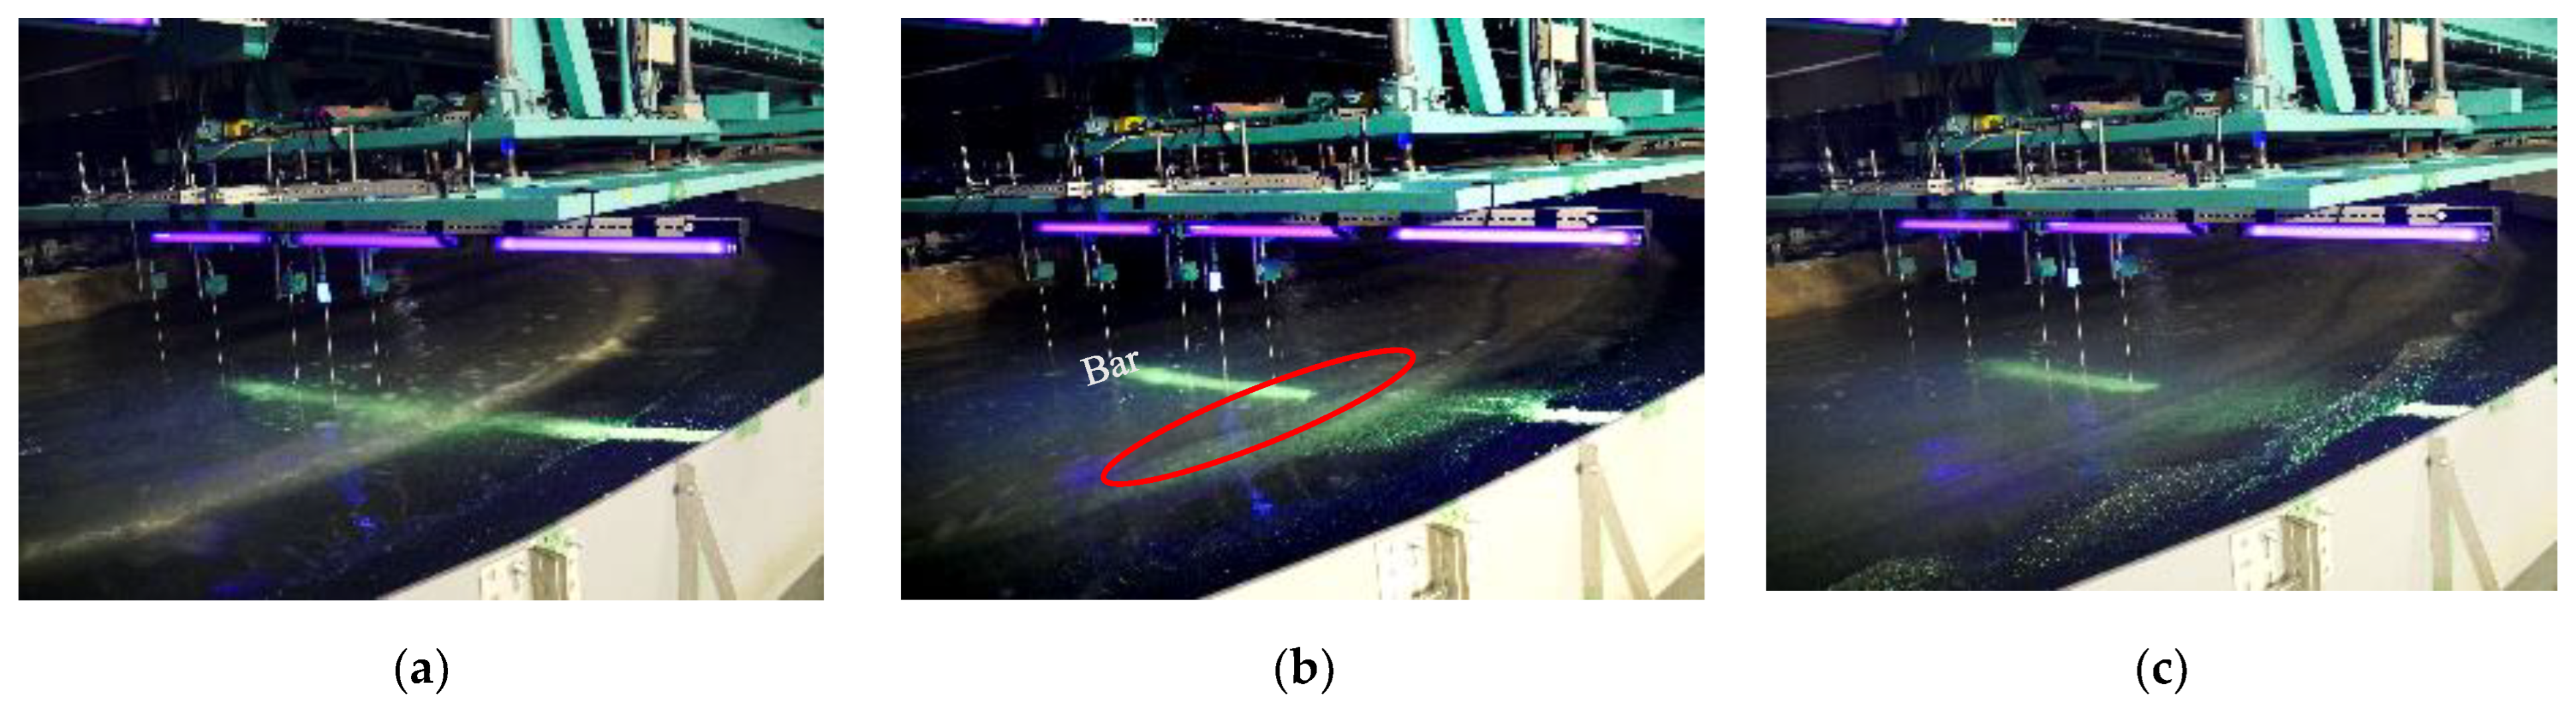
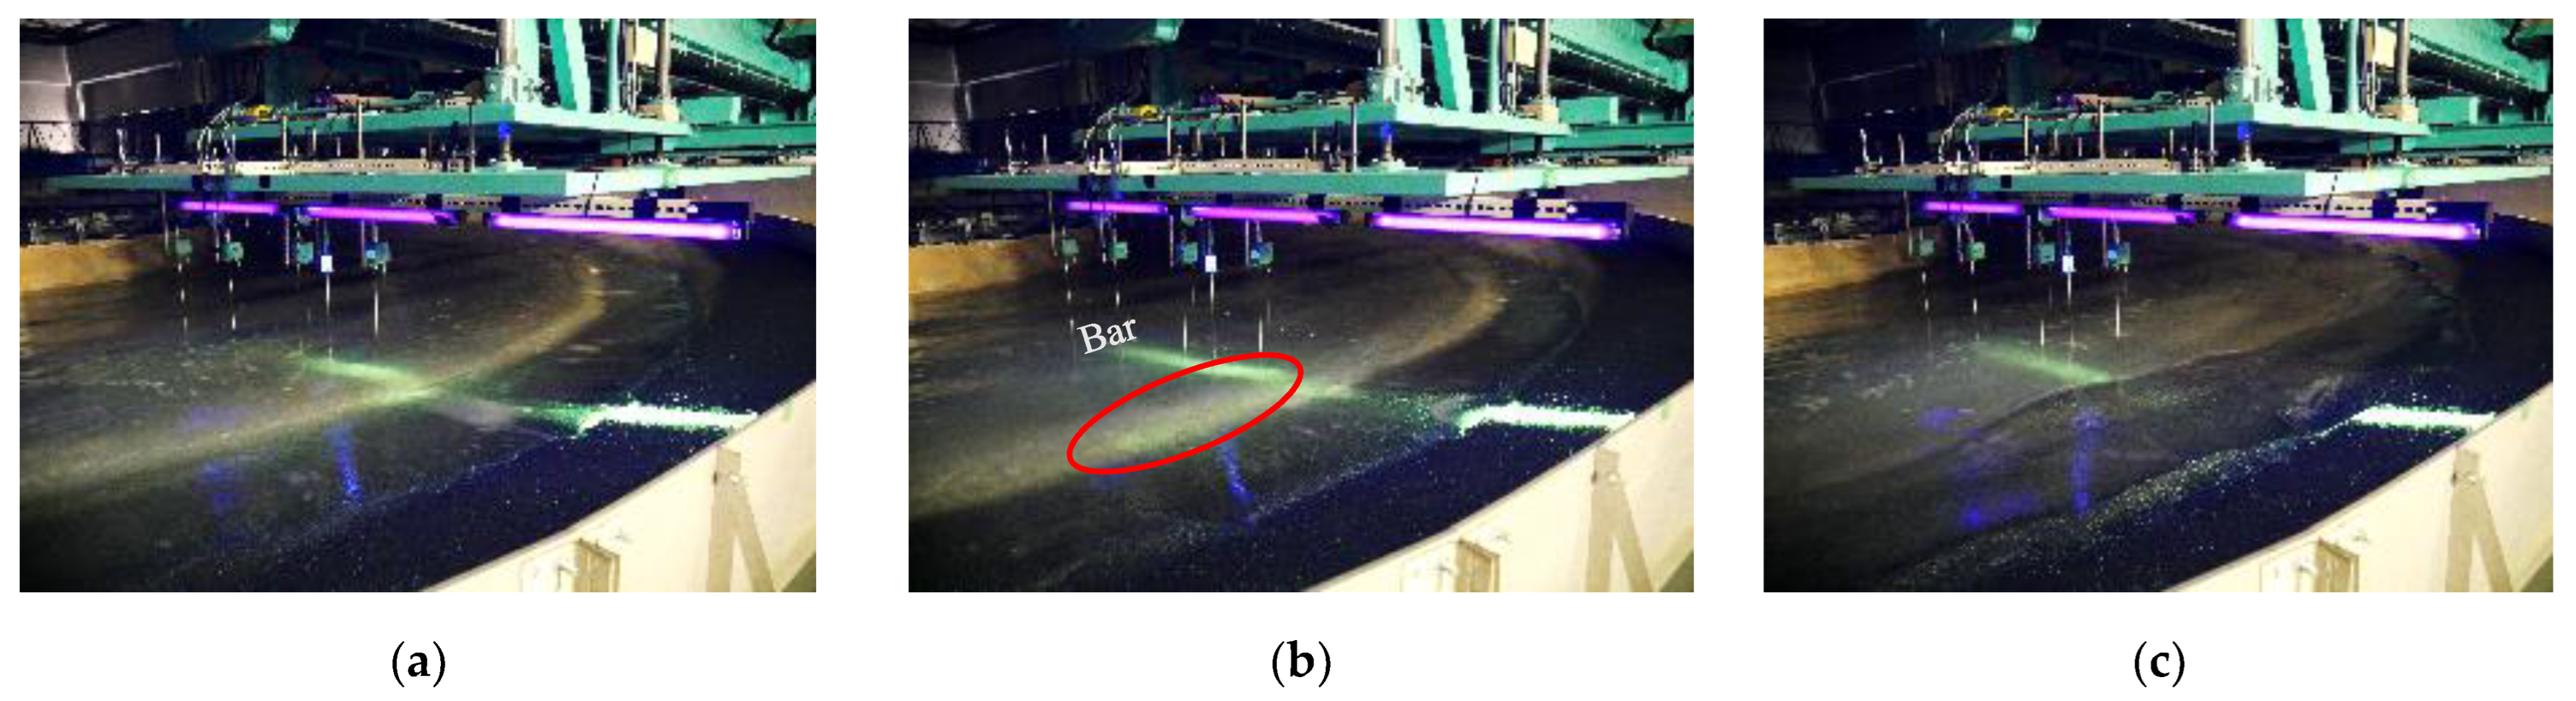
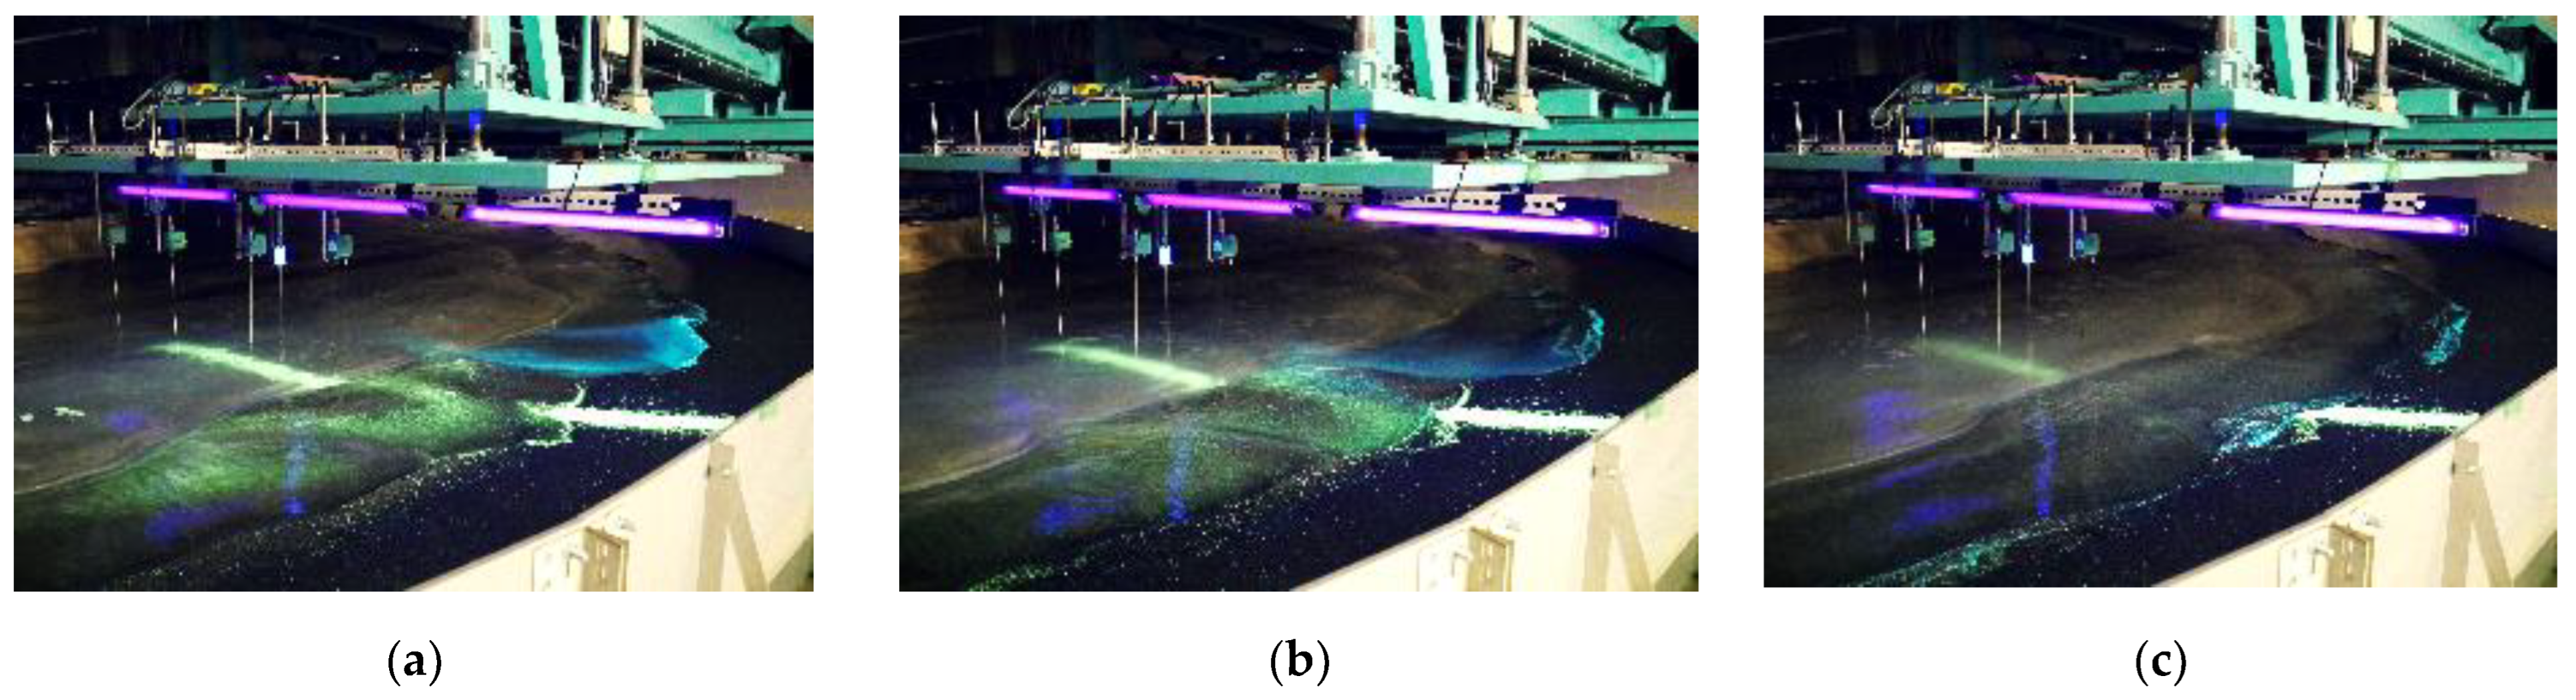
The fluorescent sand movement was observed visually and through photographs, provided that the uniform topography (1:7) was considered as the initial topography. In all cases, the movement of the fluorescent sands was significant only between the bar and berm positions, and almost no movement of fluorescent sands was observed from the bar to the offshore direction. Within the four cases, the sands displacement in different time periods in case 2 to case 4 were shown in Figure 10, Figure 11 and Figure 12.

Figure 10.
Snapshots of fluorescent sands movement during the experiment in Case 2: (a) after 1 min (b) after 20 min (c) after 60 min.
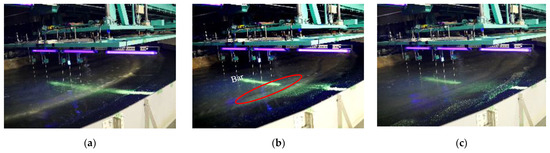
Figure 11.
Snapshots of fluorescent sands movement during the experiment in Case 3: (a) after 1 min (b) after 10 min (c) after 60 min.

Figure 12.
Snapshots of fluorescent sands movement during the experiment in Case 4: (a) after 1 min (b) after 5 min (c) after 60 min.
The characteristics of the movement of sands were observed in two major stages; as in the first stage, the sands were actively moved towards the offshore direction from the shore area after the start of wave formation, and the movement was confirmed after 1 min in all cases, which was thought to be due to the upstream and downstream flow in the swash zone. The fluorescent sands were settled near the vicinity of the wave-breaking positions and the bar formation was confirmed in this stage. After the movement settled down, the displaced sands were moved in the direction of rotation of the wave-making device, which was considered the second stage. The settled-down situation of the sand displacement indicated the stable wave formation during the experiment.
The gradual movement of the sands was consistent with the time-varying characteristics of the flow velocity, and the velocity affected the dynamics of sediment transport in the two stages. However, the time duration of the fluorescent sand movement in the alongshore direction was different in different wave conditions. Regarding the rotation speed of the wave-making device and wave heights, the shifted situation occurred earlier in case 4 (after 5 min) compared with the other cases (after 20 min in case 2 and 10 min in case 3). It was also observed that the sands were moved along the onshore and offshore direction following the mechanism of uprush and backwash in the swash zone; the same procedure of sands displacement profiles in the swash zone was found by Puleo et al. [8] in their field study. Therefore, it can be deduced that the movement of sands in the first stage was greatly related to the cross-shore sediment transport and bar formation, which was relatively dependent on the generated wave heights, wave breaking positions, and wave periods, respectively. When the movement of sands along the cross-sectional topography was settled down, the accumulated sands within the bars and berms were moved to the alongshore direction that could be occurred due to the influence of obliquely incident wave height, wave breaking positions, and strong downstream flow on the sloping beach and the longshore sediment transport became dominant near the wave breaking zones throughout the above mentioned second stages. The fluorescent sands rapidly progressed towards the alongshore direction and almost disappeared within the time zone of the experiment and scattered on the shore profile, which confirms that the longshore currents were generated at the end of the first stage, and the longshore current and the downstream flow were the active waves driving force in the second stage; also, the longshore sediment transport started in this stage. Besides these, it was also observed that the incident waves were breaking angularly on the surf zone, and the sands were moved following the breaking waves angle; however, the sand displacement angle was not the same along the onshore and offshore directions, and the displaced sands were moved parallelly along the shoreline which indicated that the incident wave angle could have a significant influence on sediment transport and beach deformation although the influence of incident wave angle was not considered in this study.
From the investigation of wave propagation and sediment transport in individual cases, the fluorescent sands movement and the disappearance tendency were found to be different in different cases. These characteristics were observed remarkably with gradually increasing the rotational speed of the wave-making device and wave heights in the experiment. It was also observed that the disappearance tendency of the fluorescent sands was prominent in that cases where the strong degree of wave breaking was remarkable in sloping beach topography due to the gradual increase in wave height and strong downstream flow, which was significantly found in case 4 (Figure 12). In case 4, the sand movement was prominent at the start of the experiment, and the settled down situation of sand movement along the cross-shore direction was found earlier (after 5 min) compared with the other cases. The sand displacement in the alongshore direction tended to be predominant earlier near the breaking point (near the bar) in this case which could be confirmed from the captured photos in Figure 12b. The fluorescent sand’s movement along the shoreline was faster in this case compared to others, and the fluorescent sands mostly disappeared out of the shooting range, which was confirmed by Figure 12c. The fluorescent sand disappearance procedure indicates the significantly prominent longshore current generation along the shoreline in this case. On the other hand, the obliquely generated wave heights were not as high in case 2 and case 3 as in case 4 and the sands’ disappearance tendency was not significantly prominent in these cases compared with case 4. In addition, the time duration of the stable wave formation and sediment transport towards the alongshore direction was different in these cases, and the displacement started after 20 min (Figure 10b) and 10 min (Figure 11b) later in case 2 and case 3, respectively. Besides these, the fluorescent sand disappearance rates were different in these cases, as confirmed in Figure 10c and Figure 11c, respectively. Since the stroke length was fixed and the rotation speed of the wave-making device was smaller compared with other cases, the wave height was also lower compared with others in case 1 and small amounts of fluorescent sands were moved toward the shoreline within the time of the experiment.
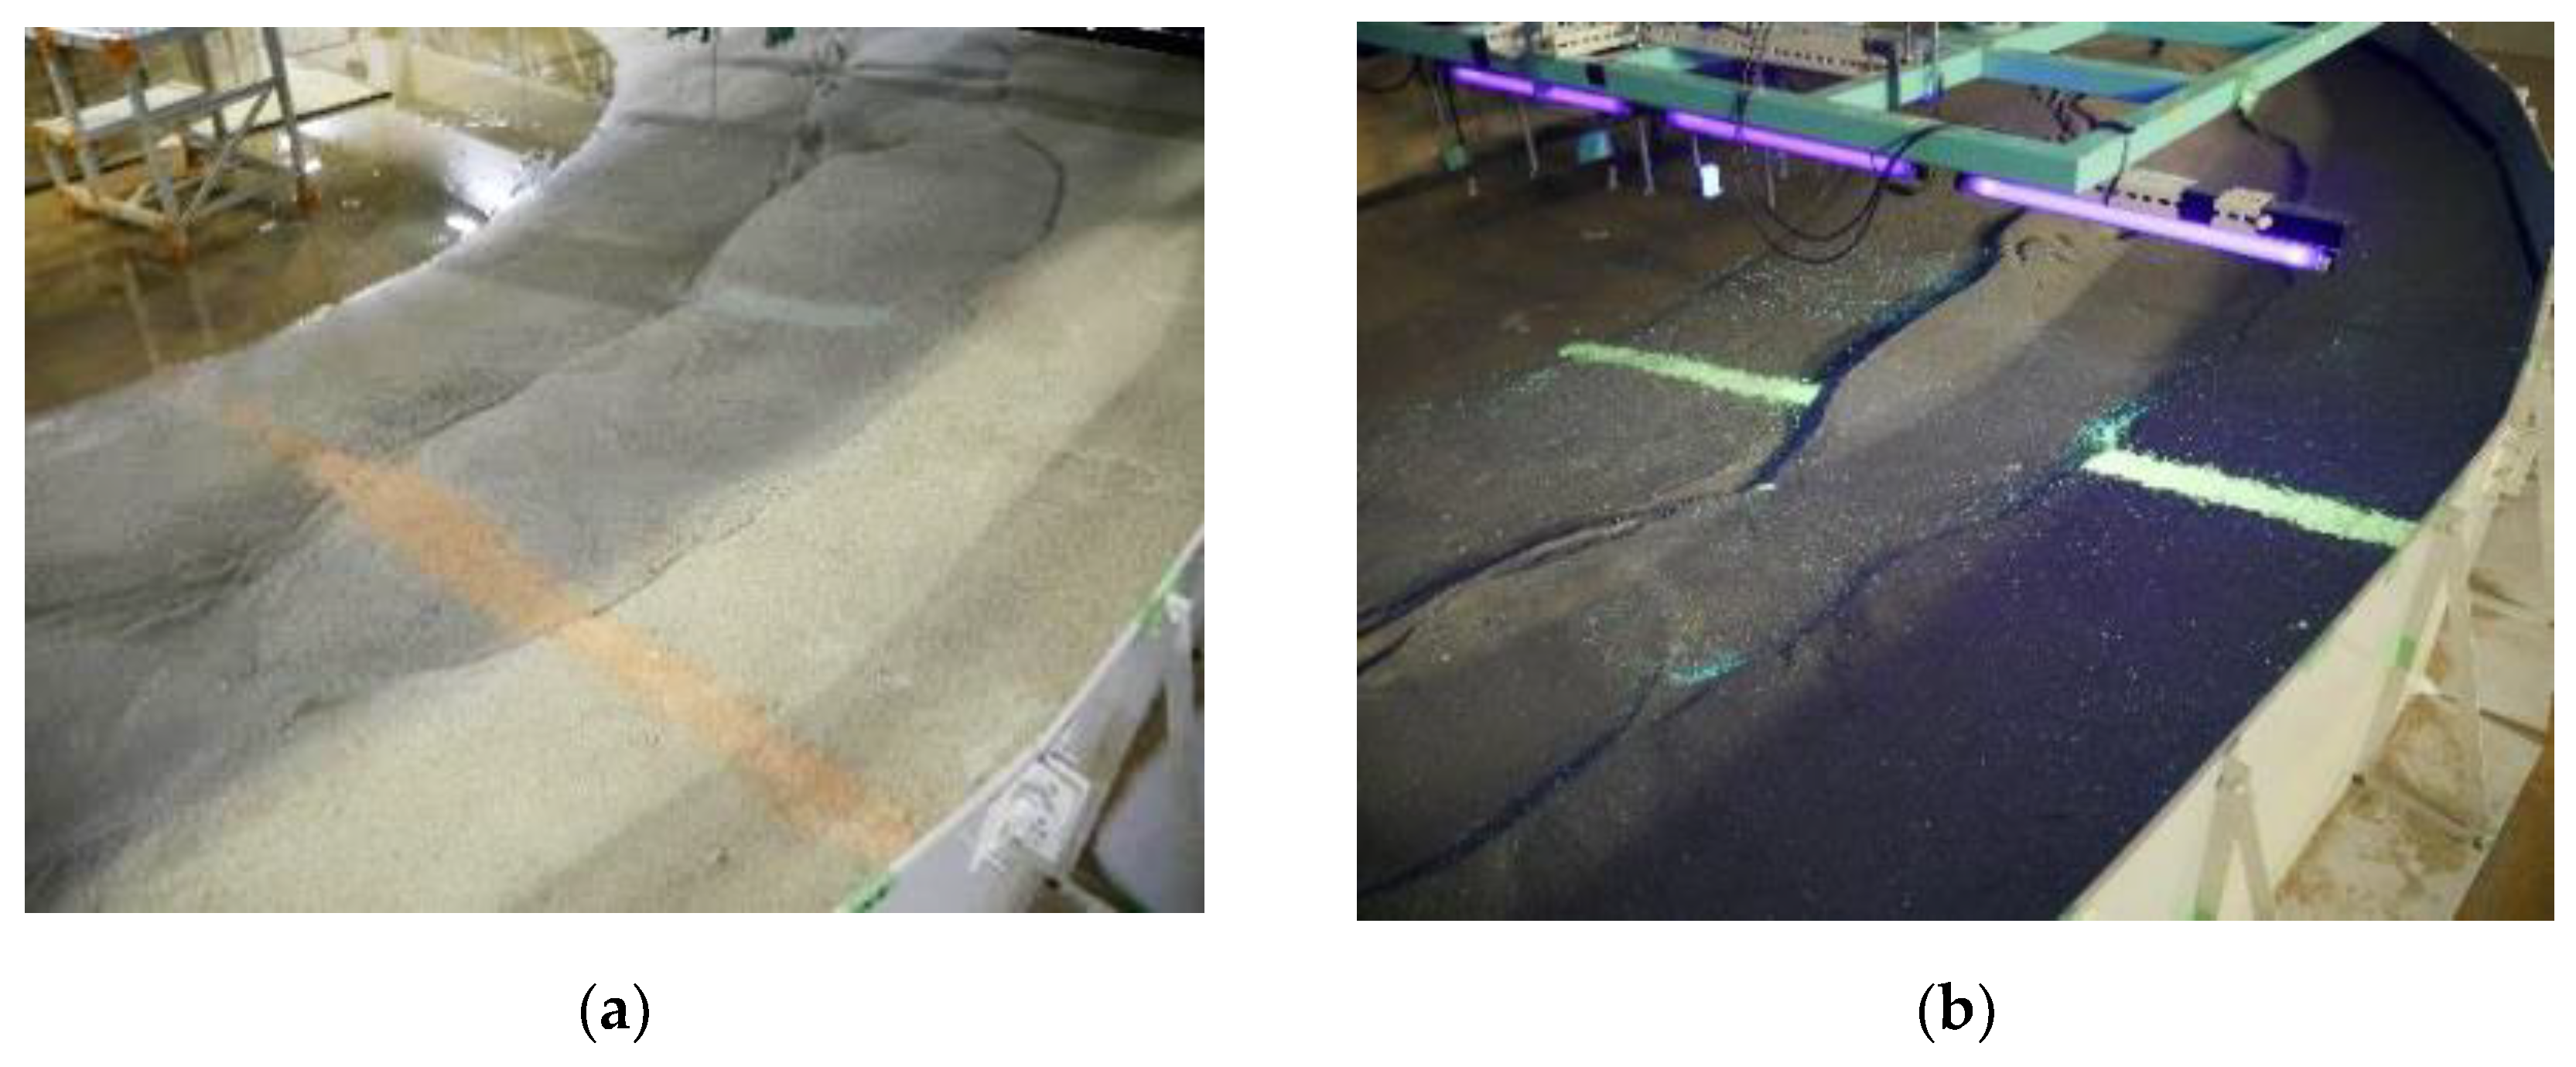
In all cases, the sand displacement tendency was remarkable at the start of the experiment, and the sand movement was settled down due to the upstream and downstream flow in the first stage. Then the longshore current and the downstream flow acted as the wave driving force in the second stage, and the fluorescent sands were moved parallel to the shoreline. The generated wave propagation and the sediment transport were continued during the experiment, and the beach was deformed throughout the mechanism of cross-shore and longshore sediment transport in each case. Furthermore, there was a sedimentation tendency on the lower side of the topographical cross-section, and the bar was dented in a curved shape with a trough in the vicinity of the fluorescent sand installation cross-section in all cases. The bar positions were not the same radial distances in a single case (Figure 13), which could be occurred due to the sediment transport throughout the obliquely incident waves breaking and the differences in wave breaking positions and wave setup during the experiment. Since the stroke length of the wave paddle was fixed and the waves were generated following the same wave period in a case, the differences in bar positions confirmed that the wave breaking positions were not the same in the same sloping condition. There could be time differences in wave breaking on a curved-shaped bar in different cross-sections on a sloping beach topography. The deviation of the generated bar positions and wave breaking time lag could have a great influence on sediment transport and beach deformation during the experiment. On the other hand, the water level differences were observed in different measured locations in the cross-sectional lines. The longshore current was developed due to the differences in water level and wave breaking positions along with the downstream flow in the experiment. The curve-shaped bar suppressed the current from the upper side to the lower side of the beach profile. As a result, sand transport was suppressed from the upper side to the lower side in terms of waves breaking time lag. The sands that flowed in from the upper side were accumulated in the installed cross-section and finally deformed the topography, which could be confirmed by Figure 13. Considering the above processes of sand displacement, it can be deduced that the incident wave breaking position and bar formation have a relationship with the mechanisms of longshore sediment transport and beach deformation in a sloping beach profile.

Figure 13.
Snapshots of topography at the end of the experiments: (a) Case 1; (b) Case 1a.
3.5. Dynamic Characteristics of Sand Displacement after Equilibrium
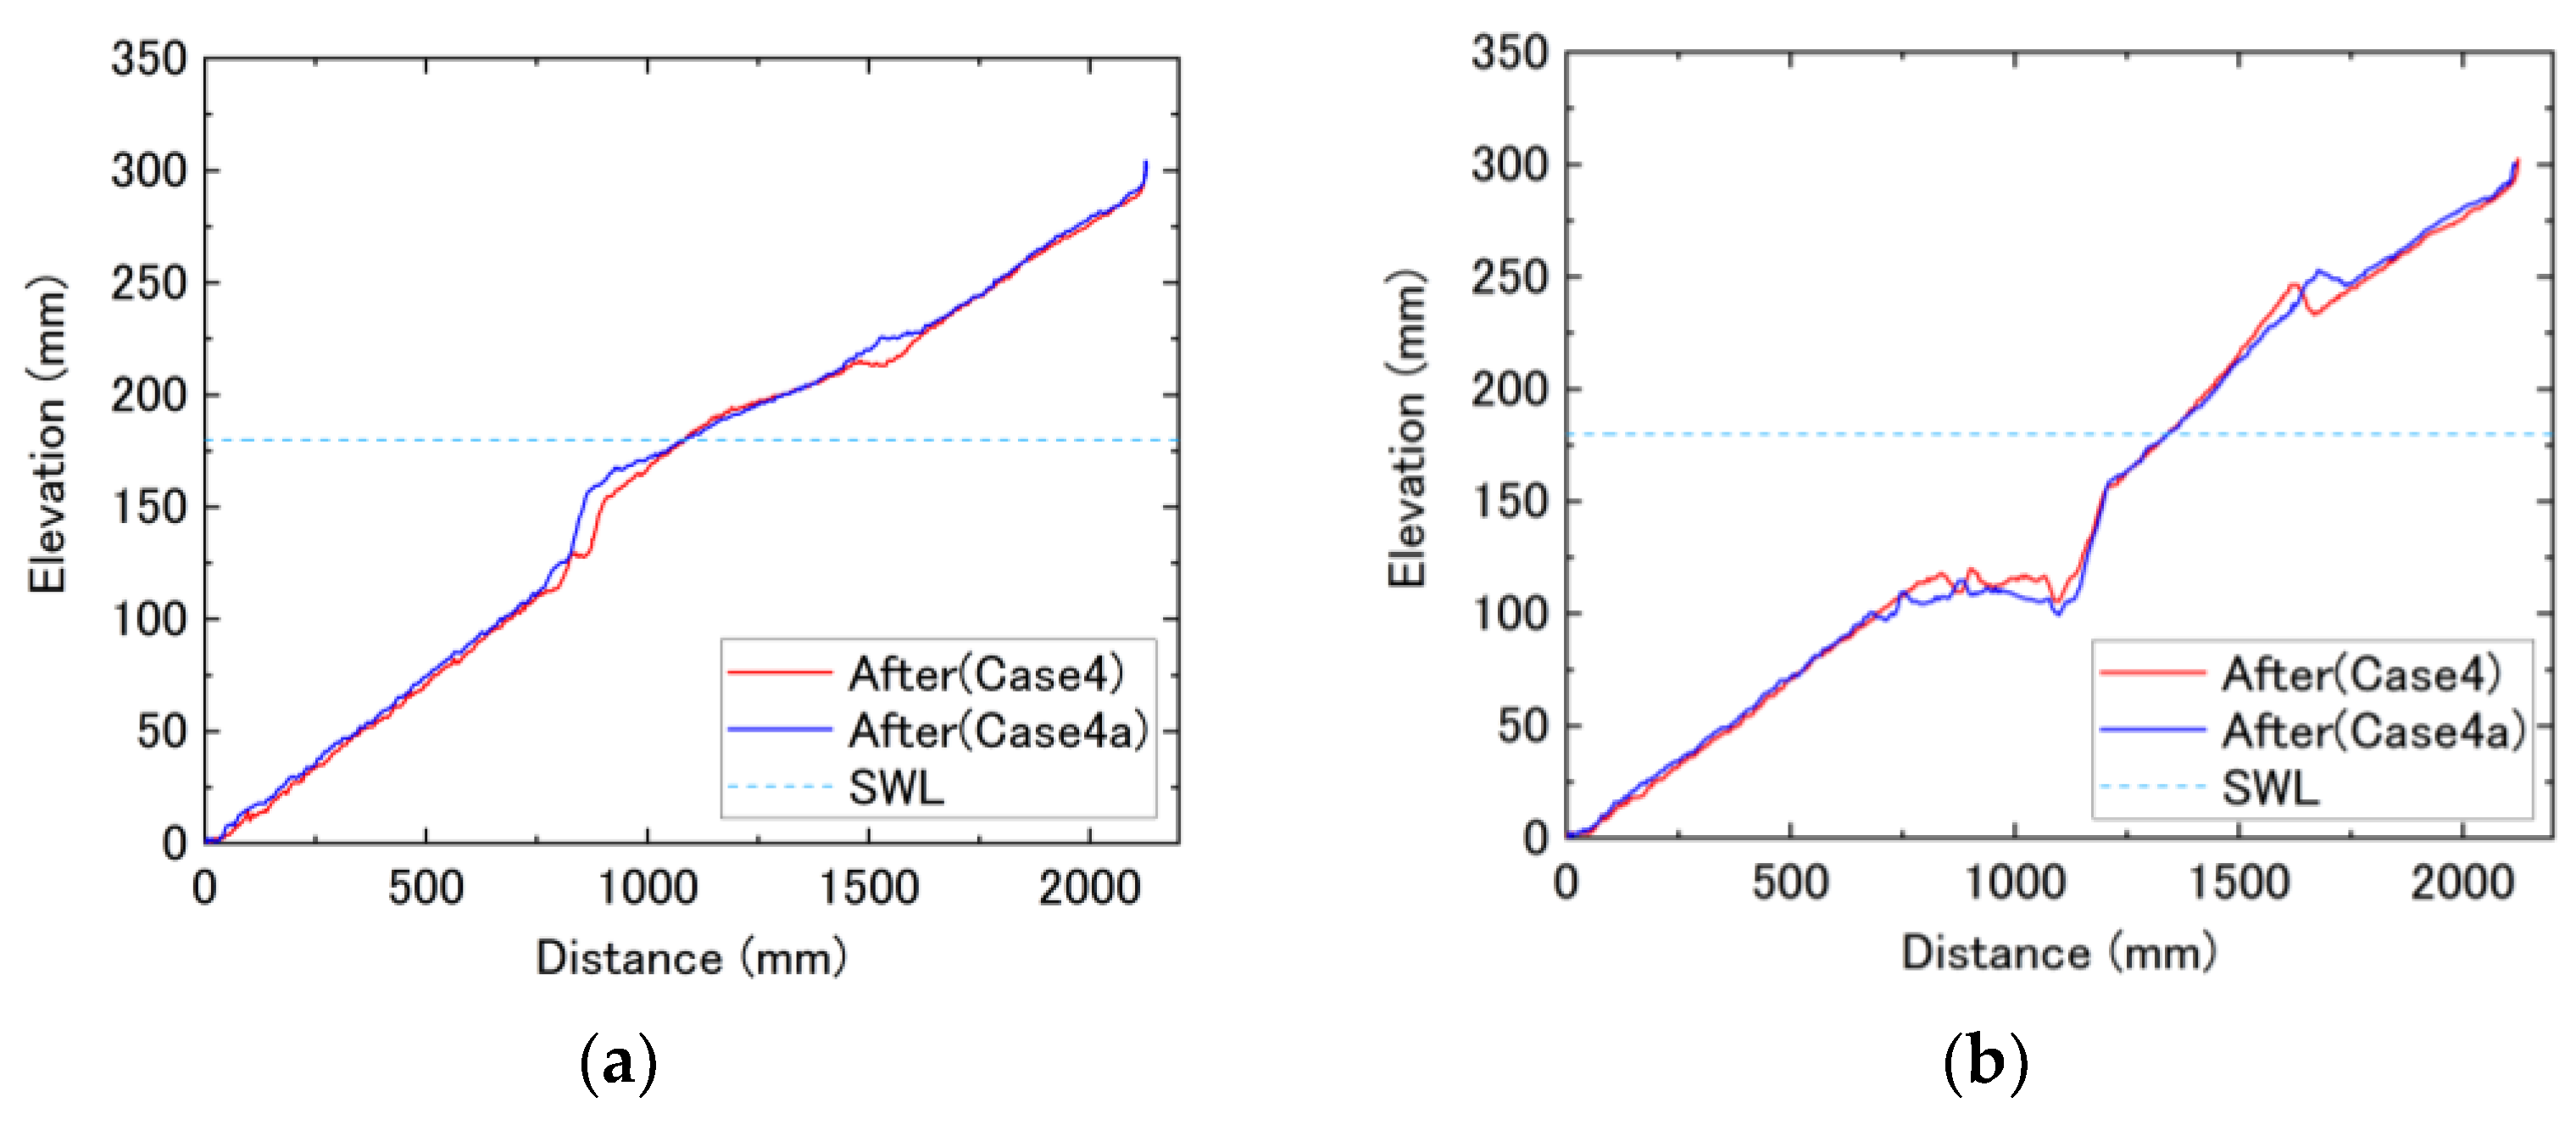
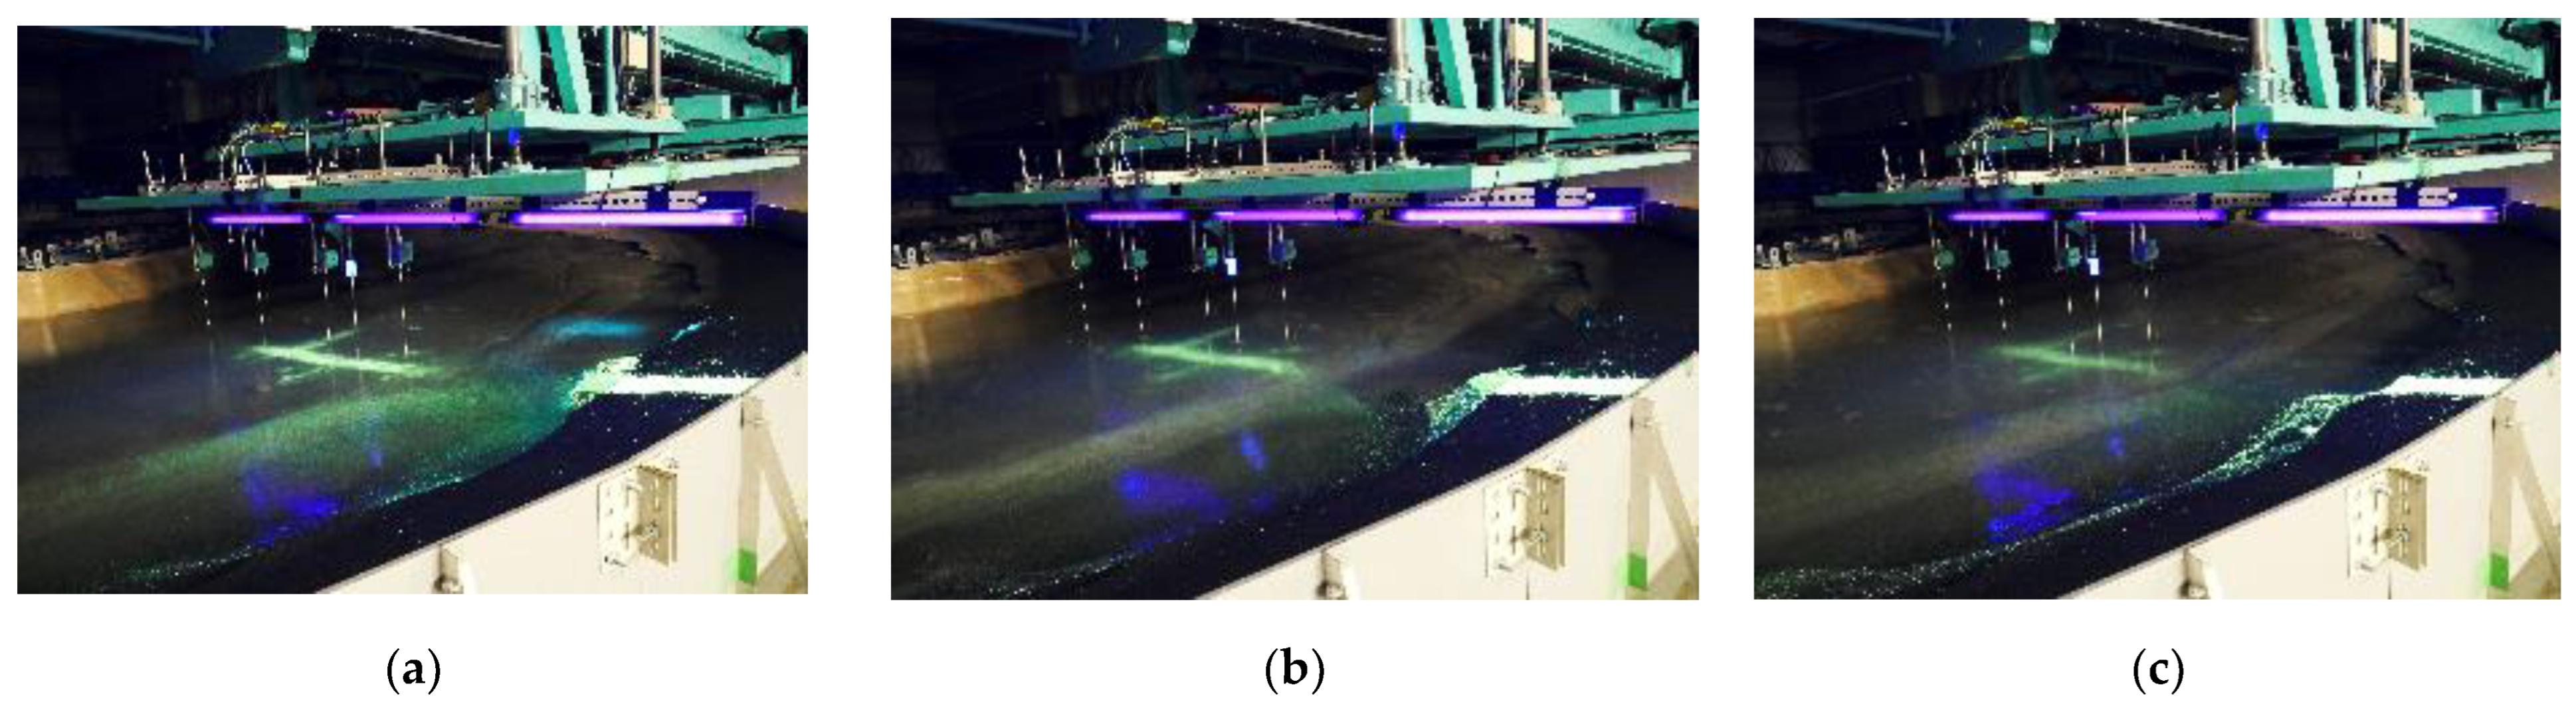
To observe the dynamic characteristics of sediment transport under the equilibrium condition, yellow-colored fluorescent sands were added to the topographical cross-section 1 and blue-colored fluorescent sands were added to the upper side of cross-section 1 (cross-section 2). The experiment was conducted again under the conditions that the final topography of case 1 to case 4 was considered as the initial topography (case 1a to case 4a). The sand displacement procedures were captured in photos in different time intervals, among them the movement of the sands in different time durations in case 2a, and case 4a were presented in Figure 14 and Figure 15.

Figure 14.
Snapshots of fluorescent sands movement during the experiment in Case 2a: (a) after 1 min (b) after 20 min (c) after 60 min.

Figure 15.
Snapshots of fluorescent sands movement during the experiment in Case 4a: (a) after 1 min (b) after 5 min (c) after 60 min.
In all cases, the longshore sediment transport occurred immediately after the start of wave formation, and the number of topographical changes was smaller than in the previous cases where the uniform topography was taken as the initial topography. Significant movement of the yellow-fluorescent sands in the rotational direction was observed in each case. A similar tendency was also observed in terms of the blue-fluorescent sands which were installed on the upper side of cross-section 1. In addition, it was observed that the fluorescent sands on the upper beach face were submerged and eroded by the incoming flow, and the eroded sands accumulated at the cross-sectional area following the downstream flow. Although the equilibrium topography was considered in these cases, the erosion and accretion were continued during the experiment. However, the sediment transport rates were significantly lower enough compared with the uniform topography cases. Since the waves were propagated obliquely along the shore and the breaking wave positions were different in the alongshore direction that influenced the water surface fluctuations in the same cross-section, the accompanying water level differences influenced the generation of longshore currents in all cases. The downstream flow and the longshore currents could be responsible for the accretion and erosion procedures even in the equilibrium topography cases. The beach profile was changed due to erosion and accretion processes in these cases. However, the dynamic processes of beach deformation were different in different wave conditions, whereas the wave heights and wave periods the wave breaking positions were different in a cross-section in different cases. A similar mechanism of beach topography changes on the upper beach face was investigated by Xiao et al. [25]; however, the mechanisms of longshore sediment transport and beach topography changes were not discussed clearly in the previous studies. On the other hand, the processes of longshore and cross-shore sediment transport and the beach profile changes along with the bar and berm formation could be observed on a natural sea beach; however, it would be difficult to measure the bar and berm formation and migration, sediment transport rate and differentiate the significant differences of sand displacement procedures and beach deformation in different wave heights and wave periods, which could be observed clearly in a circular wave tank.
The sand displacement characteristics were similar to the uniform topography cases (case 1 to case 4). The fluorescent sands concentrated near the bar earlier and progressed toward the alongshore direction rapidly compared with the uniform topography cases. The fluorescent sands disappeared in all cases, similar to the previously conducted experiments within the time zone. However, the disappearance rates were lower compared with the uniform topography cases in the same wave period. On the other hand, the longshore current generation and the fluorescent sands disappearance procedure were noticed at earlier time stages in those cases where the rotation speed of the wave-making device was increased gradually and high in wave heights; it was perceived remarkably in case 4a, shown in Figure 15. A similar relationship between the longshore sediment transport and breaking waves was found in other cases in uniform sloping conditions. Focusing on the changes in sediment transport in individual cases, it was observed that the movement of fluorescent sands was faster in case 4a, and the yellow fluorescent sands were moved earlier to the lower side compared with the other cases and went out of the shooting area during the experiment. At the same time, the blue fluorescent sands were found in the yellow fluorescent sands installation cross-sectional area, which was installed on the upper side and confirmed from the captured photos (Figure 15) taken during the experiment. This phenomenon was also found in other cases, which indicates that the longshore current and downstream flow were the active waves driving force in equilibrium topography cases. A similar displacement procedure was also observed in cases 3a and 2a as in case 4a, but the fluorescent sand displacement rate was not as high as in case 4a. In addition, the fluorescent sand movement along the longshore direction was earlier and more prominent in equilibrium topography compared with the uniform topography, which could be confirmed from the comparison of captured photos at the same time and wave periods in case 2 (Figure 10) and case 2a (Figure 14) respectively. On the other hand, the fluorescent sand movement was not significantly observed along the shoreline direction in case 1a, the sands displacement was more dominant in the offshore direction, and displaced sands accumulated nearest the bar. As a result, the bar retreated towards the offshore direction in this case. The longshore current generation and sediment transport were not prominent due to the smaller wave heights and equilibrium topography in this case.
Considering the sand displacement procedures in all cases, it can be concluded that the incident wave height, wave periods, and wave breaking positions had a significant influence on the longshore current generation that acted as the wave driving force during the experiment and the longshore sediment transport was responsible for the deformation of a beach profile in a circular wave-making tank.
4. Conclusions
The sediment transport processes have been investigated by a circular hydraulic model experiment with a non-rotational spiral wave maker, which can generate spiral waves in a circular wave basin. The experimental results have shown that the movement of sand in the offshore direction was predominant and approached the settlement of sand displacement along the cross-shore direction in the initial stages, then the longshore sediment transport was dominant at the second stages. The sand movement in two-step characteristics was observed in the vicinity of the bar and berm. The time duration of the fluorescent sand disappearance procedures was different in different wave and sloping conditions. The fluorescent sand disappearance rates were influenced by the incident wave heights and wave periods in both uniform and equilibrium topography cases. The downstream flow deposited the sand nearest the bar in the earlier stage, then the longshore current and the downstream flow acted as the wave driving force during the experiment in each case. In addition, the sand displacement procedure suggests a relationship between the downstream flow and longshore sediment transport. The bar positions were not the same on the same radius in each case which indicates that the wave breaking positions were not the same in a single case, and the differences in wave breaking on the beach profile could influence the gradient of the average water levels and the development of longshore currents in the experiment. The experimental results have assumed the relationship between the wave breaking position, bar position, the sediment transport due to the longshore sediment transport processes, and the beach profile deformation in the experiment.
However, the shapes of the waves (skewness and asymmetry, etc.) and the spatial changes of wave breaking positions were not measured due to the limitation of measurement devices during the experiment, which is important to describe the temporal changes of the beach profiles quantitively and could be considered in future. In addition, the wave reflection and the formation of standing waves between the beach and wave generator have not been discussed due to the lack of experimental data and the setup facility of measurement devices in the experiment. In addition, the incident wave angles, sediment transport rate, and wave set-up were not measured in this study, and sediment transport processes were observed only in 1:7 sloping cases, so further experimental and numerical studies are needed to understand the mechanisms of generated wave propagation and sediment transport on different sloping beach profiles and the influences of other factors on beach deformation. Besides these, the wave height and velocity measurement devices could be set up in more than two measurement cross-sections to understand the beach profile changes comprehensively due to sediment transport in different cross-sections of the beach profile, which were set up only one and two cross-sections in this study; also the wave basin size could be extended to investigate the significant differences in the longshore current generation and beach deformation procedures on a long beach profile.
By overcoming the above-mentioned limitations in the experiment, it will be possible to figure out the influence of incident wave angles and wave heights on wave breaking, spatial changes of wave breaking positions, and the shape of the waves on a sloping beach and also a relationship can be found between the wave breaking positions, bar and berm formation and migration and sediment displacement procedure during the experiment. Besides these, the causes of differences in beach profile changes at different cross-sections on a sloping beach can be significantly observed. It can be possible to find a relationship between the influences of the longshore current generation, downstream flow, and longshore sediment transport on beach deformation of a sloping beach topography. Finally, it will be possible to propose an effective countermeasure against beach erosion.
Author Contributions
Conceptualization, M.S.I. and N.M.; methodology, M.S.I. and N.M.; software, M.S.I. and T.N.; validation, M.S.I. and N.M.; formal analysis, M.S.I. and N.A.; investigation, M.S.I.; writing—original draft preparation, M.S.I. and N.M.; writing—review and editing, T.N. and Y.-H.C.; supervision, N.M.; All authors have read and agreed to the published version of the manuscript.
Funding
This research was supported by the Japan Society for the Promotion of Science (JSPS) under Grant-in-Aid for Scientific Research (B) (PI: Norimi Mizutani; Grant No.: 19H02247).
Institutional Review Board Statement
Not applicable.
Informed Consent Statement
Not applicable.
Data Availability Statement
Not applicable.
Acknowledgments
M.S.I. is cordially grateful to the Ministry of Education, Culture, Sports, Science and Technology (MEXT), Japan, for his financial support.
Conflicts of Interest
The authors declare no conflict of interest.
References
- Carter, C.H.; Guy, E.D., Jr. Coastal erosion: Processes, timing and magnitudes at the bluff toe. Mar. Geol. 1988, 84, 1–17. [Google Scholar] [CrossRef]
- Van Rijn, L.C. Coastal erosion and control. Ocean Coast. Manag. 2011, 54, 867–887. [Google Scholar] [CrossRef]
- Lloyd, M.G.; Peel, D.; Duck, R.W. Towards a social-ecological resilience framework for coastal planning. Land Use Policy 2013, 30, 925–933. [Google Scholar] [CrossRef]
- Williams, A.T.; Rangel-Buitrago, N.; Pranzini, E.; Anfuso, G. The management of coastal erosion. Ocean Coast. Manag. 2018, 156, 4–20. [Google Scholar] [CrossRef]
- Ratnayakage, S.M.S.; Sasaki, J.; Suzuki, T.; Jayaratne, R.; Ranawaka, R.A.S.; Pathmasiri, S.D. On the status and mechanisms of coastal erosion in Marawila Beach, Sri Lanka. Nat. Hazards 2020, 103, 1261–1289. [Google Scholar] [CrossRef]
- Aagaard, T.; Black, K.P.; Greenwood, B. Cross-shore suspended sediment transport in the surf zone: A field-based parameterization. Mar. Geol. 2002, 185, 283–302. [Google Scholar] [CrossRef]
- Wang, P.; Smith, E.R.; Ebersole, B.A. Large-scale laboratory measurements of longshore sediment transport under spilling and plunging breakers. J. Coast. Res. 2002, 18, 118–135. [Google Scholar]
- Puleo, J.A.; Beach, R.A.; Holman, R.A.; Allen, J.S. Swash zone sediment suspension and transport and the importance of bore-generated turbulence. J. Geophys. Res. Ocean. 2000, 105, 17021–17044. [Google Scholar] [CrossRef]
- Mariño-Tapia, I.J.; Russell, P.E.; O’Hare, T.J.; Davidson, M.A.; Huntley, D.A. Cross-shore sediment transport on natural beaches and its relation to sandbar migration patterns: 1. Field observations and derivation of a transport parameterization. J. Geophys. Res. Ocean. 2007, 112, C03001. [Google Scholar] [CrossRef]
- Günaydin, K.; Kabdaşli, M.S. Characteristics of coastal erosion geometry under regular and irregular waves. Ocean Eng. 2003, 30, 1579–1593. [Google Scholar] [CrossRef]
- Kobayashi, N.; Lawrence, A.R. Cross-shore sediment transport under breaking solitary waves. J. Geophys. Res. Ocean. 2004, 109, C03047. [Google Scholar] [CrossRef]
- Sunamura, T.; Horikawa, K. Two-dimensional beach transformation due to waves. In Proceedings of the 14th ASCE Coastal Engineering. Conference, Copenhagen, Denmark, 24–28 June 1974; pp. 920–938. [Google Scholar]
- Ozolcer, I.H. An experimental study on geometric characteristics of beach erosion profiles. Ocean Eng. 2008, 35, 17–27. [Google Scholar] [CrossRef]
- Kobayashi, N. Analytical Solution for Dune Erosion by Storms. J. Waterw. Port Coast. Ocean Eng. 1987, 113, 401–418. [Google Scholar] [CrossRef]
- Othman, I.K.; Baldock, T.E.; Callaghan, D.P. Measurement and modelling of the influence of grain size and pressure gradient on swash uprush sediment transport. Coast. Eng. 2014, 83, 1–14. [Google Scholar] [CrossRef]
- Demirci, M.; Aköz, M.S. An investigation on the formation of submerged bar under surges in sandy coastal region. China Ocean Eng. 2012, 26, 535–546. [Google Scholar] [CrossRef]
- Eichentopf, S.; Cáceres, I.; Alsina, J.M. Breaker bar morpho dynamics under erosive and accretive wave conditions in large-scale experiments. Coast. Eng. 2018, 138, 36–48. [Google Scholar] [CrossRef]
- Mizuguchi, M.; Horikawa, K. Experimental Study on Longshore Current Velocity Distribution. Bull. Fac. Sci. Eng. 1978, 21, 123–149. [Google Scholar]
- Visser, P.J. Laboratory measurements of uniform longshore currents. Coast. Eng. 1991, 15, 563–593. [Google Scholar] [CrossRef]
- Hamilton, D.G.; Ebersole, B.A. Establishing uniform longshore currents in a large-scale sediment transport facility. Coast. Eng. 2001, 42, 199–218. [Google Scholar] [CrossRef]
- Liangduo, S.; Qinqin, G.; Zhili, Z.; Lulu, H.; Wei, C.; Mingtao, J. Experimental study and numerical simulation of mean longshore current for mild slope. Wave Motion 2020, 99, 102651. [Google Scholar] [CrossRef]
- Rahman, R.; Jayaratne, R.; Tejada-Martinez, A.E.; Wang, P. Numerical investigation of beach profile evolution using a new sediment concentration model. Proc. Coast. Sediments 2015, 2015, 1–12. [Google Scholar] [CrossRef]
- Ma, Y.; Chen, H.; Ma, X.; Dong, G. A numerical investigation on nonlinear transformation of obliquely incident random waves on plane sloping bottoms. Coast. Eng. 2017, 130, 65–84. [Google Scholar] [CrossRef]
- Sasaoka, S.; Noguchi, K.; Suwa, Y.; Kobayashi, H.; Watanabe, A.; Takagi, T. A beach profile change model including three transport processes. In Proceedings of the 6th International Conference of Coastal Dynamics, Tokyo, Japan, 7–11 September 2009; pp. 1–13. [Google Scholar]
- Xiao, M.; Long, T. Numerical modelling of wave-induced beach profile change with a two-phase SPH scheme. In Proceedings of the 8th International Congress on Environmental Modelling and Software, IEMSs, Toulouse, France, 12 July 2016; pp. 1–8. [Google Scholar]
- Larson, M. Model of Beach Profile Change under Random Waves. J. Waterw. Port Coast. Ocean Eng. 1996, 122, 172–181. [Google Scholar] [CrossRef]
- Huang, C.-J.; Zhang, E.C.; Lee, J.F. Numerical Simulation of Nonlinear Viscous Wavefields Generated by Piston-Type Wavemaker. J. Eng. Mech. 1998, 124, 1110–1120. [Google Scholar] [CrossRef]
- Tabasi, M.; Soltanpour, M.; Suzuki, T.; Jayaratne, R. Modeling of berm formation and erosion at the southern coast of the Caspian Sea. Coast. Eng. Proc. 2020, 36, 19. [Google Scholar] [CrossRef]
- Dalrymple, R.A.; Dean, R.G. The spiral wavemaker for littoral drift studies. In Proceedings of the 13th Coastal Engineering Conference, Vancouver, BC, Canada, 10–14 July 1972; pp. 689–705. [Google Scholar]
- Mei, C.C. Shoaling of spiral waves in a circular basin. J. Geophys. Res. 1973, 78, 977–980. [Google Scholar] [CrossRef]
- Trowbridge, J.; Dalrymple, R.A.; Suh, K. A simplified second-order solution for a spiral wave maker. J. Geophys. Res. Ocean 1986, 91, 11783–11789. [Google Scholar] [CrossRef]
- Williams, A.N.; McDougal, W.G. Hydrodynamic analysis of variable draft spiral wavemaker. Ocean Eng. 1989, 16, 401–410. [Google Scholar] [CrossRef]
- Suh, K.; Dalrymple, R.A. Offshore Breakwaters in Laboratory and Field. J. Waterw. Port Coast. Ocean Eng. 1987, 113, 105–121. [Google Scholar] [CrossRef]
- Thomas, F. Sample NEES Presentation Thomas Finholt School of Information University of Michigan. 2015. Available online: https://slideplayer.com/slide/5065618/ (accessed on 11 November 2020).
- Katoh, K.; Yanagishima, S. Berm Formation and Berm Erosion. In Proceedings of the 23rd International Conference on Coastal Engineering, ASCE, Venice, Italy, 4–9 October 1992; pp. 2136–2149. [Google Scholar] [CrossRef]
- Suzuki, T.; Takeuchi, M.; Tomoda, N.; Yamaguchi, S.; Kuriyama, Y. Spatial distribution of cross-shore sediment transport rate for berm formation and erosion. In Proceedings of the Coastal Sediments ’07—6th International Symposium on Coastal Engineering and Science of Coastal Sediment Processes, ASCE, New Orleans, LA, USA, 13–17 May 2007; pp. 2037–2048. [Google Scholar]

Publisher’s Note: MDPI stays neutral with regard to jurisdictional claims in published maps and institutional affiliations. |
© 2022 by the authors. Licensee MDPI, Basel, Switzerland. This article is an open access article distributed under the terms and conditions of the Creative Commons Attribution (CC BY) license (https://creativecommons.org/licenses/by/4.0/).