Article

Tempo-Spatial Distribution of an Endangered Fish Species, Threadfin Porgy Evynnis cardinalis (Lacepède, 1802), in the Northern South China Sea

1
South China Sea Fisheries Research Institute, Chinese Academy of Fishery Sciences, Guangzhou 510300, China
2
Key Laboratory of Open-Sea Fishery Development, Ministry of Agriculture and Rural Affairs, Guangzhou 510300, China
*
Author to whom correspondence should be addressed.
J. Mar. Sci. Eng. 2022, 10(9), 1191; https://doi.org/10.3390/jmse10091191
Submission received: 9 August 2022 / Revised: 18 August 2022 / Accepted: 22 August 2022 / Published: 26 August 2022
(This article belongs to the Section Marine Biology)

Abstract

:
Accurate information on the temporal and spatial distribution of fish stocks is necessary for informed management and conservation of fisheries resources. We report on the temporal and spatial variation in biomass and density of a hitherto little-studied species of commercial importance, the threadfin porgy Evynnis cardinalis, it was listed as endangered (EN) in a recent International Union for Conservation of Nature (IUCN) red list, on the northern South China Sea continental shelf, using data collected during fisheries surveys from 2014 to 2015. Seasonal variation in the frequency of occurrence of E. cardinalis in trawl samples on this shelf was highest during summer (68.57%) and lowest during winter (31.43%). Average biomass was highest in autumn (33.05 kg·km−2) and density was highest in spring (936 ind·km−2). The highest annual average biomass (41.6 kg·km−2) and density (1021 ind·km−2) occurred off Shantou, and the lowest occurred off Zhanjiang (7.2 kg·km−2 and 165 ind·km−2, respectively); seasonal patterns in density are more similar in waters off Yangjiang and Shantou than elsewhere. The highest annual average biomass occurred at 40 m depth (56.9 kg·km−2), and the highest annual average density (1084 ind·km−2) occurred at 30 m depth. Density of E. cardinalis varied with depth, with lower densities occurring in shallow and deeper waters, and higher densities at intermediate depths.

1. Introduction

The northern continental shelf of the South China Sea (NCS SCS) is bathed in tropical and subtropical waters. Because a variety of widely distributed fishery resources occur here, and the area has been extensively bottom trawled, many fishery resources have been overfished, with resource densities decreased by 72% from the early 1960s to the late 1990s [1]. To protect these resources in this area, the Ministry of Agriculture in China initiated a summer fishing moratorium on fishing from 1999 to enable their recovery [2]. Several subsequent surveys of fishery resources in this region have revealed resource densities to fluctuate, but to not vary dramatically, possibly because of the summer fishing moratorium.
Fishing pressure and environmental change have driven change in fishery resources in offshore and continental shelf waters [3,4,5]. Because the NCS SCS is situated near the Guangdong–Macao–Hong Kong Greater Bay Area (GBA), it is exposed to the effects of fishing, aquaculture, and industrialization [6,7,8]. This sea area is also the spawning ground for many marine fish species [9,10]. While the status of several of these fish of economic importance (e.g., white croaker (Pennahia argentat) [11], mackerel scad (Decapterus maruadsi) [12], golden threadfin bream (Nemipterus virgatus) [13], yellowbelly threadfin bream (N. bathybius) [14]) has been described, the status of the economically important threadfin porgy (Evynnis cardinalis (Lacepède, 1802)) has not, it was listed as endangered (EN) in a recent IUCN red list and is threatened mainly by overexploitation [15]. This species occurs mainly along China’s southeastern coast and in Beibu Gulf and is mainly caught in bottom-trawl fisheries.
Resource shifts, life history parameters, and migration of E. cardinalis in Beibu Gulf were reported [16,17,18]. Cai et al. [19] found that CPUE (catch per unit effort) of E. cardinalis was described as trending upward in the Beibu Gulf. Because E. cardinalis is an economically important species in the NCS SCS, variation in its density can affect local fishery production and ecosystems. The South China Sea Fisheries Research Institute of the Chinese Academy of Aquatic Sciences surveyed bottom-trawling fishery resources in the NCS SCS from 1964–1965 and 1997–1999 [20]. Although the density of E. cardinalis was analyzed, these data might not represent the current status of these stocks. Therefore, further systematic studies were conducted to explore the temporal and spatial distribution of E. cardinalis density and biomass with four surveys in the NCS SCS from 2014 to 2015. We aim to quantify the density and biomass of E. cardinalis in the NCS SCS, describe patterns in its distribution in space and time, and identify any apparent pattern. These results will enable improved development and conservation of this important fisheries resource in this area [21,22].

2. Materials and Methods
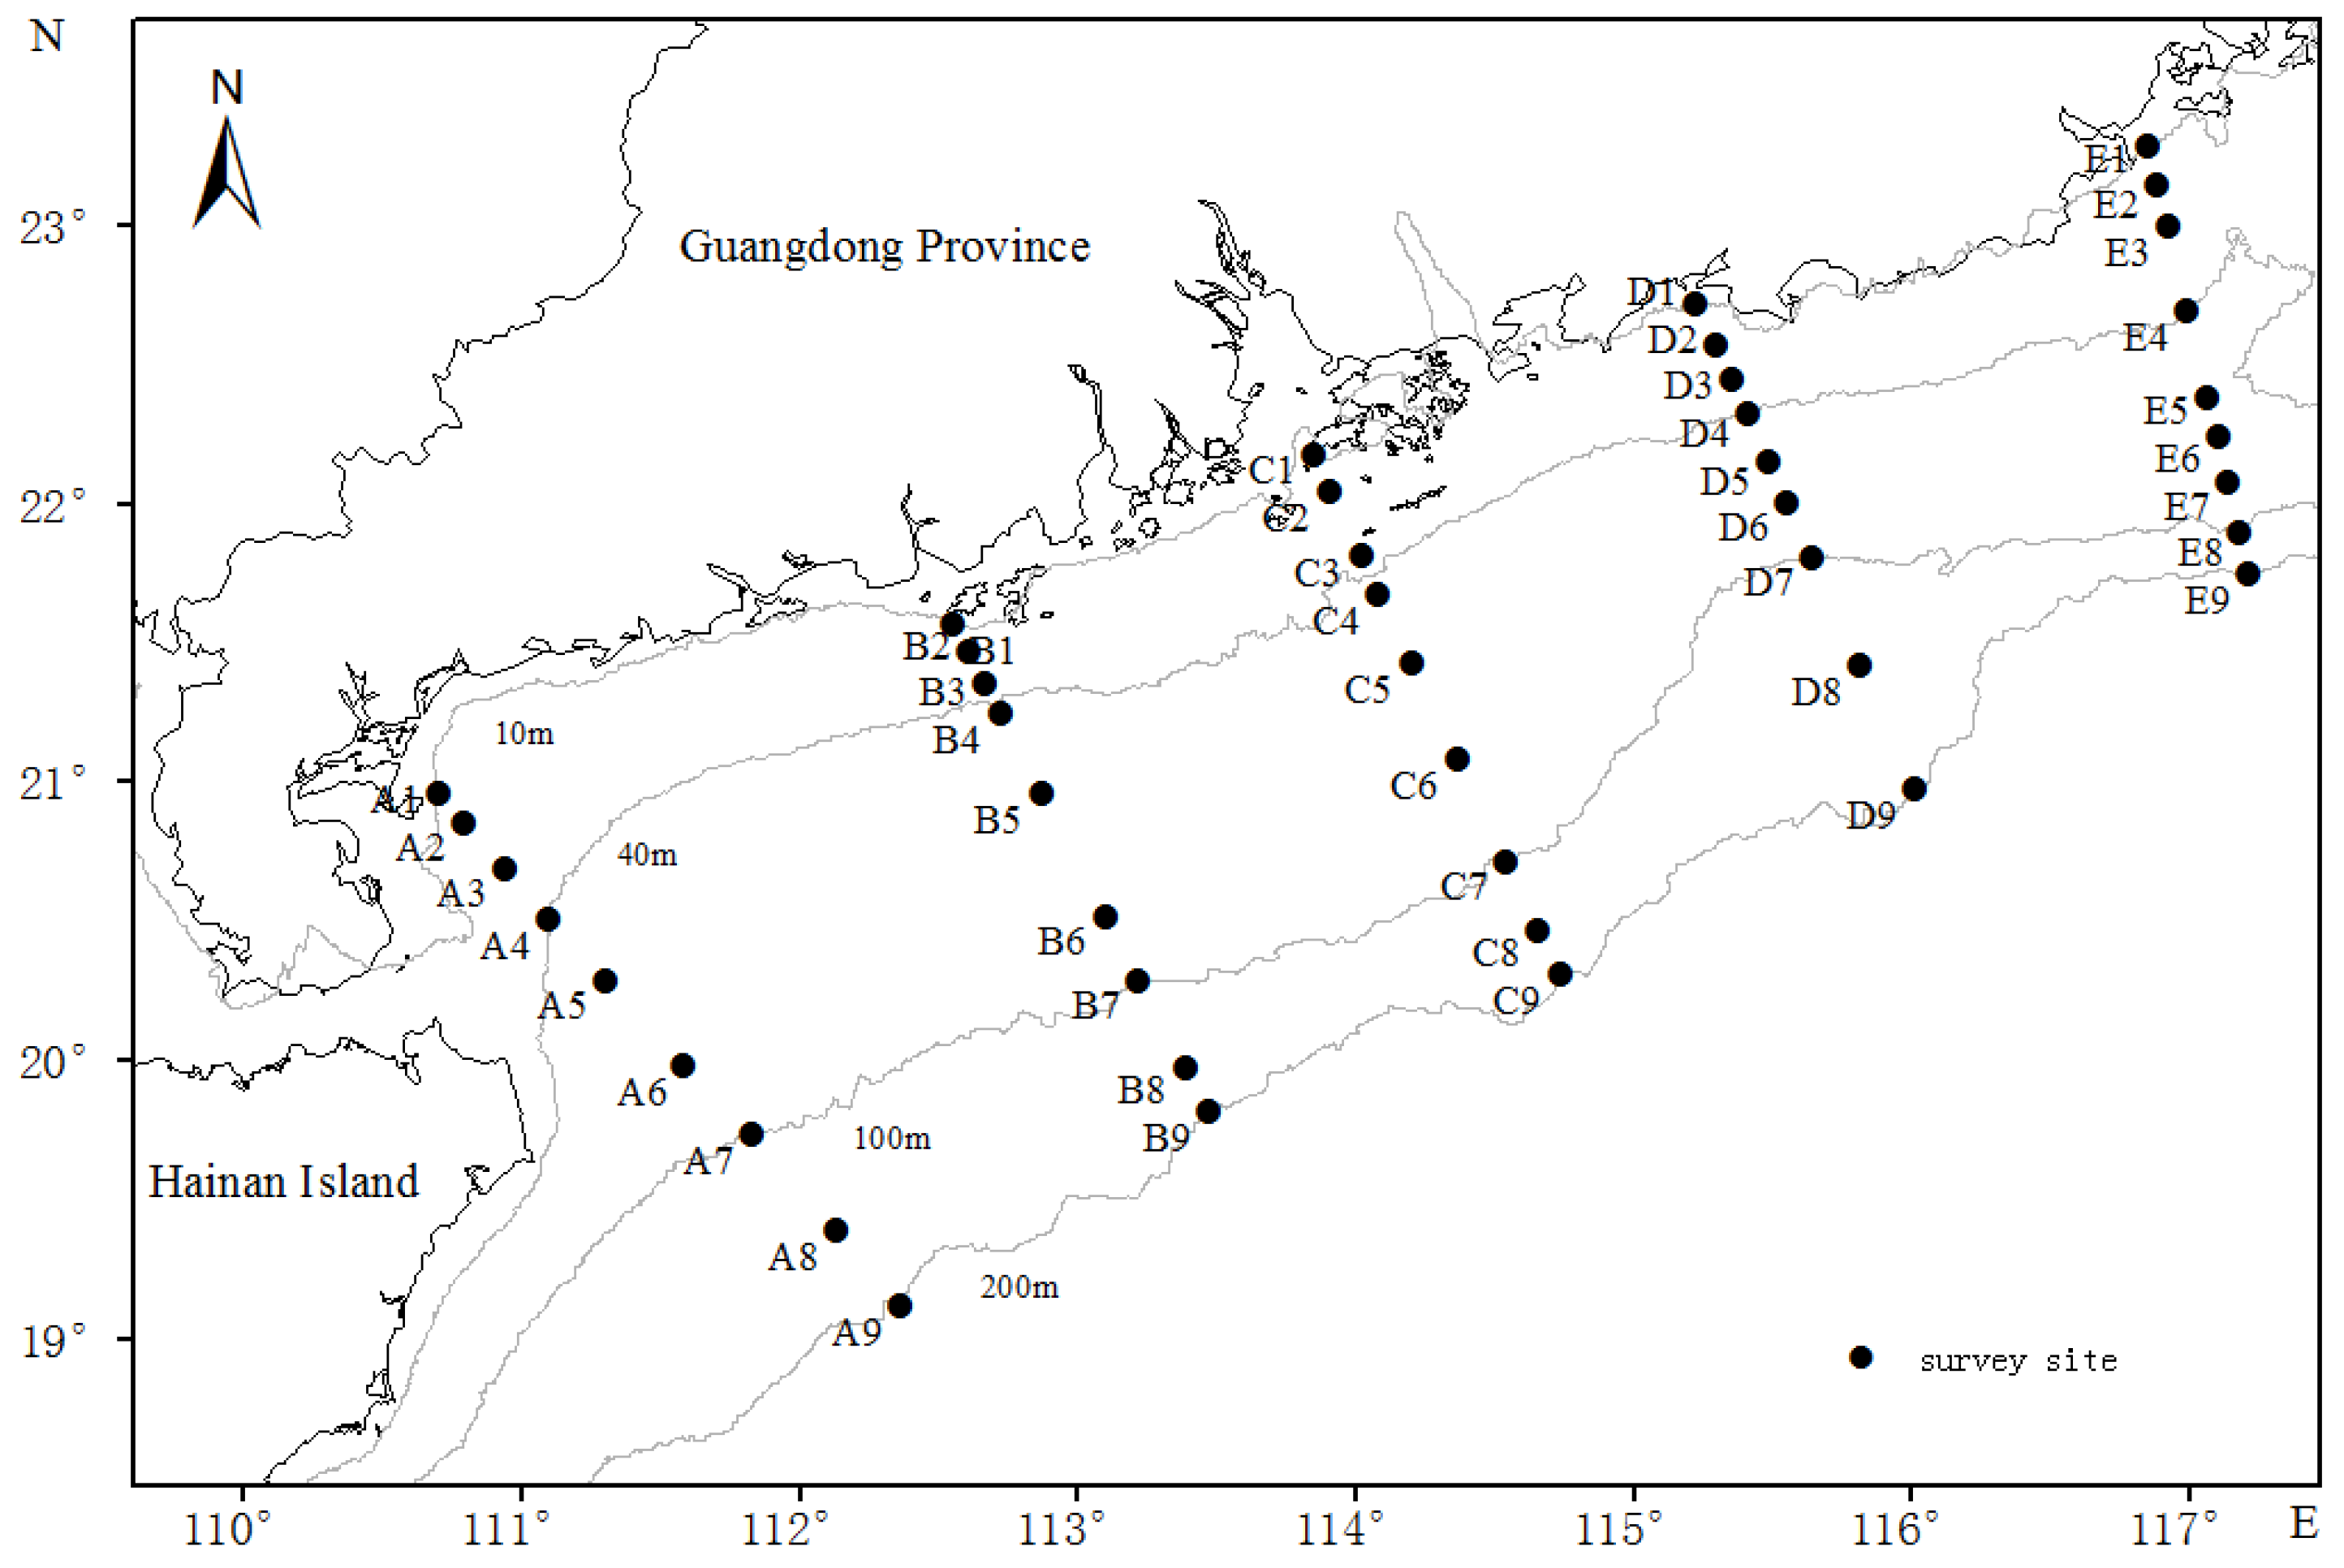
2.1. Data Sources

Data were acquired from four bottom-trawl surveys conducted by the South China Sea Fisheries Research Institute of the Chinese Academy of Fisheries (Guangzhou, China) in offshore waters of the northern South China Sea from 2014 to 2015. Surveys occurred in July–August (summer) and October–November of 2014 (autumn), and January–February (winter) and April–May of 2015 (spring), aboard the bottom trawler “Beiyu 60011.” The main engine power of the fishing boat is 514.5 kW, 253 t, the hull length is 36.8 m, and the width is 6.8 m. The net used was 60.54 m in length, had a mouth perimeter of 80.4 m, headline float length 37.70 m, and mouth and cod-end meshes of 200 and 40 mm, respectively. Because the main environmental factors and biological communities on the continental shelf are stratified by depth, sampling occurred along bathymetric contours (10, 20, 30, 40, 60, 80, 100, 140, and 200 m; labeled 1–9, respectively, in Figure 1) at nine sites within each of five sections (45 sites in total): Zhanjiang (A1–A9), Yangjiang (B1–B9), Pearl River Estuary (C1–C9), Shanwei (D1–D9), and Shantou (E1–E9) (Figure 1). At each site the net was trawled once for 1 h at an average towing velocity of 3.5 kn. Surveys were performed in accordance with “Specifications for Oceanographic Survey” (GB/T12763-2007), and relevant technical specifications and regulations.

2.2. Data Analysis

Biomass and density of E. cardinalis were calculated using the swept-area method and the following equations [23]:
S = C a x 1
a = v t · h x 2
For Equation (1), S represents resource density, C total catch, a swept area per net, and x1 escape rate (0.5) [24]. For Equation (2), v represents towing velocity, t trawl duration, h headline float length, and x2 the ratio of headline float length (0.5) [23]. S is calculated using biomass (SB) and number of catches (SI).
Because no E. cardinalis were caught at sites >100 m (sites 8 and 9 along each transect within each section), average resource density was calculated based on data for each of the seven remaining sites per section (35 sites in total). Primer6 [25] was used to cluster data for seasonal and spatial variation in E. cardinalis density and biomass. The differences in biomass among the different seasons were tested using one-way analysis of variance (ANOVA). We used the Kruskal–Wallis test to compare the differences in the temporal distribution of density by depth.

3. Results

3.1. Resource Status

Bottom trawl survey data from 2014 to 2015 (Table 1) reveal seasonality in the frequency of occurrence of E. cardinalis in NCS SCS waters, from >60% during spring and summer to 31.43% during winter. Biomass differed slightly between spring, summer, and autumn (ANOVA test, p > 0.05), was highest in autumn (33.05 kg·km−2), and lowest in winter (3.58 kg·km−2). Density was greatest in spring (936 ind·km−2), lower in summer (662 ind·km−2), and lowest (31 ind·km−2) in winter.

3.2. Spatial and Seasonal Variation in Biomass and Density

3.2.1. Biomass

Biomass was calculated using the swept-area method, and its distribution varied seasonally (Figure 2). Biomass was highest at site E3 in spring (628.6 kg·km−2) and had three high-yield sites (SB ≥ 130.0 kg·km−2) in both summer and autumn, and one in spring (none in winter). Of relatively high-yield sites (23.9 kg·km−2 < SB < 130.0 kg·km−2), six occurred in autumn, three in both summer and spring, and two in winter. Seven moderate-yield sites (10.0 kg·km−2 ≤ SB < 23.9 kg·km−2) occurred in spring, in addition to five in summer and three in winter, with two sites occurring in autumn. Low-yield sites (0.1 kg·km−2 ≤ SB < 10 kg·km−2) occurred mainly in summer (13) and spring (12), with six occurring in autumn and winter. No E. cardinalis were caught at 24 sites in winter, 18 sites in autumn, 12 sites in spring, and 11 sites in summer. Significant differences exist in the distribution of biomass by season (Kruskal–Wallis test, p < 0.05).

3.2.2. Density

Density and biomass of E. cardinalis varied spatially and temporally (Figure 3). The highest densities occurred at site E3 in spring (14,662 ind·km−2) when average densities were also highest, with seven high-yield sites (SI ≥ 1000 ind·km−2). There were five high-yield sites in summer, four in autumn, and none in winter. There were more significant differences in the seasonal distribution of density than there were for biomass (Kruskal–Wallis test, p < 0.01).

3.3. Variation in Density and Biomass with Section

For the Yangjiang section, average biomass was highest during summer (100.4 kg·km−2) and lowest during winter (0.8 kg·km−2). Annual average biomass was highest in the Shantou section (41.6 kg·km−2), followed by the Yangjiang section (41.4 kg·km−2); annual average biomasses in Pearl River Estuary and Shanwei sections were similar; the lowest value occurred in the Zhanjiang section (7.2 kg·km−2). Average biomass peaked in summer in the Zhanjiang section, while levels in the other three seasons were similar. In the Yangjiang and Shantou sections there was similar seasonal variation, although the highest density in the Yangjiang section occurred during summer, and whereas this occurred during spring in the Shantou section. For the Pearl River Estuary section, biomass was always < 10.0 kg·km−2 except during autumn (50.1 kg·km−2). Density in the Shanwei section was highest in autumn and lowest in winter.
Average density was highest in the Shantou section in spring (2717 ind·km−2) and lowest in the Yangjiang section in winter (9 ind·km−2). Spatial trends in density were similar to those of biomass (Figure 4).
Relationships between average biomass, density, season, and section were explored using cluster analysis (Figure 5). There was no obvious pattern between location, season, and biomass. Seasonal distributions in biomass and density at Pearl River Estuary and Shanwei sections were most similar. Seasonal and spatial variation in biomass was observed, just like in density of Evynnis cardinalis. The Shantou section forms a self-contained cluster since it has the lowest similarity with other sections.

3.4. Variation in Density and Biomass with Depth

The highest density (4053 ind·km−2) and biomass (149.0 kg·km−2) occurred at 30 m. No E. cardinalis were caught at depths of 10 and 20 m in autumn, or 10 and 30 m in winter. Densities of E. cardinalis varied with depth and were lower in shallower and deeper waters, and higher in between. The highest densities occurred at 30 and 40 m, followed by 60, 20, and 100 m; the lowest densities occurred at 10 and 80 m (Figure 6). Differences in the temporal distribution of density by depth were significant (Kruskal–Wallis test, p < 0.01).
Cluster analysis (Figure 7) revealed the 40 and 60 m depths to be most similar in their average densities and temporal trends, with results for density dividing into three clusters: (1) 40, 60, and 80 m, with uniformly distributed high density; (2) 100 m, with relatively uniformly distributed low density; and (3), the remaining depths (10–30 m) with non-uniformly distributed density.

4. Discussion

4.1. Seasonal Variation

Evynnis cardinalis is a major commercial fish species caught by bottom trawling in coastal waters of the northern South China Sea, the catch of which varies within and between years. The biomass of this species had declined from 7.8 kg/km2 in 1964–1965 to 0.85 kg/km2 in 1998–1999 in the NCS SCS [1]. This reduction was mainly because of strong fishing intensity and other anthropogenic disturbances. From 1964 to 1999, the power of motorized fishing vessels increased from 128,347 to 3,146,137 kW in the NCS SCS, the fishing effort increased significantly. While the biomass of E. cardinalis in NCS SCS decreased by 89% from 1964 to 1999, we report its annual average biomass for 2014–2015 to have increased to 23.86 kg/km2 (3-fold higher than it was in 1964). This may be because E. cardinalis is a small demersal fish with high intrinsic growth rates, and changes in environmental factors (e.g., temperature, salinity, and precipitation) may have significantly affected its biomass [24,25].
Low-trophic-level fish resources in offshore northern South China Sea waters are relatively sensitive to runoff, tropical cyclones, upwellings, and other seasonal variations [26,27]. These fishes are, however, also characterized by high fecundity, rapid maturation, and short life cycles, which contribute to their rapid ability to regenerate, and their relative resilience to any deleterious effects of fishing [28]. Overfishing has changed the composition of bottom-trawl fishery catch in the NCS SCS, with the abundance of large, high-quality species having decreased markedly, and that of smaller, lower-value fish having increased [29,30]. Because of this, the habitat, food, and predation pressure on E. cardinalis have all decreased. Spawning populations of E. cardinalis are mainly 1 year old, with the proportion of individuals in populations born in a current year being large, leading to an increase in their density despite an overall decline in marine fishery resource status [31].
Significant cyclic fluctuations in E. cardinalis density occur in the Beibu Gulf [32]. Bottom trawling production by the South China Sea Fisheries Company from 1961 to 1974 indicates that the proportion of E. cardinalis catch to the total catch varied considerably, from 29.3% to 0.3% annually [20]. We report density to be relatively high, but that our data are inadequate to determine if our data represent a historical high.
The distribution of E. cardinalis in NCS SCS waters changes seasonally. Biomass is highest in autumn, followed by summer, spring, and winter. Density is highest in spring, followed by summer and autumn, winter is still the lowest. This seasonal variation may be a function of reproductive and growth characteristics of this species, and the timing of the summer fishing moratorium. Most E. cardinalis breed in spring [20], during which time the proportion of juveniles from the current year is relatively high, contributing to high densities for a given year. Summer surveys were performed during the fishing moratorium, when fish were allowed to grow. Consequently, biomass increased and peaked in autumn, with average individual weight also being highest throughout the year. The proportion of juvenile E. cardinalis in populations was relatively high in spring. We posit that conservation of E. cardinalis can be achieved by restricting trawl-net mesh size, and when trawling can occur [33,34,35].

4.2. Spatial Variation

Surveys from 1997–1999 reveal that E. cardinalis fishing grounds in the NCS SCS occur mainly east of the Pearl River Estuary between May and August, including shallow offshore fishing grounds east of Guangdong and southeast of Pearl River Estuary [20]. We report the main high-yield areas to include shallow offshore waters off Shantou in eastern Guangdong and off Shangchuan and Xiachuan Islands, and the Pearl River Estuary. Density also increased dramatically, possibly because of interannual variability in abundance. The Yangjiang and Shantou sections in eastern Guangdong were considered to be high-yield areas, with the highest densities occurring during spring and summer (peaking in spring in the Shantou section). This area is most likely to be a spawning ground [33].
We report sites at 40 m depth to harbor the highest annual average biomass (56.9 kg·km−2), and sites at 30 m depth to harbor the highest density (1084 ind·km−2). Density of E. cardinalis differed by depth, being lower in shallower and deeper waters, but higher at intermediate depths—a finding consistent with Jia et al. During spring, juveniles occurred mainly in shallow coastal areas at 30 m, resulting in a peak biomass of 149.0 kg·km−2 and density of 4053 ind·km−2. In summer and autumn, stocks migrated offshore to concentrate at depths of 40–60 and 100 m. From 1997–1999, largely consistent with our results, two areas with relatively high density were reported at 80–110 and 50–60 m [20].
During summer and autumn, the highest densities of E. cardinalis occurred from 40 to 60 m. This finding affects the temporal and spatial distribution of E. cardinalis fishing grounds and provides evidence of when and where to study aspects of the life history of this species in NCS SCS waters. Fish resources stressed by overfishing, environmental change and human activity, and with degraded resource status and changing structure (miniaturized and younger-aged), are becoming increasingly prominent in global marine ecosystems [21,36,37]. Because E. cardinalis is an important, commercially exploited fish in NCS SCS waters, further monitoring is warranted.

Author Contributions

Conceptualization, Z.C.; methodology, K.Z.; formal analysis, Y.X.; resources, Z.C.; data curation, Y.X., L.S. and M.S.; writing—original draft preparation, Y.X.; writing—review and editing, all authors. All authors have read and agreed to the published version of the manuscript.

Funding

The Guangzhou Basic and Applied Basic Research Project (202201010639), the Central Public-Interest Scientific Institution Basal Research Fund, CAFS (2020TD05), and the Central Public-Interest Scientific Institution Basal Research Fund, South China Sea Fisheries Research Institute, CAFS (2021SD01).

Institutional Review Board Statement

The animal study was reviewed and approved by South China Sea Fisheries Research Institute Animal welfare committee.

Informed Consent Statement

Not applicable.

Data Availability Statement

The data presented in this study are available on request from the corresponding author.

Acknowledgments

We are grateful to the entire crew of the “Beiyu 60011” for their participation in the sampling. We thank Yuyan Gong and Zhihui Zhong for their collaboration on the experiments. We also thank Steve O’Shea, from Liwen Bianji (Edanz) for editing the English text of a draft of this manuscript.

Conflicts of Interest

The authors declare no conflict of interest.

References

  1. Wang, Y.Z.; Yuan, W.W. Changes of demersal trawlfishery resources in northern South China Sea as revealed by demersal trawling. South China Fish. Sci. 2008, 4, 26–33. [Google Scholar]
  2. Su, Y.J.; Chen, G.B.; Zhou, Y.B.; Ma, S.W.; Wu, Q.E. Assessment of impact of summer fishing moratorium in South China Sea during 2015–2017. South China Fish. Sci. 2019, 15, 20–28. [Google Scholar]
  3. Wang, Y.Z.; Sun, D.R.; Chen, Z.Z.; Jia, X.P. The influence of climatic environmental factors and fishing pressure on changes of hairtail catches in the northern South China Sea. Acta Ecol. Sin. 2015, 32, 7948–7957. [Google Scholar] [CrossRef]
  4. Simpson, S.D.; Jennings, S.; Johnson, M.P.; Blanchard, J.L.; Schön, P.J.; Sims, D.W.; Genner, M.J. Continental shelf-wide response of a fish assemblage to rapid warming of the sea. Curr. Biol. 2011, 21, 1565–1570. [Google Scholar] [CrossRef]
  5. Zhang, K.; Guo, J.Z.; Xu, Y.W.; Jiang, Y.E.; Fan, J.T.; Xu, S.L.; Chen, Z.Z. Long-term variations in fish community structure under multiple stressors in a semi-closed marine ecosystem in the South China Sea. Sci. Total Environ. 2020, 745, 140892. [Google Scholar] [CrossRef] [PubMed]
  6. Bland, L.M.; Watermeyer, K.E.; Keith, D.A.; Nicholson, E.; Regan, T.J.; Shannon, L.J. Assessing risks to marine ecosystems with indicators, ecosystem models and experts. Biol. Conserv. 2018, 227, 19–28. [Google Scholar] [CrossRef]
  7. Han, D.; Chen, Y.; Zhang, C.; Ren, Y.; Xu, B.; Xue, Y. Evaluation of effects of shellfish aquaculture and capture fishery on a semi-closed bay ecosystem. Estuar. Coast. Shelf. Sci. 2018, 207, 175–182. [Google Scholar] [CrossRef]
  8. Crain, C.M.; Kroeker, K.; Halpern, B.S. Interactive and cumulative effects of multiple human stressors in marine systems. Ecol. Lett. 2008, 11, 1304–1315. [Google Scholar] [CrossRef]
  9. Pittman, S.J.; Heyman, W.D. Life below water: Fish spawning aggregations as bright spots for a sustainable ocean. Conserv. Lett. 2020, 13, e12722. [Google Scholar] [CrossRef]
  10. Wan, R.J.; Zhou, F.; Shan, X.J.; Sun, S. Impacts of variability of habitat factors on species composition of ichthyoplankton and distribution of fish spawning ground in the Changjiang River estuary and its adjacent waters. Acta Ecol. Sin. 2010, 30, 155–165. [Google Scholar]
  11. Chen, Z.Z.; Qiu, Y.S.; Huang, Z.R. Estimation of growth and mortality parameters of Argyrosomus argentatus in northern South China Sea. Chin. J. Appl. Ecol. 2005, 4, 712–716. [Google Scholar]
  12. Chen, G.B.; Qiu, Y.S. Study on growth, mortality and reasonable utilizationof Decapterus maruadsiin northern continental shelf watersof South China Sea. J. Oceanogr. Taiwan Strait 2003, 4, 457–464. [Google Scholar]
  13. Wang, X.H.; Qiu, Y.S.; Du, F.Y. Study on the growth, mortality and optimum catchable size of Nemipterus virgatus in the northern South China Sea. J. Ocean. Univ. China 2004, 34, 224–230. [Google Scholar]
  14. Wang, X.H.; Qiu, Y.S.; Du, F.Y. Fisheries biology of Nemipterus bathybius and its optimum catchable size in northern South China Sea. Chin. J. Appl. Ecol. 2005, 12, 2428–2434. [Google Scholar]
  15. Iwatsuki, Y.; Carpenter, K.E. Evynnis Cardinalis; The IUCN Red List of Threatened Species 2014. 2014, p. e.T59034974A59034995. Available online: https://dx.doi.org/10.2305/IUCN.UK.2014-3.RLTS.T59034974A59034995.en (accessed on 1 August 2022).
  16. Chen, Z.Z.; Qiu, Y.S. Stock variation of Parargyrops edita Tanaka in Beibu Gulf. South China Fish. Sci. 2005, 3, 26–31. [Google Scholar]
  17. Zhang, K.; Chen, Z.Z.; Qiu, Y.S. Decadal changes in growth, mortality and maturity parameters of Evynnis cardinalis in Beibu Gulf. South China Fish. Sci. 2016, 6, 9–16. [Google Scholar]
  18. Chen, Z.Z.; Qiu, Y.S. Ecological distribution of Paragyrops edita Tanaka in the Beibu Gulf. Mar. Fish. Res. 2005, 3, 16–21. [Google Scholar]
  19. Cai, Y.C.; Chen, Z.Z.; Xu, S.N.; Zhang, K. Tempo-spatial distribution of Evynnis cardinalis in Beibu Gulf. South China Fish. Sci. 2017, 13, 1–10. [Google Scholar]
  20. Jia, X.P.; Li, Y.Z.; Qiu, Y.S.; Li, C.H.; Gan, J.L. Fishery Ecological Environment and Fishery Resources in the Exclusive Economic Zone and Continental Shelf of the South China Sea; Science Press: Beijing, China, 2004; pp. 1–674. [Google Scholar]
  21. Pauly, D.; Watson, R.; Alder, J. Global trends in world fisheries: Impacts on marine ecosystems and food security. Philos. Trans. R. Soc. B Biol. Sci. 2005, 360, 5–12. [Google Scholar] [CrossRef]
  22. Costello, C.; Ovando, D.; Hilborn, R.; Gainer, S.D.; Deschenes, O.; Lester, S.E. Status and solutions for the world’s unassessed fisheries. Science 2012, 338, 517–520. [Google Scholar] [CrossRef]
  23. Zhan, B.Y. Fisheries Stock Assessment; China Agriculture Press: Beijing, China, 1995; pp. 257–261. [Google Scholar]
  24. Zhang, K.; Liao, B.C.; Xu, Y.W.; Zhang, J.; Chen, Z.Z. Assessment for allowable catch of fishery resources in the South China Sea based on statistical data. Haiyang Xuebao 2017, 39, 25–33. [Google Scholar]
  25. Zhang, K.; Geng, P.; Li, J.J.; Xu, Y.W.; Chen, Z.Z. Influences of fisheries management measures on biological characteristics of threadfin bream (Nemipterus virgatus) in the Beibu Gulf, South China Sea. Acta Oceanol. Sin. Engl. Ed. 2022, 41, 24–33. [Google Scholar] [CrossRef]
  26. Qiu, Y.S.; Lin, Z.J.; Wang, Y.Z. Responses of fish production to fishing and climate variability in the northern South China Sea. Prog. Oceanogr. 2010, 85, 197–212. [Google Scholar] [CrossRef]
  27. Jing, Z.Y.; Qi, Y.Q.; Hua, Z.L.; Zhang, H. Numerical study on the summer upwelling system in the northern continental shelf of the South China Sea. Cont. Shelf Res. 2009, 29, 467–478. [Google Scholar] [CrossRef]
  28. Sun, D.R.; Lin, Z.J. Variations of major commercial fish stocks and strategies for fishery management in Beibu Gulf. J. Trop. Oceanogr. 2004, 2, 62–68. [Google Scholar]
  29. Pauly, D.; Christensen, V.; Dalsgaard, J.; Froese, R.; Torres, F. Fishing down marine food webs. Science 1998, 279, 860–863. [Google Scholar] [CrossRef]
  30. Liu, W.D.; Lin, Z.J.; Jiang, Y.E.; Huang, Z.R. Spatial distribution of demersal fishery resources in the continental shelf of the northern South China Sea. J. Trop. Oceanogr. 2011, 5, 95–103. [Google Scholar]
  31. Chen, Z.Z.; Qiu, Y.S.; Xu, S.N. Changes in trophic flows and ecosystem properties of the Beibu Gulf ecosystem before and after the collapse of fish stocks. Ocean Coast. Manag. 2011, 54, 601–611. [Google Scholar] [CrossRef]
  32. Chen, Z.C.; Liu, J.X. Economic Fish in the South China Sea; GuangDong Science & Technology Press: Guangzhou, China, 1982; pp. 1–266. [Google Scholar]
  33. Chen, Z.Z.; Qiu, Y.S. Esitimation of growth and mortality parameters of Parargyrops edita Tanaka in Beibu Bay. J. Fish. China 2003, 27, 251–257. [Google Scholar]
  34. Nguyen, H.P.; Larsen, R.B. Effect of codend mesh size increases on the size selectivity of commercial species in a small mesh bottom trawl fishery. J. Appl. Ichthyol. 2013, 29, 762–768. [Google Scholar] [CrossRef]
  35. Yang, B.; Herrmann, B.; Yan, L.; Li, J.; Wang, T. Effects of six codend meshes on the size selection of juvenile white croaker (Pennahia argentata) in demersal trawl fishery of the South China Sea. PLoS ONE 2021, 16, e0253723. [Google Scholar] [CrossRef] [PubMed]
  36. Rouyer, T.; Ottersen, G.; Durant, J.M.; Hidalgo, M.; Hjermann, D.; Persson, J.; Stige, L.C.; Stenseth, N.C. Shifting dynamic forces in fish stock fluctuations triggered by age truncation? Glob. Chang. Biol. 2011, 17, 3046–3057. [Google Scholar] [CrossRef]
  37. Cheung, W.W.L.; Sarmiento, J.L.; Dunne, J.; Frölicher, T.L.; Lam, V.W.Y.; Deng Palomares, M.L.D.; Watson, R.; Pauly, D. Shrinking of fishes exacerbates impacts of global ocean changes on marine ecosystems. Nat. Clim. Chang. 2013, 3, 254–258. [Google Scholar] [CrossRef]
Figure 1. Sampling sites across the northern continental shelf, South China Sea. Zhanjiang (A1–A9), Yangjiang (B1–B9), Pearl River Estuary (C1–C9), Shanwei (D1–D9), and Shantou (E1–E9).
Jmse 10 01191 g001
Figure 2. Temporal and spatial distribution of Evynnis cardinalis biomass in the northern South China sea.
Jmse 10 01191 g002
Figure 3. Temporal and spatial distribution of Evynnis cardinalis density in the northern South China sea.
Jmse 10 01191 g003
Figure 4. Temporal and spatial variation in average biomass (upper) and density (lower) of Evynnis cardinalis across the northern continental shelf, South China Sea. Error bars indicate SE.
Jmse 10 01191 g004
Figure 5. Seasonal and spatial variation in (a) biomass and (b) density of Evynnis cardinalis across the northern continental shelf, South China Sea.
Jmse 10 01191 g005
Figure 6. Temporal distribution of biomass (upper) and density (lower) by depth. Error bars indicate SE.
Jmse 10 01191 g006aJmse 10 01191 g006b
Figure 7. Seasonal distribution by depth of: (a) biomass and (b) density.
Jmse 10 01191 g007
Table 1. Evynnis cardinalis resource status in northern continental shelf waters of the South China Sea, 2014–2015.
SeasonFrequency of Occurrence (%)Biomass (kg·km−2)Density (ind·km−2)
Summer68.5731.34662
Autumn48.5733.05412
Winter31.433.5831
Spring65.7127.48936
Annual average53.5723.86510
Publisher’s Note: MDPI stays neutral with regard to jurisdictional claims in published maps and institutional affiliations.

