Article

Change of Global Ocean Temperature and Decadal Variability under 1.5 °C Warming in FOAM

1
Laboratory for Climate and Ocean-Atmosphere Studies, Department of Atmospheric and Oceanic Sciences, School of Physics, Peking University, Beijing 100871, China
2
Open Studio for Ocean-Climate-Isotope Modeling, Pilot National Laboratory for Marine Science and Technology (Qingdao), Qingdao 266075, China
3
Program in Ocean Science and Engineering, Georgia Institute of Technology, Atlanta, GA 30318, USA
4
College of Geography Science, Nanjing Normal University, Nanjing 210023, China
5
Atmospheric Science Program, Department of Geography, Ohio State University, Columbus, OH 43210, USA
*
Author to whom correspondence should be addressed.
J. Mar. Sci. Eng. 2022, 10(9), 1231; https://doi.org/10.3390/jmse10091231
Submission received: 13 July 2022 / Revised: 25 August 2022 / Accepted: 26 August 2022 / Published: 2 September 2022
(This article belongs to the Section Physical Oceanography)

Abstract

:
The rise in atmospheric CO2 concentration is regarded as the dominant reason for observed warming since the mid-20th century. Based on the Paris Agreement target, this research designs three conceptual pathways to achieve the warming target of 1.5 °C above the pre-industrial level by using the Fast Ocean Atmosphere Model. The three different scenarios contain one equilibrium experiment (equilibrium, EQ) and two transient experiments (never-exceed pathway, NE; overshoot pathway, OS). Then, we choose a ten year average that achieves 1.5 °C warming to calculate the climatology of the warming situation. Since OS achieves 1.5 °C twice, we obtain four warming situations to explore the response of ocean temperature. In 2100, the global ocean temperature increases over the global region, except the surface of the Southern Ocean. The difference in heat content mainly depends on the cumulative force of CO2 concentration. It is worth pointing out that during the increase in warming, the ocean surface temperature and heat content start to respond in different hemispheres. The weakening of decadal variability in the North Pacific and North Atlantic is robust in all three scenarios. However, there is a tremendous growth in the low-pass ocean surface temperature standard deviation in the Southern Ocean in EQ, which is different to NE and OS, and causes the increase in global mean total standard deviation. The shortening of decadal variability can only be seen from the EQ power spectrum, while NE and OS have similar power spectra with pre-industrial runs. It suggests that all previous studies that use equilibrium experiments data may have overestimated the shortening of decadal variability under global warming.

1. Introduction

According to IPCC Sixth Assessment Report (AR6), human activities contributed the most in the warming of the atmosphere, oceans, and land since the pre-industrial era (defined as the period 1850–1900). The report also pointed out that the increased frequency of extreme events around the world are driven by the greenhouse gases emitted by human activities; it would be almost impossible for extreme events in many regions to occur otherwise. If the climate continues to warm, the Earth’s system may reach a tipping point at which abrupt change will happen and the system will not be able to recover to its previous state, even if the CO2 level is reduced. In order to avoid such an unpleasant situation, the Paris Agreement aspires to hold the rise of global mean surface temperature to below 2 °C, and better yet to below 1.5 °C above the pre-industrial level at the end of this century (https://unfccc.int/files/essential_background/convention/application/pdf/english_paris_agreement.pdf accessed on 17 March 2016).
To analyze the difference in climate response under warmings of 1.5 °C and 2 °C, different carbon emission scenarios were proposed to achieve these two warming targets [1,2,3]. Climate simulations show that reducing the warming from 2.0 °C to 1.5 °C does make a difference, especially in reducing extreme precipitation, temperature, stabilizing the sea-ice coverage in the Arctic [4], and reducing the sea-level-rise-related flood damage [5,6]. However, given that more than 1 °C of warming has already occurred, it seems difficult to keep the warming below 1.5 °C all through this century; IPCC AR6 estimates that the surface warming may reach 1.5 °C or 1.6 °C around 2040. Therefore, there are two types of emission pathways by which the warming may be limited to 1.5 °C by the year 2100: in one pathway, the warming never exceeds 1.5 °C before 2100, and in the other, the warming exceeds 1.5 °C for a few decades, but returns to 1.5 °C by the year 2100. The latter is called the “overshoot” pathway [7,8] and the former is called the “never-exceed” pathway herein [9,10].
Previous studies found that the impacts of 1.5 °C warming depend on the emission pathway that leads to the warming [11,12]. They found that global mean steric sea level is higher and ocean acidification stronger in the overshooting pathway than in the never-exceed pathway. The transient climate responses under these two pathways are definitely different from the “equilibrium” response, in which the climate reaches statistical equilibrium and the global mean surface temperature is 1.5 °C higher than that of the pre-industrial era [4,13]. Therefore, the warming of 1.5 °C may be achieved in four different situations: by year 2100 through continuous warming (never-exceed pathway); in the near future with fast warming (overshoot pathway); by the year 2100 when the temperature falls to 1.5 °C from a larger warming (still the overshoot pathway), and in an equilibrium state after many hundreds of years (equilibrium pathway). The climate responses may be different among all the four situations.
The decadal and multi-decadal variability of the climate system and the associated heat storage within the oceans have a large influence on the surface climate and the observed global warming [14,15,16,17,18]. Previous studies show that the magnitude of decadal variability, such as Pacific decadal oscillation (PDO) and Atlantic multi-decadal variability (AMV), will weaken and the period will shorten under future global warming [19,20,21]. However, it is relatively unclear what the response of decadal variability will be and how the ocean temperature will evolve for the same warming (e.g., 1.5 °C) but along different pathways. Here, we use the Fast Ocean Atmosphere Model (FOAM) to simulate the climate at 1.5 °C warming achieved along the three different pathways described above, with a special focus on the evolution of ocean temperature and the change in the statistic characteristics of decadal variability.

2. Data and Method

2.1. The Fast Ocean Atmosphere Model

The Fast Ocean Atmosphere Model (FOAM) is a fully coupled general circulation model. The atmospheric component (PCCM3-UW) is a parallel version of the Community Climate Model (CCM) version 2 with an R15 resolution (7.5° longitude, 4.5° latitude, 18 vertical levels) developed at the University of Wisconsin (UW), and the physics is from the CCM3 model. The ocean component (OM3) is a z-coordinate, A-grid ocean model, with a resolution of 2.8° longitude, 1.4° latitude, and 24 vertical layers. The land surface model is a CCM2 land model from the National Center for Atmospheric Research (NCAR). A thermodynamic component of NCAR’s Community Sea Ice Model (CSIM2.2.6) was chosen for sea ice model, and the sea ice dynamics portion was not implemented in FOAM. The land model and sea ice model had the same grid set as the ocean model in the horizontal direction. The FOAM was shown to perform well in simulating the global climate, as well as interannual and interdecadal variabilities such as El Niño and the Southern Oscillation (ENSO) and the Pacific decadal oscillation (PDO) [22,23,24]. FOAM is a fast model, and is especially powerful when large ensemble members for different pathways are needed.

2.2. Climate Sensitivity Experiments

In order to better design the 1.5 °C warming experiments, the equilibrium climate sensitivity (ECS) and the transient climate response (TCR) of FOAM were tested first. At first, CO2 was quadrupled abruptly (abrupt4×CO2) from 280 ppmv to 1120 ppmv, and continued for 300 years until statistical equilibrium is reached; then, CO2 was increased at a rate of 1% yr−1 (1 pctCO2) for 70 years, at which it is doubled and continued for an additional 230 years at this CO2 (Figure 1), similar to that performed by Cao et al. (2018). Both experiments started from year 700 of the pre-industrial era control (CTRL), which was spun up for 1000 years. The final 300 years of data from the experiment CTRL were used for analysis.
The equilibrium climate sensitivity (ECS) is defined as the equilibrium warming ( Δ T e q u ) in response to a doubling of the atmospheric CO2 concentration [25,26]. For the CO2 quadrupling experiment, the ECS can, thus, be calculated by Δ T e q u /2 [27,28]. TCR is defined as the temperature response at the time of CO2 doubling before the deep ocean equilibrated [29]. ECS is usually described as the most relevant on centennial timescales, while TCR has long been considered a more appropriate measure of the 50–100 years response to the gradual increase in CO2.

2.3. Global Warming Experiments

As described in Section 1, the climate was warmed along three different pathways: “never-exceed (NE)”, “overshoot (OS)”, and “equilibrium (EQ)”. The simulations all started from the year 1900 and ran until the year 2005, following the Coupled Model Intercomparison Project Phase 6 (CMIP6) historical experiment design protocol. After the year 2005, CO2 was changed according to the pathways designed for these experiments. For NE, the CO2 concentration grows linearly at a slow rate (0.6 ppmv/year; green curve in Figure 1d) to guarantee that the increase in temperature never exceeds 1.5 °C before 2100. For OS, the CO2 concentration increases following the CMIP6 shared socioeconomic pathway at 4.5 W/m2 (SSP2-4.5) until the year 2040, and decreases in the following decades (red curve in Figure 1d). The equilibrium experiment is designed to show a stable warming state of 1.5 °C above the pre-industrial control, and is continued for 500 years. The last 200 years of data of the EQ experiment are used to compare with those of the NE and OS experiments, at which point the drifting of global mean surface air temperature (SAT) is 0.086 °C/100 yr. However, when we discuss the response under 1.5 °C warming, only the last 95 years (2006–2100) are used in three three scenarios, because the first 105 years (1900–2005) represent historical situations in NE and OS. For each experiment, three ensemble members are carried out, and each member starts from a different month in year 700 of CTRL.
As described above, we obtained four 1.5 °C warming situations from three different scenarios by calculating the ten year average at the end of the 21st century (2091–2100) in NE, OS, and EQ, and the first time when OS achieves 1.5 °C of warming (2028–2037). To distinguish between the two 1.5 °C warming situations in OS, they are named OS1 and OS2 for the warmings before and after the peak warming, respectively. NE1 and EQ1 represent the 1.5 °C warming situations in NE and EQ. These warmings in NE and OS experiments are calculated relative to the ten year average around 1900 (1900–1909), which is the length with warming situation and used to represent the pre-industrial era (PI) in the analysis herein.
The significance level of the difference between the four 1.5 °C warming situations and PI is examined at each grid point using the Monte Carlo method. We first obtained the standard deviation of the ten year average temperatures for the CTRL by (1) calculating the difference between any two randomly selected ten year segments and repeating for 1000 times, and (2) calculating the standard deviation of the 1000 realizations at each grid point. Then, the difference between NE1, OS1, OS2, EQ1, and PI were marked as significant only if the difference was larger than one standard deviation at each grid point.

2.4. Decadal Variability

The annual average was calculated from the monthly sea surface temperature (SST) data and the anomaly (SSTA) as obtained by subtracting the climatological mean from the annual average at each grid point. The low-pass SSTA was obtained next, by applying a commonly used filter, i.e., by applying the 3 year running mean twice [30]. Then, the PDO index was derived as the principal component of the leading empirical orthogonal function (EOF) mode of the North Pacific (110° E–100° W, 20° N–70° N) low-pass SST time series, and EOF as normalized by its standard deviation [31]. The AMV index was calculated by the regional average of the low-pass SSTA in the North Atlantic (80° W–0°, 0°–70° N) [32]. Before comparing the decadal variability between 1.5 °C scenarios and the CTRL, the empirical mode decomposition (EMD) method was used to remove the warming trend caused by CO2 changes [20,33]. The shortening of decadal variability was analyzed according to the power spectrum of the PDO and AMV indexes, while the weakening of variability was expressed in terms of the standard deviation of the SSTA. We calculated the 95 year (from 2006 to 2100) standard deviation for each point, and then calculated the regional average of the North Pacific and North Atlantic. The amplitudes of total variability and decadal variability were calculated as the standard deviations of original SSTA and loss–pass data. The interannual variabilities were obtained from the residual between the total and decadal variabilities [21].

3. Climate Sensitivity

The time series of global mean surface air temperature (SAT) and SST for the CTRL, abrupt4×CO2, and 1 pctCO2 are shown in Figure 1b,c, respectively. The global mean SAT increases immediately in abrupt4×CO2 experiment and increases by 5.2 °C after 300 years. The global mean SAT in the 1 pctCO2 experiment increases almost linearly during the first 70 years, and continues to rise but at a slower rate afterwards. After 300 years, the global temperature is 2.4 °C warmer than CTRL. The increase in SST is less, only 3.4 °C, and 1.5 °C in abrupt4×CO2 and 1 pctCO2 respectively.
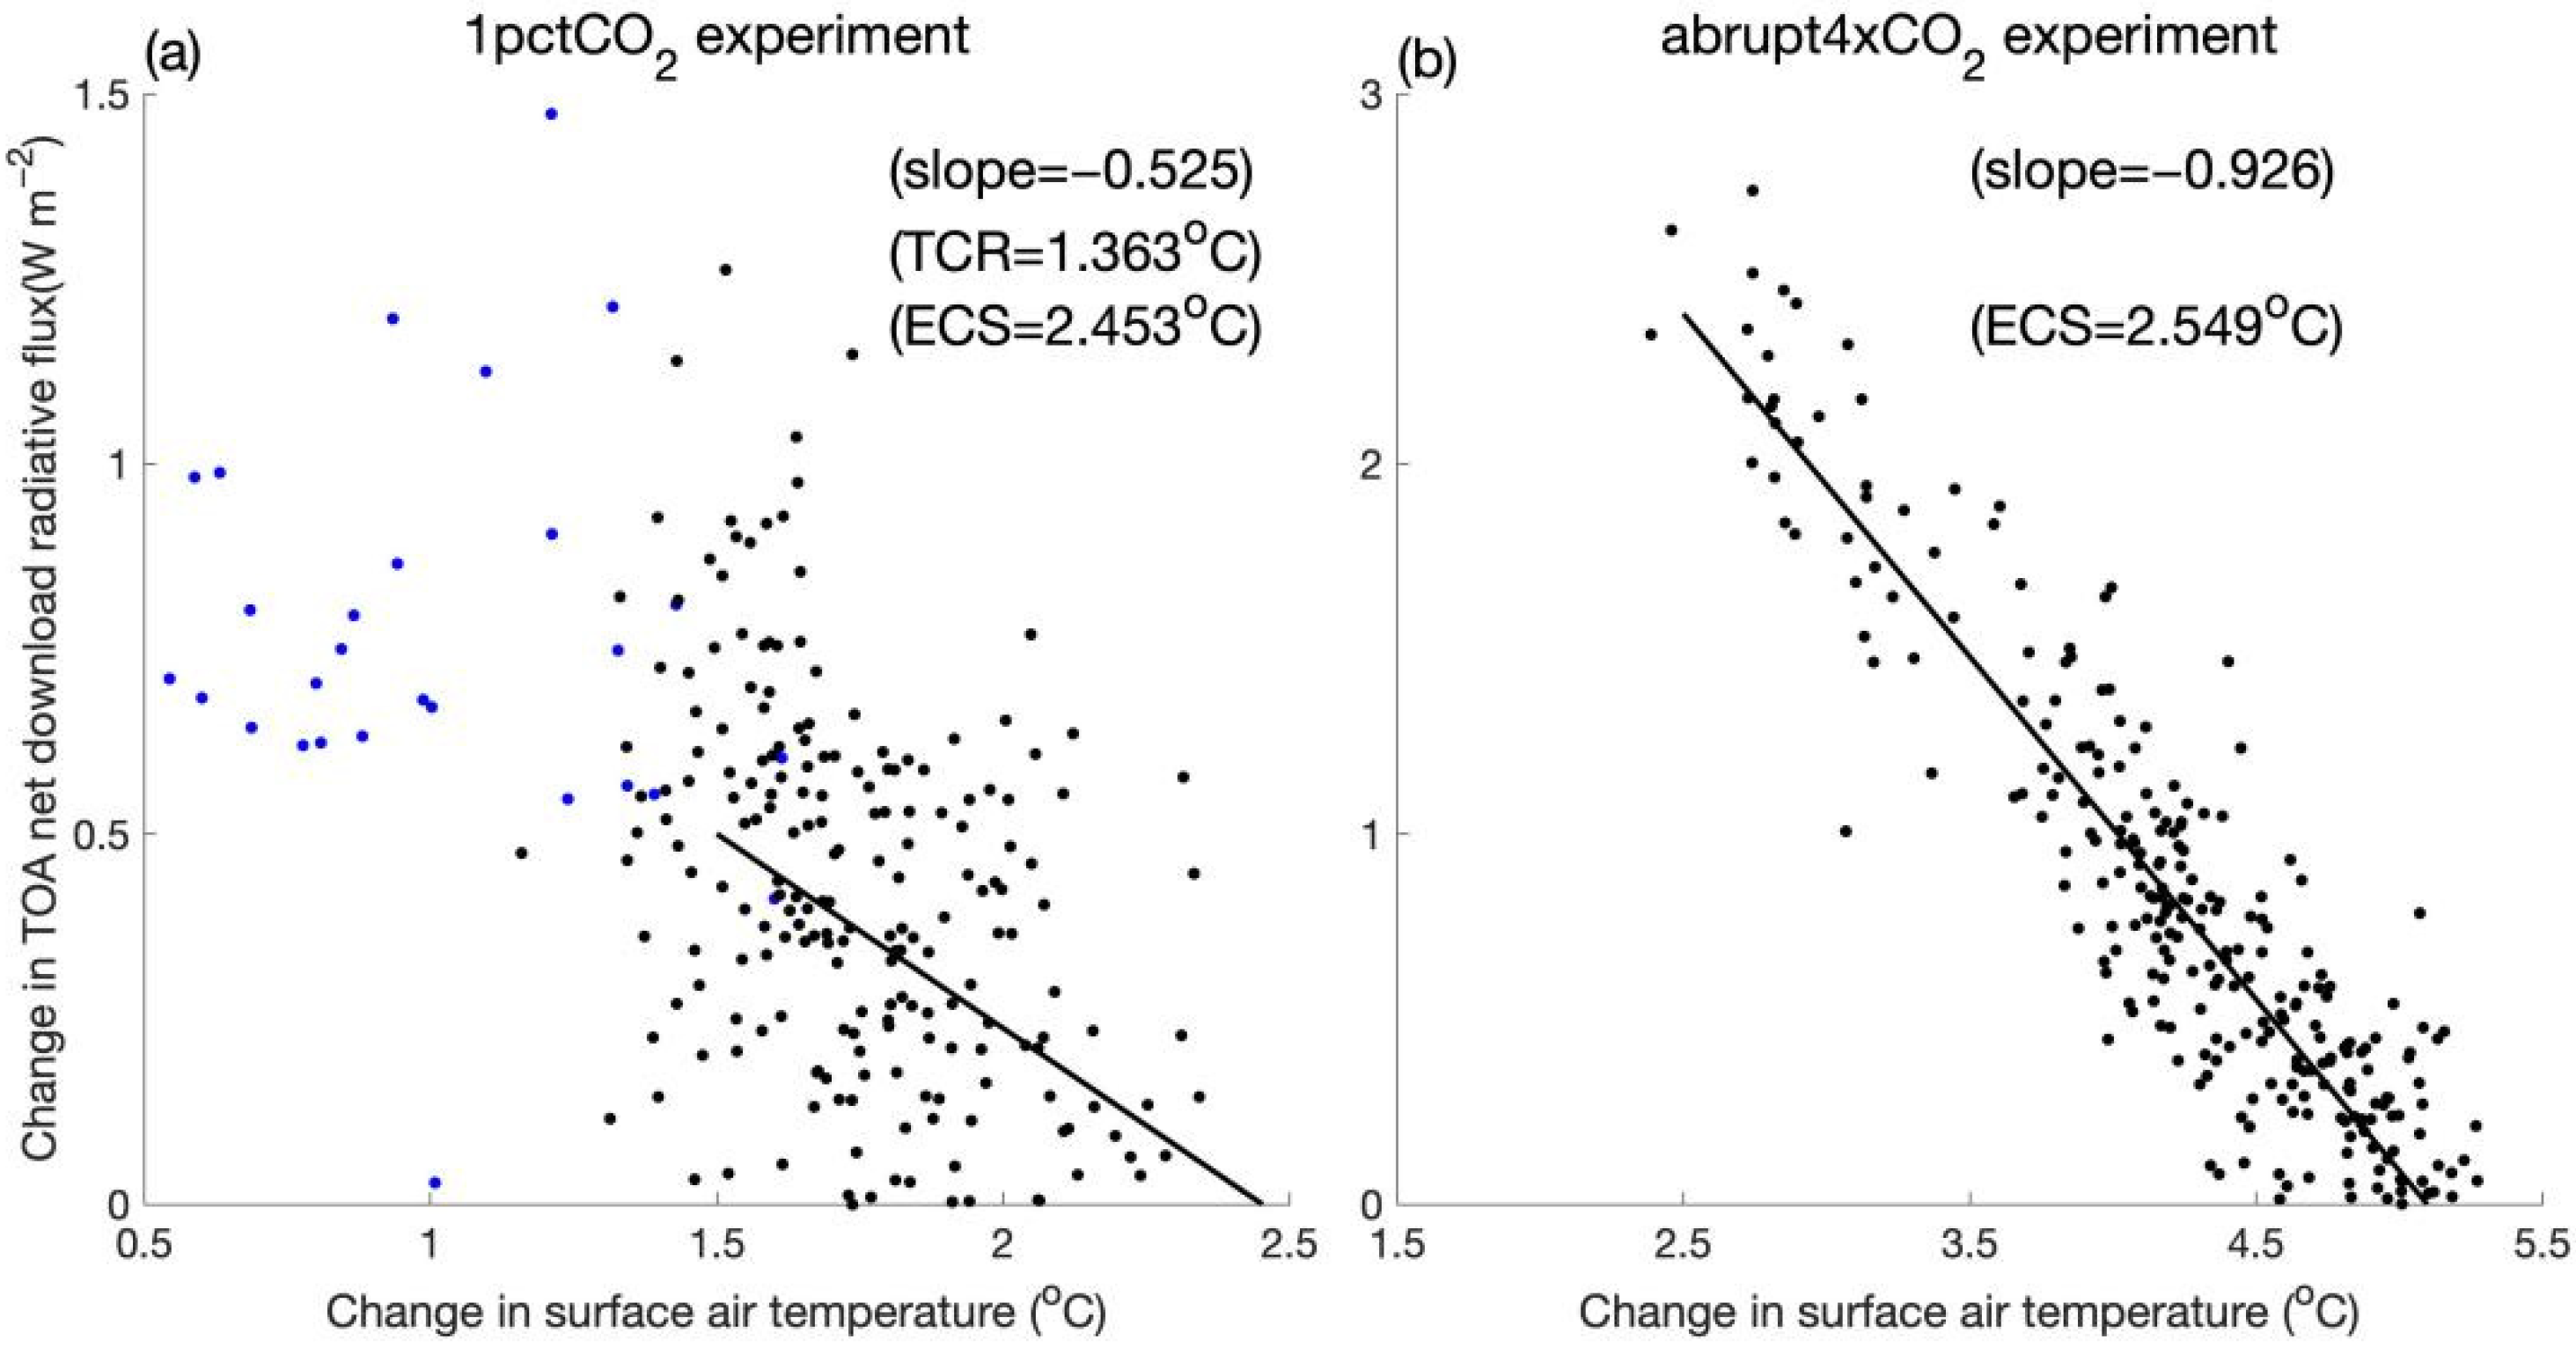
The ECS can be calculated more precisely from the relationship between the annually averaged global mean net top-of-atmosphere (TOA) radiative flux and SAT (Figure 2). A linear fit can be obtained for the relationship with the correlation coefficients of change in SAT and the change in radiative flux for the 1 pctCO2 and abrupt4×CO2 experiments, respectively. These lines intersect the x-axis at 2.45 °C and 5.11 °C, respectively, and, thus, give an ECS of ~2.5 °C. This ECS is lower than the Coupled Model Intercomparison Project Phase 5 (CMIP5) ensemble mean (3.4 °C), but still in the range of CMIP5 models from 2.1 °C to 4.7 °C [27]. The recent IPCC AR6 report (Section 7.5.5) narrows the likely range of ECS to 2.5–4.0 °C, and shifts the ensemble mean to 3.0 °C. Therefore, the ECS of FOAM is near the lower end of the climate model TCSs. Due to the weak climate sensitivity in FOAM, we use a relatively high CO2 concentration to achieve the 1.5 °C warming target (Figure 1d). The mean TCR of CMIP5 (1.8 °C) is significantly smaller than ECS (3.4 °C), which suggests that the ocean heat uptake delays surface warming. In FOAM, the TCR is 1.4 °C, 1.1 °C from the ECS (2.5 °C), indicating that the ocean response to the atmosphere in FOAM is fast.

4. Global Ocean Temperature

The final increase in the global mean SAT is ~1.5 °C for all three pathways (EQ, NE, and OS). The OS reaches 1.5 °C twice as designed; the first time it reaches 1.5 °C is around year 2032, and reaches a peak of ~1.8 °C around year 2070 (Figure 1e). For all three warming scenarios, global mean SST increases by about 1 °C at the end of the 21st century (Figure 1f). The changes in zonal mean SST and heat content (HC) of the upper 2000 m relative to the period of 1900–1909 mean are shown in Figure 3. At the end of the 21st century, the zonal mean SST exhibits a warming amplification in the mid latitudes of the Southern and Northern Hemispheres in EQ. However, in both transient warming scenarios (NE, OS), the zonal mean SST has a slightly large increase in the Northern Hemisphere than in the EQ scenario, but much subdued warming in the mid- to high-latitude Southern Hemisphere, and even a cooling near 60° S (Figure 3a).
The changes in the upper ocean heat content are quite different from those of SST, with a meridionally near uniform increase, except in the northern high latitudes, for all three warming scenarios (Figure 3e). Around 40° S, there is a peak in the change of HC, which is linked to the deeper heat storage in that region [13,34] (see also Figure 4l–n). The temporal evolution of the zonal mean SST and HC anomalies show that the zonal mean SST in the northern mid to high latitudes starts to warm first (Figure 3b,c), while the HC increases in the Southern Hemisphere first in the two transient warming scenarios (Figure 3f,g). The increase in HC in the deeper part of the Southern Ocean delays the surface warming there, and the northward transport of HC [35] may even lead to a cooling on the surface. As expected, the HC in the EQ case does not change with time (Figure 3d,h).
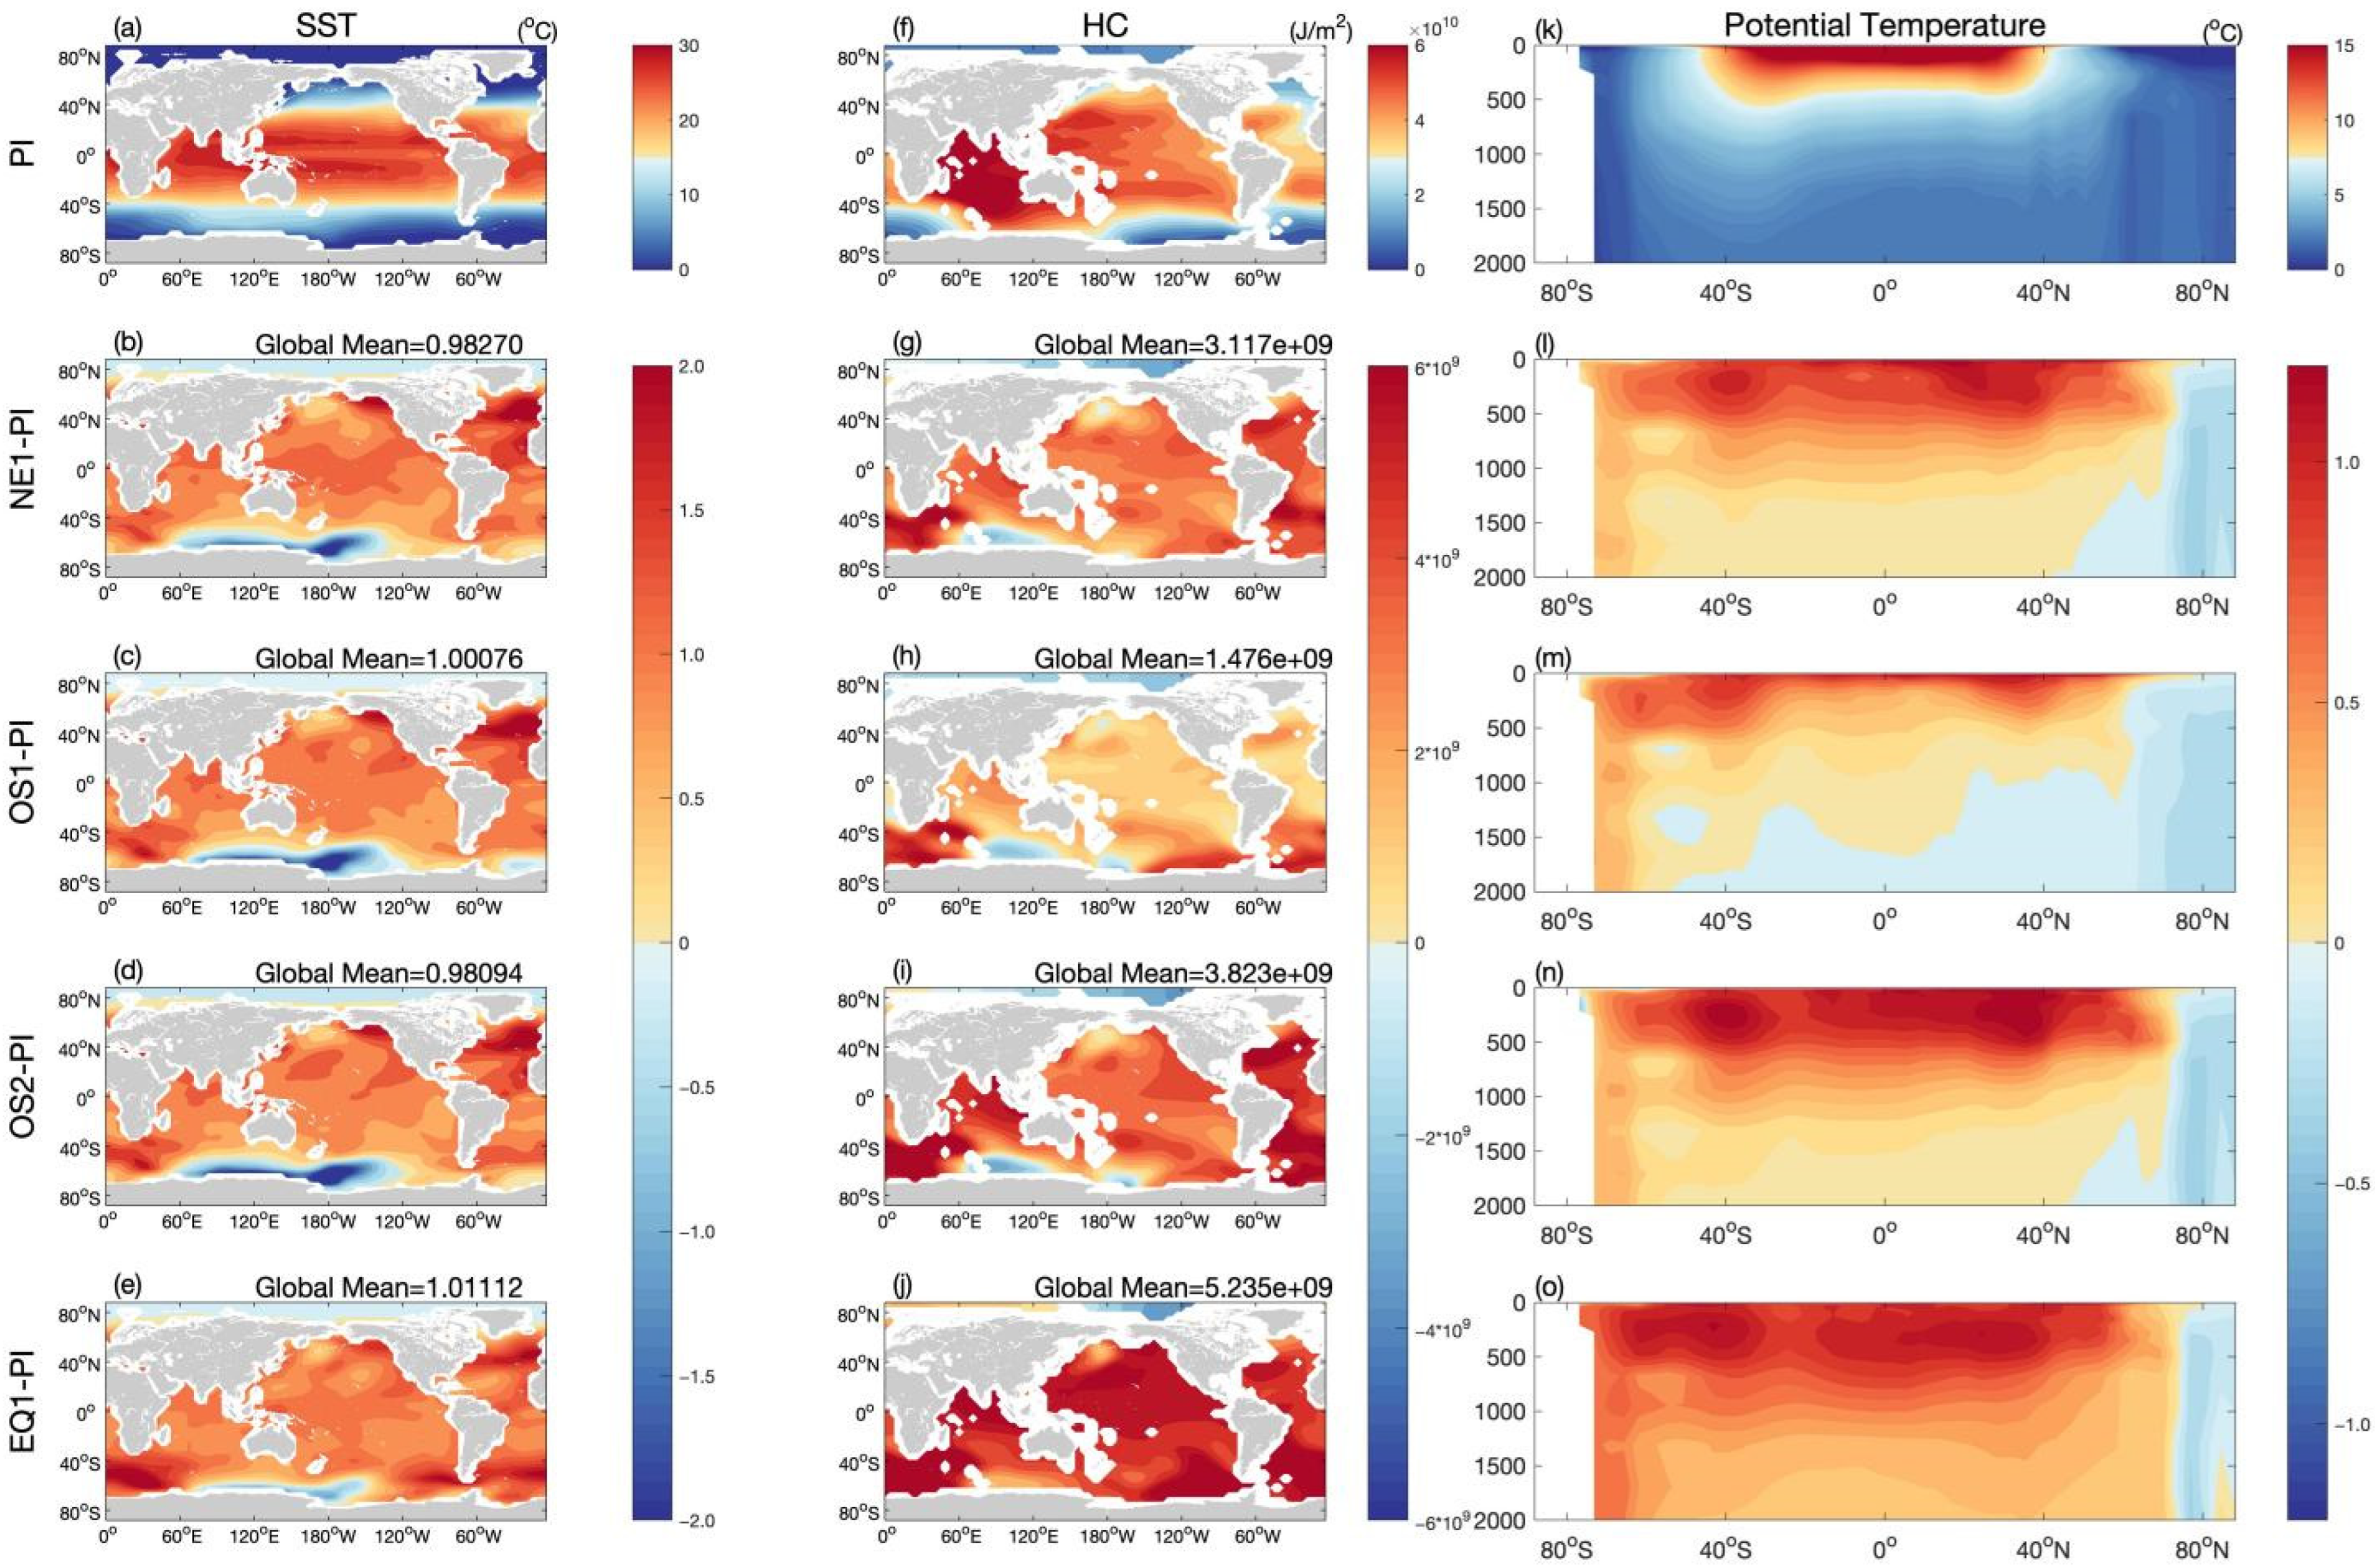
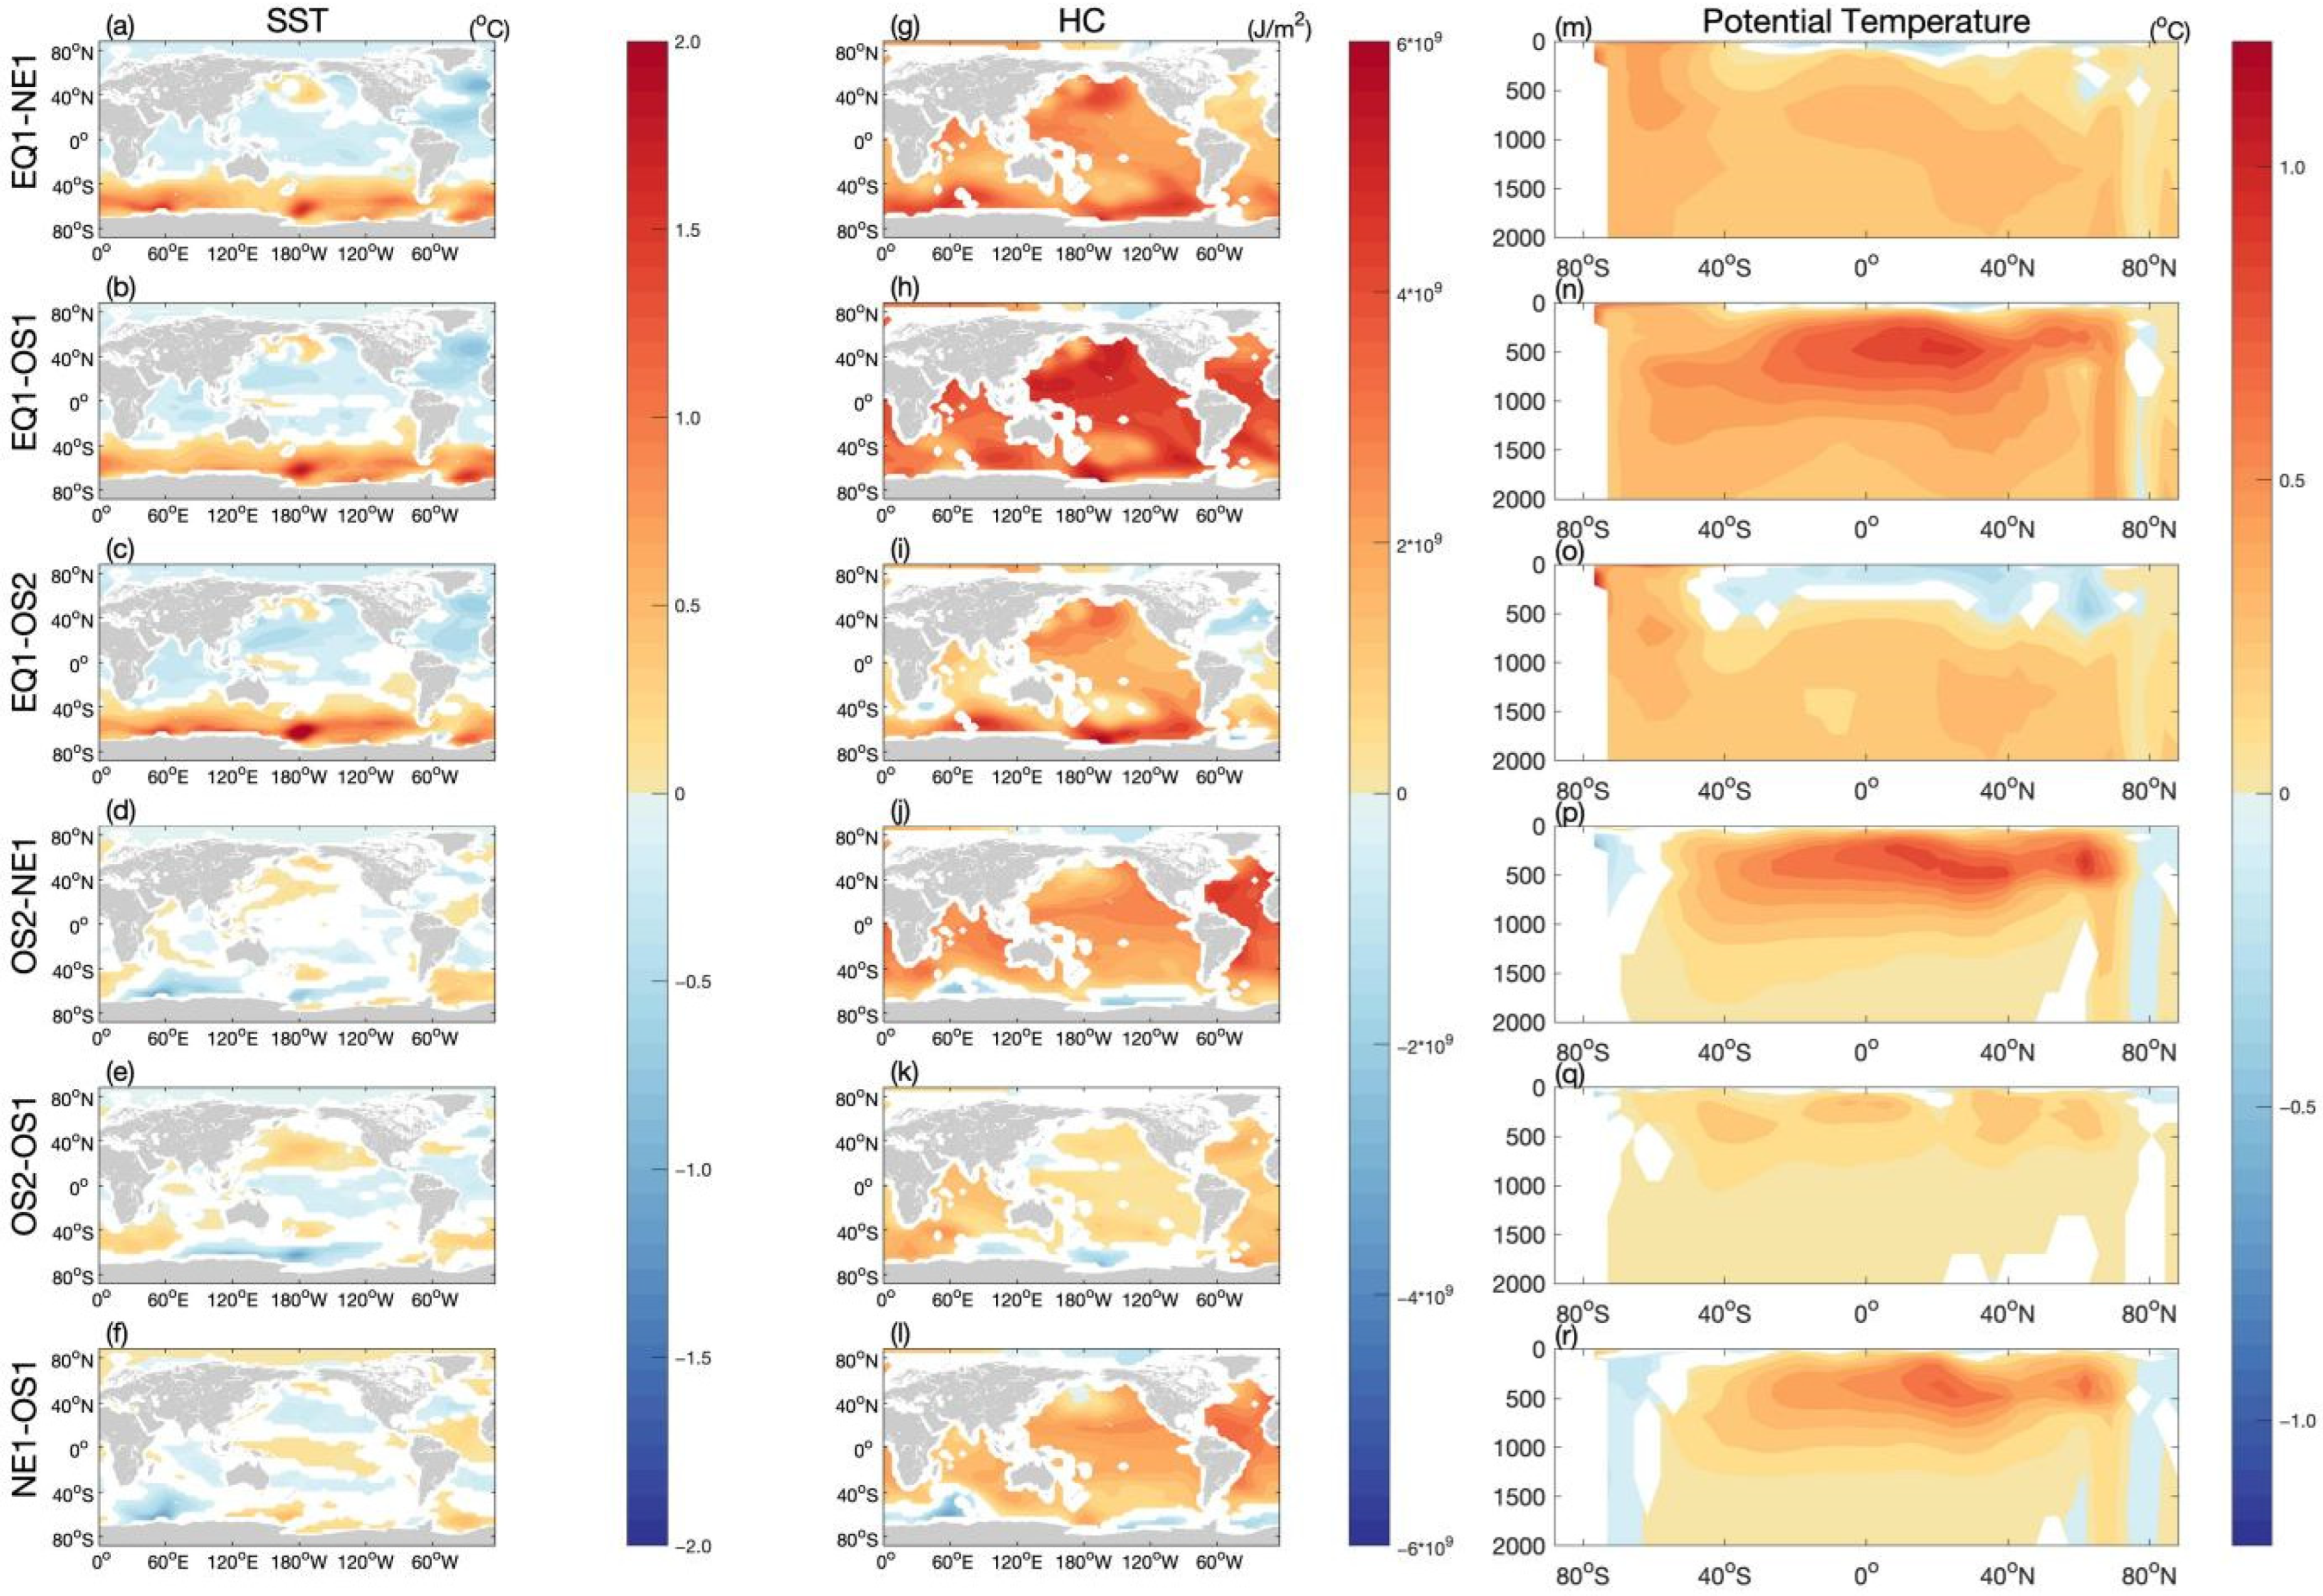
The spatial pattern of warming in both the horizonal and vertical axes at the time (ten year average) of 1.5 °C warming for the four cases (NE1, OS1, OS2, and EQ1) are shown in Figure 4. The patterns and magnitudes of SST warming are very similar for all four cases, except that the Southern Ocean experiences much larger warming in the EQ1 case than in the other cases (Figure 4b–e and Figure 5a–f). The pattern of HC changes is also similar among the four cases, but the magnitudes are quite different with EQ1 > OS2 > NE1 > OS1 (seen more clearly in Figure 5g–l), consistent with the duration and/or the amplitude of the forcings (Figure 4g–j). OS1 and OS2 experience very similar surface warming (Figure 4c–d), but very different changes in the HC of the upper 2000 m (Figure 4h–i), because the warming reaches deeper in the latter than in the former (Figure 4m–n and Figure 5q). Warming hardly reaches below 1000 m in OS1, but is well below 1000 m in OS2, and well below 2000 m in EQ1. The deepest warming is reached near the edge of Antarctica, where the bottom water forms in all cases. Around 40° S, the warming is also deep in the transient cases due to the deep mixed-layer depth there, delaying the surface warming.

5. Decadal Variability

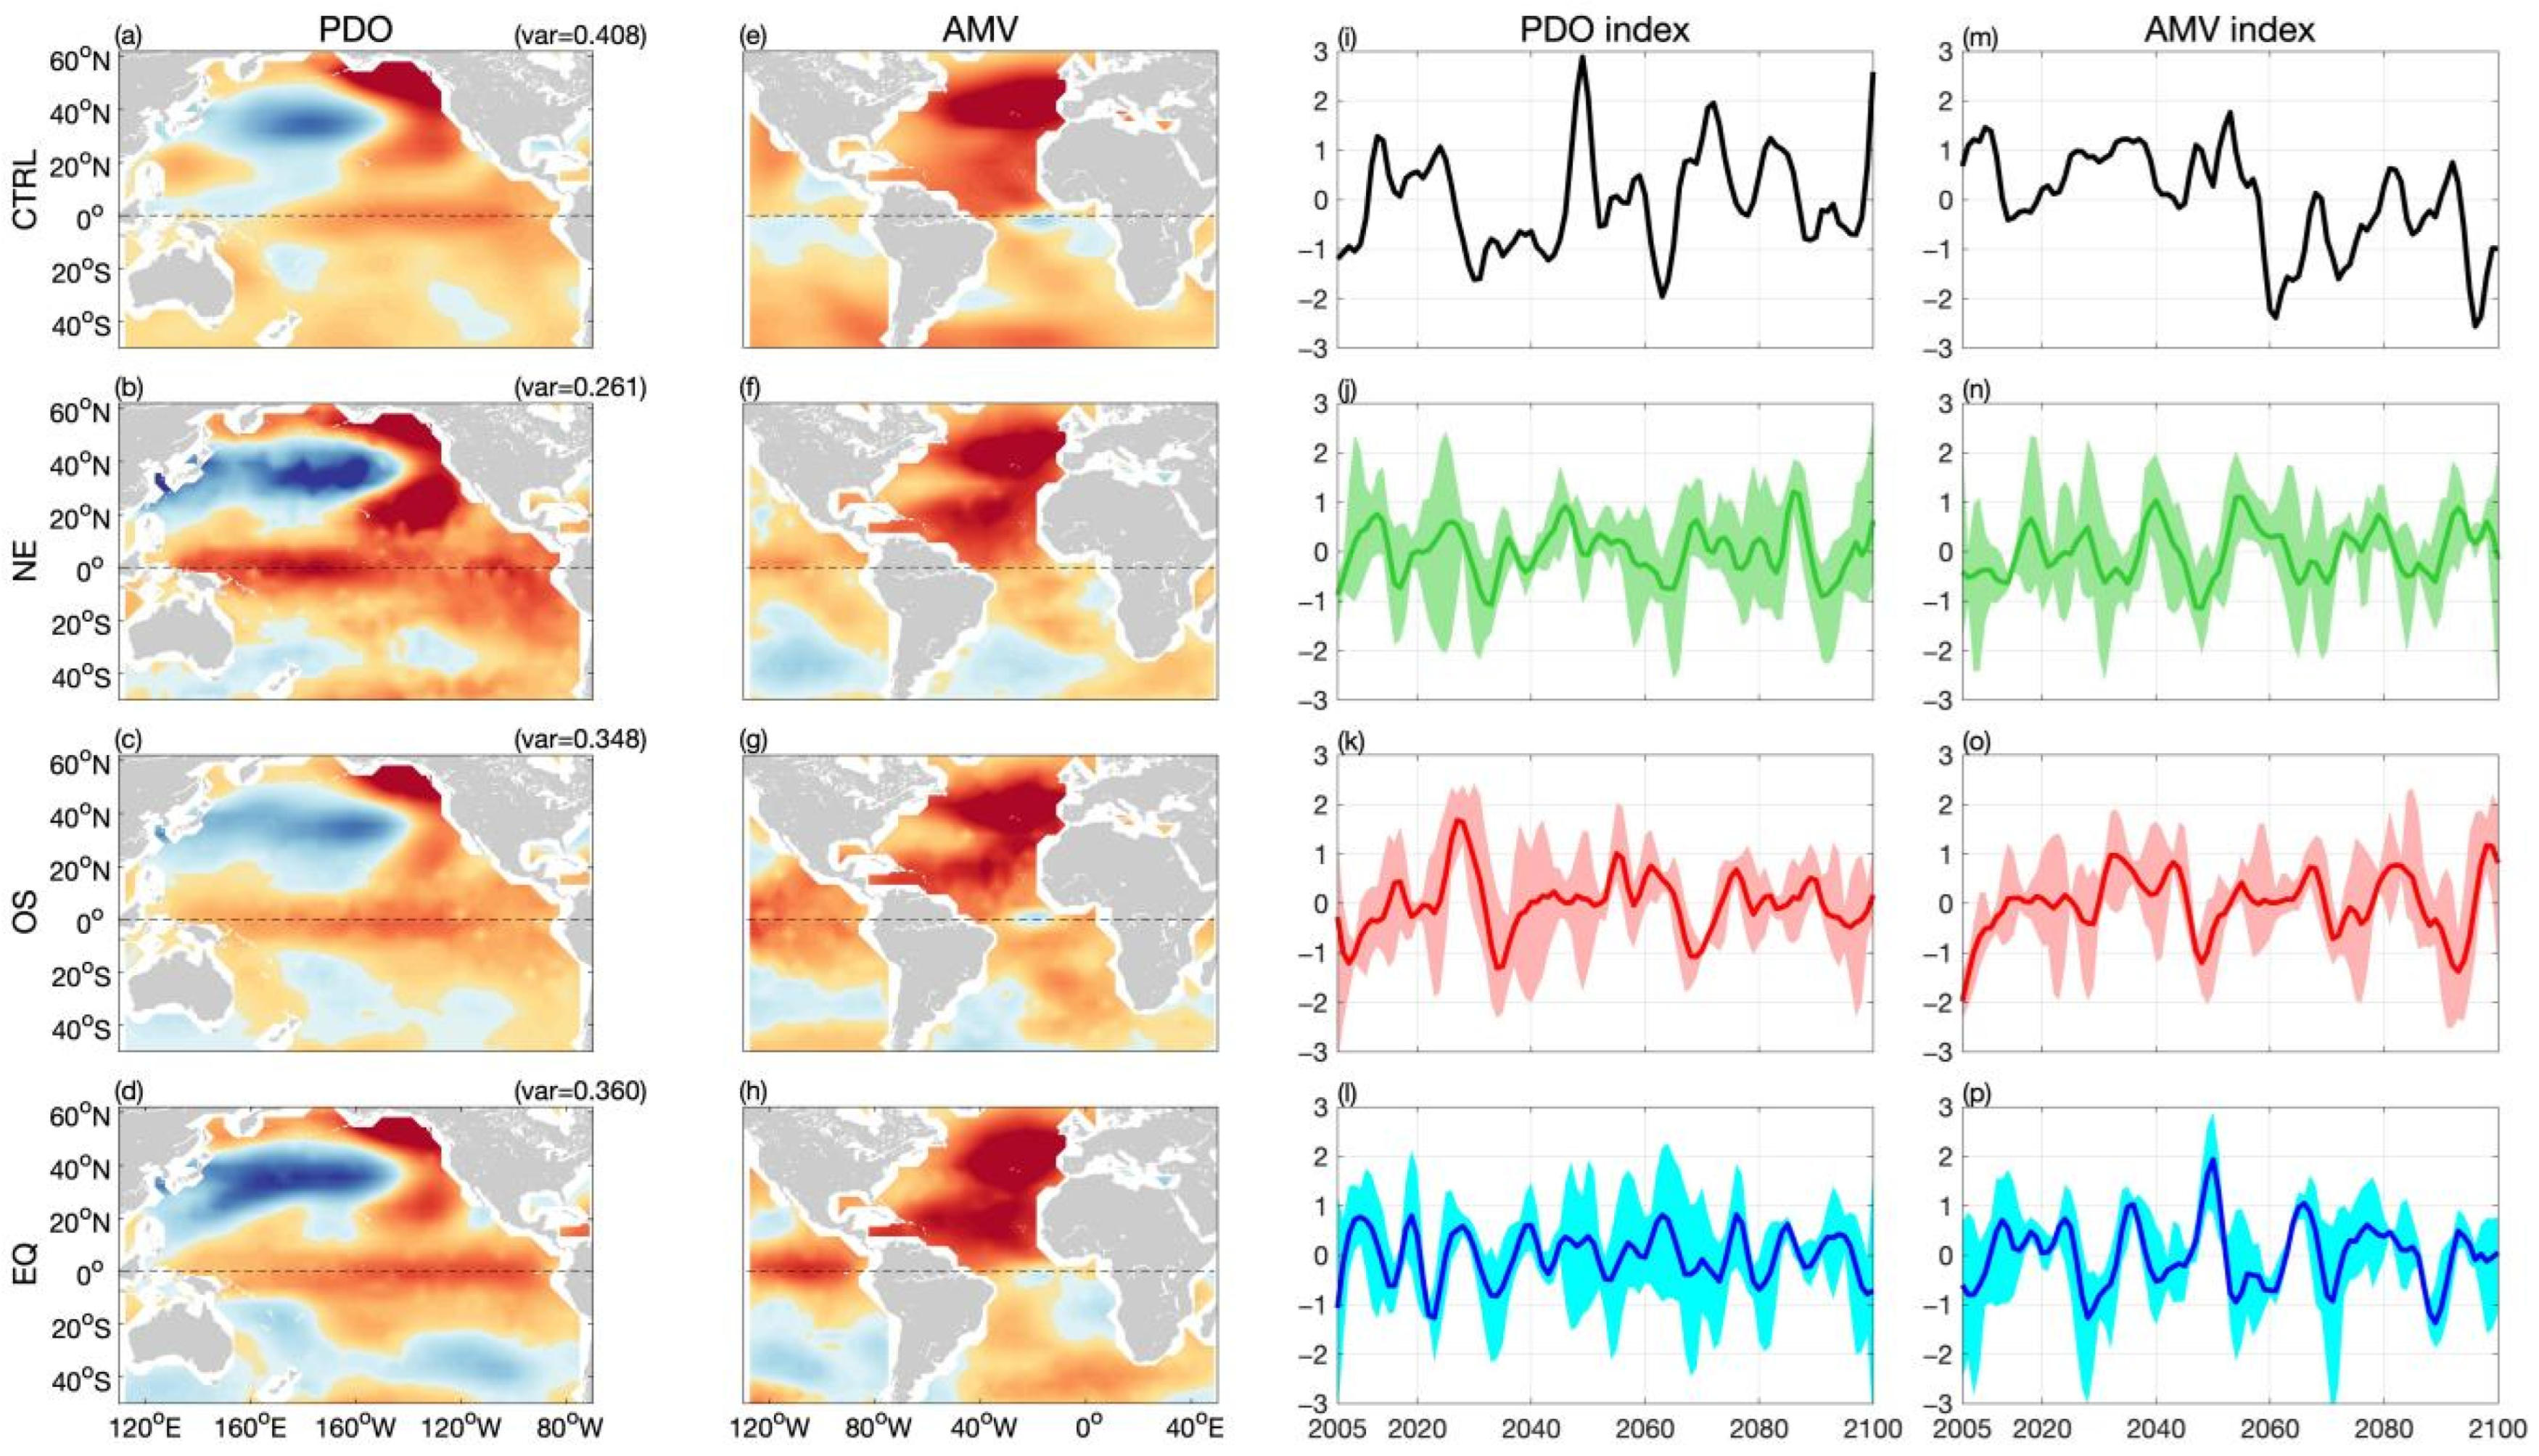
Although the global SST is not so different among the three warming scenarios, it is unclear how the decadal variability is going to respond to the three different CO2 pathways. We calculate the PDO and AMV index from 2006 to 2100 in three warming scenarios (NE, OS, and EQ), and pick the last 95 years from CTRL as benchmark. It is worth mentioning that the warming trend is removed (at each grid point) before calculating the indices. The calculated patterns of the PDO and AMV are still broadly similar to each other and to those in the CTRL (Figure 6a–h), but the variance in PDO is visibly reduced in all three warming cases (Figure 6i–l). In the meantime, both the PDO and AMV indices show more frequent oscillations under warming, especially in the EQ case (Figure 6i–p), indicating the shortening of their periods.
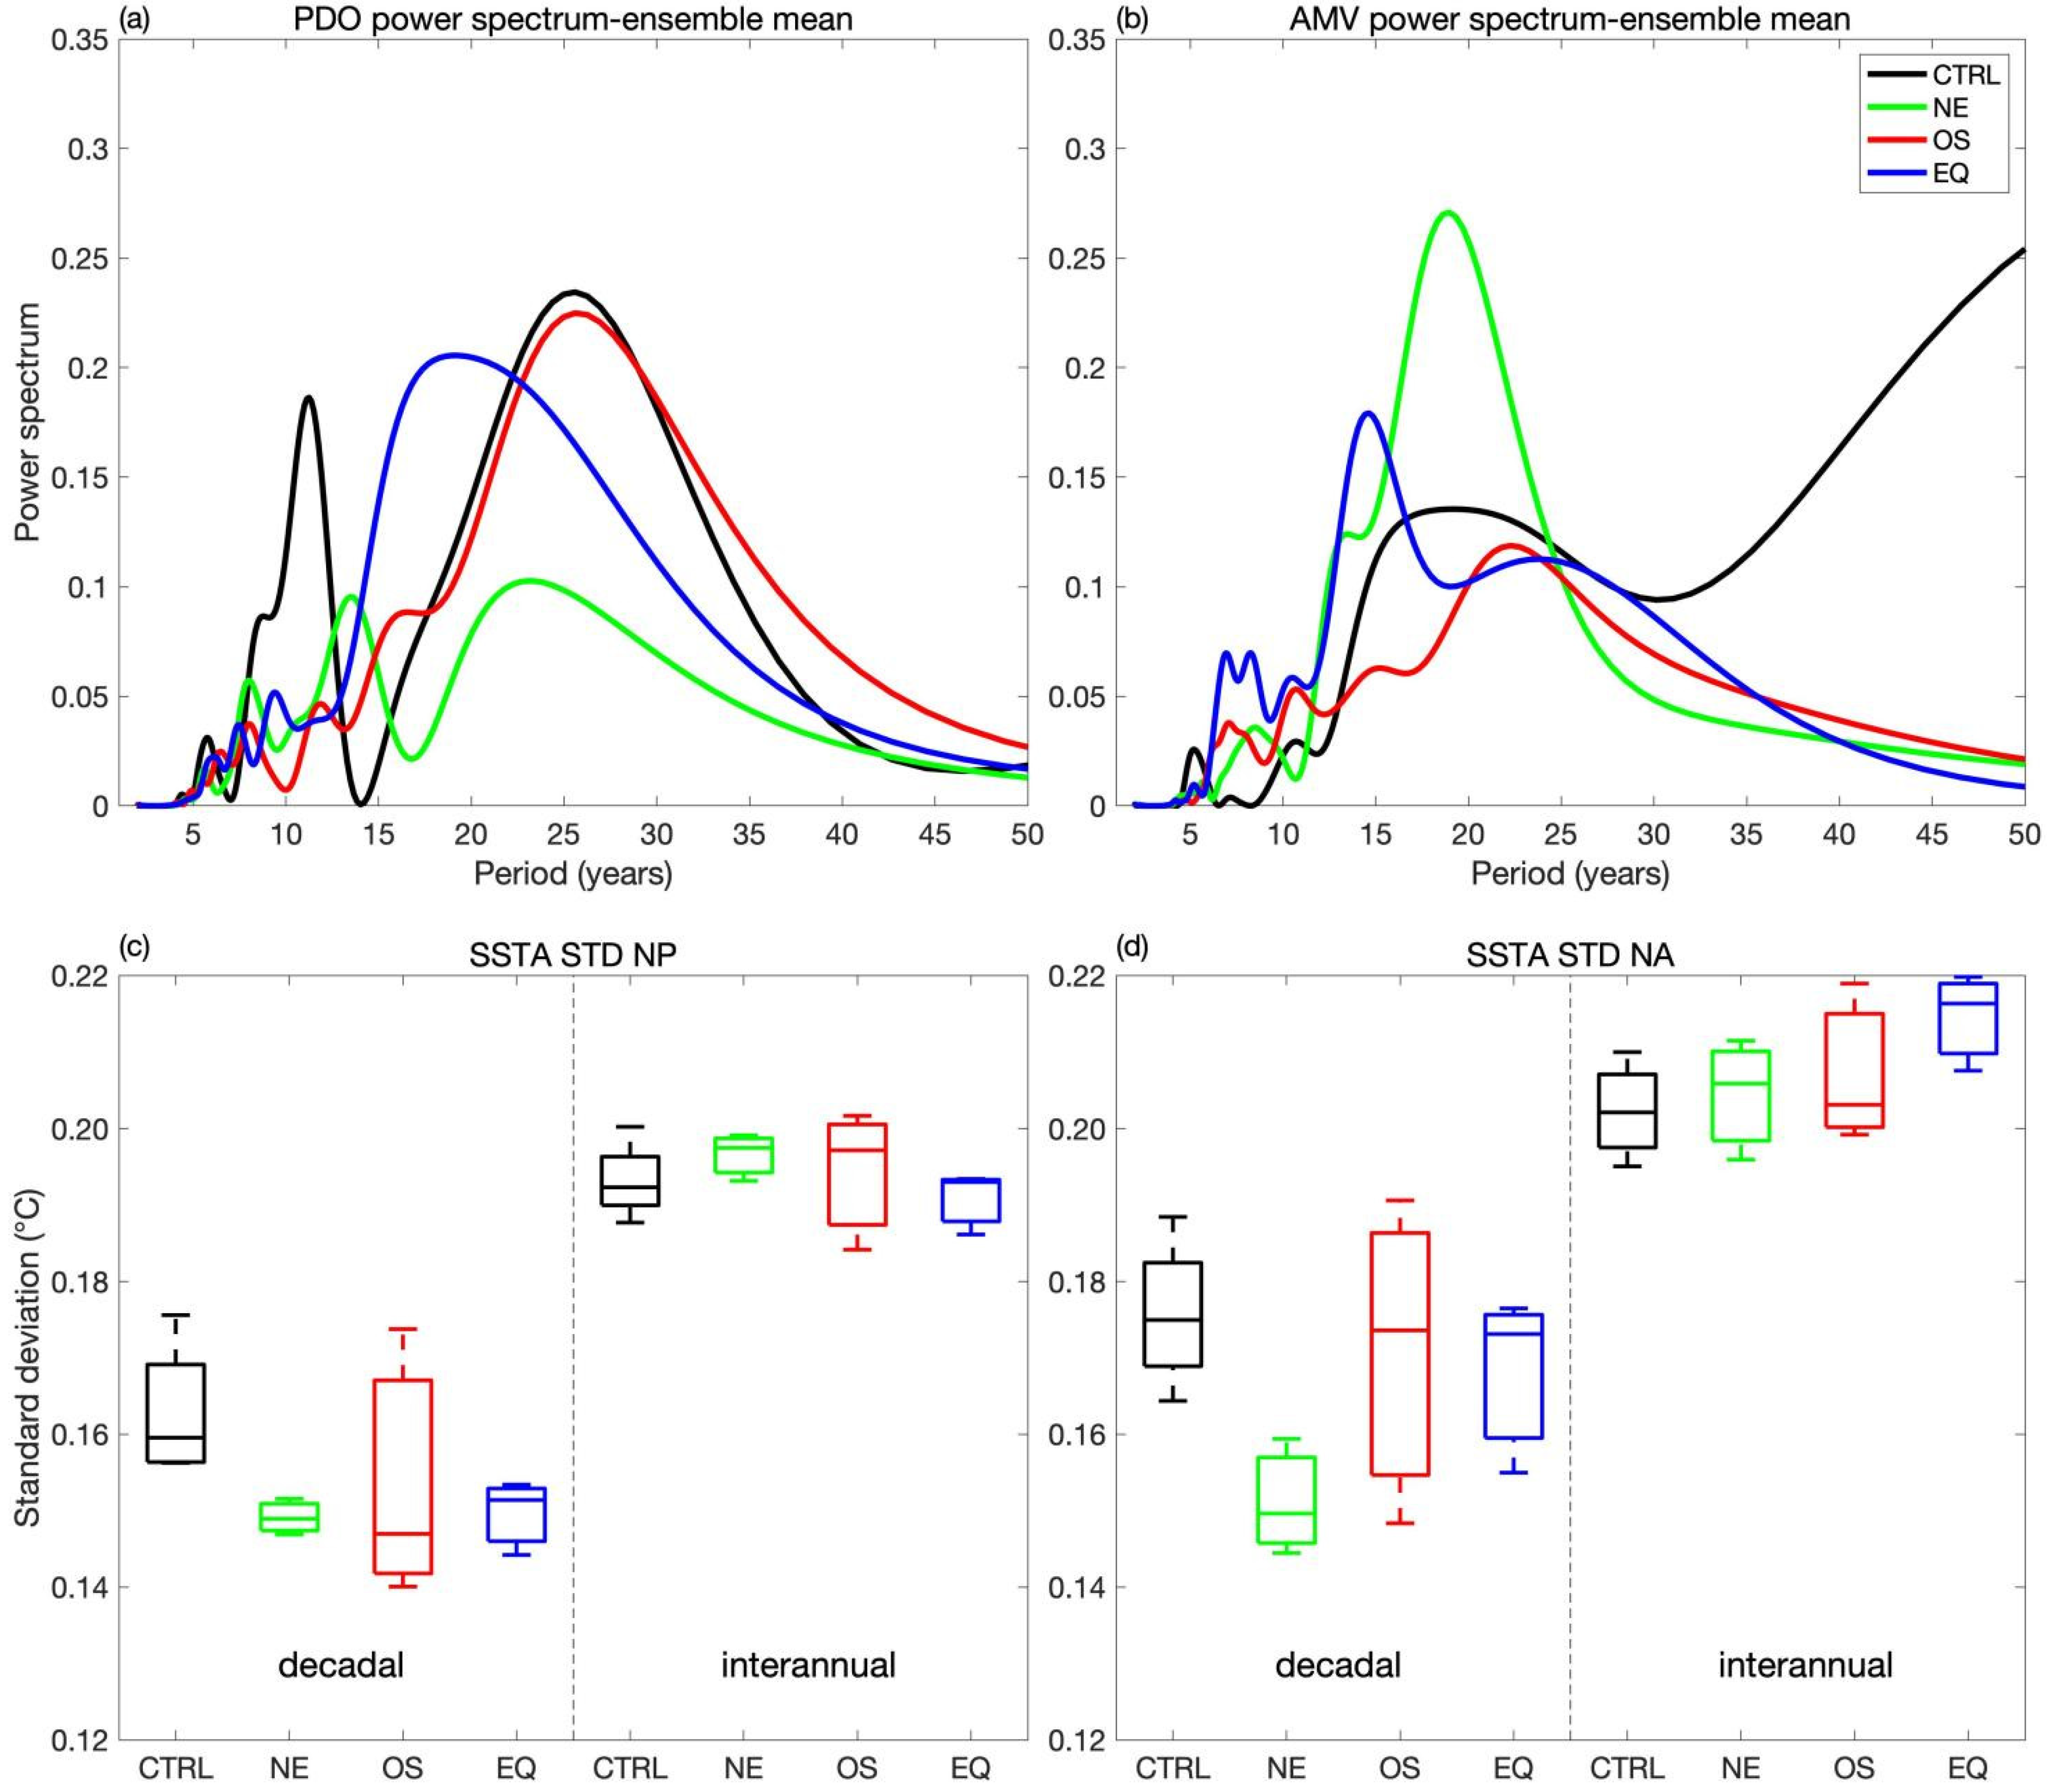
To demonstrate the response of decadal variability in the North Pacific and North Atlantic more clearly, the ensemble average of the power spectra and field average standard deviation of SSTA are calculated. Specifically, we calculate the power spectrum for each ensemble member, and then average the three members for PDO and AMV. Due to the limited data length (95 years), the power spectra are shown only for periods between 0 and 50 years. The primary period of PDO is around 25–30 years for CTRL, and changes differently for different warming scenarios (Figure 7a). The transient case OS has almost the same primary PDO period as the CTRL, while that in the NE case is slightly shorter (20–25 years). The EQ case has the shortest PDO period, slightly below 20 years. The change in the North Atlantic is less clear, as only the EQ case shows an obvious shortening of the AMV period. This is probably because the data length is too short to manifest the 70 year period that is often seen as the major period of AMV [36]. The fact that the shortening of PDO and AMV primary periods only becomes significant in the equilibrium warming may indicate that the shortening previously obtained for transient warming using multi-model data [37] is an overestimate.
The change in amplitude of SSTA variabilities is evaluated by field averaging the standard deviation of SSTA over the North Pacific and North Atlantic. The decadal variability is calculated using the low-pass time series, and the interannual variability is calculated using the residual time series (original minus low-pass time series), and both are shown in Figure 7c,d. The decadal variability is significantly weakened under global warming, especially over the North Pacific (Figure 7c); the median is reduced by around 10% compared with CTRL. In contrast, the interannual variability remains basically unchanged. In the North Atlantic, weakening of decadal variability is also seen, but is less significant than that in the North Pacific. A slight increase in interannual variability is seen in the North Atlantic (Figure 7d). This increase in interannual variability is dependent on its definition. As shown in a previous study [21], the change in interannual variability disappears if the 10 year running mean is used for the low-pass filtering.
Spatial distribution of the total and decadal variabilities of SST in the CTRL, as well as their changes in the warming scenarios, are shown in Figure 8. The change in decadal variability is very similar in pattern to the change in total variability, implying that the change in the former dominates the change in the latter and is consistent with what is found above. The weakening in decadal variability over the North Pacific and North Atlantic found here is consistent with that in previous studies [20,21,38], but we show here that the variabilities may increase in some regions, especially in the high latitude of both hemispheres. From the change in the zonal mean SST standard deviation (Figure 8j–l), it can be seen that both the total and decadal variabilities weaken significantly around 40° N in all three warming scenarios, but strengthen for latitudes that are further north than about 50° N. In the Southern Hemisphere, the change in variability is different among warming scenarios; it weakens significantly in the two transient warming cases, but strengthens significantly in the EQ case. The tropical and subtropical variabilities experience small changes under future warming.

6. Discussions and Conclusions

We first determine the ECS of FOAM to be 2.5 °C, and then, based on this, designed three different warming pathways (NE, OS, and EQ). Among them, NE and OS are transient and the global mean SSTA increases by 1.5 °C by the year 2100, relative to the pre-industrial era, while EQ is an equilibrium run and the global mean SSTA is also increased by 1.5 °C at the end. Results show that the increase of SST is only 1 °C by the year 2100, and, consistent with that, the magnitude of warming in land is higher than the global mean [39]. Although SST warms faster in the Northern Hemisphere, the HC rises faster in the Southern Hemisphere during the transient warming.
SST warms over the global region, but has a strong cooling anomaly in the Southern Ocean in two transient experiments which may be related to the cooling of Antarctic bottom water. However, the warming hole in the north Atlantic does not show up in the warming situation, which is shown in previous studies [4], and is thought to be associated with ocean circulation perturbation [8]. Compared to the equilibrium experiment, these cooler surfaces are associated with the expansion of sea ice (not shown), which suggests that the radiative feedback is stronger during climate change. Since FOAM has a weak transient climate response, it is not clear how robust the radiative feedback is in other models that are physically slightly different. Another reason for this cooling may be the northward shift in the Antarctic Circumpolar Current, which further cools the Southern Ocean region. This is different with the polar amplification [40,41] in the atmosphere. The difference between the four situations (NE1, OS1, OS2, and EQ1) is dominated by cumulative CO2 emissions and ocean circulation perturbations. A continuous slowdown of AMOC leads to the warmer Southern Hemisphere and cooler Northern Hemisphere in the EQ1, compared with the other three warming situations.
The former work reveals that the decadal variability shift from low frequency to high frequency, and becomes weaker under the global warming [21,42,43,44,45]. However, this work shows that the period reduction in PDO and AMV is obvious only in the equilibrium experiments, and there is no significant change in the transient cases (NE and OS). This is an important finding, that we may overestimate the response of decadal variability under global warming. This would help the short-term forecast in the future. However, there are still some uncertainties such as the fact that the data length is only 95 years (from 2006 to 2100), which is not long enough to analyze the decadal variability, especially in AMV, whose major period is longer than 50 years. Longer time series should be used in the future to verify this consequence. The weakening of decadal variability in the North Pacific and North Atlantic is still robust in different warming scenarios. Over the global region, the total SST standard deviation decreases except in sinking areas. The weakening of global mean decadal SST standard deviation is larger than the total decreasing, implying that the interannual SST standard deviation increases under global warming.
Overall, under 1.5 °C warming, the temperature increases over the global region, except for the surface of the Southern Ocean, and the increase in SST and HC starts in different hemispheres. The changes in the three 1.5 °C warming situations in the transient scenarios are subtle, while EQ1 has a significant difference in which the Northern Hemisphere is cooler and the Southern Hemisphere is warmer. We find that in different 1.5 °C warming scenarios, the weakening of decadal variability is robust, but the shortening of the period only appears in EQ. In this preliminary study, we provide a set of warming experiments, and find that the response is different in the transient cases and the equilibrium case. Further studies are needed to verify these conclusions in longer periods of data and stronger warming situations.

Author Contributions

Conceptualization, S.W. and Z.L.; methodology, S.W.; software, S.W.; validation, S.W., Z.L. and Y.L.; formal analysis, S.W.; investigation, S.W.; resources, Z.L.; data curation, S.W.; writing—original draft preparation, S.W.; writing—review and editing, S.W., J.D. and Y.L.; visualization, S.W.; supervision, S.W.; project administration, Y.L.; funding acquisition, Z.L. All authors have read and agreed to the published version of the manuscript.

Funding

This work is supported by Chinese MOST (2017YFA0603801) and NSFC (41630527).

Data Availability Statement

https://data.cma.cn/ (accessed on 13 May 2022).

Acknowledgments

The China Scholarship Council funded S.W.’s visiting at Georgia Institute of Technology. We thank Kejun Jiang and Jian Cao for helping us to design transient scenarios.

Conflicts of Interest

We declare that we do not have any commercial or associative interest that represent a conflict of interest in connection with the work submitted.

References

  1. Goodwin, P.; Katavouta, A.; Roussenov, V.M.; Foster, G.L.; Rohling, E.J.; Williams, R.G. Pathways to 1.5 °C and 2 °C warming based on observational and geological constraints. Nat. Geosci. 2018, 11, 102–107. [Google Scholar] [CrossRef]
  2. Nkemelang, T.; New, M.; Zaroug, M. Temperature and precipitation extremes under current, 1.5 °C and 2.0 °C global warming above pre-industrial levels over Botswana, and implications for climate change vulnerability. Environ. Res. Lett. 2018, 13, 065016. [Google Scholar] [CrossRef]
  3. Rogelj, J.; Popp, A.; Calvin, K.V.; Luderer, G.; Emmerling, J.; Gernaat, D.; Fujimori, S.; Strefler, J.; Hasegawa, T.; Marangoni, G. Scenarios towards limiting global mean temperature increase below 1.5 °C. Nat. Clim. Change 2018, 8, 325. [Google Scholar] [CrossRef]
  4. Sanderson, B.M.; Xu, Y.; Tebaldi, C.; Wehner, M.; O’Neill, B.C.; Jahn, A.; Pendergrass, A.G.; Lehner, F.; Strand, W.G.; Lin, L. Community climate simulations to assess avoided impacts in 1.5 and 2 °C futures. Earth Syst. Dyn. 2017, 8, 827–847. [Google Scholar] [CrossRef]
  5. Jevrejeva, S.; Jackson, L.; Grinsted, A.; Lincke, D.; Marzeion, B. Flood damage costs under the sea level rise with warming of 1.5 °C and 2 °C. Environ. Res. Lett. 2018, 13, 074014. [Google Scholar] [CrossRef]
  6. Qu, Y.; Liu, Y.; Jevrejeva, S.; Jackson, L.P. Future sea level rise along the coast of China and adjacent region under 1.5° C and 2.0° C global warming. Adv. Clim. Change Res. 2020, 11, 227–238. [Google Scholar] [CrossRef]
  7. Sanderson, B.M.; O’Neill, B.C.; Tebaldi, C. What would it take to achieve the Paris temperature targets? Geophys. Res. Lett. 2016, 43, 7133–7142. [Google Scholar] [CrossRef]
  8. Palter, J.B.; Frölicher, T.; Paynter, D.; John, J.G. Climate, ocean circulation, and sea level changes under stabilization and overshoot pathways to 1.5 K warming. Earth Syst. Dyn. 2018, 9, 817–828. [Google Scholar] [CrossRef]
  9. Lin, L.; Wang, Z.; Xu, Y.; Zhang, X.; Zhang, H.; Dong, W. Additional intensification of seasonal heat and flooding extreme over China in a 2 °C warmer world compared to 1.5 °C. Earth’s Future 2018, 6, 968–978. [Google Scholar] [CrossRef]
  10. Chen, L.; Qu, X.; Huang, G.; Gong, Y. Projections of East Asian summer monsoon under 1.5 °C and 2 °C warming goals. Theor. Appl. Climatol. 2019, 137, 2187–2201. [Google Scholar] [CrossRef]
  11. Baker, H.S.; Millar, R.J.; Karoly, D.J.; Beyerle, U.; Guillod, B.P.; Mitchell, D.; Shiogama, H.; Sparrow, S.; Woollings, T.; Allen, M.R. Higher CO2 concentrations increase extreme event risk in a 1.5 °C world. Nat. Clim. Change 2018, 8, 604–608. [Google Scholar] [CrossRef]
  12. Mitchell, D.; AchutaRao, K.; Allen, M.; Bethke, I.; Beyerle, U.; Ciavarella, A.; Forster, P.M.; Fuglestvedt, J.; Gillett, N.; Haustein, K. Half a degree additional warming, prognosis and projected impacts (HAPPI): Background and experimental design. Geosci. Model Dev. 2017, 10, 571–583. [Google Scholar] [CrossRef]
  13. Back, L.; Russ, K.; Liu, Z.; Inoue, K.; Zhang, J.; Otto-Bliesner, B. Global hydrological cycle response to rapid and slow global warming. J. Clim. 2013, 26, 8781–8786. [Google Scholar] [CrossRef]
  14. Abraham, J.P.; Baringer, M.; Bindoff, N.; Boyer, T.; Cheng, L.; Church, J.; Conroy, J.; Domingues, C.; Fasullo, J.; Gilson, J. A review of global ocean temperature observations: Implications for ocean heat content estimates and climate change. Rev. Geophys. 2013, 51, 450–483. [Google Scholar] [CrossRef]
  15. Chen, X.; Tung, K.-K. Varying planetary heat sink led to global-warming slowdown and acceleration. Science 2014, 345, 897–903. [Google Scholar] [CrossRef]
  16. Lee, S.-K.; Park, W.; Baringer, M.O.; Gordon, A.L.; Huber, B.; Liu, Y. Pacific origin of the abrupt increase in Indian Ocean heat content during the warming hiatus. Nat. Geosci. 2015, 8, 445–449. [Google Scholar] [CrossRef]
  17. Farneti, R. Modelling interdecadal climate variability and the role of the ocean. Wiley Interdiscip. Rev. Clim. Change 2017, 8, e441. [Google Scholar] [CrossRef]
  18. Chen, X.; Tung, K.-K. Global surface warming enhanced by weak Atlantic overturning circulation. Nature 2018, 559, 387–391. [Google Scholar] [CrossRef]
  19. Fang, C.; Wu, L.; Zhang, X. The impact of global warming on the pacific decadal oscillation and the possible mechanism. Adv. Atmos. Sci. 2013, 31, 118–130. [Google Scholar] [CrossRef]
  20. Cheng, J.; Liu, Z.; Zhang, S.; Liu, W.; Dong, L.; Liu, P.; Li, H. Reduced interdecadal variability of Atlantic Meridional Overturning Circulation under global warming. Proc. Natl. Acad. Sci. USA 2016, 113, 3175–3178. [Google Scholar] [CrossRef] [Green Version]
  21. Wu, S.; Liu, Z.-Y. Decadal variability in the North Pacific and North Atlantic under global warming: The weakening response and its mechanism. J. Clim. 2020, 33, 9181–9193. [Google Scholar] [CrossRef]
  22. Liu, Z.; Kutzbach, J.; Wu, L. Modeling climate shift of El Nino variability in the Holocene. Geophys. Res. Lett. 2000, 27, 2265–2268. [Google Scholar] [CrossRef]
  23. Wu, L.; Liu, Z.; Gallimore, R.; Jacob, R.; Lee, D.; Zhong, Y. Pacific decadal variability: The tropical Pacific mode and the North Pacific mode. J. Clim. 2003, 16, 1101–1120. [Google Scholar] [CrossRef]
  24. Liu, Z.; Liu, Y.; Wu, L.; Jacob, R. Seasonal and long-term atmospheric responses to reemerging North Pacific Ocean variability: A combined dynamical and statistical assessment. J. Clim. 2007, 20, 955–980. [Google Scholar] [CrossRef]
  25. Meraner, K.; Mauritsen, T.; Voigt, A. Robust increase in equilibrium climate sensitivity under global warming. Geophys. Res. Lett. 2013, 40, 5944–5948. [Google Scholar] [CrossRef]
  26. Knutti, R.; Rugenstein, M.A.; Hegerl, G.C. Beyond equilibrium climate sensitivity. Nat. Geosci. 2017, 10, 727–736. [Google Scholar] [CrossRef]
  27. Andrews, T.; Gregory, J.M.; Webb, M.J.; Taylor, K.E. Forcing, feedbacks and climate sensitivity in CMIP5 coupled atmosphere-ocean climate models. Geophys. Res. Lett. 2012, 39. [Google Scholar] [CrossRef]
  28. Cao, J.; Wang, B.; Young-Min, Y.; Ma, L.; Li, J.; Sun, B.; Bao, Y.; He, J.; Zhou, X.; Wu, L. The NUIST Earth System Model (NESM) version 3: Description and preliminary evaluation. Geosci. Model Dev. 2018, 11, 2975–2993. [Google Scholar] [CrossRef]
  29. Stocker, T.F.; Qin, D.; Plattner, G.-K.; Tignor, M.; Allen, S.K.; Boschung, J.; Nauels, A.; Xia, Y.; Bex, V.; Midgley, P.M. Climate Change 2013: The Physical Science Basis; Cambridge University Press: Cambridge, UK, 2013. [Google Scholar]
  30. Zhang, Y.; Wallace, J.M.; Battisti, D.S. ENSO-like interdecadal variability: 1900–93. J. Clim. 1997, 10, 1004–1020. [Google Scholar] [CrossRef]
  31. Mantua, N.J.; Hare, S.R.; Zhang, Y.; Wallace, J.M.; Francis, R.C. A Pacific interdecadal climate oscillation with impacts on salmon production. Bull. Am. Meteorol. Soc. 1997, 78, 1069–1080. [Google Scholar] [CrossRef]
  32. Enfield, D.B.; Mestas-Nuñez, A.M.; Trimble, P.J. The Atlantic Multidecadal Oscillation and its relation to rainfall and river flows in the continental U.S. Geophys. Res. Lett. 2001, 28, 2077–2080. [Google Scholar] [CrossRef]
  33. Wu, Z.; Huang, N.E. Ensemble empirical mode decomposition: A noise-assisted data analysis method. Adv. Adapt. Data Anal. 2009, 1, 1–41. [Google Scholar] [CrossRef]
  34. Gregory, J.M. Vertical heat transports in the ocean and their effect on time-dependent climate change. Clim. Dyn. 2000, 16, 501–515. [Google Scholar] [CrossRef]
  35. He, C.; Liu, Z.; Hu, A. The transient response of atmospheric and oceanic heat transports to anthropogenic warming. Nat. Clim. Change 2019, 9, 222–226. [Google Scholar] [CrossRef]
  36. Sutton, R.T.; Hodson, D.L. Atlantic Ocean forcing of North American and European summer climate. Science 2005, 309, 115–118. [Google Scholar] [CrossRef]
  37. Wu, S.; Liu, Z.-Y.; Cheng, J.; Li, C. Response of North Pacific and North Atlantic decadal variability to weak global warming. Adv. Clim. Change Res. 2018, 9, 95–101. [Google Scholar] [CrossRef]
  38. Zhang, L.; Delworth, T.L. Simulated response of the Pacific decadal oscillation to climate change. J. Clim. 2016, 29, 5999–6018. [Google Scholar] [CrossRef]
  39. Li, D.; Zhou, T.; Zou, L.; Zhang, W.; Zhang, L. Extreme high-temperature events over East Asia in 1.5 °C and 2 °C warmer futures: Analysis of NCAR CESM low-warming experiments. Geophys. Res. Lett. 2018, 45, 1541–1550. [Google Scholar] [CrossRef]
  40. Polyakov, I.V.; Alekseev, G.V.; Bekryaev, R.V.; Bhatt, U.; Colony, R.L.; Johnson, M.A.; Karklin, V.P.; Makshtas, A.P.; Walsh, D.; Yulin, A.V. Observationally based assessment of polar amplification of global warming. Geophys. Res. Lett. 2002, 29, 25-1–25-4. [Google Scholar] [CrossRef]
  41. Holland, M.M.; Bitz, C.M. Polar amplification of climate change in coupled models. Clim. Dyn. 2003, 21, 221–232. [Google Scholar] [CrossRef]
  42. MacMartin, D.G.; Zanna, L.; Tziperman, E. Suppression of Atlantic meridional overturning circulation variability at increased CO2. J. Clim. 2016, 29, 4155–4164. [Google Scholar] [CrossRef]
  43. Armstrong, E.; Valdes, P.; House, J.; Singarayer, J. Investigating the Impact of CO2 on Low-Frequency Variability of the AMOC in HadCM3. J. Clim. 2017, 30, 7863–7883. [Google Scholar] [CrossRef]
  44. Wang, J.; Li, C. Low-Frequency Variability and Possible Changes in the North Pacific Simulated by CMIP5 Models. J. Meteorol. Soc. Jpn. Ser. II 2017, 95, 199–211. [Google Scholar] [CrossRef]
  45. Li, S.; Wu, L.; Yang, Y.; Geng, T.; Cai, W.; Gan, B.; Chen, Z.; Jing, Z.; Wang, G.; Ma, X. The Pacific Decadal Oscillation less predictable under greenhouse warming. Nat. Clim. Change 2020, 10, 30–34. [Google Scholar] [CrossRef]
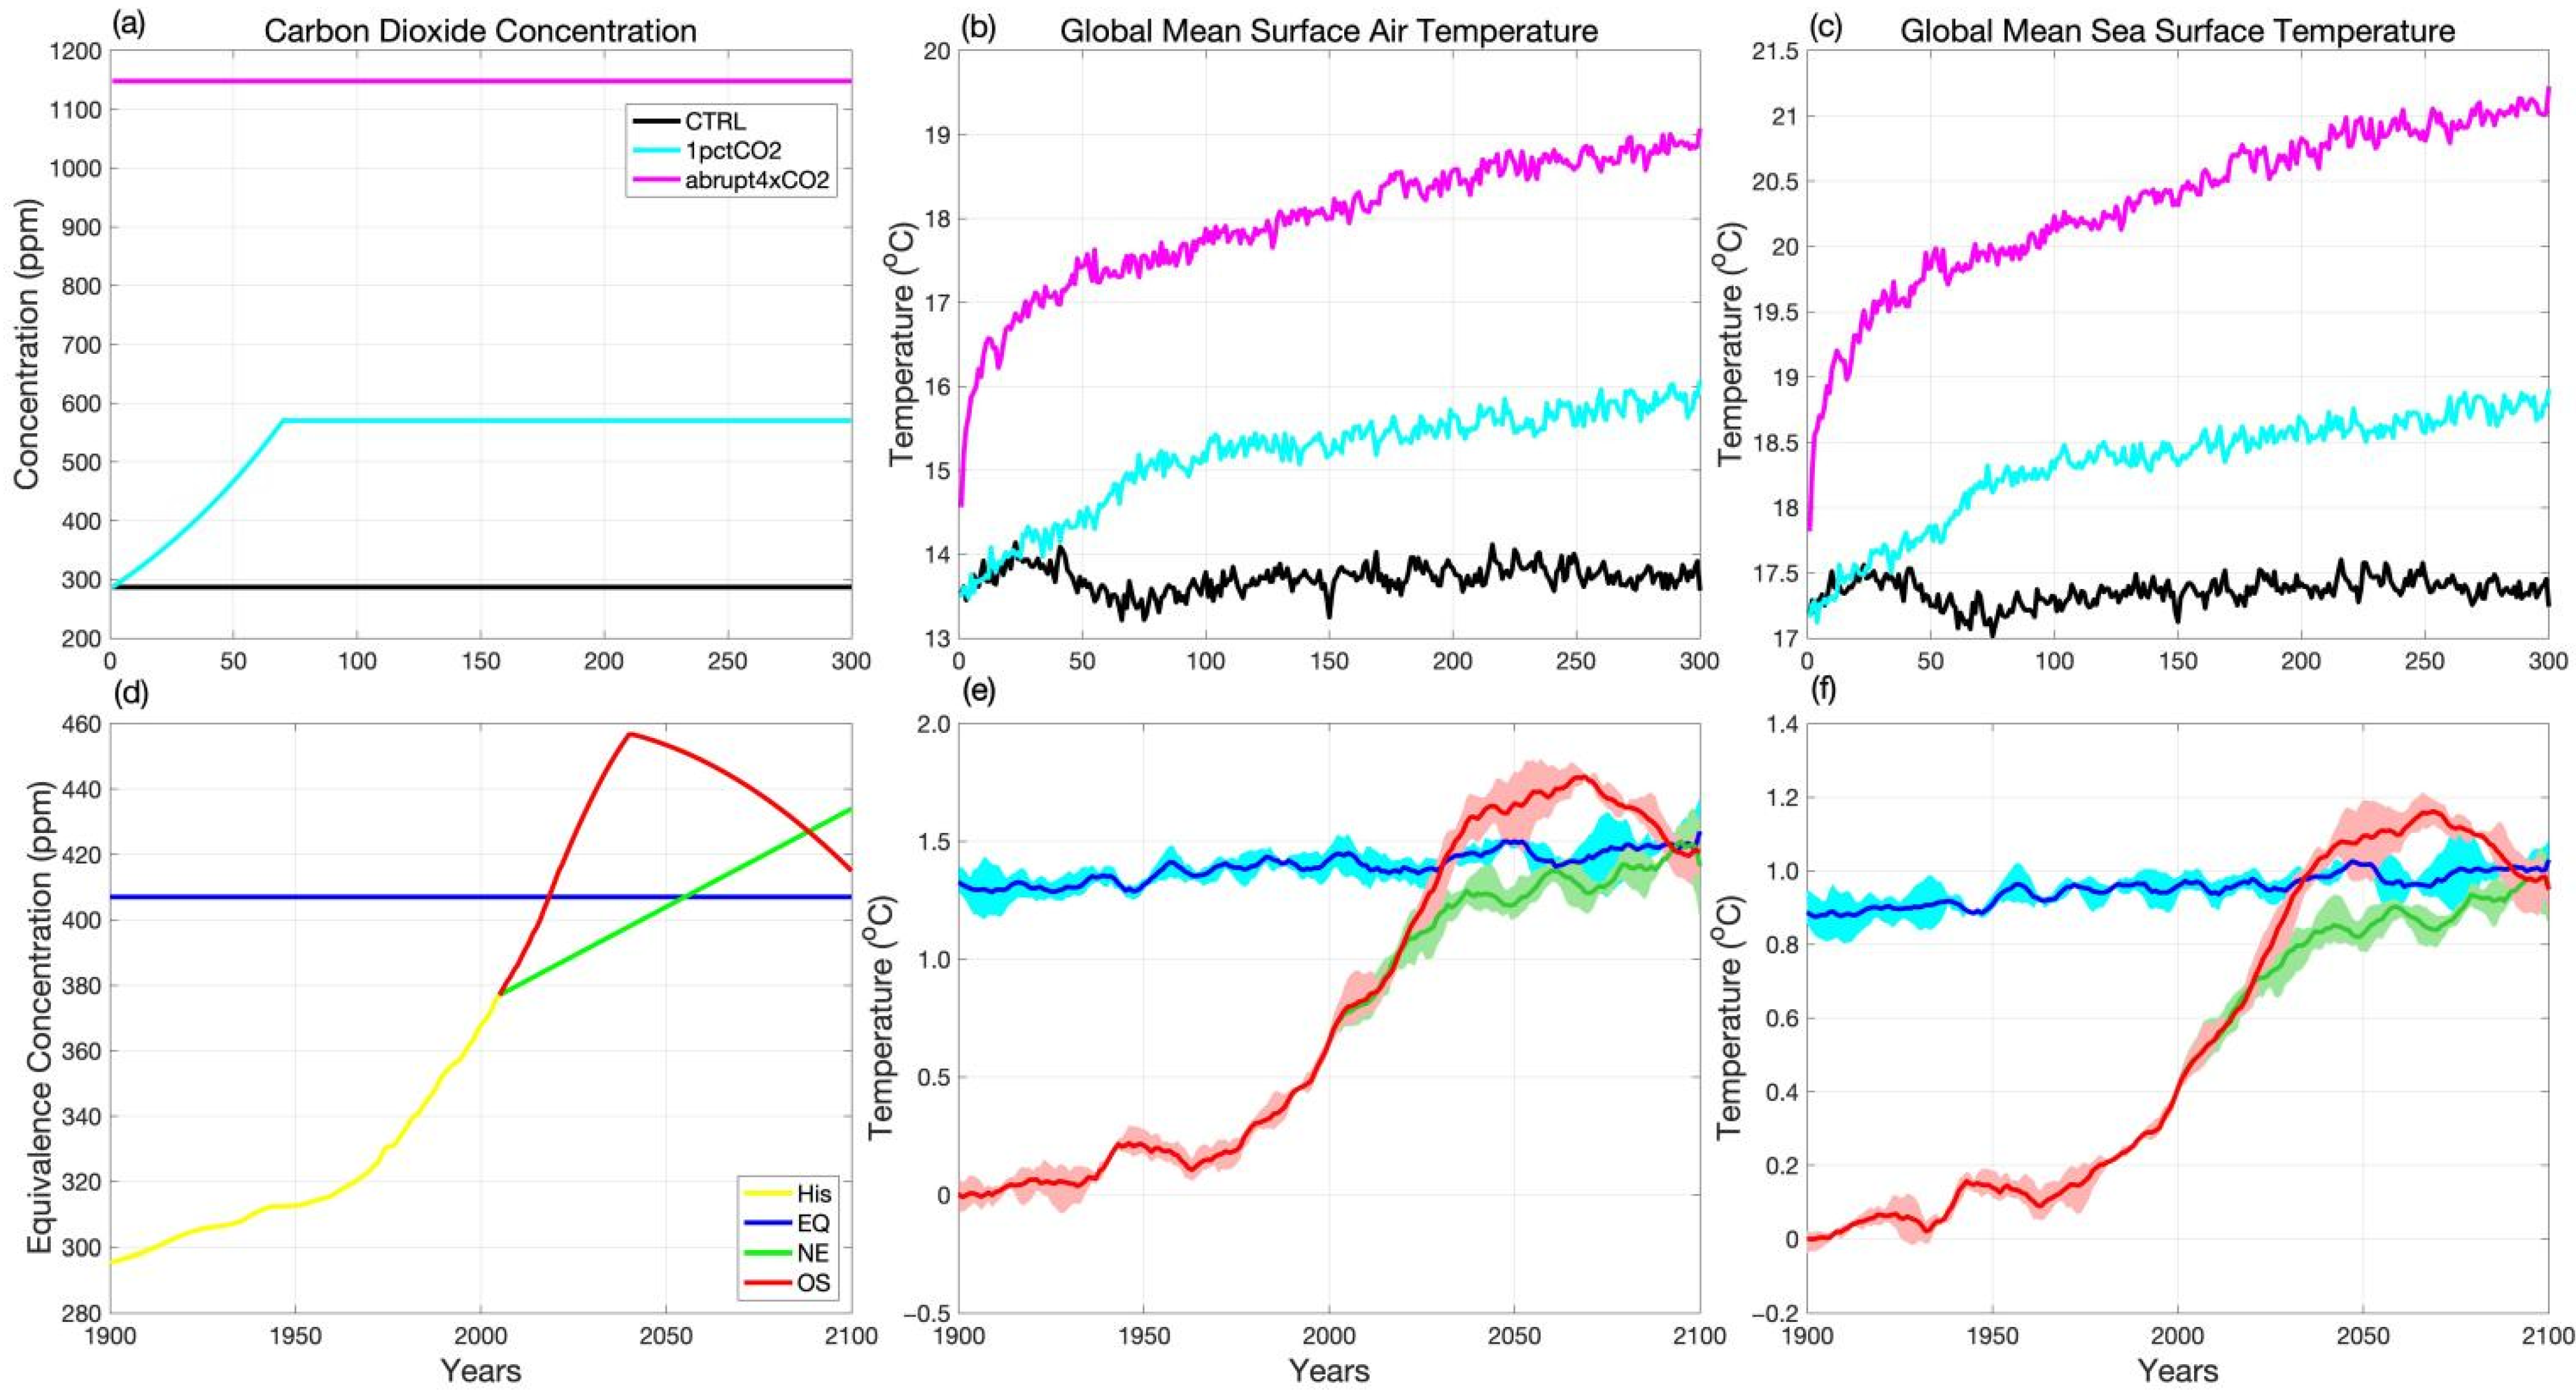
Figure 1. The time series of the CO2 concentration (a,d), global mean surface air temperature (b,e), and global mean sea surface temperature (c,f). The black line represents the control run (CTRL). The light blue and green lines represent the 1% per year CO2 increase experiment (1 pctCO2) and the abrupt quadrupling of CO2 experiment (abrupt4×CO2), respectively. The yellow line represents the historical CO2 concentration (His). The blue, green, and red lines represent the average of equilibrium experiment (EQ), the never-exceed pathway (NE), and the overshoot pathway of 1.5 °C (OS), respectively. The shaded region in (e,f) is calculated from three members of each experiment.
Jmse 10 01231 g001
Figure 2. Results from the 1% per year CO2 increase experiment (a) and the abrupt quadrupling of CO2 experiment (b). The relationships between the change in net radiative flux at the TOA and the global mean surface air temperature in FOAM. The black points show the yearly data after the equilibrium warming, and the blue points are chosen from the periods at the time of CO2 doubling. Lines represent ordinary least squares regression fits to the points. The slopes of the regression lines illustrate the strength of the feedbacks.
Jmse 10 01231 g002
Figure 3. The sea surface temperature (SST) and ocean heat content (HC) change in the twenty-first century relative to the nineteenth century shown as zonal mean (a,e). The zonal mean SST and HC change each year under three global warming scenarios (bd,fh). Units are °C and J/m2.
Jmse 10 01231 g003
Figure 4. Spatial patterns of SST (a), HC (f), and vertical profile of ocean potential temperature (k). (be,gj,lo) The differences between the twenty-first century (2091–2100) relative to the PI (1896–1905) in the EQ, the NE, the OS, and the PI, respectively. The OS1 means the first time to achieve 1.5 °C and the OS2 means the second time. Units are °C, J/m2, and °C for three columns.
Jmse 10 01231 g004
Figure 5. The differences in SST (af), HC (gl), and potential temperature (mr) between equilibrium experiment and other three 1.5 °C situations (NE, OS1, OS2). The units are °C, J/m2, and °C for three columns.
Jmse 10 01231 g005
Figure 6. PDO and AMV spatial regression pattern (ah) from simulations of CTRL, NE, OS, and EQ, respectively. The explained variance for the first EOF mode of North Pacific annual mean SSTA is given at the upper right of each panel (ad). PDO and AMV index (ip) for four simulations. The shaded regions in (jl,np) are calculated from three members of each experiment.
Jmse 10 01231 g006
Figure 7. (top) Ensemble mean power spectra of (a) PDO and (b) AMV from the simulations of CTRL and three 1.5 °C warming scenarios. (bottom) Distribution of the average of the (c) North Pacific and (d) North Atlantic SSTA standard deviation fields in CTRL, NE, OS, and EQ. “Decadal” and “interannual” mean decadal and interannual standard deviations, respectively. Boxplot boundaries are set at the 25th and 75th percentiles (p25 and p75, respectively).
Jmse 10 01231 g007
Figure 8. Standard deviation (STD) of unfiltered (a) and 6 yr low-pass filtered (e) annually averaged SST, and the zonal mean STD (i) in CTRL. (bd,fh,jl) The differences between EQ, NE, OS, and CTRL, respectively. The global mean of the differences is shown in the upper right corner. The unit is °C.
Jmse 10 01231 g008
Publisher’s Note: MDPI stays neutral with regard to jurisdictional claims in published maps and institutional affiliations.