Article

Experimental Study on Gas–Liquid–Solid Interaction Characteristics in the Launch Tube

1
School of Energy and Power Engineering, Nanjing University of Science and Technology, Nanjing 210094, China
2
The Third Research Department, Xi’an Modern Chemistry Research Institute, Xi’an 710065, China
*
Author to whom correspondence should be addressed.
J. Mar. Sci. Eng. 2022, 10(9), 1239; https://doi.org/10.3390/jmse10091239
Submission received: 5 August 2022 / Revised: 31 August 2022 / Accepted: 1 September 2022 / Published: 3 September 2022
(This article belongs to the Section Ocean Engineering)

Abstract

:
In the present study, a visual experimental system was built to explore the multiphase hydrodynamic features in the underwater launching process. The whole processes of gas-curtain generation produced by multichannel jet convergence, gas-curtain expansion, and projectile movement were captured using direct photography. The experimental results show that as the area of a single groove grows from 6.25 mm2 to 11.25 mm2, the gas-curtain displacement grows by 47.5%, and the projectile’s speed reduces by 34.1%. The expansion of the gas curtain can be aided by 36.0% by increasing the number of sidewall grooves within a specified range (4 to 8), but the vehicle’s speed is reduced by 53.8%. While increasing the maximum injection pressure from 9.9 MPa to 18.2 MPa, the gas curtain’s draining capability is improved by 29.6%, and the projectile speed increment diminishes (only 10.0%) as the amount of gas flowing into the front of the projectile grows. The impact of jet parameters on gas-curtain displacement and projectile speed is revealed in this study, which is of utmost significance to the parameter-matching design of underwater low-resistance launchers.

1. Introduction

With the improved strategic positioning of the ocean in recent years, researchers have conducted substantial studies on the engineering background of underwater propulsion and underwater vehicle drag reduction. For underwater launching devices, such as underwater guns, the launch tube is filled with water, which brings great launch resistance and seriously slows down the moving speed of the vehicle. In order to solve this problem, researchers have proposed gas-curtain launching to reduce the underwater launch resistance. By setting up injection channels inside the projectile or in the inner wall of the barrel, our team [1,2] analyzed the interaction characteristics between multiple gas jets and water in the circular tube, and revealed the formation mechanism and influencing factors of the gas curtain without considering the motion of the projectile. In addition, there are few studies on the gas–liquid interaction in the underwater launch tube, and most of them focus on the underwater rocket engine gas jet and gas drag-reduction launching of underwater missiles.
From the aspect of the underwater rocket engine gas jet, Gong [3] studied the expansion characteristics of the Laval nozzle gas jet at various water depths, and obtained the evolution process of the jet under the operation of a succession of expansion and compression waves. Kang [4] conducted an experimental study on the high-speed underwater jet engine to clarify the influence of the nozzle outlet area on engine thrust fluctuation and efficiency. Degtiar [5] developed a mathematical model of the interaction between high-temperature gas and water, focusing on interphase heat and mass transport, as well as hydrodynamic features in the two-phase flow field. With a vertical-pressure water vessel to simulate a water depth of 100–300 m, Zhang [6] experimentally evaluated the flow characteristics of the overexpanded gas jet and numerically analyzed the fine structure of the flow field. Through numerical simulation, Xiang [7] detected three gas–liquid flow patterns under the circumstance of jet flow variation and disclosed the conversion process between distinct modes. In terms of ventilated supercavitation drag reduction, Yu [8] examined the evolution process of ventilated cavitation on axisymmetric trips, identified the primary reasons for cavitation shedding using numerical modeling, and explained the influence of ventilation on the length, thickness, and shedding position of cavitation. Zou [9] established a three-dimensional supercavitation maneuvering model and analyzed the evolution characteristics and the pressure distribution characteristics under the conditions of cavitation deflection. Wang [10] studied the flow structure of the ventilated cavity and the shedding process of the unsteady cavity through experimental testing and numerical simulation, and found that the flow pattern of the ventilated cavity can be mainly divided into the structure with vortex shedding and the relatively stable structure. Xu [11] numerically studied the closure morphology of ventilated supercavitation, focusing on the flow field structure and gas leakage behavior of ventilated supercavitation at a high Froude number. Shao [12] carried out research on the gas leakage mechanism and flow stability of ventilated supercavitation, and found that the double-vortex closure mode under medium ventilation conditions is more conducive to the stability of ventilated supercavitation. In the aspect of gas drag-reduction launching of underwater missiles, Weiland [13] analyzed the concentric cylinder launching of underwater missiles. According to the empirical data and numerical simulation, it was found that the cylinder gas curtain can effectively reduce the added mass and launch resistance, so as to improve the initial launch speed. Cao [14] numerically analyzed the influence of jet velocity on the gas-curtain shape and launch resistance, and found that different jet velocities do not affect the smooth passage of the vehicle through the minimum radius of the gas curtain after exiting the cylinder, but the larger Mach number of the gas jet would bring larger total resistance coefficient of the vehicle. Wang [15] established a three-dimensional unsteady model for the concentric cylinder launching process of submarine-launched missiles, focusing on the analysis of the distribution characteristics of the water–air two-phase flow field and its impact on the missile movement. It was found that the cylinder mouth bubble has periodic expansion and compression effects, and the pressure pulsation caused by it is the driver of the missile acceleration pulsation. Hu [16] experimentally studied the gas jet evolution characteristics of the underwater vertical annular nozzle. It was found that the jet morphology presents two states, that is, the continuous jet and centralized pinch-off.
During the launching and navigation process in the underwater wet launching environment, the projectile is challenged with complex multiphase flow problems. Previous research primarily concentrated on the gas–liquid interaction during projectile exit from the tube and underwater navigation, but there is a lack of research on multiphase hydrodynamics in the launching tube. A visual launch system was built to study the gas curtain generated by the multigroove jets, the expansion of the gas curtain, and the projectile motion under various working conditions in order to better understand the multiphase fluid dynamics characteristics in the tube during the underwater low-resistance launching process. The research results are of great significance to promote the progress of underwater low-resistance launch technology.

2. Experimental Device

In this study, the simulated experiment apparatus illustrated in Figure 1 is built. A gas generator, gas storage chamber, clear round tube, projectile (embedded sealing diaphragm), pulse igniter, high-speed video system, and pressure test system are the major components of the system.
The gas generator and the storage chamber are connected by threads and separated by a sealing diaphragm. The function of the diaphragm is to ensure that the propellant can be burned completely, and to prevent high-temperature and high-pressure gas from acting directly on the wall surface of the filling tube, causing the rupture of the tube. The clear round tube made of Plexiglas is 300 mm long and 30 mm in diameter. The projectile shown in Figure 2 has a maximum diameter of 30 mm and a mass of 180 g. The projectile head is a round table with a diameter of 10 mm. The platform has a slope of 45°. There are 4–8 rectangular grooves evenly opened along the projectile circumference. A sealing diaphragm is embedded inside the projectile to prevent water from entering the gas storage chamber before ignition. A start device connection is employed between the projectile and the gas storage chamber. The high-speed video system consists of a high-speed video (FASTCAM Mini AX50 type) and a computer. In the experiment, the frame rate of 4000 fps was used to record the formation and expansion of the gas curtain and the projectile movement. The pressure test system consists of a piezoelectric pressure sensor, charge amplifier, and data acquisition system to record the gas pressure. The structural parameters of simulated projectiles are given in Table 1. Among them, the number of grooves of Projectiles A, B, and C is 4, and the area of individual grooves increases successively. Projectiles B, D, and E have the same area of a single groove, with the number of grooves in order of 4, 6, and 8.
During the experiment, the simulated projectile was first loaded into the bottom of the tube, which was fixed vertically to the experimental platform and filled with water. Then, a gas generator containing a 2/1 single-base propellant was installed under the gas storage chamber, and the ignition line was connected to the pulse igniter. Finally, all personnel evacuated to the test room. After the pulse igniter was charged, the high-speed video system and pressure test system were ready. The pulse igniter was started, and the data were recorded and saved. Once the impulse igniter was loaded, the high-speed video system and the pressure test system were ready. The impulse igniter was started, and the data were recorded. The experimental principle was that by igniting the propellant in the gas generator through the pulse igniter, the pressure in the generator rises rapidly to a certain value and then enters the gas storage chamber. Once the pressure in the gas storage chamber reaches the destruction pressure of the sealing diaphragm inside the projectile, the gas enters the grooves through the porous structure inside the projectile, forming multiple gas jets. The multiple gas jets expand and converge to form a gas curtain in the filled circular tube and expel the water column in the tube. When the pressure difference between the front and rear ends of the projectile reaches the breaking pressure of the start device, the projectile begins to move in the gas curtain.

3. Experimental Results and Discussions

3.1. Influence of a Single Groove Area

In order to study the influence of a single groove area on the expansion characteristics of multiple gas jets in a circular tube, experiments were carried out based on three simulated Projectiles A, B, and C, using the same charge and sealing diaphragm. The maximum pressure of the gas storage chamber was measured to be pmax = 9.9 MPa, and the sequence diagram of the simulated launching process shown in Figure 3 was obtained.
It can be seen from Figure 3 that at 2 ms, the three projectiles are not started, but the groove jets have all completed the circumferential convergence, indicating the preliminary formation of the gas curtain. With the increase in the area of a single groove, the gas-curtain displacement increases in turn, the gas-curtain head looks more flat, and the projectile head is more thoroughly covered by the gas. At 4 ms, under the three working conditions, as the fuel gas continues to be sprayed from the gas storage chamber to the front of the projectile, the projectile has started, and the gas-curtain displacement has increased significantly. Due to the gas–liquid instability, the gas-curtain head is more uneven than the previous moment. From 8 ms to 20 ms, the projectile continues to move upward, and the gas-curtain displacement continues to increase. The larger the area of a single groove, the longer the displacement of the gas curtain, and the flatness of the gas-curtain head gradually becomes better than that at 4 ms. In this period, the displacement of Projectile A is the smallest, and the displacement of Projectiles B and C is almost the same.
In order to further understand the multiphase hydrodynamic characteristics of the simulated launching process, the variation curves of the gas-curtain displacement and the projectile velocity with time are given in Figure 4 and Figure 5, respectively. Among them, the gas-curtain displacement represents the drainage capacity of the gas curtain, and the projectile velocity reflects the energy distribution effect. It can be seen from Figure 4 that the gas-curtain displacement increases with time under the three working conditions, and with the increase in the area of a single groove, the amount of fuel gas flowing from the gas storage chamber to the projectile front increases, which promotes the growth of the gas-curtain displacement and improves the drainage capacity of the gas curtain. At 20 ms, the gas-curtain displacement with Projectile A is 282 mm, but it is 361 mm and 416 mm with Projectiles B and C, which is 28.0% and 47.5% higher than with Projectile A. It can be seen from Figure 5 that the projectile velocity increases fast under each of the three working conditions before stabilizing around 8.2 m/s, 8.0 m/s, and 5.4 m/s, respectively. According to Figure 4, with the increase in the area of a single groove, the amount of fuel gas flowing out of the gas storage chamber for drainage increases, while the energy used to drive the projectile decreases, resulting in a decrease in the projectile velocity, that is, the energy distribution effect becomes worse. It can be seen that the area of a single groove has a different influence on the drainage capacity and energy distribution effect of the gas curtain.

3.2. Influence of the Maximum Pressure

Based on Projectile B, the experiments were carried out under the maximum pressure of 13.1 MPa and 18.2 MPa to further understand the effects of the maximum pressure on the gas-curtain drainage and the projectile velocity. Figure 6, Figure 7 and Figure 8 show the sequence diagram of the simulated launching process under different maximum pressures and the variation curves of gas-curtain displacement and projectile velocity with time.
Combined with Figure 3b, the gas-curtain displacement and projectile velocity rise as the maximum pressure increases. In particular, at 20 ms, the gas-curtain displacement under the three injection pressures is 361 mm, 396 mm, and 468 mm, respectively. Compared with the maximum pressure condition of 9.9 MPa, the increase in gas-curtain displacement is 9.7% and 29.6%, respectively. At this time, the projectile velocity is 8.0 m/s, 8.6 m/s, and 8.8 m/s, respectively. Compared with the maximum pressure condition of 9.9 MPa, the increase in the projectile velocity is 7.5% and 10.0%, respectively.
It can be seen that increasing the maximum pressure increases the amount of gas flowing from the gas storage chamber to the projectile front and improves the drainage capacity of the gas curtain. At the same time, increasing the charge also ensures that there is enough gas in the gas storage chamber so as to improve the projectile velocity. It should be noted that increasing the maximum pressure from 13.1 MPa to 18.2 MPa will significantly improve the drainage capacity of the gas curtain, but the increase in the projectile velocity is limited. This is because more gas flows into the projectile front, promoting the growth of the gas-curtain displacement. At the same time, the pressure in front of the projectile increases, which in turn increases the launch resistance.

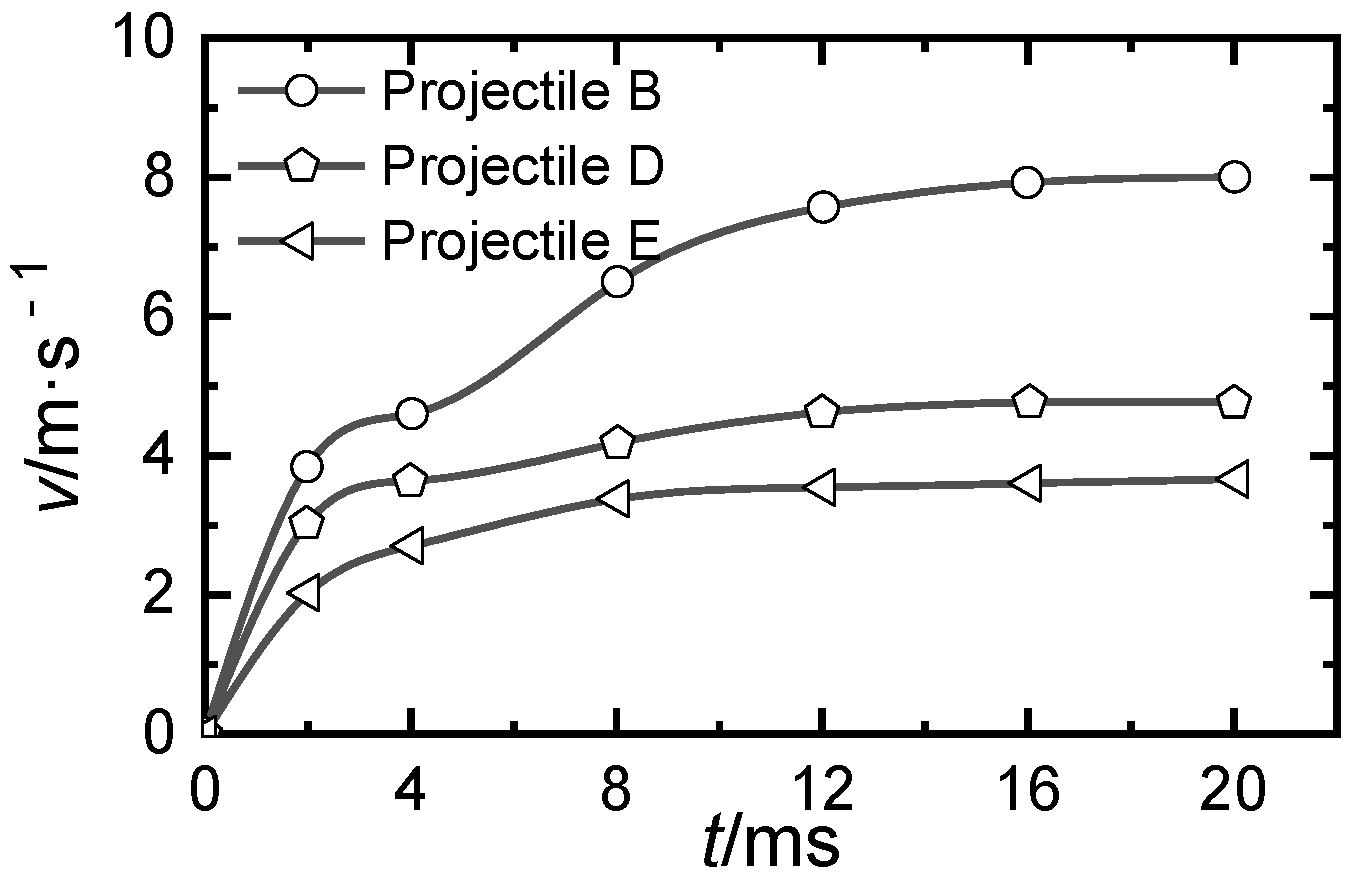
3.3. Influence of the Groove Number

In order to further study the influence of groove number on gas-curtain drainage and projectile velocity, Projectiles B, D, and E in Table 1 were used for experiments. The area of a single groove of the three projectiles is the same, and the groove number is 4, 6, and 8 in turn. Figure 9, Figure 10 and Figure 11 are the sequence diagram of the simulated launching process under different maximum pressures, and the variation curves of gas-curtain displacement and projectile velocity with time, respectively.
Combined with Figure 3b, it is obvious that the gas-curtain displacement increases significantly when the groove number increases from 4 to 6, but only slightly when the groove number increases from 6 to 8. At 20 ms, the gas-curtain displacements are 361 mm, 474 mm, and 491 mm, respectively. When projectile D and E are used, the increase in gas-curtain displacement is 31.3% and 36.0%, respectively, compared with that of projectile B. At this time, the velocities of the three projectiles are 8.0 m/s, 4.8 m/s, and 3.7 m/s, respectively. The velocities of Projectiles D and E are reduced by 40.0% and 53.8%, respectively, compared with those of Projectile B.
It can be seen that increasing the number of grooves within a certain range can significantly improve the gas-curtain drainage capacity, and continuing to increase the number of grooves has little effect on improving the drainage capacity. At the same time, without increasing the gas energy in the gas storage chamber, increasing the number of grooves will greatly reduce the energy distribution effect.

4. Conclusions

Through this experimental study, the influence characteristics of the key parameters of the gas-curtain drainage and the projectile motion characteristics are obtained, which have utmost significance for the design of the underwater injection structure and charge structure. The main conclusions are as follows.
(1)
When the total gas energy is certain, increasing the area of a single groove from 6.25 mm2 to 11.25 mm2, the gas-curtain displacement grows by 47.5%, and the projectile’s speed reduces by 34.1%. Within a certain range of grooves (4 to 8), increasing the groove numbers can improve the drainage capacity by 36.0%. However, the excessive number of grooves not only has little effect on the improvement of the drainage capacity of the gas curtain, but also reduces the energy distribution effect, that is, the vehicle’s speed is reduced by 53.8%.
(2)
Under the same injection structure, increasing the maximum pressure from 9.9 MPa to 18.2 MPa, that is, increasing the total energy of gas, can improve the drainage capacity of the gas curtain by 29.6%. Meanwhile, the energy distribution effect is also improved only by 10.0%. However, as the amount of gas flowing into the projectile front increases, so does the pressure in front of the projectile, which not only promotes the growth of gas-curtain displacement, but also increases the launch resistance. However, as the amount of gas flowing into the projectile front increases, so does the pressure in front of the projectile, promoting not only the growth of gas-curtain displacement but also increasing launch resistance.
(3)
The influence of a single parameter (the area of a single groove, maximum pressure, or groove numbers) on the gas-curtain displacement and projectile velocity is different.

Author Contributions

Conceptualization, X.Z. and Y.Y.; methodology, X.Z. and Y.Y.; formal analysis, X.Z.; investigation, X.Z. and Y.H.; resources, X.Z. and Y.H.; data curation, X.Z.; writing—original draft preparation, X.Z.; writing—review and editing, Y.Y.; supervision, X.Z.; project administration, X.Z.; funding acquisition, X.Z. All authors have read and agreed to the published version of the manuscript.

Funding

This research was funded by the National Key Laboratory Fund (grant number 6142604200309) and the China Postdoctoral Science Foundation (grant number 2020M681596).

Institutional Review Board Statement

Not applicable.

Informed Consent Statement

Not applicable.

Data Availability Statement

The data in this article is true and valid.

Conflicts of Interest

The authors declare no conflict of interest. The funders had no role in the design of the study; in the collection, analyses, or interpretation of data; in the writing of the manuscript; or in the decision to publish the results.

References

  1. Zhou, L.; Yu, Y. Study on interaction characteristics between multi gas jets and water during the underwater launching process. Exp. Therm. Fluid Sci. 2017, 83, 200–206. [Google Scholar] [CrossRef]
  2. Hu, Y.; Yu, Y. Drainage characteristics of circumferential multi-strand wall combustion gas jets in a liquid-filled circular tube. Acta Armamentarii 2020, 41, 2417–2423. [Google Scholar]
  3. Gong, Z.; Lu, C.; Li, J. The gas jet behavior in submerged Laval nozzle flow. J. Hydrodyn. 2017, 29, 1035–1043. [Google Scholar] [CrossRef]
  4. Kang, H.; Baek, S.; Ahn, B. Conceptual design of high-speed underwater jet engine using high concentration of hydrogen peroxide. Ocean Eng. 2018, 153, 193–200. [Google Scholar] [CrossRef]
  5. Degtiar, V.G.; Pegov, V.I.; Moshkin, I.Y. Mathematical modeling of the processes of heat and mass transfer of hot gas jets with fluid during underwater rocket launches. High Temp. 2019, 57, 707–711. [Google Scholar] [CrossRef]
  6. Zhang, X.; Li, S.; Yang, B. Flow structures of over-expanded supersonic gaseous jets for deep-water propulsion. Ocean Eng. 2020, 213, 107611. [Google Scholar] [CrossRef]
  7. Xiang, M.; Zhao, X.; Zhou, H. Transient dynamic analysis for the submerged gas jet in flowing water. Eur. J. Mech. B/Fluids 2021, 85, 351–360. [Google Scholar] [CrossRef]
  8. Yu, X.; Wang, Y.; Huang, C. Unsteady characteristics of ventilated cloud cavity around symmetrical bodies. J. Ship Mech. 2014, 18, 499–506. [Google Scholar]
  9. Zou, W.; Liu, H.; Xue, L. Three-dimensional ventilated supercavity on a maneuvering trajectory. Ocean Eng. 2016, 122, 97–104. [Google Scholar] [CrossRef]
  10. Wang, Z.; Huang, B.; Zhang, M. Experimental and numerical investigation of ventilated cavitating flow structures with special emphasis on vortex shedding dynamics. Int. J. Multiph. Flow 2017, 98, 79–95. [Google Scholar] [CrossRef]
  11. Xu, H.; Luo, K.; Dang, J. Numerical investigation of supercavity geometry and gas leakage behavior for the ventilated supercavities with the twin-vortex and the re-entrant jet modes. Int. J. Nav. Archit. Ocean Eng. 2021, 13, 628–640. [Google Scholar] [CrossRef]
  12. Shao, S.; Li, J.; Yoon, K. Probing into gas leakage characteristics of ventilated supercavity through bubbly wake measurement. Ocean Eng. 2022, 245, 110457. [Google Scholar] [CrossRef]
  13. Weiland, C.J.; Vlachos, P.P.; Yagla, J.J. Concept analysis and laboratory observations on a water piercing missile launcher. Ocean Eng. 2010, 37, 959–965. [Google Scholar] [CrossRef]
  14. Cao, W.; Liu, H.; Wang, C. The effect of gas jet speed on the motion process of the underwater vehicle vertical launching by using gas curtain. Eng. Mech. 2013, 30, 288–292. [Google Scholar]
  15. Wang, Y.; Yuan, X.; Zhang, Y. On the effect of bubble elasticity to sub-launch process using concentric canister launcher. Chin. J. Comput. Mech. 2013, 30, 313–318. [Google Scholar]
  16. Li, T.; Hu, J.; Cao, X. Pinch-off process of underwater annular-nozzled gas jet. CIESC J. 2017, 68, 4565–4575. [Google Scholar]
Figure 1. Visual simulated experiment system.
Jmse 10 01239 g001
Figure 2. Projectiles: (a) structural diagram; (b) physical map.
Jmse 10 01239 g002
Figure 3. Sequence diagram of simulated launching process (pmax = 9.9 MPa).
Jmse 10 01239 g003
Figure 4. Gas-curtain displacement (pmax = 9.9 MPa).
Jmse 10 01239 g004
Figure 5. Projectile velocity (pmax = 9.9 MPa).
Jmse 10 01239 g005
Figure 6. Sequence diagram of simulated launching process under different maximum pressures (Projectile B, n = 4).
Jmse 10 01239 g006
Figure 7. Gas-curtain displacement under different maximum pressures.
Jmse 10 01239 g007
Figure 8. Projectile velocity under different maximum pressures.
Jmse 10 01239 g008
Figure 9. Sequence diagram of simulated launching process under different groove numbers (pmax = 9.9 MPa).
Jmse 10 01239 g009
Figure 10. Gas-curtain displacement under different groove numbers.
Jmse 10 01239 g010
Figure 11. Projectile velocity under different groove numbers.
Jmse 10 01239 g011
Table 1. Structural parameters of the projectiles.
Typesw/mmh/mms/mm2n
A2.52.56.254
B3.52.58.754
C4.52.511.254
D3.52.58.756
E3.52.58.758
Note: w is the width of the groove, h is the height of the groove, s is the area of a single groove, and n is the number of grooves.
Publisher’s Note: MDPI stays neutral with regard to jurisdictional claims in published maps and institutional affiliations.

