Abstract
Defining the appropriate functional requirements in the early ship design stage is important in order that costs that are caused by the over- or under-specified functional capabilities do not increase. This paper presents a K-means clustering algorithm for the determination of functional requirements. It uses automatic identification system (AIS) data from a reference ship to determine the representative operational profiles, which can support decision-makers in defining the functional requirements of ships that will be performing similar missions as those of the reference ship. In a case study, we used this method as part of a ship design project, in which the functional requirements of a battery-only electric ship are defined using AIS data from a reference ship. Results indicate that the cost can be reduced by determining the functional requirements using the proposed method.
1. Introduction
The automatic identification system (AIS) is used for maritime navigation such as traffic management, collision avoidance, and coastal surveillance for ships. There is a large amount of research on the application of AIS data. Xiao et al. [1] analyzed the spatial distribution, route, average speed, and traffic density of ships using AIS data. Mou et al. [2] used AIS data for collision avoidance. Tsou et al. [3] processed AIS data through a data warehouse. Breithaupt et al. [4] delineated maritime routes using AIS data. Dobrkovic et al. [5] predicted a maritime vessel’s destination and arrival time from AIS data using a genetic algorithm. Mazzarella et al. [6] predicted a ship’s position based on knowledge using AIS data. Ristic et al. [7] analyzed vessel motion patterns in the ports and waterways using AIS data. Kim et al. [8] conducted an energy efficiency operational indicator estimation study using AIS data. Rong et al. [9] presented an AIS data-based data mining approach for the probabilistic characterization of maritime traffic and automatic anomaly detection. Silveira et al. [10] proposed a maritime risk model using AIS data. Murray and Perera [11] proposed an autoencoder approach, which is a machine learning technique, on AIS data for vessel trajectory prediction. Although studies using AIS data are being actively developed, it is difficult to find studies using AIS data to determine the functional requirements of ship.
When the designer does not know the appropriate functional requirements, economic losses can occur. For example, if a ship is built having bigger gross tonnage (GT) than market needs, economic losses can occur because of the increased acquisition and operating costs that are caused by the extra space. The extra space requires an increase in the amount of hull material required for shipbuilding, which leads to an increase in acquisition cost. Moreover, because the effective horsepower (EHP) is relatively reduced due to the extra space, fuel consumption increases in operation, which leads to an increase in operating cost. Therefore, if the functional requirements such as the GT and ship’s speed are not designed for the operation purpose, it can induce economic losses.
Additionally, the interest in low- or zero- emission energy for ships such as liquefied natural gas, hydrogen, ammonia, or batteries is increasing to reduce greenhouse gas emissions in response to the environmental regulations of the International Maritime Organization (IMO). For example, research on sustainable ships that use renewable energy is being actively conducted. Reusser and Osses [12] described propulsion systems, alternative fuels, and technical challenges for ocean-going zero-emission ships. Kyunghwa et al. [13] proposed four propulsion systems using carbon-free ammonia as fuel. Hansen and Wendt [14] presented an overview of commercial electric propulsion ships, from the history of commercial electric propulsion ships over 100 years ago to the latest technology. Sulligoi et al. [15] provided an overview of all-electric ship design components for shipboard power systems. Shakeri et al. [16] reviewed technologies that use hydrogen fuel cells as the main source of power for zero-emission ship propulsion. However, compared with fossil fuels, the lower energy density of sustainable energies often results in the increased size and higher costs of these ships, and this makes the transition to sustainable energies less attractive economically. To make the transition possible, it is important to determine appropriate functional requirements.
This paper presents a data-driven method that uses a K-means clustering algorithm to determine the appropriate functional requirements of ships in the initial design stage. Previous design projects for small ships, such as patrol ships and fishing boats, tend to omit the analysis of functional requirements. Instead, they have adopted the functional requirements of similar ships without considering scientific analysis. In addition, fossil fuel ships that have reached the end of their lifespan have been replaced by green ships in recent years. In this context, it is necessary to develop analysis methods, for determining the appropriate functional requirements that allow for more affordable transition to transition to zero-emission ships. The proposed method uses AIS data from a reference ship that has performed missions that are similar to those that the newly built ships would perform in the future. Through clustering of AIS data, representative operational profiles are created and analyzed to determine functional requirements. The appropriate functional requirements allow for the right design for the purpose of the ship, which can lead to cost reduction. Previous studies have used AIS data primarily for marine traffic analysis and collision avoidance. However, to the best of our knowledge, there is no research that uses AIS data for the determination of functional requirements. Therefore, the key contribution of this paper is on using AIS data to analyze appropriate functional requirements in ship design problems.
The data description and preprocessing are detailed in Section 2. The K-means clustering algorithm is described in Section 3. In Section 4, the proposed method was implemented in a case study in which the functional requirements of a battery-only electric ship were defined using the AIS data from a reference ship. This paper concludes with future research that is described in Section 5.
2. Data Preparation
AIS data is comprised of static, dynamic, and voyage-related information. Table 1 [17] shows examples of the information contained in the AIS data.

Table 1.
Examples of information contained in the AIS data [17].
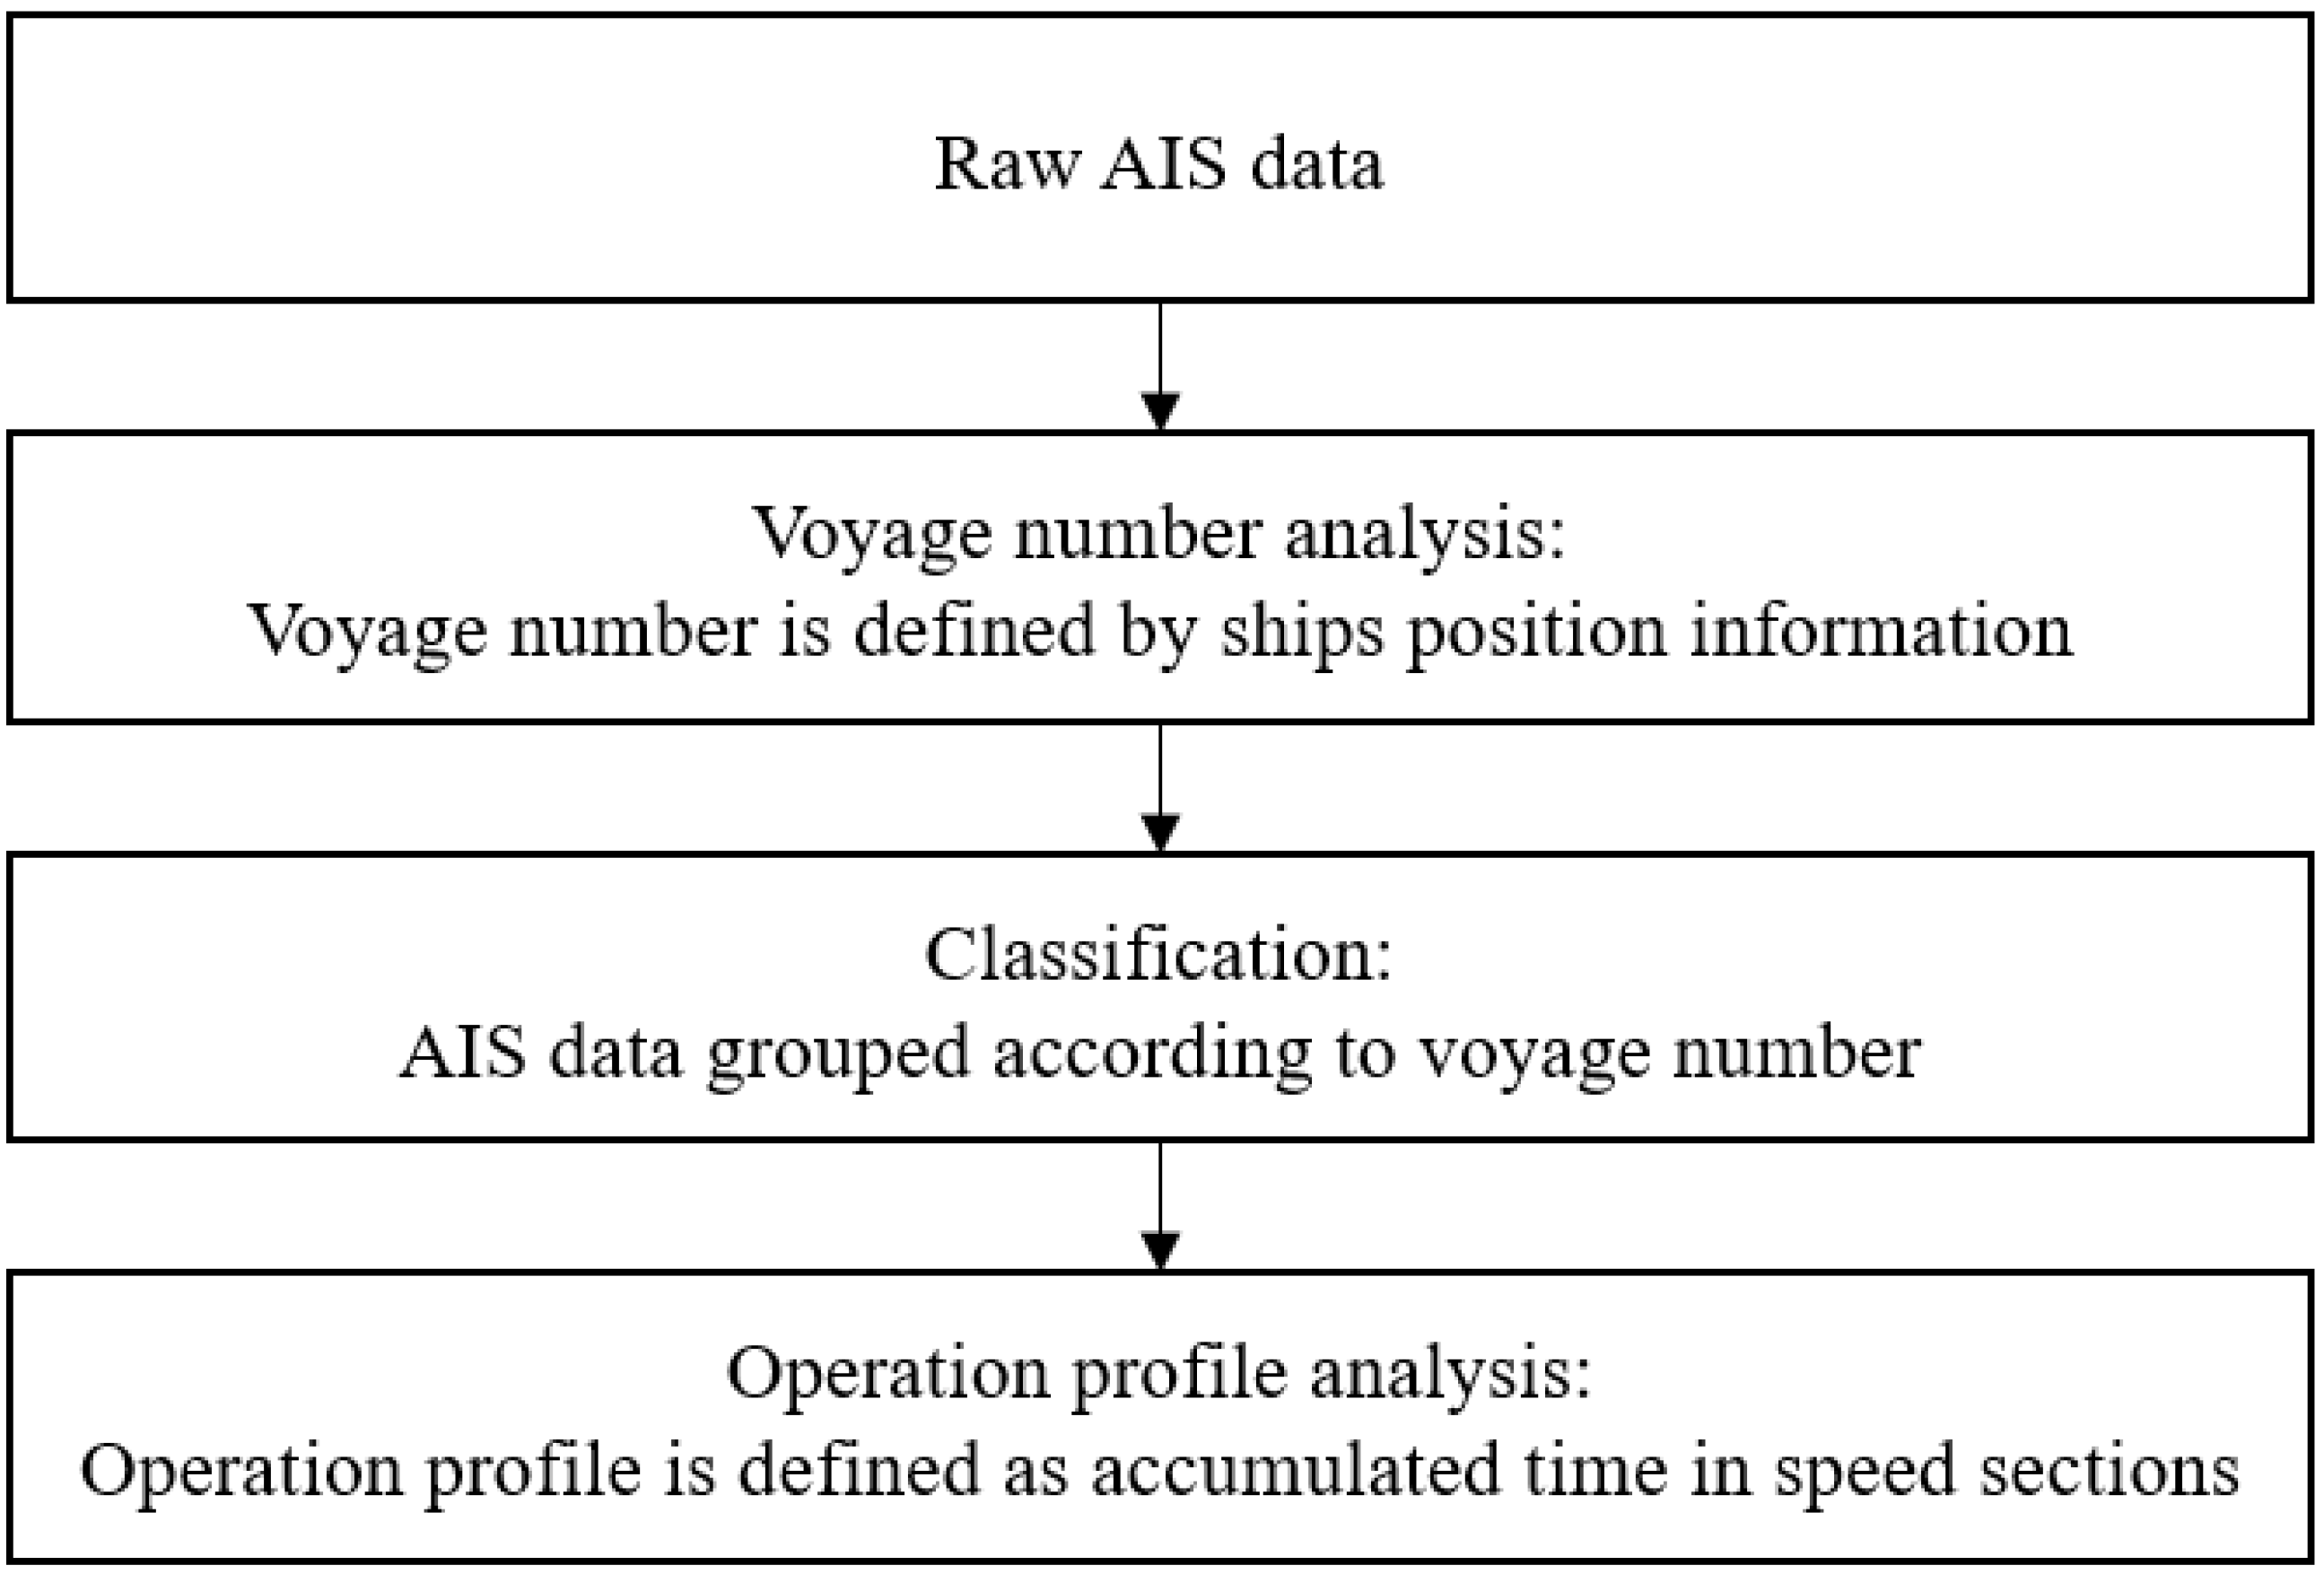
For this method, the AIS data need to be preprocessed, which is comprised of the following three stages: (1) voyage number analysis; (2) classification; and (3) operational profile analysis. Figure 1 shows the flowchart of the data preprocessing.
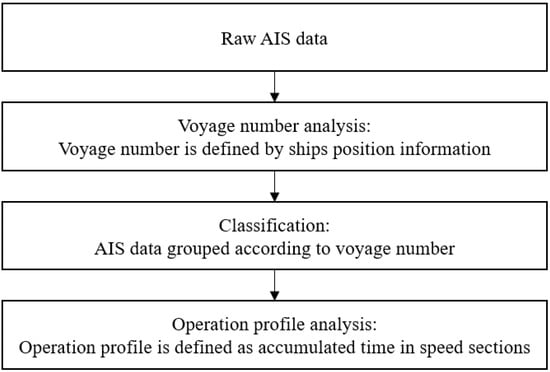
Figure 1.
Flowchart of data preprocessing.
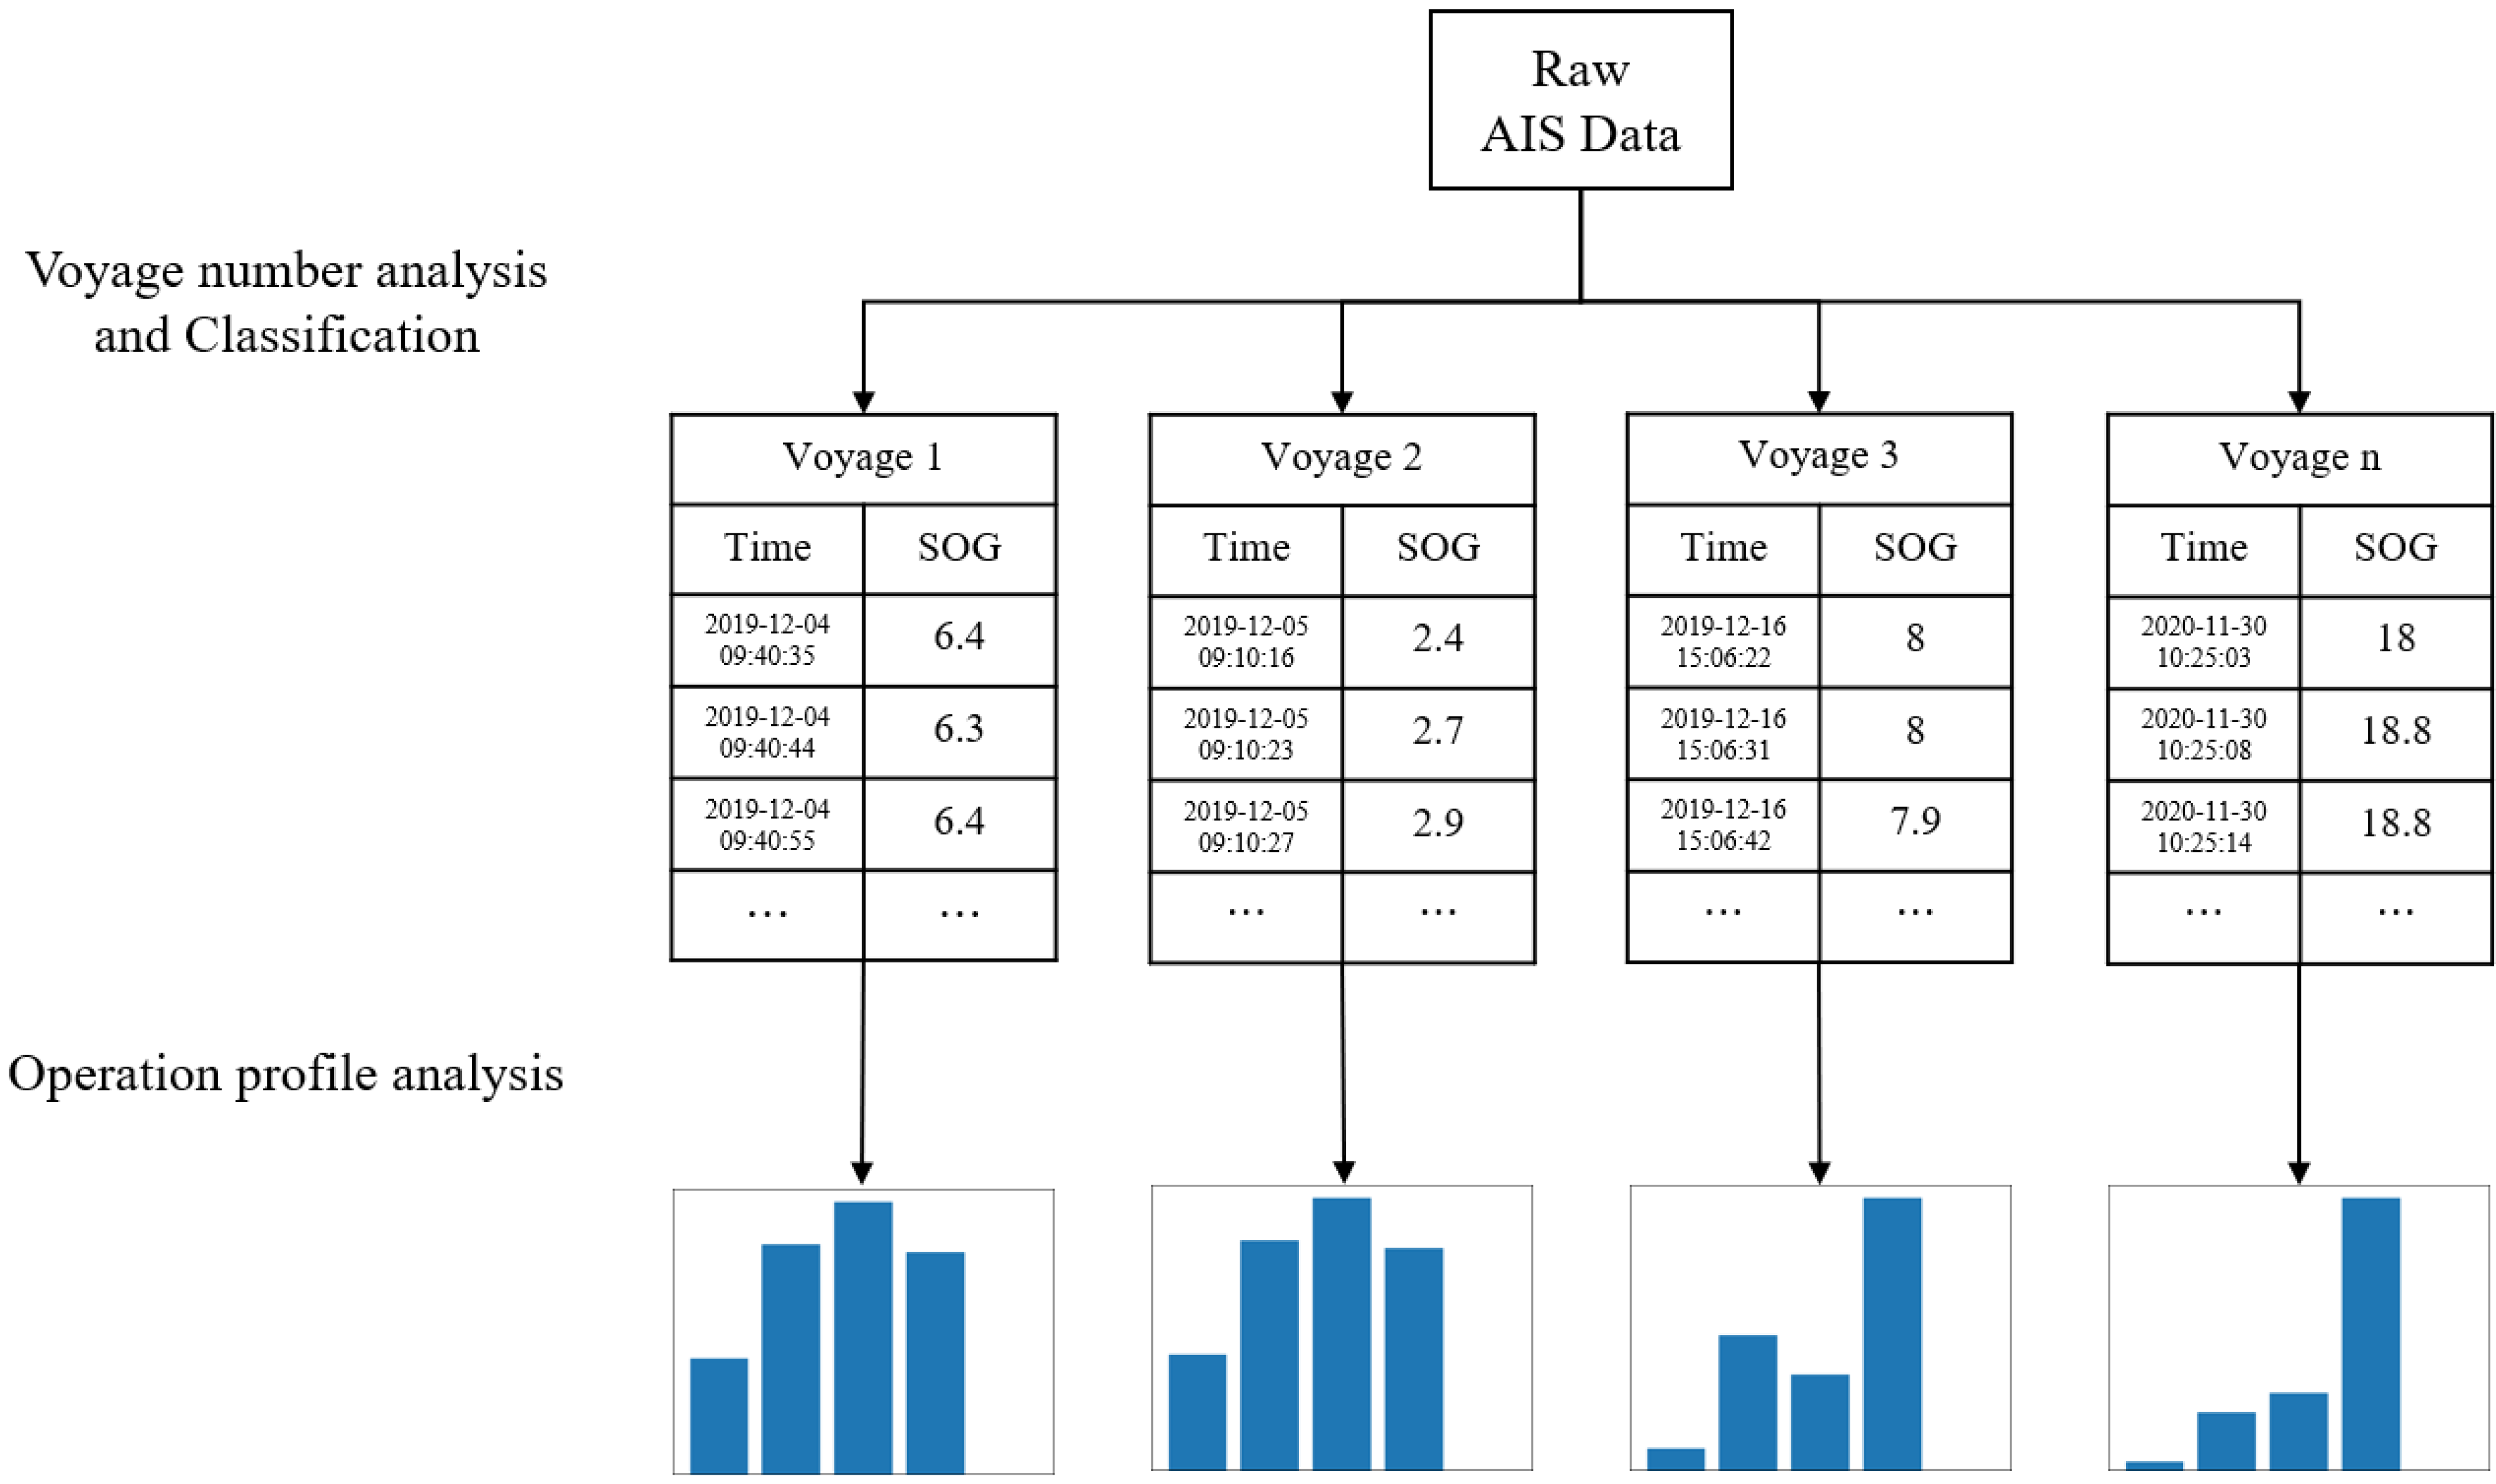
First of all, outliers that are far outside the normal range are filtered based on latitude, longitude, or SOG values in the AIS data. In the voyage number analysis, it is assumed that there is a single home port. The location of the home port is determined by analyzing the ship’s position information consisting of latitude and longitude. Sequential data during travel between the ship’s leaving and return have the same voyage number. For classification, the AIS data are grouped according to the voyage number. In addition, information excluding the time and SOG is filtered. In the operational profile analysis, operational profiles are determined using the accumulated time in speed sections, in which the number of speed sections and the unit of accumulated time, such as hours or minutes, can vary depending on the AIS data. Figure 2 shows the preprocessing procedures. Each graph indicates the voyage data.
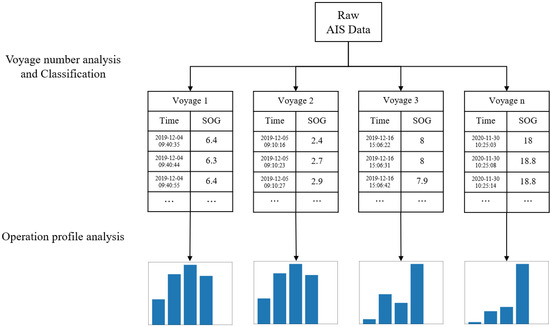
Figure 2.
The data preprocessing procedure.
Figure 3 describes an example of the results after preprocessing. The horizontal and vertical axes indicate the discrete speed section and accumulated time, respectively.
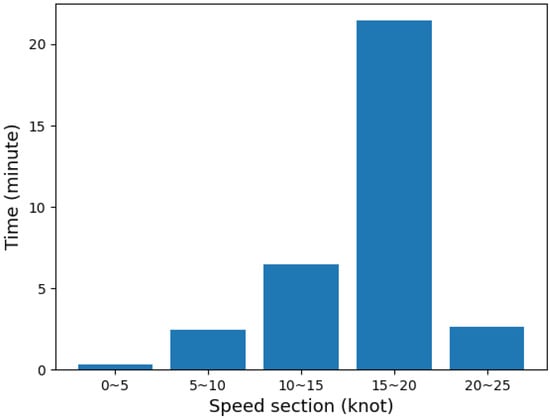
Figure 3.
An example of preprocessed data.
3. K-Means Clustering Algorithm
The K-means clustering algorithm [18] is an unsupervised learning algorithm for clustering data. The K-means clustering algorithm is used in a variety of fields such as image analysis, pattern recognition, data mining, and bioinformatics. The K-means clustering algorithm can also be applied to a ship’s operation. For example, Zheng et al. [19] used a K-means clustering algorithm to analyze the characteristics of vessel traffic flow data. Affandi and Sunarmo [20] used a K-means clustering algorithm to define spatial fishing vessel activities. Mieczynska et al. [21] eliminated the impact of AIS packet collision and removed outliers using a K-means clustering algorithm. Gan et al. [22] predicted ship trajectories using a hybrid method that uses a K-means clustering algorithm and artificial neural network. Liu et al. [23] also proposed a K-means clustering algorithm and noise algorithm for the probabilistic characterization of ship traffic and anomaly detection.
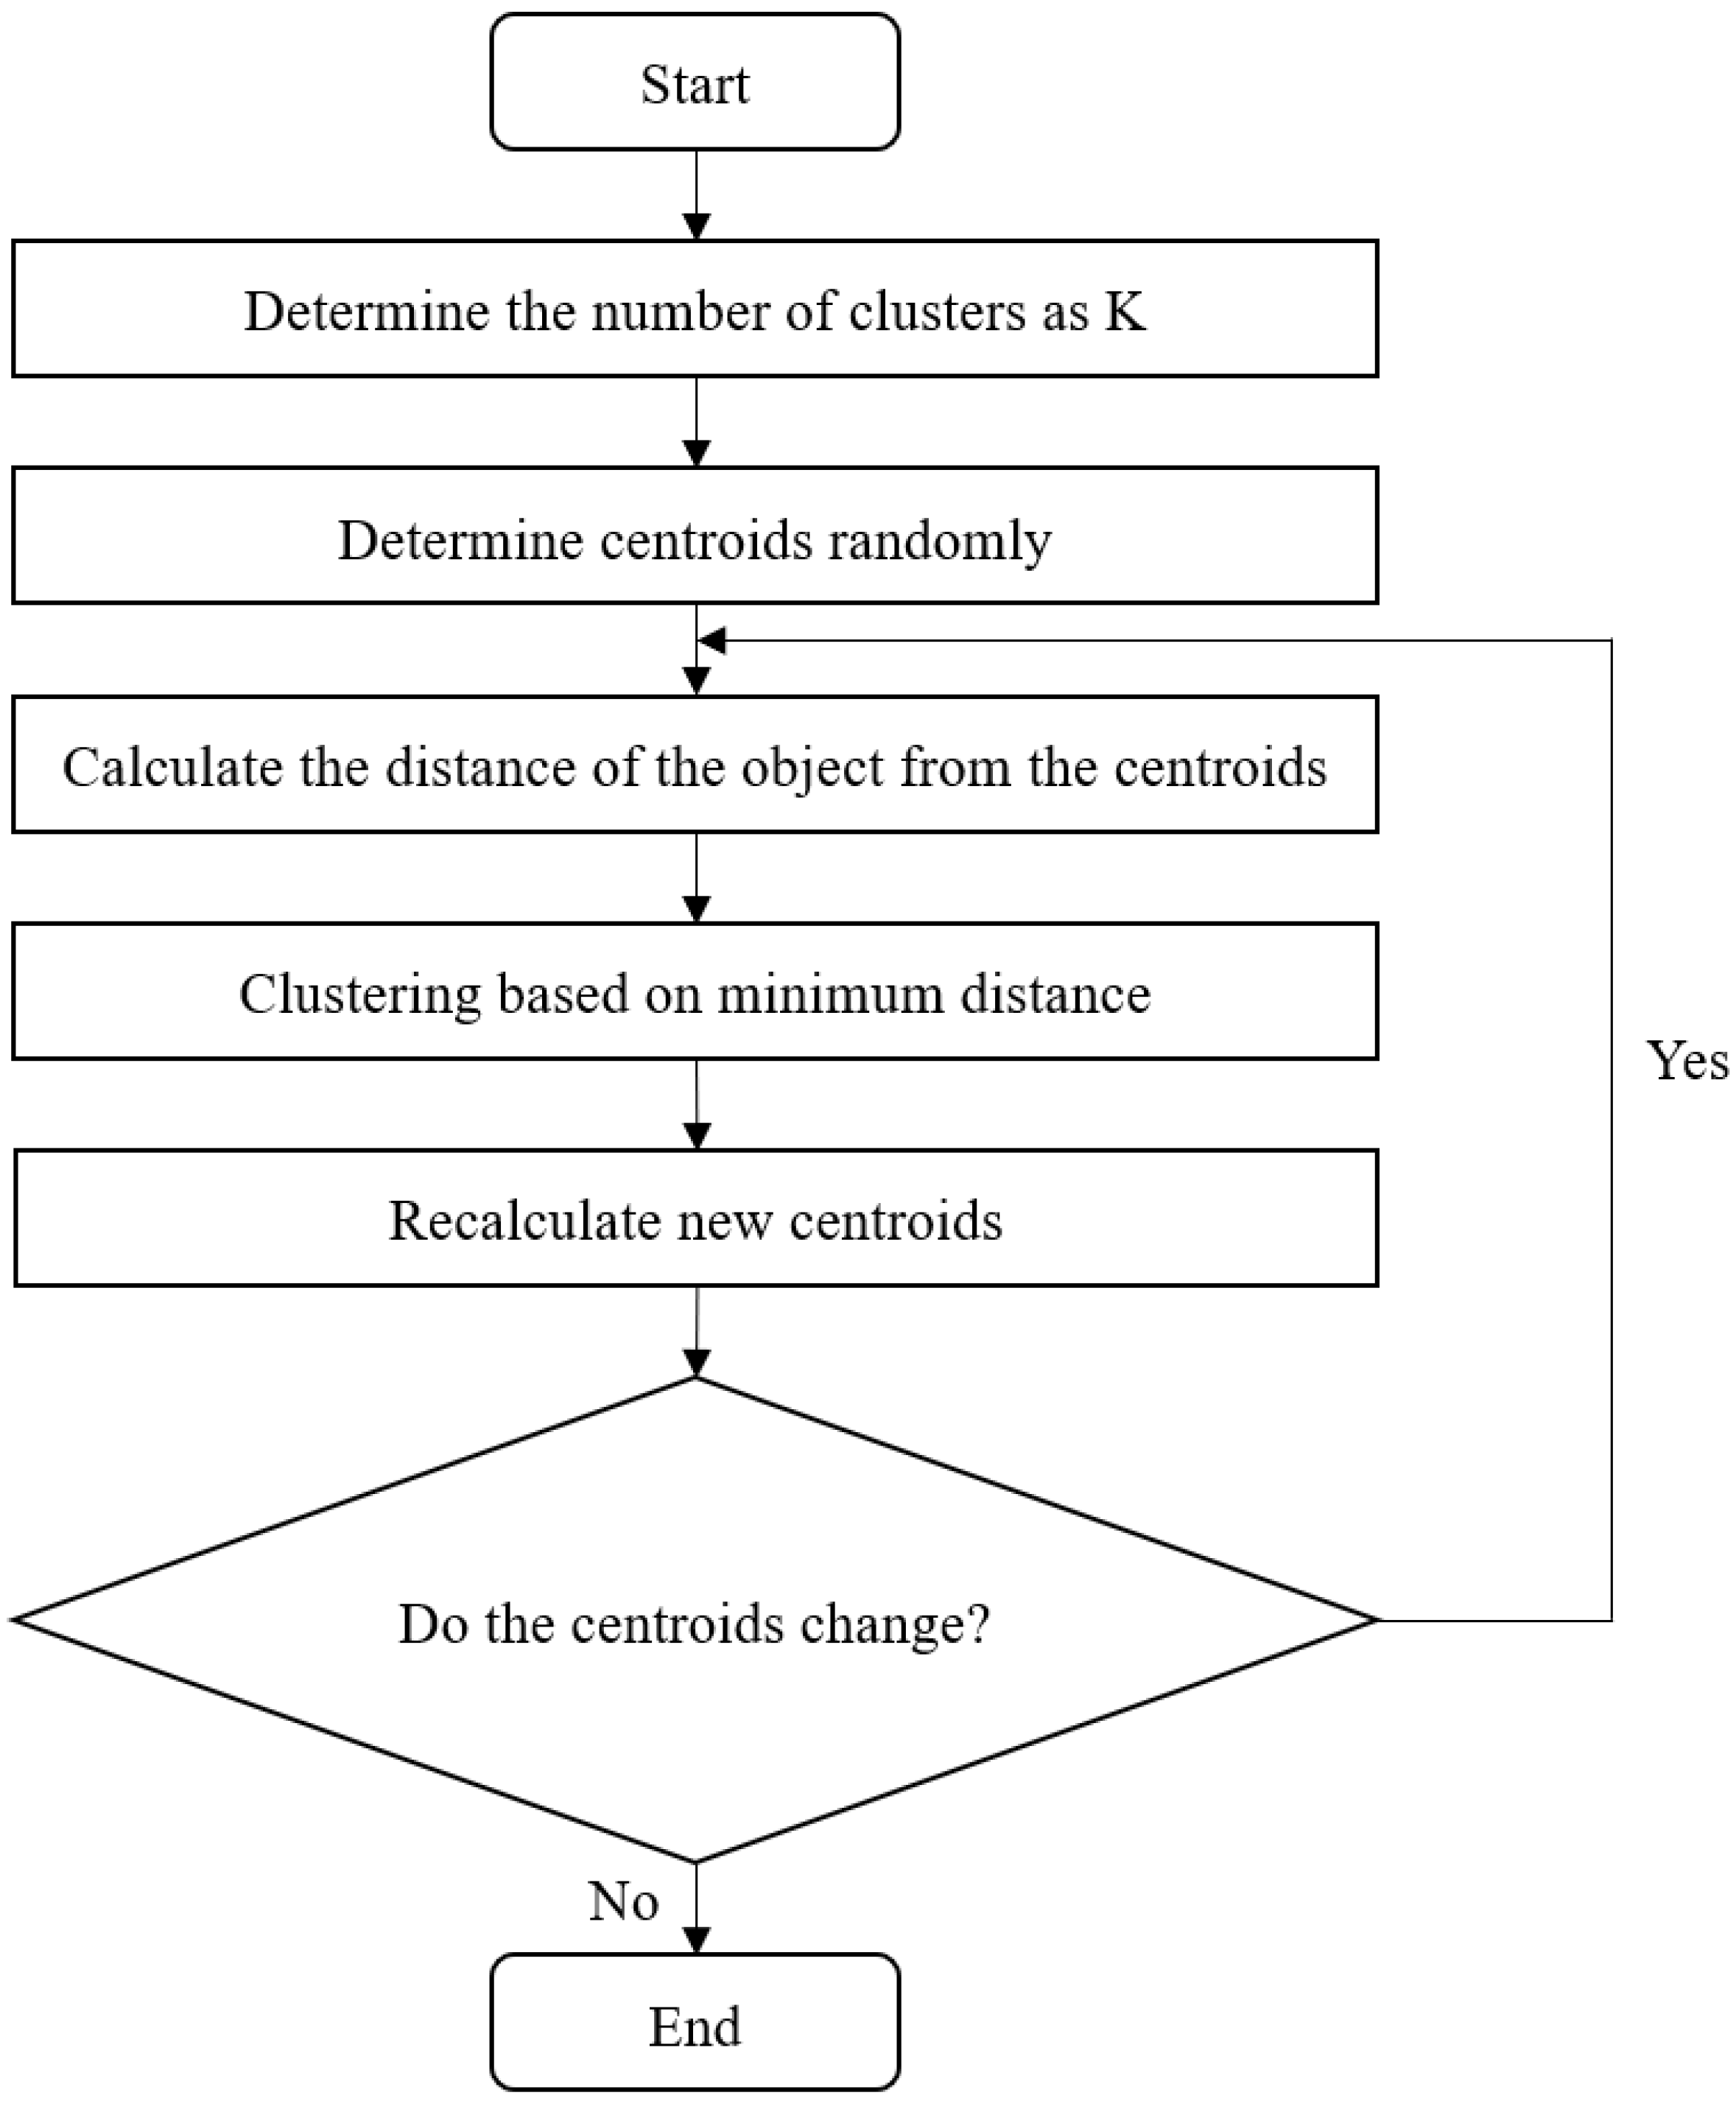
The K-means clustering algorithm procedure is comprised of six stages. The first stage determines the number of clusters, K. The selection of the K value significantly affects the result of the algorithm, and thus, there have been many studies on K value selection. Pham et al. [24] proposed a heuristic for K value selection. Yuan et al. [25] compared K value selection algorithms to each other, such as the elbow method, gap statistic, silhouette coefficient, and canopy. Kodinariya et al. [26] presented six approaches for determining the number of clusters. The second stage randomly determines the centroids. The third stage calculates the distance between data points and the centroids. For calculation, the Euclidean distance is often used, which is defined by Equation (1).
where
—is the Euclidean distance between data point and the centroid ;
—is the number of dimensions;
—is the coordinate in dimension of data point ; and
—is the coordinate in dimension of centroid .
The fourth stage creates clusters to make the data points match with the minimum centroid distance. The fifth stage recalculates the centroids using Equation (2).
where
—is the coordinate in dimension of data point ;
—is the centroid in dimension of cluster ; and
—is the number of data points in cluster .
Finally, if the centroid has been changed, the algorithm returns to the third stage and repeats the process, otherwise the algorithm is terminated. Figure 4 describes the six stages of the K-means clustering algorithm.
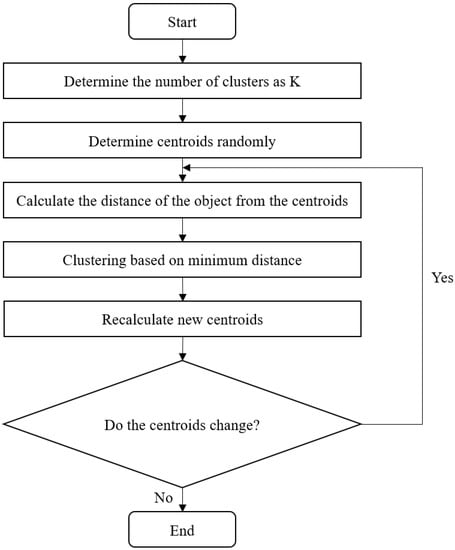
Figure 4.
Flowchart of the K-means clustering algorithm.
4. Case Study
4.1. Description of the Case
There is a design project for the development of a new public ship. This would replace a currently operating ship that would retire in a few years. The mission of the operating ship is to patrol a given area based on a single home port. The operational profiles of the operating ship are used to determine the functional requirements of the new ship. The new ship requires the functional capabilities to perform the missions that are defined by the operational profiles.
The operating ship has two diesel engines for propulsion. However, because of the IMO regulations to reduce the emission of greenhouse gasses, it would be ideal to replace the conventional power system in the operating ship with a battery-only propulsion system. The GT of the operating ship is about 40 t. Table 2 shows the principal dimensions of the operating ship.
Table 2.
Principal dimensions of a patrol ship.
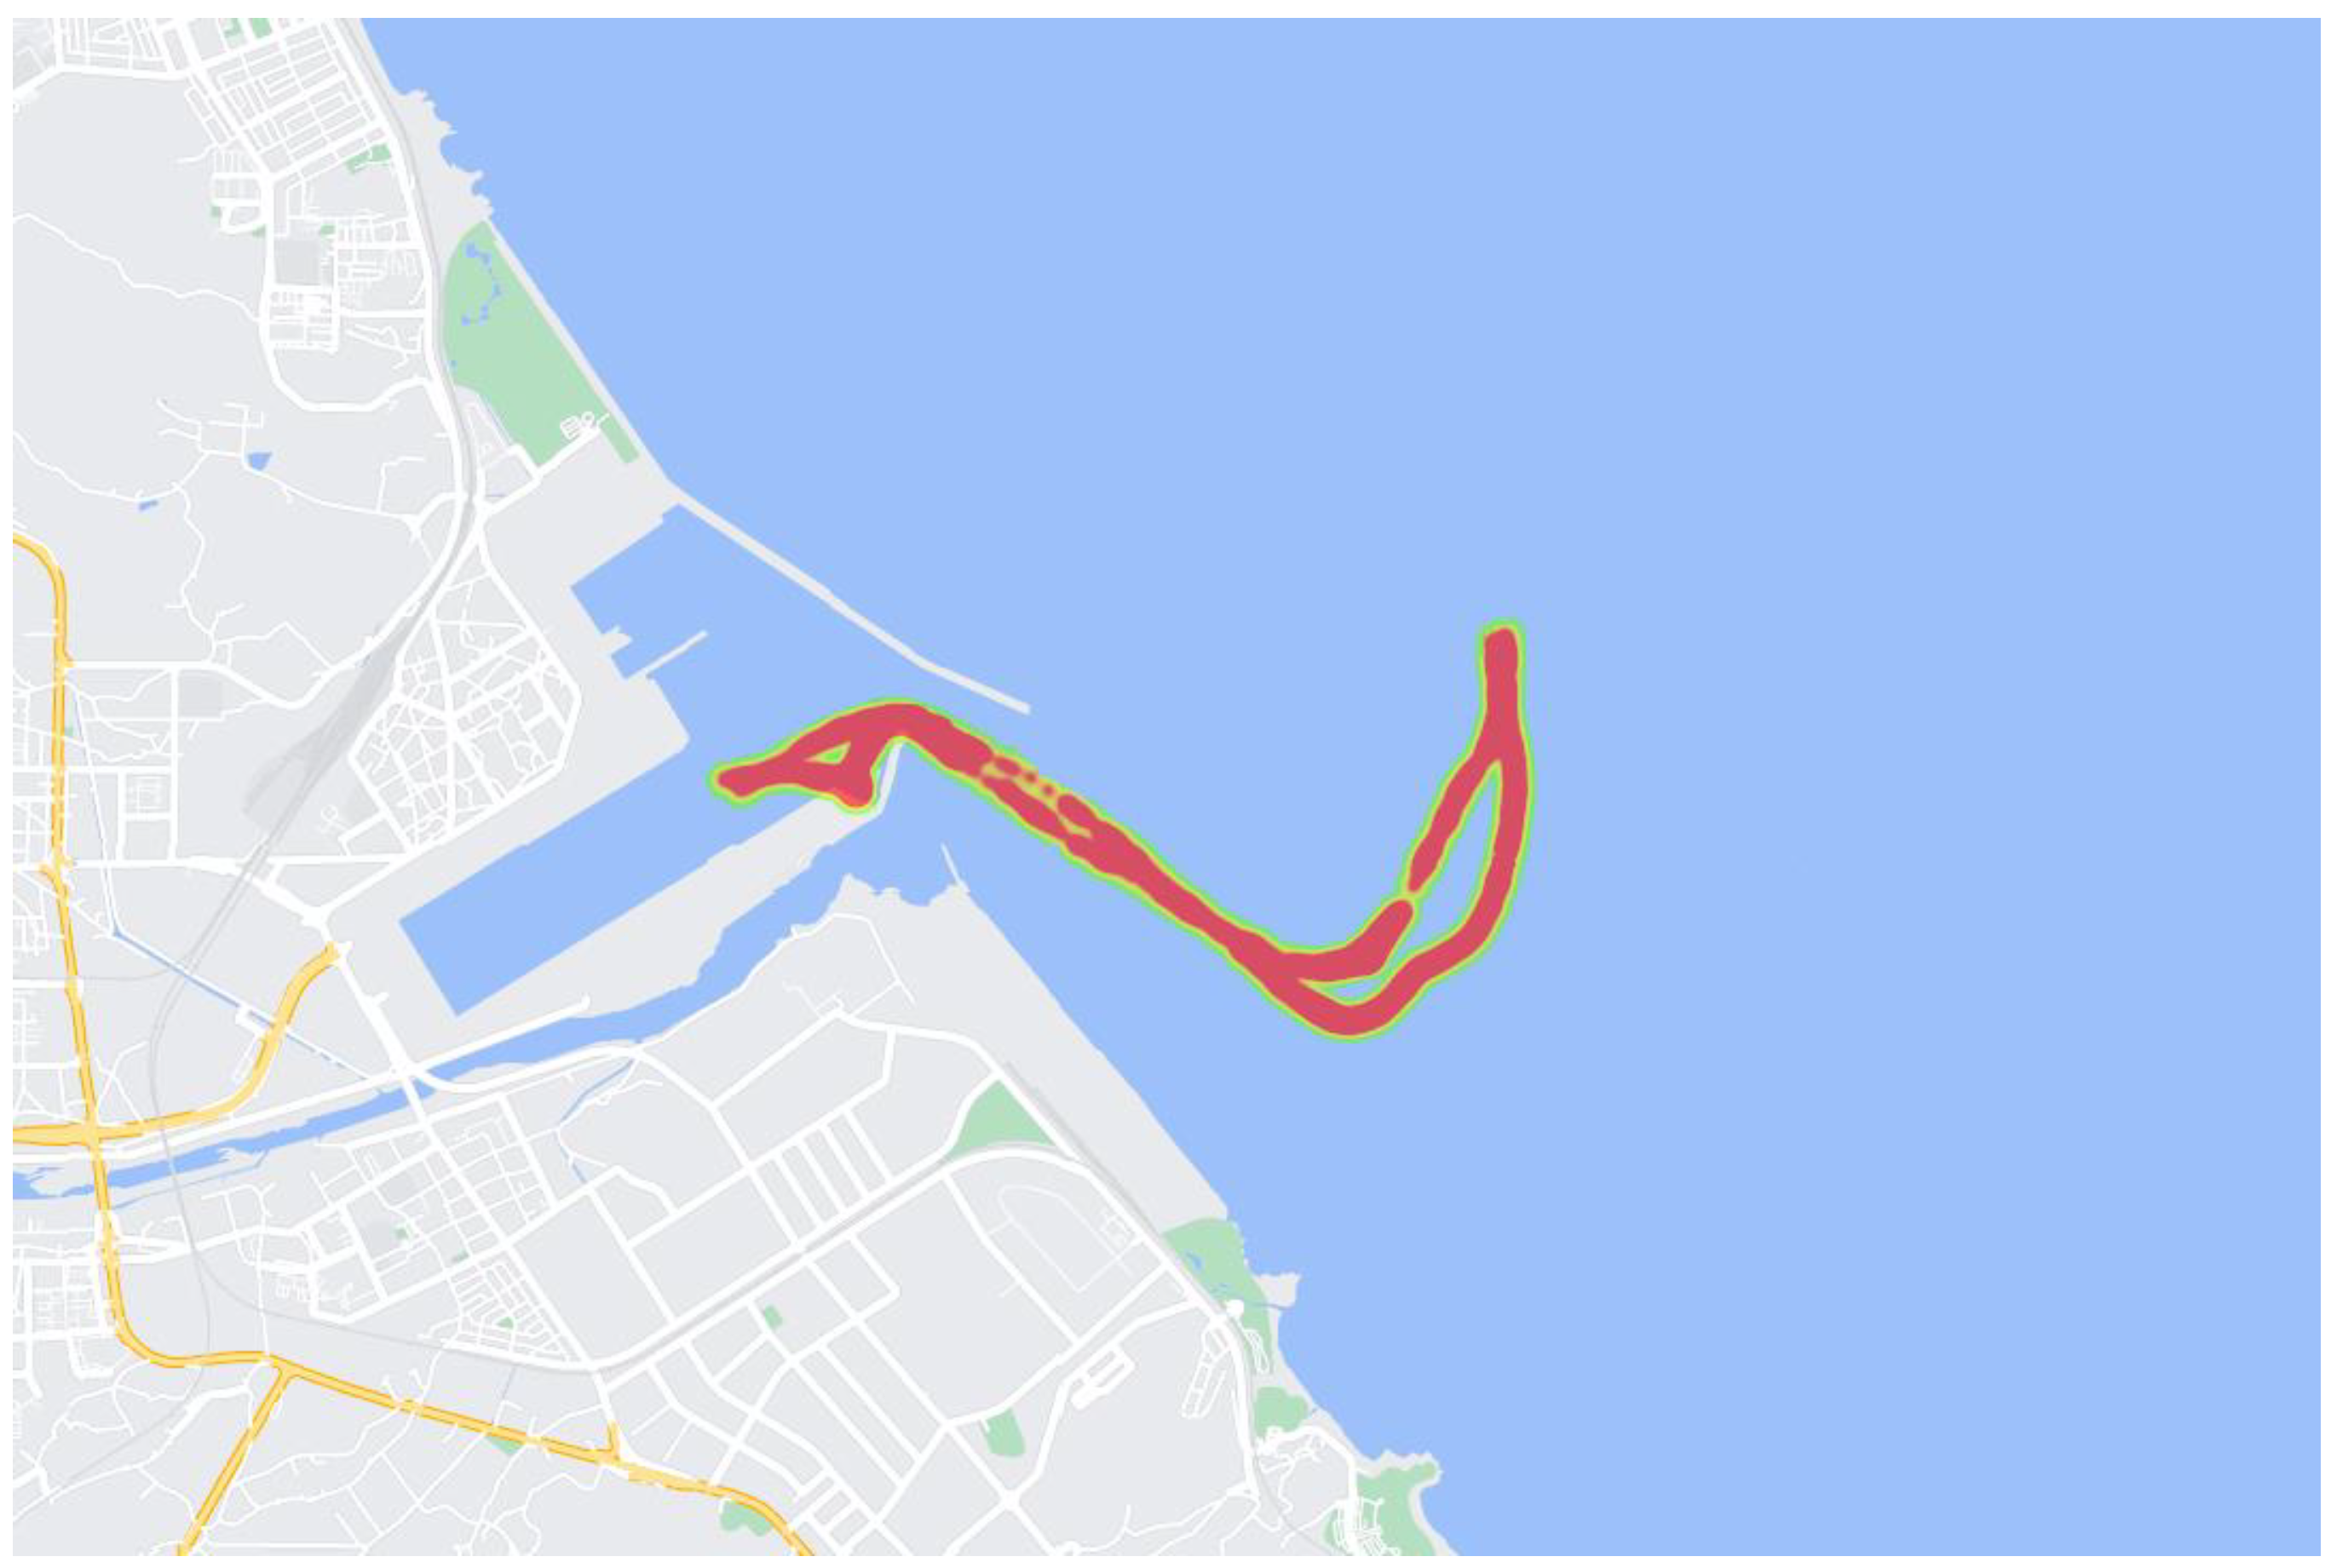
The representative operational profile analysis used the AIS data. The observation period was from 1 December 2019 to 30 November 2020. There were 55,578 data points, and the maximum speed was 23.4 knots during this period. The average operating time per voyage was about 41 min, the average operating distance was 16.5 km, and the average operating speed was 11.7 knots. The time intervals between sequential AIS data were approximately 2–12 s. As described in Section 3, data preprocessing categorized the AIS data into sets, which includes the data from the same voyage. In this case, there were 202 voyages with five speed sections. Because the patrol ship operated along the coast, the operating time for each voyage was relatively short. Figure 5 shows an example of the trajectory of an operating ship voyage, where the trajectory is represented by the red dots.
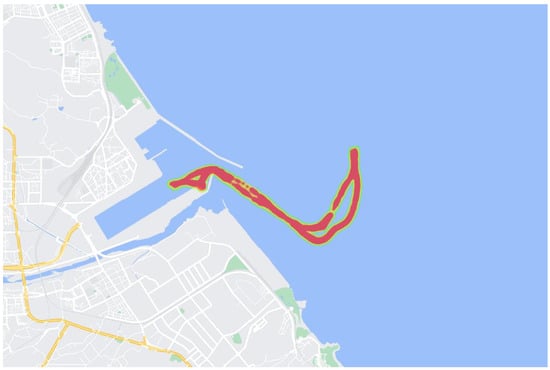
Figure 5.
An example of the trajectory of a voyage.
4.2. Application of the K-Means Clustering Algorithm
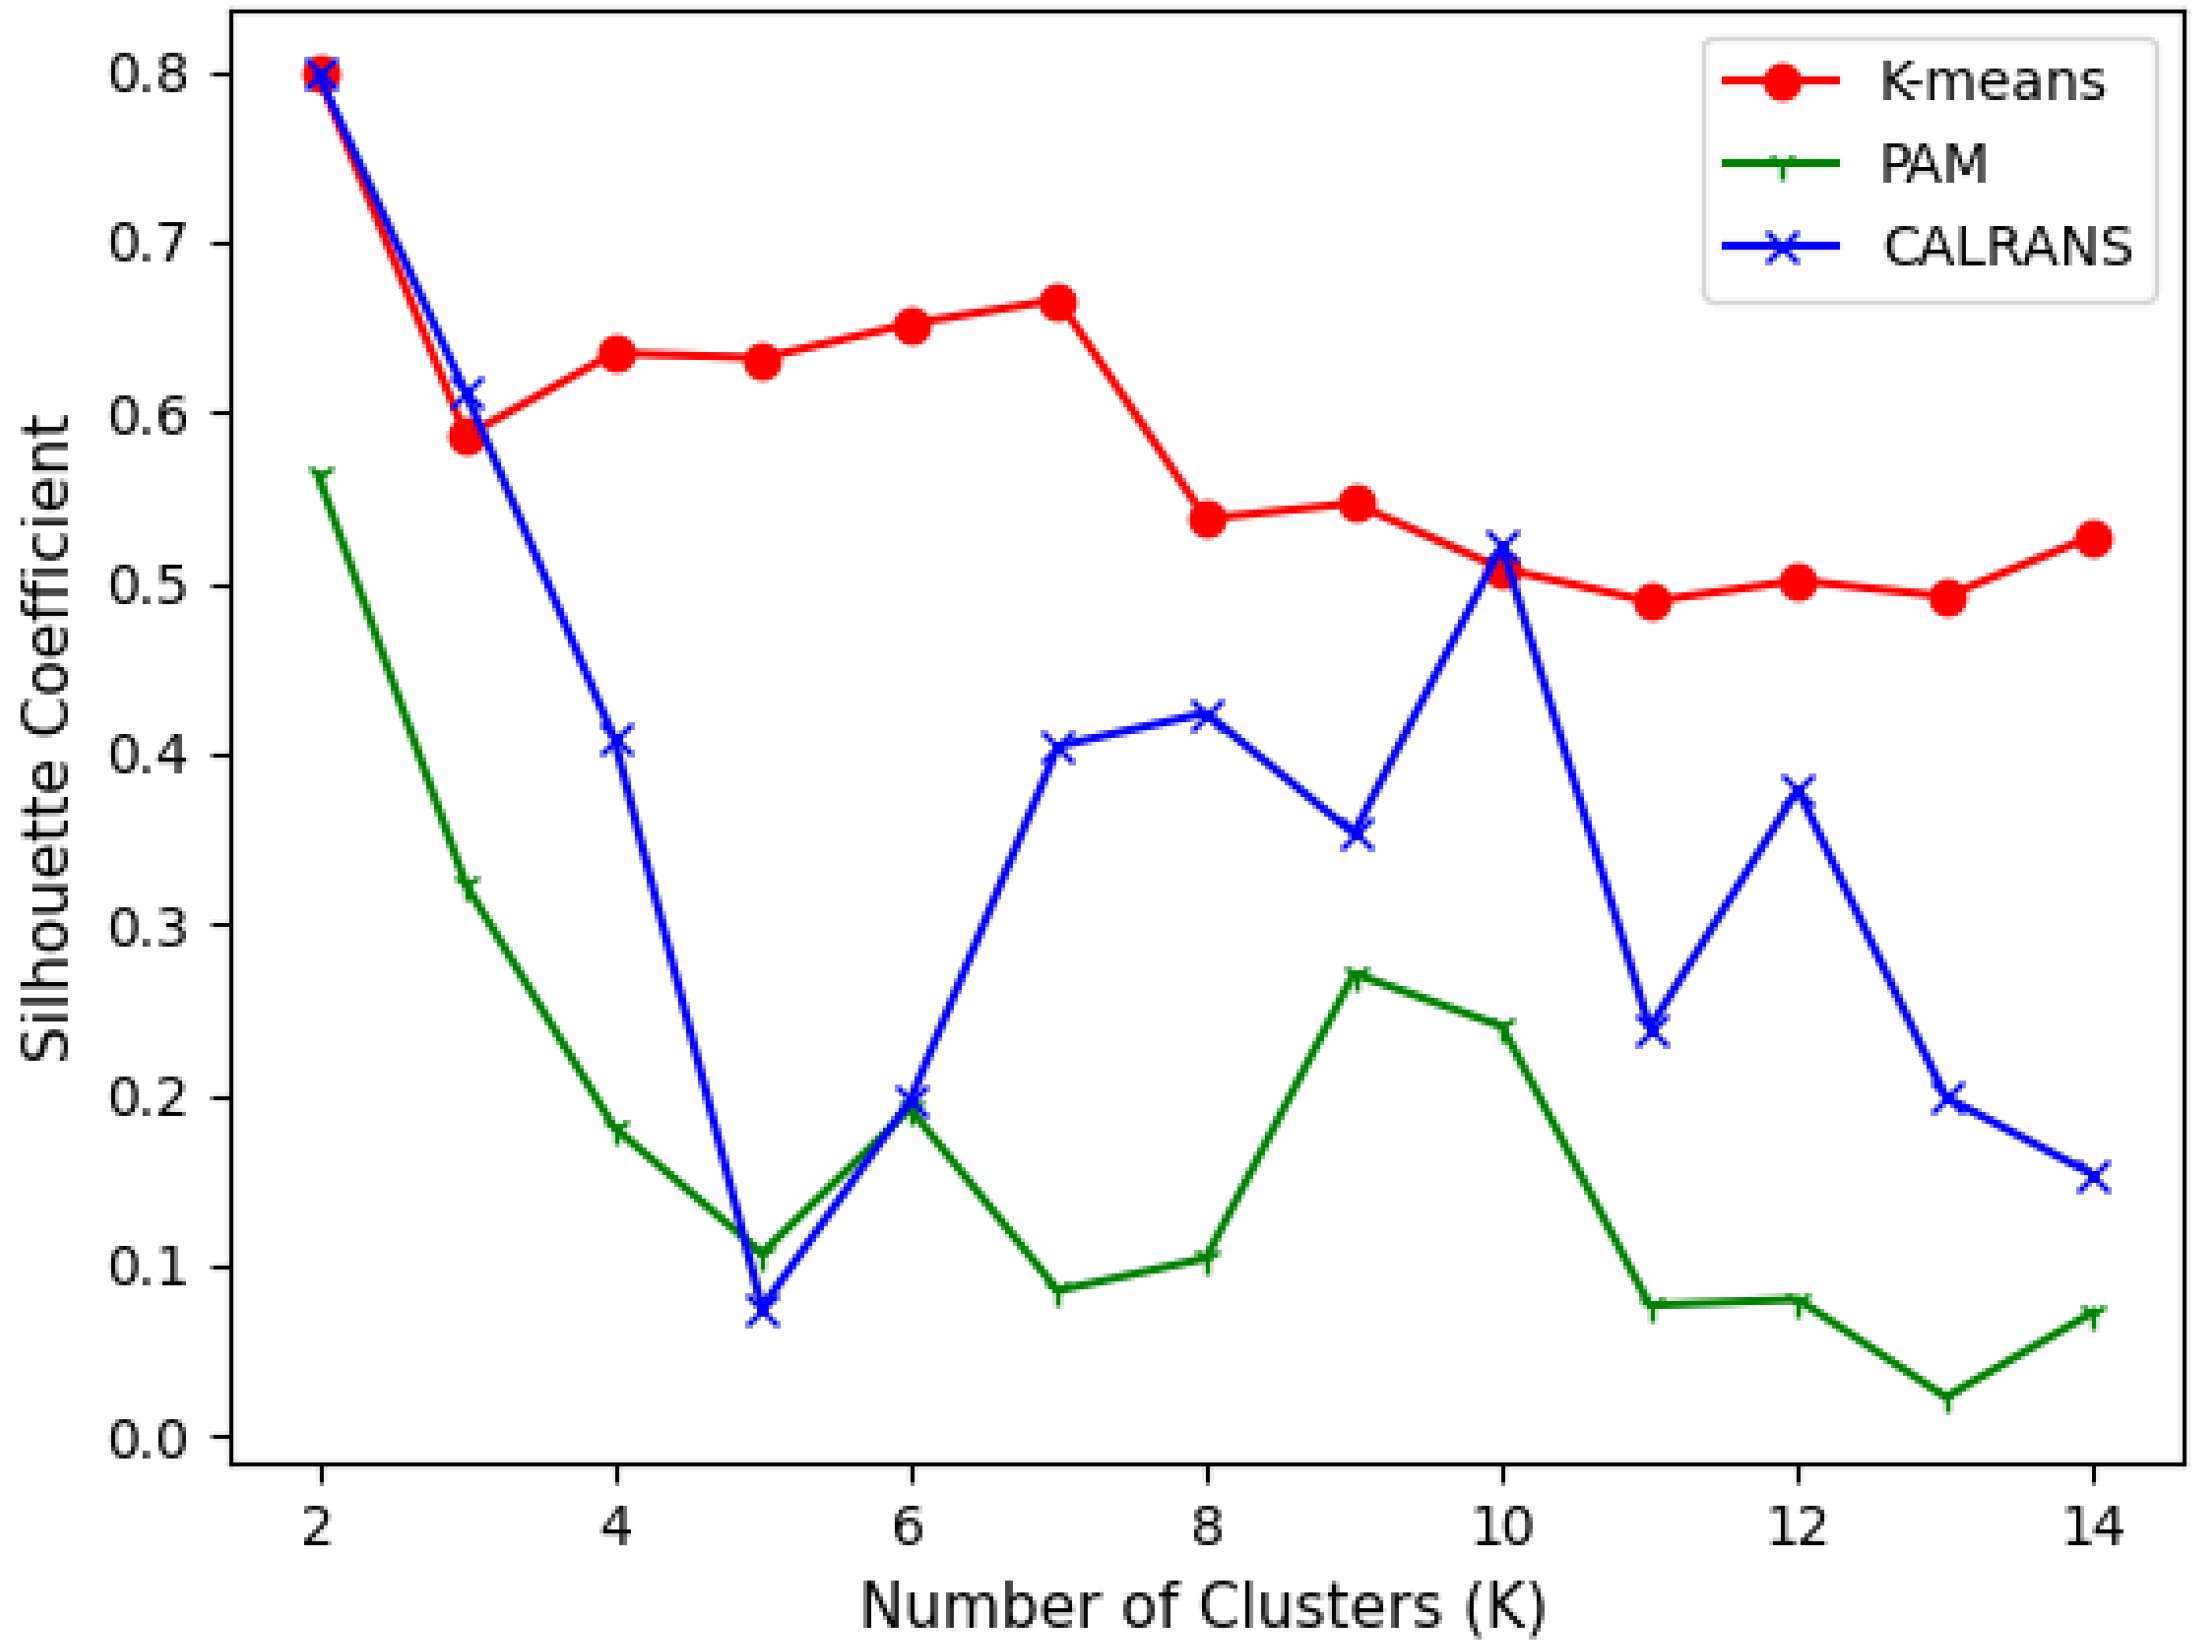
Xu and Tian [27] provided detailed descriptions of various clustering algorithms. According to Xu and Tian [27], the clustering algorithm is divided into partition-based, hierarchy-based, density-based, and so on. The K-means clustering algorithm is a representative partitional clustering algorithm. The partitional clustering algorithms generally determine the number of clusters in advance by the user. In this study, since the number of clusters can be determined according to the requirements of stakeholders, the partitional clustering algorithm that determines the number of clusters in advance is used. The partitional clustering algorithm also includes PAM, CLARA, and CLARANS [28,29]. To select the clustering algorithm for this study, K-means clustering, PAM, and CLARANS algorithms were compared through silhouette coefficients. The silhouette coefficient is obtained by calculating the distance between each data point and adjacent data points and is used as a measure to evaluate the proximity between data in a cluster. The silhouette coefficient value ranges from −1 to 1, and is defined by Equation (3).
where
—is the silhouette coefficient of data point ;
—is the mean intra-cluster distance of data point ;
—is the mean nearest-cluster distance of data point .
The silhouette coefficient near +1 indicates that the samples are far from adjacent clusters. A value of 0 indicates that the sample is at or very close to the decision boundary between two adjacent clusters, and a negative value indicates that the sample may have been assigned to the wrong cluster. The partitional clustering algorithm was compared by the average of silhouette coefficients of all data points. The silhouette coefficient values of the K-means, PAM, and CLARANS algorithms from 2 to 15 in the number of clusters are shown in Figure 6. Figure 6 shows that the K-means clustering algorithm has a higher overall silhouette coefficient than PAM and CLARANS. A high silhouette coefficient value indicates that the distance between each cluster is efficiently separated. “Efficiently separated” means that the distance from other clusters is far and the data of the same cluster are closely clustered together. Therefore, in this study, which can perform data clustering well, the K-means clustering algorithm was used. However, the purpose of this study is to analyze the operational profile with a data-driven approach through the clustering algorithm rather than quantitatively performing clustering with a high evaluation index, and the evaluation index of the clustering algorithm is data-dependent. Therefore, the use of other clustering algorithms can be considered later.
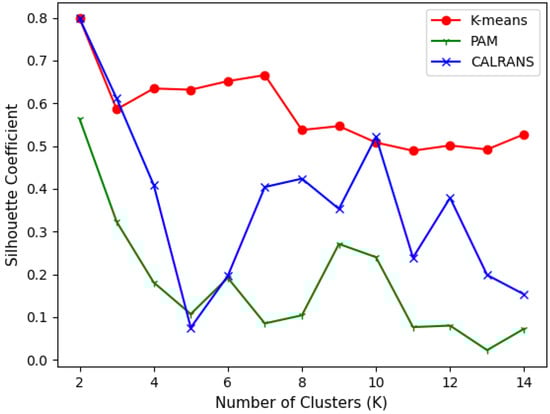
Figure 6.
A comparison of the partitional clustering algorithm.
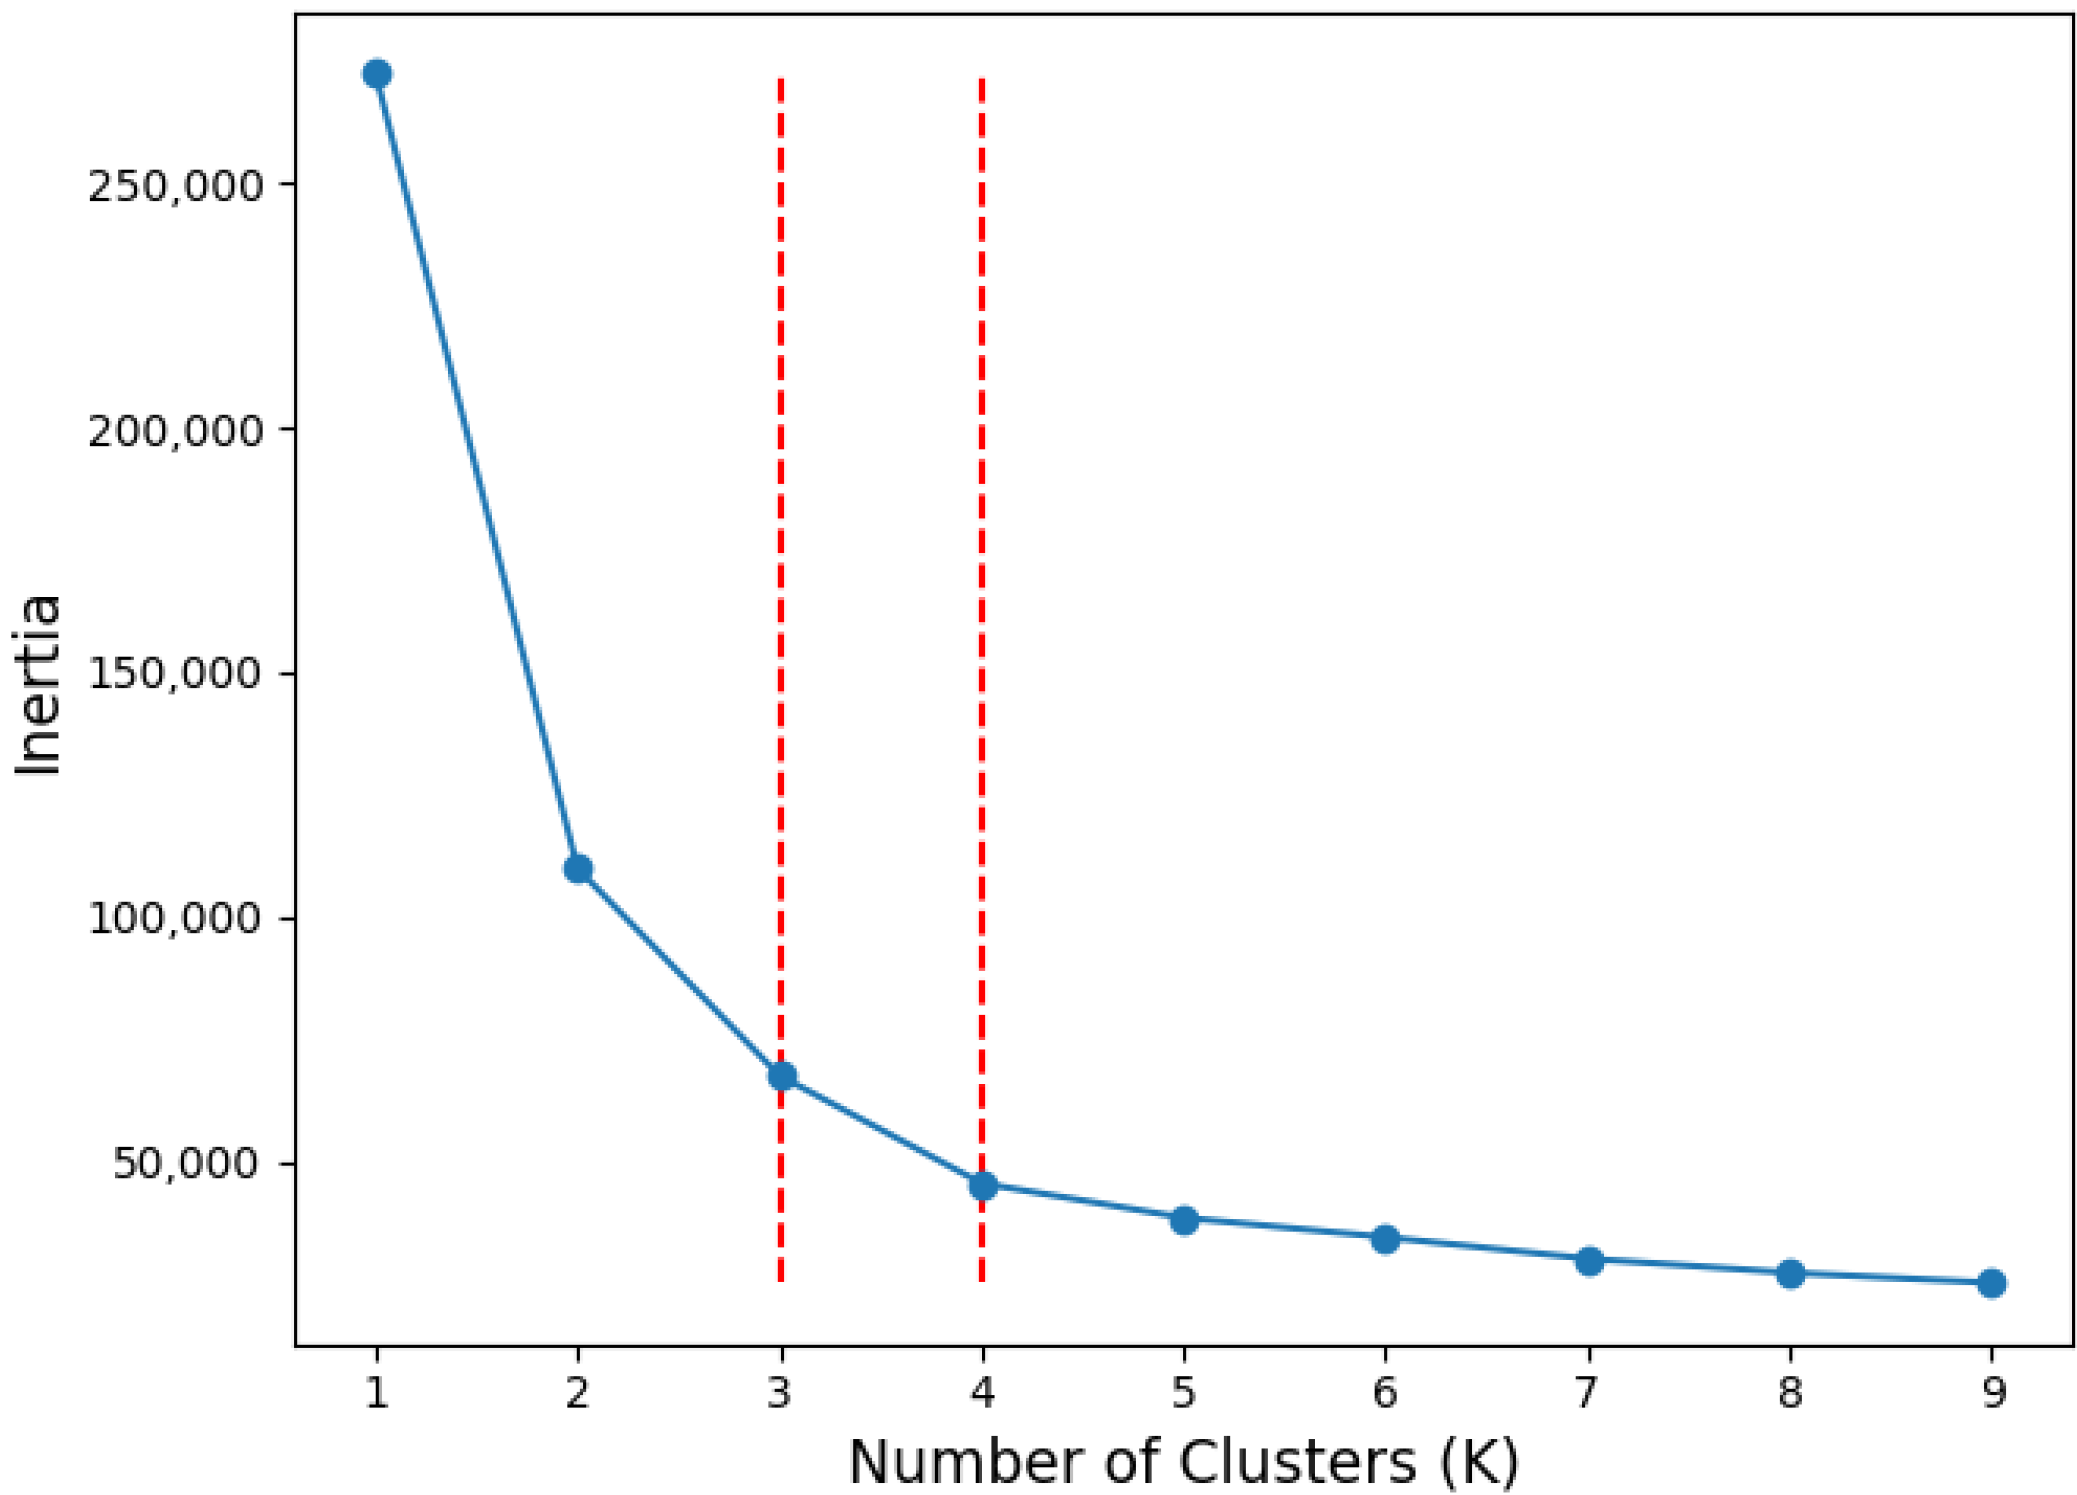
As described in Section 3, determining the K value is an important decision when applying K-means clustering algorithms. In this case study, the K value was determined using the elbow method. This determines the optimal K value using inertia, which is the sum of the distances between the K clusters. The elbow method increases the K value gradually and determines the optimal K value when the change in the inertia value is smaller after the inertia value drops sharply. Figure 7 illustrates the change of inertia values as the K value increases, and the inertia value decreased sharply when the K value was 2. Thus, it seems that the optimal K value was 3 or 4, and further investigation is needed at these values.
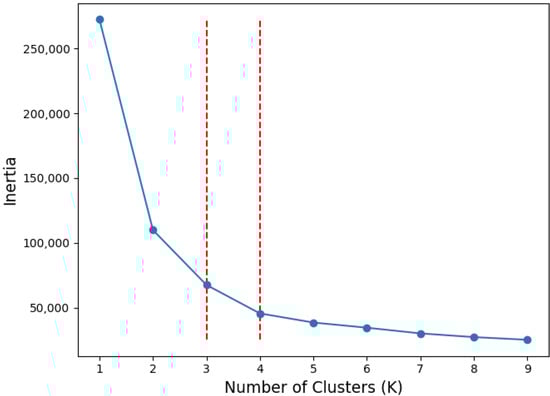
Figure 7.
Inertia values at different K values; the optimal K values are marked with dashed lines.
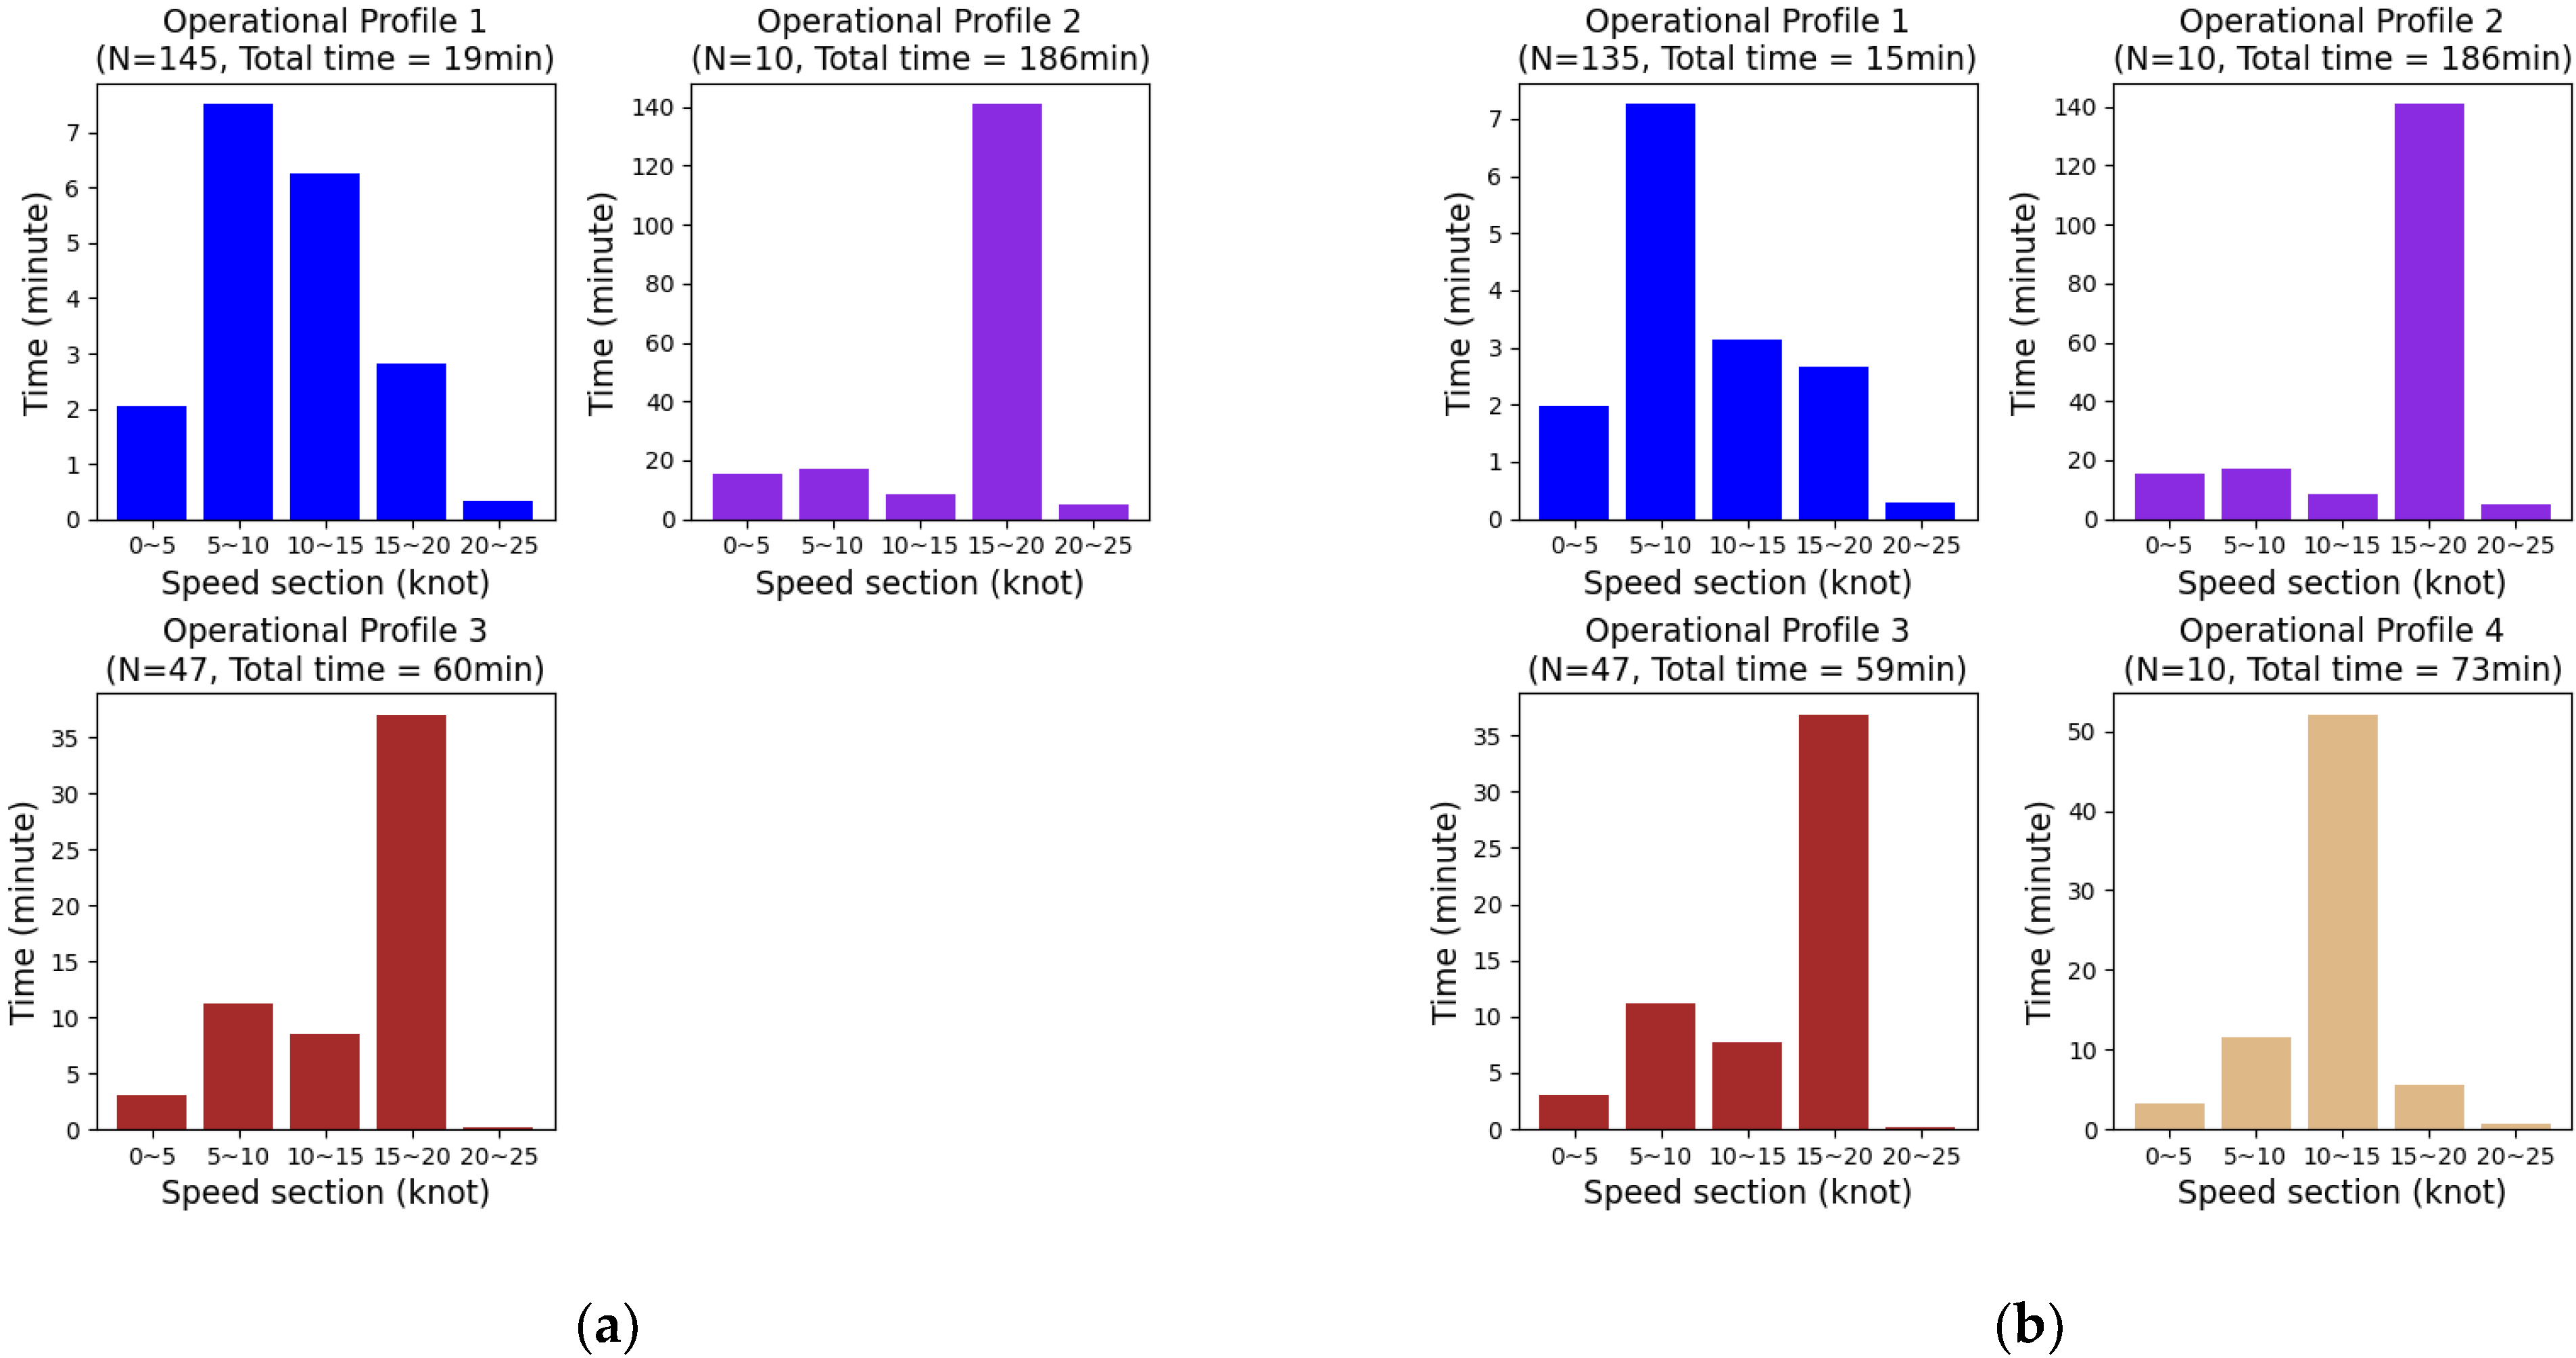
If the K value is determined, the representative operational profiles (the cluster centers) can be determined. Figure 8 shows the operational profiles at K = 3 and 4. In the figures, “N” indicates the number of voyages that belong to the operational profiles. “Total time” indicates the sum of the accumulated operating time. The operational profiles of K = 3 and K = 4 seem similar. However, the main difference was operational profile 1 at K = 3, and it was further divided into operational profiles 1 and 4 at K = 4. The main difference is that the data included in operational profile 1 in Figure 8a when K = 3 was divided into new operational profile 4 in Figure 8b when K = 4 according to the increase in K value.

Figure 8.
Representative operational profiles. (a) K = 3; (b) K = 4.
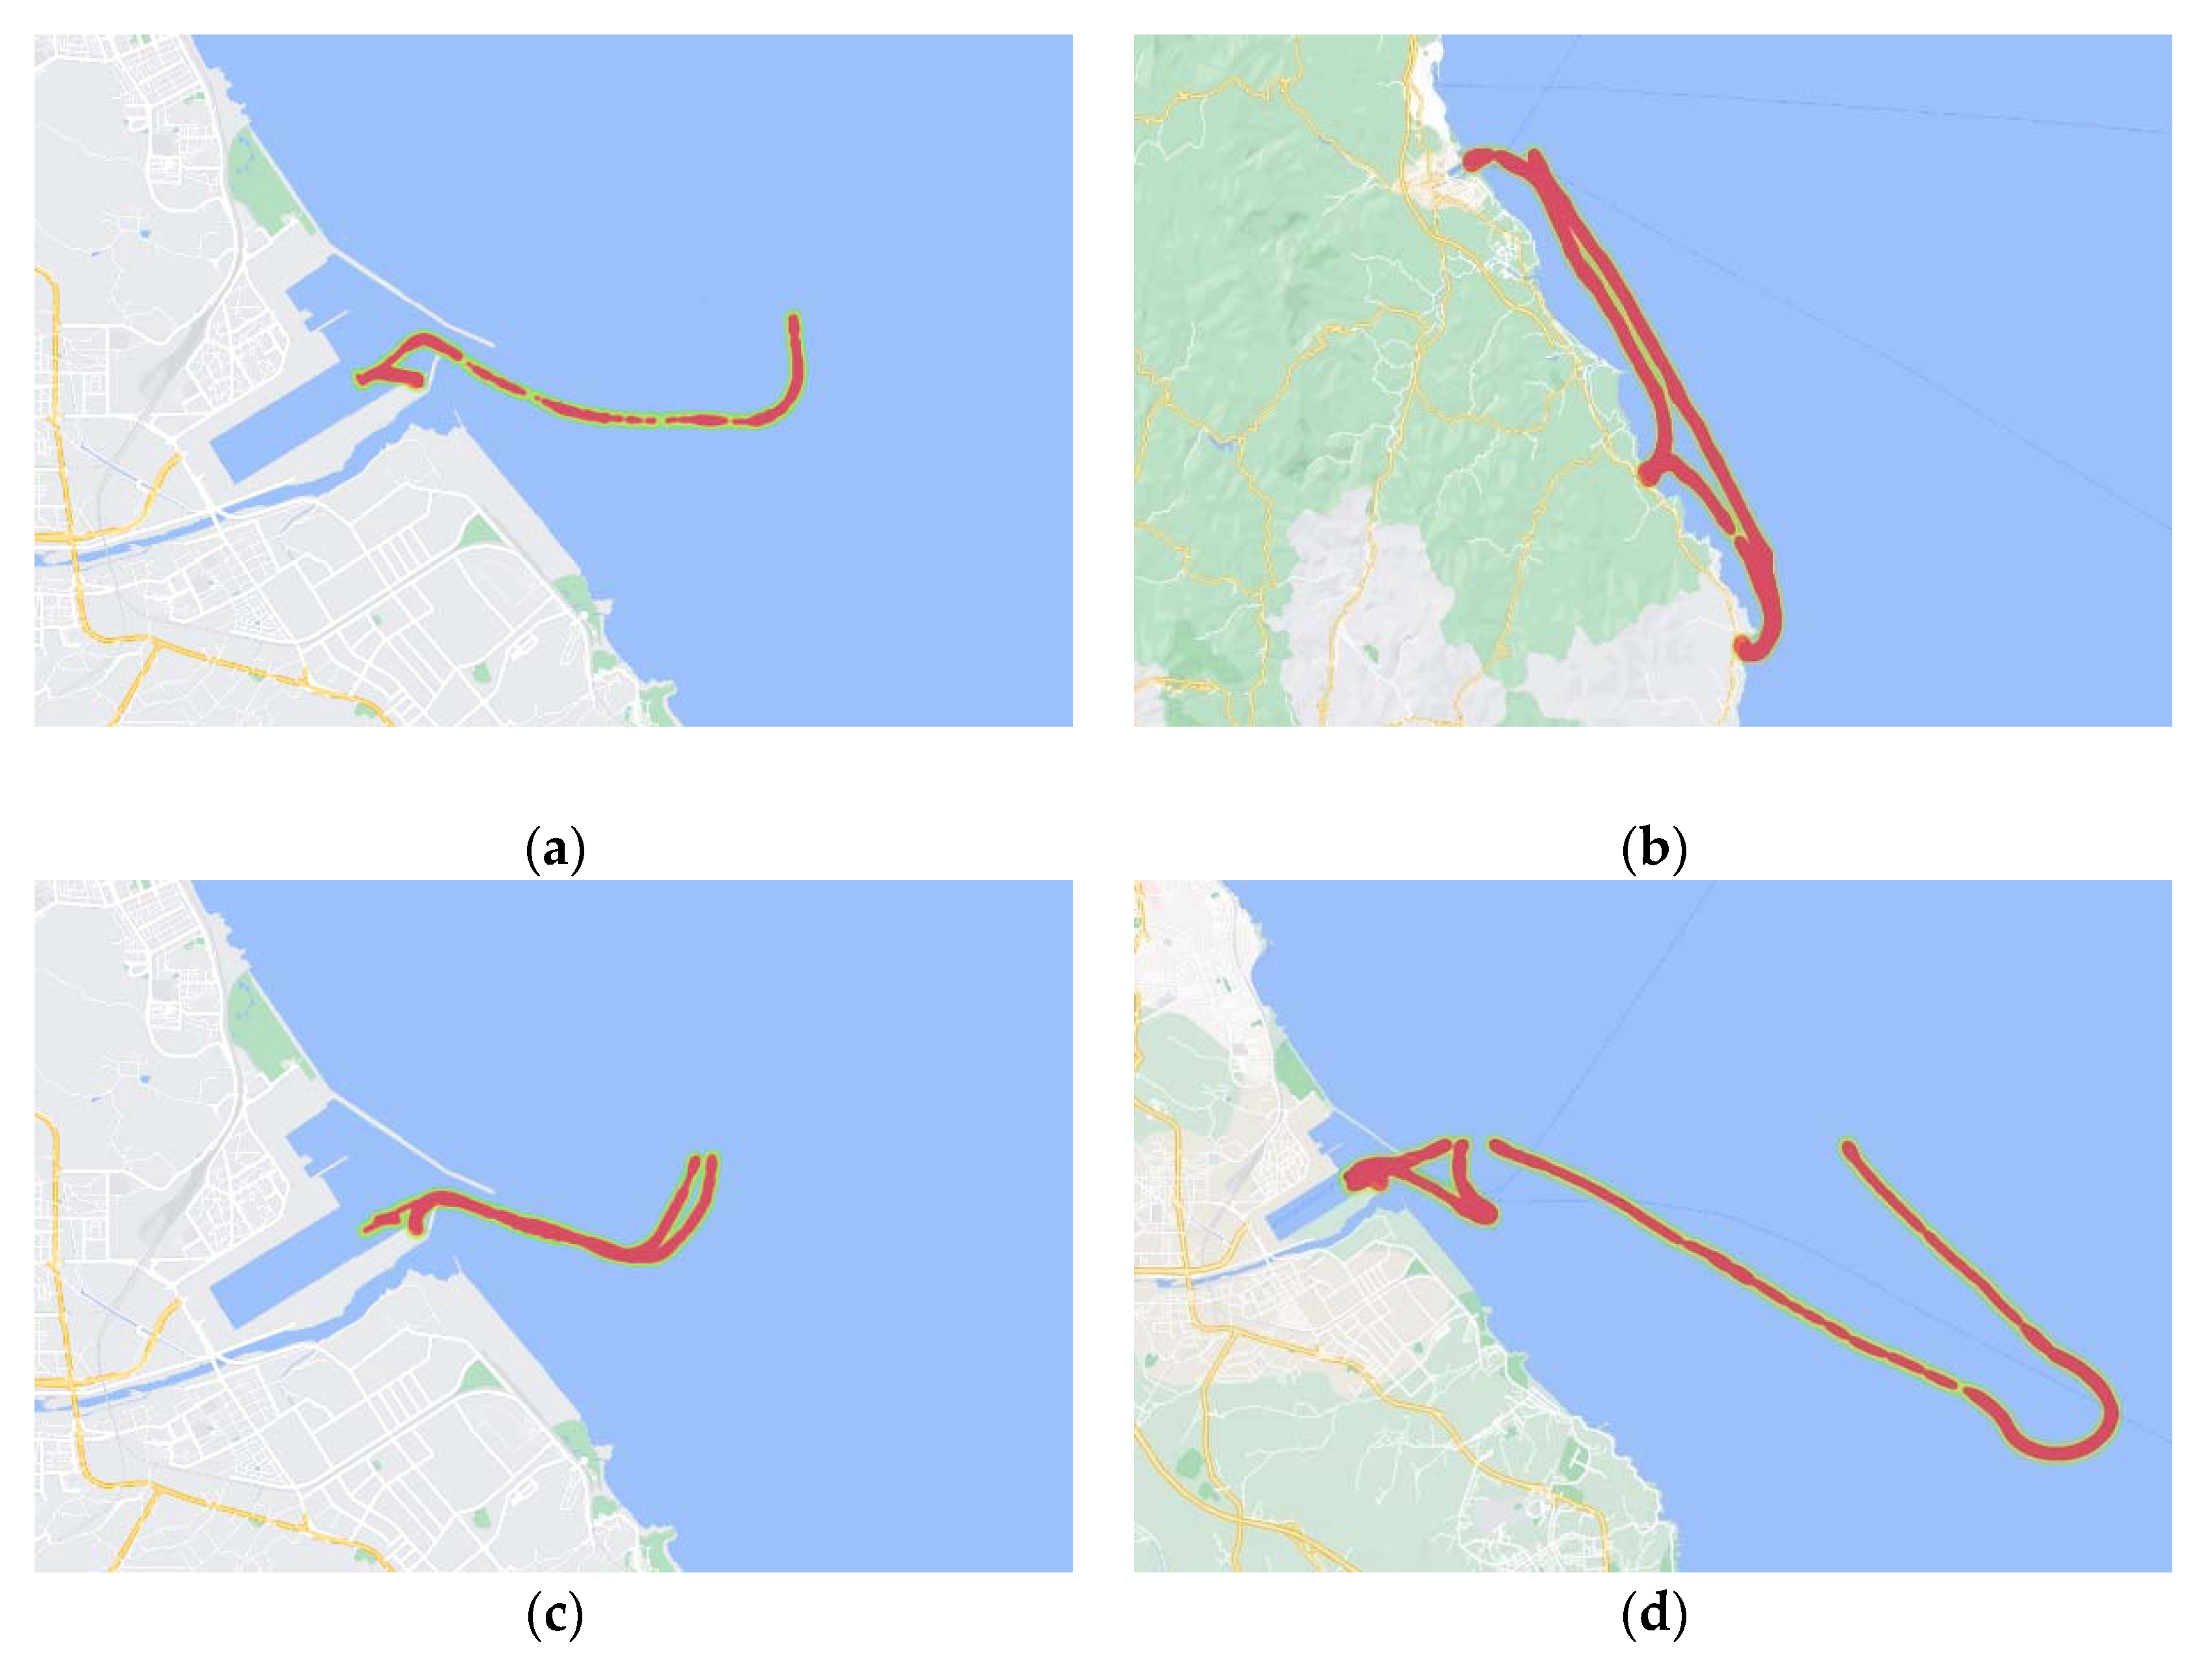
In a stakeholders meeting, it was agreed that distinguishing between operational profiles 1 and 4 at K = 4 is significant. Thus, the operational profiles at K = 4 were selected. It would be used to define the functional requirements of the new ship. Figure 9 illustrates examples of the trajectories in each operational profile. As the figures show, longer voyage data, such as the data belonging to operational profile 2, include operations between different cities.
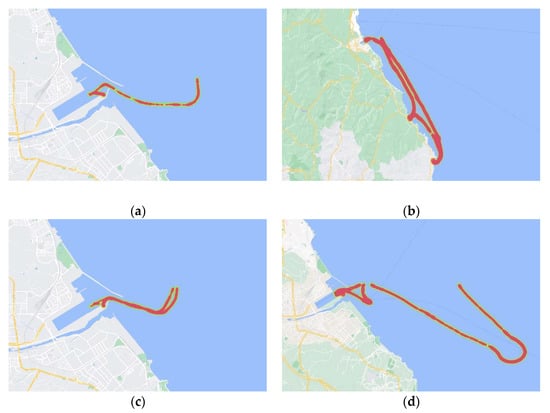
Figure 9.
Examples of voyage trajectories in the operational profiles. (a) Trajectory of operational profile 1; (b) trajectory of operational profile 2; (c) trajectory of operational profile 3; (d) trajectory of operational profile 4.
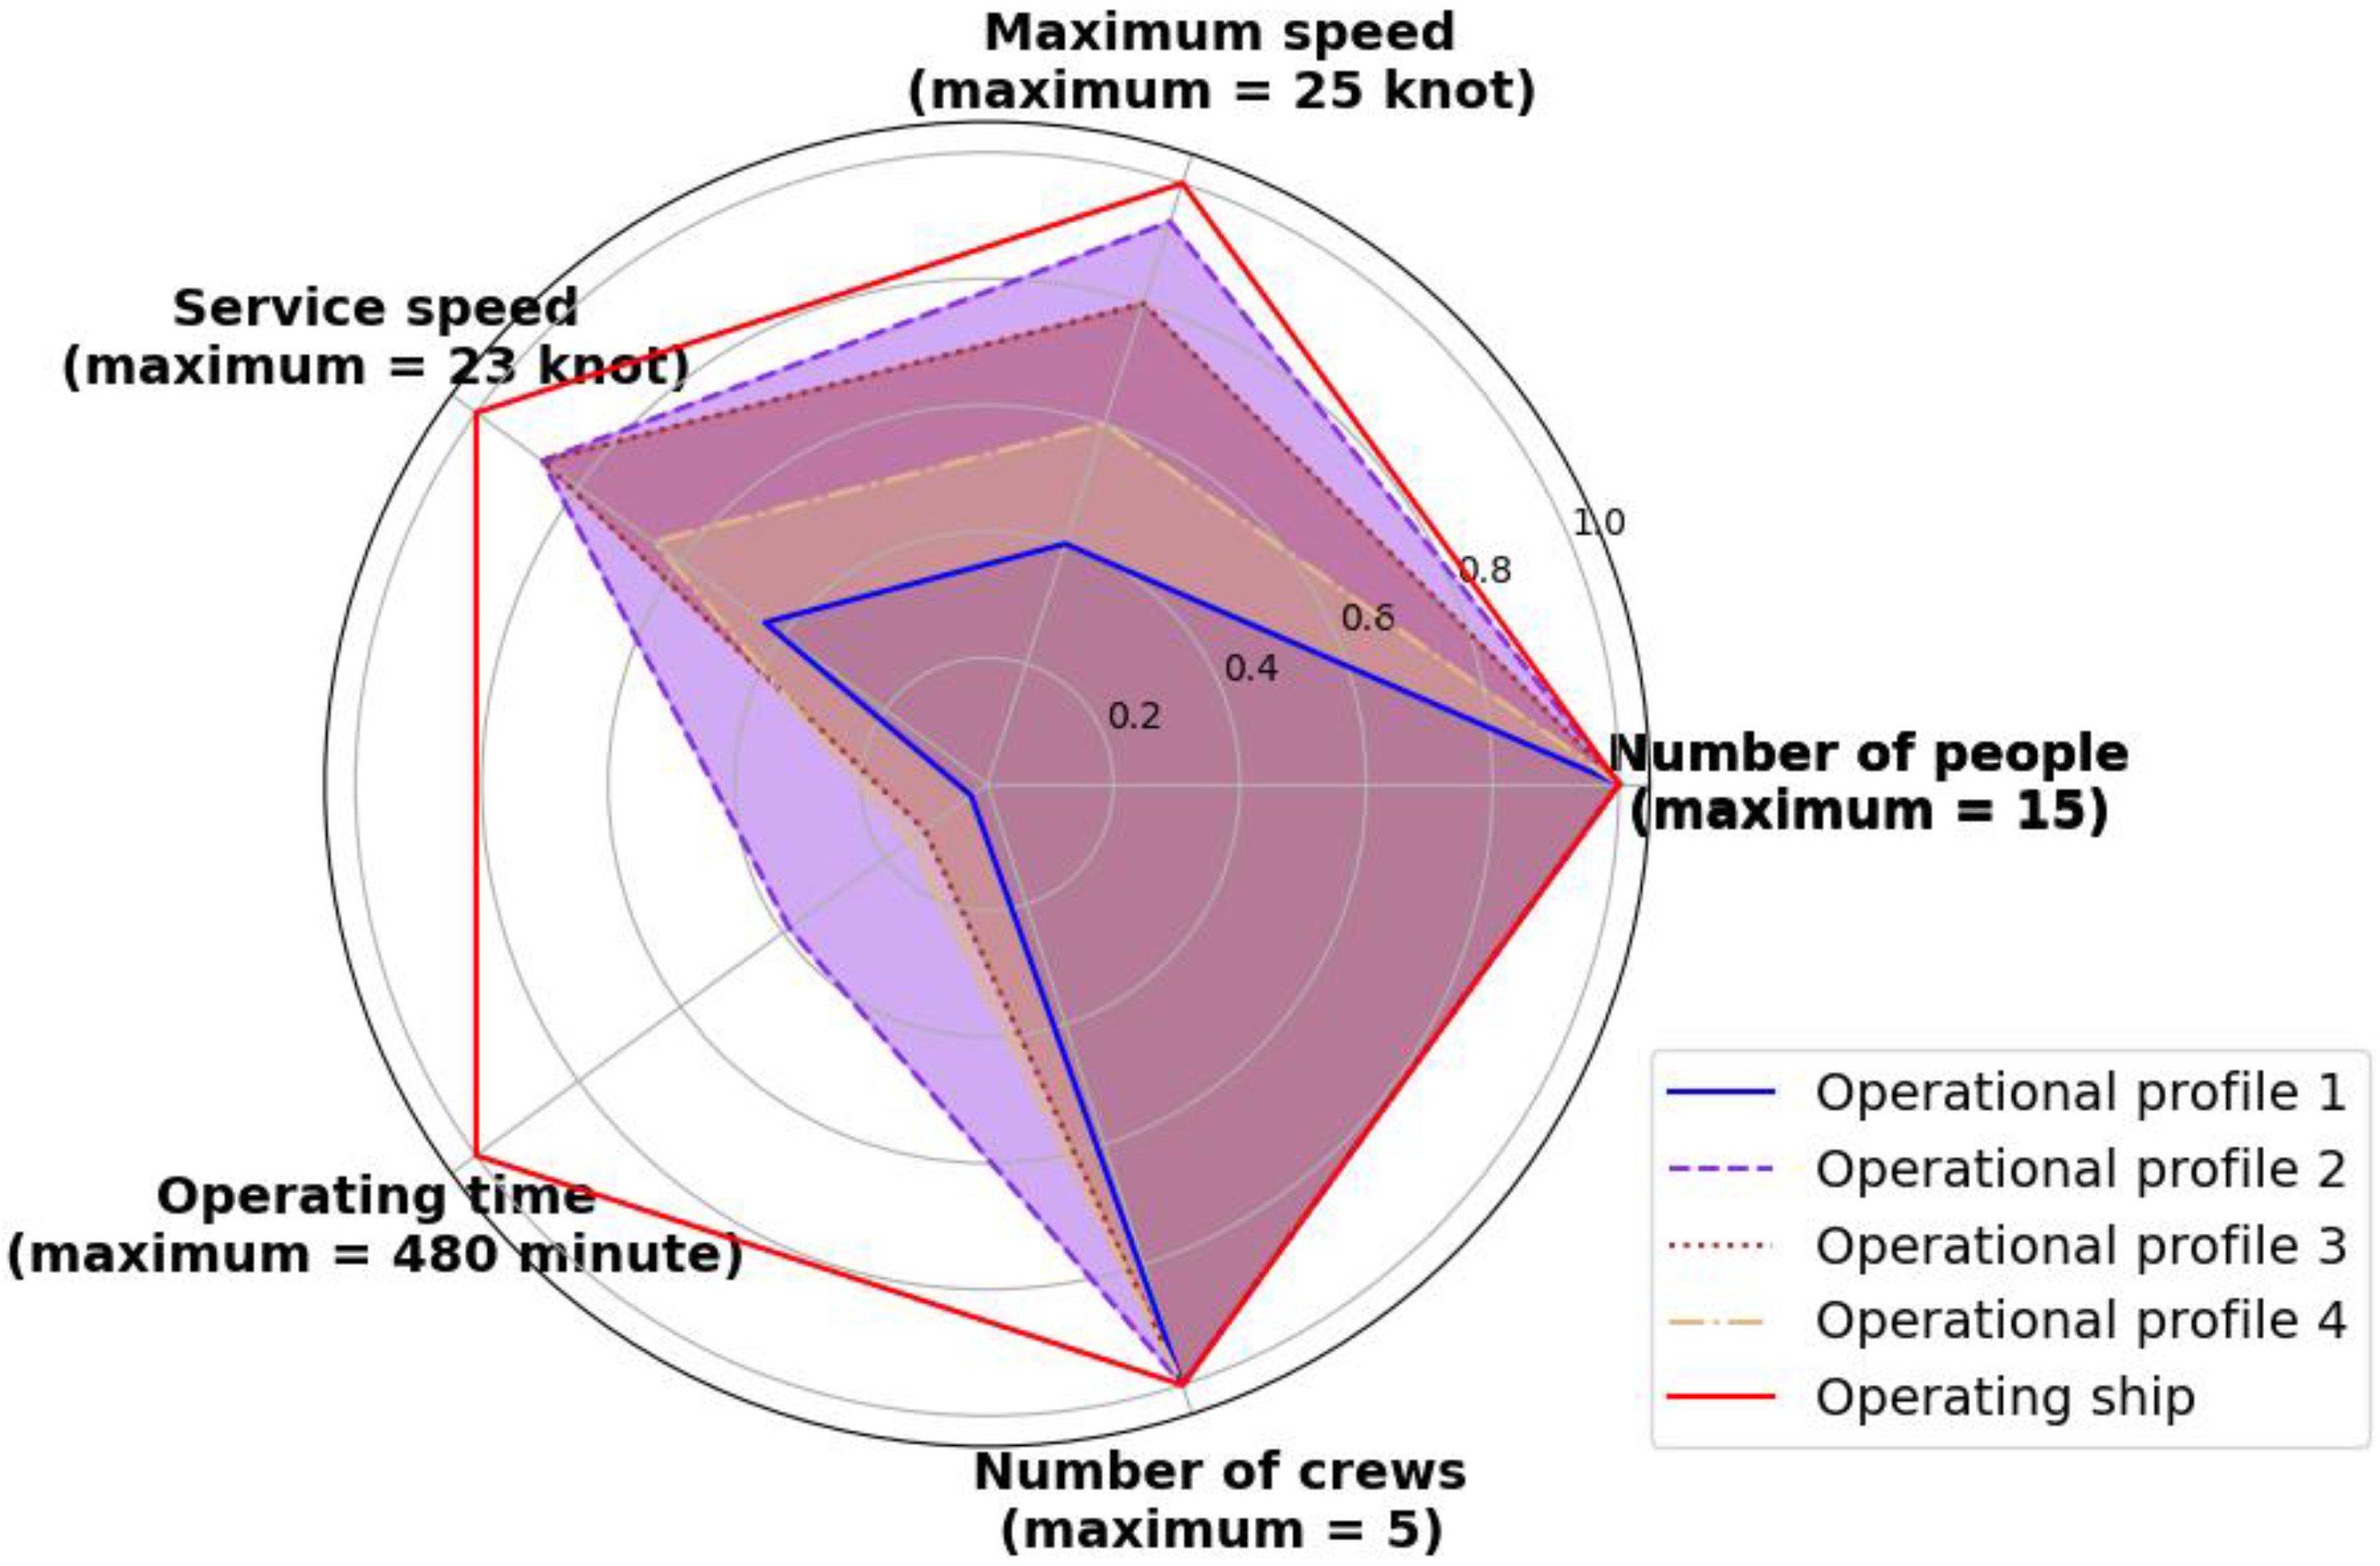
Using the representative operational profiles, the functional requirements of the new ship were determined. For the patrol ship, the key performance indicators (KPIs) were maximum speed, operating time at the service speed, the number of working crews, and the maximum number of people on board. Figure 10 shows KPIs defined by the operational profiles, in which the red line indicates the principal dimensions of the operating ship in Table 2. This is based on the assumptions that the required number of people and crews are the same in all the operational profiles. These numbers could not be found in the AIS data, but were requested by the stakeholders. In defining the maximum speeds, the stakeholders agreed that the speed sections with an operating time of fewer than 5 min could be ignored. The service speed was determined as the maximum value of the most frequent speed section in each representative operational profile. The operating time was determined as the aggregation of the time of each representative operational profile. Finally, the union of all the areas in Figure 10 was defined as the functional requirements. It is noteworthy that there is a huge difference between the maximum operating time of the operating ship and the operational profiles. Although the operating ship was designed for operation up to 480 min, the actual operating time needed is less than 186 min.

Figure 10.
KPIs defined by the operational profiles.
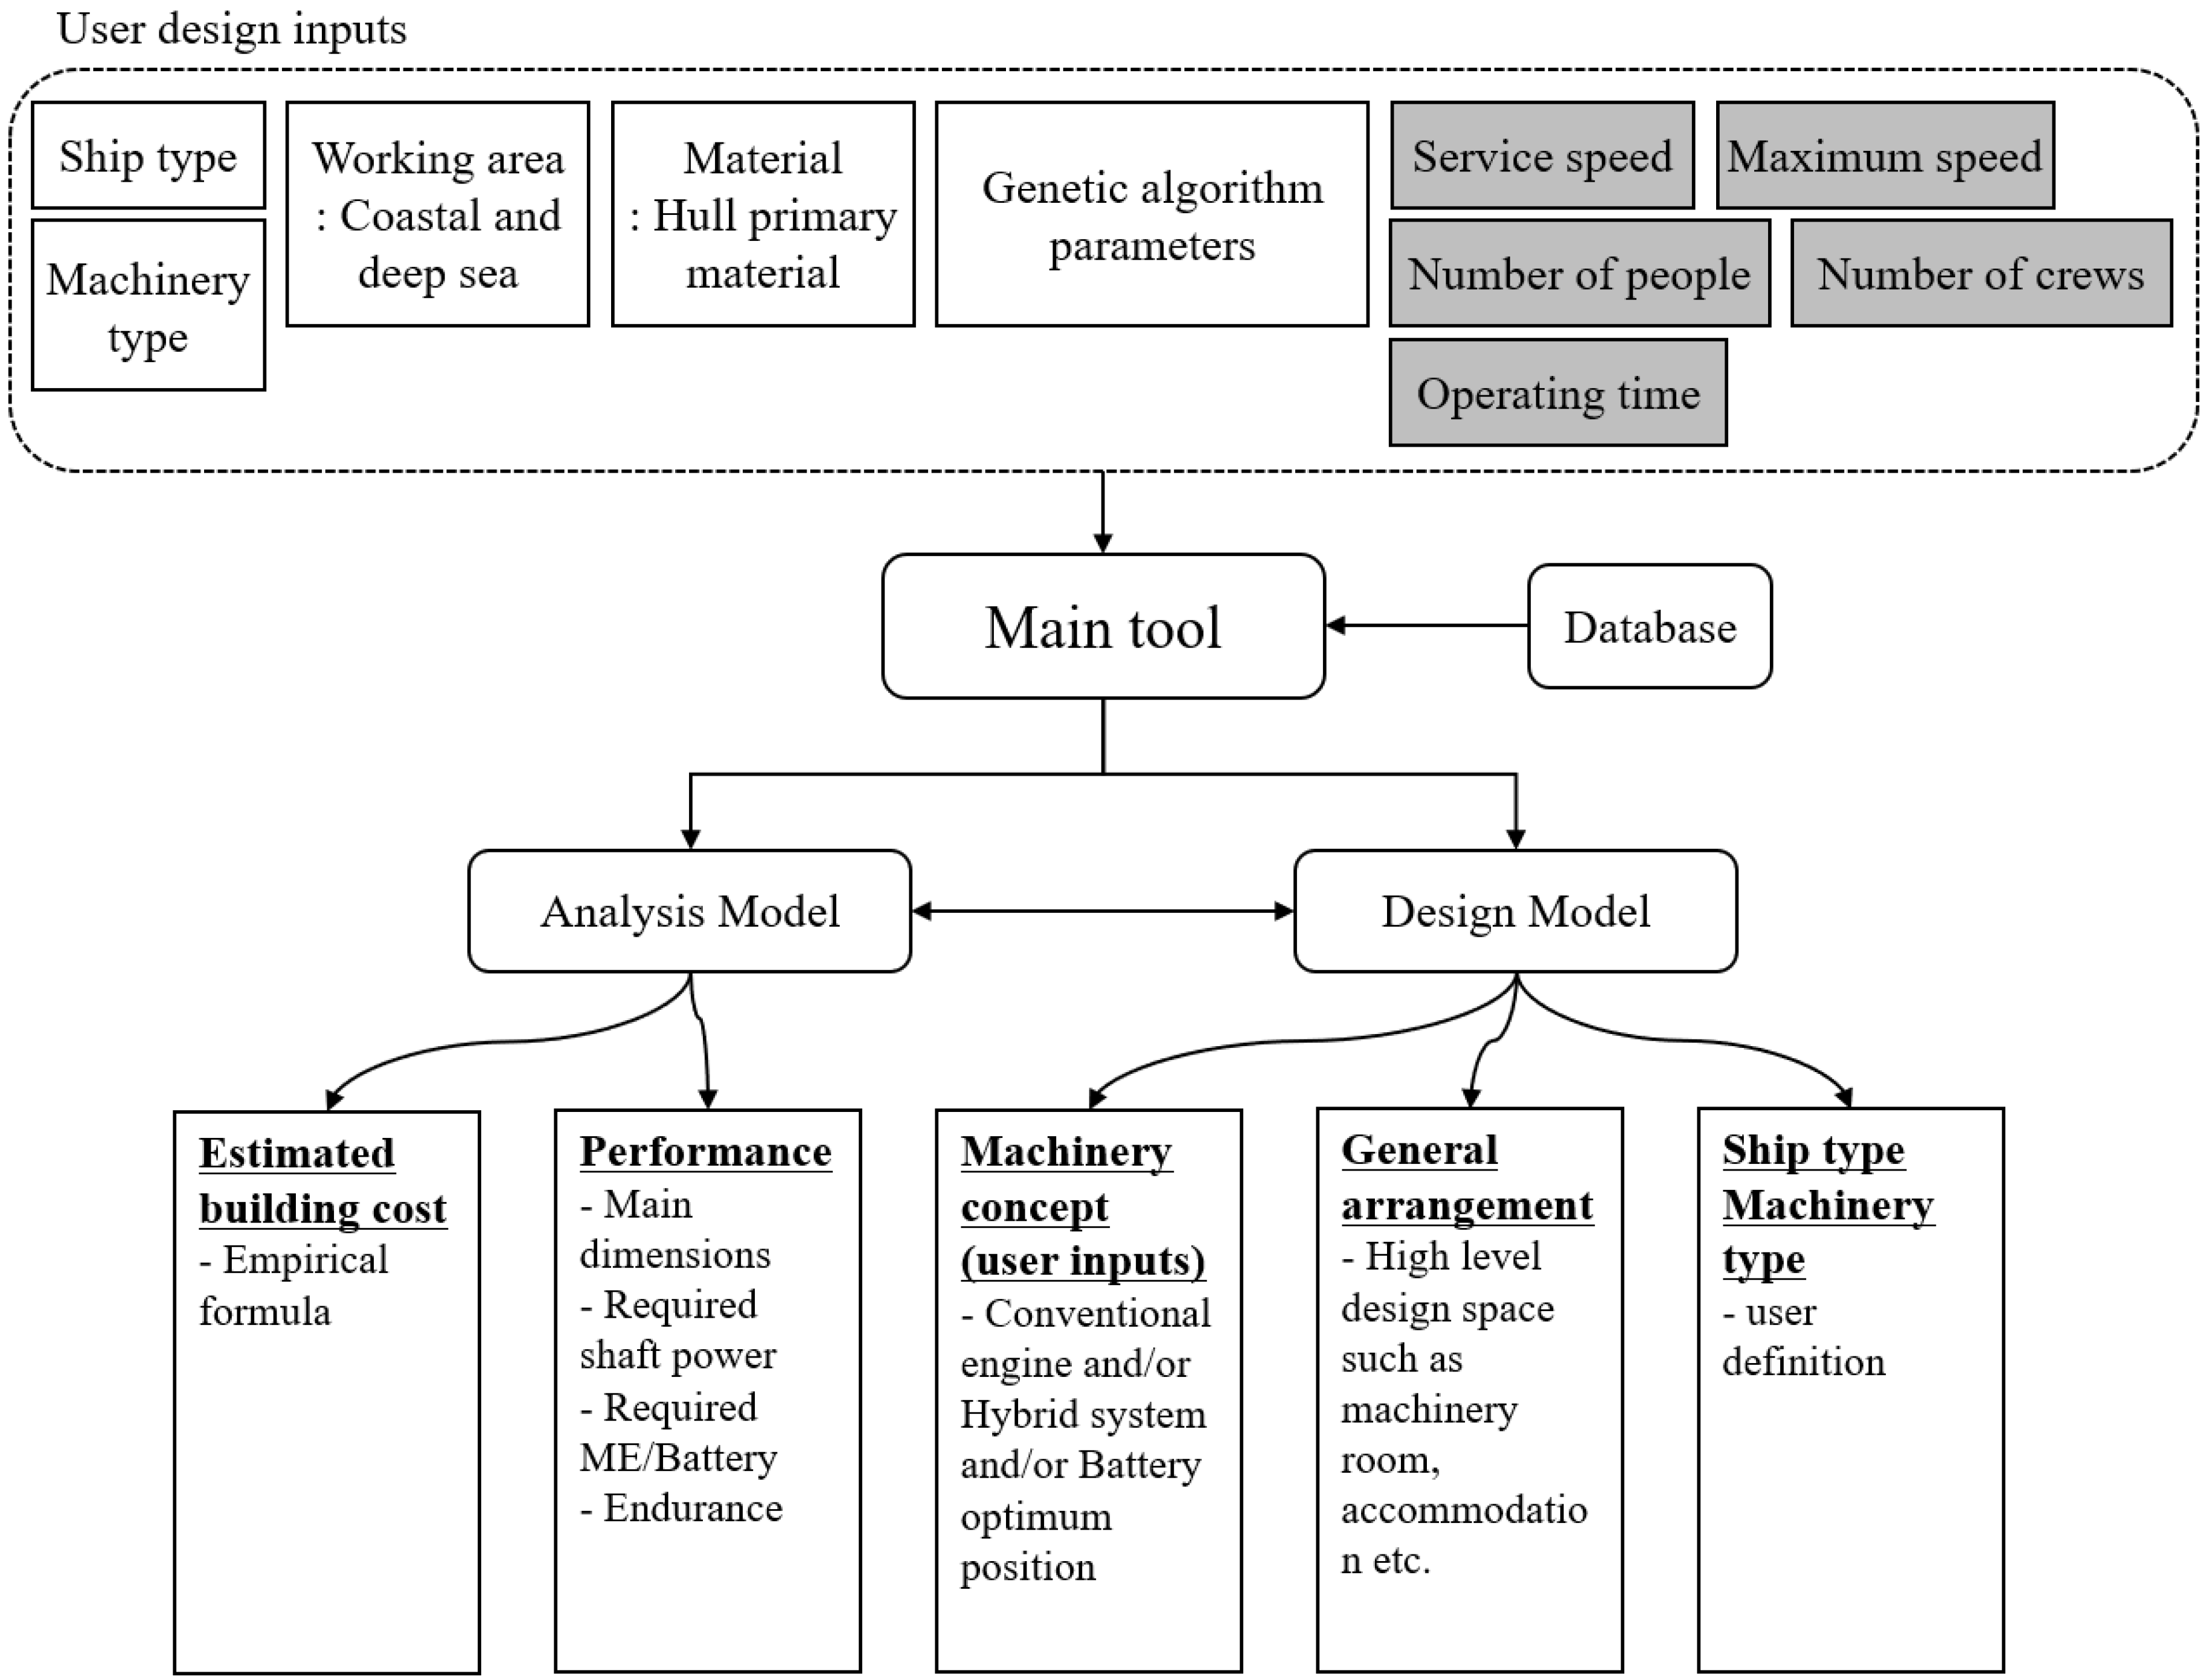
According to the functional requirements in Figure 10, the design decisions were made using a design tool. The design tool determined the best design that has the lowest acquisition cost while meeting the given KPIs that are defined by the operational profiles at K = 4. Figure 11 shows the process of the design tool that uses the KPIs as design inputs and they are described in the grey boxes. The design tool also uses other design inputs. For instance, we use patrol ship as ship type; battery-only as machinery type; working area is coastal; material is steel; and genetic algorithm parameters are a crossover size of 40, an elite size of 4, a mutation size of 6, and a population size of 50.
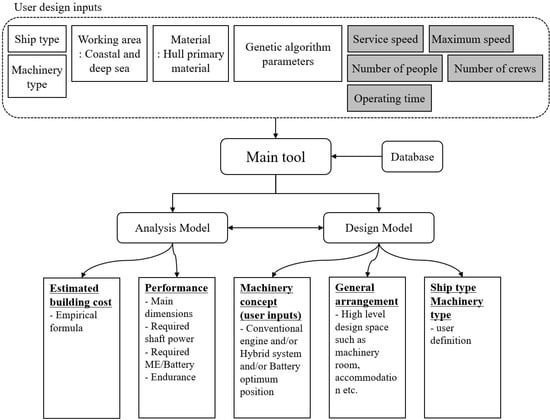
Figure 11.
The process of the design tool.
Table 3 shows the design decisions made using the design tool. The power of the motor was determined to satisfy a maximum speed of 23.4 knots. The battery capacity enabled service speed during the operating time. Principal dimensions and measurements, such as the length, breadth, depth, draft, and GT of the ship, were determined to meet requirements such as the number of boardable people and crew and the battery capacity. The total acquisition cost is determined primarily by the hull size and battery cost.
Table 3.
Design decisions to meet the functional requirements defined by the operational profiles.
Table 4 shows the design decisions when designing a new battery-only electric ship in accordance with the functional requirements of the operating ship. Design decisions shown in Table 4 were determined using KPIs shown in Table 2. The design decision was also made in the same way as in Table 3. The design decisions in Table 3 and Table 4 were compared, and Table 3 has a lower specification performance level, but it is more economical. The proposed data-driven analysis of the operational profile can save about USD 5.43 million in this case. The lower battery capacity and power are affected primarily by the higher maximum and service speeds and the operating time in Table 4 than that in Table 3. Thus, principal dimensions and measurements also increase, and the cost therefore also increases.
Table 4.
Design decisions that are required to maintain the same level of functional capabilities as that of the operating ship.
When designing a ship that performs the same mission by comparing design decisions, it is possible to reduce the cost by identifying the operation information using the proposed method. Additionally, determining the functional requirements according to the analysis of the ship’s operational profiles affects the capacity of the auxiliary machinery. Because the capacity of the auxiliary machinery is related to the power of the motor, the operational profile analysis can identify the various functional requirements of the ship. Thus, when building a ship that will perform similar missions, it is possible to determine the accurate functional requirements and design for the ship’s purpose by analyzing the ship’s operational profile.
5. Conclusions and Future Work
In this paper, a K-means clustering algorithm was proposed to analyze the representative operational profiles of an operating ship using AIS data. AIS data were reconfigured according to speed sections and clustered based on the accumulated operating time of the speed sections. The centers of the clusters were considered to be the representative operational profiles, which were used as a basis for defining the functional requirements for designing a new ship that would perform a similar mission as the operating ship. KPIs were defined from representative operating profiles and used to make design decisions with the design tools. Finally, the applicability for determining functional requirements in the design stage of this study was confirmed by comparing the design decisions. The comparison depends on whether representative operational profiles were considered when designing a battery-only electric ship that will perform a similar mission. The difference between the cost when designing according to the functional requirements of the operating ship and the cost when determining the functional requirements through representative operational profiles analysis was USD 5.43 million. In the transition to battery-only electric ships, what stakeholders are concerned about is the increased CAPAX due to the high battery cost and the increased size of the hull for accommodating batteries. The cost for the transition seems to be inevitable but in some cases the cost could be decreased significantly if the ship is designed to have an appropriate level of functional capabilities. Through the proposed method, the availability of ship electrification was investigated by determining the functional requirements that could be suitable for the mission while minimizing the cost. In addition, the proposed method can be widely applied when a reference ship exists because it enables finding opportunities to reduce costs even for ships using fossil fuels, avoiding excessive functional capabilities.
The operational profiles were determined using the SOG values and accumulated times from the AIS data, which significantly affected the functional requirement decisions. However, the SOG value of the AIS data used in this study includes information that is not related to operation because sometimes it also includes data from when the ship was anchored in the port. In a future study, representative operational profiles can be determined with accurate operational information by filtering out information that is unrelated to the operation. Additionally, when determining the ship’s battery capacity, only the propulsion power was considered. However, determining the battery capacity also requires that the hotel load, which is the power for all the systems that are not related to propulsion, such as the power for auxiliaries, air conditioning, and lighting, are considered. Therefore, more accurate analysis of the battery capacity becomes possible. Moreover, the proposed method used only the AIS data from an operating ship that would be replaced with the new ship. However, the analysis could be improved further by considering the AIS data from other ships in the fleet. This additional information from other ships could allow for a better understanding of the context of the ship and identify hidden opportunities to design better ships. In addition, representative operational profile analysis can be applied to fleet design. As with operational profile 2 in the case study, there are often voyages where the number of observations is small but require high functional capabilities, such as long operating time or high speed. In this case, rather than making a decision that satisfies all of the representative operational profiles, more efficient decision making is possible through the distribution of missions among ships in the fleet.
Author Contributions
Conceptualization, J.P. and M.C.; methodology, J.P. and M.C.; software, J.P.; validation M.C.; formal analysis, J.P. and M.C.; investigation, J.P. and M.C.; resources J.P. and M.C.; data curation, J.P.; writing—original draft preparation, J.P.; writing—review and editing, M.C.; visualization, J.P.; supervision, M.C.; project administration, M.C.; funding acquisition, M.C. All authors have read and agreed to the published version of the manuscript.
Funding
This research was supported by the Basic Science Research Program through the National Research Foundation of Korea (NRF) funded by the Ministry of Education (NRF2020R1G1A101417213).
Institutional Review Board Statement
Not applicable.
Informed Consent Statement
Not applicable.
Data Availability Statement
Not applicable.
Conflicts of Interest
The authors declare no conflict of interest. The funders had no role in the design of the study; collection, analyses, or interpretation of data; writing of the manuscript; or the decision to publish the results.
References
- Xiao, F.; Ligteringen, H.; van Gulijk, C.; Ale, B. Comparison study on AIS data of ship traffic behavior. Ocean. Eng. 2015, 95, 84–93. [Google Scholar] [CrossRef]
- Mou, J.M.; van der Tak, C.; Ligteringen, H. Study on collision avoidance in busy waterways by using AIS Data. Ocean. Eng. 2010, 37, 483–490. [Google Scholar] [CrossRef]
- Tsou, M.-C. Online analysis process on automatic identification system data warehouse for application in vessel traffic service. Proc. Inst. Mech. Eng. M J. Eng. Marit. Environ. 2016, 230, 199–215. [Google Scholar] [CrossRef]
- Breithaupt, S.A.; Copping, A.; Tagestad, J.; Whiting, J. Maritime route delineation using AIS data from the Atlantic coast of the US. J. Navig. 2017, 70, 379–394. [Google Scholar] [CrossRef]
- Dobrkovic, A.; Iacob, M.-E.; van Hillegersberg, J. Maritime pattern extraction from AIS data using a genetic algorithm. In Proceedings of the 2016 IEEE International Conference on Data Science and Advanced Analytics (DSAA), Montreal, QC, Canada, 17–19 October 2016; pp. 642–651. [Google Scholar]
- Mazzarella, F.; Arguedas, V.F.; Vespe, M. Knowledge-based vessel position prediction using historical AIS data. In Proceedings of the 2015 Sensor Data Fusion: Trends, Solutions, Applications (SDF), Bonn, Germany, 6–8 October 2015; pp. 1–6. [Google Scholar]
- Ristic, B.; la Scala, B.; Morelande, M.; Gordon, N. Statistical analysis of motion patterns in AIS data: Anomaly detection and motion prediction. In Proceedings of the 2008 11th International Conference on Information Fusion, Cologne, Germany, 30 June–3 July 2008; pp. 1–7. [Google Scholar]
- Kim, S.-H.; Roh, M.-I.; Oh, M.-J.; Park, S.-W.; Kim, I.-I. Estimation of ship operational efficiency from AIS data using big data technology. Int. J. Nav. Archit. Ocean Eng. 2020, 12, 440–454. [Google Scholar] [CrossRef]
- Rong, H.; Teixeira, A.P.; Guedes Soares, C. Data Mining Approach to Shipping Route Characterization and Anomaly Detection Based on AIS Data. Ocean. Eng. 2020, 198, 106936. [Google Scholar] [CrossRef]
- Silveira, P.A.M.; Teixeira, A.P.; Soares, C.G. Use of AIS Data to Characterise Marine Traffic Patterns and Ship Collision Risk off the Coast of Portugal. J. Navig. 2013, 66, 879–898. [Google Scholar] [CrossRef]
- Murray, B.; Perera, L.P. A Dual Linear Autoencoder Approach for Vessel Trajectory Prediction Using Historical AIS Data. Ocean. Eng. 2020, 209, 107478. [Google Scholar] [CrossRef]
- Reusser, C.A.; Pérez Osses, J.R. Challenges for zero-emissions ship. J. Mar. Sci. Eng. 2021, 9, 1042. [Google Scholar] [CrossRef]
- Kim, K.; Roh, G.; Kim, W.; Chun, K. A preliminary study on an alternative ship propulsion system fueled by ammonia: Environmental and economic assessments. J. Mar. Sci. Eng. 2020, 8, 183. [Google Scholar] [CrossRef] [Green Version]
- Hansen, J.F.; Wendt, F. History and state of the art in commercial electric ship propulsion, integrated power systems, and future trends. Proc. IEEE 2015, 103, 2229–2242. [Google Scholar] [CrossRef]
- Sulligoi, G.; Vicenzutti, A.; Menis, R. All-electric ship design: From electrical propulsion to integrated electrical and electronic power systems. IEEE Trans. Transp. Electrif. 2016, 2, 507–521. [Google Scholar] [CrossRef]
- Shakeri, N.; Zadeh, M.; Nielsen, J.B. Hydrogen fuel cells for ship electric propulsion: Moving toward greener ships. IEEE Electrif. Mag. 2020, 8, 27–43. [Google Scholar] [CrossRef]
- Harati-Mokhtari, A.; Wall, A.; Brooks, P.; Wang, J. Automatic Identification System (AIS): Data reliability and human error implications. J. Navig. 2007, 60, 373–389. [Google Scholar] [CrossRef]
- MacQueen, J. Some methods for classification and analysis of multivariate observations. In Proceedings of the Fifth Berkeley Symposium on Mathematical Statistics and Probability, Berkeley, CA, USA, 7 January 1967; pp. 281–297. [Google Scholar]
- Zheng, B.; Chen, J.; Xia, S.; Jin, Y. Data analysis of vessel traffic flow using clustering algorithms. In Proceedings of the 2008 International Conference on Intelligent Computation Technology and Automation (ICICTA), Changsha, China, 20–22 October 2008; pp. 243–246. [Google Scholar]
- Affandi, A.; Sumpeno, S. Clustering spatial temporal distribution of fishing vessel based LON VMS data using K-means. In Proceedings of the 2020 3rd International Conference on Information and Communications Technology (ICOIACT), Yogyakarta, Indonesia, 24–25 November 2020; pp. 1–6. [Google Scholar]
- Mieczyńska, M.; Czarnowski, I. K-means clustering for SAT-AIS data analysis. WMU J. Marit. Aff. 2021, 20, 377–400. [Google Scholar] [CrossRef]
- Gan, S.; Liang, S.; Li, K.; Deng, J.; Cheng, T. Ship trajectory prediction for intelligent traffic management using clustering and ANN. In Proceedings of the 2016 UKACC 11th International Conference on Control (CONTROL), Belfast, UK, 31 August–2 September 2016; pp. 1–6. [Google Scholar]
- Liu, L.; Zhang, Y.; Hu, Y.; Wang, Y.; Sun, J.; Dong, X. A hybrid-clustering model of ship trajectories for maritime traffic patterns analysis in port area. J. Mar. Sci. Eng. 2022, 10, 342. [Google Scholar] [CrossRef]
- Pham, D.T.; Dimov, S.S.; Nguyen, C.D. Selection of K in K-means clustering. Proc. Inst. Mech. Eng. C J. Mech. Eng. Sci. 2005, 219, 103–119. [Google Scholar] [CrossRef]
- Yuan, C.; Yang, H. Research on K-value selection method of K-means clustering algorithm. J 2019, 2, 226–235. [Google Scholar] [CrossRef]
- Kodinariya, T.M.; Makwana, P.R. Review on determining number of cluster in K-means clustering. Int. J. Adv. Res. Comput. Sci. Manag. Stud. 2013, 1, 90–95. [Google Scholar]
- Xu, D.; Tian, Y. A comprehensive survey of clustering algorithms. Ann. Data. Sci. 2015, 2, 165–193. [Google Scholar] [CrossRef]
- Kaufman, L.; Rousseeuw, P.J. Finding Groups in Data: An Introduction to Cluster Analysis; John Wiley & Sons: Hoboken, NJ, USA, 2009; Volume 344. [Google Scholar]
- Ng, R.T.; Han, J. CLARANS: A method for clustering objects for spatial data mining. IEEE Trans. Knowl. Data Eng. 2002, 14, 1003–1016. [Google Scholar] [CrossRef] [Green Version]

Publisher’s Note: MDPI stays neutral with regard to jurisdictional claims in published maps and institutional affiliations. |
© 2022 by the authors. Licensee MDPI, Basel, Switzerland. This article is an open access article distributed under the terms and conditions of the Creative Commons Attribution (CC BY) license (https://creativecommons.org/licenses/by/4.0/).