Abstract
The oil and natural gas resources of the Bohai Sea are mainly marginal oil fields, and there are currently a large number of structures that are approaching or have reached the end of their service life called aging structures. The interactions between ice and offshore structures could lead to significant ice-induced vibration. Ice-induced vibrations may evoke fatigue damage in tubular joints, which results in severe dangers for offshore platforms in the Bohai Sea. Dynamic ice force models and sea ice fatigue environmental parameters have not been well developed in the current design codes. It is not accurate to evaluate the fatigue damage of structures only with numerical simulation. In this paper, a faster method for evaluating fatigue damage on aging structures is proposed. Firstly, the approximate linear relationship between the fatigue hot spot stress and the vibration response of the deck structure has been discovered using dynamic analysis for jacket platform of Bohai Sea. Then, the procedure of the fatigue damage evaluation of the aging structures in the Bohai Sea is established. Finally, the numerical simulation of the structure is carried out considering ice thickness, ice velocity, ice direction, and action height of sea ice. Fatigue damage is calculated by the fatigue hot spot stress and the Palmgren–Miner rule. The measured data on the platform in the Bohai Sea are selected to obtain the fatigue hot spot stress using a mathematical model. The fatigue damage results considering the actual ice conditions of a jacket structure in the Bohai Sea are compared using the proposed method and finite element analysis. The comparison of the results verifies the rationality of the method proposed in this work.
1. Introduction
At present, the Bohai oil field is the most productive offshore oil field in China, accounting for about 60% of the total offshore oil and gas production in China [1]. The oil fields in the Bohai Sea are mostly marginal and in frozen areas, where the water depth is 10–30 m. Hence, the ice-resistant platforms in the Bohai Sea are mostly constructed as jacket platforms for economic reasons [2]. Jacket platforms have a unique risk, which is also without precedent internationally. There have been several disasters caused by sea ice on oil platforms in the history of oil exploration in the Bohai Sea.
The design life of jacket platforms is 15–20 years in the Bohai Sea. Now, many platforms are approaching or have reached the end of their service life [1,2]. However, the cost of constructing a new platform is much higher than the cost of maintaining an existing platform in cost-saving terms. It is more economical to continue using platforms which are approaching or have reached the end of their service life than to reconstruct new platforms. Structural safety is the biggest problem for the continued service of the jacket platforms, where structural fatigue is the main considering factor affecting structural safety [3].
The recommended practice for planning, designing, and constructing fixed offshore structures in ice environments in American states is that “fatigue damage caused by ice loads needs to be evaluated when necessary” [4]. Because the study of dynamic ice force models and ice-induced fatigue environmental parameters is not mature, the different design codes lack specific conditions and methods for ice-induced vibration fatigue analysis [3]. Fang et al. [5] had conducted a lot of study on ice-induced fatigue analysis of ice-resistant platforms, including the study on fatigue properties of low-temperature steels, the calculation method of fatigue equivalent stress under ice loads, and ice-induced fatigue reliability. Because of the lack of fatigue performance analysis under ice loads in domestic and foreign codes, Fang et al. [6] proposed a new method for the combined calculation of equivalent stress amplitude, given the fatigue life curve of the tubular node and its calculation parameters. Braun et al. [7] studied the fatigue strength of butt-welded normal- and high-strength steel structures for sub-zero temperatures. Fatigue test results of SAW and MAG welded joints for temperatures down to −50 °C were analyzed. Bridges et al. [8] had proposed a fatigue design assessment procedure. The procedure includes ice loads and impact frequencies, structural stresses, fatigue performance at low temperatures, fatigue damage, etc. Liu et al. [9] calculated the ice-induced vibration response and fatigue life of the field platforms based on the Maattanen model [10,11] for ice-induced vibration of platforms. Based on field observations, Yue et al. [12] analyzed the importance of ice-induced fatigue life assessment for the ice-resistant platforms in the Bohai Sea and defined the method for the study of fatigue ice loads and ice environmental parameters on conical platforms. Zhang et al. [13] analyzed the interaction between ice and vertical-leg structures and proposed a fatigue life analysis procedure for vertical-leg platforms. Suyuthi et al. [14] proposed a systematic procedure for fatigue damage assessment in relation to ships navigating in ice-covered waters. The proposed procedure for fatigue damage assessment reflected the vibration in ice conditions, speed of vessel, and operational modes. Jeong-Hwan Kim et al. [15,16] applied a two-parameter Weibull model to describe the probability distribution of the stress amplitude, and the fatigue damage was obtained using the Palmgren–Miner rule and S-N curves. Wei et al. [17] applied the Weibull distribution and the three-parameter exponential distribution to approximate the distribution of the stress ranges due to ice loads actions, and they investigated the performance of the fatigue damage evaluation based on probabilistic distribution functions of the stress ranges. Hoyland et al. [18] evaluated the fatigue damage on fixed offshore structures under the drifting ice. Fatigue damage from a combination of loads from waves, wind, and ice was investigated by evaluating simulated time-series of the different loads.
All the above research results have played a certain role in promoting the ice-induced fatigue damage assessment of structures. However, there are great uncertainties and errors in the existing fatigue damage evaluation of offshore platforms, including fatigue loadings, fatigue environmental conditions and analysis of fatigue hot spot stress. Numerical simulations are used to evaluate fatigue damage of platforms that have reached the end of their service life but continue to work. Yooil [19] proposed the analysis of fatigue hot spot stresses for welded joints by using 3D solid finite elements. Xu et al. [20] used numerical analysis method to study the ice-induced vibration response and fatigue damage of offshore platforms. Kim [21,22] proposed a simplified numerical simulation method to evaluate the fatigue of icebreakers. Because the loads of numerical analysis are simplified and assumed, and platforms that are approaching or have reached the service life cannot be modeled in detail, the evaluation results using numerical simulation methods cannot accurately reflect the fatigue damage of the platforms.
The load simplifications and assumptions of numerical analysis can be avoided in the field-based structural health assessment method. Hence, the fatigue damage of the field structures is reflected more accurately. The application in land-based engineering structures such as bridges, subways, tunnels, and foundation pits has become mature [23]. Nevertheless, it is hard to directly measure structural fatigue hot spot stress due to the challenging operating circumstances of offshore platforms. The hot spots of the platform structures are typically found at the jacket tubular nodes, which are usually underwater. Field monitoring suffers from low sensor survival rates, poor durability, and lack of system reliability, resulting in direct measurement of structural fatigue hot spot stress being impossible.
In this paper, the approximate linear relationship between the fatigue hot spot stress and the vibration response of the deck structure has been discovered. In addition, a fatigue damage assessment method for aging structures is proposed based on field observation. This method avoids the uncertainties of the fatigue environment conditions and the load model in numerical computation and gives more accurate fatigue damage results. Moreover, it will effectively reduce the technical requirements for field observation and improve the efficiency of fatigue damage calculation.
2. Dynamics Analysis for Jacket Platforms
There is a typical ice-induced vibration problem on jacket platforms in Bohai Sea, which requires dynamic analysis. The dynamic equilibrium equation is given as follows:
where m is the mass of the structure, c is the viscous damping of the structure, k is the lateral stiffness of the structure, a is the acceleration, v is the velocity, and x is the displacement.
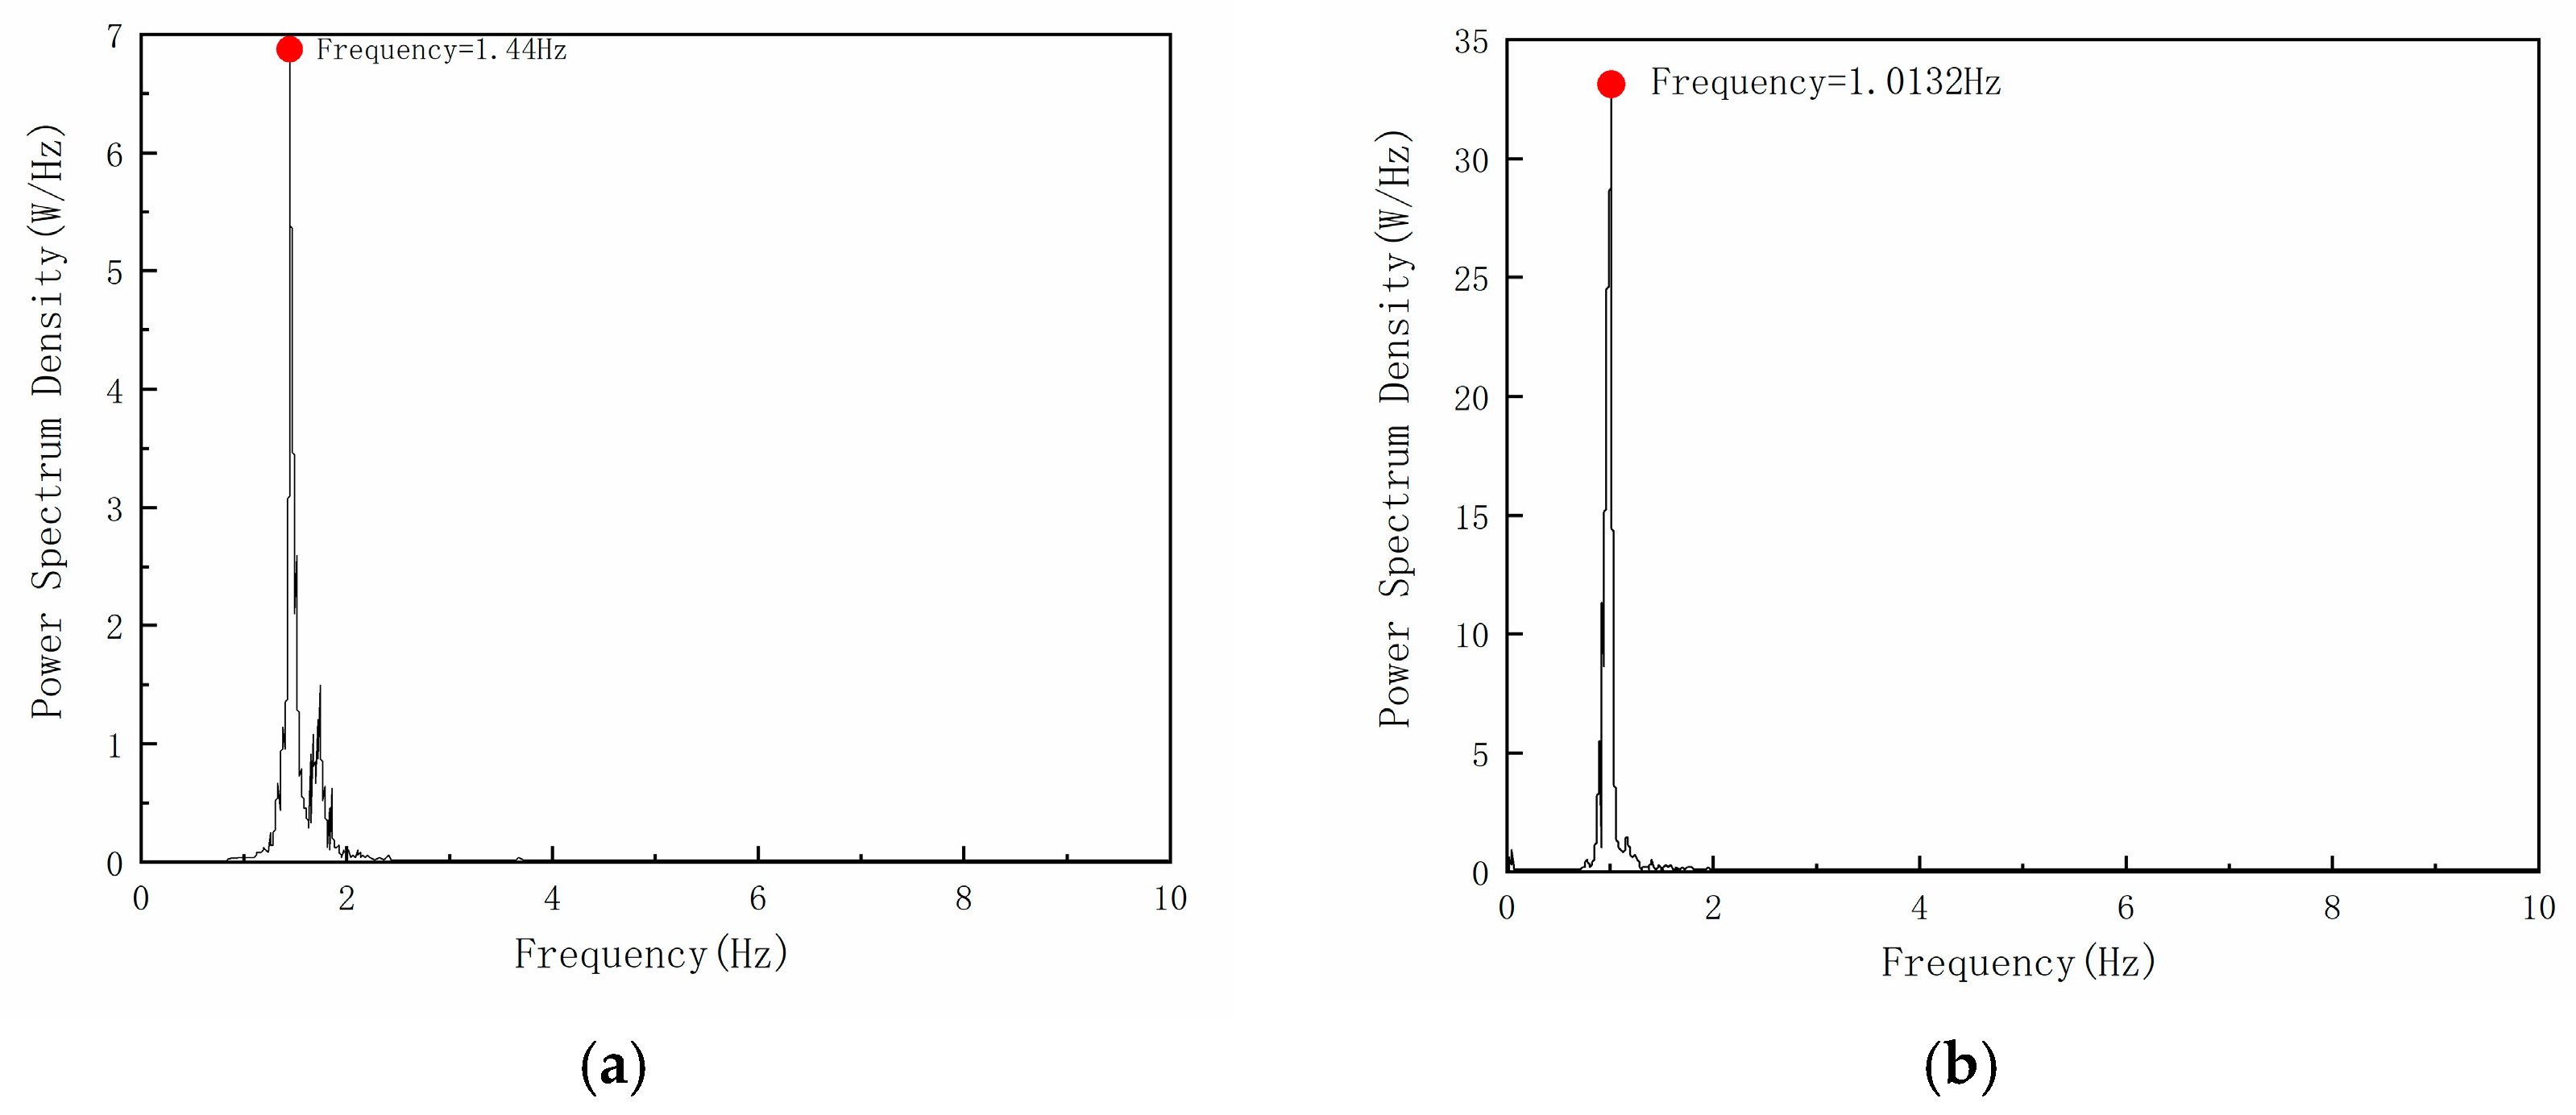
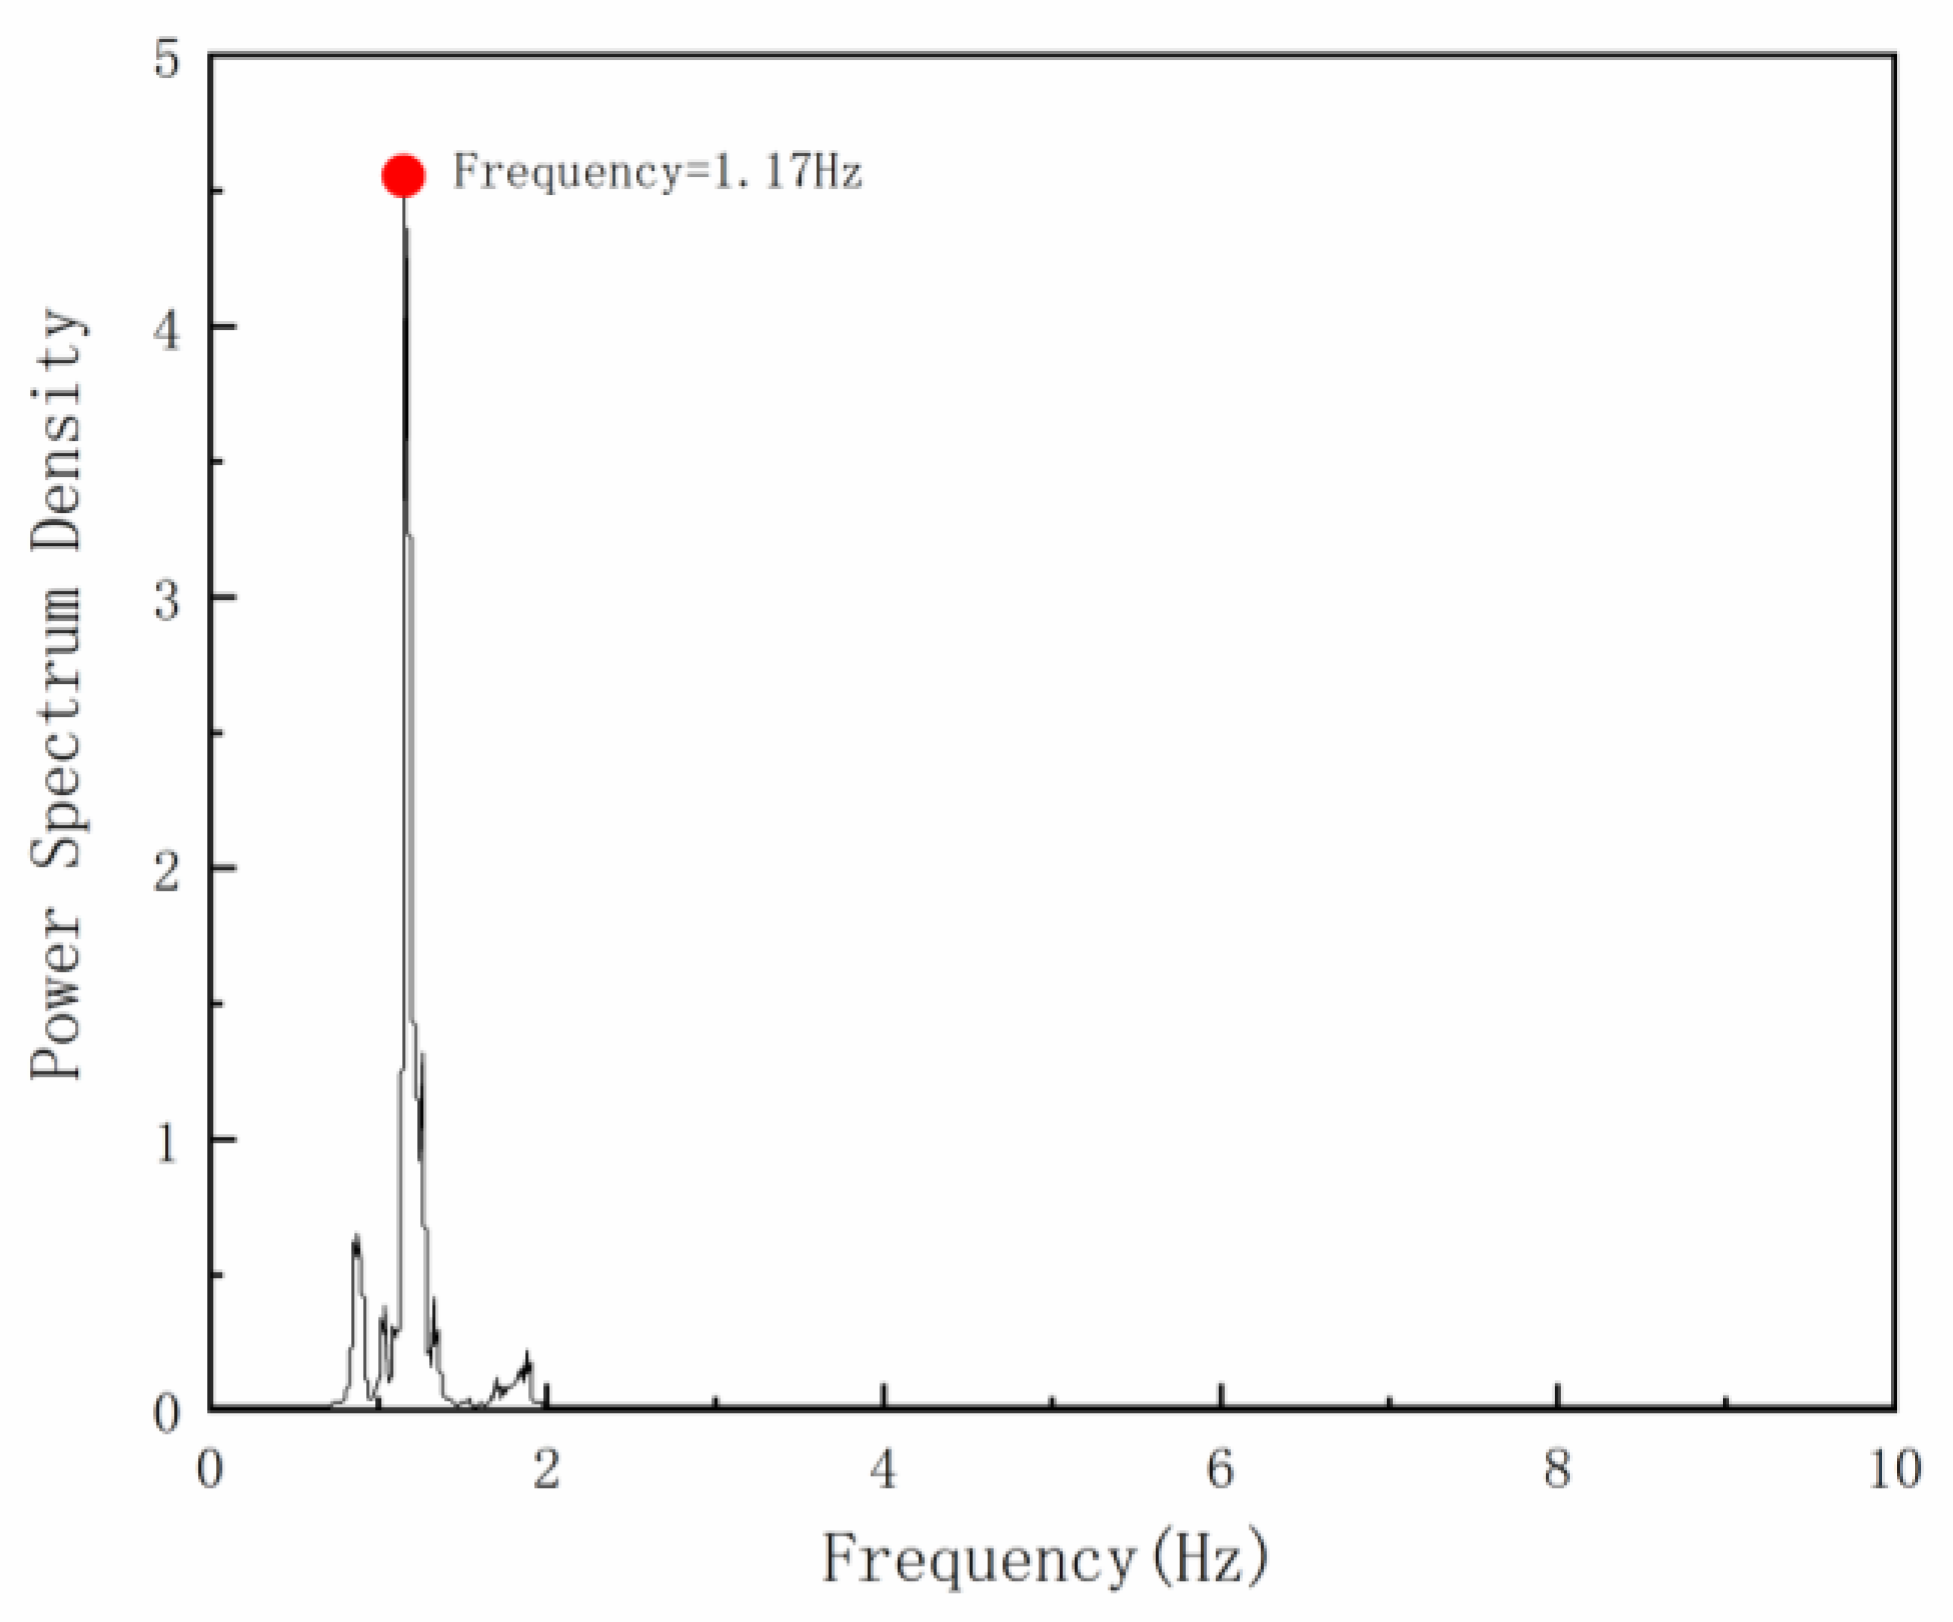
Based on field observations of several jacket platforms in Liaodong Bay, it is found that the structural vibration energy subjected to sea ice are mainly concentrated in the fundamental frequency of the structures, with a very small proportion of high-order frequency, whether the ice-resistant cone is installed or not. The typical power spectral density (PSD) of ice-induced vibration response is shown in Figure 1. The first mode shape of the structures is horizontal vibration, and the structural response is mainly in the elastic stage. Hence, the equivalent stiffness and equivalent mass can be used to simplify the complex offshore engineering structures into a cantilever beam system [24,25].

Figure 1.
Power spectrum of ice-induced vibration response: (a) The vertical jacket platforms. (b) The conical jacket platforms.
The jacket platform is simplified into a cantilever beam structure for analysis. Under the action of dynamic force F(t), the structure has a slight displacement, and the bending stress generated by the platform at the hot spot stress is as follows:
where is the force of ice-structure interaction; is the vertical distance between the position of the hot spot stress and the force acting position; is the distance between the position of the hot spot stress and the neutral axis of the whole jacket; is the inertia axis of the cross section to the neutral axis; and SCF is stress concentration factors.
The displacement at the hot spot stress of the platform and the displacement of the deck’s response can be expressed as:
where is the distance between the position of the hot spot stress and the bottom of the platform; is the distance of the position between where the ice acts on the structure and the bottom; is the height of the platform; and is the elastic modulus of the platform. is also the maximum displacement of the platform structure.
Here, the mode shapes factor is introduced [26]. Within the linear elastic range, the structural response can be transformed into displacement mode shapes:
where , which is the order relative displacement response vector of the structure; is the corresponding mode shapes matrix; ; .
Actually, a mode shape of the structure is the vector of characteristic offset shape of the undamped structure corresponding to a certain frequency under a certain initial condition, that is, the mode shape is not the displacement of each degree of freedom, but only the ratio of displacement.
Then, under the first mode shape, the displacement of the jacket platform at the hot spot stress and the displacement of the deck response can be expressed as:
where is the mode shapes factor at the hot spot stress, and is the mode shapes factor of the deck response. When , the mode shapes factor at all points of the structure are constant.
Combining Equations (2), (4), and (6), can be expressed as:
Simplify the equation, is as follows:
. When the position of the hot spot stress was determined, H is a constant.
It can be seen from Equation (8) that there is an approximate linear relationship between the structural hot spot stress and the deck response displacement. The standard deviation of the deck response displacement and hot spot stress of Equation (8) can be obtained as follows:
It can be seen that the statistical analysis of the measured data will not affect the linear relationship between the response data of the deck part and the hot spot stress.
3. Fatigue Damage Assessment Method of Jacket Platforms
At present, the fatigue analysis in structural fatigue damage assessment is relatively mature. According to the recommendations of major domestic and foreign design codes, this method is widely used in fatigue damage and life assessment of offshore engineering structures. The process of the fatigue analysis is as follows: determining the random ice force function in different ice conditions, calculating the time history of hot spot stress in different ice conditions, the rain-flow counting method [27] statistics the stress cycle, and the cyclic number, and combining with the Palmgren–Miner rule and S-N curves to study the ice-induced fatigue damage assessment method of offshore platforms with field observation.
3.1. Calculation Procedure for Fatigue Analysis from Field Observation
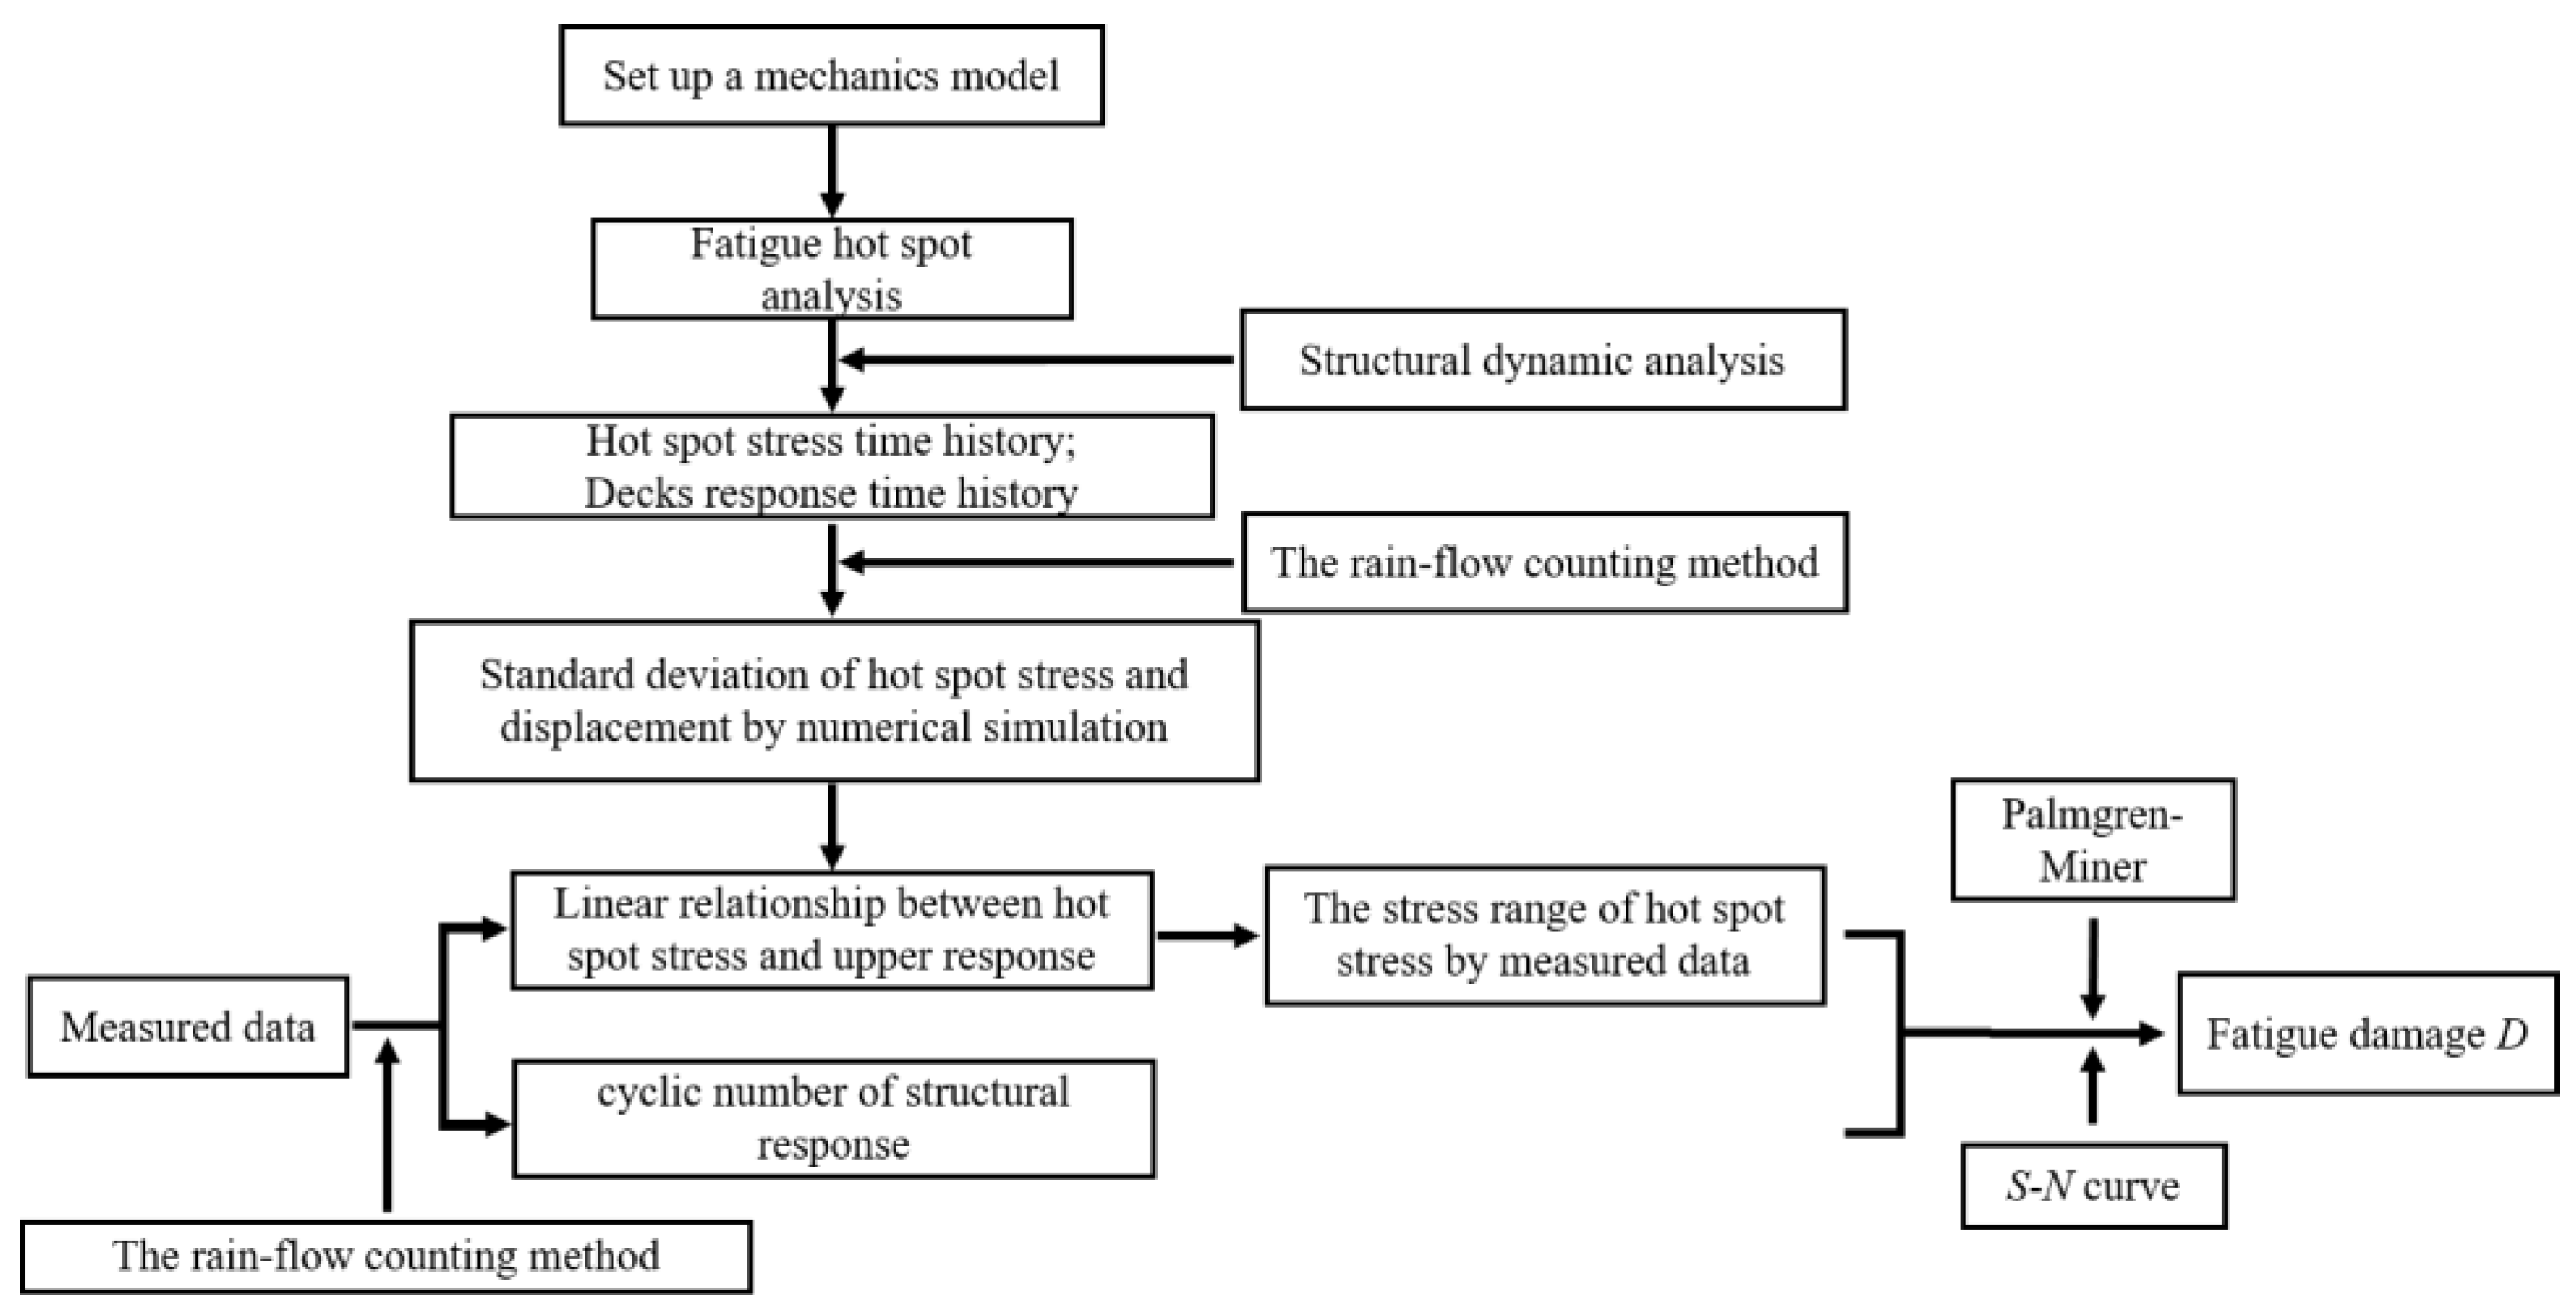
According to the fatigue analysis, the standard deviation of hot spot stress and the cyclic number are the key parameters to assess the fatigue damage of the structures. In order to evaluate the fatigue damage of jacket platforms accurately, it is necessary to set up an approximate mathematical relationship between the structural response and the hot spot stress in standard deviation, then obtain the fatigue stress parameters from field observation of the structure, and finally evaluate the fatigue damage of the structures based on the Palmgren–Miner rule and S-N curves. The fatigue evaluation process is shown in Figure 2, and the main steps are as follows:

Figure 2.
Calculation procedure for fatigue damage analysis of structures from field observation.
- Set up a finite element model, and a mechanical model is established based on geometrical and physical properties of the structure, so as to ensure that the stiffness, total mass, and damping of the model are basically consistent with the field structure (in service).
- Make sure of the position of the hot spot stress of the platform.
- Set up an approximate mathematical relationship between the vibration response of the deck platform and the hot spot stress, considering environmental factors such as ice thickness, ice velocity, ice drifting direction, and action height of sea ice, and calculate the ice vibration response (displacement, velocity, acceleration) and hot spot stress of the structure based on the random ice force function. Using statistical method, a simplified mathematical relationship between the response of the structure and the fatigue hot spot stress in standard deviation is obtained.
- Fatigue damage assessment: the standard deviation and cyclic number of the structural response time history is obtained from field observation, the standard deviation of the structural fatigue stress are obtained according to the mathematical relationship established in step (3), and the fatigue damage of the structure in this observation period is analyzed with the Palmgren–Miner rule and S-N curves.
3.2. The Palmgren–Miner Rule
The fatigue damage at the selected point in the structures during a stationary short-term condition can be evaluated by applying the linear Palmgren–Miner equation, which is given by the following expression [28]:
Its failure criterion is as follows:
where D is the fatigue damage accumulated during the stationary short-term condition, is the number of stress cycles for the stress range , which is given by the spectrum of load, and is the number of stress cycles to failure for the stress range , which is given by S-N curves.
3.3. S-N Curves
Based on the known stress range S of the material, the equation for calculating the fatigue life N of the structure suggested in “Planning, Design and Construction of Fixed Offshore Platforms-Working Stress Design” is as follows [28]:
where is the stress amplitude. The parameters are shown in Table 1. The curve of X in Table 1 is applicable to the joints with smooth penetration welding of adjacent parent metals and control of weld appearance. If the profile control is improper, the curve of X’ is recommended.

Table 1.
S-N curves parameters.
Theoretically, the stress amplitude is determined by the local stress , but the local stress is very difficult to obtain; the hot spot stress is often used instead of in engineering. The calculation equation of hot spot stress is [29]:
where SCF is stress concentration factors, same as Equation (2); is nominal stress.
4. Fatigue Damage Analysis by Field Monitoring
A jacket platform in Jz20-2 sea area of Liaodong Bay, Bohai Sea, China is taken as an example. This structure is a typical four-leg ice-resistant structure with ice-resistant cones installed at the waterline of the legs. The finite element model is established with ANSYS, which is used to calculate the fatigue damage. SHELL181 element is used for the jacket of the structure, and the model has 22,909 elements. The mesh sizes of 0.05 m, 0.08 m, 0.1 m, 0.3 m, and 0.5 m are considered respectively. The ice force acting on the structure is 1157.1 KN. Table 2 shows the results of the maximum stress and displacement response. It shows that the results tend to be stable respectively for mesh sizes of 0.05 m, 0.08, and 0.1 m. Therefore, the mesh size of the finite element model is 0.1 m in this paper. Since the upper decks of the structure do not need to consider fatigue, the upper decks use BEAM188 element, and the weight of upper decks use MASS21 element. The pile–soil interaction is simulated using an equivalent pile, in which the length of the equivalent pile is six times the diameter of the pile [30], and the structural damping ratio is 0.02. The platform bottom constrains all degrees of freedom.
Table 2.
Results of different mesh sizes.
Table 3 presents the natural frequencies of the first three modes. The first-order mode is swing along the X-axis, the second-order mode is swing along the Y-axis, and the third-order mode is twist around the Z-axis. Figure 3 shows the measured first frequency. The first frequency is 1.11 Hz in the model, and the measured first frequency is 1.17 Hz. The error value between them is small, which may indicate the accuracy of the model.
Table 3.
Results of the first 3 modes analysis of the structure.

Figure 3.
Vibration acceleration response spectrum of platform in J20-2.
4.1. Find Position of the Hot Spot Stress
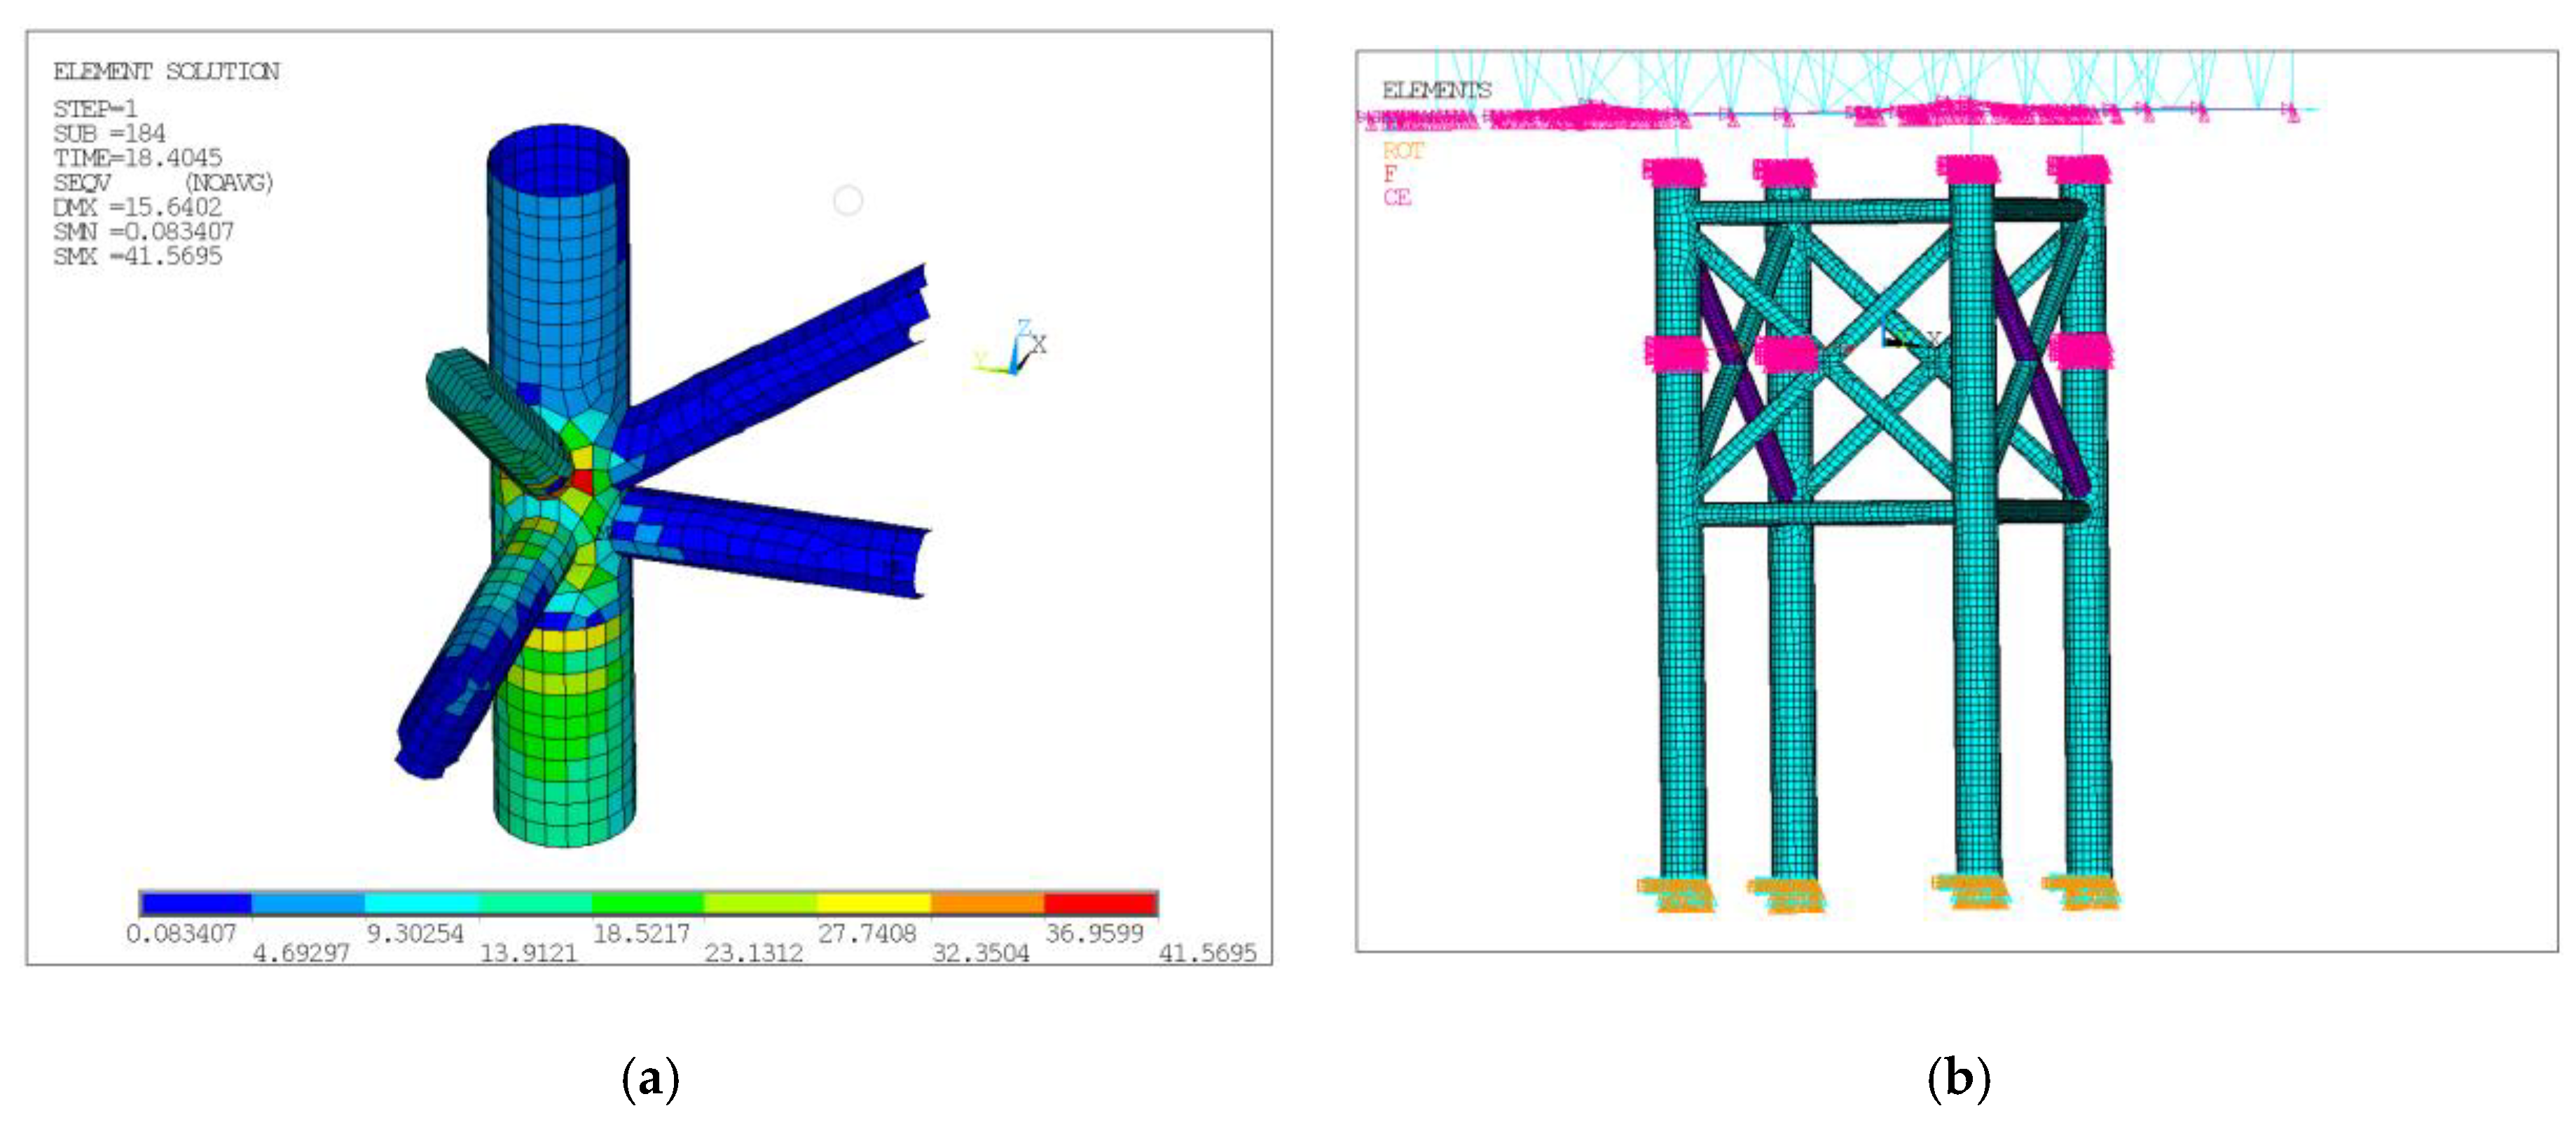
The hot spot stress is the maximum value of the stress amplitude under alternating load. For welded joints, the structural stresses are local stresses calculated immediately adjacent to the welded front without considering notch effects. The fatigue hot spots of jacket platforms are mostly found at the welded joints based on the finite element analysis, which can be regarded as K-type connections. Figure 4a shows a locally enlarged stress diagram. Fatigue hot spots are located on the outside of the weld on the pile leg and horizontal and diagonal braces under the waterline. The arrows can be seen in Figure 4b to show the position of the forces on the model. The axes in Figure 4 are waterline positions. The hot spot stresses of the structure are calculated directly using shell elements for finite element modelling. The pile legs of the jacket structure apply SHELL181 element in this paper, which has been considered for stress concentrations. Therefore, the stress results of the model are fatigue hot spot stress.

Figure 4.
The position of fatigue hot spots: (a) Local zoomed-in stress figure; (b) The position of the forces on the model.
It is necessary to set up the mathematical relationship between the standard deviation of the fatigue hot spots and the structure response. Due to the variation of ice conditions in the frozen sea areas in northern China, ice thickness, ice velocity, ice drifting direction, and action height of sea ice are all taken into account. Then, the mathematical relationship between them in terms of standard deviation is determined.
4.2. Set up the Mathematical Relationships
4.2.1. Ice-Induced Vibration Response Analysis
Under extreme ice conditions, the conical structures can induce severe ice-induced vibrations. In the structural response, dynamic amplification is observed. Consequently, the flexural failure frequency of sea ice is near to the natural frequency of the structure in the typical ice condition, where ice thickness is 0.1 m and ice velocity is 0.08 m/s. The time history data included displacement, velocity, and acceleration, and the fatigue hot spot stress of the platform is obtained using a numerical model. The standard deviation of the fatigue hot spot stress and the structure response are calculated using the rainflow counting method. Figure 5 shows the relationships between the fatigue hot spot and the structural response in standard deviation.
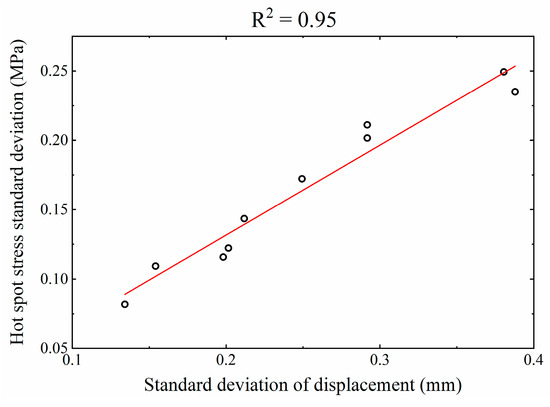
Figure 5.
Standard deviation results between decks displacement response and hot spot stress.
R2 is the correlation coefficient, which refers to evaluating the fitting degree of the regression model. It has been found that the standard deviation fitting R2 is 0.95. Iversen and Gergen [31] showed a strong positive correlation when the fitting R2 was between 0.7 and 1. The fitting R2 is between 0.9 and 1 for more accurate fatigue damage assessment results in this paper. There is a clear linear relationship between displacement and hot spot stress in standard deviation.
4.2.2. Analysis of Environmental Factors
Due to the freezing situation in northern China in winter, it is necessary to consider the influence of ice thickness, ice velocity, ice drifting direction, and action height of sea ice on the relationship between displacement and hot spot stress.
Current study found that the ice thickness is less than 20 cm, and the maximum ice velocity is generally less than 70 cm/s based on the field observation over several years in Liaodong Bay. Therefore, the ice thickness is chosen as 0.08 m, 0.15 m, and 0.2 m, the ice velocity is chosen as 0.04 m/s, 0.1 m/s, 0.3 m/s, 0.6 m/s, and 0.8 m/s, respectively, and the 15 groups of data are obtained. Every ice condition only has a group of data.
The jacket platform has four legs, and the legs are arranged symmetrically. The direction of sea ice is 0°to the north and rotates 180°clockwise to the south. Thus, the direction of sea ice is chosen as 0°, 30°, 45°, 60°, and 90°, ice thickness is chosen as 10 cm, and ice velocity is chosen as 10 cm/s. Ten groups of data have been obtained. Every ice direction has two groups of data.
Based on field observation over several years, it is found that the action height of sea ice in winter is close to 4 m, which leads to the change of the interaction position between ice and structure. Action height of sea ice selects the position, where the design waterline moves up by 1 m and down by 1 m, and the eight groups of data are obtained. The four groups of data are selected in every action height of sea ice.
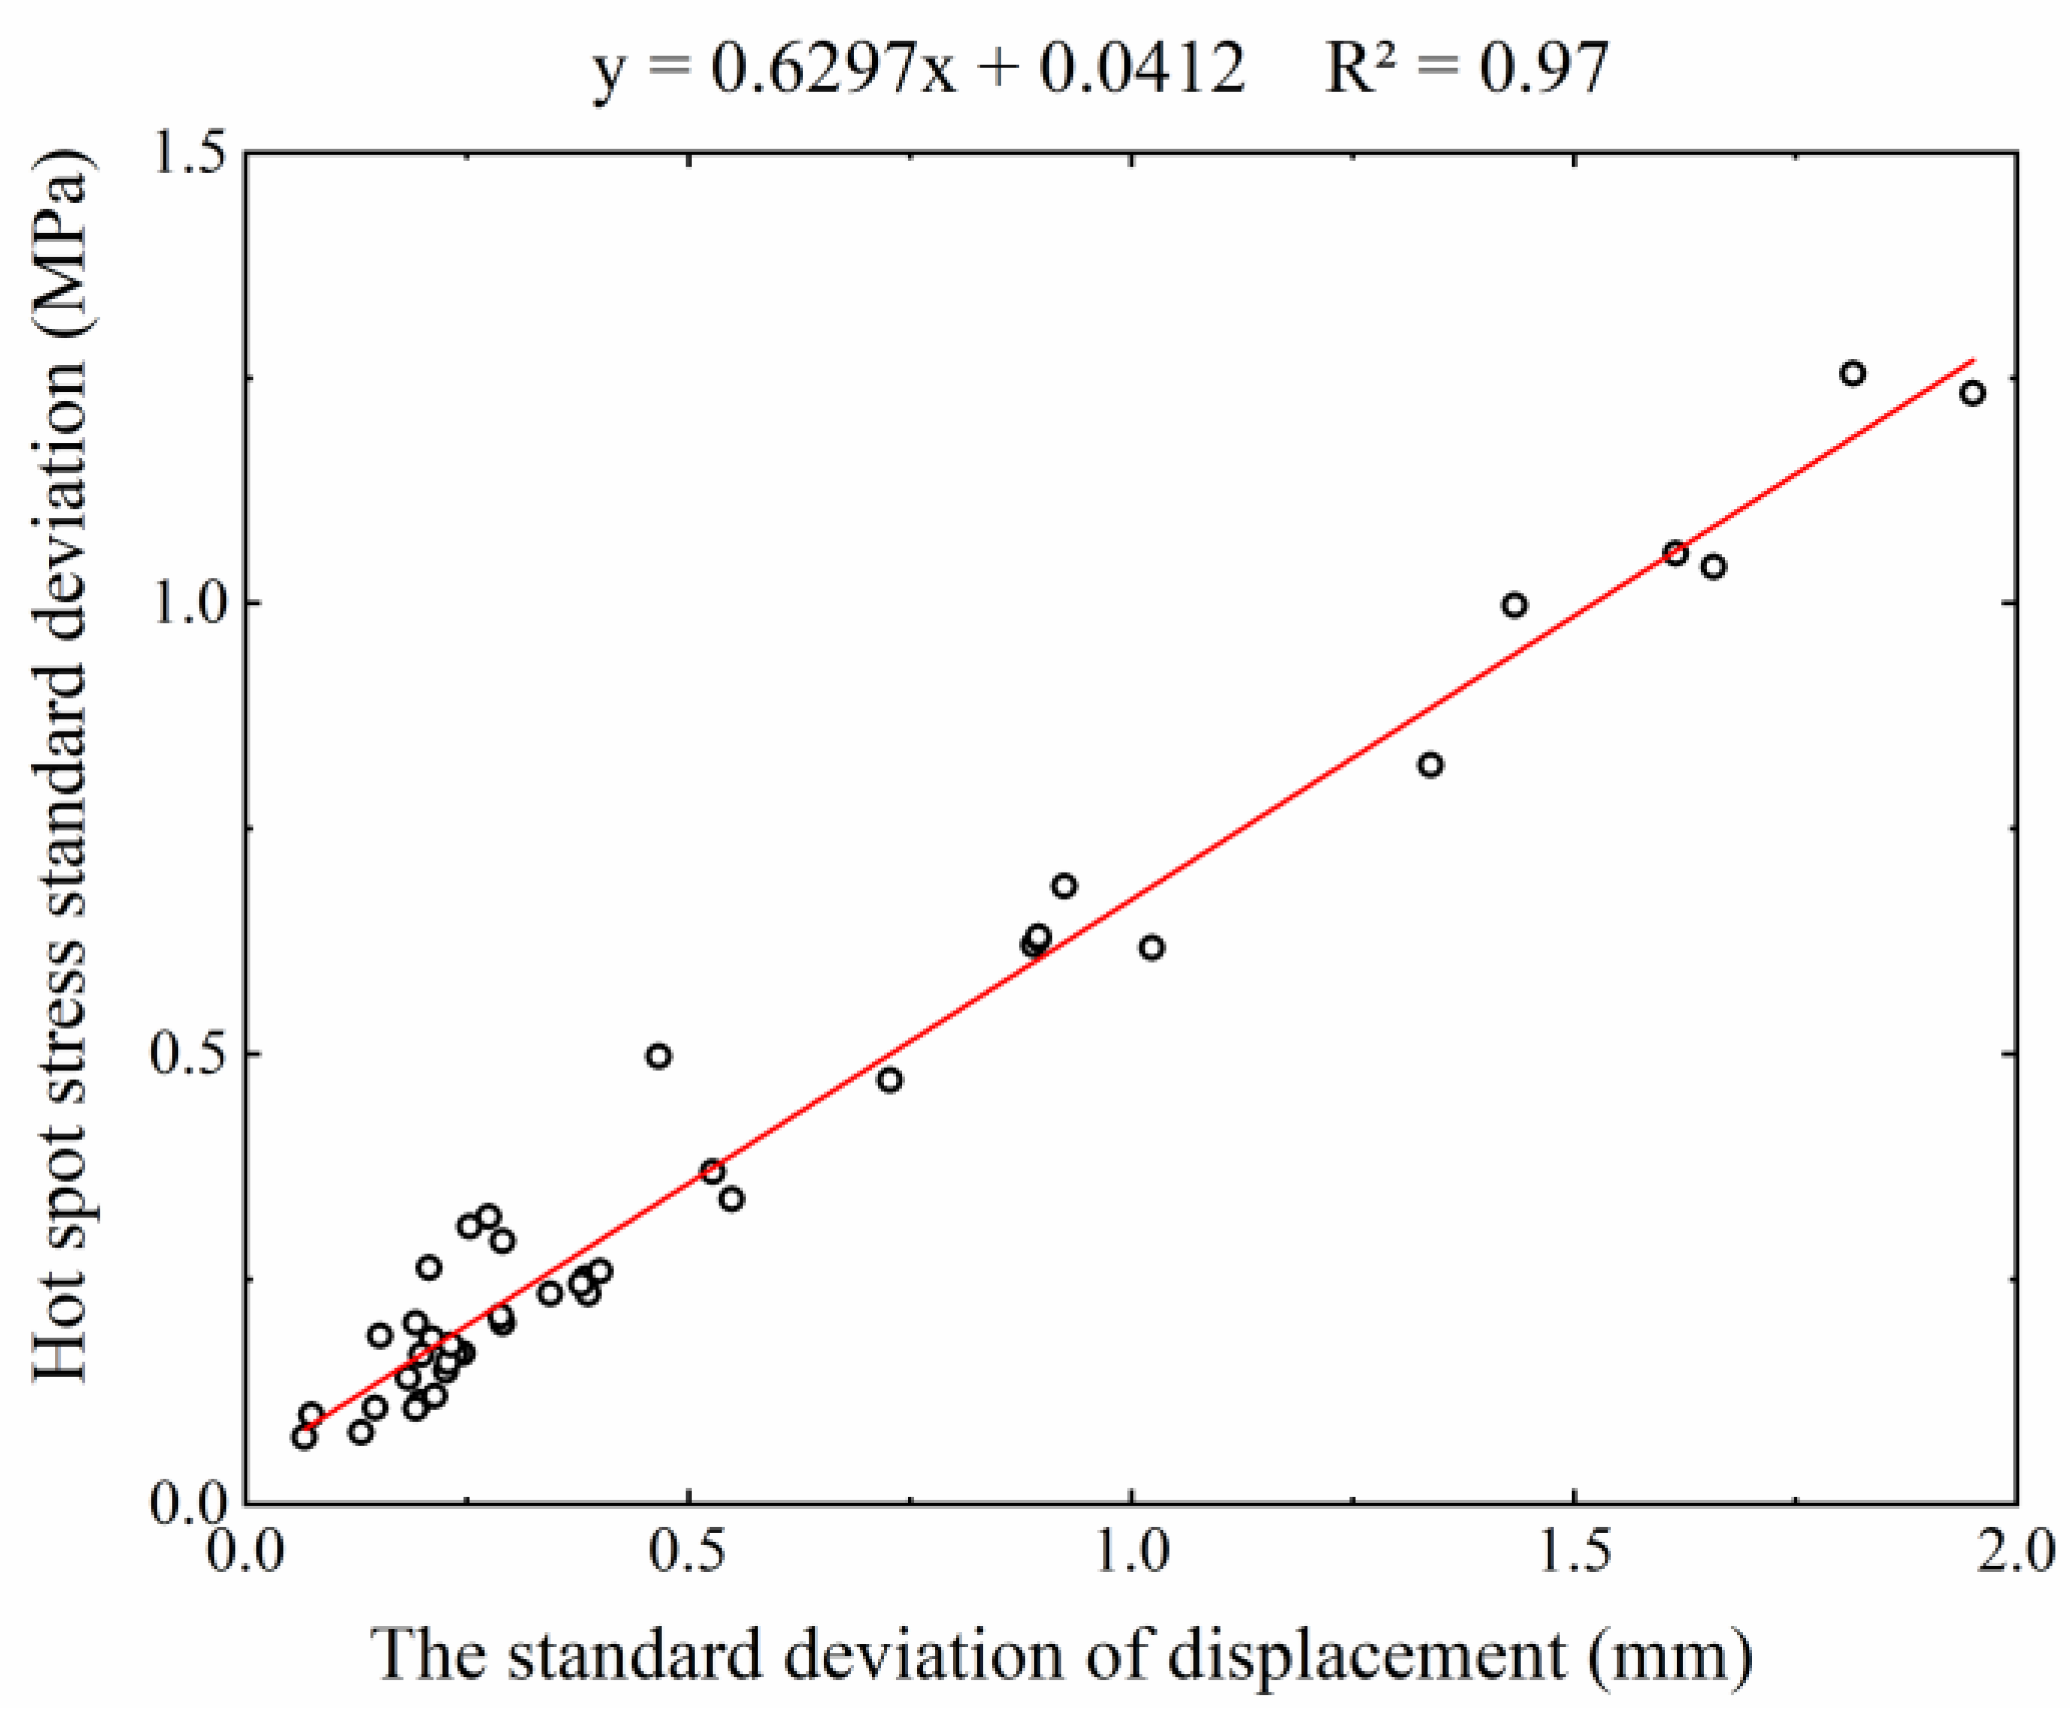
Based on the numerical computation, the hot spot stress and vibration response displacement of the structure are obtained, and the standard deviation of data is calculated. Combining all the above-mentioned influence analysis in Section 4.2.1 and Section 4.2.2, 43 groups of data are summarized. The standard deviation relationship between hot spot stress and displacement is shown in Figure 6.
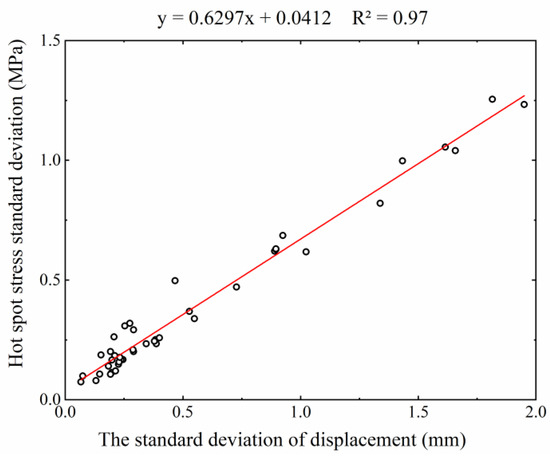
Figure 6.
The results between standard deviation of response displacement and hot spot stress.
It is found that the standard deviation fitting R2 of displacement-stress is 0.97. As such, the relationships between the displacement of the structural response and hot spot stress are linear under the action of different ice direction, ice thickness, ice velocity, and action height of sea ice. This study also shows that ice condition, ice direction, and action height of sea ice have no significant influence on the relationship.
All data are summarized and fitted into linear equations. The mathematical equation is given as follows:
where is the standard deviation of hot spot stress (MPa) and is the standard deviation of the displacement (mm).
For complex stress states, the equivalent stress can be used to evaluate the fatigue damage of the structure [32]. Combined with the code [33], the equivalent stress amplitude of the hot spot is obtained by applying SHELL elements to model the tubular nodes based on finite element analysis. As this stress is generally positive and cannot reflect the alternating stress during vibration with positive and negative values, the stress range for fatigue is twice the stresses calculated. This paper establishes a linear relationship between the standard deviation of the platform vibration displacement response amplitude and the standard deviation of the hot spot stress amplitude by numerical simulation. In this paper, it is considered that the cyclic number of platform vibration response and the cyclic number of fatigue stresses are approximately equal.
4.3. Fatigue Damage Analysis of Platform
4.3.1. Decks Response of Field Observations
In the winter of 2020–2021, structural vibration sensors and one camera are arranged on the platform decks, as shown in Figure 7. The sensors are arranged in the horizontal direction and are installed vertically to each other on the top deck. Y-axis is the main sea ice direction, as shown in Figure 7. The sensors are used to collect the vibration data. The camera installed on the bottom floor of the deck is used to record the ice thickness and ice velocity.
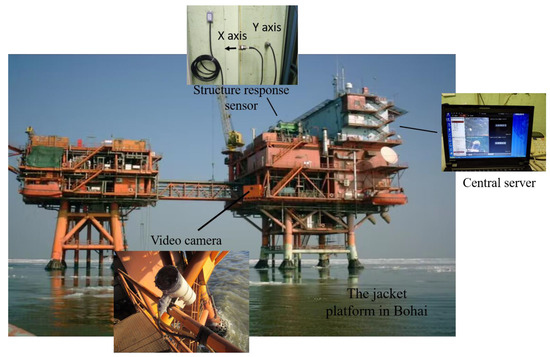
Figure 7.
Field arrangement.
4.3.2. Results of Fatigue Damage and Discussion
With the measured data in winter of 2020–2021 (sampling rate at 10 Hz), the ice vibration fatigue damage assessment of jacket platform structures is carried out. Each set of data corresponds to typical ice conditions: the ice thickness is 16–20 cm, the ice velocity is 40 cm/s, and each set of data lasts approximately 10 min. The standard deviation and cyclic number of the vibration time history data are calculated using the rainflow counting method. Fatigue damage of the structure is calculated based on the cyclic number of structural vibration response and the stress range of the equivalent stress. Table 4 shows the results.
Table 4.
Results of the time history data.
Then, based on the Palmgren–Miner rule and the S-N curve data, the accumulated fatigue damage of the structure for each set of vibration time history data is calculated and can be found in Table 4. The spectral analysis method is widely used in fatigue evaluation of offshore engineering structures. The spectral analysis method is mainly used to obtain the stress range probability density distribution of fatigue hot spots by calculating the hot spot stress response spectrum [34]. To verify the reliability of results evaluation method based on field observations, the ice conditions corresponding to the measured time period, with the average ice thickness of 18 cm and the ice velocity of 40 cm/s, the fatigue damage of the structure within 10 min is 1.6 × 10⁻⁶ by the spectral analysis method, and the result is shown in Table 5.
Table 5.
Results of structural fatigue damage.
It is obviously shown that the results of this method are consistent with the method of spectral analysis. The main reasons why the fatigue damage evaluation results by field observation are greater than the spectral analysis are as follows: (1) In spectral analysis, the cyclic number of hot spot stress is estimated based on the natural frequency of the structure, which is less than the real cyclic number under high ice velocity. (2) There is a certain degree of resistance attenuation in the field structure. (3) The fatigue damage evaluation method by field observation considers the differences in the structural ice-induced vibration response caused by ice condition, ice direction, and action height of sea ice. (4) The sea ice load has great randomness. In this paper, the ice condition of the spectral analysis methods is ice thickness of 18 cm and ice speed of 40 cm/s; the ice condition of the methods proposed in this paper is ice thickness of 16–20 cm and ice speed of 40 cm/s. The differences of ice thickness lead to some error between the results of the methods proposed in this paper and the results of the spectral analysis methods. (5) The action direction of sea ice is random. The spectral analysis method considers the forces of two pile legs; however, there may be more than two pile leg forces in field observation. The spectral analysis method may not be able to take into account some uncertainties, and these will lead to smaller fatigue damage results obtained from spectral analysis calculations. Hence, the structural fatigue damage proposed in this paper is more accurately reflected than by spectral analysis.
5. Conclusions
In this study, an ice-induced fatigue damage evaluation method for aging structures based on field observation is proposed in Bohai Sea. A simplified linear relationship between structural vibration response and fatigue hot spot stress is set up based on numerical simulation. Then, fatigue damage evaluation of structures using measured data by field observation and the Palmgren–Miner rule is carried out. This method avoids the uncertainties of the fatigue ice loads models, sea ice fatigue parameters, and numerical simulations, and gives more accurate results of the hot spot stress in the field structure. Eventually, an example analysis is carried out using a typical jacket platform in Bohai Sea; the results show the following:
- (1)
- There is an obvious linear relationship between the displacement response at the deck and the hot spot stress for standard deviation.
- (2)
- A series of numerical simulations are carried out for the various analysis cases considering the ice thickness, ice velocity, ice direction, and action height of sea ice. As a result, these factors do not have a significant effect on the linear relationship.
- (3)
- The fatigue damage results calculated with the proposed method are compared with the results obtained by the spectral analysis method. In this paper, the method has considered the real ice conditions and structural conditions. Therefore, it more accurately reflects extent of fatigue damage to the aging structure.
- (4)
- The discovery of the linear relationship can effectively avoid errors in numerical simulations, calculate the fatigue damage of the structure more quickly, and evaluate the safety performance of the structure. Furthermore, the research provides a basis for achieving the systematic management of sea ice.
Author Contributions
Y.H.: Formal analysis, Visualization, and Writing—Original Draft; S.Y.: Resources, Software, Methodology and Writing—Review and Editing; T.A.: Software, Data curation, Investigation and Writing—Original Draft; G.W.: Methodology, Formal analysis and Writing—Review and Editing; D.Z.: Conceptualization, Writing—Review and Editing, and Supervision. All authors have read and agreed to the published version of the manuscript.
Funding
This work was supported by the National Natural Science Foundation of China (Grant No.52071055), and the Fundamental Research Funds for the Central Universities (Grant No. DUT22QN237).
Institutional Review Board Statement
Not applicable.
Informed Consent Statement
Not applicable.
Data Availability Statement
Not applicable.
Conflicts of Interest
The authors declare no conflict of interest.
References
- Wan, S.L. Assessment of Structural Safety and Design Optimization for Jacket Offshore Platform. Master’s Thesis, Dalian University of Technology, Dalian, China, 2019. [Google Scholar] [CrossRef]
- Zhang, D.Y.; Yue, Q.J.; Li, H.H.; Zhang, Y.J.; Xu, T. Structural safety ensuring system of offshore platforms in the ice zone based on full-scale measurement. In Proceedings of the China Mechanics Congress 2011 and the 100th Anniversary of Qian Xuesens’ Birth, Harbin, China, 22 August 2011. [Google Scholar]
- Zhang, D.Y. Performance Based Risk Design Research of Ice-Resistant Jacket Structures. Ph.D. Thesis, Dalian University of Technology, Dalian, China, 2007. [Google Scholar] [CrossRef]
- API RP 2N (E1988). Recommended Practice for Planning, Designing, and Constructing Fixed Offshore Structures in Ice Environments. Available online: https://www.api.org (accessed on 15 October 2022).
- Fang, H.C.; Xu, F.Y.; Chen, G.M. A New Method for Calculating Fatigue Life of Pipe Joints of Offshore Platforms in Ice Area. China Offshore Platf. 1997, 12, 259–264. [Google Scholar]
- Fang, H.C.; Xu, F.Y.; Chen, G.M. Fatigue Life Estimation of Pipe Joints of Offshore Fixed Platforms under Random Ice Loads. J. China Univ. Pet. 1997, 21, 50–54. [Google Scholar] [CrossRef]
- Braun, M.; Milakovic, A.S.; Ehlers, S.; Kahl, A.; Willems, T.; Seidel, M.; Fischer, C. Sub-Zero Temperature Fatigue Strength of Butt-Welded Normal and High-Strength Steel Joints for Ships and Offshore Structures in Arctic Regions. In Proceedings of the ASME2020 39th International Conference on Ocean, Offshore and Arctic Engineering, Fort Lauderdale, FL, USA, 28 June–3 July 2020. [Google Scholar] [CrossRef]
- Zhang, S.; Bridges, R.; Tong, J. Fatigue Design Assessment of Ship Structures Induced by Ice Loading—An introduction to the Ship Right FDA ICE Procedure. In Proceedings of the Twenty-first International Offshore and Polar Engineering Conference, International Society of Offshore and Polar Engineers, Maui, HI, USA, 19–24 June 2011. [Google Scholar]
- Liu, J.; Chen, G.M. Ice-induced fatigue analysis of offshore structures based on Määttanen model. J. China Univ. Pet. 2004, 28, 89–94. [Google Scholar] [CrossRef]
- Manttanen, M.P. Advances in ice mechanics in Finland. Appl. Mech. Res. 1987, 40, 1200–1207. [Google Scholar] [CrossRef]
- Blenkarn, K.A. Measurement and analysis of ice forces on Cook Inlet structures. In Proceedings of the Offshore Technology Conference, Houston, TX, USA, 22–24 April 1970; Volume 2, pp. 365–378. [Google Scholar] [CrossRef]
- Liu, Y.; Yue, Q.J.; Qu, Y.; Wang, R.X.; Yu, X.B. Estimation of ice-reduced fatigue life for ice-resistant jacket platforms. Ocean Eng. 2006, 24, 15–19. [Google Scholar] [CrossRef]
- Zhang, D.Y.; Liu, D.; Xu, N.; Yue, Q.J.; Guo, F.W. Fatigue life analysis of the vertical legs jacket platform induced by ice vibrations. Ocean Eng. 2015, 33, 35–44. [Google Scholar] [CrossRef]
- Suyuthi, A.; Leira, B.J.; Riska, K. Fatigue damage of ship hulls due to local ice-induced stresses. Appl. Ocean Res. 2013, 42, 87–104. [Google Scholar] [CrossRef]
- Jeong, H.K.; Yooil, K. Numerical Simulation on the Ice-induced Fatigue Damage of Ship structural Members in Broken Ice Fields. Mar Struct. 2019, 66, 83–105. [Google Scholar] [CrossRef]
- Jeong, H.K. Development of the Analysis Procedure for the Ice-Induced Fatigue Damage of a Ship in Broken Ice Fields. J. Offshore Mech Arct. 2020, 142, 061601. [Google Scholar] [CrossRef]
- Wei, C.; Leira, B.J.; Arvid, N. Short-term Extreme Ice Loads Prediction and Fatigue Damage Assessment for an Icebreaker. Ships Offshore Struct. 2018, 13, 127–137. [Google Scholar] [CrossRef]
- Høyland, K.V.; Nord, T.; Turner, J.; Hornnes, V.; Gedikli, E.D.; Bjerkås, M.; Hendrikse, H.; Hammer, T.; Ziemer, G.; Stange, T.; et al. Fatigue damage from dynamic ice action—The FATICE project. In Proceedings of the 26th International Conference on Port and Ocean Engineering under Arctic Conditions, Moscow, Russia, 14–18 June 2021. [Google Scholar]
- Yooil, K.; Jung, S.O.; Seock, H.J. Novel hot spot stress calculations for welded joints using 3D solid finite elements. Mar Struct. 2015, 44, 1–18. [Google Scholar] [CrossRef]
- Xu, H.; Chai, J.K. Numerical analysis of ice-induced vibration response of offshore platforms. Pet Eng. Constr. 2020, 46, 1–7. [Google Scholar] [CrossRef]
- Yooil, K. Estimation of the Fatigue Damage for an Ice-going Vessel under Broken Ice Condition Part I—Direct Approach. J. Soc. Nav. Archit. Korea 2019, 56, 217–230. [Google Scholar] [CrossRef]
- Yooil, K. Estimation of the Fatigue Damage for an Ice-going Vessel under Broken Ice Condition Part II—Simplified Approach. J. Soc. Nav. Archit. Korea 2019, 56, 231–241. [Google Scholar] [CrossRef]
- Wang, J.H. Research status and prospect of structural health monitoring standards at home and abroad. Constr. Saf. 2021, 36, 41–45. [Google Scholar] [CrossRef]
- Zhang, D.Y.; Yue, Q.J.; Che, X.F.; Liu, Y.; Li, H.H. Dynamic characteristics analysis of ice-resistant jacket platforms in Bohai Sea. Ocean Eng. 2010, 28, 18–24. [Google Scholar] [CrossRef]
- Li, G.; Zhang, D.Y.; Yue, Q.J.; Spurgeon, E.C. An efficient approximate algorithm for global reliability analysis of offshore platforms in ice regions. J. Dalian Univ. Technol. 2008, 48, 157–161. [Google Scholar] [CrossRef]
- Lee, G.; Lee, J.W. Estimation of Mode Participation Factor of Vibration Response Using Convolutional Neural Network Model. J. Korean Soc. Mech. Eng. 2021, 45, 1109–1116. [Google Scholar] [CrossRef]
- Vaibhav, S.; Jyoti, J.; Asim, T.; Sushil, M. Modified Rain flow Counting Algorithm for Fatigue Life Calculation. In Fatigue, Durability and Fracture Mechanics; Springer: Singapore, 2017; pp. 331–387. [Google Scholar] [CrossRef]
- SY/T 10030-2018. Recommended Practice for Planning Designing and Constructing Fixed Offshore Platform. 2018. Available online: https://std.samr.gov.cn/hb/search/stdHBDetailed?id=8B1827F2636DBB19E05397BE0A0AB44A (accessed on 18 October 2022).
- DNV (E2001). Recommended Practice DNV-RP-C203 Fatigue Strength Analysis of offshore Steel Structures. Available online: https://www.dnv.com/ (accessed on 20 October 2022).
- Thieken, K.; Achmus, M.; Lemke, K. A new static p-y approach for piles with arbitrary dimensions in sand. Geotechnik 2015, 38, 266–288. [Google Scholar] [CrossRef]
- Iversen, G.R.; Gergen, M. Regression analysis and correlation analysis of two numerical variables. In Statistics, 1st ed.; Springer Undergraduate Textbooks in Statistics; Springer: New York, NY, USA, 1997; pp. 396–471. [Google Scholar]
- Preumont, A.; Piefort, V. Predicting random high-cycle fatigue life with finite-elements. J. Vib. Acoust. Trans. ASME 1994, 116, 245–248. [Google Scholar] [CrossRef]
- Q/HSn 3005-2002; Fatigue strength analysis of offshore steel structures. China National Offshore Oil Corporation Enterprise Standard: Beijing, China.
- Mohammadi, S.F.; Galgoul, N.S.; Starossek, U.; Videiro, P.M. An efficient time domain fatigue analysis and its comparison to spectral fatigue assessment for an offshore jacket structure. Mar. Struct. 2016, 49, 97–115. [Google Scholar] [CrossRef]


Disclaimer/Publisher’s Note: The statements, opinions and data contained in all publications are solely those of the individual author(s) and contributor(s) and not of MDPI and/or the editor(s). MDPI and/or the editor(s) disclaim responsibility for any injury to people or property resulting from any ideas, methods, instructions or products referred to in the content. |
© 2023 by the authors. Licensee MDPI, Basel, Switzerland. This article is an open access article distributed under the terms and conditions of the Creative Commons Attribution (CC BY) license (https://creativecommons.org/licenses/by/4.0/).