
The Effects of Wave-Induced Stokes Drift and Mixing Induced by Nonbreaking Surface Waves on the Ocean in a Climate System Ocean Model


Abstract
:1. Introduction
2. Model Description and Experiments
2.1. The Description of Two Physical Processes of Sea Surface Waves
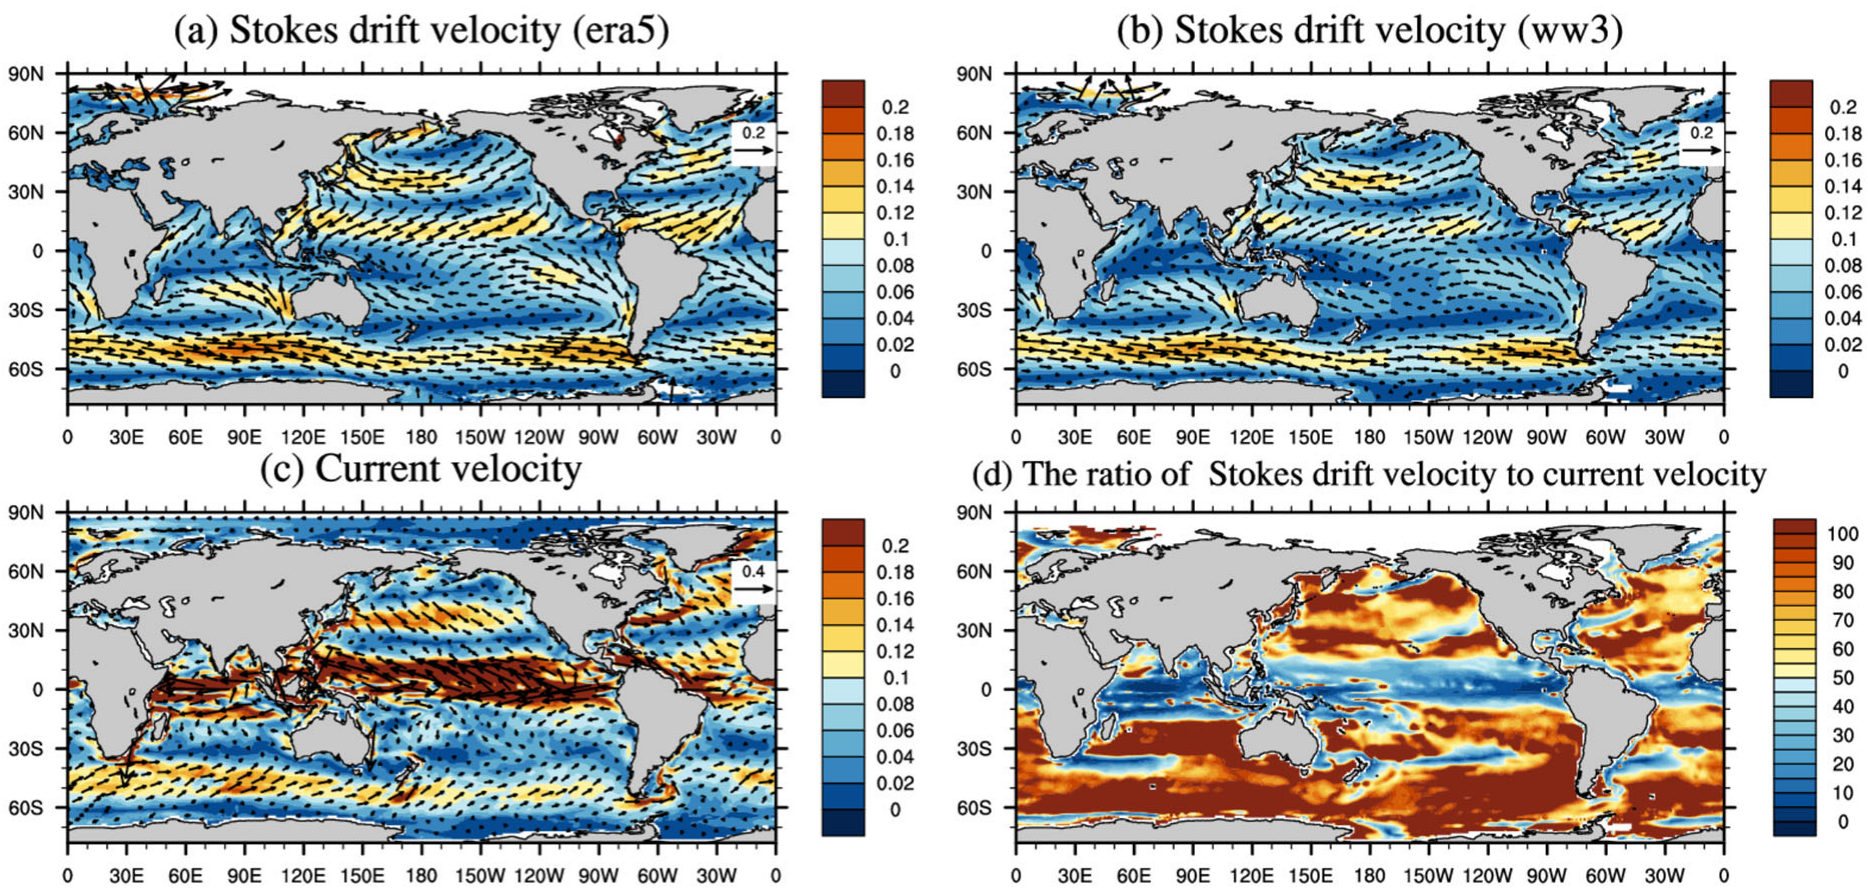
- The surface Stokes drift
- Nonbreaking surface wave mixing
2.2. Model Description
2.3. Numerical Experimental Design
3. Results
4. Summary and Discussion
Author Contributions
Funding
Institutional Review Board Statement
Informed Consent Statement
Data Availability Statement
Conflicts of Interest
References
- Griffies, S.M.; Adcroft, A.J.; Banks, H.; Boning, C.W.; Chassignet, E.P.; Danabasoglu, G.; Danilov, S.; Deleersnijder, E.; Drange, H.; England, M.; et al. Problems and prospects in large-scale ocean circulation models. In Proceedings of the OceanObs’ 09 Conference: Sustained Ocean Observations and Information for Society, Venice, Italy, 21–25 September 2009; Volume 2, pp. 1–24. [Google Scholar]
- Pacanowski, R.; Philander, S. Parameterization of vertical mixing in numerical models of tropical oceans. J. Phys. Oceanogr. 1981, 11, 1443–1451. [Google Scholar] [CrossRef]
- Mellor, G.L.; Yamada, T. Development of a turbulence closure model for geophysical fluid problems. Rev. Geophys. 1982, 20, 851–875. [Google Scholar] [CrossRef]
- Large, W.G.; McWilliams, J.C.; Doney, S.C. Oceanic vertical mixing: A review and a model with a nonlocal boundary layer parameterization. Rev. Geophys. 1994, 32, 363–403. [Google Scholar] [CrossRef]
- Canuto, V.M.; Howard, A.; Cheng, Y.; Dubovikov, M.S. Ocean turbulence. Part I: One-point closure model-momentum and heat vertical diffusivities. J. Phys. Oceanogr. 2001, 31, 1413–1426. [Google Scholar] [CrossRef]
- Canuto, V.M.; Howard, A.; Cheng, Y.; Dubovikov, M.S. Ocean turbulence. Part II: Vertical diffusivities of momentum, heat, salt, mass, and passive scalars. J. Phys. Oceanogr. 2002, 32, 240–264. [Google Scholar] [CrossRef]
- Martin, P.J. Simulation of the mixed layer at OWS November and Papa with several models. J. Geophys. Res. 1985, 90, 903–916. [Google Scholar] [CrossRef]
- Mellor, G.L. One-dimensional, ocean surface layer modeling: A problem and a solution. J. Phys. Oceanogr. 2001, 31, 790–809. [Google Scholar] [CrossRef]
- Belcher, S.E.; Grant, A.L.M.; Hanley, K.E.; Fox-Kemper, B.; Roekel, L.V.; Sullivan, P.P.; Large, W.G.; Brown, A.; Hines, A.; Calvert, D.; et al. A global perspective on Langmuir turbulence in the ocean surface boundary layer. Geophys. Res. Lett. 2012, 39, L18605. [Google Scholar] [CrossRef]
- Song, Y.; Qiao, F.; Liu, J.; Shu, Q.; Bao, Y.; Wei, M.; Song, Z. Effects of Sea Spray on Large-Scale Climatic Features over the Southern Ocean. J. Clim. 2022, 35, 4645–4663. [Google Scholar] [CrossRef]
- Polton, J.A.; Lewis, D.M.; Belcher, S.E. The role of wave-induced Coriolis-stokes forcing on the wind-driven mixed layer. J. Phys. Oceanogr. 2005, 35, 444–457. [Google Scholar] [CrossRef]
- Röhrs, J.; Christensen, K.H.; Hole, L.R.; Broström, G.; Drivdal, M.; Sundby, S. Observation-based evaluation of surface wave effects on currents and trajectory forecasts. Ocean Dyn. 2012, 62, 1519–1533. [Google Scholar] [CrossRef]
- Li, M.; Zahariev, K.; Garrett, C. Role of Langmuir circulation in the deepening of the ocean surface mixed layer. Science 1995, 270, 1955–1957. [Google Scholar] [CrossRef]
- Reichl, B.G.; Ginis, I.; Hara, T.; Thomas, B.; Kukulka, T.; Wang, D. Impact of Sea-State-Dependent Langmuir Turbulence on the Ocean Response to a Tropical Cyclone. Mon. Weather Rev. 2016, 144, 4569–4590. [Google Scholar] [CrossRef]
- McWilliams, J.C.; Huckle, E.; Liang, J.H.; Sullivan, P.P. The Wavy Ekman Layer: Langmuir Circulations, Breaking Waves, and Reynolds Stress. J. Phys. Oceanogr. 2012, 42, 1793–1816. [Google Scholar] [CrossRef]
- Qiao, F.; Yuan, Y.; Yang, Y.; Zheng, Q.; Xia, C.; Ma, J. Wave-induced mixing in the upper ocean: Distribution and application to a global ocean circulation model. Geophys. Res. Lett. 2004, 31, L11303. [Google Scholar] [CrossRef]
- Babanin, A.V.; Haus, B.K. On the existence of water turbulence induced by nonbreaking surface waves. J. Phys. Oceanogr. 2009, 39, 2675–2679. [Google Scholar] [CrossRef]
- Dai, D.; Qiao, F.; Sulisz, W.; Han, L.; Babanin, A. An experiment on the nonbreaking surface-wave-induced vertical mixing. J. Phys. Oceanogr. 2010, 40, 2180–2188. [Google Scholar] [CrossRef]
- Qiao, F.; Yuan, Y.; Ezer, T.; Xia, C.; Yang, Y.; Lü, X.; Song, Z. A three-dimensional surface wave-ocean circulation coupled model and its initial testing. Ocean Dyn. 2010, 60, 1339–1355. [Google Scholar] [CrossRef]
- Wang, Y.; Qiao, F.; Fang, G.; Wei, Z. Application of wave-induced vertical mixing to the K profile parameterization scheme. J. Geophys. Res. 2010, 115, C09014. [Google Scholar] [CrossRef]
- Shu, Q.; Qiao, F.; Song, Z.; Xia, C.; Yang, Y. Improvement of MOM4 by including surface wave-induced vertical mixing. Ocean Model 2011, 40, 42–51. [Google Scholar] [CrossRef]
- Chen, S.; Qiao, F.; Huang, C.; Song, Z. Effects of the non-breaking surface wave-induced vertical mixing on winter mixed layer depth in subtropical regions. J. Geophys. Res. Ocean. 2018, 123, 2934–2944. [Google Scholar] [CrossRef]
- Bao, Y.; Song, Z.; Qiao, F. FIO-ESM version 2.0: Model description and evaluation. J. Geophys. Res. Ocean. 2020, 125, e2019JC016036. [Google Scholar] [CrossRef]
- Terray, E.A.; Donelan, M.A.; Agrawal, Y.C.; Drennan, W.M.; Kahma, K.K.; Williams, A.J.; Hwang, P.A.; Kitaigorodskii, S.A. Estimates of kinetic energy dissipation under breaking waves. J. Phys. Oceanogr. 1996, 26, 792–807. [Google Scholar] [CrossRef]
- Gemmrich, J.R. Temperature anomalies beneath breaking waves and the decay of wave-induced turbulence. J. Geophys. Res. 2000, 105, 8727–8736. [Google Scholar] [CrossRef]
- Mellor, G.; Blumberg, A. Wave breaking and ocean surface layer thermal response. J. Phys. Oceanogr. 2004, 34, 693–698. [Google Scholar] [CrossRef]
- Babanin, A.V. Breaking of ocean surface waves. Acta Phys. Slovaca 2009, 59, 305–535. [Google Scholar] [CrossRef]
- Li, Q.; Webb, A.; Fox-Kemper, B.; Craig, A.; Danabasoglu, G.; Large, W.; Vertenstein, M. Langmuir mixing effects on global climate: WAVEWATCH III in CESM. Ocean Model. 2016, 103, 145–160. [Google Scholar] [CrossRef]
- Fan, Y.; Griffies, S.M. Impacts of Parameterized Langmuir Turbulence and Nonbreaking Wave Mixing in Global Climate Simulations. J. Clim. 2014, 27, 4752–4775. [Google Scholar] [CrossRef]
- Bi, D.; Dix, M.; Marsland, S.; O’Farrell, S.; Rashid, H.; Uotila, P.; Hirst, t.; Kowalczyk, E.; Golebiwski, M.; Sullivan, A.; et al. The ACCESS coupled model: Description, control climate and evaluation. Austral. Meteorol. Oceanogr. J. 2013, 63, 41–64. [Google Scholar] [CrossRef]
- Fox-Kemper, B.; Adcroft, A.; Böning, C.W.; Chassignet, E.P.; Curchitse, E.; Danabasoglu, G.; Eden, C.; England, M.H.; Gerdes, R.; Greatbatch, R.J.; et al. Challenges and Prospects in Ocean Circulation Models. Front. Mar. Sci. 2019, 6, 65. [Google Scholar] [CrossRef]
- Zhang, X.; Zeng, Q. A computational design of numerical world general circulation model. Chin. J. Atmos. Sci. 1988, 12, 149–165. (In Chinese) [Google Scholar]
- Zeng, Q.; Zhang, X.; Liang, X.; Yuan, C.; Chen, S. Documentation of IAP two-level atmospheric general circulation model. Environ. Sci. 1989, TR044, 383. [Google Scholar]
- Dai, Y.; Zeng, Q. A land surface model (IAP94) for climate studies part I: Formulation and validation in off-line experiments. Adv. Atmos. Sci. 1997, 14, 433–460. [Google Scholar]
- Zhou, G.; Zhang, Y.; Jiang, J.; Zhang, H.; Wu, B.; Cao, H.; Wang, T.; Hao, H.; Zhu, J.; Yuan, L.; et al. Earth System Model: CAS-ESM. Front. Data Comput. 2020, 2, 38–54. (In Chinese) [Google Scholar]
- Zhang, H.; Zhang, M.; Jin, J.; Fei, K.; Ji, D.; Wu, C.; Zhu, J.; He, J.; Chai, Z.; Xie, J.; et al. Description and Climate Simulation Performance of CAS-ESM Version 2. J. Adv. Model. Earth Syst. 2020, 12, e2020MS002210. [Google Scholar] [CrossRef]
- Jin, J.; Zhang, H.; Dong, X.; Liu, H.; Zhang, M.; Gao, X.; He, J.; Chai, Z.; Zeng, Q.; Zhou, G.; et al. CAS-ESM2.0 Model Datasets for the CMIP6 Flux-Anomaly-Forced Model Intercomparison Project (FAFMIP). Adv. Atmos. Sci. 2021, 38, 296–306. [Google Scholar] [CrossRef]
- Dong, X.; Jin, J.; Liu, H.; Zhang, H.; Zhang, M.; Lin, P.; Zeng, Q.; Zhou, G.; Yu, Y.; Song, M.; et al. CAS-ESM2.0 Model Datasets for the CMIP6 Ocean Model Intercomparison Project Phase 1 (OMIP1). Adv. Atmos. Sci. 2021, 38, 307–316. [Google Scholar] [CrossRef]
- Dobler, D.; Huck, T.; Maes, C.; Grima, N.; Blanke, B.; Martinez, E.; Ardhuin, F. Large impact of Stokes drift on the fate of surface floating debris in the South Indian Basin. Mar. Pollut. Bull. 2019, 148, 202–209. [Google Scholar] [CrossRef]
- Lewis, H.W.; Sanchez, J.M.C.; John, S.; Robert, R.K.; Marina, T.; Andrew, S.; Peter, S.; Anne-Christine, P.; Graham, P.; Weedon, T.P.; et al. Can wave coupling improve operational regional ocean forecasts for the north-west European Shelf? Ocean Sci. 2019, 15, 669–690. [Google Scholar] [CrossRef]
- Lewis, H.W.; Sanchez, J.M.C.; Arnold, A.; Fallmann, J.; Saulter, A.; Graham, J.; Bush, M.; Siddorn, J.; Palmer, T.; Lock, T.; et al. The UKC3 regional coupled environmental prediction system. Geosci. Model Dev. 2019, 12, 2357–2400. [Google Scholar] [CrossRef]
- Liu, H.; Lin, P.; Yu, Y. The baseline evaluation of LASG/IAP climate system ocean model (LICOM) version 2.0. J. Meteorol. Res. 2012, 26, 318–329. [Google Scholar]
- Jin, J.; Zeng, Q.; Wu, L.; Liu, H.; Zhang, M. Formulation of a new ocean salinity boundary condition and impact on the simulated climate of an oceanic general circulation model. Sci. China Earth Sci. 2017, 60, 491–500. [Google Scholar] [CrossRef]
- Fairall, C.W.; Bradley, E.F.; Hare, J.E.; Grachev, A.A.; Edson, J.B. Bulk parameterization of air-sea fluxes: Updates and verification for the COARE algorithm. J. Clim. 2003, 16, 571–591. [Google Scholar] [CrossRef]
- Abdolali, A.; Accensi, M.; Alves, J.H.; Ardhuin, F.; Babanin, A.; Barbariol, F.; Benetazzo, A.; Bidlot, J.; Booij, N.; Boutin, G.; et al. User Manual and System Documentation of WAVEWATCH III, Version 6.07; Tech. Note 333, NOAA/NWS/NCEP/MMAB; National Oceanic and Atmospheric Administration: College Park, MD, USA, 2019; 465p.
- Ardhuin, F.; Rogers, E.; Babanin, A.V.; Filipot, J.F.; Magne, R.; Roland, A.; Westhuysen, A.V.D.; Queffeulou, P.; Lefevre, J.M.; Aouf, L.; et al. Semiempirical dissipation source functions for ocean waves. Part I: Definition, calibration, and validation. J. Phys. Oceanogr. 2010, 40, 1917–1941. [Google Scholar] [CrossRef]
- Hasselmann, S.; Hasselmann, K. Computations and parameterizations of the nonlinear energy transfer in a gravity-wave spectrum, Part I: A new method for efficient computations of the exact nonlinear transfer integral. J. Phys. Oceanogr. 1985, 15, 1369–1377. [Google Scholar] [CrossRef]
- Hasselmann, K.; Barnett, T.P.; Bouws, E.; Carlson, H.; Cartwright, D.E.; Enke, K.; Ewing, J.A.; Gienapp, H.; Hasselmann, D.E.; Kruseman, P.; et al. Measurements of wind-wave growth and swell decay during the Joint North Sea Wave Project (JONSWAP). Ergaenzungsheft Zur Dtsch. Hydrogr. Z. Reihe A 1973, 8, 1–95. [Google Scholar]
- Battjes, J.A.; Janssen, J.P.F.M. Energy loss and set-up due to breaking of random waves. Coast. Eng. 1978, 56, 569–587. [Google Scholar]
- Large, W.G.; Yeager, S.G. Diurnal to Decadal Global Forcing for Ocean and Sea Ice Models: The Data Sets and Flux Climatologies; University Corporation for Atmospheric Research: Boulder, CO, USA, 2004. [Google Scholar]
- Kantha, L.H.; Clayson, C.A. An improved mixed layer model for geophysical applications. J. Geophys. Res. 1994, 99, 25235–25266. [Google Scholar] [CrossRef]
- Qiao, F.; Zhao, W.; Yin, X.; Huang, X.; Liu, X.; Shu, Q.; Wang, G.; Song, Z.; Li, X.; Liu, H.; et al. A highly effective global surface wave numerical simulation with ultra-high resolution. In Proceedings of the International Conference for High Performance Computing, Networking, Storage and Analysis (SC), Salt Lake City, UT, USA, 13–18 November 2016; pp. 46–56. [Google Scholar]
- McWilliams, J.C.; Sullivan, P.P. Vertical mixing by Langmuir circulations. Spill Sci. Technol. Bull. 2000, 6, 225–237. [Google Scholar] [CrossRef]
- Smyth, W.D.; Skyllingstad, E.D.; Grawford, G.B.; Wijesekera, H. Nonlocal fluxes and Stokes drift effects in the K-profile parameterization. Ocean Dyn. 2002, 52, 104–115. [Google Scholar] [CrossRef]
- Wang, S.; Wang, Q.; Shu, Q.; Scholz, P.; Lohmann, G.; Qiao, F. Improving the upper-ocean temperature in an ocean climate model (FESOM 1.4): Shortwave penetration versus mixing induced by nonbreaking surface waves. J. Adv. Model. Earth Syst. 2019, 11, 545–557. [Google Scholar] [CrossRef]
- Hersbach, H.; Bell, B.; Berrisford, P.; Biavati, G.; Horányi, A.; Muñoz, S.J.; Nicolas, J.; Peubey, C.; Radu, R.; Rozum, I.; et al. ERA5 hourly data on single levels from 1940 to present. In Copernicus Climate Change Service (C3S) Climate Data Store (CDS); Copernicus Publications: Göttingen, Germany, 2023; Available online: https://cds.climate.copernicus.eu/cdsapp#!/dataset/reanalysis-era5-single-levels?tab=eqc (accessed on 16 September 2023).
- Boyer, T.; Mishonov, A. (Eds.) World Ocean Atlas 2013 Product Documentation. 2013. Available online: https://www.nodc.noaa.gov/OC5/woa13/ (accessed on 16 September 2023).
- Meijers, A.J.S. The Southern Ocean in the coupled model intercomparison project phase 5. Philos. Trans. A Math. Phys. Eng. Sci. 2014, 372, 20130296. [Google Scholar] [CrossRef] [PubMed]
- Xiao, L.; Shi, J.; Jiang, G.; Liu, Z.; Zhang, C. The impact of Stokes drift on global sea surface temperature simulation. Mar. Sci. Bull. 2018, 37, 9. [Google Scholar]
- Shu, Q.; Qiao, F.; Song, Z.; Yin, X. A comparison of two global ocean-ice coupled models with different horizontal resolutions. Acta Oceanol. Sin. 2013, 32, 1–11. [Google Scholar] [CrossRef]
- Zhao, C.; Qiao, F.; Xia, C.; Wang, G. Sensitive study of the long and short surface wave-induced vertical mixing in a wave-circulation coupled model. Acta Oceanol. Sin. 2012, 31, 1–10. [Google Scholar] [CrossRef]
- Monterey, G.I.; Levitus, S. Seasonal Variability of Mixed Layer Depth for the World Ocean. NOAA NESDIS Atlas 1997, 14, 100. [Google Scholar]
- De Boyer, M.C.; Madec, G.; Fischer, A.S.; Lazar, A.; Iudicone, D. Mixed layer depth over the global ocean: An examination of profiledata and a profile-based climatology. J. Geophys. Res. 2004, 109, 12003. [Google Scholar] [CrossRef]
- De Boyer, M.C.; Mignot, J.; Lazar, A.; Cravatte, S. Control of salinity on the mixed layer depth in the world ocean: 1. General description. J. Geophys. Res. 2007, 112, C06011. [Google Scholar]
- Schmidtko, S.; Johnson, G.C.; Lyman, J.M. MIMOC: A global monthly isopycnal upper-ocean climatology with mixed layers. J. Geophys. Res. Ocean. 2013, 118, 1658–1672. [Google Scholar] [CrossRef]
- Qiao, F.; Song, Z.; Bao, Y.; Song, Y.; Shu, Q.; Huang, C.; Zhao, W. Development and evaluation of an Earth System Model with surface gravity waves. J. Geophys. Res. Ocean. 2013, 118, 4514–4524. [Google Scholar] [CrossRef]
- Chan, J.J.; Park, J.; Park, T.; Yoo, S. Response of the ocean mixed layer depth to global warming and its impact on primary production: A case for the North Pacific Ocean. ICES J. Mar. Sci. 2011, 68, 996–1007. [Google Scholar]
- Huang, C.; Qiao, F.; Shu, Q.; Song, Z. Evaluating austral summer mixed-layer response to surface wave-induced mixing in the Southern Ocean. J. Geophys. Res. 2012, 117, 24–33. [Google Scholar] [CrossRef]


| Experiment ID | Stokes Drift | Nonbreaking Surface Wave |
|---|---|---|
| con | no | no |
| uss | yes | no |
| bv | no | yes |
| bv_uss | yes | yes |
| Experiment ID | Average SST | RMSEs |
|---|---|---|
| observation | 6.71 | |
| con | 8.01 | 1.75 |
| uss | 7.92 | 1.67 |
| bv | 7.39 | 1.30 |
| bv_uss | 7.37 | 1.29 |
| Experiment ID | Average MLD | RMSEs |
|---|---|---|
| observation | 36.16 | |
| con | 21.44 | 26.16 |
| uss | 24.04 | 23.55 |
| bv | 33.30 | 18.36 |
| bv_uss | 34.08 | 18.28 |
| Experiment ID | Average MLD | RMSEs |
|---|---|---|
| observation | 92.13 | |
| con | 137.16 | 90.08 |
| uss | 134.67 | 84.69 |
| bv | 142.36 | 88.67 |
| bv_uss | 139.69 | 83.81 |
Disclaimer/Publisher’s Note: The statements, opinions and data contained in all publications are solely those of the individual author(s) and contributor(s) and not of MDPI and/or the editor(s). MDPI and/or the editor(s) disclaim responsibility for any injury to people or property resulting from any ideas, methods, instructions or products referred to in the content. |
© 2023 by the authors. Licensee MDPI, Basel, Switzerland. This article is an open access article distributed under the terms and conditions of the Creative Commons Attribution (CC BY) license (https://creativecommons.org/licenses/by/4.0/).
Share and Cite
Fan, P.; Jin, J.; Guo, R.; Li, G.; Zhou, G. The Effects of Wave-Induced Stokes Drift and Mixing Induced by Nonbreaking Surface Waves on the Ocean in a Climate System Ocean Model. J. Mar. Sci. Eng. 2023, 11, 1868. https://doi.org/10.3390/jmse11101868
Fan P, Jin J, Guo R, Li G, Zhou G. The Effects of Wave-Induced Stokes Drift and Mixing Induced by Nonbreaking Surface Waves on the Ocean in a Climate System Ocean Model. Journal of Marine Science and Engineering. 2023; 11(10):1868. https://doi.org/10.3390/jmse11101868
Chicago/Turabian StyleFan, Peng, Jiangbo Jin, Run Guo, Guixian Li, and Guangqing Zhou. 2023. "The Effects of Wave-Induced Stokes Drift and Mixing Induced by Nonbreaking Surface Waves on the Ocean in a Climate System Ocean Model" Journal of Marine Science and Engineering 11, no. 10: 1868. https://doi.org/10.3390/jmse11101868
APA StyleFan, P., Jin, J., Guo, R., Li, G., & Zhou, G. (2023). The Effects of Wave-Induced Stokes Drift and Mixing Induced by Nonbreaking Surface Waves on the Ocean in a Climate System Ocean Model. Journal of Marine Science and Engineering, 11(10), 1868. https://doi.org/10.3390/jmse11101868