Article

Development of a Complex Vulnerability Index for Fishing Shelters—The Case of Cyprus

by
Vasiliki I. Chalastani
1,*,
Andreas Pantelidis
1,
Elissavet Feloni
2,3,
Andreas Papadimitriou
1,
Christina N. Tsaimou
1,
Olympia Nisiforou
4 and
Vasiliki K. Tsoukala
1
1
Laboratory of Harbour Works, Department of Water Resources and Environmental Engineering, School of Civil Engineering, National Technical University of Athens (NTUA), 15780 Zografou, Greece
2
Laboratory of Hydrology and Water Resources Management, Department of Water Resources and Environmental Engineering, School of Civil Engineering, National Technical University of Athens (NTUA), 15780 Zografou, Greece
3
Department of Mechanical Engineering and Materials Science and Engineering, Cyprus University of Technology, 3041 Limassol, Cyprus
4
Department of Chemical Engineering, Faculty of Geotechnical Sciences and Environmental Management, Cyprus University of Technology, 3603 Limassol, Cyprus
*
Author to whom correspondence should be addressed.
J. Mar. Sci. Eng. 2023, 11(10), 1880; https://doi.org/10.3390/jmse11101880
Submission received: 6 August 2023 / Revised: 14 September 2023 / Accepted: 23 September 2023 / Published: 27 September 2023
(This article belongs to the Special Issue Estuaries, Coasts, and Seas in a Changing Climate)

Abstract

:
Small fishing harbours substantially contribute to coastal economies as they support not only fishing but also tourism activities. They are located at the land–sea interface and are considered vulnerable infrastructure affected by the increased human activities but also by the impacts of climate change, including rising sea levels and extreme weather events. In this paper, the 16 existing fishing shelters of Cyprus are used as a case study to develop a complex vulnerability index for assessing the shelters’ vulnerability. The index incorporates physical, environmental, technical and socioeconomic variables, which are quantified and scored to denote the current state of vulnerability. The results are validated through on-site visits, questionnaires answered by local fishermen and targeted interviews with representatives of the port authorities. Furthermore, climate change projections are taken into account for the physical variables to evaluate the impact of climate change on vulnerability changes. The study highlights the complex interactions between a variety of factors characterising the fishing shelters and driving vulnerability. The proposed index can assist decisionmakers with prioritising interventions, allocating funding and designing adaptation pathways that reduce the shelters’ vulnerability while increasing their resilience.

1. Introduction

Seaports play a crucial role in the worldwide economy, enabling global trade [1,2] while fostering development, employment and connectivity. However, they are vulnerable to a range of factors due to their location, infrastructure condition, operational dependencies and climate change. According to the Intergovernmental Panel on Climate Change (IPCC) definition of vulnerability, seaport vulnerability refers to the degree to which a seaport is susceptible to or unable to cope with adverse effects from various hazards, including those associated with climate change. The seaports’ level of exposure, sensitivity and adaptive capacity determine the degree of their vulnerability [3].
Seaports are lying in the land–sea interface, thus being affected by sea level rise, storm surges, flooding and extreme weather events [4]. These hazards jeopardise the structural condition of the seaport itself, the undisrupted operation of the supply chain and the lives of adjacent coastal communities [5,6,7]. Additional factors that contribute to seaports’ vulnerability include (i) the design and condition of seaport infrastructure and facilities [8], (ii) the extent to which seaports rely on external systems, such as telecommunications, power and water supply [2], as well as (iii) socioeconomic aspects including the contribution of port activities to regional or national economies and their relation to adjacent communities’ prosperity [9].
Understanding seaport vulnerability is the first step for assessing risks, developing adaptation strategies, and implementing measures to enhance resilience [4,10] through actions such as integrating climate change considerations into port planning and design, monitoring and improving port infrastructure, implementing emergency response plans and fostering collaboration among stakeholders to address vulnerabilities. Assessments of seaport vulnerability are typically conducted via the selection of appropriate indicators and the development of vulnerability indices. Measuring vulnerability indicators and indices, although a controversial issue among policy and academic communities [11], constitutes a rapid and consistent method for conceptualising vulnerability [12,13], especially to identify vulnerable people, regions or sectors at local scales [11].
Vulnerability assessments of seaport infrastructure and its functions are limited [14], especially when compared to similar assessments for coastal areas. Indeed, targeted searches in the Scopus database, undertaken in the context of this work, reveal that the search term “coastal vulnerability” returned 7640 publications until 2022, whereas the search term “port vulnerability” returned 1280 publications for the same time period. However, publications related to port vulnerability keep increasing, albeit for 2016–2020, only 1/3 of the publications assess port vulnerability, while only half of these incorporate climate change. Several assessments at the single-port scale are found in the literature (e.g., [15,16,17,18]), which despite their importance at the local scale do not allow for comparisons of vulnerability among ports [8]. Vulnerability, risk and resilience assessments at the multi-port scale have followed an upward trend over the years (e.g., [4,8,19,20]). However, most efforts at determining seaport vulnerability focus on large commercial ports rather than small craft harbours. Kontogianni et al. [21] proposed a vulnerability index for small harbours, applied in Lesvos island, Greece, without considering specific climate change projections.
Small harbours initially designed as fishing shelters but also used as berthing locations for tourist boats play a vital role in the livelihood of coastal communities dependent on fishing and tourism as a livelihood. They provide infrastructure and services that support fishing and tourism operations, facilitate seafood distribution to consumers and enhance business development in the surrounding areas. The need to assess these small harbours’ vulnerability becomes imminent when considering climate change and the rapid growth of blue economy, which is estimated to reach USD 2.5–3 trillion by 2030 [22]. In particular, the seafood sector is considered the fastest growing food industry and coastal tourism is the fastest growing tourism sector [23].
In an attempt to contribute to the growing body of literature related to seaport vulnerability, a framework for assessing the vulnerability of fishing harbours, hereafter fishing shelters, is proposed and applied in the fishing shelters of Cyprus. The framework is based on the appropriate selection of variables and the development of an index that describes the various physical, environmental, technical and socioeconomic aspects of the shelters’ current vulnerability. Furthermore, the climate change projections taken into account allow for monitoring changes in vulnerability and planning targeted interventions, seeking to reduce vulnerability and increase resilience. The proposed index is anticipated to facilitate funding allocation and adaptation planning while providing input for climate-smart marine spatial plans that consider land–sea interactions.

2. Materials and Methods

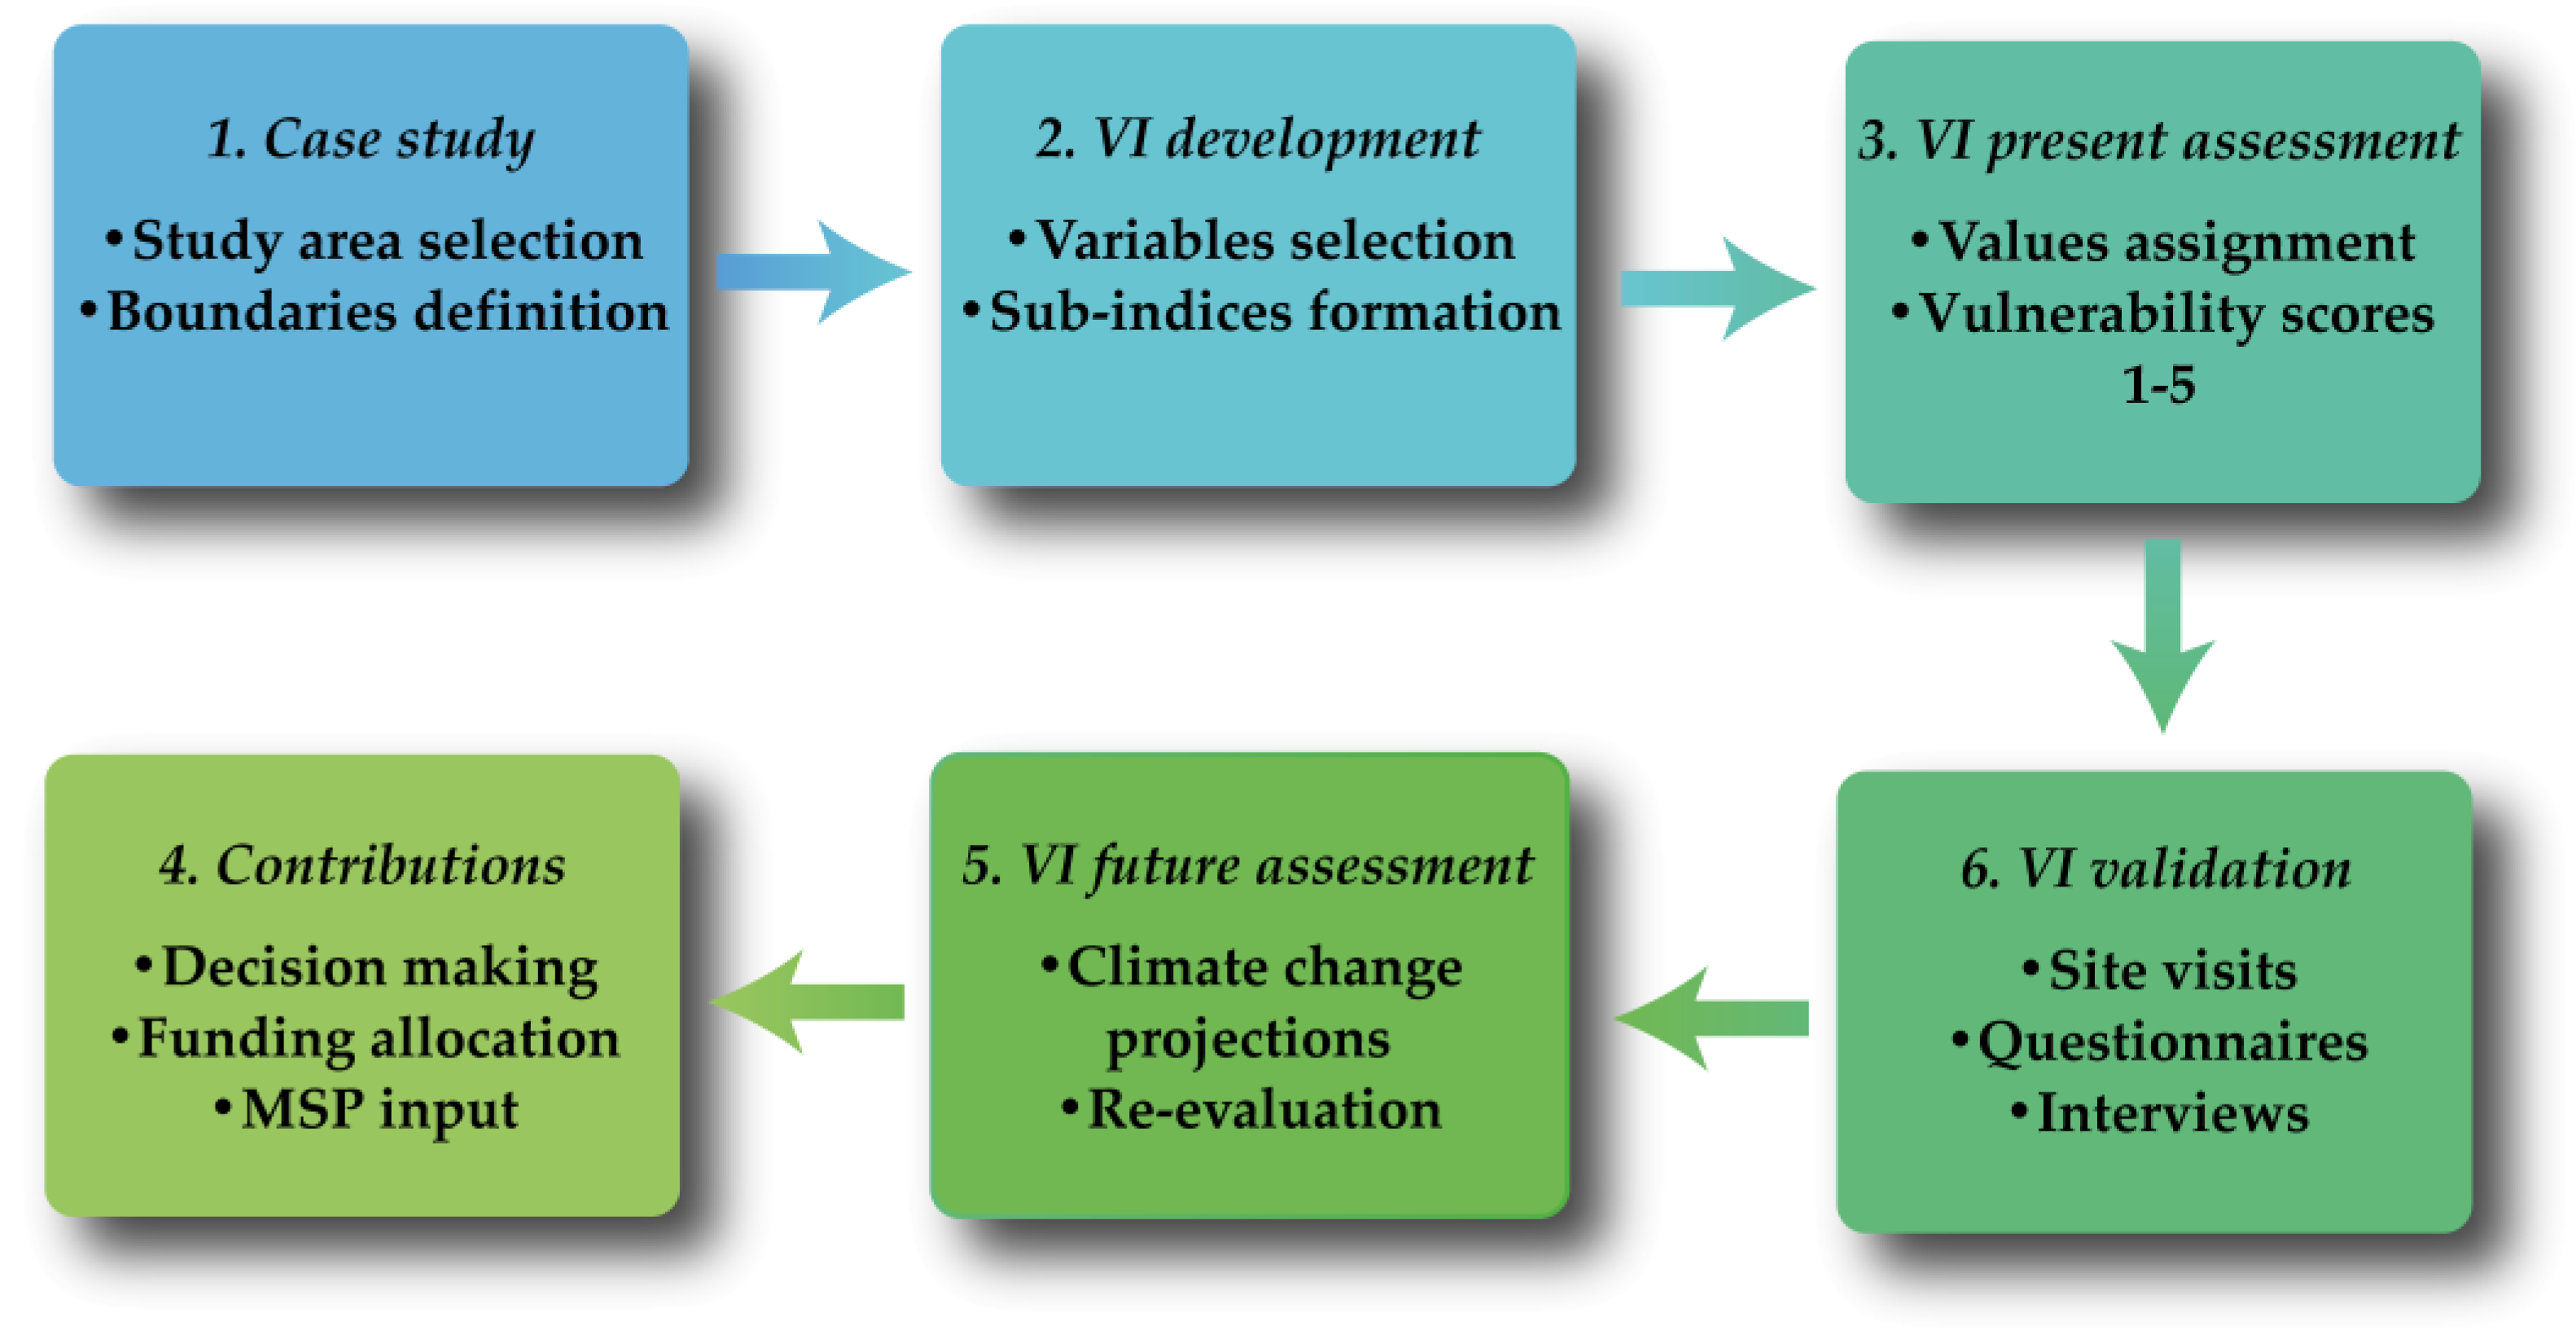
2.1. Vulnerability Framework

The methodological framework for assessing the vulnerability of the 16 fishing shelters of the Republic of Cyprus consists of six (6) consecutive steps, as shown in Figure 1. Step 1 involves selecting the case study and defining its boundaries: in this case, the 16 Republic of Cyprus fishing shelters. Step 2 refers to developing the suggested vulnerability index (VI), hence selecting the appropriate vulnerability variables and their inclusion into sub-indices to easily monitor which aspects affect alterations in vulnerability. During Step 3, values are assigned to each variable and subsequently transformed into discrete scores from 1 to 5 according to a predefined scale. The current VI is calculated for each fishing shelter by aggregating the variables’ scores. To validate the current variables’ scores and total VI, Step 4 comprises the validation of these results through the physical inspection of the shelters, the completion of questionnaires by representatives of the fishermen in each shelter, as well as targeted interviews with experts from the authorities who are responsible for managing the shelters. Subsequently, VI is re-calculated in Step 5 by considering climate change projections to assess the effect of climate change on Cypriot fishing shelters. In Step 6, once both current and future vulnerability are determined, decision-makers and stakeholders are in place to determine the most vulnerable shelters, the aspects of the shelters contributing to their vulnerability as well as changes in future patterns. Thereby, they are capable of properly allocating funding for targeted interventions that reduce vulnerability. The results can also serve as input for climate-smart marine spatial planning (MSP) that incorporates vulnerability at the land–sea interface.

2.2. Study Area (Step 1)

Cyprus is an island country located in the eastern part of the Mediterranean Sea, at the cross-road of Asia, Europe, and Africa. It is the third largest and third most populous island in the Mediterranean, after Sicily and Sardinia, extending over 9251 km2, with an Exclusive Economic Zone (EEZ) 7.5 times larger than the island’s terrestrial area. The Republic of Cyprus was established in 1960 and has been a member of the European Union (EU) since 2004. The capital and largest city of Cyprus is Nicosia. The internationally recognised government controls the southern and eastern parts of the island, comprising approximately 59% of the total land area. The northern part of Cyprus is under the authority of the Turkish Republic of Northern Cyprus (TRNC), which is recognised only by Turkey. It covers approximately 35% of the total land area of Cyprus. The United Kingdom (UK) retains sovereignty over two (2) areas on the island, known as the British Sovereign Base Areas (SBAs) of Akrotiri and Dhekelia, extending at about 3% of the land area. These are used as military bases by the UK, while the demilitarised Buffer Zone or Green Line that separates the northern and southern parts of the island covers about 3% of the island. The coastline of Cyprus stretches approximately 648 km, including the coastlines of both the southern and the northern parts of the island.
Sixteen (16) fishing shelters are found along the coastline controlled by the Republic of Cyprus (Figure 1), extending over approximately 315 km2. These shelters play a vital role in supporting the local fishermen by providing a safe harbour for fishing vessels and contributing to the island’s fishing industry by facilitating the trade and distribution of fresh seafood.
The management of fishing shelters falls under the authority of various government bodies. The primary agency responsible for managing the fishing shelters is the Department of Fisheries and Marine Research (DFMR), which oversees the operations and maintenance of 13 of the 16 fishing shelters. The DFMR is part of the Ministry of Agriculture, Rural Development, and Environment. The proper functioning and compliance with regulations of the remaining three (3) fishing shelters, namely the shelters of Limassol, Paphos and Latsi (10, 12 and 14 in Figure 2), fall under the jurisdiction of the Cyprus Port Authority (CPA), which is part of the Ministry of Transport, Communication and Works. However, six (6) out of the 16 shelters host fishing and tourist vessels, thus contributing to the country’s tourism sector, which comprised more than 13% of the total employment in 2019 [24].

2.3. Development of the Proposed VI (Steps 2 and 5)

The proposed VI comprises four (4) sub-indices, including 21 physical, environmental, technical and socioeconomic variables in total (Table 1).
As regards the physical sub-index, three (3) categories were chosen, namely: (i) climate, comprising variables V1–V3, (ii) hydrodynamic conditions, including variables V4-V6 and (iii) geomorphology, comprising variables V7 and V8 (Table 1) to indicate the impacts of these variables on fishing shelters. The variables included in the climate and hydrodynamic conditions categories were quantified using both hindcast and forecast data to denote current and future vulnerability, respectively. In particular, variables V1–V6 were given values for three (3) different 30-year periods: (i) 1976–2005, (ii) 2041–2070 and (iii) 2071–2100. For the period 1976–2005, V1–V6 were jointly quantified with the remaining variables V7–V21 of the VI to indicate the present vulnerability of each fishing shelter. For the two (2) future time periods, only the values of V1–V6 were altered by considering two (2) Representative Concentration Pathway (RCP) scenarios: (i) the moderate scenario (RCP 4.5) according to which CO2 emissions will peak around 2040 and will decline thereafter and (ii) the pessimistic scenario (RCP 8.5) in which CO2 emissions continue to rise throughout the 21st century (IPCC, 2014). The combination of two (2) future time periods and two (2) RCPs resulted in the formation of four (4) future vulnerability assessments to examine the effects of climate change in the short and long term by considering medium and high greenhouse gas (GHG) emissions pathways. It is noted that both historical and future datasets containing offshore wave characteristics are associated with uncertainties regarding the predictions, especially in the context of performing an Extreme Value Analysis (EVA) [25], which may affect the subsequent vulnerability analysis. However, given the extensive validation of these datasets and the consistent parametrizations of the models undertaken to generate the historical and future datasets, it is considered that a reliable estimation of the hydrodynamic conditions at the vicinity of the fishing shelters was obtained.
V1. Mean wind velocity
The annual mean wind velocity at 10 m above the mean sea level extracted at a reference location in the centre of the basin of each fishing shelter. Both hindcast and forecast data are considered (i.e., 1976–2005; RCP 4.5 2041–2070; RCP 4.5 2071–2100; RCP 8.5 2041–2070; RCP 8.5 2071–2100). More intense winds generate more energetic waves, affecting the berth positions’ tranquillity. Additionally, winds exert loads on fishing boats [26], increasing the risk of vessel collision.
V2. Mean air temperature
The mean ambient air temperature at 2 m above the surface over the three (3) 30-year periods. The data for this variable were extracted at the nearest point in the centre of the fishing shelter basin. An increased mean air temperature can potentially increase the exerted stress on the harbour infrastructure especially in metal components (e.g., ladders) [27].
V3. Mean precipitation
The average cumulative precipitation over the three (3) 30-year periods. The data for this variable were extracted at the nearest point in the centre of the fishing shelter basin. Increased precipitation levels can affect the harbour berthing operations and are often associated with extreme storm events that can potentially damage the harbour infrastructure [17].
V4. The 1-year return period extreme significant wave height
The extreme significant wave height with a return period of one (1) year, at a reference point offshore each fishing shelter’s entrance, with a corresponding depth of 100 m. This depth was selected to ensure that the offshore sea-state wave characteristics will correspond to deep water values. The variable was calculated by identifying a ±90-degree range relative to the main orientation of the fishing shelter location with respect to the true north. Then, the extreme significant wave height with a return period of one (1) year for each fishing shelter was computed by performing EVA on the available hourly wave data over the 30-year periods. A larger wave height can increase the agitation levels inside the harbour basin [28] disturbing its operations [29].
V5. The 50-year return period extreme significant wave height
The extreme significant wave height with a return period of 50 years, at a reference point offshore each fishing shelter’s entrance, with a corresponding depth of 100 m. This depth was selected to ensure that the offshore sea-state wave characteristics will correspond to deep water values. The variable was calculated by identifying a ±90-degree range relative to the main orientation of the fishing shelter location with respect to the true north. Similarly to V4, the extreme significant wave height with a return period of 50 years for each fishing shelter was computed by performing EVA on the hourly wave data over the years 1976–2005, 2041–2070 and 2071–2100 for the two (2) RCPs, available in the dataset at stations along the European coast with a maximum resolution of 30 km, obtained from the Copernicus Climate Change Service. In addition to increasing agitation levels inside the harbour basin, larger wave heights can damage the protection works and interior port infrastructure due to excess loading [30].
V6. Sea level (change)
The rate of mean sea-level change due to the impact of climate change at a reference location in the centre of the basin of each fishing shelter. The variable is calculated at the end of the 30-year window only for the future periods for each RCP scenario. An increased level of sea-level rise increases the risk of coastal inundation and flooding, resulting in operational stoppage of the fishing shelter and infrastructure damages in the hinterland [31,32].
V7. Sediment
Sediment transport, especially when sediment motion is mainly due to suspension, can hinder the approach of fishing boats due to the potential accumulation of sediment in the channel entrance, thus reducing the depth in the fishing shelter basin [33]. Fine sand, silt, and clay sediments, present in mud flats deltas and sandy beaches, are more easily set in suspension due to wave stirring and are associated with increased vulnerability. The variable is extracted in the centre of the basin of each fishing shelter.
V8. Earthquake zone
Earthquakes can seriously impact ports [34], depending on their intensity and proximity, including fatalities, structural damage, disruption of operation and changes in water depths. The higher the seismic zone in which a shelter is located, the higher its vulnerability.
The environmental sub-index refers to the areas of environmental interest and consists of V7 and V8 (Table 1), denoting areas which may be affected, depending on their proximity to the shelter, by an unintended event occurring at the shelter’s area (e.g., vessel accident).
V9. Distance from areas included in the NATURA 2000 network
The Euclidean distance from the centre of each shelter to the closest marine or terrestrial boundary included in the NATURA 2000 network. The distance is calculated with the Euclidean distance tool of ArcToolbox with the use of ArcGIS Desktop, version 10.8.2. The closer the shelter is to the NATURA 2000 area, the more vulnerable it is.
V10. Distance from aquaculture
The Euclidean distance from the centre of each shelter to the closest boundary of an aquaculture site. The distance is calculated with the Euclidean distance tool of ArcToolbox with the use of ArcGIS Desktop, version 10.8.2. The closer the shelter is to an aquaculture area, the more vulnerable it is.
The technical sub-index contains two (2) categories, the general characteristics and the infrastructural ones, consisting of three (3) variables each: V11–V13 and V14–V16, respectively (Table 1). The sub-index encapsulates the technical components of the shelter, which, based on their value, contribute more or less to the shelter’s vulnerability.
V11. Harbour capacity
The number of berthing positions for which the shelter was designed. The higher number of boats a shelter can host, the higher the vulnerability of the seaport itself, since in case of unintended incidents, such as natural hazards or delays, more assets are affected.
V12. Current usage
Percentage of the annual berthing positions occupied with respect to the available berthing positions. The percentages were calculated for the year 2021. Higher current usage indicates higher vulnerability, since more assets and people are affected in case of accidents and catastrophic events.
V13. Year of construction/reconstruction
Year of construction or major reconstruction of the fishing shelter. For 12 out of the 16 shelters, the year of reconstruction was considered. The more recent the year of construction or reconstruction, the lower the shelter’s vulnerability.
V14. Utilities and facilities
The variable refers to a combination of 12 parameters, namely: electricity supply, water supply, freshwater refilling services, boat slip, fire safety facilities, boat-stacking facilities, lighting, toilettes, sanitation facilities, storage areas, parking areas and sheds. The more of these utilities and facilities the shelter includes, the less vulnerable it is considered.
V15.Port layout
The ratio of the total length of protection works to the difference between the perimeter of the port basin minus the length of the shelter’s terrestrial zone. The variable seeks to determine how protected the shelter is, in terms of layout, from the wave action. The higher this ratio, the lower the vulnerability of the shelter.
V16. Road network condition
The category of the road closest to the fishing shelter. The road categories refer to the ones imposed by national regulations. The lower the category of the road, the higher the vulnerability of the shelter, since in case of accidents or catastrophic events, the escape routes are fewer and less safe.
The socioeconomic sub-index includes the categories of (i) demographics, comprising V17–V19 and seeking to determine the vulnerability concerning the impacts on communities found alongside, in case of unintended events, and (ii) economics, consisting of V20–V21 (Table 1) which refer to the economic aspects affecting the shelters’ vulnerability.
V17. Distance from the closest human settlement
The Euclidean distance from the centre of each shelter to the closest boundary of the adjacent city/settlement. The distance is calculated with the Euclidean distance tool of ArcToolbox with the use of ArcGIS Desktop, version 10.8.2. Higher distance denotes higher vulnerability, since prompt intervention is less possible in case of accidents or catastrophic events in the shelter’s area.
V18. Number of inhabitants of the closest human settlement
The number of people living close to the fishing shelter as depicted by the Cypriot census in 2011. The higher the number of adjacent communities, the higher the shelter’s vulnerability, since more people are affected in case of accidental incidents.
V19. Number of professional users
The number of professional fishing boats authorised to berth in each fishing shelter for the year 2021. The higher the number of professional fishing boats, the higher the shelter’s vulnerability to account for potential impacts on business operations.
V20. Distance from the closest port
The Euclidean distance from the centre of each shelter to the centre of the closest port. The distance is calculated with the Euclidean distance tool of ArcToolbox with the use of ArcGIS Desktop, version 10.8.2. Higher distance denotes higher vulnerability, since in case of interruptions, delays, accidents or catastrophic events, the possibility of boats to safely berth in an adjacent location decreases, and the economic impact is higher.
V21. Maintenance costs during the last 15 years
The amount of money spent on the shelter’s structural maintenance during the last 15 years. The higher the amount, the lower the vulnerability of the shelter since there are repair and maintenance initiatives that improve the shelter’s structural health.

2.4. Estimation of the Proposed VI (Step 3 and 5)

The suggested VI was estimated for all 16 fishing shelters according to [21].
V I = w PHYS × norm 1 n PHYS + w ENV × norm 1 n ENV + w TECH × norm 1 n TECH + w SOEC × norm 1 n SOEC
where norm 1 n PHYS ,   norm 1 n ENV ,   norm 1 n TECH ,   and   norm 1 n SOEC are the normalised, aggregated values for the physical, environmental, technical and socioeconomic sub-indices, respectively.
The four sub-indices are considered to be equally important in this case study, similar to Kontogianni et al. [21]; thus, the sum of their weights is equal to 1:
w PHYS + w ENV + w TECH + w SOEC = 1
The normalisation of the aggregated values of the four (4) sub-indices was conducted according to Equation (3):
sub - index   normalised   value = Aggvalue min tot max tot min tot × 100
where the Aggvalue is the sum of the values given to each variable within the sub-index, and the maxtot and mintot values depend on the number of parameters and the scale of assessment. For instance, for a sub-index comprising five (5) variables, which are measured on a 1–3 scale, the maxtot equals 15 and the mintot equals 3, respectively.
The VI results were ranked using a priority scale between 1 and 100 (with 1 indicating the lowest priority and 100 the highest), according to Equation (4):
priority   ranking   value = 99 × VI i min vuln max vuln min vuln + 1
where VIi is the value of the composite VI of the i-th shelter, and maxvuln and minvuln are the maximum and minimum VI values observed within the examined group of shelters.
The vulnerability variables were quantified by collecting relevant data from various sources (Table 1), which were mainly departments of Cypriot Ministries. The values assigned to vulnerability variables such as V7, V11 and V14 were validated through site visits in all the examined shelters, undertaken in Autumn 2021, during which physical inspection was performed.
Following the assignment of values to each vulnerability variable, five (5) vulnerability classes were developed for each variable according to the equal interval classification method, with one (1) and five (5) representing the lowest and the highest vulnerability, respectively (Table 2). For V8 (i.e., earthquake zone), only three (3) scores were assigned, (1/5), (3/5) and (5/5) to correspond to zones I, II and III, respectively. For this variable, low (2/5) and high (4/5) vulnerability are not applicable. For illustration purposes, the discrete scores from one (1) and five (5) were assigned a different colour, with the lightest standing for the lowest vulnerability and the darkest representing the highest vulnerability of the sample. For each one of the 16 fishing shelters, each vulnerability variable was scored according to the scale presented in Table 2. Furthermore, the aggregated variables’ scores resulted in scores for the four (4) sub-indices (Equation 3), which were also classified for illustration purposes, according to the equal interval method. Finally, a total VI score for each shelter (Equation 1) and their ranking from the most to the least vulnerable was estimated according to Equation (4).
Table 2. Scale for the assessment of each variable.
Variable Vulnerability Levels
UnitsVery Low (1/5)Low (2/5)Moderate (3/5)High (4/5)Very High (5/5)
V1: Mean wind velocitym/s[1.80–2.43)[2.43–3.07)[3.07–3.70)[3.70–4.34)[4.34–4.97]
V2: Mean air temperature°C[14.29–16.06)[16.06–17.84)[17.84–19.61)[19.61–21.38)[21.38–23.15]
V3: Mean precipitationmm[365.69–445.77)[445.77–525.85)[525.85–605.93)[605.93–686.01)[686.01–766.09]
V4: The 1-year return period extreme significant wave heightm[1.14–1.86)[1.86–2.59)[2.59–3.31)[3.31–4.04)[4.04–4.76]
V5: The 50-year return period extreme significant wave heightm [2.75–4.19)[4.19–5.63)[5.63–7.08)[7.08–8.52)[8.52–9.96]
V6: Sea level (change)mm/year[0–1.27)[1.27–2.55)[2.55–3.82)[3.82–5.10)[5.10–6.37]
V7: SedimentTypeBoulders
(Cobbles)
PebblesSandSiltClay
V8: Earthquake zoneI, II, IIIZone I-Zone II-Zone III
V9: Distance from areas included in NATURA 2000 networkkm[9.86–12.32][7.39–9.86)[4.93–7.39)[2.46–4.93)[0–2.46)
V10: Distance from aquaculturekm[60.71–75.28][46.14–60.71)[31.56–46.14)[16.99–31.56)[2.41–16.99)
V11: Harbour capacityNumber of vessels[7–59)[59–110)[110–162)[162–213)[213–265]
V12: Current usage%[47.37–57.32)[57.32–67.26)[67.26–77.21)[77.21–87.15)[87.15–97.10]
V13: Year of construction/reconstructionYear[2011–2021][2001–2011)[1990–2001)[1980–1990)[1976–1980)
V14: Utilities and facilitiesNumber[2–3)[3–5)[5–7)[7–9)[9–10]
V15: Port layout-[0.12–0.53)[0.53–0.94)[0.94–1.35)[1.35–1.76)[1.76–2.17]
V16: Road network conditionCategoryMotorways, two lanes per directionMain roads, intercity roads, mostly one lane per directionSecondary road network, mostly connecting rural areas. One paved lane per directionLocal and unclassified roadsDirt roads
V17: Distance from the closest human settlementkm[0.16–1.04)[1.04–1.92)[1.92–2.79)[2.79–3.67)[3.67–4.55]
V18: Number of inhabitants of the closest human settlementNumber[448–12755)[12755–13203)[13203–25958)[25958–38713)[38713–101000)
V19: Number of professional usersNumber[6–26)[26–46)[46–67)[67–87)[87–107]
V20: Distance from the closest portkm[0.17–5.69)[5.69–11.22)[11.22–16.74)[16.74–22.27)[22.27–27.79]
V21: Maintenance costs during the last 15 years (×103)Euros[[]660–825[495–660)[330–495)[165–330)[0–165)

2.5. Validation of the Proposed VI (Step 4)

To validate the results of the proposed VI, the representatives of professional fishermen answered a series of questionnaires during the site visits in Autumn 2021. The representatives of fishermen have been contacted in advance and were requested to answer 25 questions (Table S1.1 in [35]) relevant to the shelter’s climatic, socioeconomic, operational and infrastructural characteristics. In total, 25 questionnaires were completed by one (1) or two (2) representatives in each shelter.
To further investigate the differences in results of the proposed VI based on experts’ perceptions about the vulnerability of the fishing shelters, two (2) half-hour interviews were conducted with representatives of DFMR and CPA, during which the problems of the shelters were discussed, mainly in relation to the shelters’ structures and operations as well as their contribution to the fishing and tourism industries of the country.

3. Results and Discussion

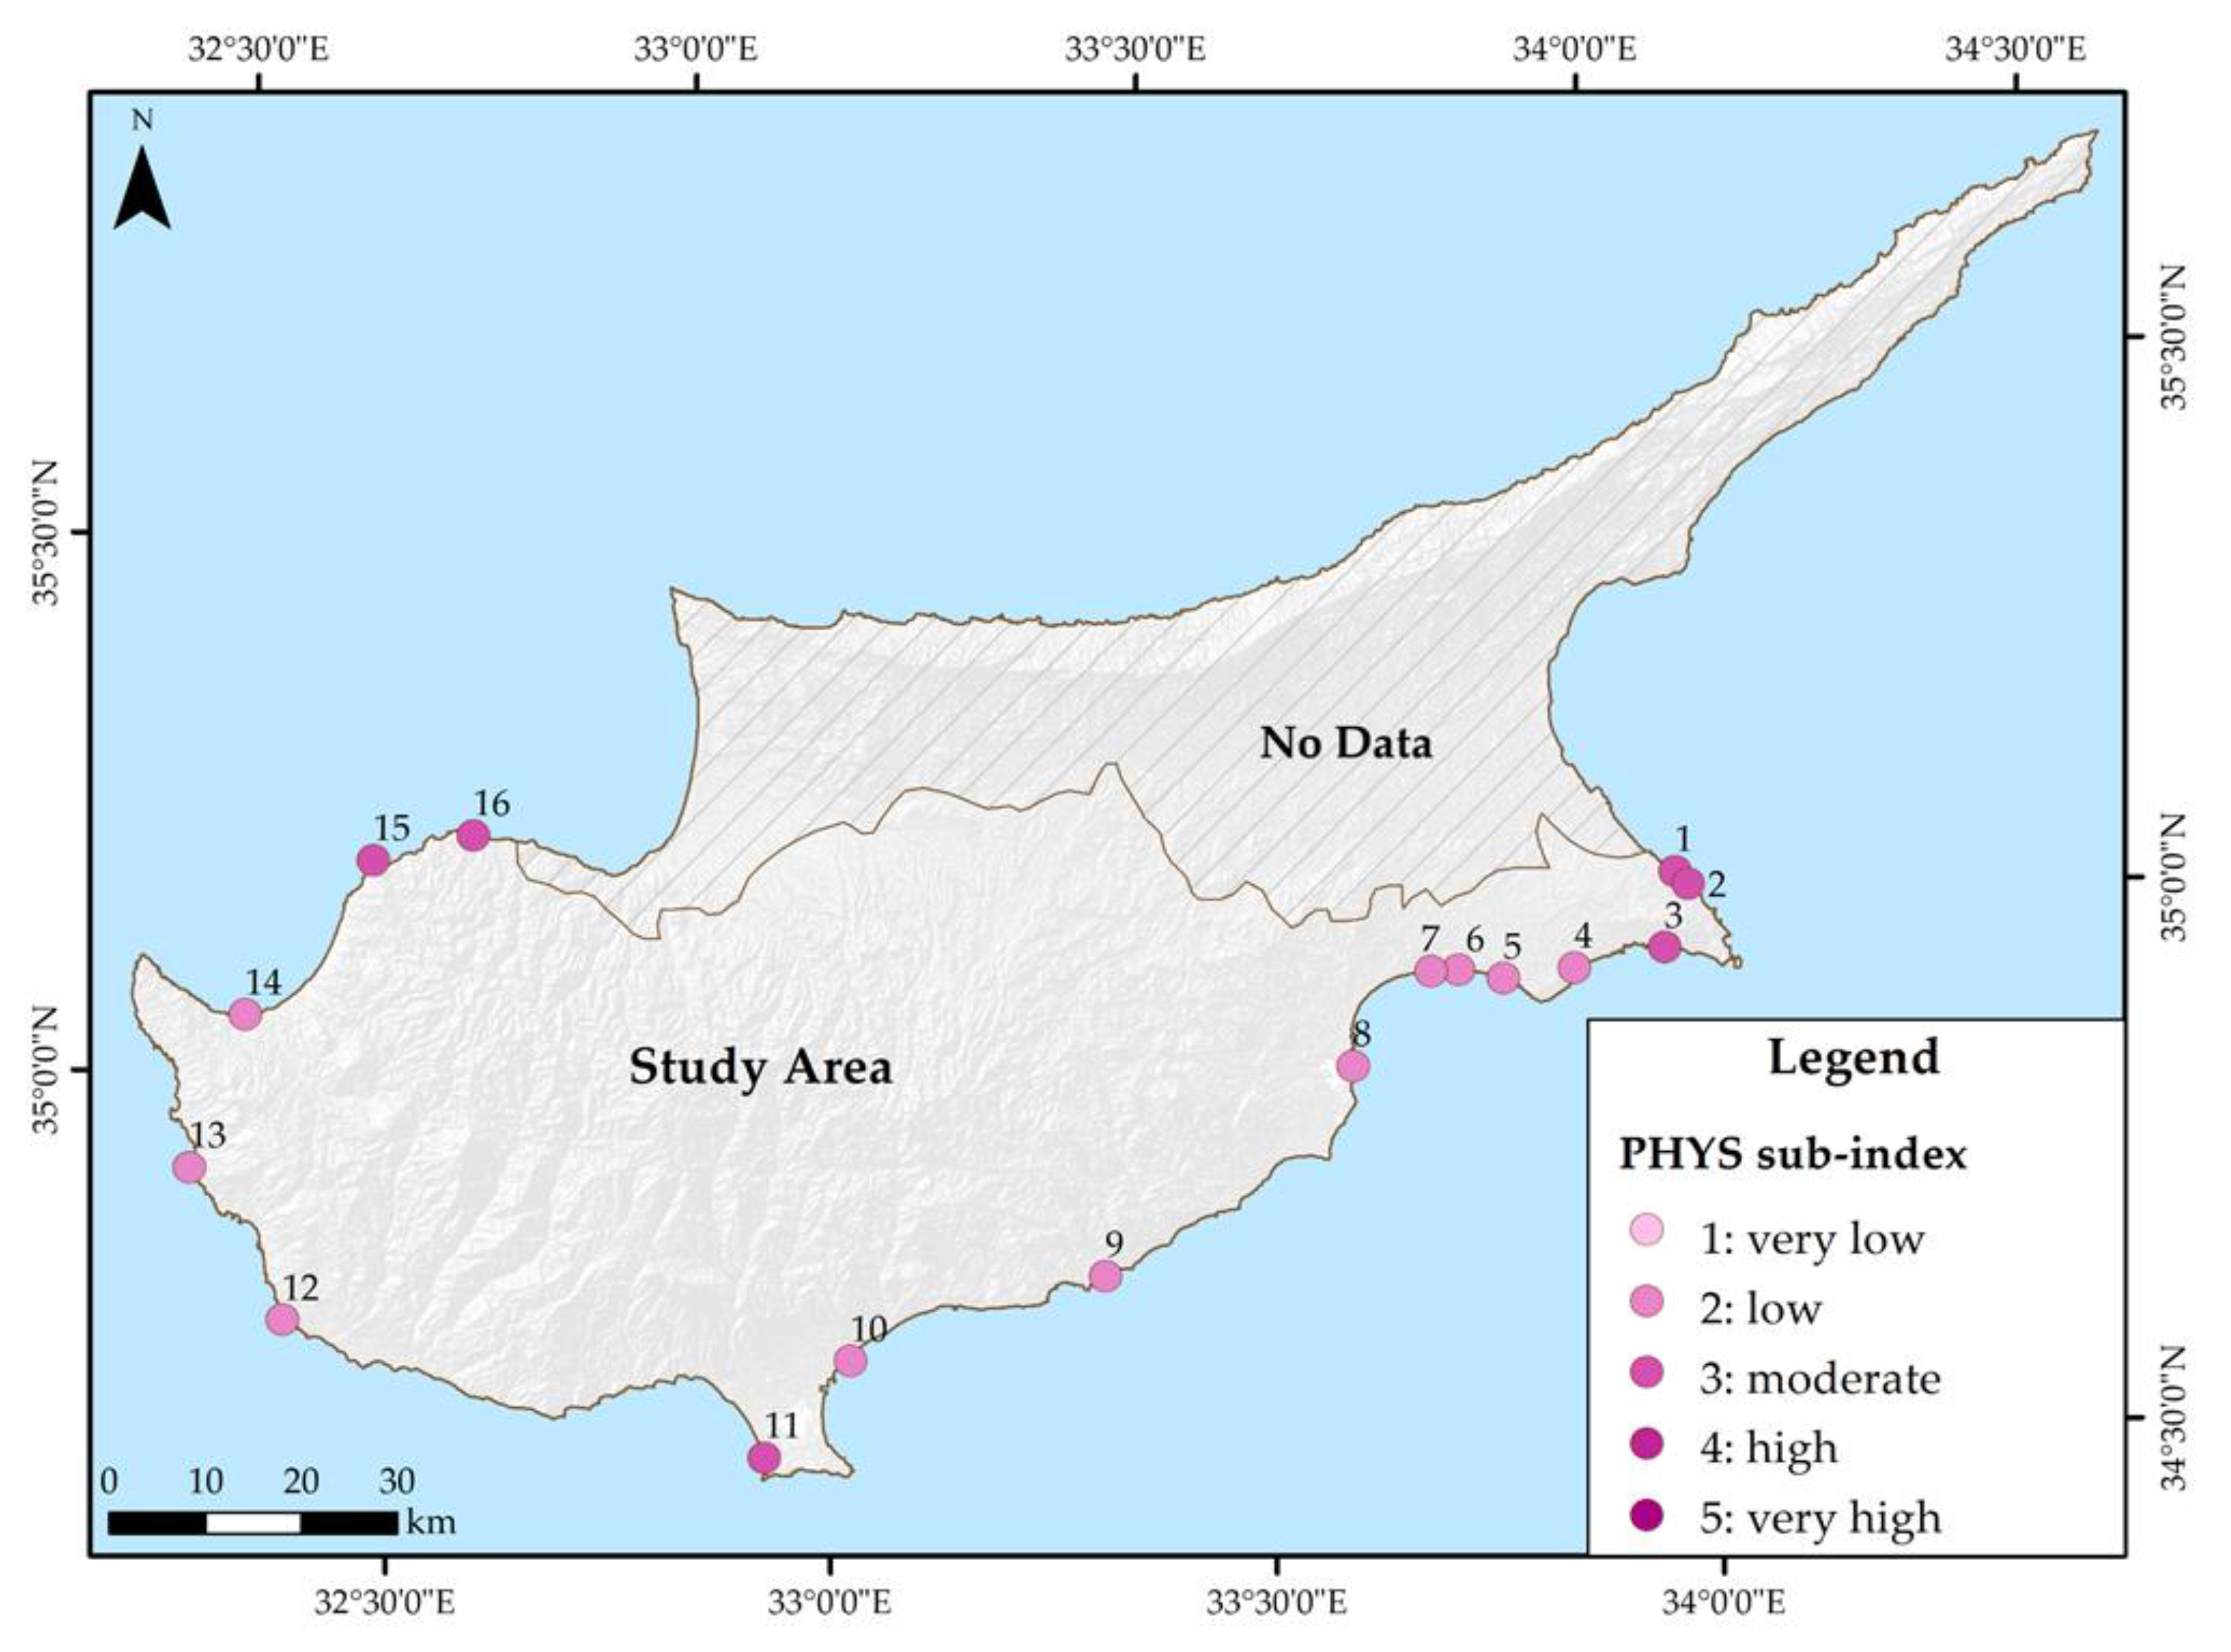
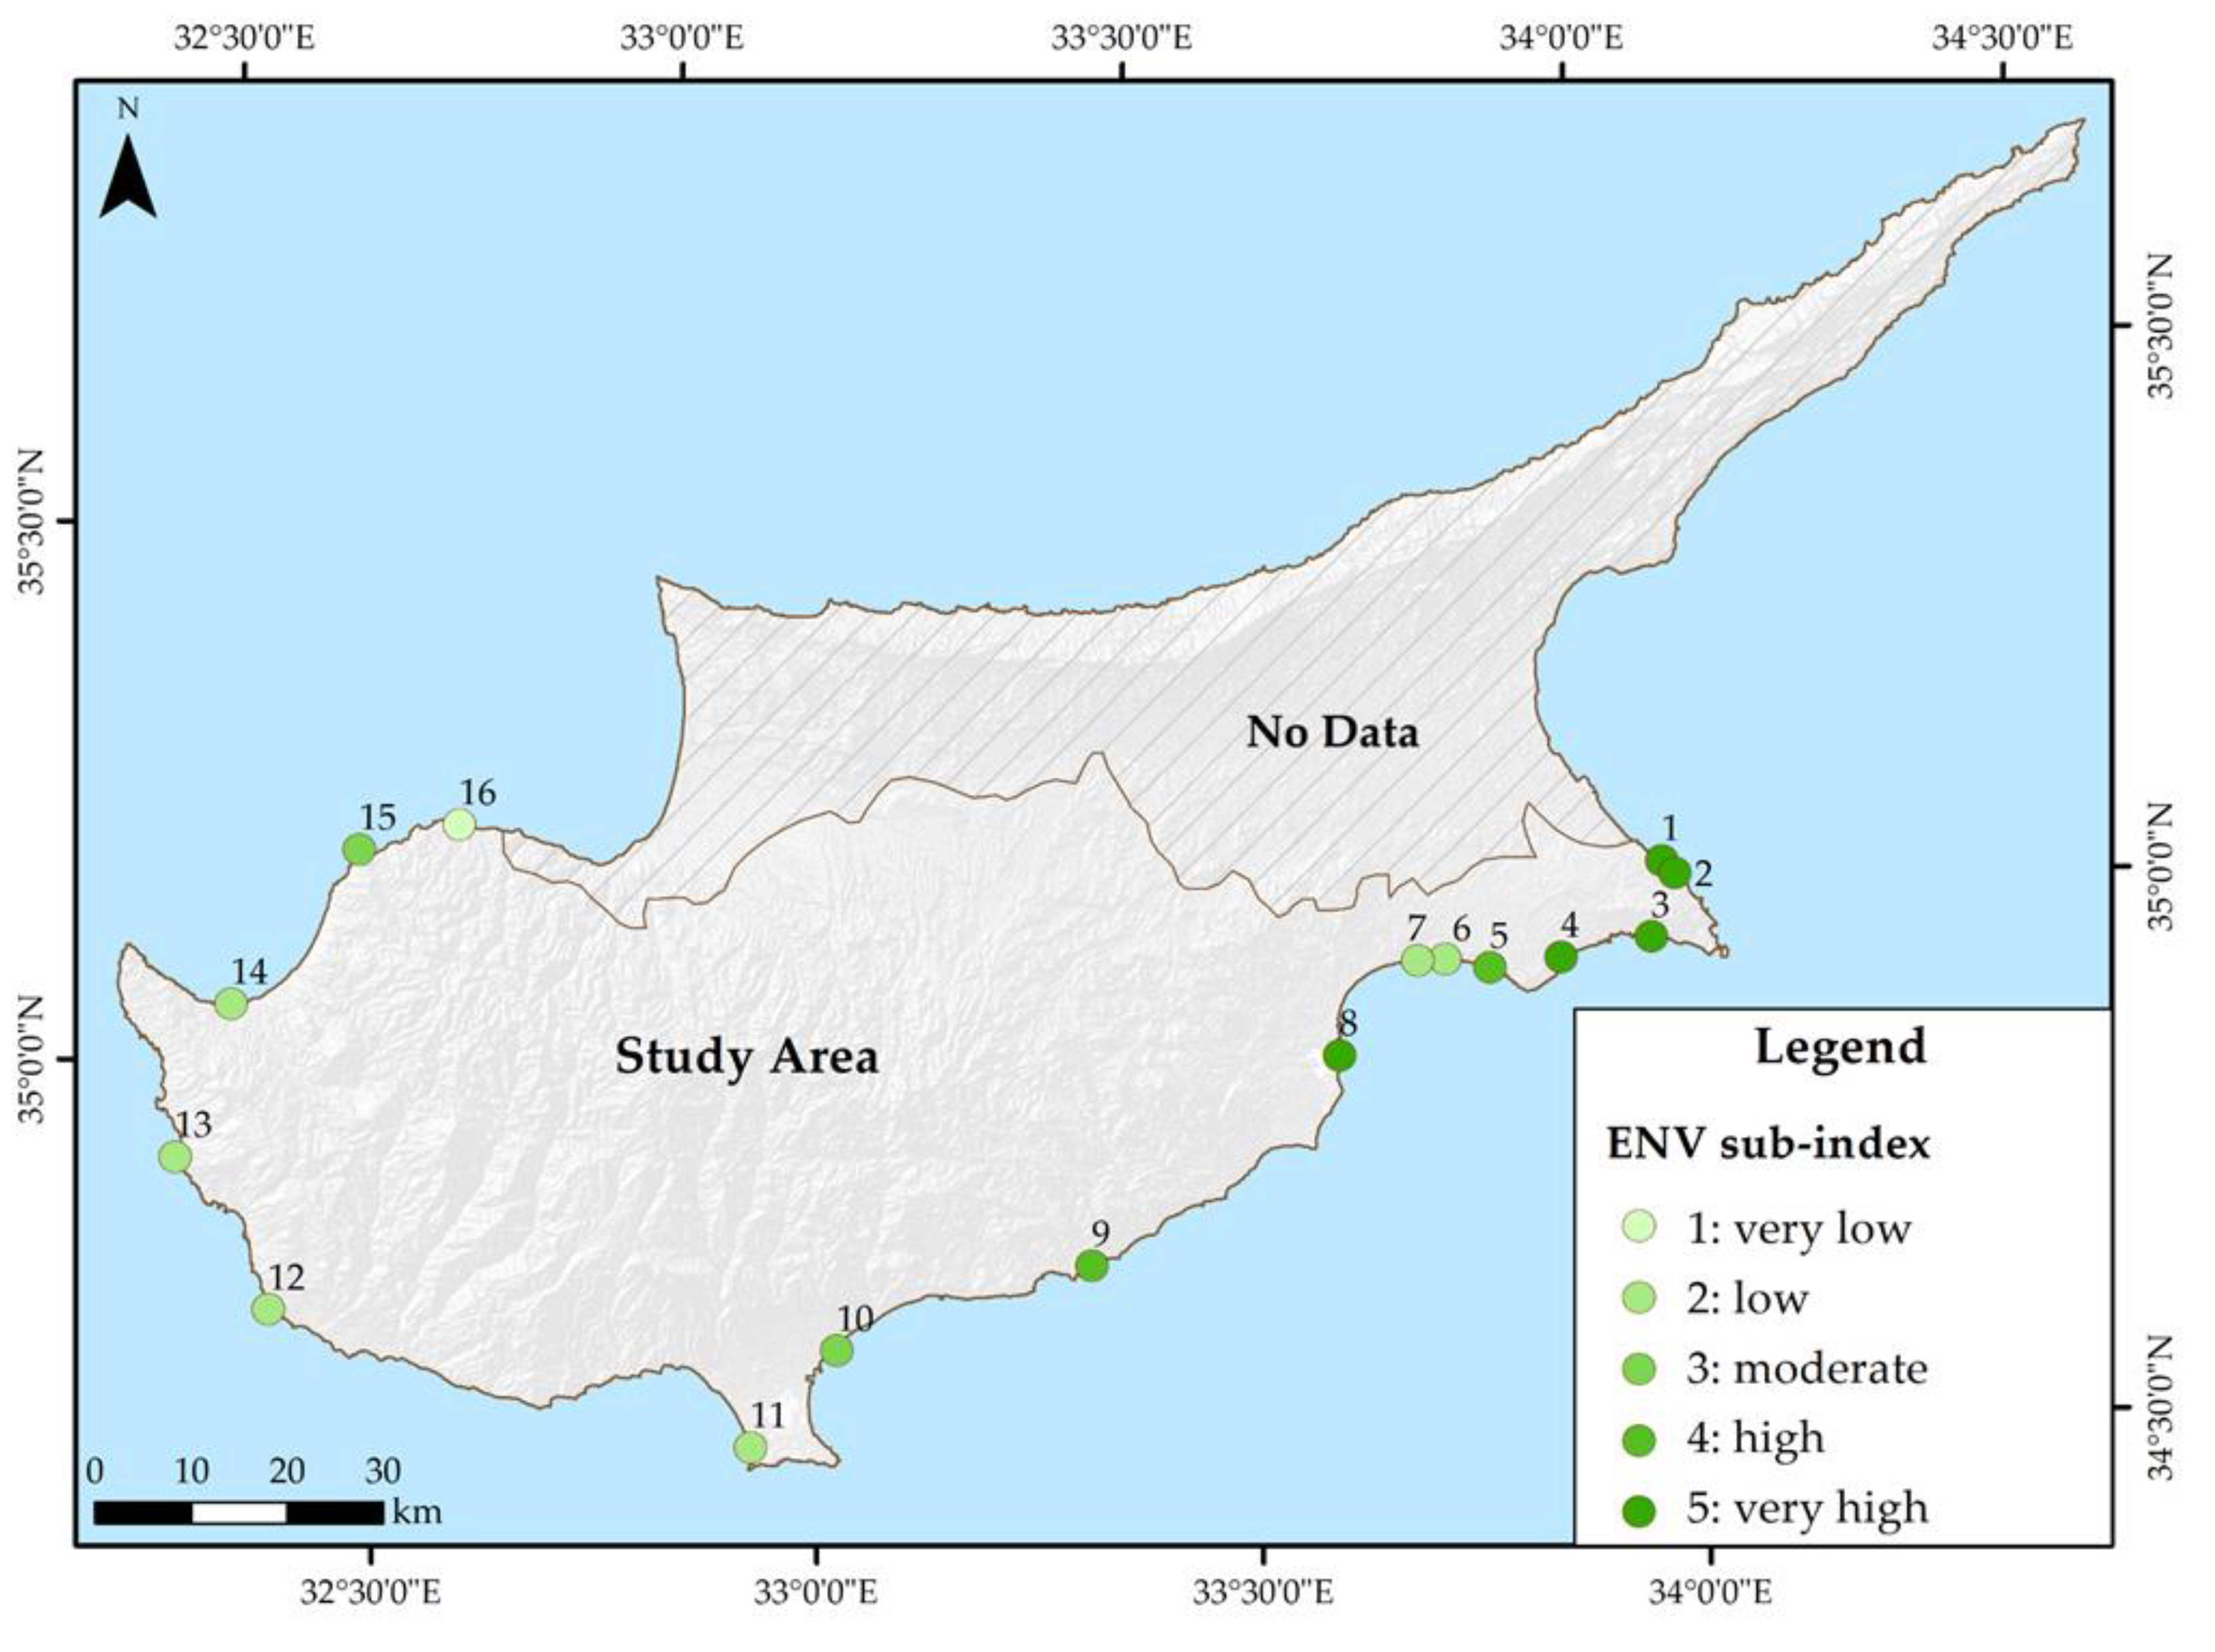
3.1. Current Vulnerability Assessment

The analysis of the physical, environmental, technical, and socioeconomic parameters contributing to the current vulnerability of the 16 Cypriot fishing shelters (Figures S2.1–S2.21 in [35]) resulted in ranking the shelters from the most to the least vulnerable (#1 and #16 in Figure 3, respectively). Overall, most scores indicating very high vulnerability (5/5; Table 2) were found within the environmental sub-index, which was followed by the scores of the socioeconomic sub-index (i.e., five and four out of the 16 shelters are scored with 5/5, respectively). The lowest vulnerability was observed within the physical and the technical sub-indices (i.e., five out of the 16 shelters were scored with 5/5). However, the assessment scale for the physical sub-index also comprises the values of the parameters of the RCP scenarios. Therefore, the values of the current assessment were lower since the scale encompasses higher values of climate change projections for the variables V1–V6 (Table 2). The fishing shelter of Agia Napa has been identified as the most vulnerable (#1 in Figure 3) among the 16 shelters, which is mainly due to its very high vulnerability scores in the environmental and technical sub-indices, and this is followed by the shelters of Larnaca, Liopetri and Paralimni (#2–#4 in Figure 3). On the other hand, the shelter of Pyrgos (#16 in Figure 3) was the least vulnerable one with moderate vulnerability (3/5; Table 2) in the physical sub-index and very low vulnerability (1/5; Table 2) in all other sub-indices. In between, the shelters’ ranking did not follow a clear pattern, such as a geographical one, and further investigation of the sub-indices and the parameters affecting the vulnerability was required.
Regarding the physical sub-index, the fishing shelters of Agia Triada, Paralimni, Agia Napa, Akrotiri, Pomos and Pyrgos (1–3, 11, 15, 16 in Figure 4) were identified as the most vulnerable ones. For the shelters in the southeastern part of the island (1–3 in Figure 4), the physical parameters responsible for their increased vulnerability were the mean wind velocity and the mean air temperature. Also, these shelters were found within the boundaries of seismic zone III, thus presenting very high vulnerability (i.e., 5/5; Table 2) in the category of geomorphology. For the shelters in the northwestern part of Cyprus (15 and 16 in Figure 4), current physical vulnerability was due to increased mean wind velocity and precipitation and increased exposure to wave action. The fishing shelter of Akrotiri (11 in Figure 4), which ranks as the most physically vulnerable shelter, demonstrated very high and high vulnerability in the variables of mean wind velocity, air temperature, precipitation and wave height (i.e., 5/5 for the mean wind velocity and 4/5 for the other variables; Table 2). The shelters of Limassol and Larnaca were the least vulnerable ones with respect to their physical parameters.
The vulnerability of the shelters from an environmental perspective is illustrated in Figure 5. The shelters Agia Triada, Paralimni, Agia Napa and Liopetri (1–4 in Figure 5), as well as Larnaca (8 in Figure 5) demonstrated the highest environmental vulnerability, whereas the shelter of Pyrgos (16 in Figure 5) was the least vulnerable. Indeed, the shelters of the southeastern part are in close vicinity with both areas included in the NATURA 2000 network (i.e., 0–4.93 km; Table 2) and aquaculture sites (i.e., 2.41–16.99 km). On the contrary, despite those shelters of the western part, namely Paphos, Akrotiri, Agios Georgios, Latsi, Pomos, and Pyrgos (12–16 in Figure 5), being also very close, or even within (i.e., Agios Georgios; 13 in Figure 5) NATURA 2000 areas, they are very far from aquaculture sites, thus scoring less in environmental vulnerability.
The most vulnerable shelters from a technical aspect were Agia Napa and Larnaca (3 and 8 in Figure 6), which was mainly due to their year of construction (i.e., 1976 and 1979, respectively) and the absence of any reconstruction activities since then. Furthermore, these two (2) shelters, along with Agia Triada, Paralimni, Zygi and Limassol (1, 2, 9 and 10 in Figure 6) demonstrated the highest current usage percentages (i.e., 87.15–97.10%; Table 2), denoting the shortage of space available for berthing. Even the shelter of Zygi, which is among the newest shelters (i.e., reconstructed in 2010) and has the highest harbour capacity (i.e., able to host 265 boats), has reached a 92.08% usage in 2021. The shelters of the western part (i.e., Akrotiri to Pyrgos; 11–16 in Figure 6) have very low capacity and were not full throughout the year. Most shelters showed high or very high vulnerability (i.e., 4/5 and 5/5; Table 2) regarding their layout, except for Paralimni and Agios Georgios (2 and 13 in Figure 6). None of the shelters was found connected to a road classified as a motorway, with the worst road network identified around the shelter of Xylophagou. The shelters of Xylotympou and Akrotiri (7 and 11 in Figure 6) had the lowest number of utilities and facilities within their terrestrial area with the shelters of Agios Georgios, Pomos and Pyrgos (13, 15 and 16 in Figure 6) following. On the contrary, Zygi and Latsi were found as the most modern and well-equipped Cypriot fishing shelters.
Regarding the socioeconomic aspect, the most vulnerable shelters were the ones of Larnaca and Zygi (8 and 9 in Figure 7), which is mainly because these are the shelters mostly used by professional fishermen. The shelter of Agios Georgios (13 in Figure 7) also ranked very highly in socioeconomic vulnerability because of its isolation from human settlements. Furthermore, Larnaca shelter is located within the city’s boundaries. Therefore, more inhabitants will be potentially affected in case of accident or catastrophic events. Zygi is far from the closest port (i.e., 27.79 km; Table 2). In case of port closure, stoppage or accident, the numerous professional users of Zygi’s shelter have the longest distance to sail for safe berthing. The shelters of the northwestern part (Agios Georgios to Pyrgos; 13–16 in Figure 7) demonstrated very low and low vulnerability (i.e., 1/5 and 2/5; Table 2) in the number of professional users and inhabitants of the closest human settlement, since they are fairly isolated compared to the shelters of the southeastern part. Regarding maintenance costs, most shelters have received little or no funding for maintenance operations during the last 15 years, which is in conjunction with the absence of utilities and facilities shown in the technical sub-index. However, important construction and reconstruction costs were not considered in this paper, including the high construction cost of Zygi, of approximately 15 million euros.

3.2. Site Visits

The site visits (S3.1–S3.16 in [35]) were extremely helpful during the validation process and should be considered a prerequisite in a robust vulnerability assessment. Indeed, there were observations, such as defects, which would be impossible to be made without visiting the shelters. For instance, in the shelter of Xylophagou (5 in Figure 2), waste disposal was observed in the terrestrial zone of the shelter. At the same time, temporary structures were found in the shelter of Liopetri (4 in Figure 2), affecting the shelter’s overall facilities’ condition and safety. Furthermore, maintenance works were observed in Ormideia (6 in Figure 2), and a damaged boat slip was found in Xylotympou (7 in Figure 2).

3.3. Questionnaires

In total, 25 questionnaires were completed by representatives of the professional fishermen in each fishing shelter. For the shelters of Liopetri and Akrotiri (4 and 11 in Figure 2), no representative was present; thus, no questionnaires were completed. Overall, the shelters of Paphos, Agios Georgios, Pomos, and Pyrgos (12, 13, 15, 16 in Figure 2) were identified as the most vulnerable by professional fishermen. The main reasons for this increased vulnerability were the insufficient space for berthing and the increased wave action in the island’s western part, which jeopardises safe boat manoeuvring and berthing. The results were consistent with the analysis findings, which indicated high and very high vulnerability scores in the variables related to wave height (i.e., V4 and V5; Table 2). The harbour capacity of these shelters is indeed limited, albeit in our case, the lower the capacity, the lower the vulnerability (Section 3.1, Table 2). Furthermore, fishermen from nine (9) shelters reported a significant decrease in fishing stocks, which was mainly due to the presence of invasive species, especially lionfish in the southern and southeastern parts of the island.

3.4. Interviews

With regard to the interviews’ results, there was a consensus with the fishermen’s views regarding the fishing shelters that face severe operational and structural problems. These were the shelters of Paphos, Agios Georgios, Pomos and Pyrgos (12, 13, 15, and 16 in Figure 2). In particular, the issues of wave agitation and overtopping, resulting in difficulty in safe berthing, were highlighted. The shelter of Xylophagou (5 in Figure 2) was also identified as vulnerable concerning its structural condition and layout. The interviewees indicated the shelters of Akrotiri (11 in Figure 2), Pomos and Pyrgos as the least cost-effective and the shelters of Agia Napa and Limassol (3 and 10 in Figure 2) as the most profitable ones. The representatives of DFMR and CPA indicated that five (5) out of 16 shelters do not have electricity and water supply and that seven (7) out of 16 do not have any fire safety facility or equipment.

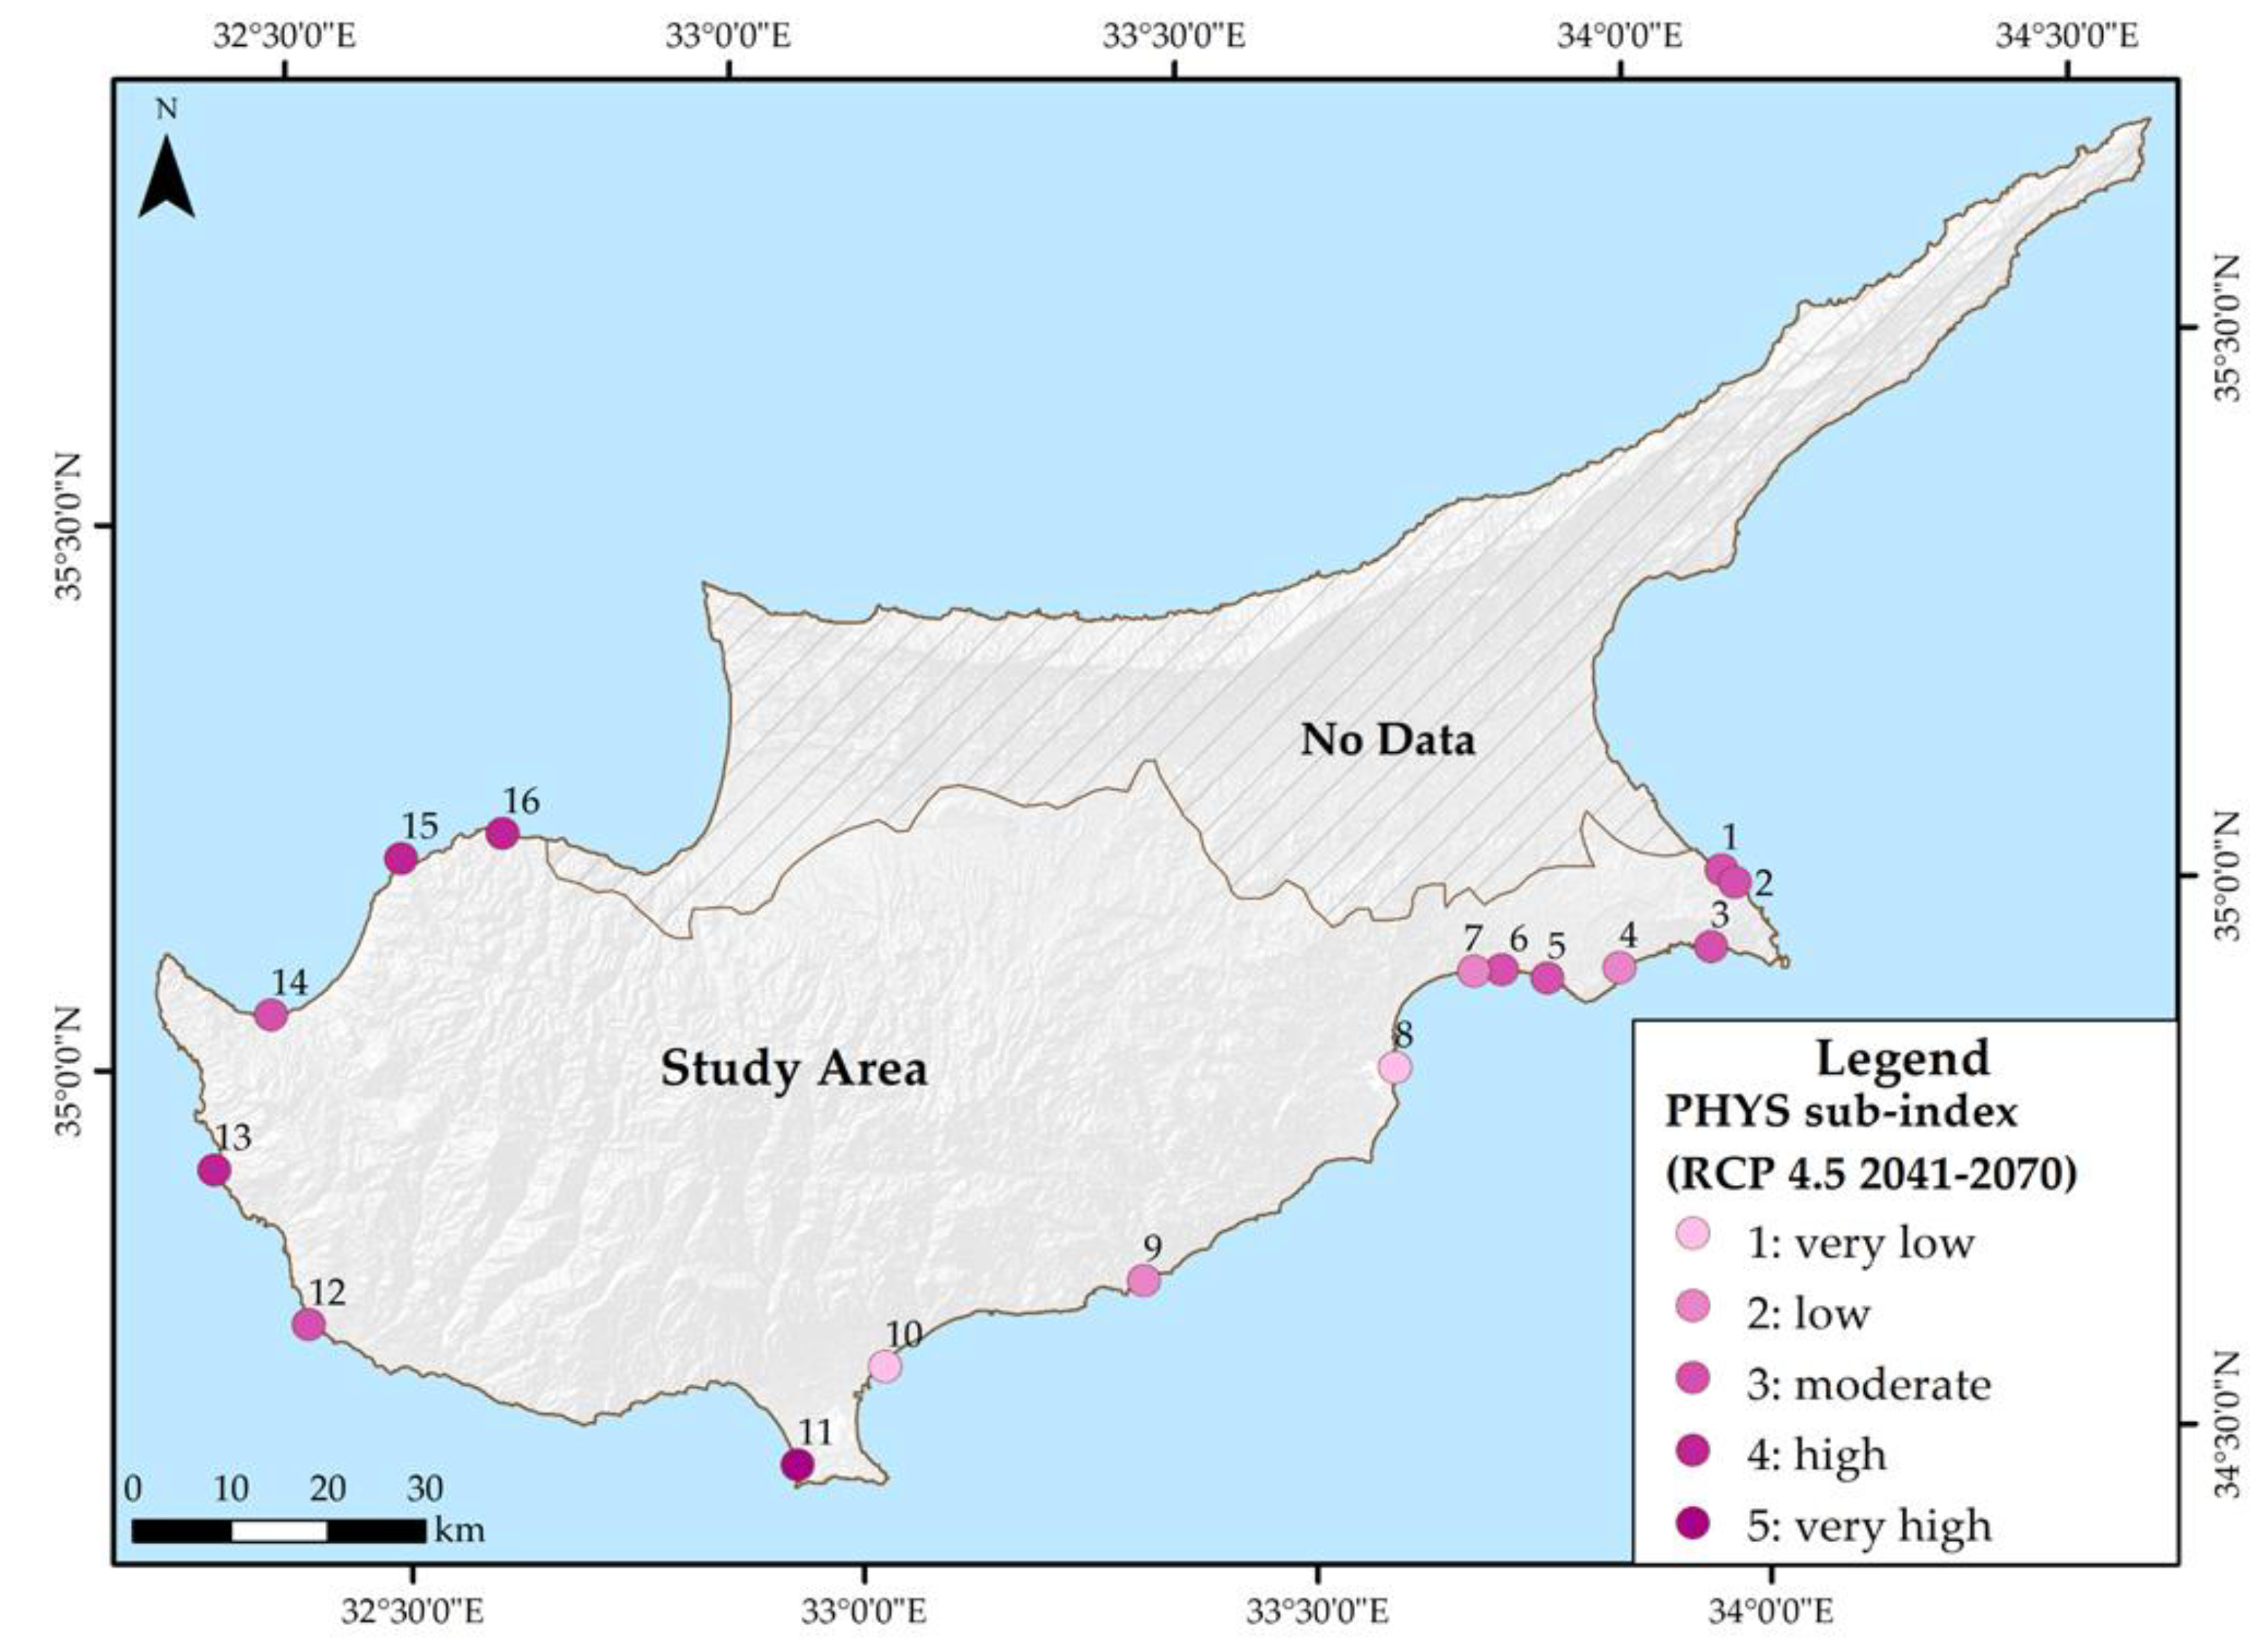
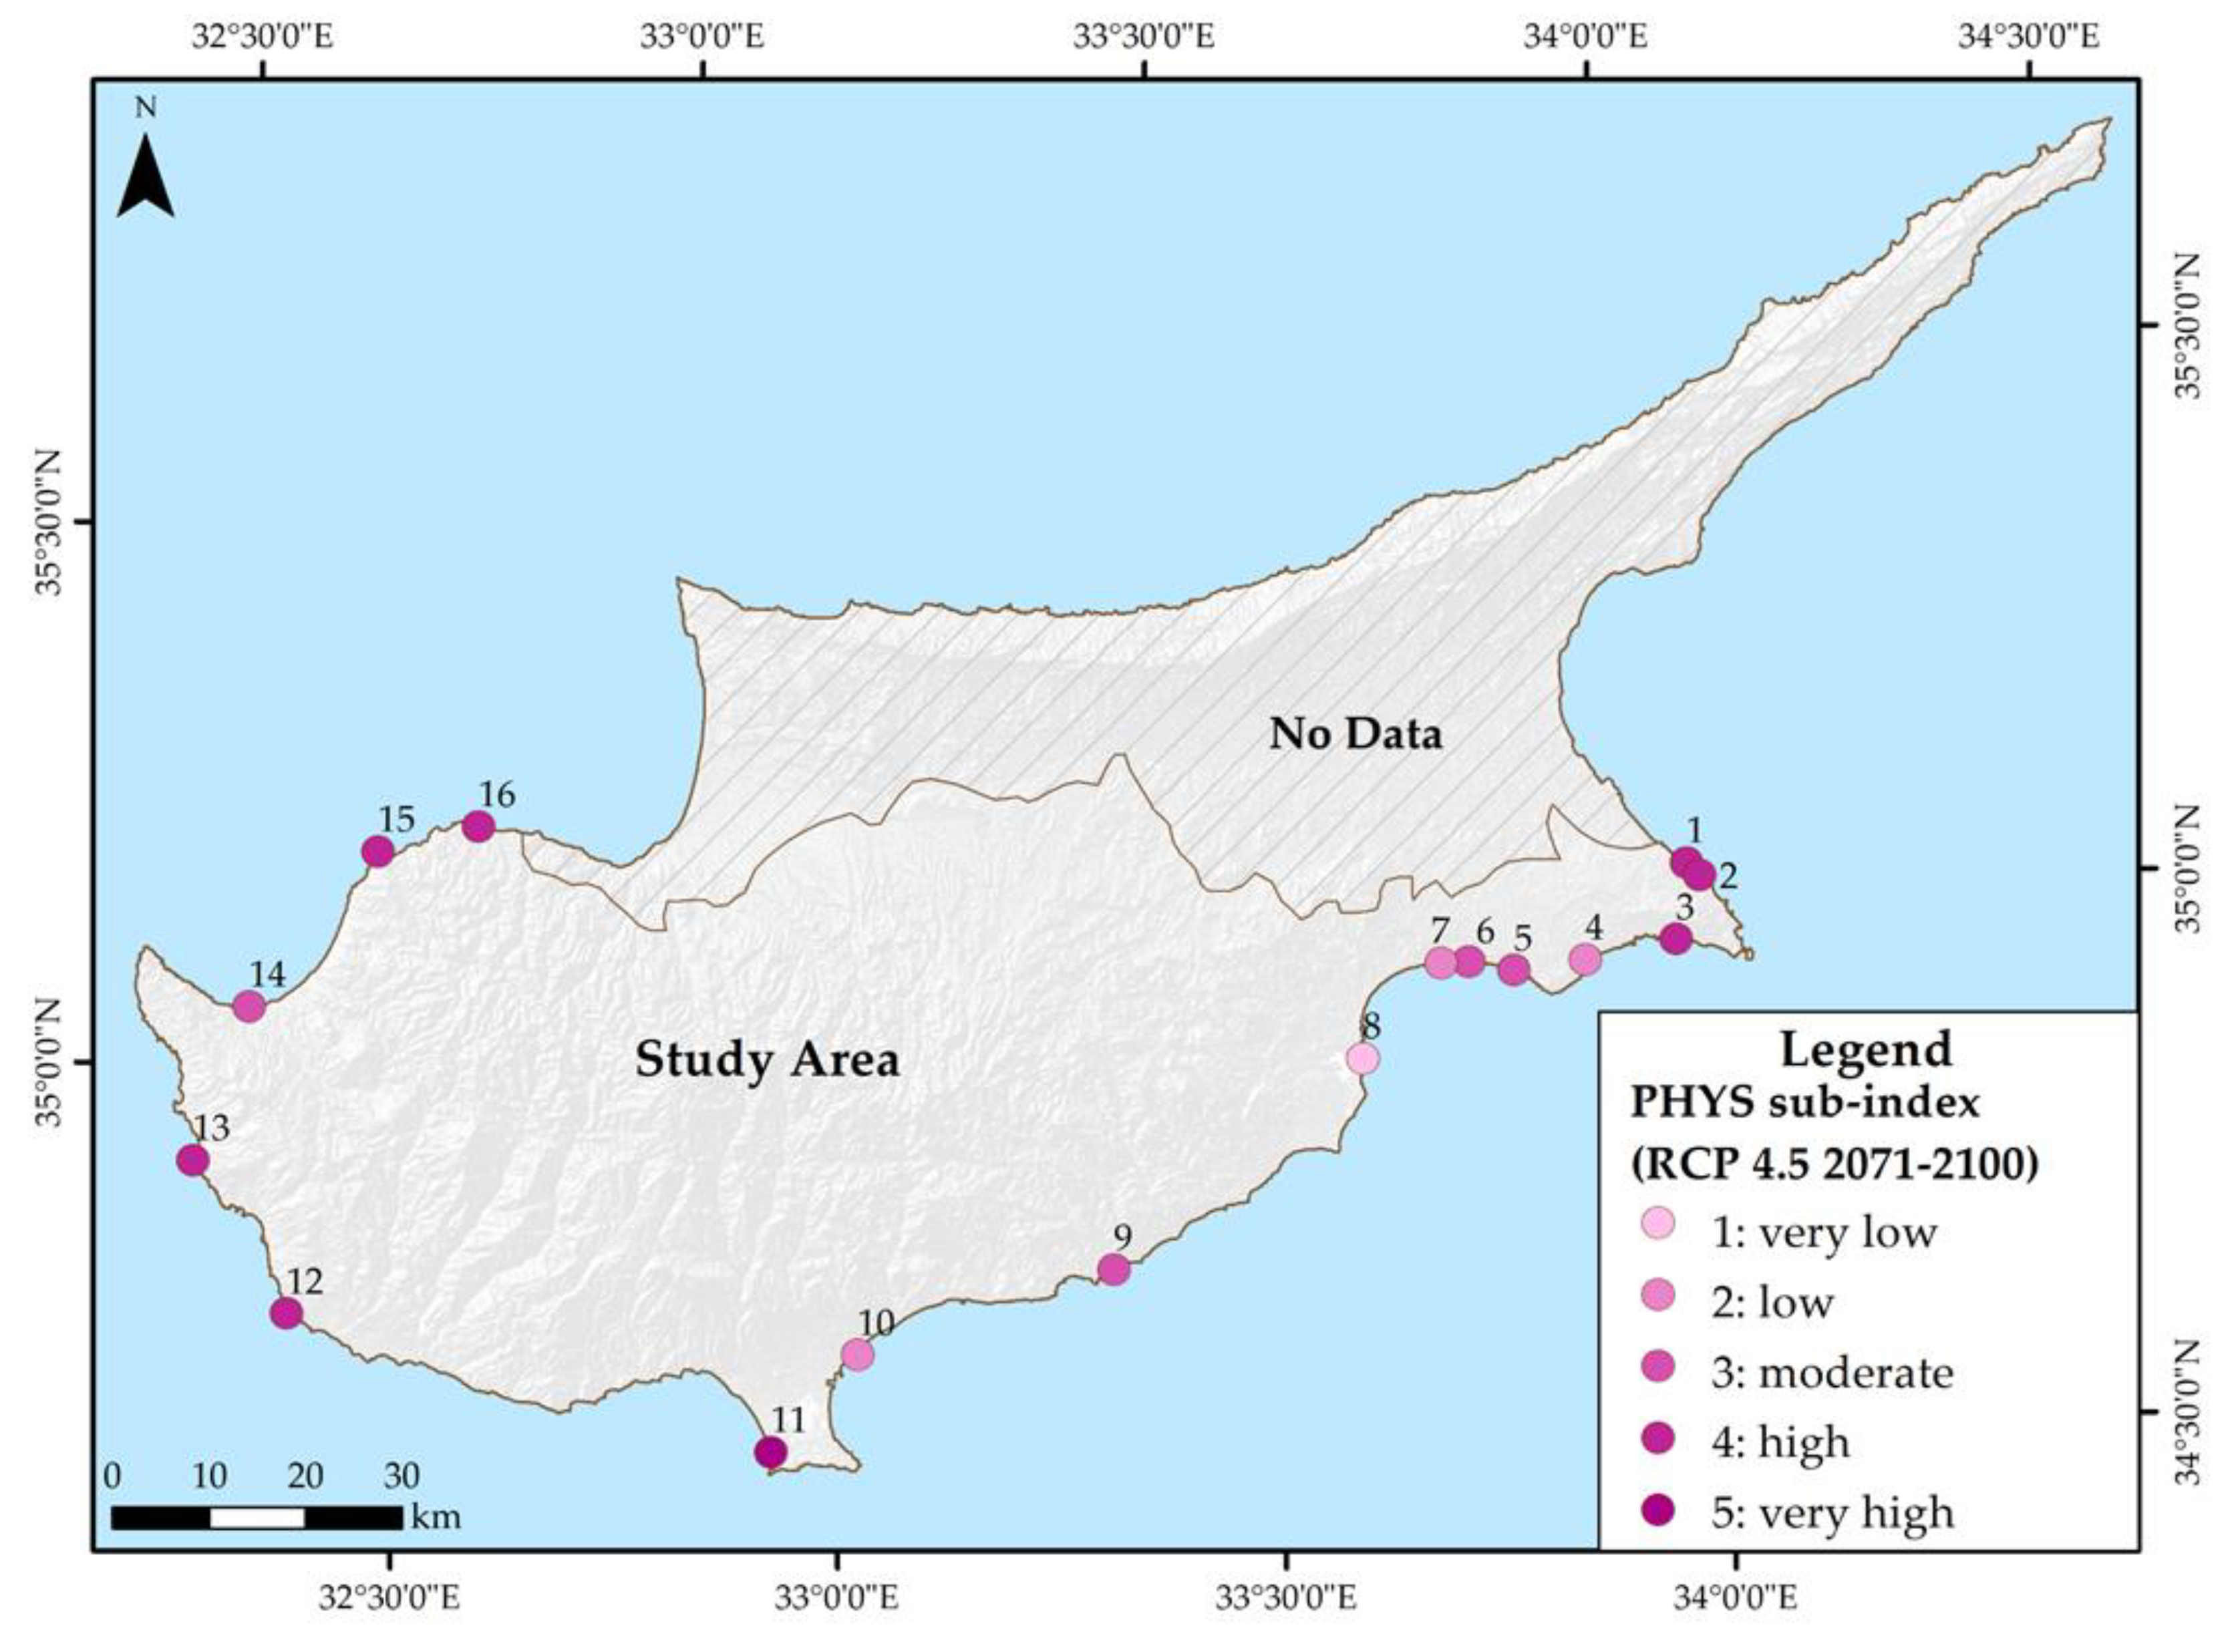
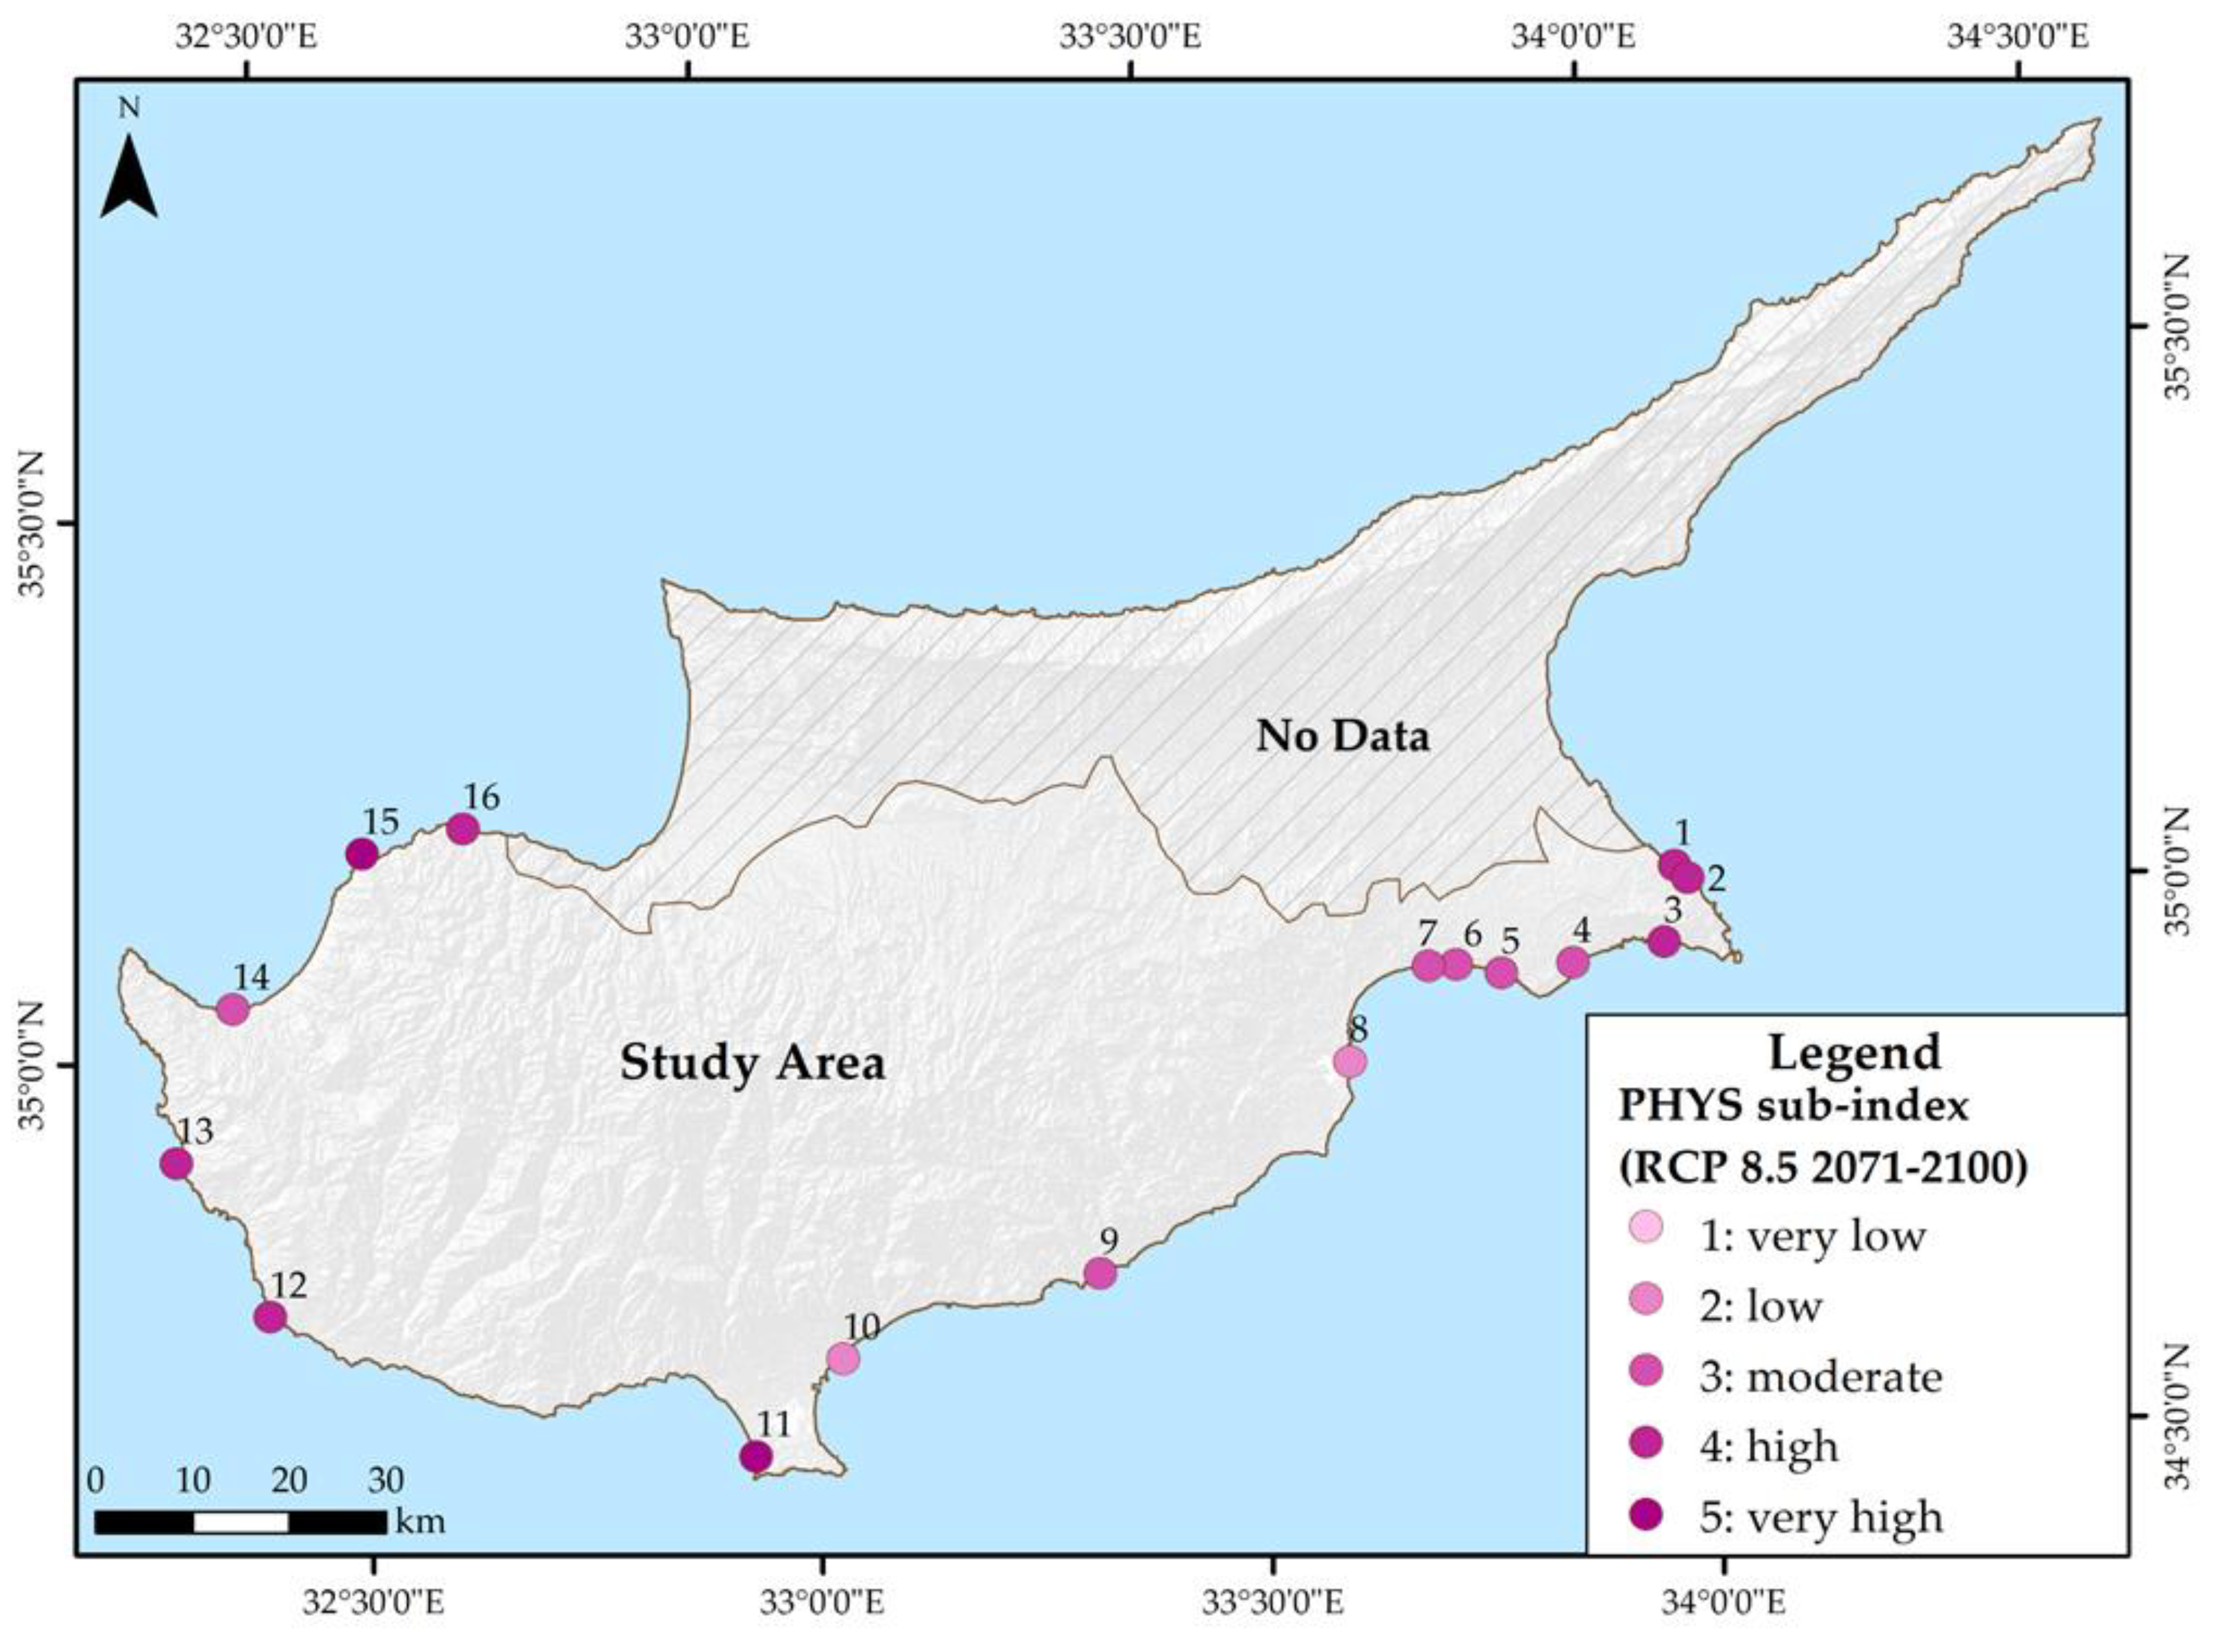
3.5. Future Vulnerability Assessment

Since only six (6) out of the 21 vulnerability variables were altered according to climate change projections (V1–V6; Table 1), which are included in the physical sub-index, the changes in this particular sub-index are illustrated in Figure 8, Figure 9, Figure 10 and Figure 11. The remaining variables were excluded from this future assessment mainly because the use of socioeconomic projections has been scarce compared to the climate ones [36] but also because projections of the hereto considered variables differ in terms of time horizons. For instance, projections for utilities and facilities of the shelter (V14) are stemming from policy-making and strategic planning, usually undertaken up to 2030 or even 2050, whereas projections regarding wind velocity (V1) are obtained up to 2100. Overall, all shelters demonstrated higher vulnerability compared to the current one, which considered values of V1–V6 for the period 2076–2005. For all the shelters, sea level rise seems to contribute to their increased vulnerability. V6 (Table 2), depicting changes in sea level, was found to increase from very low (1/5) to high (4/5) for RCP 4.5 and very high (5) for the RCP 8.5 scenario. In both scenarios, the fishing shelter of Akrotiri (11 in Figure 8, Figure 9, Figure 10 and Figure 11) was the most vulnerable, since it showed high and very high vulnerability in all the physical variables of climate and hydrodynamic conditions categories (Table 1). In contrast, the least vulnerable from a physical perspective was Larnaca. When RCP 4.5 was considered, for the years 2041–2100, the physical vulnerability of all shelters increased at least by one level except for the shelters of Agia Triada, Liopetri, Larnaca and Limassol (1, 4, 8, 10 in Figure 8), which remained constant. For instance, Xylotympou’s (7 in Figure 8) physical vulnerability increased from low (2/5) to moderate (3/5) for this short-term RCP 4.5 scenario. The most striking rise was observed in the northwestern shelters, namely Agios Georgios, Latsi, Pomos and Pyrgos (13–16 in Figure 8), which was mainly due to increased wave height and sea level. In the long-term consideration of RCP 4.5, hence for the years 2071–2100, a rise was observed in the vulnerability of Agia Triada, Paralimni and Agia Napa (1–3 in Figure 9), which was due to the projected increase in annual mean air temperature and precipitation in these areas. The estimation of physical vulnerability in the context of the most pessimistic scenario, RCP 8.5, showed a further increase in vulnerability scores in the short term (2041–2070), but there was a stabilisation or even decrease in the long term (2071–2100). This is mostly attributed to the variations of the metocean parameters affecting the wave penetration in the harbour basin (i.e., V2, V4 and V5; Table 1). In particular, when RCP 8.5 is considered, the average wind speed is expected to remain relatively unchanged compared to the historical period (1976–2005), but a shift in wind direction can alter the offshore sea-state wave characteristics [29,30] and reduce the agitation levels for the RCP 8.5 scenario at the harbour basin [37]. For RCP 8.5, the shelters located in the northwestern side of Cyprus are anticipated to become even more vulnerable, since the vulnerability scores for annual mean wind velocity, air temperature, precipitation and wave height were all found high to very high (4/5 and 5/5, respectively).

4. Conclusions

In this work, an integrated framework for assessing the vulnerability of fishing shelters was proposed. The framework was applied in the 16 shelters of Cyprus and involved the development of a vulnerability index comprising 21 physical, environmental, technical and socioeconomic variables associated with the determination of four (4) sub-indices. The variables were chosen to incorporate different aspects of the fishing shelters in an effort to holistically examine vulnerability. The parameters were quantified and scored on a scale of 1–5, with 1 denoting very low vulnerability and 5 denoting very high vulnerability. Six (6) out of eight (8) physical variables reflect each area’s climatic and hydrodynamic conditions and were quantified by considering both hindcast and forecast data to assess current and future vulnerability. For the current assessment, data for the period 1976–2005 were taken into account, whereas for the future one, two (2) RCP scenarios—namely, RCP 4.5 and RCP 8.5 were considered—with respect to two (2) time horizons, 2041–2070 and 2071–2100, resulting in four (4) future scenarios. The approach allowed for comparison among the shelters at present and examination of vulnerability alterations due to climate change. The most common constraints in assessing future vulnerability are high uncertainties in projecting future socioeconomic development [38], lack of conceptual clarity, and methodological limitations, most notably the lack of future-oriented socioeconomic data at an usable spatial scale [39]. Overall, vulnerability indices constitute simplifications of vulnerability, which is a complex and immeasurable phenomenon [11]; therefore, the index results need to be critically evaluated and linked to the analysis of drivers that increase vulnerability [36]. Furthermore, the vulnerability was perceived as a dynamic process during which stakeholders’ views and real-time observations are necessary to acquire a robust overview of the shelters’ vulnerability. To validate the current assessment, site visits were performed in all shelters, during which professional fishermen answered questionnaires. In addition, interviews with representatives of the port authorities were also conducted.
Overall, vulnerability was proven to result from strong interconnections between all components of each fishing shelter. Policymakers and stakeholders should examine the full vulnerability spectrum before allocating adaptation funding and prioritising interventions rather than solely considering an aggregated vulnerability score. In particular, Agia Napa and Larnaca were identified as the most vulnerable Cypriot shelters. Their vulnerability predominantly stemmed from socioeconomic and technical aspects related to their capacity and occupancy. However, these shelters were less vulnerable with respect to their physical parameters when compared to the shelters of the western and northwestern parts of the island. These shelters demonstrated low to moderate total vulnerability. However, they were highly to very highly vulnerable when only the physical aspect was considered since they were found to be exposed to increased wind velocity, precipitation depths and wave height. The problem is anticipated to further exacerbate when climate change projections were considered, which generally revealed a rise in sea level for all shelters.
In the context of marine spatial planning, the increased vulnerability of shelters on the southeastern part of the island has to be examined due to their proximity to areas of environmental interest. It was identified, especially via the in situ inspections, the interviews and the questionnaires, that important utilities and facilities such as water supply and fire protection systems are inadequate for most of the shelters. Additional variables that further reflect the hydrodynamic and structural conditions of the shelters could be added in a more technically oriented index. For instance, the percentage of wave height inside the port basin that exceeds a certain threshold and the length of the breakwaters could be added to evaluate the wave agitation levels and the structural conditions of the shelters, respectively. Furthermore, geomorphological variables such as slope and elevation could be added to describe the condition of the adjacent shoreline in an effort to combine coastal and port vulnerability assessments. The communication between professional fishermen and the port authorities was identified as problematic in some cases, as stated by both sides, which impedes the process of undertaking actions that reduce vulnerability. Designing tailored adaptation pathways that address vulnerability and further increase the shelters’ resilience would require an interdisciplinary team of scientists, decision-makers, fishermen and citizens. The latter is necessary to tackle the complexity of the sectors involved in vulnerability and risk assessments. A potential upscaling of vulnerability assessments and consideration of numerous shelters would require improved data transparency as well as the definition of threshold values to simultaneously examine the vulnerability of fishing shelters found in different geographical and socioeconomic settings.

Author Contributions

Conceptualization, V.I.C. and V.K.T.; methodology, V.I.C., A.P. (Andreas Pantelidis), E.F. and V.K.T.; formal analysis, V.I.C., A.P. (Andreas Pantelidis) and A.P. (Andreas Papadimitriou); investigation, V.I.C., E.F. and A.P. (Andreas Papadimitriou); data curation, V.I.C., A.P. (Andreas Pantelidis), E.F., A.P. (Andreas Papadimitriou) and C.N.T.; writing—original draft preparation, V.I.C.; writing—review and editing, E.F., A.P. (Andreas Papadimitriou), C.N.T., O.N. and V.K.T.; visualization, E.F. and C.N.T.; supervision, V.K.T.; project administration, V.K.T.; funding acquisition, V.K.T. All authors have read and agreed to the published version of the manuscript.

Funding

This research received no external funding.

Institutional Review Board Statement

Not applicable.

Informed Consent Statement

Not applicable.

Data Availability Statement

The data supporting the reported results are openly available in Zenodo at https://doi.org/10.5281/zenodo.8100320 [35].

Conflicts of Interest

The authors declare no conflict of interest.

References

  1. IMO. International Shipping Facts and Figures—Information Resources on Trade, Safety, Security, Environment; Maritime Knowledge Centre: London, UK, 2012. [Google Scholar]
  2. UNCTAD. Key Statistics and Trends in International Trade 2020; UNCTAD: New York, NY, USA, 2021. [Google Scholar]
  3. IPCC. Climate Change 2001: Impacts, Adaptation, and Vulnerability. Contribution of Working Group II to the Third Assessment Report of the Intergovernmental Panel on Climate Change; Cambridge University Press: Cambridge, UK; New York, NY, USA, 2001. [Google Scholar]
  4. Izaguirre, C.; Losada, I.J.; Camus, P.; Vigh, J.L.; Stenek, V. Climate Change Risk to Global Port Operations. Nat. Clim. Chang. 2021, 11, 14–20. [Google Scholar] [CrossRef]
  5. Ng, A.K.Y.; Monios, J.; Zhang, H. Climate Adaptation Management and Institutional Erosion: Insights from a Major Canadian Port. J. Environ. Plan. Manag. 2019, 62, 586–610. [Google Scholar] [CrossRef]
  6. Ng, A.K.Y.; Zhang, H.; Afenyo, M.; Becker, A.; Cahoon, S.; Chen, S.-l.; Esteban, M.; Ferrari, C.; Lau, Y.-Y.; Lee, P.T.-W.; et al. Port Decision Maker Perceptions on the Effectiveness of Climate Adaptation Actions. Coast. Manag. 2018, 46, 148–175. [Google Scholar] [CrossRef]
  7. Verschuur, J.; Pant, R.; Koks, E.; Hall, J. A Systemic Risk Framework to Improve the Resilience of Port and Supply-chain Networks to Natural Hazards. Marit. Econ. Logist. 2022, 24, 489–506. [Google Scholar] [CrossRef]
  8. McIntosh, R.D.; Becker, A. Expert Evaluation of Open-data Indicators of Seaport Vulnerability to Climate and Extreme Weather Impacts for U. S. North Atlantic Ports. Ocean Coast. Manag. 2019, 180, 104911. [Google Scholar] [CrossRef]
  9. Becker, A.; Chase, N.T.L.; Fischer, M.; Schwegler, B.; Mosher, K. A Method to Estimate Climate-Critical Construction Materials Applied to Seaport Protection. Glob. Environ. Chang. 2016, 40, 125–136. [Google Scholar] [CrossRef]
  10. PIANC. Climate Change Adaptation Planning for Ports and Inland Waterways, EnviCom WG 178; The World Association for Waterborne Transport Infrastructure: Brussels, Belgium, 2020. [Google Scholar]
  11. Hinkel, J. “Indicators of Vulnerability and Adaptive Capacity”: Towards a Clarification of the Science–Policy Interface. Glob. Environ. Chang. 2011, 21, 198–208. [Google Scholar] [CrossRef]
  12. Hinkel, J.; Klein, R.J.T. Integrating Knowledge to Assess Coastal Vulnerability to Sea-level Rise: The Development of the DIVA Tool. Glob. Environ. Chang. 2009, 19, 384–395. [Google Scholar] [CrossRef]
  13. McLaughlin, S.; Cooper, J.A.G. A Multi-scale Coastal Vulnerability Index: A Tool for Coastal Managers? Environ. Hazards 2010, 9, 233–248. [Google Scholar] [CrossRef]
  14. Duncan McIntosh, R.; Becker, A. Seaport Climate Vulnerability Assessment at the Multi-port Scale: A Review of Approaches. In Resilience and Risk; Springer: Dordrecht, The Netherlands, 2017; pp. 205–224. [Google Scholar]
  15. Chhetri, P.; Corcoran, J.; Gekara, V.; Maddox, C.; McEvoy, D. Seaport Resilience to Climate Change: Mapping Vulnerability to Sea-Level Rise. J. Spat. Sci. 2015, 60, 65–78. [Google Scholar] [CrossRef]
  16. Chapapría, V.E.; Peris, J.S. Vulnerability of Coastal Areas Due to Infrastructure: The Case of Valencia Port (Spain). Land 2021, 10, 1344. [Google Scholar] [CrossRef]
  17. Yang, Y.-C.; Ge, Y.-E. Adaptation strategies for port infrastructure and facilities under climate change at the Kaohsiung port. Transp. Policy 2020, 97, 232–244. [Google Scholar] [CrossRef]
  18. Abdelhafez, M.A.; Ellingwood, B.; Mahmoud, H. Vulnerability of Seaports to Hurricanes and Sea Level Rise in a Changing Climate: A Case Study for Mobile, AL. Coast. Eng. 2021, 167, 103884. [Google Scholar] [CrossRef]
  19. Hanson, S.; Nicholls, R.; Ranger, N.; Hallegatte, S.; Corfee-Morlot, J.; Herweijer, C.; Chateau, J. A global ranking of port cities with high exposure to climate extremes. Clim. Chang. 2011, 104, 89–111. [Google Scholar] [CrossRef]
  20. Hsieh, C.-H.; Tai, H.-H.; Lee, Y.-N. Port Vulnerability Assessment from the Perspective of Critical Infrastructure Interdependency. Marit. Policy Manag. 2014, 41, 589–606. [Google Scholar] [CrossRef]
  21. Kontogianni, A.; Damigos, D.; Kyrtzoglou, T.; Tourkolias, C.; Skourtos, M. Development of a composite climate change vulnerability index for small craft harbours. Environ. Hazards 2019, 18, 173–190. [Google Scholar] [CrossRef]
  22. OECD. The Ocean Economy in 2030; OECD Publishing: Paris, France, 2016. [Google Scholar]
  23. Jouffray, J.-B.; Blasiak, R.; Norström, A.V.; Österblom, H.; Nyström, M. The Blue Acceleration: The Trajectory of Human Expansion into the Ocean. One Earth 2020, 2, 43–54. [Google Scholar] [CrossRef]
  24. Yılancı, V.; Kırca, M. Testing the relationship between employment and tourism: A fresh evidence from the ARDL bounds test with sharp and smooth breaks. J. Hosp. Tour. Insights 2023. ahead-of-print. [Google Scholar] [CrossRef]
  25. Dentale, F.; Furcolo, P.; Pugliese Carratelli, E.; Reale, F.; Contestabile, P.; Tomasicchio, G.R. Extreme Wave Analysis by Integrating Model and Wave Buoy Data. Water 2018, 10, 373. [Google Scholar] [CrossRef]
  26. Australian Standard. AS 3962—2001: Guidelines for Design of Marinas; Standards Australia: Syndey, Australia, 2001. [Google Scholar]
  27. Băetu, G.; Gălățanu, T.-F.; Băetu, S.-A. Behavior of Steel Structures under Elevated Temperature. Procedia Eng. 2017, 181, 265–272. [Google Scholar] [CrossRef]
  28. PIANC. Guidelines for Marina Design. Report No. 149/Part II; PIANC: Brussels, Belgium, 2016. [Google Scholar]
  29. Kollias, I.; Papadimitriou, A.; Chondros, M.; Chalastani, V.; Spyrou, D.; Laspidou, C.; Koundouri, P.; Tsoukala, V. Assessing the Impact of Climate Change in Wave Agitation for the Port of Piraeus. In Proceedings of the 2nd International Conference, Design and Management of Port, Coastal and Offshore Works, Thessaloniki, Greece, 24–27 May 2023. [Google Scholar]
  30. Tsoukala, V.K.; Chondros, M.; Kapelonis, Z.G.; Martzikos, N.; Lykou, A.; Belibassakis, K.; Makropoulos, C. An Integrated Wave Modelling Framework for Extreme and Rare Events for Climate Change in Coastal Areas—The Case of Rethymno, Crete. Oceanologia 2016, 58, 71–89. [Google Scholar] [CrossRef]
  31. Christodoulou, A.; Christidis, P.; Demirel, H. Sea-level rise in ports: A wider focus on impacts. Marit. Econ. Logist. 2019, 21, 482–496. [Google Scholar] [CrossRef]
  32. Chondros, M.; Metallinos, A.; Papadimitriou, A.; Memos, C.; Tsoukala, V. A Coastal Flood Early-Warning System Based on Offshore Sea State Forecasts and Artificial Neural Networks. J. Mar. Sci. Eng. 2021, 9, 1272. [Google Scholar] [CrossRef]
  33. Bosa, S.; Petti, M.; Pascolo, S. Improvement in the Sediment Management of a Lagoon Harbor: The Case of Marano Lagunare, Italy. Water 2021, 13, 3074. [Google Scholar] [CrossRef]
  34. Lam, J.S.L.; Lassa, J.A. Risk assessment framework for exposure of cargo and ports to natural hazards and climate extremes. Marit. Policy Manag. 2017, 44, 1–15. [Google Scholar] [CrossRef]
  35. Vulnerability of the Sixteen Cypriot Fishing Shelters; Zenodo: Geneve, Switzerland, 2023; Table S1.1. 25 questionsanswered by representatives of professional fishermen in the 16 fishing shelters of the Republic of Cyprus. [CrossRef]
  36. Landreau, A.; Juhola, S.; Jurgilevich, A.; Räsänen, A. Combining socio-economic and climate projections to assess heat risk. Clim. Chang. 2021, 167, 12. [Google Scholar] [CrossRef]
  37. Sierra, J.P.; Genius, A.; Lionello, P.; Mestres, M.; Mösso, C.; Marzo, L. Modelling the Impact of Climate Change on Harbour Operability: The Barcelona Port Case Study. Ocean Eng. 2017, 141, 64–78. [Google Scholar] [CrossRef]
  38. Vanos, J.K.; Baldwin, J.W.; Jay, O.; Ebi, K.L. Simplicity lacks robustness when projecting heat-health outcomes in a changing climate. Nat. Commun. 2020, 11, 6079. [Google Scholar] [CrossRef]
  39. Jurgilevich, A.; Räsänen, A.; Groundstroem, F.; Juhola, S. A systematic review of dynamics in climate risk and vulnerability assessments. Environ. Res. Lett. 2017, 12, 013002. [Google Scholar] [CrossRef]
Figure 1. Flow diagram describing the methodology followed for assessing the vulnerability of the 16 fishing shelters of the Republic of Cyprus, through the development of a vulnerability index (VI), to support decision-makers and serve as an input for marine spatial planning (MSP).
Jmse 11 01880 g001
Figure 2. The 16 fishing shelters of the Republic of Cyprus examined in this case study.
Jmse 11 01880 g002
Figure 3. Ranking of the 16 fishing shelters from the most to the least vulnerable, according to their vulnerability index (VI).
Jmse 11 01880 g003
Figure 4. Vulnerability of the 16 fishing shelters with respect to their physical parameters. The five colours indicate the five levels of vulnerability (1–5), ranging from light pink, denoting very low vulnerability (1) to magenta, representing very high vulnerability (5).
Jmse 11 01880 g004
Figure 5. Vulnerability of the 16 fishing shelters with respect to their environmental parameters. The five colours indicate the five scales of vulnerability, ranging from light green, denoting very low vulnerability to deep green, representing very high vulnerability.
Jmse 11 01880 g005
Figure 6. Vulnerability of the 16 fishing shelters with respect to their technical parameters. The five colours indicate the five levels of vulnerability (1–5), ranging from light grey, denoting very low vulnerability (1) to deep grey, representing very high vulnerability (5).
Jmse 11 01880 g006
Figure 7. Vulnerability of the 16 fishing shelters with respect to their socioeconomic parameters. The five colours indicate the five levels of vulnerability (1–5), ranging from light beige, denoting very low vulnerability (1) to bright orange (5), representing very high vulnerability.
Jmse 11 01880 g007
Figure 8. Vulnerability of the 16 fishing shelters with respect to their physical parameters for RCP 4.5 scenario. The five colours indicate the five levels of vulnerability (1–5), ranging from light pink, denoting very low vulnerability (1) to magenta, representing very high vulnerability (5).
Jmse 11 01880 g008
Figure 9. Vulnerability of the 16 fishing shelters with respect to their physical parameters for RCP 4.5 scenario. The five colours indicate the five levels of vulnerability (1–5), ranging from light pink, denoting very low vulnerability (1) to magenta, representing very high vulnerability (5).
Jmse 11 01880 g009
Figure 10. Vulnerability of the 16 fishing shelters with respect to their physical parameters for RCP 8.5 scenario. The five colours indicate the five levels of vulnerability (1–5), ranging from light pink, denoting very low vulnerability (1) to magenta, representing very high vulnerability (5).
Jmse 11 01880 g010
Figure 11. Vulnerability of the 16 fishing shelters with respect to their physical parameters for RCP 4.5 scenario. The five colours indicate the five levels of vulnerability (1–5), ranging from light pink, denoting very low vulnerability (1) to magenta, representing very high vulnerability (5).
Jmse 11 01880 g011
Table 1. The developed sub-indices of the Vulnerability Index (VI) and the selected vulnerability variables, their units, category and data source for their quantification.
No.Sub-IndexCategoryVariableUnitsSource
V1PhysicalClimateMean wind velocitym/sCopernicus Climate Data Store—Product: CORDEX regional climate model data on single levels
V2Mean air temperature°CCopernicus Climate Data Store—Product: CORDEX regional climate model data on single levels
V3Mean precipitationmmCopernicus Climate Data Store—Product: CORDEX regional climate model data on single levels
V4Hydrodynamic conditions1-year return period extreme significant wave heightmCopernicus Climate Data Store—Product: Ocean surface wave time series for the European coast from 1976 to 2100 derived from climate projections
V550-year return period extreme significant wave heightm Copernicus Climate Data Store—Product: Ocean surface wave time series for the European coast from 1976 to 2100 derived from climate projections
V6Sea level (change)mm/yearCopernicus Climate Data Store—Product: Ocean surface wave time series for the European coast from 1976 to 2100 derived from climate projections
V7GeomorphologySedimentTypeGeological Survey Department, Ministry of Agriculture, Natural Resources and Environment
V8Earthquake zoneI, II, IIIGeological Survey Department, Ministry of Agriculture, Natural Resources and Environment
V9EnvironmentalAreas of environmental interestDistance from areas included in the NATURA 2000 networkkmDepartment of Environment, Ministry of Agriculture, Natural Resources and Environment
V10Distance from aquaculturekmDepartment of Environment, Ministry of Agriculture, Natural Resources and Environment
V11TechnicalGeneral characteristicsHarbour capacityNumber of vesselsDepartment of Fisheries and Marine Research, Ministry of Agriculture, Rural Development, and Environment
V12Current usage%Department of Fisheries and Marine Research, Ministry of Agriculture, Rural Development, and Environment
V13Year of construction/reconstructionYearDepartment of Fisheries and Marine Research, Ministry of Agriculture, Rural Development, and Environment and Cyprus Port Authority (CPA), Ministry of Transport, Communication and Works
V14InfrastructureUtilities and facilitiesNumberDepartment of Fisheries and Marine Research, Ministry of Agriculture, Rural Development, and Environment and Cyprus Port Authority (CPA), Ministry of Transport, Communication and Works
V15Port layout-Department of Fisheries and Marine Research, Ministry of Agriculture, Rural Development, and Environment and Cyprus Port Authority (CPA), Ministry of Transport, Communication and Works
V16Road network conditionCategoryMinistry of Transport, Communication and Works and National Open Data Portal https://www.data.gov.cy/ (accessed on 20 April 2023)
V17SocioeconomicDemographicsDistance from the closest human settlementkmNational Open Data Portal https://www.data.gov.cy/ (accessed on 20 April 2023)
V18Number of inhabitants of the closest human settlementNumberStatistical Service of Cyprus (CYSTAT) https://www.cystat.gov.cy/ (accessed on 20 April 2023)
V19Number of professional usersNumberDepartment of Fisheries and Marine Research, Ministry of Agriculture, Rural Development, and Environment
V20EconomicsDistance from the closest portkmNational Open Data Portal https://www.data.gov.cy/ (accessed on 20 April 2023)
V21Maintenance costs during the last 15 yearsEurosDepartment of Public Works, Ministry of Transport, Communication and Works
Disclaimer/Publisher’s Note: The statements, opinions and data contained in all publications are solely those of the individual author(s) and contributor(s) and not of MDPI and/or the editor(s). MDPI and/or the editor(s) disclaim responsibility for any injury to people or property resulting from any ideas, methods, instructions or products referred to in the content.

