Review

Coastal Marine Monitoring Experiments at the National Research Council in Messina, Italy: 30 Years of Research

by
Giuseppe Zappalà
1 and
Gabriella Caruso
2,*
1
Institute for Marine Biological Resources and Biotechnology, National Research Council (CNR-IRBIM), 98122 Messina, Italy
2
Institute of Polar Sciences, National Research Council (CNR-ISP), 98122 Messina, Italy
*
Author to whom correspondence should be addressed.
J. Mar. Sci. Eng. 2023, 11(10), 1958; https://doi.org/10.3390/jmse11101958
Submission received: 9 September 2023 / Revised: 3 October 2023 / Accepted: 9 October 2023 / Published: 11 October 2023
(This article belongs to the Section Coastal Engineering)

Abstract

:
Coastal marine monitoring is a specialized field of research requiring the acquisition of long-term datasets regarding the main physico-chemical and biological variables that characterize the aquatic environments as a key strategy to depict the environmental status and its possible changes due to natural or anthropogenic stressors. During the last few decades, the devices used in this research field underwenta great evolution. This progress has been made possible by the advancement of the technologies and data processing that have resulted in the availability of new systems for autonomous monitoring. This paper reviews the state of the art of coastal marine monitoring systems developed since 1988 at the Istituto Sperimentale Talassografico—Experimental Thalassographic Institute of Messina (CNR IST), a part of the Italian National Research Council, and continued when the Institute was incorporated into the Istituto per l’Ambiente Marino Costiero—Institute for Marine Coastal Environment (IAMC). The research activity focused on coastal marine monitoring starting at the end of 1988 and lasting for about 30 years, up to the re-organization of the CNR Institutes. This event led to the redistribution of former marine research centers into new Institutes, with missions different to those characterizing the previous structures. Monitoring experiments were performed, and new automatic devices were developed and tested. Some of these systems, including water samplers and integrated data acquisition and transmission systems, are reported.

1. Introduction

Coastal marine areas are ecosystems where multiple anthropic activities (i.e., recreational, ship building, harbors, aquaculture activities, etc.) converge and sometimes conflict. These different uses enrich the territories but potentially have severe impacts on the environmental quality, causing pollution due to their inputs of biological (e.g., pathogen and non-pathogen bacteria, viruses, fungi, etc.) and chemical contaminants (fuels, lubricants, production wastes) [1]. Due to the wide variety of toxic compounds that accumulate following pollution with untreated sewage wastes, shipping activities and agricultural and industrial wastes, pollution is a major ecological threat for coastal marine areas. All these compounds can severely affect seawater quality, causing harm to the delicate balance of species and habitats, with consequent risks to the natural environmental equilibrium. The impacts of climate change, in terms of rising temperatures and altered ocean currents, further exacerbate the pressure on coastal environments. This leads to changes in biodiversity and the alteration of the ecosystem’s ability to provide relevant resources and services. In temperate regions, the cross effects of anthropic activities on the shoreline have been studied for several decades; conversely, in polar areas, the study of ice melting with its causes and effects represents a new crucial issue.
In the light of the above reported considerations, assessing the marine pollution risk is essential not only for monitoring the ecosystems’ health but also for mitigating the impacts of pollution on wildlife and human health.
Very few marine monitoring activities (mainly in North America and Europe) existed in 1988, when the Italian National Research Council launched the Strategical Project “Scientific problems and development of methodologies related to the automatic monitoring of data concerning marine pollution in the South of Italy” project coordinated by CNR-IST (Istituto Sperimentale Talassografico). In the USA, research laboratories, such as those at the University of San Diego, California; the Scripps Institution of Oceanography; Monterey Bay Aquarium Research Institute (MBARI);and the Woods Hole Oceanographic Institution (WHOI), as well as those of the National Data Buoy Center (NDBC) available at some governmental Agencies [National Oceanic and Atmospheric Administration (NOAA)], installed systems for ocean monitoring [2,3]. In the North Sea, the most relevant activities in coastal monitoring were carried out at the mouth of Elbe River, Germany, at a site threatened by heavy industrial pollution, as well as in Norway, to create an early warning system for the arrival of pollutants (for instance, discharged from oil spills) that potentially damage coasts and, in particular, aquaculture areas [4].
In the Mediterranean Sea, the Arcobleu was an example of international cooperation between Italy and France [5]. The ODAS buoy installed in the Ligurian Sea and the Acqua Alta platform established in the Venice Lagoon were probably the most important monitoring structures operating during the 1990s, which are still working after several improvements and refurbishments. Long-term data series acquired over 40 years from the ODAS buoy have recently been published [6]. All these systems, just like the North American ones, employed measurement equipment often derived from traditional offshore systems, originally designed to be used on oceanographic ships, or laboratory devices, hardly adaptable to the peculiarity of buoy environments. High-level instrumentation (like that produced by Sea Bird Electronics) provided very good performance in both deep and shallow water, albeit at quite a high price; lower-cost (and lower-precision) devices (sometimes designed for fresh water) were also available, but their characteristics made them hardly acceptable for scientific measurements. A key issue was the tendency of the manufacturers to consider their systems to be “black boxes”, connectable only with other devices of the same brand. Creative solutions were found to face several problems that showed up during the experiments; in particular, these issues concerned different key features of the monitoring systems, such as those related to costs, sizes, weights, power needs, capability of unattended working, data acquisition, storage and transmission.
This review provides an overview of the experiments in the field of the development and application of marine monitoring technologies over thirty years of activity performed at the CNR-IST and CNR-IAMC (Istituto per l’Ambiente Marino Costiero). The main advantages and constraints of the systems that were designed and built are reported.

2. The History and Technological Evolution of the Prototypal Monitoring Systems Built in Messina

2.1. Step 1: First Experiments

Mostly funded by the Strategical Project “Scientific problems and development of methodologies related to the automatic monitoring of data concerning marine pollution in the South of Italy”, monitoring experiments using small buoys and small boats were performed. The first experimentsin the monitoring field were performed using commercial devices. These systems, however, suffered major drawbacks. In their basic architecture, they were composed of an array of sensors digitalized viaan Analog-to-Digital Converter (ADC). A radio signal was sent from the base station to start the measurement. This event activated the “squelch” line on the buoy radio, switching on the measuring subsystem. A basic modem transmitted the performed measurements to the base station. As a final step, the system moved to a “sleep” state, where only the radio was powered. If needed, the requests for measurements could be reiterated until the data were fully obtained or up to reaching the maximum retry number or a time-out.
The first instrumented buoy, installed in Messina, Italy, was bought from an Italian firm. It was equipped with a multiparametric CTD probe for conductivity, temperature, dissolved oxygen and pH, normally used for manual measurements from quays or small boats, coupled with a voice VHF transceiver, slightly modified to host a very basic modem; the power supply was provided by sealed lead accumulators, which had no recharge system and an expected operativity of 1–2 weeks. The main problems encountered with this technology involved the short-term (less than two weeks) expected operativity and the low reliability of the communication system (totally dependent on the received signal strength). This issue required a very precise tuning of the volume and squelch commands of the RTX. This first system (which had no remote data storage) simply sent the acquired data to the base station control box, which included a small LCD display and a small printer to save measurements on a roll of special paper; a serial interface for PC connection was available. Data were presented already converted into the proper measurement units. Received data had to be manually organized for calibration and validation control. This system demonstrated all of its limits and was soon abandoned, only saving the multiparametric probe for manual use.
A second system, sold by Idromar (Genoa, Italy), was installed in Augusta Bay (Figure 1) [7]. It consisted of 5 buoys equipped with sensors measuring temperature and dissolved oxygen (ENDECO) and conductivity (Meerestechnik Elektronik GmbH—Trappenkamp, Germany); one of the buoys also hosted Haardt sensors for fluorescence and transmittance. The voltage outputs of the sensors were converted into digital values using industrial 12-bit ADC converters. The data transmission used UHF transceivers and showed better reliability than that experienced using the first buoy system. The electrical power was provided by accumulators, with a two-week expected autonomy in their operativity and no recharge systems. Received data (digitalized sensors outputs and battery status) were stored at the local base station and transferred to Messina using a Hayes 1200 bps modem viaa switched public phone line under the control of the Carbon Copy software. Manual elaboration was then performed for the conversion, calibration and validation of the data, which were stored in a very simple database. Data calibration was ensured through comparison with data obtained during traditional surveys using a small boat in coincidence with periodical maintenance operations (battery substitution and sensor cleaning). Values out of the range of data were discarded. Data plotting allowed us to recognize anomalous trends (e.g., those due to sensor drift). Statistical elaborations were performed to obtain daily mean, minimum and maximum values of each parameter [7].

2.2. Step 2: Starting Instrumentation Development

These experiences demonstrated the need for new systems for data acquisition and transmission. While the acquisition of data could be an easily solved problem, only few improvements on the data transmission side, which continued to use traditional voice UHF transceivers, could be obtained.
The basic idea was to build up a “control computer” using serial, parallel, digital and analogic interfaces to connect the various instruments. Such a computer must also self-diagnose and monitor the functioning of the whole system, including the power supply.
Aninitial data acquisition and transmission prototype was designed and built to be used in the “Progetto Strategico Sistema Lagunare Veneziano” (Venice Lagoon System Strategical Project) (1993) [8]. Based on an ASEM 286 CPU board, implementing a PC-AT architecture in double Eurocard size, it had serial RS232 and 16-bit analog interfaces; the communication system used an UHF RTX module, coupled with a 10W linear amplifier and a Z80-CPU-based CTE packet switching intelligent radio modem, able to manage each system and act as a “repeater” to and from otherwise unreachable measurement sites. The base station was installed on Palazzo Papadopoli (Venice, Italy); the measurement stations, together with the connected tri-axial Doppler anemometers, were fitted on poles in the lagoon. The acquired data were validated in Venice by CNR-ISDGM (Istituto per lo Studio della Dinamica delle Grandi Masse—Institute for the Study of Great Masses Dynamics) and stored in the Strategical Project Database [8].
With respect to the radio (VHF or UHF) link, some considerations needed to be addressed:
  • The Ministry for Communication had to grant a license for the exploitation of the radio frequency;
  • A site, high enough on the sea and without obstacles in the direction of the buoy station, was needed to host a Land Base Station;
  • The antennas had to be in reciprocal view;
  • The marine aerosol caused the attenuation of the signal;
  • The use of directional antennas with a good gain sometimes became necessary to lower the transmission power, but this solution was not always applicable to buoy systems, because of the small size of the buoy, and of the buoy’s movement caused by currents or wind;
  • The antennas height determined the maximum reachable distance;
  • Further limitations could be imposed through municipal laws;
  • The possible reception of background noise viaantennas pointed too low on the sea horizon had to be considered.
The substitution of basic with “smart” packet radio modems (also known as TNC—Terminal Node Controller) allowed the use of intermediate stations as repeaters, managed the transmission protocol (enabling the error control and retransmission of damaged data packets) and helped us to overcome some (but not all) of the above-reported constraints.
The activation of the GSM (Global System for Mobile Telecommunication) network in Italy simplified the design of the communication system. The first use of this technology for environmental monitoring dated back to “Programma di Ricerca e Sperimentazione per la salvaguardia del mare Adriatico” (PRISMA2) (Research and Experimentation for the safeguarding of the Adriatic Sea Program PRISMA 2) (1996) [9,10]. Installed in the “Acqua Alta” Platform in Venice Lagoon, a single-board computer and a Motorola GSM phone, connected to a PCMCIA (Personal Computer Memory Card International Association) data interface card, later substituted with Nokia devices that offered a better and more reliable performance, were used. It was possible to set up the base station wherever necessary, without caring for the antenna positioning; of course, the base and all the remote stations had to be maintained under mobile network coverage. A multiparametric Idromar (Genoa, Italy) 5171 probe, a Systea (Anagni, Frosinone, Italy) MicroMac LFA colorimetric ammonia analyzer and a Barnes PRT-5 TIR radiometer were the scientific payload. CNR-ISDGM carried out the data management and storage.

2.3. Step 3: Definition of the Final Architecture

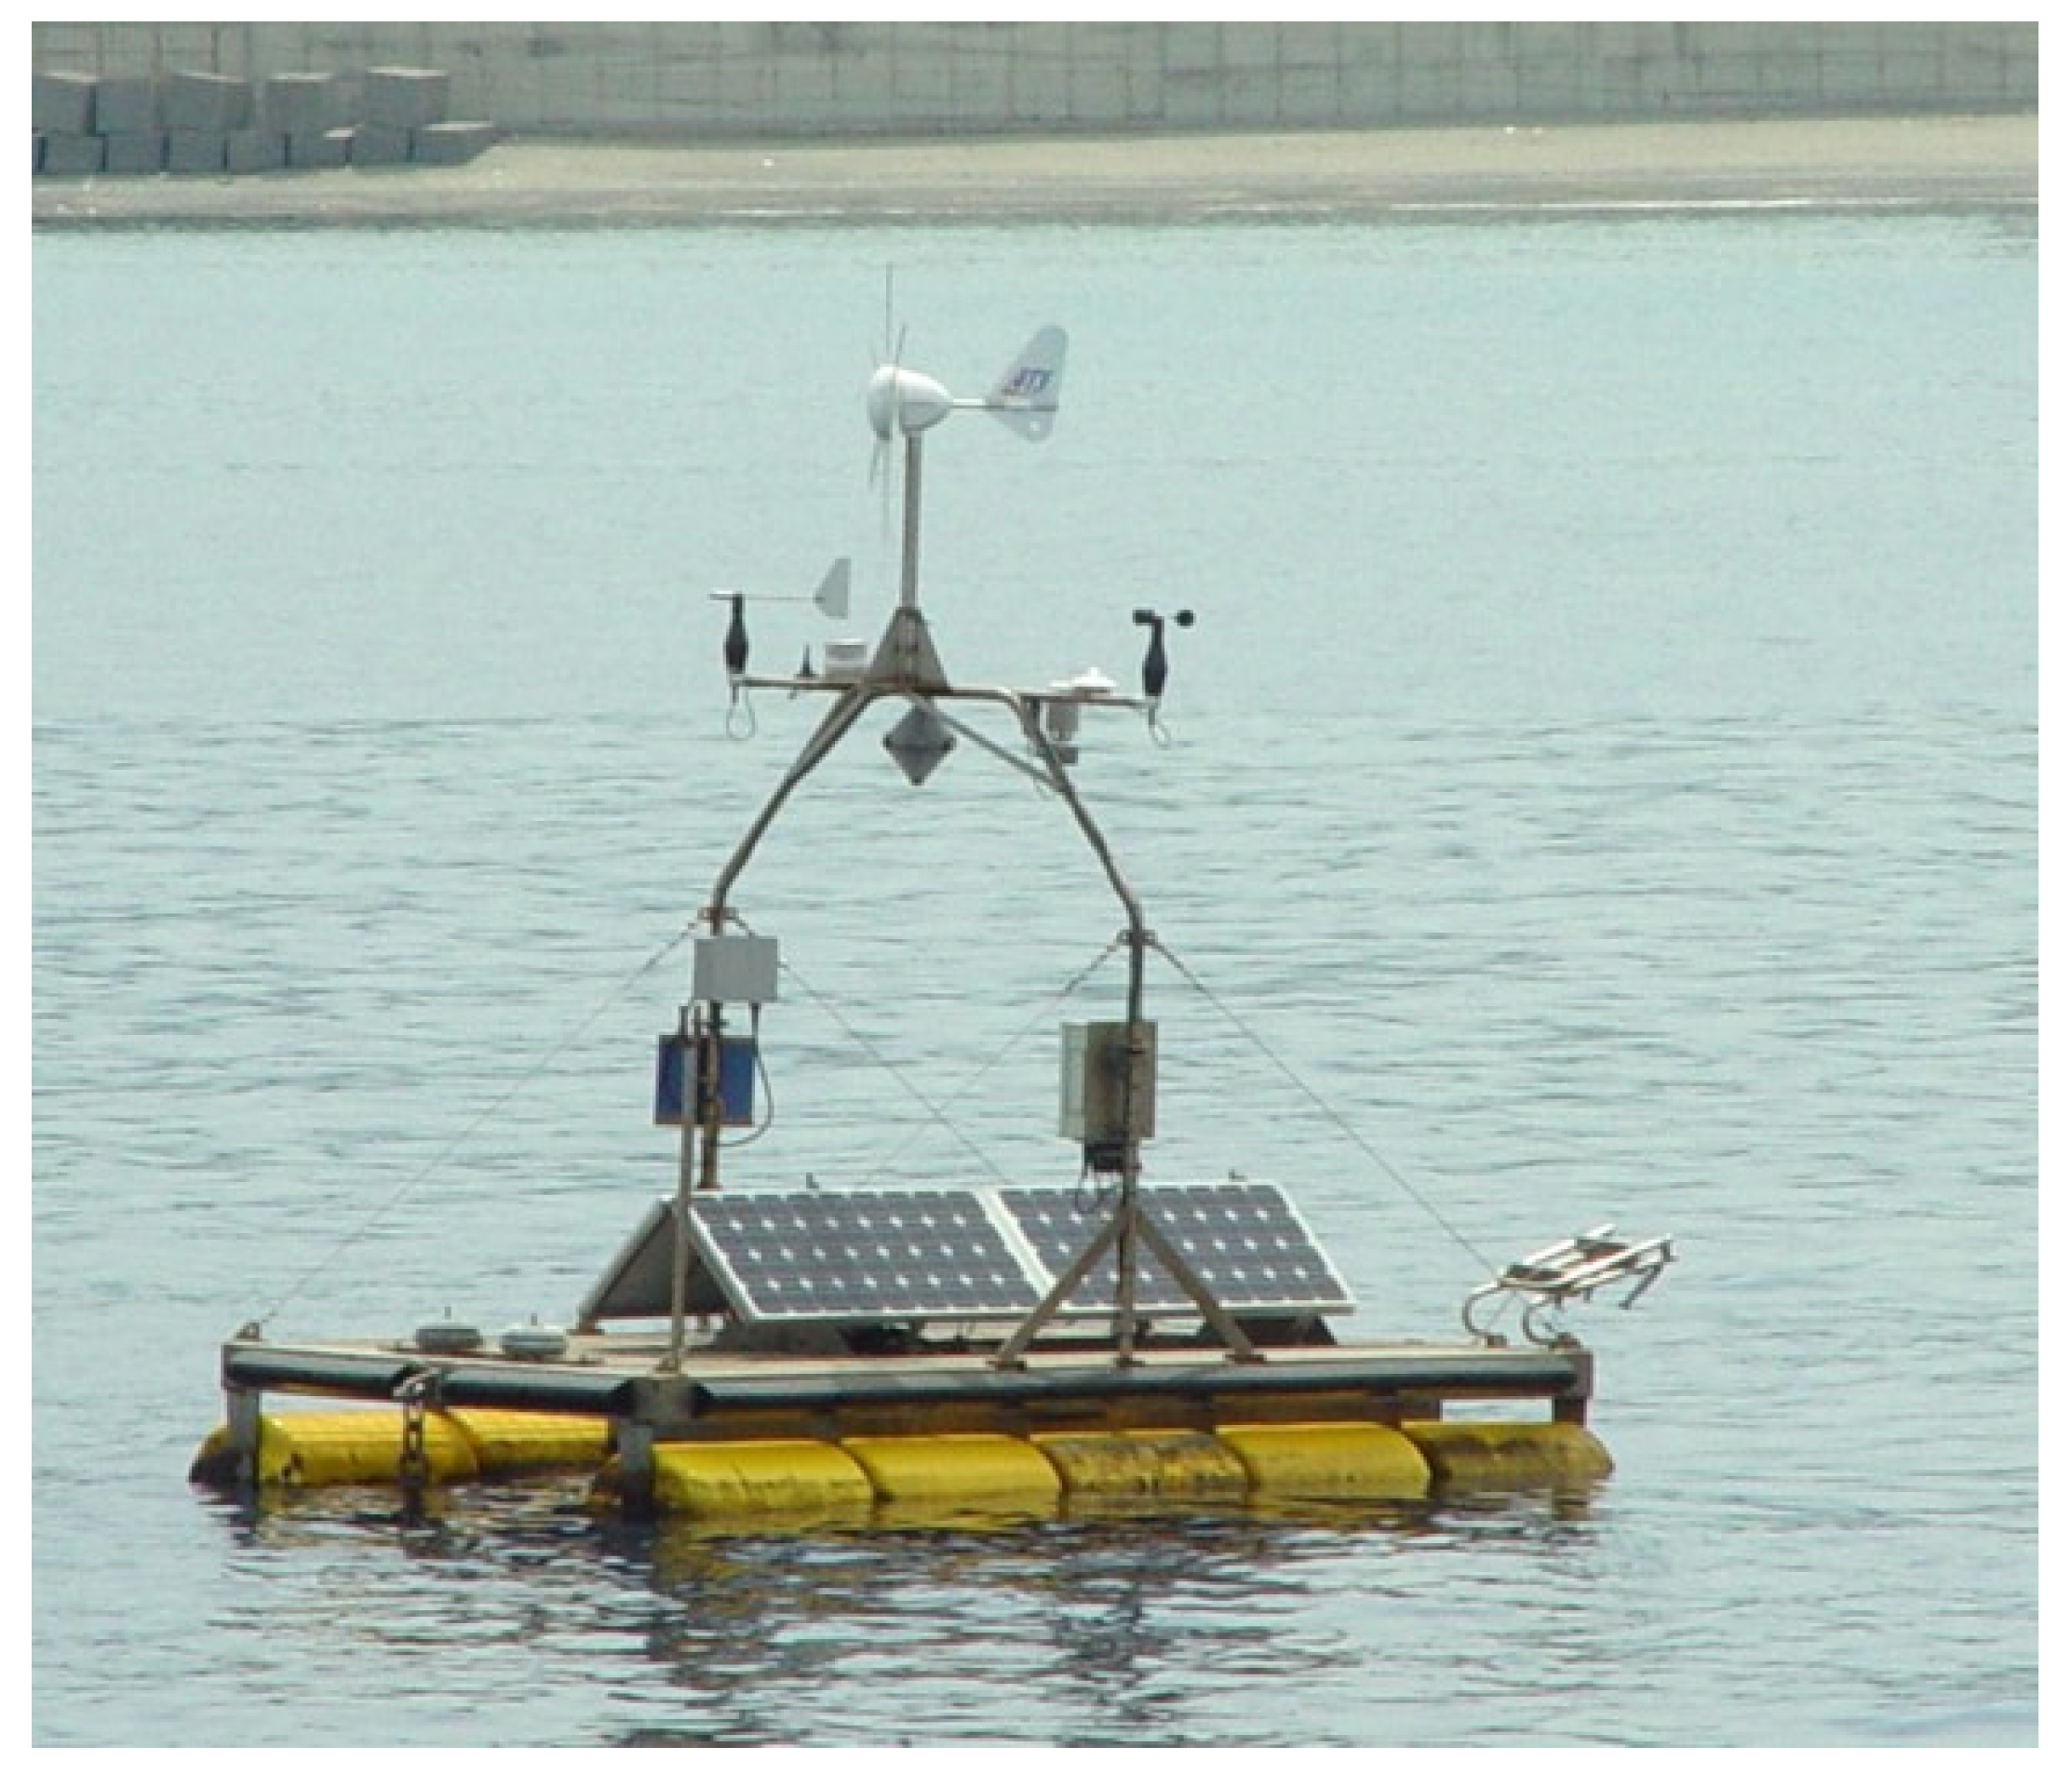
2.3.1. Design of a New Platform

A prototype platform was designed and built using four of the buoys previously located in the Augusta Bay monitoring system [11,12]. It had a triangular shape with a 4 m side. This platform was equipped with a new data acquisition and transmission system and three solar panels continuously recharging the batteries, thus avoiding the need for their frequent substitution (Figure 2). It was equipped with an Idromar (Genoa, Italy) IM 5171 CTDO probe, two MicroMac colorimetric analyzers for ammonia and orthophosphates and a meteo station. It was conceived as a test bed for the new devices under development.

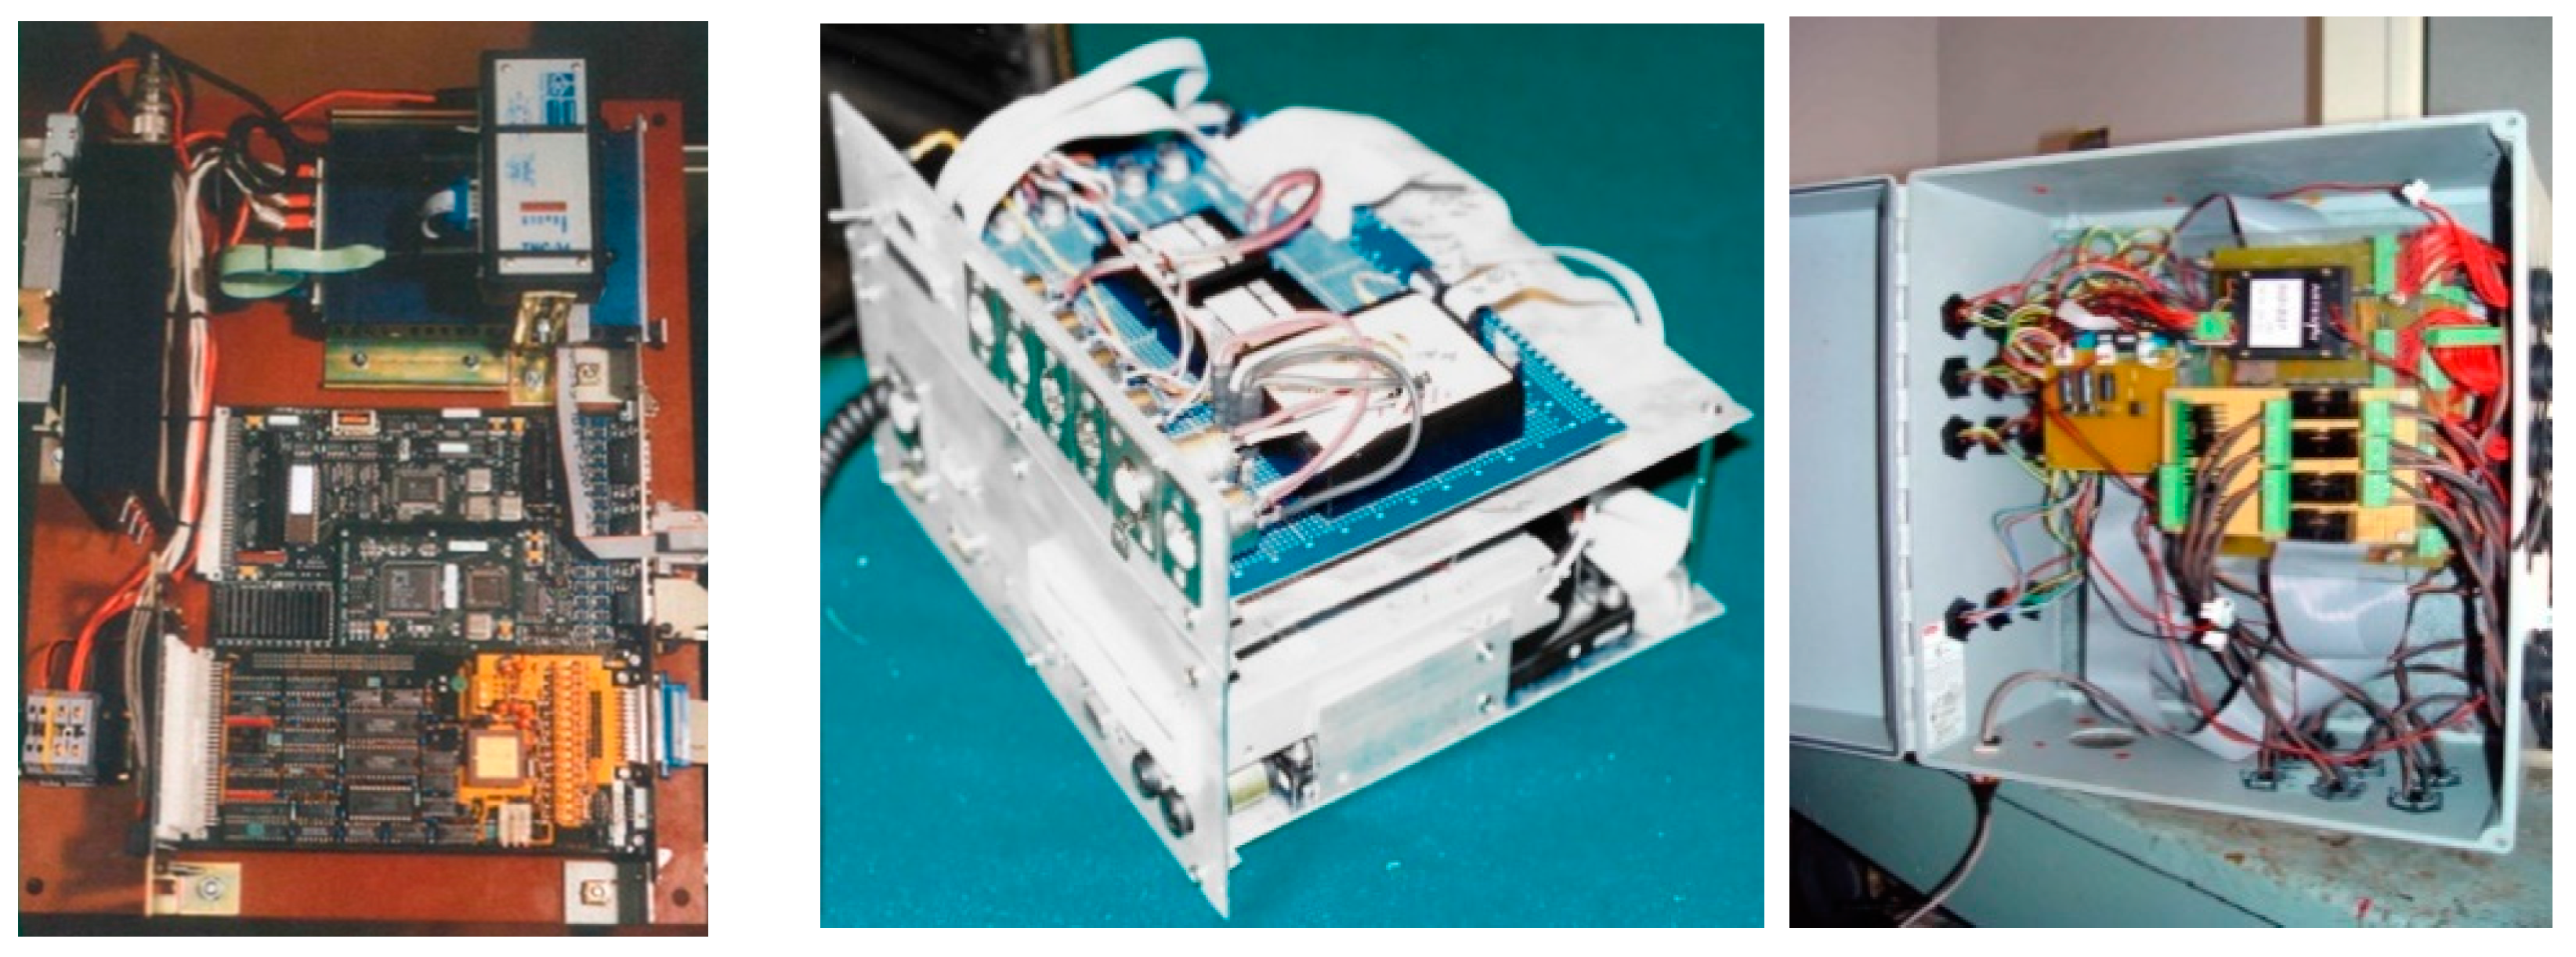
2.3.2. System Hardware

In the late1990s, the availability of new electronic devices led to more compact, powerful and versatile data acquisition and transmission systems based on PC104 (IEEE 696 standard) stackable boards, implementing a PC architecture in the small size of 90 × 96 mm, and new cellular modems. The first boards mounted an 8088 CPU, later substituted with more powerful ones (80386, Pentium-like, etc.); additional interface boards provided video interface, serial, parallel, digital and analog I/Os.

2.3.3. System Software

The availability of central and mass memory allowed the systems to be fully programmable, hosting an integrated interpreter for a newly designed control language, based on a set of macro-instructions [13]. A remote-control program was also developed to interact with the measuring systems. These systems were able to run in a fully automatic mode and, at the same time, receive remote commands. It was possible to completely reprogram the systems for different data acquisition schedules without suspending normal activity.

2.4. Newer Developments

The experience obtained in previous years led to the codification of the “basic” characteristics of new systems, whose architecture is shown in Figure 3. These new systems had to comply with some important constraints:
  • Battery recharging systems (solar panels or wind generators) had to be available on the buoy;
  • Equipment could not draw too much energy from the supply system;
  • Modularity and flexibility had to always be pursued;
  • Communication link had to be reliable;
  • Maintenance had to be easily performed in situ;
  • Costs had to be minimized.
The global system architecture was defined as follows:
Land station:
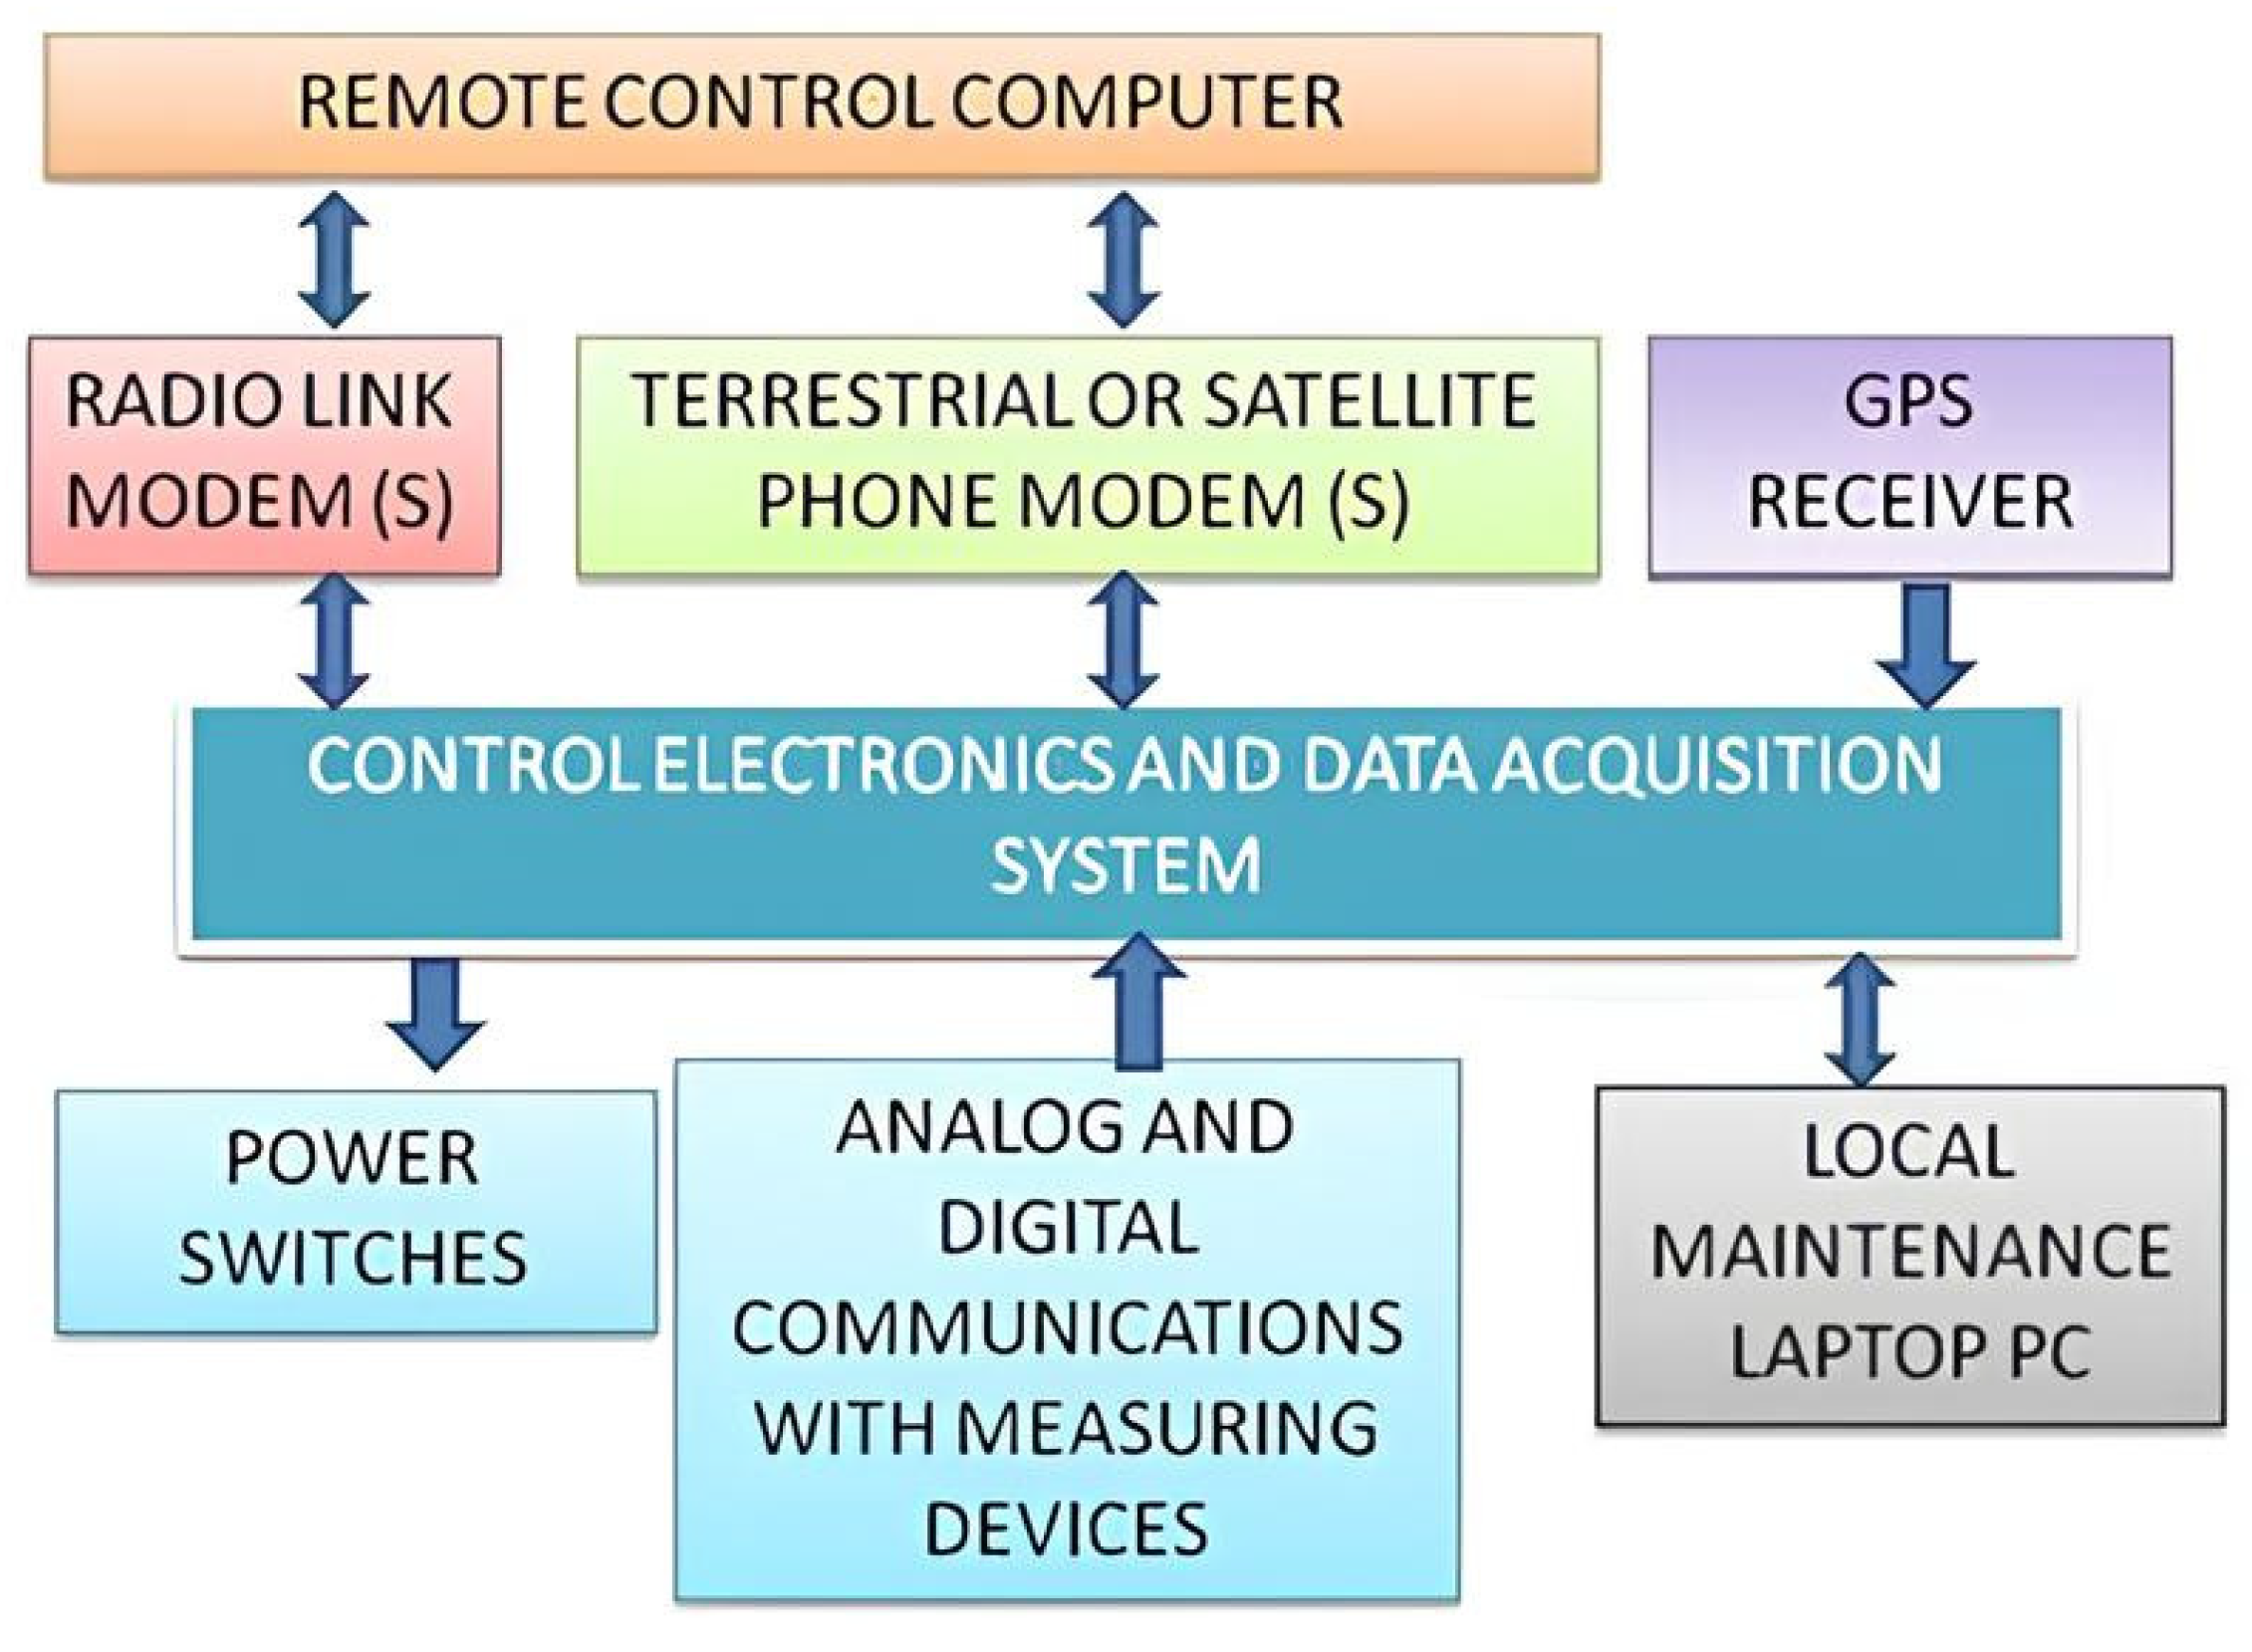
  • A computer of any kind (software was however written for PC-like ones) could be used to control the sea station, allowing the storage of the collected measurements in a database (remote or local).
  • Sea station:
  • Power supply system managing the power sources (batteries and local generators);
  • Measuring system for connecting the installed sensors and devicesvia standard interfaces (typically serial RS232);
  • Data acquisition system for coordinating all measuring and management operations;
  • A GPS system to monitor the position of the system to send an alarm in case of un-mooring;
  • A data transmission system that could be a VHF/UHF link, a terrestrial or satellite mobile telephony modem or, in later years, a LoRa interface.
Funded by the Italian Ministry for Scientific Research and University (MIUR), in 2000, two research programs, namely Advanced Monitoring Systems (SAM) and Infrastructural Program (PI), started [14]. In this context, the prototype platform was refurbished with the installation of three more floats (Figure 4), increasing its buoyancy and stability and allowing the addition of a wind generator.
The increased electrical power availability enabled us to host new devices and instrumentson this platform. These included a pump operating at different depths, which was sold by Idromar (Genoa, Italy), and a water sampler equipped with 8 bottles, which was designed at CNR-IAMC.
This platform, moored in the Messina coastal waters [15], was joined by six rectangular-shaped semi-submersed platforms, each being 8 sqm wide (Figure 5), designed to host the same devices as those that were tested on the prototype platform.
The six platforms were located in Sicily, specifically in Milazzo (province of Messina), Palermo, Syracuse, Mazara del Vallo (province of Trapani) and Apulia regions (Taranto and Lesina, province of Foggia) [10,11,15]. A concise description of these equipment follows.

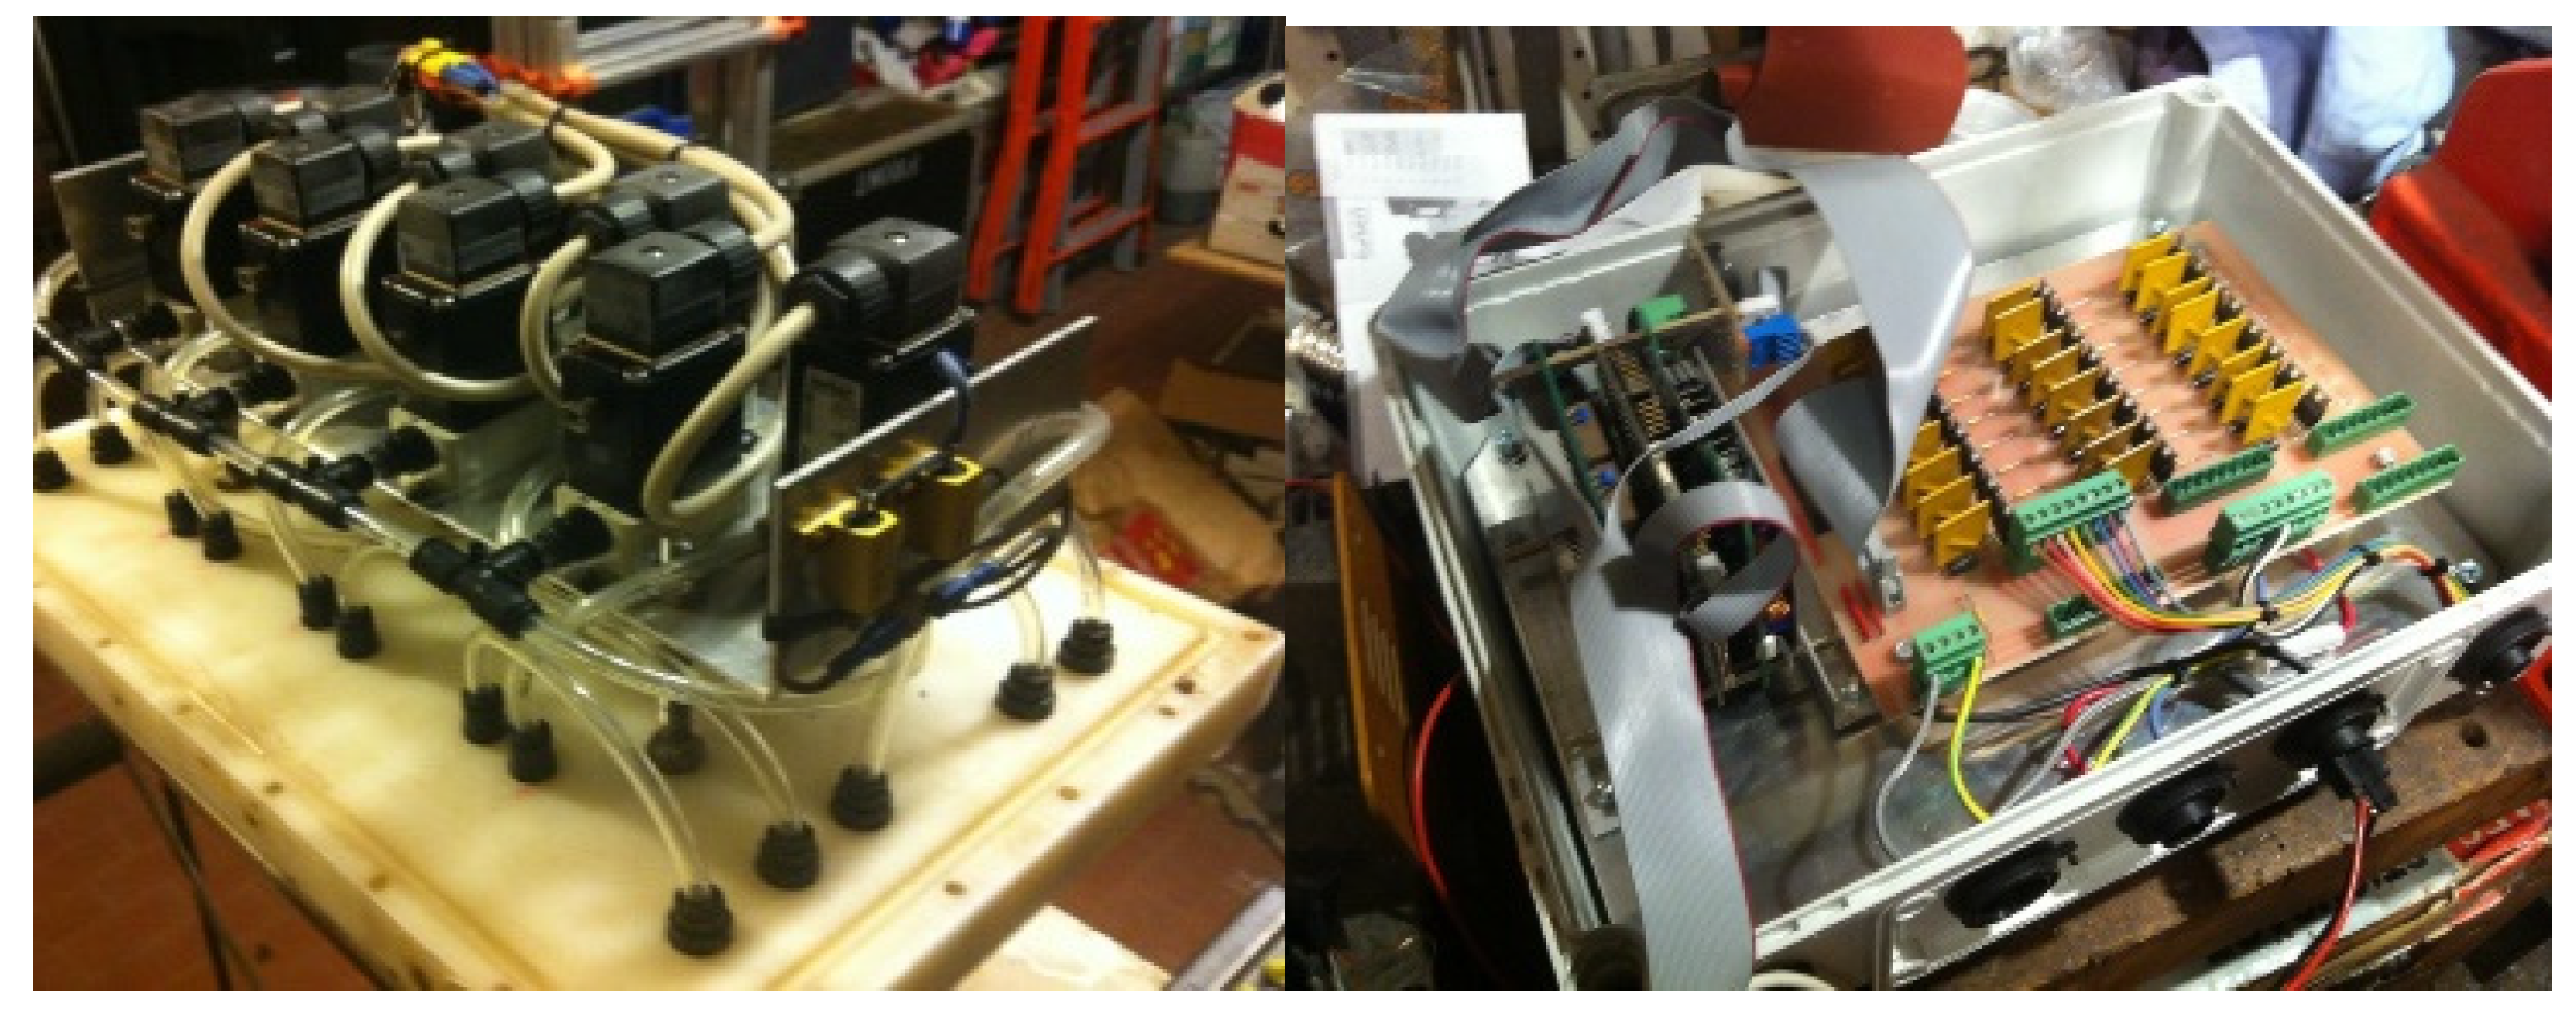
2.4.1. The Power Supply System

This system hosted a maximum of four 12 V sealed lead accumulators in relation to the power feed required by the connected devices. Each battery was connected to one solar panel and a dedicated charge regulator, while a wind generator with a separate charge regulator contributed to the optimal energy balance of the system. The charge regulators and the parallel diodes were low-voltage drop diodes. The generated power was sent to the DC/DC converters, generating the proper power voltages and currents to feed the electronic systems. Using a combination of wind generator and solar panels, the batteries were continuously recharged, enabling the monitoring equipment to work during low-insolation and bad weather conditions.

2.4.2. The Measuring System

The measuring system comprised sensors used to measure water conductivity, temperature, dissolved oxygen, turbidity, pH and fluorescence. These sensors could be single or assembled into a multiparametric probe. Their main characteristics are reported in Table 1. The meteorological sensors (air temperature, wind speed and direction, solar radiation) were integrated with a controlling and conditioning system; this system communicated with the main system of data acquisition. An experimental NPA (Nutrient Probe Analyzer) built by Systea (Anagni, Frosinone, Italy) measured ammonia, nitrites, nitrates and orthophosphates. Serial interfaces were used to connect the meteorological and marine subsystems.

2.4.3. The Data Acquisition, Communication and Treatment

The data acquisition subsystem was an enhanced version of the one described in Section 2.3.2, using a 386 CPU board, which was later substituted with Pentium-like CPUs (Figure 3). PC-104 (IEEE 696 standard) boards constituted the data acquisition subsystem providing standard interfaces to connect terrestrial or satellite modems, GPS, measuring devices, measuring systems, analytical instrumentation and data storage devices (usually solid-state disks, SSD) [16]. The power supply of the various devices was controlled using digital I/O interfaces.
A set of macro-commands was implemented, allowing us to manage the buoy stations and the installed devices through the local keyboard, the base station computer or a mobile phone. The macro-commands were identified by an initial letter “Z”, which was followed by a character specifying the type of command and, if necessary, by command parameters related to the I/O or communication port involved or a specific instrument. Using a simple text editor, the macro-commands could be assembled into “sequences” and stored in the remote station, where an event machine operated in an endless loop, waiting for commands issued by the local keyboard, received from communication devices, the reaching of a geographical point (in a version customized for monitoring from Ships of Opportunity) or a timed event to launch a proper command sequence. At 10 min intervals, programmed command sequences were launched. The sequences were interpreted and executed by a “parser” routine that scanned the sequence file line-by-line. The available commands were classified into system and instruments management commands, control and diagnostic commands, data acquisition commands and telecommunication management commands. Both Microsoft-compiled BASIC and Microsoft Macro Assembler were used to develop and implement the system software, which runs in ROM-DOS, being very similar to the MS-DOS operating system. In the most recent version, Arduino’s embedded development system language is used.
While not operating, the system entered a “sleep” state, characterized by low power consumption, from which it could be awakened through the execution of specific sequences or commands. The position was under continuous monitoring by a GPS receiver, and a warning message was launched in the case of “out-of-bounds”, indicating a buoy unmooring.
The design goal of an easy-to-use, modular system, able to accept new devices and offering dynamic mission programming, was reached thanks to the combination of the software architecture and standard electronics. Various implementations of the data acquisition and transmission are depicted in Figure 6.
The first version of the Data Transmission System used a PC 104 GSM modem; later, an external MC35 Siemens modem was adopted. Both modems allowed us to receive and transmit data and commands using “normal” data connections or SMS viaa service available at that time, provided by the telecom provider, and transformed into e-mail messages.
A Mail Processor including a POP3 Client downloaded the mail messages and pre-validated data, tagging the records with MAST-compliant quality flags, following EU Data Management guidelines. An automatic screening compared received data to minimum and maximum bounds. Three quality levels were available: Class 0—not yet validated; Class 1—verified, but dubious or wrong; Class 2—validated and apparently good. For data produced using “static” sensors, the measuring procedure must be emphasized: every sensor was read 10 times, and the measured values were all transmitted; the first reading was discharged, and the minimum, maximum, standard deviation and mean were calculated; the mean value was the one inserted into the data base. Two high-level PCs were used: one to host the Oracle Data Base, and the other for the ArcView GIS, which was used for cartographic elaborations. It was possible to select data and extract them as Excel files for scientific elaborations and diagnostic purposes (e.g., to detect sensor drift) [17].
A new modem, mounted in a platform that was transferred to Tuscia University for the monitoring of the Civitavecchia coastal area, located in Latium region, Italy [18,19,20], was able to directly connect to Internet and send e-mail messages without using any provider service.

2.5. Special Equipments: Water Samplers

Water samplers are devices designed to collect liquid samples and preserve them for further laboratory analyses. The possibility to store water samples taken at prefixed time intervals and delay their examination is very useful, as it is important to monitor the occurrence of biological agents, for instance Escherichia coli as an indicator of fecal pollution, or bacterial pathogens.
A first prototype of water sampler was designed and developed at CNR-IST in the 1990s. It was based on a frame mounting six sterile bottles (capacity 250 mL), filled viaa rotary distributor moved using a step motor; a peristaltic pump drove the water flux into one bottle or directed it towards a circuit washing position. Sample fixation was performed using a suitable volume of formalin (10 mL), pre-dosed inside of each bottle before its installation in the frame.
Controlled through the computer installed on the buoy, this kind of sampler was operating on the first version of the prototype platform, moored in the Straits of Messina, Sicily [21].
As a further upgrade of this first prototype, at the beginning of the 2000s, a redesigned version of the water sampler was designed and built at the CNR-IST laboratories to be mounted on the new generation of coastal monitoring buoys. This new system included eight 250 mL bottles, with electro-valves that managed the water intake and three peristaltic pumps that pushed the fluids through a circuit. The buoy computer programmed the filling of the bottles with sea water, the addition of formalin as a preserving agent and the washing cycle with fresh water (Figure 7).
More recently, a new prototype of water sampler was specially developed to work in extreme environments such as polar regions to collect in situ samples. In the Arctic Svalbard region, during a cruise performed in 2015 within the project ARCA, funded by the Department of Earth Systems and Technologies for the Environment (DSSTTA-CNR), an unmanned surface vehicle—towed by a catamaran—hosted this sampler, which mounted eight 500 mL bottles, thus doubling the volume of sampled water [22,23].
This system allowed us to work in extreme conditions and examine the ice–water interface very close to glaciers, where the fall of ice blocks could endanger conventional ships and their crew [24]. This water sampler incorporated a control computer like those reported in the previous description (Figure 8).

3. Discussion

3.1. The Technological Progress Made over the Years

The state of the art of coastal marine monitoring has recorded substantial technological and scientific advancements in the last few decades. Scientists have benefited from the availability of new low-cost instruments able to operate in both coastal and extreme environments.
The search for innovative systems to monitor, at different timescales, both meteorological and water quality parameters has led to a variety of coastal and offshore buoys and platforms with different typologies [2,4,25]. The systems reviewed in this study are the result of the knowledge obtained in the last decade of the past century [10,11,12,13,14,15,16] and were funded by the Italian Ministry of University and Research within the research programs “Sistemi Avanzati di Monitoraggio” (Advanced Monitoring Systems, SAM) and “Potenziamento Infrastrutture“ (Infrastructure Implementation, PI) (both part of the Cluster 10 project) and by the European program “Mediterranean Forecasting System Towards Environmental Prediction” (MFSTEP). The first application was the infrastructure of coastal monitoring buoys developed during the SAM program [10,11]. Further developments were reached within the MFSTEP program, in which the computer system was refitted with a new, more powerful CPU board; a Wavecom modem incorporating a TCP-IP stack; and a new set of programs to control a fully automatic multiple launcher for expandable profiling probes (usually measuring temperature), designed to work unattended on ships of opportunity.
The observing systems were able to collect meteorological datasets and perform physical–chemical measurements to characterize seawater quality and current speed and direction. Diversified sensors were installed on the measurement platforms, including simple devices such as “static” sensors (e.g., Pt100) and more sophisticated analyzers developed for nutrient analysis, based on colorimetric assays (Systea, Italy). As a further implementation of the monitoring system, a water sampler, collecting samples for further laboratory processing, could be added to the systems, expanding the set of measurable parameters. Temperature probes were mounted at fixed depths, the same depths from which a pumping system sent water into a measurement chamber on the buoy, where a multiparametric probe was fitted and samples were collected for colorimetric analysis. Through the macro-commands, it was possible to control the acquisition and transmission of data, the hardware of the system and the measuring devices. Moreover, the e-mail messages allowed us to overcome the need to locate the data center close to the measuring stations and host it wherever desired. The modularity of the new monitoring systems also enabled the upgrade of hardware–software architecture; the systems could be upgraded to more powerful processors, avoiding rewriting the software. It was also easy to upload to the remote systems new software and sequences without opening the watertight computer box or suspending the system activities. The flexibility in mission programming, given by the execution of simple “sequence” files, allowed us to fit the measurements to the different and varying requirements of scientific research and environment monitoring (e.g., early warning or follow-up of pollution phenomena). The acquisition frequency was chosen considering the power consumption and the characteristics of the connected devices: using only sensors, it was possible to reach a frequency of six measurements/hour, while the use of nutrient analyzers limited the sampling frequency to one sample/hour. The systems were fully automatic and could be remotely controlled using a modem connected to a PC or by sending an SMS. It was also possible to disable the sequence manager to stop the execution of measurements (for instance, during maintenance operations) without shutting down the buoy. Thanks to the availability of packet radio modems, all the controls, including the number of trials of retransmission, the latency intervals and the management of errors, were embedded into the modem itself; this was progress from the former commercial systems using rudimental modems and devoting the communication control to the acquisition software. Cellular telephony enabled us to abandon private radio links, demanding data transmission viaa public operator. The exchange between the base and the remote stations of SMS was made possible using the first GSM modems. Viathis approach, both commands and data were transmitted in a bi-directional way; the telecom provider also offered the service of converting the SMSs into e-mail messages. Point-to-point “terminal” connections, like those inherent in the maintenance of the system, were billed on a connection time basis. With the introduction of GPRS (General Packet Radio Service) and new modems, which allowed an Internet connection, the e-mail messages sent after measurements were paid based on data volume; as a result, the communication costs were significantly reduced. Furthermore, the availability of mobile telephony networks allowed us to overcome possible problems related to the use of private radio communications, so avoiding the need of a base station, allowing the remote control of buoys and acquisition of the data in any place in the world. Concerning data acquisition, over the years, improvements in the control electronics and measuring devices were also obtained thanks to the availability of new computer boards and communication systems. Concerning data storage, the first data were saved on very basic text files, and the latest one used an advanced relational database (Oracle and a GIS).
As a synthesis of the coastal monitoring experiments performed in Messina, a scheme of the monitoring systems developed at the CNR is shown in Table 2.

3.2. Challenges and Solutions

Several problems arose during the experimentation:
(1)
Power supply: The first buoys were too small to host a recharging system (solar panels or wind generators) or more powerful batteries, but electronic devices needed good, stable and reliable availability of power. Switching off unnecessary devices and putting them into a suspended “sleep” state the acquisition subsystem were the first energy-saving procedures that were implemented. A more accurate design of the power supply subsystem, with the use of “low voltage drop” devices and a new step-up/step-down-high efficiency DC/DC converter, also enabled us to supply the instrumentation with the proper voltage when battery charge was about to end (e.g., for a delayed battery substitution caused by meteo-marine conditions). The use of solar panel on larger buoys and platforms made a big contribution to avoiding battery dis-charged events, but in the case of prolonged bad weather conditions or soiling of the panels, the produced energy could be very low (during the experiments, one of the buoys, moored near Milazzo, was found totally covered with volcanic ash coming from an eruption of the Etna volcano several tens of kilometers away). The addition of wind generators solved any problems.
(2)
Communication faults: This kind of problem was quite “normal” when first using systems with private radio links; it was typically caused by the bad coupling of the radio equipment, radio-electric interferences or the obstruction of the “visibility” between the antennas (e.g., caused by large ships passing or anchored near the buoy). To avoid battery discharging, it was necessary to limit the number of transmission retries to three. A low battery condition, with are duction in the transmission power, could also generate communication faults. The use of mobile networks almost solved these communication problems, or at least transferred them to the telecom provider.
(3)
System freezing: It was necessary to avoid the acquisition system waiting indefinitely for a reply from a device (that could be out of order). Adding a watchdog timer (hardware in the first systems, software in the latest) to periodically reset all devices solved the problem.
(4)
Sensor drift: periodical calibration at the manufacturer was necessary, but to ensure the best possible quality of the acquired data, reference measurements were performed in tandem with periodical maintenance operations (mooring control, fouling removal)
(5)
Duties and taxes: A study was conducted on the correct behavior. Comparing Navigation Code, DPR 633/72 (VAT Code) and the pronouncements and opinions of tax offices, the right fiscal regime was individuated, which equated coastal monitoring platforms and equipped small boats to ordinary ships for commercial use, making them subject to a special fiscal regime.
(6)
Last but not least (or maybe the most important), the lack of funding: all the described equipment were built using “spot” funding, usually lasting no more than three years; financial reporting rules obliged us to spend all the money before the end of the research program, without saving any amount for subsequent maintenance, which was supposed to be funded by other sources (research programs, external contracts and contributions) that, when found, were very scarce.

3.3. Comparative Analysis

Over the years, several experiments of environmental automatic monitoring have been performed, and significant progress has been recorded in the field of the technologies applied to environmental monitoring. Further enhancement of the performance of currently available systems in terms of their reliability and performance and the development of new low cost, high precision measuring systems have been achieved. The integration of satellite data and mathematical models into a combined system (called C-CEMS, Civitavecchia Coastal Environmental Monitoring System), has led to a successful advance in the field of coastal monitoring [1,18,19,20]. A promising low-cost solution to future telecommunication needs could be the LoRa technology, currently under experimentation. Other technological developments, focused on fluorescence sensors, undulating towed vehicles and cost-effective measuring systems, were obtained in the Civitavecchia (Rome, Italy) LOSEM (Laboratorio di Oceanologia Sperimentale ed Ecologia Marina—Experimental Oceanology and Marine Ecology Laboratory) of Tuscia University [26,27,28,29].
In Greece, a multi-parametric observing system has been developed since 2000 by the Hellenic Centre for Marine Research (HCMR) as a part of a more complex observing network (the POSEIDON network) [30]. In 2000, eight moored buoys deployed in the Aegean Sea composed the observing system, which, over the years, has been further implemented and upgraded with new equipment and sensors. Three multi-parametric stations (in the Cretan Sea, the Ionian Sea and the Athos basin) continuously monitor the water column from 3 to 1000 m depths. To date, six fixed mooring buoys located at different coastal and off-shore stations [Athos, Saronikos, Mykonos, Pylos and two locations in the Cretan Sea (E1-M3A and Heraklion)] collect data regarding several variables (such as atmospheric temperature, sea temperature, salinity/conductivity, currents/waves and, at some buoys, optical and biochemical variables) with a sampling frequency of 3 h. This activity has provided long-term data on the marine ecosystem state and functioning, which is also useful to calibrate the marine and weather forecasting systems.
Wang et al. [31] reported a detailed study of the ocean data buoy network developed in China by the State Oceanic Administration (SAO) since 1987. The number of buoys increased from 7 (in the 1990s) to 43 buoys, serving functions such as marine environment forecasting, marine protection and the prevention/mitigation of disasters. The comparison of Chinese technologies with those developed in foreign Countries (e.g., USA, UK, Germany, Canada, Japan) found the gaps existing in the situation of Chinese marine data buoy technologies and suggested directions for future development. Among these directions, the design of low-cost and effective, modularized and standardized buoys—of which some are specialized for special applications (such as tsunami or typhoon monitoring), the increase in spatial monitoring coverage and the use of new technologies/materials has been able to reduce offshore deployment costs.
In Spain, intensive monitoring activity started since 2013 and is continuing in the framework of the Balearic Island Coastal Observing and Forecasting System (Sistema de Observación y Predicción Costero de las Islas Baleares—SOCIB) to respond to technological and societal needs [32]. An integrated ocean observing and forecasting multi-platform system covering areas ranging from coastal to offshore stations in the Western Mediterranean Sea works to collect oceanographic data and provide forecasting services. A fixed-station facility including four coastal monitoring stations is operating at selected harbor sites (Andratx, La Rápita, Maó and Pollensa), where physical and biogeochemical data measurements (temperature, salinity, density, adsorbed heat, sea level) are performed viamonitoring platforms equipped with several sensors. After quality control procedures, the collected data can be downloaded in quasi-realtime using a devoted iPhone App. The integration of autonomous or remote-sensing measurements with in situ oceanographic sampling campaigns is recommended to achieve complete information on ecosystem functioning and variability.
From a Blue Growth perspective, during the last 20 years, some European Countries (including Germany, Denmark, France, Belgium and Italy) have established, through dedicated projects (JERICO, JERICO-NEXT), networks of infrastructures, also integrated by mooring buoys, gliders, HF radars and satellites [33] In the context of the European Marine Strategy Framework Directive (MSFD), Danovaro et al. [34] compiled a large number of in situ technologies and instruments (e.g., AUVs, high-resolution sampling instruments) for marine monitoring, with particular emphasis on the systems required to study marine biodiversity and the impacts of global changes on ecosystem functioning. The need to collect real-time information on the environmental health status, using cost-effective and innovative monitoring systems (able to overcome constraints related to low spatio-temporal resolution and extensive labor requirement) has been stressed; the inclusion of deep-sea ecosystems in the monitoring plans has also been suggested.
Future developments in marine environmental monitoring in the United Kingdom have also been suggested by Bean et al. [35]. Attention has been given to three main pillars, namely the total ecosystem approach, the integration of new technologies and data management and communication.
Tintoré et al. [36] have reviewed more than 30 years of operational oceanography research performed in the Mediterranean, summarizing the basic systems and services currently available in this field (like the multi-platform observing infrastructures developed within the POSEIDON, MOOSE, MAOS, RITMARE and IEOSS research programs and the data assembly systems, i.e., EMODnet or Regional Data Management Systems) and providing recommendations on the future developments of the environmental structures. They also found that some main constraints still affect the performance and sustainability of the Mediterranean system, such as the lack of measurements regarding some Essential Ocean Variables (EOVs), the definition of the right indicators of environmental health, the limited spatial coverage of observations (e.g., Southern Mediterranean insitu observations) and the limited use of modelling systems.
The integration of science with local communities has been proposed as the strategy to be adopted to improve ecosystem management [37]. In this context, two case studies (Ocean Networks Canada and New Moana Project from New Zealand)—in which scientific monitoring was linked to indigenous knowledge—have been illustrated.
Very recently, another success story in environmental monitoring was the long-term coastal monitoring system established in Brazil [38], where a network of several institutions involved in marine and coastal research projects (Programa de PesquisasEcológicas de Longa Duracão—PELD) have joined their efforts to achieve the objectives of a clean, accessible and resilient ocean set by the United Nations Sustainable Development Goals (SDG) in the framework of the Ocean Decade (2021–2030) [39,40].

4. Conclusions

Technological developments in various marine monitoring equipment (buoys, platforms, drifters, gliders etc.) and transmission systems (terrestrial and satellite modems) made available cost-effective, reliable equipment able to measure and transmit real-time complex datasets that can be used for traditional oceanography, operating oceanography and forecasting model feeding. The technologies summarized in this review provide new tools suitable for both environmental monitoring and operational and forecasting oceanography by scientists and stakeholders interested in the protection and management of the marine resources and ecosystem services. The systems for marine monitoring developed at CNR depict a comprehensive overview of the history and the know-how obtained as the result of more than 30 years of research into operational oceanography, highlighting their features’ strengths and weaknesses [41]. Assessing the occurrence of marine pollution is of paramount importance, not only for the preservation of marine ecosystems and mitigation of detrimental effects on them, but also for several aspects related to the health, economy and security of the environment in its totality. The new electronic devices and the water samplers, all designed at the CNR-IAMC Messina, proved their efficiency and reliability for in situ marine monitoring.
More recently, thanks to the advancement in the available technologies, new perspectives have been offered to implement the previous research infrastructures with new multi-platform and integrated observing systems that allowed the advancement in operational services and new scientific achievements and innovation. The design, building and testing of low-cost automatic technologies, such as the water samplers, together with new oceanography sensors, can offer the technological instruments required to monitor environmental status, providing nowcasting, early warning and feeding of forecasting models, thus helping us to better understand the mechanisms of environmental changes such as, for instance, those related to climate warming. Devices can be remotely controlled using the same electronic of data acquisition and transmission connected to various kinds of sensors [16,18]. For pollution monitoring, to date, only a few sensors are available for the measurement of organic pollutants and heavy metal concentrations. Systea (Italy) has developed a new version of the NPA probe (NPA Plus), able to measure total P, total N, total dissolved iron, silicates and sulphides [42]. A fluorescence sensor was developed by Marcelli [26,27,28,29]. The described systems are only some examples of the cost-effective, reliable, easy to use and flexible tools that are offered to stakeholders and scientists; thanks to their modularity, they can be assembled with a new architecture to comply with the needs of monitoring a range of different environmental contexts. Good future goals would be the lowering of costs and the development of sensors for chemical pollutants and bacterial pathogens at low concentrations.
Further challenges could be achieved by integrating the developed systems into societal relevant services and engaging with stakeholders communities to build initiatives in the framework of the 2030 Agenda regarding the relevant Sustainable Development Goal [SDG14—Life below water], which aims at preserving and using in a sustainable way the oceans, the seas and the marine resources, and the UN’s Decade of Ocean Science for sustainable development, therefore contributing to reducing the science–policy gap.

5. Patents

The automatic multiple launcher designed and built in the framework of the MFSTEP program was covered by both Italian and international patents.

Author Contributions

Conceptualization, G.Z. and G.C.; methodology, G.Z.; validation, G.Z.; formal analysis, G.C.; investigation, G.Z.; data curation, G.Z.; writing—original draft preparation, G.Z. and G.C.; writing—review and editing, G.Z. and G.C.; supervision, G.Z.; project administration, G.Z.; funding acquisition, G.Z. All authors have read and agreed to the published version of the manuscript.

Funding

The research activities reviewed in this article were funded by the Italian Ministry of Research and University (MIUR); the Strategical Project “Scientific Problems and Development of Methodologies Related to the Automatic Monitoring of Data Concerning Marine Pollution in the South of Italy”; the PRISMA2 (Research and Experimentation for the safeguarding of the Adriatic Sea) program; “SAM (Advanced Monitoring Systems)” and “PI (Infrastructure Implementation)” programs of the MIUR Cluster 10; the EU FP5 MFSTEP (Mediterranean Forecasting System Towards Environmental Predictions) program; and the “ARCA (Arctic: present Climatic change and pAst extreme events)” project funded by CNR.

Institutional Review Board Statement

Not applicable.

Informed Consent Statement

Not applicable.

Data Availability Statement

Data are available following adequate request to the authors.

Acknowledgments

The authors thank all the scientists who were involved and believed in the monitoring experiences, in particular Antonino Cavaliere, Giuseppe Magazzù and Ermanno Crisafi. The authors wish to thank Renzo Di Chio, who assembled the prototypes.

Conflicts of Interest

The authors declare no conflict of interest. The funders had no role in the design of this study; the collection, analyses, or interpretation of data; the writing of the manuscript; or the decision to publish the results.

References

  1. Bonamano, S.; Piermattei, V.; Madonia, A.; Paladini de Mendoza, F.; Pierattini, A.; Martellucci, R.; Stefanì, C.; Zappalà, G.; Caruso, G.; Marcelli, M. The Civitavecchia Coastal Environment Monitoring System (C-CEMS): A new tool to analyze the conflicts between coastal pressures and sensitivity areas. Ocean Sci. 2016, 12, 87–100. [Google Scholar] [CrossRef]
  2. Griffiths, G.; Davis, R.; Eriksen, C.; Frye, D.; Marchand, P.; Dickey, T. Towards New Platform Technology for Sustained Observations. In Proceedings of the Ocean Obs99, Saint-Raphael, France, 18–22 October 1999; Available online: http://www.bom.gov.au/OceanObs99/Papers/Griffiths.pdf (accessed on 23 February 2007).
  3. Lessing, P.; Henderson, D.; Edwards, B. Architecture and development of an environmental acquisition and reporting system. In Proceedings of the MTS-IEEE OCEANS’99 Conference II, Seattle, WA, USA, 7–9 September l999; pp. 785–788.
  4. Grisard, K. Eight years-experience with the Elbe Estuary environmental survey net. In Proceedings of the OES-IEEE OCEANS’94 Conference I, Brest, France, 13–16 September 1994; pp. 38–43. [Google Scholar]
  5. Sauzade, D.; Hénocque, Y.; Carof, A.H. Arcobleu, an integrated surveillance system for chronic and accidental pollution. Water Sci. Technol. 1995, 32, 25–31. [Google Scholar] [CrossRef]
  6. Canepa, E.; Pensieri, S.; Bozzano, R.; Faimali, M.; Traverso, P.; Cavaleri, L. The ODAS Italia1 buoy: More than forty years of activity in the Ligurian Sea. Progr. Oceanogr. 2015, 135, 48–63. [Google Scholar] [CrossRef]
  7. Autori Vari. Sistema Integrato per il Monitoraggio Automatico Della Rada di Augusta. II-Risultati dei Rilevamenti Della Rete di Monitoraggio (1990–1992); Rapporti Consiglio Nazionale delle Ricerche, Istituto Sperimentale Talassografico-Messina: Messina, Italy, 1994; Volume 7, pp. 1–241. (In Italian) [Google Scholar]
  8. Autori Vari. La Ricerca Scientifica per Venezia: Il Progetto Sistema Lagunare Veneziano; Istituto Veneto di Scienze, Lettere ed Arti: Venice, Italy, 2000. (In Italian) [Google Scholar]
  9. Zappalà, G.; Caruso, G.; Azzaro, F.; Crisafi, E. Marine environment monitoring in coastal Sicilian waters. WIT Trans. Ecol. Environ. 2006, 95, 337–346. [Google Scholar] [CrossRef]
  10. Zappalà, G.; Alberotanza, L.; Crisafi, E. Assessment of environmental conditions using automatic monitoring systems. In Proceedings of the MTS-IEEE OCEANS’99 Conference II, Seattle, WA, USA, 7–9 September l999; pp. 796–800.
  11. Zappalà, G.; Caruso, G.; Crisafi, E. Design and use of advanced technology devices for seawater monitoring. In Operational Oceanography; Implementation at the European and Regional Scales; Flemming, N.C., Vallerga, S., Pinardi, N., Behrens, H.W.A., Manzella, G., Prandle, D., Stel, J.H., Eds.; Oceanography Series; Elsevier: Amsterdam, The Netherlands, 2002; Volume 66. [Google Scholar] [CrossRef]
  12. Zappala, G.; Caruso, G.; Crisafi, E. The “SAM” integrated system for coastal monitoring. In Proceedings of the Fourth International Conference on Environmental Problems in Coastal Regions, Coastal Environment IV; Brebbia, C.A., Ed.; WIT Press: Southampton, UK; Boston, UK, 2002; pp. 341–350. [Google Scholar] [CrossRef]
  13. Zappalà, G. A software set for environment monitoring networks. In Proceedings of the Envirosoft 2004, Ancona, Italy, 2–4 June 2004; Latini, G., Passerini, G., Brebbia, C.A., Eds.; WIT Press: Southampton, UK; Boston, UK, 2004; pp. 3–12. [Google Scholar]
  14. Autori Vari. Piani di Potenziamento della Rete Scientifica e Tecnologica; Ministero dell’Istruzione, dell’Università e della Ricerca: Rome, Italy, 1999. (In Italian)
  15. Zappalà, G.; Azzaro, F. A new generation of coastal monitoring platforms. Chem. Ecol. 2004, 20, 387–398. [Google Scholar] [CrossRef]
  16. Zappalà, G. A versatile software-hardware system for environmental data acquisition and transmission. WIT Trans. Model. Simul. 2009, 48, 283–294. [Google Scholar] [CrossRef]
  17. Autori Vari. Realizzazione ed attivazione di una rete integrata di piattaforme costiere e mezzo mobile attrezzati per Sistemi Avanzati di Monitoraggio delle acque (SAM). In Programma Cluster 10-Potenziamento delle Reti di Ricerca Nelle aree Depresse; Rendicontazione Scientifica Finale, CNR-Istituto Sperimentale Talassografico Messina: Messina, Italy, 2004. (In Italian) [Google Scholar]
  18. Zappalà, G.; Caruso, G.; Piermattei, V.; Bonamano, S.; Madonia, A.; Cicco, A.D.; Martellucci, R.; Marcelli, M. Integrated marine measurements in Civitavecchia, near Rome. WIT Trans. Model. Simul. 2013, 55, 221–235. [Google Scholar] [CrossRef]
  19. Zappalà, G.; Piermattei, V.; Madonia, A.; Martellucci, R.; Bonamano, S.; Pierattini, A.; Burgio, C.; Marcelli, M. Assessment of environmental conditions in Civitavecchia (Rome, Italy) harbour. WIT Trans. Ecol. Environ. 2014, 182, 271–282. [Google Scholar] [CrossRef]
  20. Zappalà, G.; Caruso, G.; Bonamano, S.; Madonia, A.; Piermattei, V.; Martellucci, R.; Di Cicco, A.; Pannocchi, A.; Stefanì, C.; Borsellino, C.; et al. A multi-platform approach to marine environment assessment in the Civitavecchia (Rome) area. J. Oper. Oceanogr. 2016, 9, s131–s143. [Google Scholar] [CrossRef]
  21. Zappalà, G.; Caruso, G.; Crisafi, E. Coastal pollution monitoring by an automatic multisampler coupled with a fluorescent antibody assay. Environ. Stud. 2004, 10, 125–133. [Google Scholar] [CrossRef]
  22. Zappalà, G.; Bruzzone, G.; Caruso, G.; Azzaro, M. Development of an automatic sampler for extreme polar environments: First in situ application in Svalbard Islands. Rend. Lincei 2016, 27, S251–S259. [Google Scholar] [CrossRef]
  23. Zappalà, G.; Bruzzone, G.; Azzaro, M.; Caruso, G. New advanced technology devices for operational oceanography in extreme conditions. Int. J. Sustain. Develop. Plan. 2017, 12, 61–70. [Google Scholar] [CrossRef]
  24. Piermattei, V.; Madonia, A.; Bonamano, S.; Martellucci, R.; Bruzzone, G.; Ferretti, R.; Odetti, A.; Azzaro, M.; Zappalà, G.; Marcelli, M. Cost-effective technologies to study the Arctic Ocean environment. Sensors 2018, 18, 2257. [Google Scholar] [CrossRef] [PubMed]
  25. Pinardi, N.; Allen, I.; Demirov, E.; De Mey, P.; Korres, G.; Laskaratos, A.; LeTraon, P.Y.; Maillard, C.; Manzella, G.; Tziavos, C. The Mediterranean Ocean Forecasting System: First phase of implementation (1998–2001). Ann. Geophys. 2003, 21, 3–20. [Google Scholar] [CrossRef]
  26. Marcelli, M.; Di Maio, A.; Donis, D.; Mainardi, U.; Manzella, G. Development of a new expendable probe for the study of the pelagic ecosystems from Voluntary Observing Ships. Ocean Sci. 2007, 3, 311–320. [Google Scholar] [CrossRef]
  27. Pasculli, L.; Piermattei, V.; Madonia, A.; Bruzzone, G.; Caccia, M.; Ferretti, R.; Odetti, A.; Marcelli, M. New Cost-Effective Technologies Applied to the Study of the Glacier Melting Influence on Physical and Biological Processes in Kongsfjorden Area (Svalbard). J. Mar. Sci. Eng. 2020, 8, 593. [Google Scholar] [CrossRef]
  28. Marcelli, M.; Piermattei, V.; Madonia, A.; Mainardi, U. Design and Application of NewLow-Cost Instruments for Marine Environmental Research. Sensors 2014, 14, 23348–23364. [Google Scholar] [CrossRef]
  29. Marcelli, M.; Piermattei, V.; Gerin, R.; Brunetti, F.; Pietrosemoli, E.; Addo, S.; Boudaya, L.; Coleman, R.; Olubumni, N.; Rick, J.; et al. Toward the widespread application oflow-cost technologies in coastal ocean observing (Internet of Things for the Ocean). Medit. Mar. Sci. 2021, 22, 255–269. [Google Scholar] [CrossRef]
  30. Bourma, E.; Perivoliotis, L.; Petihakis, G.; Korres, G.; Frangoulis, C.; Ballas, D.; Zervakis, V.; Tragou, E.; Katsafados, P.; Spyrou, C.; et al. The Hellenic Marine Observing, Forecasting and Technology System—An Integrated Infrastructure for Marine Research. J. Mar. Sci. Eng. 2022, 10, 329. [Google Scholar] [CrossRef]
  31. Wang, J.; Wang, Z.; Wang, Y.; Liu, S.; Li, Y. Current situation and trend of marine data buoy and monitoring network technology of China. Acta Oceanol. Sin. 2016, 35, 1–10. [Google Scholar] [CrossRef]
  32. Vargas-Yáñez, M.; Moya, F.; Serra, M.; Juza, M.; Jordà, G.; Ballesteros, E.; Alonso, C.; Pascual, J.; Salat, J.; Moltó, V.; et al. Observations in the Spanish Mediterranean Waters: A Review and Update of Results of 30-Year Monitoring. J. Mar. Sci. Eng. 2023, 11, 1284. [Google Scholar] [CrossRef]
  33. She, J.; Allen, I.; Buch, E.; Crise, A.; Johannessen, J.A.; Le Traon, P.-Y.; Lips, U.; Nolan, G.; Pinardi, N.; Reißmann, J.H.; et al. Developing European operational oceanography for Blue Growth, climate change adaptation and mitigation, and ecosystem-based management. Ocean Sci. 2016, 12, 953–976. [Google Scholar] [CrossRef]
  34. Danovaro, R.; Carugati, L.; Berzano, M.; Cahill, A.E.; Carvalho, S.; Chenuil, A.; Corinaldesi, C.; Cristina, S.; David, R.; Dell’Anno, A.; et al. Implementing and Innovating Marine Monitoring Approaches for Assessing Marine Environmental Status. Front. Mar. Sci. 2016, 3, 213. [Google Scholar] [CrossRef]
  35. Bean, T.P.; Greenwood, N.; Beckett, R.; Biermann, L.; Bignell, J.P.; Brant, J.L.; Copp, G.H.; Devlin, M.J.; Dye, S.; Feist, S.W.; et al. A Review of the Tools Used for Marine Monitoring in the UK: Combining Historic and Contemporary Methods with Modeling and Socioeconomics to Fulfill Legislative Needs and Scientific Ambitions. Front. Mar. Sci 2017, 4, 263. [Google Scholar] [CrossRef]
  36. Tintoré, J.; Pinardi, N.; Alvarez-Fanjul, E.; Aguiar, E.; Alvarez-Berastegui, D.; Bajo, M.; Balbin, R.; Bozzano, R.; Bozzano, R.; Nardelli, B.B.; et al. Challenges for Sustained Observing and Forecasting Systems in the Mediterranean Sea. Front. Mar. Sci. 2019, 6, 568. [Google Scholar] [CrossRef]
  37. Kaiser, B.A.; Hoeberechts, M.; Maxwell, K.H.; Eerkes-Medrano, L.; Hilmi, N.; Safa, A.; Horbel, C.; Juniper, S.K.; Roughan, M.; Theux Lowen, N.; et al. The Importance of Connected Ocean Monitoring Knowledge Systems and Communities. Front. Mar. Sci. 2019, 6, 309. [Google Scholar] [CrossRef]
  38. Cordeiro, C.A.; Aued, A.W.; Barros, F.; Bastos, A.C.; Bender, M.; Mendes, T.C.; Creed, J.C.; Cruz, I.C.; Dias, M.S.; Fernandes, L.D.; et al. Long-term monitoring projects of Brazilian marine and coastal ecosystems. Peer J 2022, 10, e14313. [Google Scholar] [CrossRef]
  39. Heymans, J.J.; Bundy, A.; Christensen, V.; Coll, M.; De Mutsert, K.; Fulton, E.A.; Piroddi, C.; Shin, Y.-J.; Steenbeek, J.; Travers-Trolet, M. The Ocean decade: A true ecosystem modeling challenge. Front. Mar. Sci. 2020, 7, 554573. [Google Scholar] [CrossRef]
  40. Visbeck, M. Ocean science research is key for a sustainable future. Nat. Comm. 2018, 9, 690. [Google Scholar] [CrossRef]
  41. Zappalà, G.; Caruso, G.; Piermattei, V.; Madonia, A.; Bonamano, S.; Petri, A.; Marcelli, M. Devices for environmental observations. WIT Trans. Eng. Sci. 2018, 125, 61–71. [Google Scholar] [CrossRef]
  42. Systea Analytical Technologies. Available online: https://www.systea.it (accessed on 2 June 2023).
Figure 1. One of the buoys located in Augusta Bay.
Jmse 11 01958 g001
Figure 2. First version of the prototype platform located in the Messina coastal waters.
Jmse 11 01958 g002
Figure 3. The system architecture.
Jmse 11 01958 g003
Figure 4. The refurbished version of the prototype platform, moored in the Messina Straits.
Jmse 11 01958 g004
Figure 5. The last version of the advanced monitoring platform: one of the six semi-submersed platforms.
Jmse 11 01958 g005
Figure 6. The electronic equipment mounted in the Venice Lagoon System (left), the version used in the PRISMA2 research program (middle) and the updated version used in the SAM program (right).
Jmse 11 01958 g006
Figure 7. The “SAM” water sampler on the bench (left) and installed on the prototype platform, with the box above containing the pumps, the formalin for sample fixation and the rising water (right).
Jmse 11 01958 g007
Figure 8. The Arctic version of the water sampler (left) and its electronics (right).
Jmse 11 01958 g008
Table 1. Main characteristics of the measuring devices.
InstrumentParameterAccuracyResolution
IDROMAR IM50TEMPERATURE0.02 °C0.0025 °C
IDROMAR IM50CONDUCTIVITY0.02 mS/cm0.004 mS/cm
IDROMAR IM50DISSOLVED OXYGEN2% sat0.01%sat
IDROMAR IM50FLUORESCENCE0.05 µg/L0.0035 µg/L (f.s. 50)
IDROMAR IM50TURBIDITY1 FTU0.015 FTU (f.s. 200 FTU)
SEA-BIRD 39TTEMPERATURE0.002 °C0.0001 °C
SYSTEA NPAPO4–P (range)5–500 µg/L
SYSTEA NPANH4–N (range)3–1000 µg/L
SYSTEA NPA(NO3+NO2)–N (range)10–500 µg/L
SYSTEA NPANO2–N (range)2–200 µg/L
Table 2. Main components and evolution of the developed monitoring systems.
1989–1990 First Buoy1991–1992 Augusta BuoyVenice Lagoon SystemPrisma 2Cluster PlatformsCivitavecchia Platform
Data acquisitionCommercial closed systemCommercial closed systemExperimental systemExperimental systemExperimental SystemExperimental System
Static sensorsMultiparametric probeT, C, DO, Fl, TUTriaxial Doppler AnemometersMultiparametric probe—radiometerMultiparametric probe—SBE 39T probesMultiparametric probe—SBE 39T probes
Measurement equipment (e.g., analyzers)NONONOMicroMac 1000 ammonia analyzerExperimental NPA nutrient analyzer—pumping system—water sampler—meteo stationAll the instruments of cluster platforms could be installed
Transmission technologyVHF—basic modemUHF—radio modemUHF—smart packet radio modemGSM telephonyGSM Telephony and SMSGPRS Telephony and Internet
Recharging systemsNONOYESYESSolar panels and wind generatorSolar panels and wind generator
Un-mooring alarmNONON.A.N.A.YESYES
Abbreviations: T, Temperature; C, Conductivity; DO, Dissolved Oxygen; Fl, Fluorescence; TU, Turbidity; N.A., Not Applicable.
Disclaimer/Publisher’s Note: The statements, opinions and data contained in all publications are solely those of the individual author(s) and contributor(s) and not of MDPI and/or the editor(s). MDPI and/or the editor(s) disclaim responsibility for any injury to people or property resulting from any ideas, methods, instructions or products referred to in the content.

