Article

Analysis of Flow-Induced Vibration Control in a Pontoon Carrier Based on a Pendulum-Tuned Mass Damper

College of Ocean Science and Engineering, Shandong University of Science and Technology, Qingdao 266590, China
*
Author to whom correspondence should be addressed.
J. Mar. Sci. Eng. 2023, 11(10), 1963; https://doi.org/10.3390/jmse11101963
Submission received: 29 August 2023 / Revised: 28 September 2023 / Accepted: 9 October 2023 / Published: 11 October 2023
(This article belongs to the Special Issue Advances in Marine Mechanical and Structural Engineering)

Abstract

:
The pendulum-tuned mass damper (PTMD) is a widely used vibration-damping device capable of transferring and dissipating structural vibration energy, resulting in reduced structural amplitude, and offering both structural and performance advantages. Given the susceptibility of the submerged expendable conductivity, temperature, and depth profiler (SSXCTD) buoyancy platform to flow-induced vibrations during the upwelling process, the PTMD effectively suppresses the main structure’s amplitude under flow field effects. To this end, we investigated the application and design of the PTMD in the SSXCTD buoyancy platform and analyzed its vibration reduction performance. Moreover, we conducted finite volume simulations of the structure using ANSYS FLUENT fluid simulation software, providing insights into its motion under flow field effects and validating the PTMD’s effectiveness in mitigating the buoyancy platform’s flow-induced vibrations. Our research results demonstrate that the PTMD effectively alleviates the impact of seawater flow on the buoyancy platform, leading to a significant improvement in its operational stability. The proposed research methodology and findings serve as valuable references for the design and optimization of other expendable marine detection equipment.

1. Introduction

In recent years, as ocean research and development have accelerated, traditional marine detection equipment has struggled to meet the demands of increasingly complex detection environments and requirements. Consequently, new types of ocean physical parameter measurement devices, such as the submerged expendable conductivity, temperature, and depth profiler (SSXCTD), have emerged. These devices provide oceanographers with physical parameters, including seawater temperature and salinity at various depths, enabling a more accurate understanding of the specific oceanic characteristics in a given area. This has significant implications for marine economic development, military strength building, marine environmental protection, and other applications [1]. As research progresses, higher expectations are placed on the stability of the SSXCTD’s operational process and the precision of measurement results [2]. In addition, the buoyancy platform plays a crucial role in the SSXCTD’s operations, encompassing functions such as protection, load-bearing, release, and data transmission. Consequently, designing a buoyancy platform capable of withstanding the flow-induced vibrations in the underwater environment is essential to enhance the stability of the SSXCTD measurement system and the accuracy of its results.
The pendulum-tuned mass damper (PTMD) is an early-developed device used for structural vibration control. It primarily consists of two parts: a structural vibration system, composed of an inertial mass, and a damping system, which is generally supported or suspended on the structure. When the structure experiences external excitation and starts vibrating, the PTMD system also vibrates accordingly. The inertial forces generated by the PTMD system act in response to the structure, tuning these inertial forces to harmonize with the main structure’s vibrations. This process reduces the structural vibration response and mitigates fatigue damage. Initially, the PTMD was primarily utilized in tall buildings and bridges to control the amplitude of structural vibrations. Gradually, it was introduced into mechanical structures to control mechanical vibrations. In recent years, the PTMD has found successful applications in small and medium-sized equipment in the marine domain [3]. Hu et al. [3] incorporated electromechanical inertance systems into PTMD design and applied the integrated electromechanical inertance PTMD system to the vibration control of offshore wind turbines. In 2015, Tan et al. [4] investigated the vibration control problems of suspended pipeline systems under seismic excitations and experimentally verified the vibration suppression performance of two PTMD configurations: a spring-steel type and a single-pendulum type. Guan et al. [5] studied the application of genetic algorithms in tuning the parameters of tuned mass dampers, improving the system’s damping efficiency through the optimization of system parameters. Xia et al. [6] investigated the application of PTMDs in the collision damping and vibration damping control of offshore wind turbines under combined wind and wave action and used the Euler–Lagrange equations to establish a simplified model of the wind turbine considering blade, tower coupling, and pile–soil interactions, and, through numerical simulation, the dynamic response characteristics of the wind turbine under wind, wave, and seismicity were analyzed in the absence of control. The forward and backward displacements of the nacelle of an offshore monopile wind turbine were controlled using a PTMD. The analyses showed that the incorporation of viscoelastic material baffles made the PTMD less space-intensive and more robust than the TMD.
Note that the current primary application of PTMDs in the field of marine engineering equipment technology focuses on vibration control for instruments and equipment such as wind turbines and buoys above the sea surface. Although some studies have been conducted on reducing the mechanical structure vibrations of small underwater detection equipment, like submerged expendable conductivity, temperature, and depth (SSXCTD) buoys, progress in this area remains limited. Furthermore, existing research on PTMD applications mostly centers on the vibration control of tall buildings and bridges in atmospheric airflow, leaving a gap in the analysis of vibration control for small devices like SSXCTD buoys in seawater flow fields. Therefore, this paper investigates the vibration control problem of SSXCTD buoys with the use of PTMD systems in seawater flow fields. Firstly, a dynamic model of the SSXCTD buoy is established. Through research and analysis of the model, parameters affecting the buoy’s motion stability are identified. These parameters are then used for the research and design of the PTMD system when applied to the SSXCTD buoy, and the system’s effectiveness is validated through finite volume simulation analysis.

2. Dynamic Model of SSXCTD Buoyancy Vehicle

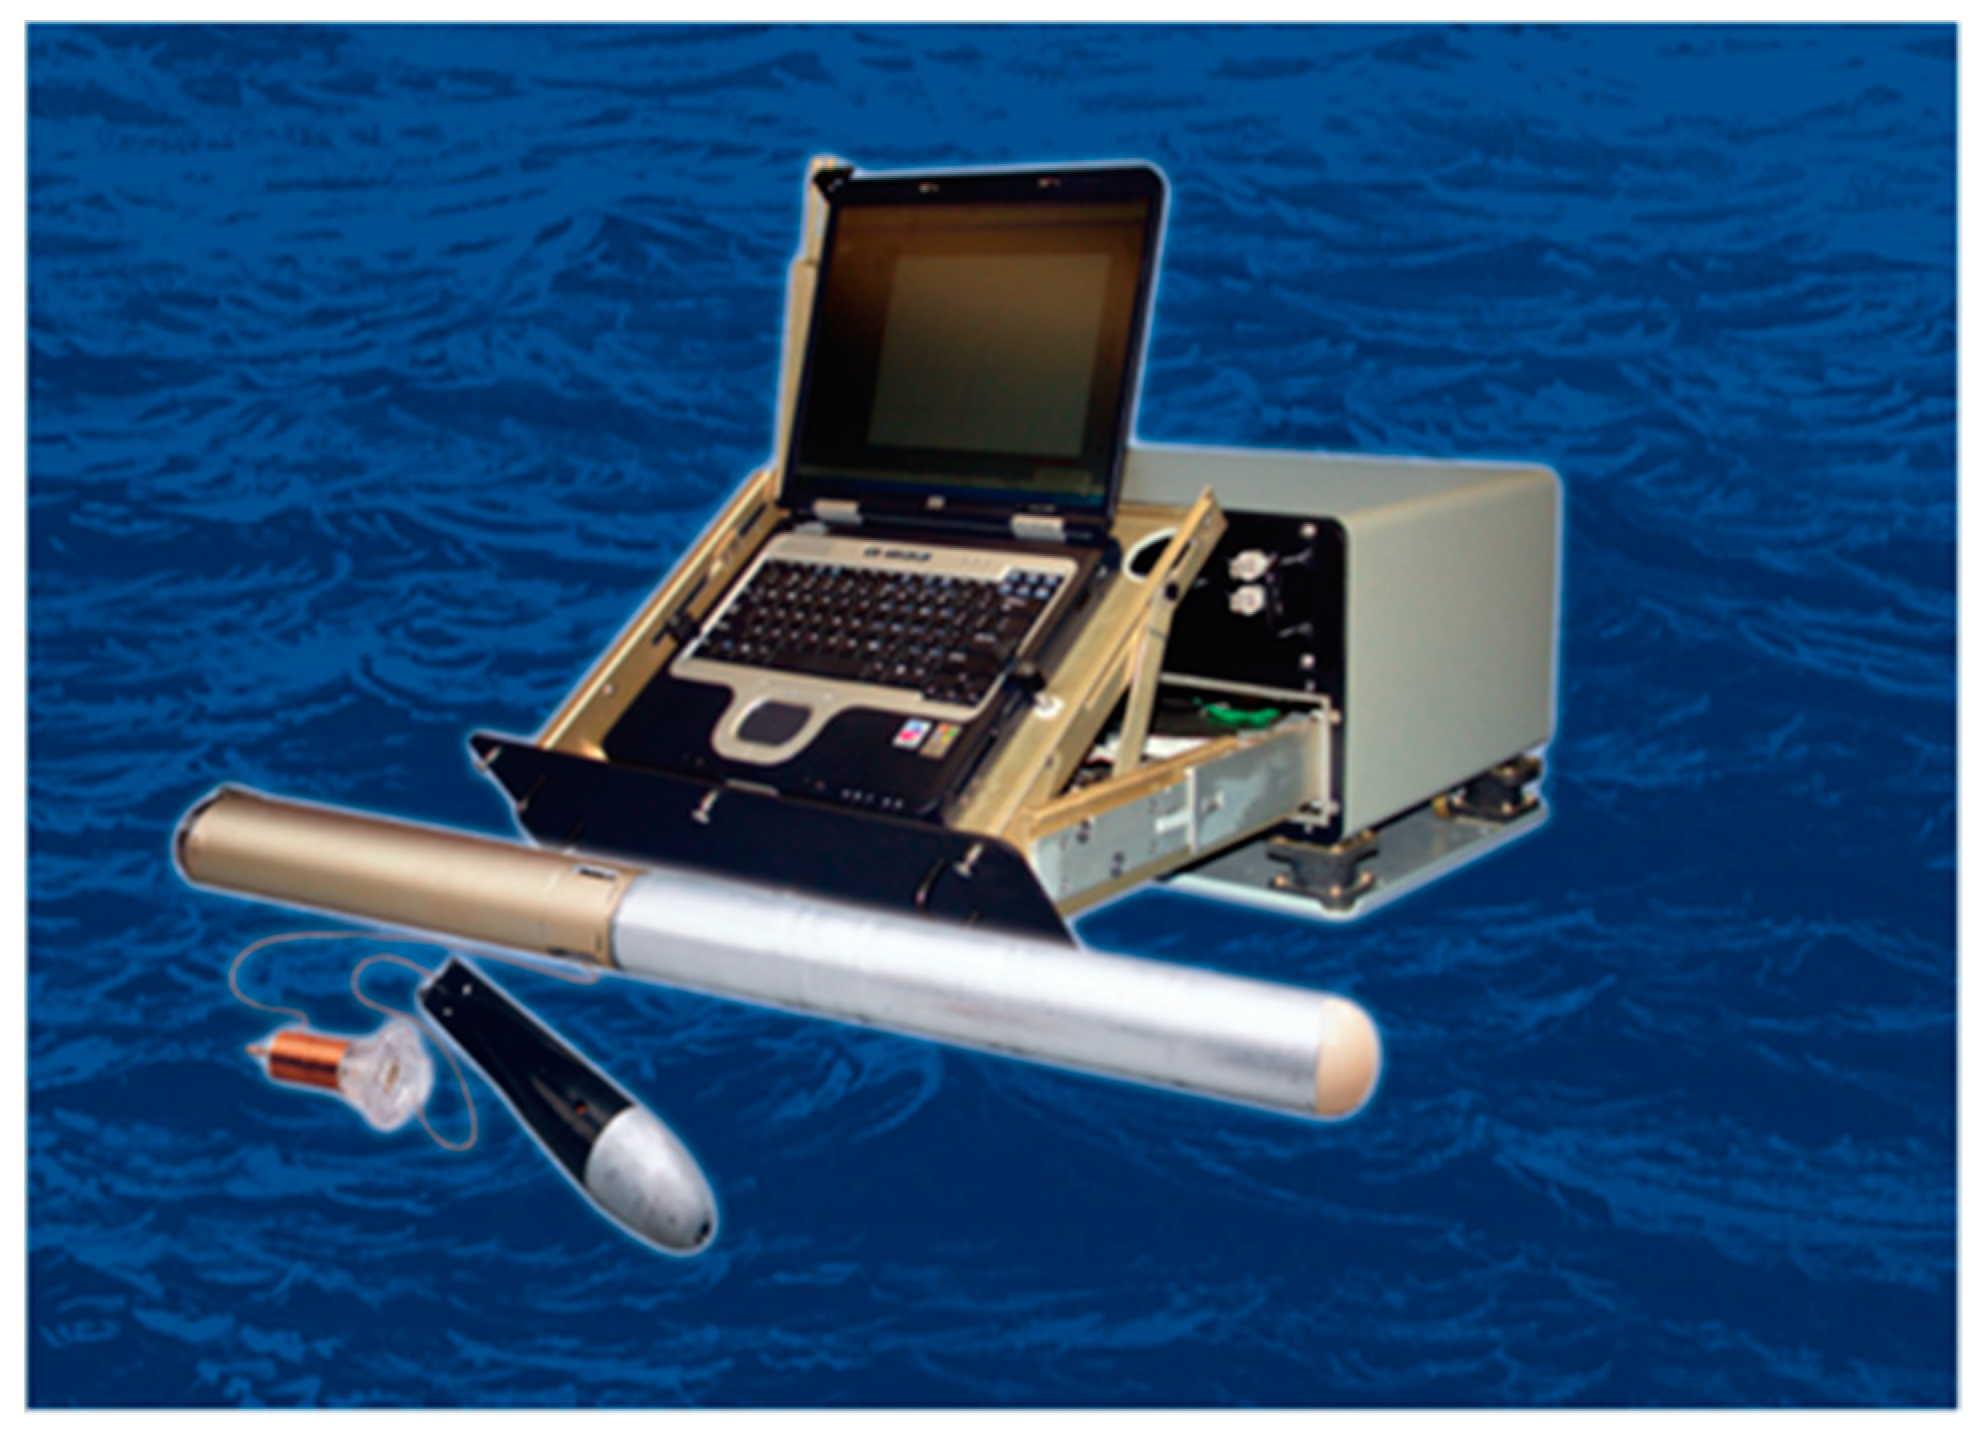
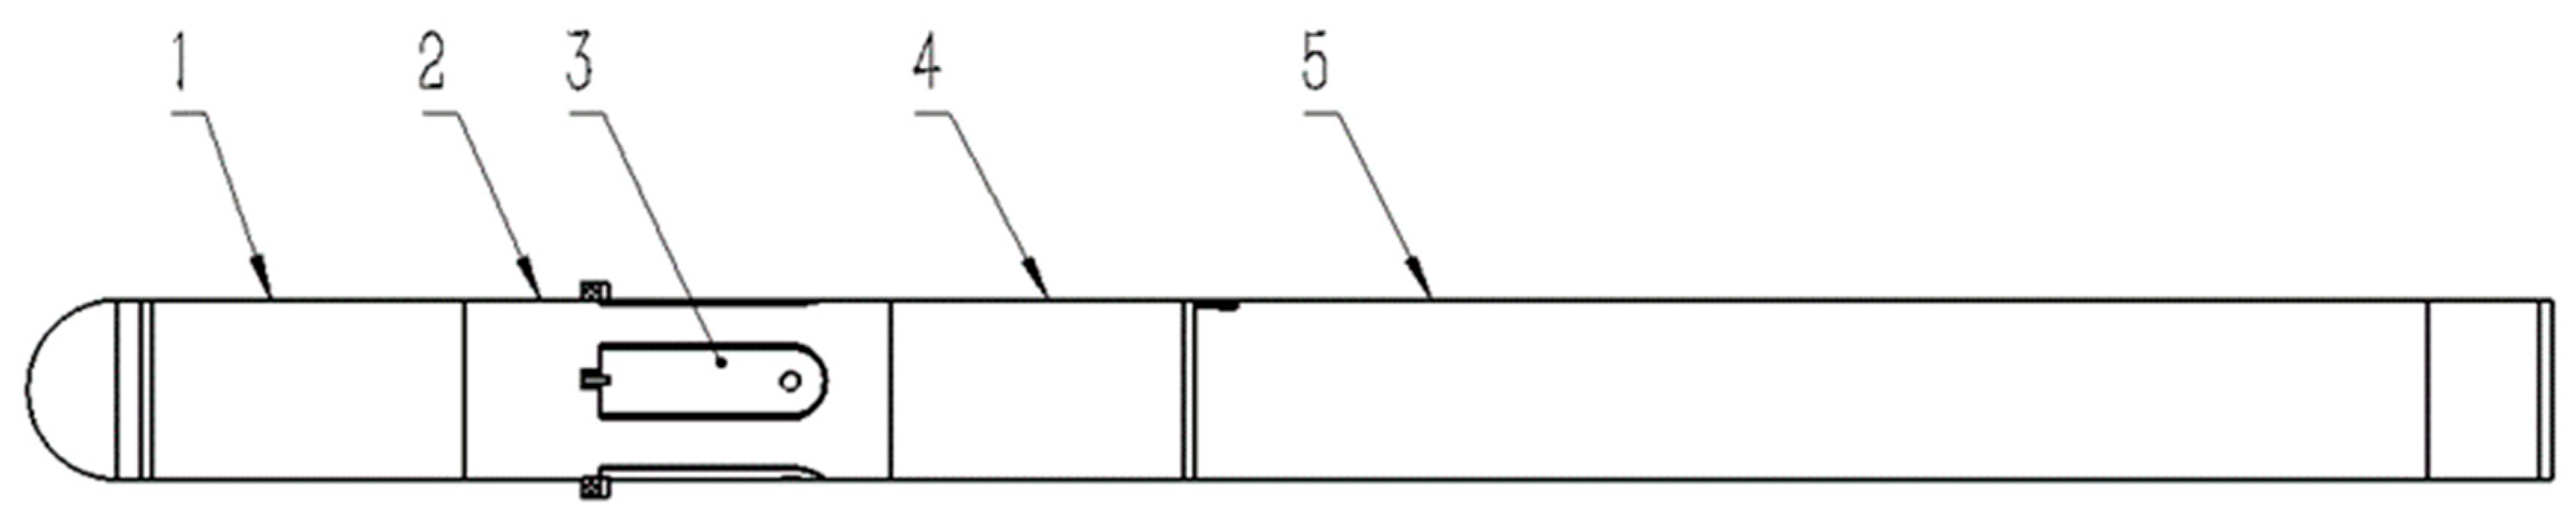
2.1. SSXCTD Buoyancy Vehicle

As depicted in Figure 1, this schematic diagram illustrates the prototype of a submerged expendable conductivity, temperature, and depth (SSXCTD) instrument developed by Lockheed Martin Corporation [7]. The prototype comprises three main components: the probe, buoyancy carrier, and deck unit. The diagram clearly shows that the buoyancy carrier consists of two parts: the upper buoyancy cylinder and the lower probe housing cylinder. This structural design is commonly employed in similar, currently available products.
Figure 2 illustrates the structural design of the self-developed buoyancy carrier. It comprises, from top to bottom (from right to left in the figure), the buoyancy chamber, near-surface attitude stabilization chamber, upwelling process attitude correction chamber, and probe housing chamber. The overall structure forms a cylindrical shape. In this paper, we will concentrate on this structure as the research subject and explore the design and application of the pendulum-tuned mass damper (PTMD) in small-scale oceanic detection equipment such as the SSXCTD.

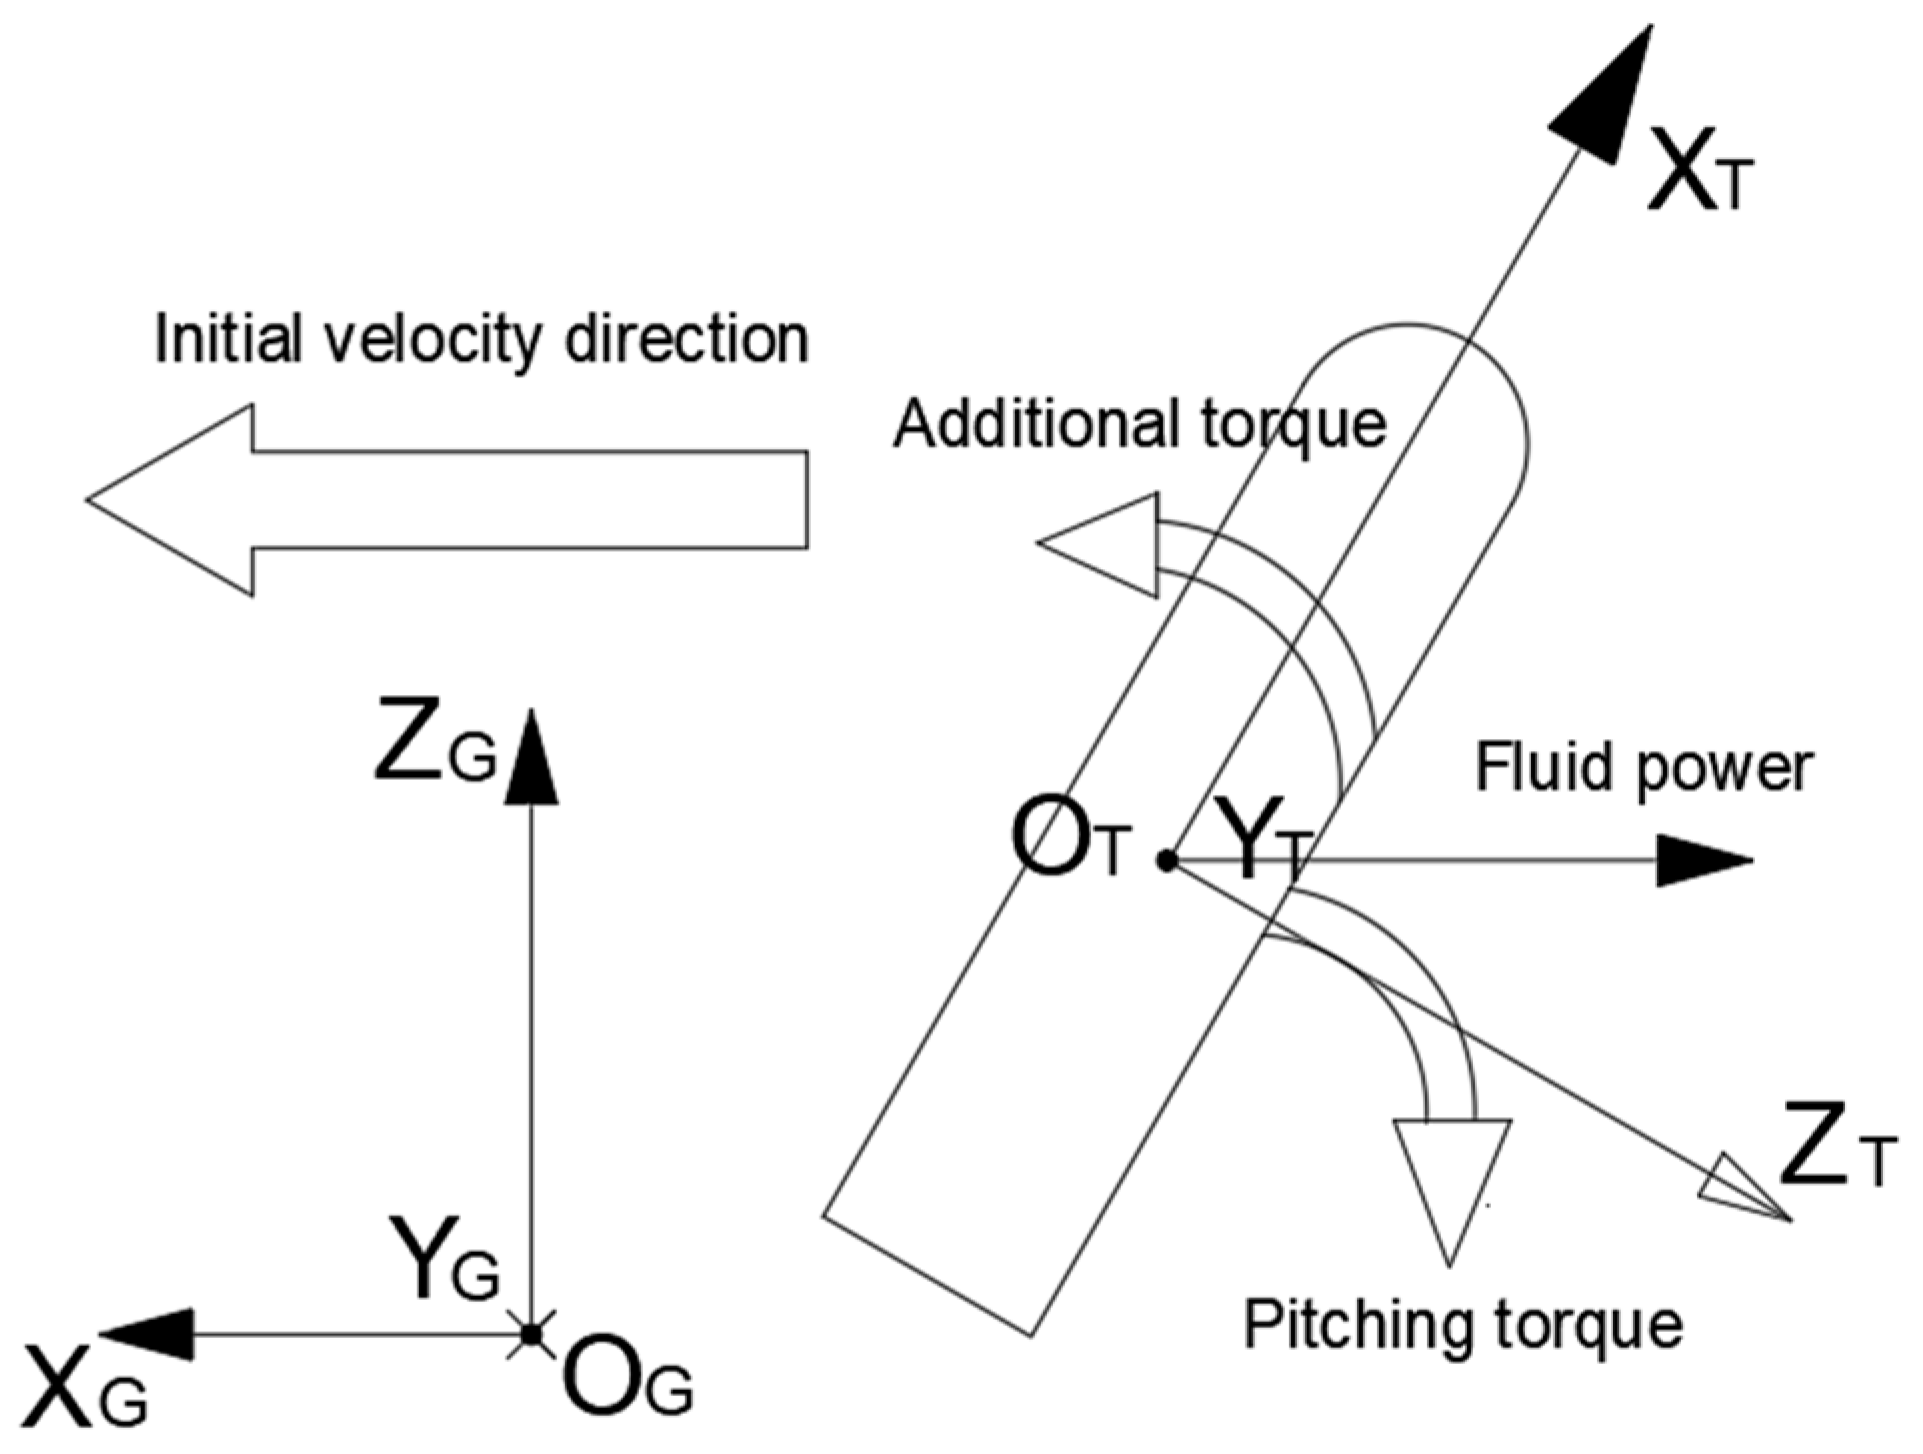
2.2. The Dynamical Model of the SSXCTD Buoyancy Vehicle

During the operational process, the SSXCTD buoyancy carrier functions as a complex multi-degree-of-freedom system. In the buoyancy carrier’s upwelling process, the hydrodynamic forces of seawater provide the main load. To facilitate analysis and reduce the complexity of the buoyancy carrier’s load, we simplified its structure to a cylindrical shape and established a six-degrees-of-freedom model system [8].
To model and analyze the motion of the buoyancy carrier, it is essential to establish relevant coordinate systems, namely, the body coordinate system and the inertial coordinate system, as shown in Figure 3. Now, let us introduce each of them.
The body coordinate system O T X T Y T Z T : The origin O T of this coordinate system is located at the centroid of the buoyancy carrier. The positive direction of the O T X T axis aligns with the longitudinal direction of the buoyancy carrier, pointing towards the head of the buoyancy carrier. The O T Y T axis is perpendicular to the O T X T axis and lies within the symmetry plane of the buoyancy carrier. The O T Z T axis is orthogonal to both the O T X T and O T Y T axes, forming a right-handed Cartesian coordinate system.
The inertial coordinate system O G X G Y G Z G : The origin O G of this coordinate system is located at the launch point of the deployment platform. The O G X G axis lies within the horizontal plane of the launch point and points in the direction of the launch. The O G Z G axis is perpendicular to the O G X G axis, with its positive direction aligned along the vertical line at the launch point, pointing upward. The O G Y G axis is orthogonal to both the O G X G and O G Z G axes, forming a right-handed Cartesian coordinate system.
After the buoyancy carrier is launched from the platform into the water, its motion can be considered as free motion. During the motion process, it experiences forces such as gravity, buoyancy, hydrodynamic forces, and added mass effects. In the inertial coordinate system, the dynamic models of the buoyancy carrier’s translational and rotational motions around its center of mass can be expressed as follows [8]:
V ˙ x 1 = [ m ( V y 1 ω z 1 V z 1 ω y 1 ) + F λ x 1 + R x 1 + F x 1 + G x 1 ] / ( m + λ 11 ) V ˙ y 1 = [ m ( V z 1 ω x 1 V x 1 ω z 1 ) + F λ y 1 + R y 1 + F y 1 + G y 1 ] / ( m + λ 22 ) V ˙ z 1 = [ m ( V x 1 ω y 1 V y 1 ω x 1 ) + F λ z 1 + R z 1 + F z 1 + G z 1 ] / ( m + λ 33 )
ω ˙ x 1 = [ J y 1 J z 1 ) ω y 1 ω z 1 + M λ x 1 + M x 1 + M f x 1 ] / ( J x 1 + λ 44 ) ω ˙ y 1 = [ J z 1 J x 1 ) ω x 1 ω z 1 + M λ y 1 + M y 1 + M f y 1 ] / ( J y 1 + λ 55 ) ω ˙ z 1 = [ J x 1 J y 1 ) ω x 1 ω y 1 + M λ z 1 + M z 1 + M f z 1 ] / ( J z 1 + λ 66 )
In Equation (1), F λ x 1 , F λ y 1 , and F λ z 1 , represent the added forces; R x 1 , R y 1 , and R z 1 represent the hydrodynamic forces; F x 1 , F y 1 , and F z 1 represent the buoyancy forces; and G x 1 , G y 1 , and G z 1 represent the gravitational forces. In Equation (2), M λ x 1 , M λ y 1 , and M λ z 1 represent the added moments; M x 1 , M y 1 , and M z 1 represent the hydrodynamic moments; and M f x 1 , M f y 1 , and M f z 1 represent the buoyancy moments.
The added forces and added moments can be expressed as follows:
F λ x 1 = λ ˙ 11 V x 1 λ 33 ω y 1 V z 1 λ 35 ω y 1 2 + λ 22 ω z 1 V y 1 + λ 26 ω z 1 2 F λ y 1 = λ ˙ 22 V y 1 λ ˙ 26 ω z 1 λ 26 ω ˙ z 1 + λ 33 ω x 1 V z 1 + λ 35 ω x 1 ω y 1 F λ z 1 = λ ˙ 33 V z 1 λ ˙ 35 ω y 1 λ 35 ω ˙ y 1 λ 22 ω x 1 V y 1 λ 26 ω x 1 ω z 1
M λ x 1 = λ ˙ 44 ω x 1 + ( λ 55 λ 66 ) ω y 1 ω z 1 + ( λ 26 + λ 35 ) ( ω z 1 V z 1 V y 1 ω y 1 ) M λ y 1 = λ ˙ 55 ω y 1 λ ˙ 35 V z 1 λ 35 V ˙ z 1 + ( λ 66 λ 44 ) ω x 1 ω z 1 + λ 26 ω x 1 V y 1 M λ z 1 = λ ˙ 66 ω z 1 λ ˙ 26 V y 1 λ 26 V ˙ y 1 + ( λ 44 λ 55 ) ω x 1 ω y 1 λ 35 ω x 1 V z 1
In the equations, λ 11 , λ 22 , and λ 33 represent added mass; λ 26 and λ 35 represent added static moments; and λ 44 , λ 55 , and λ 66 represent added moments of inertia. If the buoyancy carrier is a smooth axially symmetric body, the following relations hold: λ 22 = λ 33 ,   λ 55 = λ 66 , and λ 26 = λ 35 . Consequently, Equations (3) and (4) can be simplified as follows:
F λ x 1 = λ ˙ 11 V x 1 + ( ω z 1 V y 1 ω y 1 V z 1 ) λ 22 + ( ω y 1 2 + ω z 1 2 ) λ 26 F λ y 1 = λ ˙ 22 V y 1 λ ˙ 26 ω z 1 ( ω ˙ z 1 + ω x 1 ω y 1 ) λ 26 + λ 22 ω x 1 V z 1 F λ z 1 = λ ˙ 22 V z 1 + λ ˙ 26 ω y 1 + ( ω ˙ y 1 ω x 1 ω z 1 ) λ 26 λ 22 ω x 1 V y 1
M λ x 1 = λ ˙ 44 ω x 1 M λ y 1 = λ ˙ 55 ω y 1 + λ ˙ 26 V z 1 + ( V ˙ z 1 + ω x 1 V y 1 ) λ 26 + ( λ 55 λ 44 ) ω x 1 ω z 1 M λ z 1 = λ ˙ 55 ω z 1 λ ˙ 26 V y 1 ( V ˙ y 1 ω x 1 V z 1 ) λ 26 + ( λ 44 λ 55 ) ω x 1 ω y 1

2.3. Analysis of Buoyancy Vehicle’s Attitude Stability

By analyzing the various expressions of momentum and momentum moments for the underwater buoyancy carrier’s motion in the water, it can be observed that each λ i j represents an additional value, added to the buoyancy carrier’s various inertia coefficients when it moves in an ideal fluid. The coefficients λ i j ( i = 1 , 2 , 3 ; j = 1 , 2 , 3 ) have a mass dimension and are called added masses. The coefficients λ i j ( i = 1 , 2 , 3 ;   j = 4 , 5 , 6 ) have a static moment dimension and are referred to as added static moments. The coefficients λ i j   ( i = 4 ,   5 ,   6 ;   j = 4   , 5 ,   6 ) have a second-moment dimension. The coefficients with i = k are added to the inertia moments, known as added inertia moments, while the coefficients with i k are added to the inertia products, termed added inertia products. In the computation of non-steady fluid forces and moments acting on the underwater buoyancy carrier, its axial asymmetry is usually neglected. Therefore, there are only eight coefficients that need to be determined: λ 11 , λ 22 , λ 33 , λ 44 , λ 55 , λ 66 , λ 26 , and λ 35 , with the following relationships:
λ 11 = L λ 11 x d x λ 22 = L λ 22 x d x λ 33 = L λ 33 x d x λ 44 = L λ 44 x d x λ 26 = L x λ 26 x d x λ 35 = L x λ 35 x d x λ 55 = L x 2 λ 55 x d x λ 66 = L x 2 λ 66 x d x
For a finite-length cylindrical body with a radius of ‘a’ in an unbounded, incompressible potential flow, the added mass per unit length is given by:
λ 22 x = λ 33 x = ρ π a 2
Assuming that the diameter of the shell at the longitudinal coordinate x of the passive underwater buoyancy carrier is D(x), and the volume of the shell for the passive underwater buoyancy carrier is V b , we can calculate that:
λ 11 = μ x ρ V b λ 22 = λ 33 = μ y ρ V b λ 55 = λ 66 = μ y ρ π 4 L x 2 D 2 x d x λ 26 = λ 35 = μ y ρ π 4 L x D 2 x d x = μ y ρ V b x b
Here, μ x represents the longitudinal added mass coefficient of the shell, typically ranging from 0.02 to 0.04, and μ y represents the longitudinal flow correction coefficient, usually ranging from 0.95 to 0.98 [9].
In conclusion, for a spatially symmetrical six-degree-of-freedom motion model, it is essential to design an appropriate structure to maintain a relatively stable attitude motion under the influence of fluid forces. When the model tilts in a certain direction during motion, this structure can provide an additional inertia moment to counteract the tilting moment of the main structure and maintain its stable attitude [10]. Based on the above analysis, this paper employs the working principle of the PTMD to design a vibration reduction structure that reduces the unstable motion amplitude of the buoyancy carrier caused by fluid forces during its underwater operation.

3. PTMD System Design

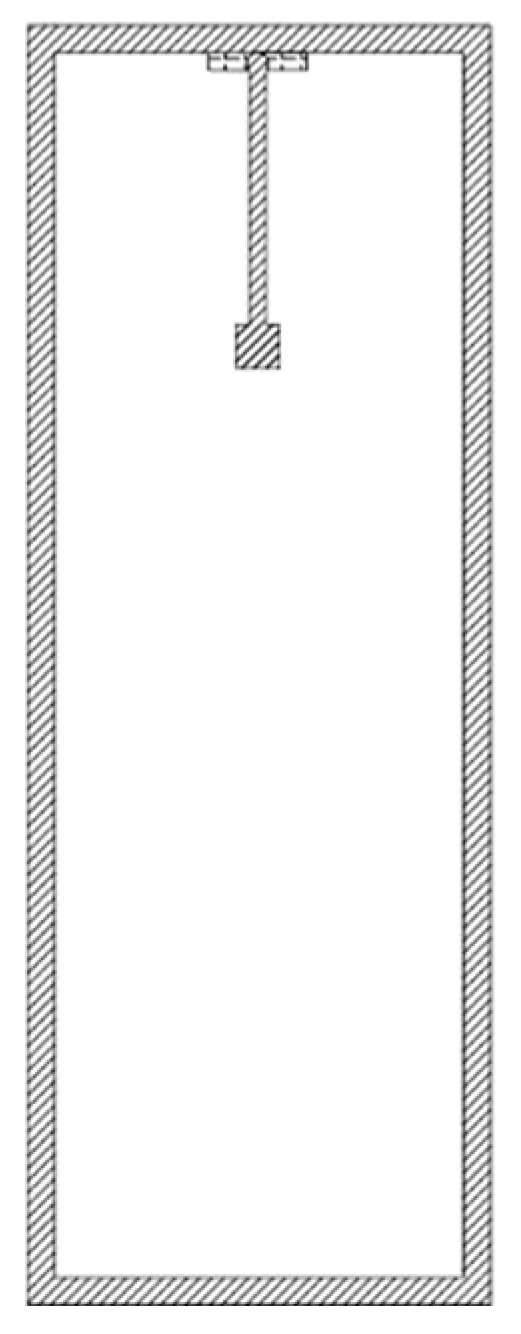
3.1. The Working Principle of the PTMD System

The PTMD is a mechanical device used for structural vibration reduction. Its principle function involves utilizing the interaction between the mass and damping systems to achieve the effect of vibration reduction in a structure [11].
The mass component of the PTMD consists of one or multiple mass blocks, and the system’s resonance frequency can be adjusted by changing the mass, quantity, and position of these blocks. When the system is subjected to external forces and undergoes vibration, the mass blocks generate inertia forces to counteract the external forces, thereby reducing the vibration amplitude of the system.
The conventional PTMD’s damping system typically comprises multiple springs, which can be adjusted to control the system’s stiffness. When the system experiences external forces and undergoes vibration, the springs generate reactive forces to counteract the external influences. They also serve to restrict the movement of the mass blocks, preventing them from rapidly destabilizing the entire damping system.
The working principle of the PTMD designed in this paper is similar. When the carrier experiences displacement in a certain direction due to fluid forces, the pendulum of the pendulum-tuned mass damper will swing in the opposite direction under the effect of inertia force, reducing the amplitude of the carrier’s swing in that direction. Similarly, to achieve better vibration reduction results, the pendulum’s swing must not be excessively free. Therefore, an electromagnetic damping system is adopted which allows the damping coefficient of the system to be adjusted through electromagnetic forces [12].
This system can be simply understood as follows: A magnetic force is applied to the pendulum, always directed towards the center of the permanent magnet. This force does not affect the direction of the pendulum’s swing during actual operation but provides a constraint, allowing the pendulum to play its corresponding vibration reduction role. However, when the entire carrier tends to stabilize, the pendulum can quickly stabilize as well, limiting its free swinging and avoiding unnecessary damage.

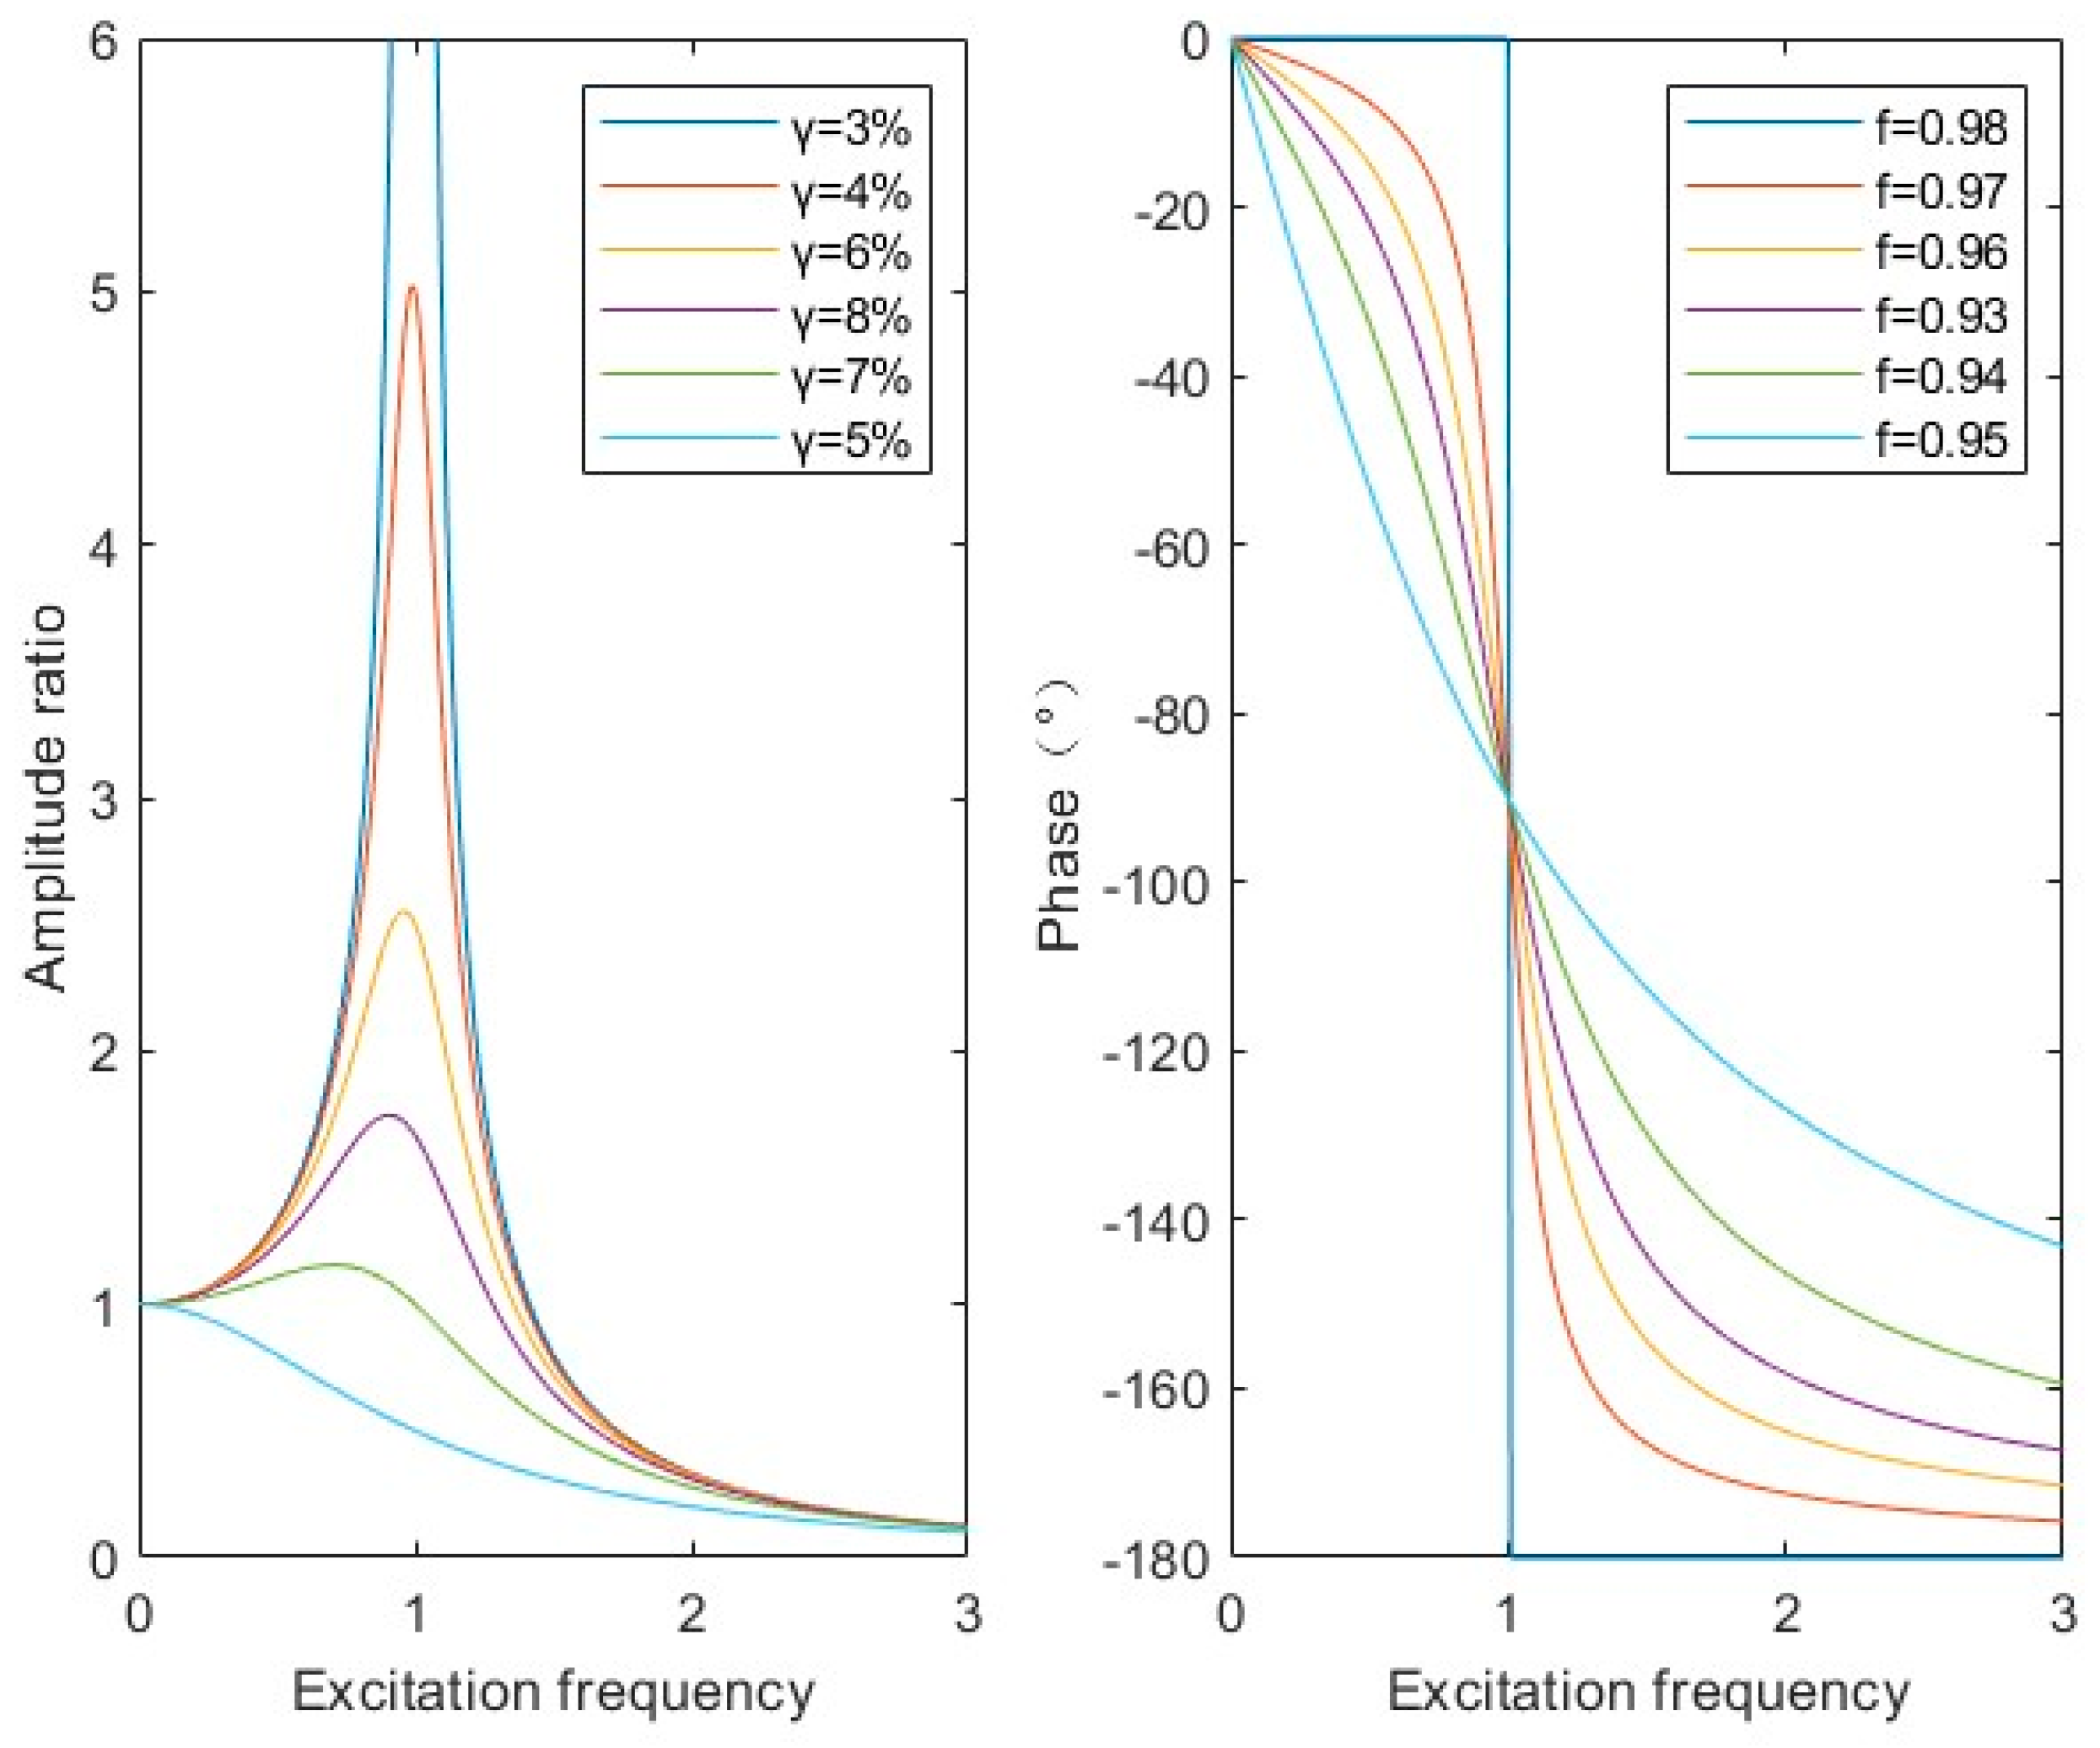
3.2. Numerical Calculations for PTMD System Design

The SSXCTD buoyancy carrier can be regarded as a hollow cylindrical structure with uniform mass distribution. Therefore, the computational model of the PTMD-equipped SSXCTD buoyancy carrier can be simplified to a six-degrees-of-freedom cylindrical structure with uniform mass distribution [13]. The PTMD model consists of a rigid slender rod connected at one end to a metal mass block with a certain mass and at the other end to a three-degrees-of-freedom ball hinge, forming the PTMD model. The PTMD is fixed to the inner surface of the upper wall of the SSXCTD buoyancy carrier model using bolts, forming the computational model, as shown in Figure 4.
The optimal parameters of the aforementioned PTMD computational model can be obtained using Den Hartog’s formula [14,15]:
f = 1 + γ 2 1 + γ
ζ s = 3 γ 8 1 + γ
| u p | H = g 2 f 2 1 + γ g 2 2 + 4 g 2 f 2 ζ s 2 ( 1 + γ ) 2 γ f 2 g 2 g 2 1 g 2 f 2 + 4 g 2 ζ s ζ s f 2 + 4 g 2 ζ s f g 2 + γ g 2 1 + ζ s g 2 f 2 2
For a given PTMD system with a structural damping ratio ζ p , the optimal parameters γ ,     f , and ζ s need to be determined through numerical iteration. Here, we consider the vibration response | u p | H as a function of g. For a specific set of γ and f values, different ζ s values ( ζ s 1 ,   ζ s 2 , ζ s 3 …… ζ s i ) are applied, and the maximum value of the function corresponding to each ζ s value is found.
{ ( | u p | H ) m a x 1 , ( | u p | H ) m a x 2 ( | u p | H ) m a x i }
Next, the minimum value among the obtained function values is identified:
( | u p | H ) m i n 1 = m i n { ( | u p | H ) m a x 1 , ( | u p | H ) m a x 2 ( | u p | H ) m a x i }
For each specific set of γ and f values, the aforementioned data calculation process yields a value ( | u p | H ) m i n i . At this point, we can again identify the minimum value | u p | H from the series of ( | u p | H ) m i n i obtained through numerical iteration. The corresponding γ , f , and ζ s values that lead to this minimum value | u p | H will be the optimal parameters for the PTMD system.
When the excitation frequency remains constant, the system’s natural frequency f and the phase of the amplitude response function ϕ 1 are related as follows:
ϕ 1 = t a n 1 ( 2 ξ 1 f 1 f 2 )
When f = 1 , there is a 90° phase difference between the excitation frequency ξ i and the phase of the amplitude response function ϕ 1 , representing optimal system control. However, this is an idealized result that is challenging to achieve in practical applications. When f 1 , the phase difference between ξ i and ϕ 1 is −180°, and a negative phase difference renders the computed system parameters invalid. Therefore, to obtain the best system parameters in real-world environments, it is essential to begin calculations with f < 1 and approach 1 gradually.
Therefore, in this study, the mass ratio γ was varied at 3%, 4%, 5%, 6%, 7%, and 8%, while the ratio of the PTMD’s natural frequency to the main structure’s natural frequency, denoted as f, was set to 0.98, 0.97, 0.96, 0.95, 0.94, and 0.93. These values were then input into Equation (3) and computed using MATLAB R2022a, with the results shown in Figure 5.
From the left side of the graph, showing the amplitude ratio variation with excitation frequency, it can be observed that, under the same external excitation frequency, when γ is 3%, the main structure exhibits a relatively large amplitude and significant structural vibration. However, when γ is 5%, the main structure’s amplitude ratio is minimized, indicating the most ideal vibration reduction effect of the PTMD. From the right side of the graph, displaying the phase response variation with excitation frequency, it can be seen that when f is 0.96 (corresponding to γ being 5%), the phase response changes most rapidly, indicating that the system exhibits the most sensitive control performance [16].
In conclusion, for a structure with a determined structural damping, the optimal parameters for the PTMD system are as follows: γ = 5 % , f = 0.96 , and ζ s = 10 % .
Because the natural period T of the PTMD system is given by T = 2 π L g , the natural frequency ω s of the PTMD system is given by ω s = 1 2 π g L . Therefore, the formula used to calculate the pendulum length (L) of the PTMD system is:
L = g 4 π 2 ω s 2
Furthermore, since f = ω s ω p , we can express ω s = f · ω p . By substituting the value of ω s in the previous formula, we can calculate the optimal pendulum length (L) of the PTMD system, which is L = 92.3 mm.

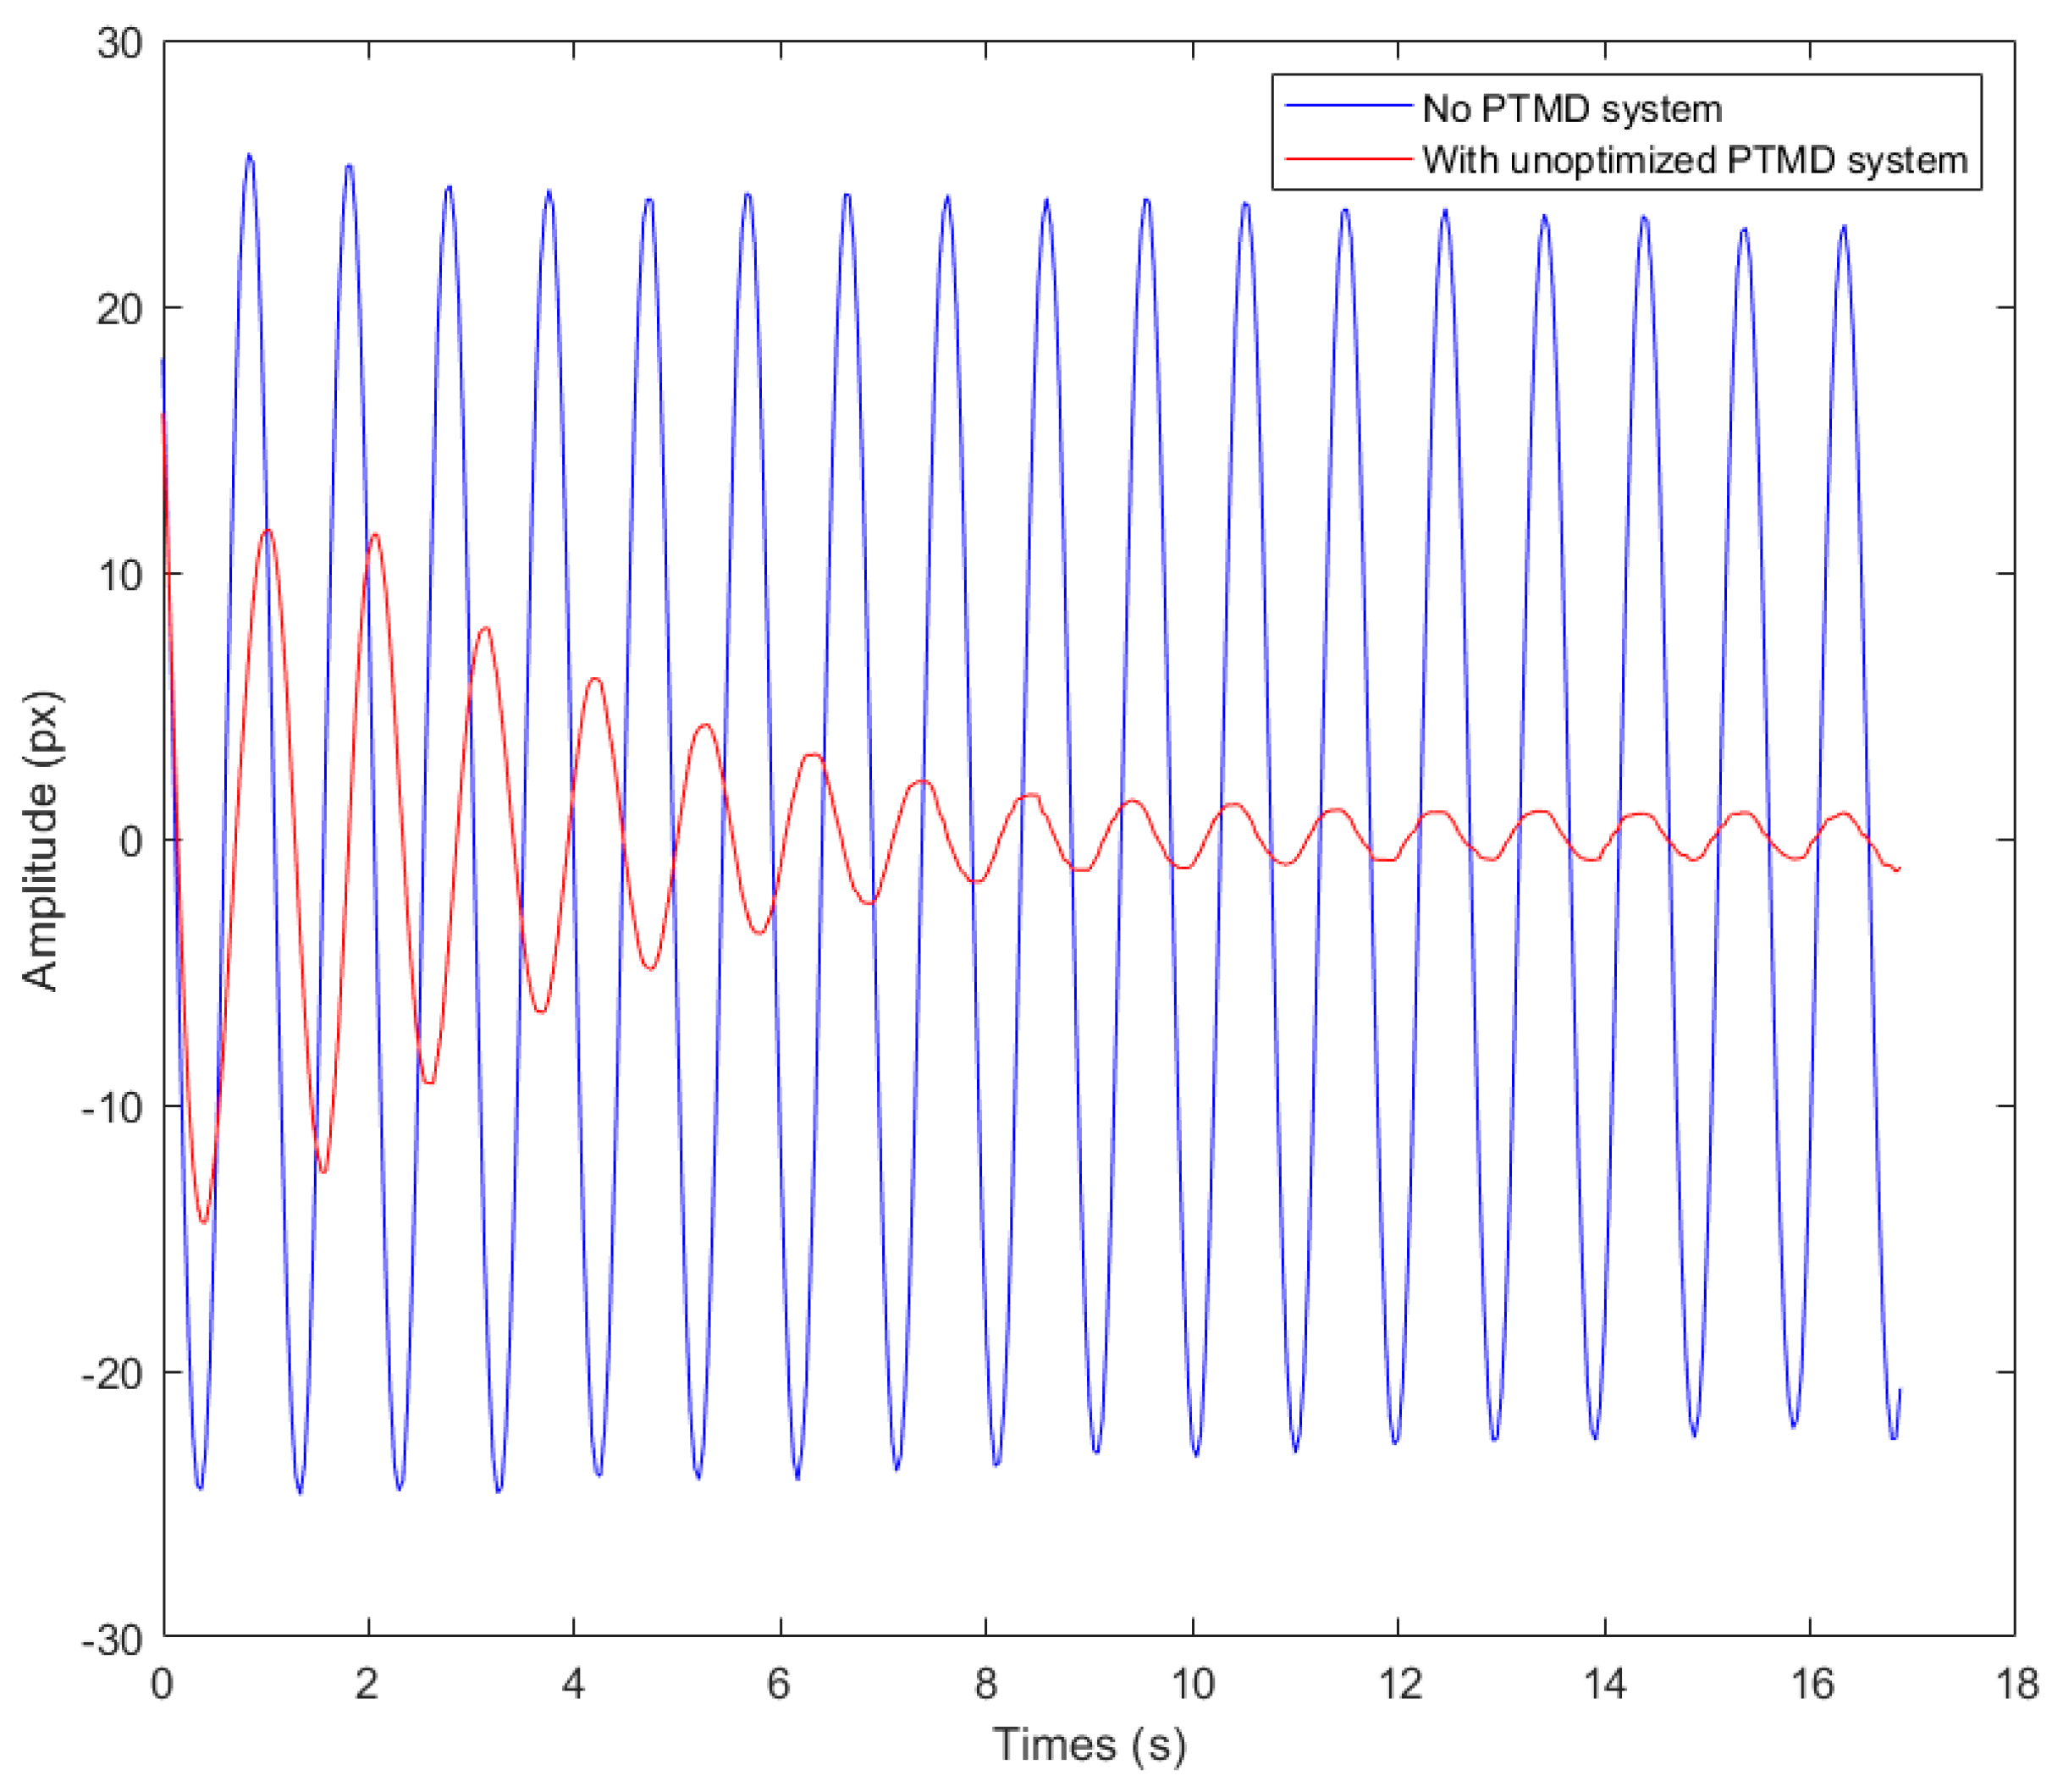
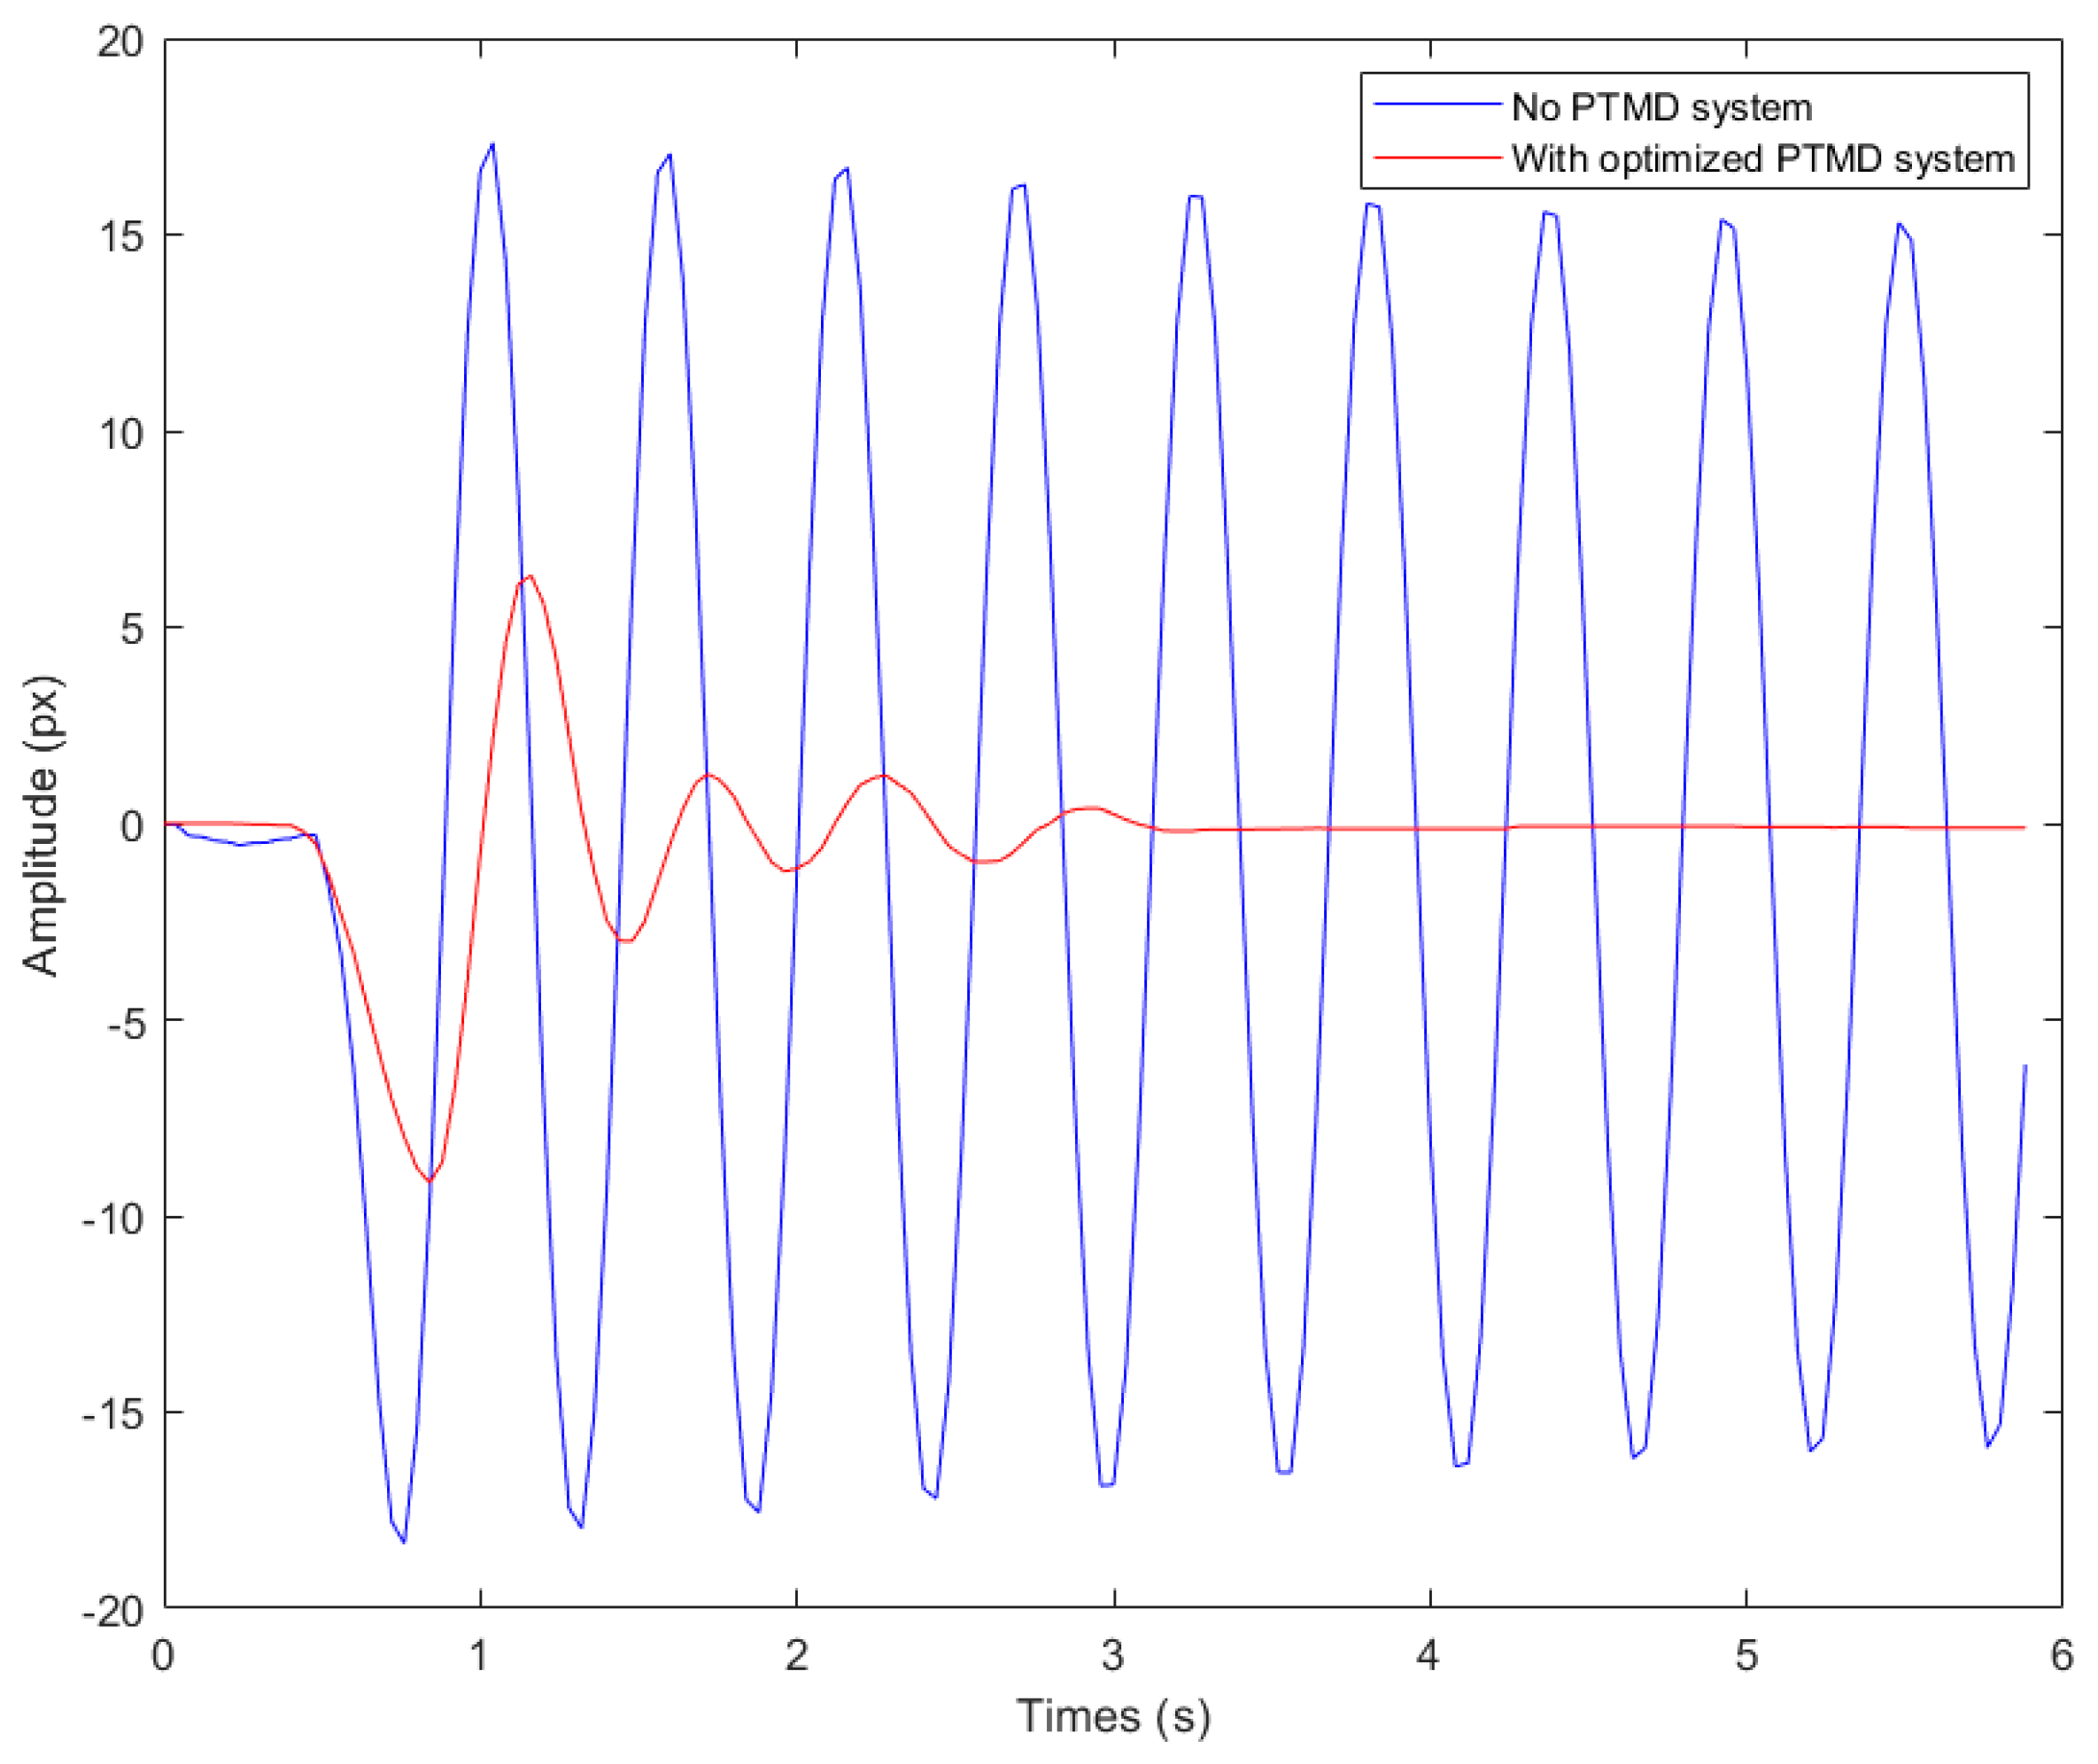
3.3. Analysis of the Computational Results

The optimal mass ratio and pendulum length for the PTMD system have been determined through rigorous analysis and calculations. Subsequently, these optimal parameters were used to enhance and optimize the computational model. The enhanced model was then compared to the original model without the PTMD system (prior to improvement) through numerical simulations performed using MATLAB R2022a [17,18]. Figure 6 illustrates a comparison of the structural amplitude variations over time between the model equipped with the PTMD system before improvement and the model without the PTMD system.
The amplitude curves reveal that the main structure experiences a slow decay in structural amplitude when subjected to external force without the PTMD system, necessitating several tens of seconds to reach a stable and vibration-free state. Conversely, the structure equipped with the PTMD system before optimization exhibits partial suppression of the main structure’s amplitude. Within approximately a dozen seconds, the amplitude significantly decreases. However, despite the decay of the amplitude, a minor residual vibration persists in the main structure. Achieving complete elimination of the main structure’s vibration at this stage demands a relatively extended duration.
Figure 7 illustrates a temporal comparison of structural amplitude variations between the model equipped with the enhanced PTMD system and the model lacking the PTMD system.
The figure above clearly demonstrates the significant enhancement in the speed of the amplitude decay in the main structure achieved by the improved PTMD system. Within seconds, the main structure quickly returns to stability, effectively eliminating the small residual vibrations present in the pre-optimized scenario. The vibration reduction performance shows a substantial improvement.

4. Finite Volume Simulation of SSXCTD Floating Buoy’s Motion and Attitude

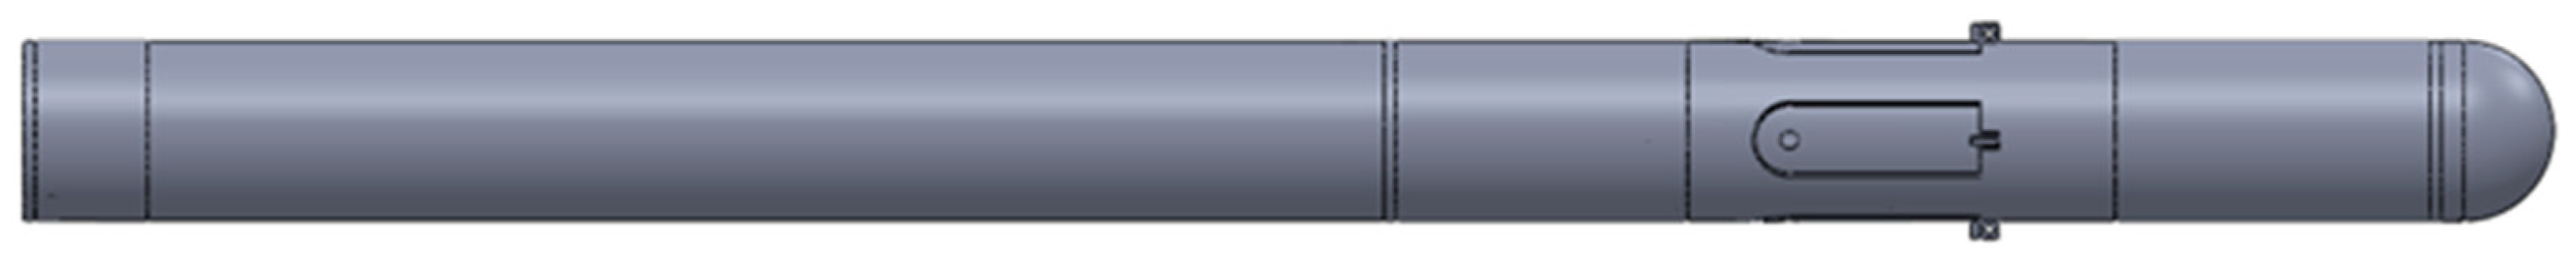
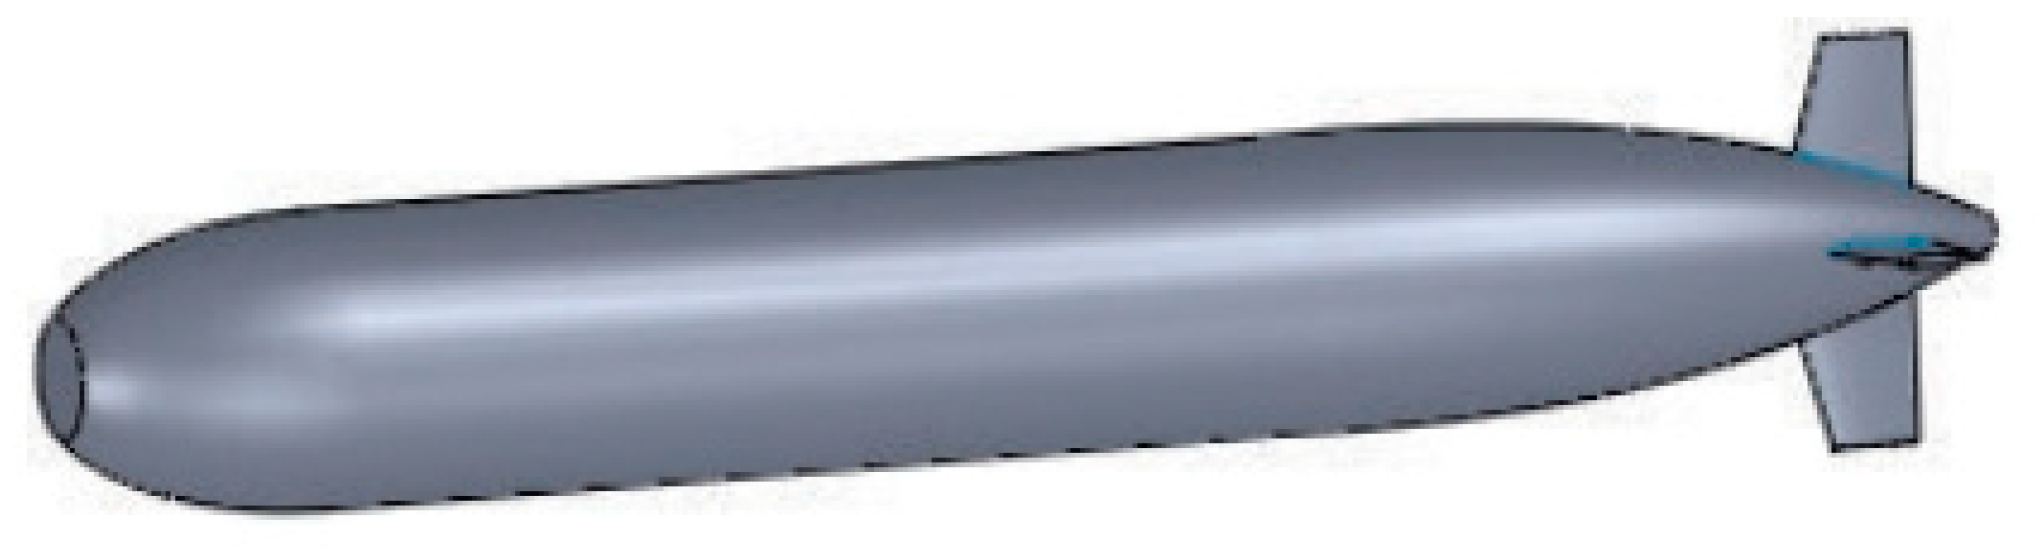
4.1. Introduction to the SSXCTD Model

The SSXCTD floating buoy model, equipped with the pressure-tolerant motion device (PTMD) system, is illustrated in Figure 8. The buoy consists of four sequentially connected sections: the buoyancy-providing (Section 1), the attitude adjustment (Section 4), the near-sea surface attitude stabilization (Section 2), and the probe mounting (Section 5). The buoyancy-providing section and the attitude adjustment section are sealed, ensuring water-tight integrity. In contrast, the near-sea surface attitude stabilization section and the probe mounting section are designed as open structures to maintain the internal and external pressure balance. The buoyancy-providing section is responsible for offering the necessary buoyancy for the buoy to ascend. The probe mounting section is specially designed to securely hold the SSXCTD probe. Inside the attitude adjustment section, the PTMD system is installed to control the buoy’s motion and attitude during its underwater ascent. The near-sea surface attitude stabilization section is equipped with four evenly distributed attitude stabilizing fins (Section 3). These fins conform to the hull and remain locked in place under high-pressure conditions at great water depths. However, as the buoy ascends to shallower, low-pressure environments near the sea surface, these fins automatically open to achieve end-stage deceleration during the upward motion and stabilize the buoy’s attitude at the sea surface.

4.2. Domain and Boundary Condition Settings for Calculation

To analyze the motion attitude of the SSXCTD floating buoy, we focus on two representative motion processes: the initial motion when the buoy leaves the mounting platform and the end-stage motion as it emerges from the water. These processes provide a comprehensive reflection of the buoy’s motion state while optimizing the computational time and resources. In this study, we utilized ANSYS FLUENT 2021 R2’s dynamic mesh technique to conduct dynamic simulations for these two motion processes. The dynamic mesh technique involves dividing the computational domain into background and moving regions, each with an independent mesh. These sub-regions may have overlapping, nesting, or covering relationships. Coupling between the overlapping regions is achieved by interpolating and matching the flow field information at their boundaries [19].
Figure 9 and Figure 10 illustrate the background and moving regions for the two motion processes in this study. Both computational domains have rectangular shapes, measuring 20 m in length, 5 m in width, and 15 m in height. The left side of the background region functions as the velocity inlet, while the right side is designated as the pressure outlet. The velocity inlet is characterized by the field function of static water VOF wave velocity, whereas the pressure outlet is defined using the field function of static water VOF wave static pressure. The volume fractions for the velocity inlet and pressure outlet are determined using a composite field function that involves static water VOF light fluid volume fraction and static water VOF heavy fluid volume fraction.

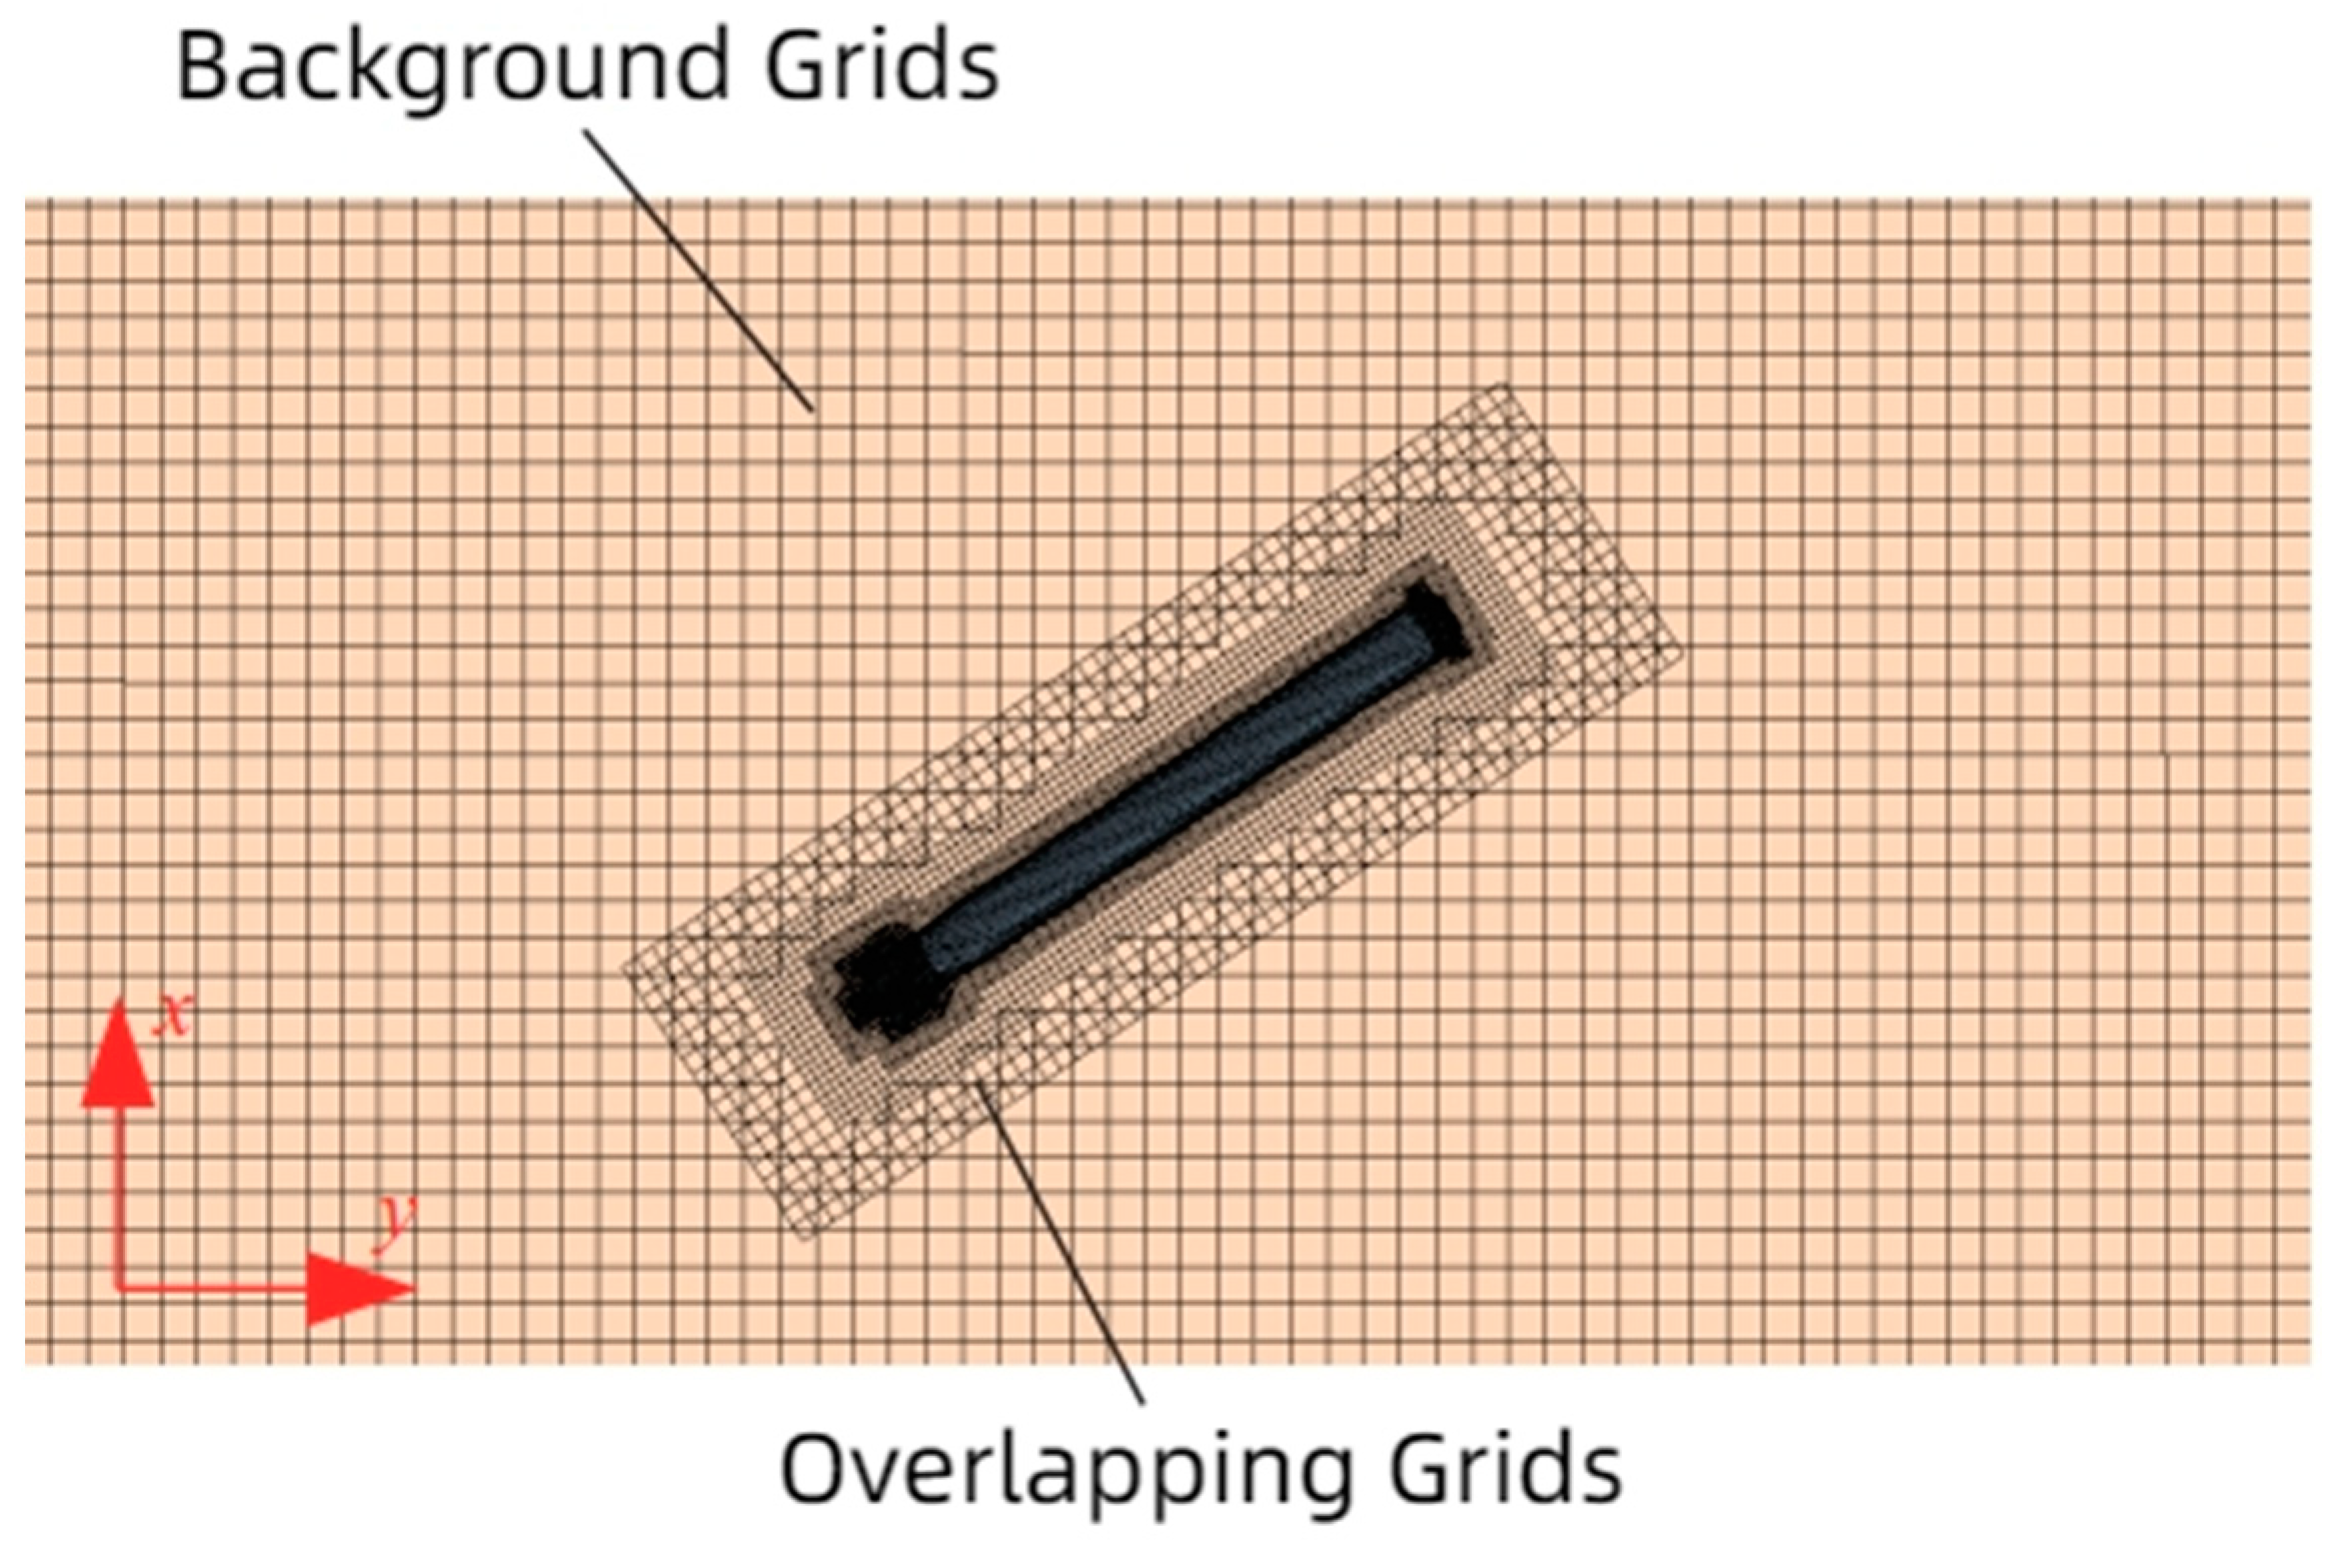
4.3. Computational Domain Meshing

The working depth of the SSXCTD platform is 1 km underwater. Therefore, for the scenario shown in Figure 7, the fluid medium when the SSXCTD buoyancy device leaves the mounting platform is 3 °C seawater, with a density (ρ) of 1030.5 kg/m3, a flow velocity (v) of 2 m/s, and a dynamic viscosity (μ) of 1.01 × 10 3 P a · s . For the scenario shown in Figure 8, the fluid medium when the SSXCTD buoyancy device is about to emerge from the water is 15 °C seawater, with a density (ρ) of 1025.91 k g / m 3 , a flow velocity (v) of 3 m/s, and a dynamic viscosity (μ) of 1.005 × 10 3 P a · s [20]. The k-ε model is adopted for turbulence modeling, with the wall function set as ∆y^+ = 20 [21]. The first layer’s thickness of the prism layer on the surface of the buoyancy device is 4.344 × 10⁻⁴ mm, the total thickness of the prism layer is 9.467 mm, and the expansion factor is 2.8946. The surface mesh’s maximum size is 0.1 mm, and a tetrahedral mesh is used to partition the background and moving regions, as shown in Figure 11 and Figure 12, respectively.

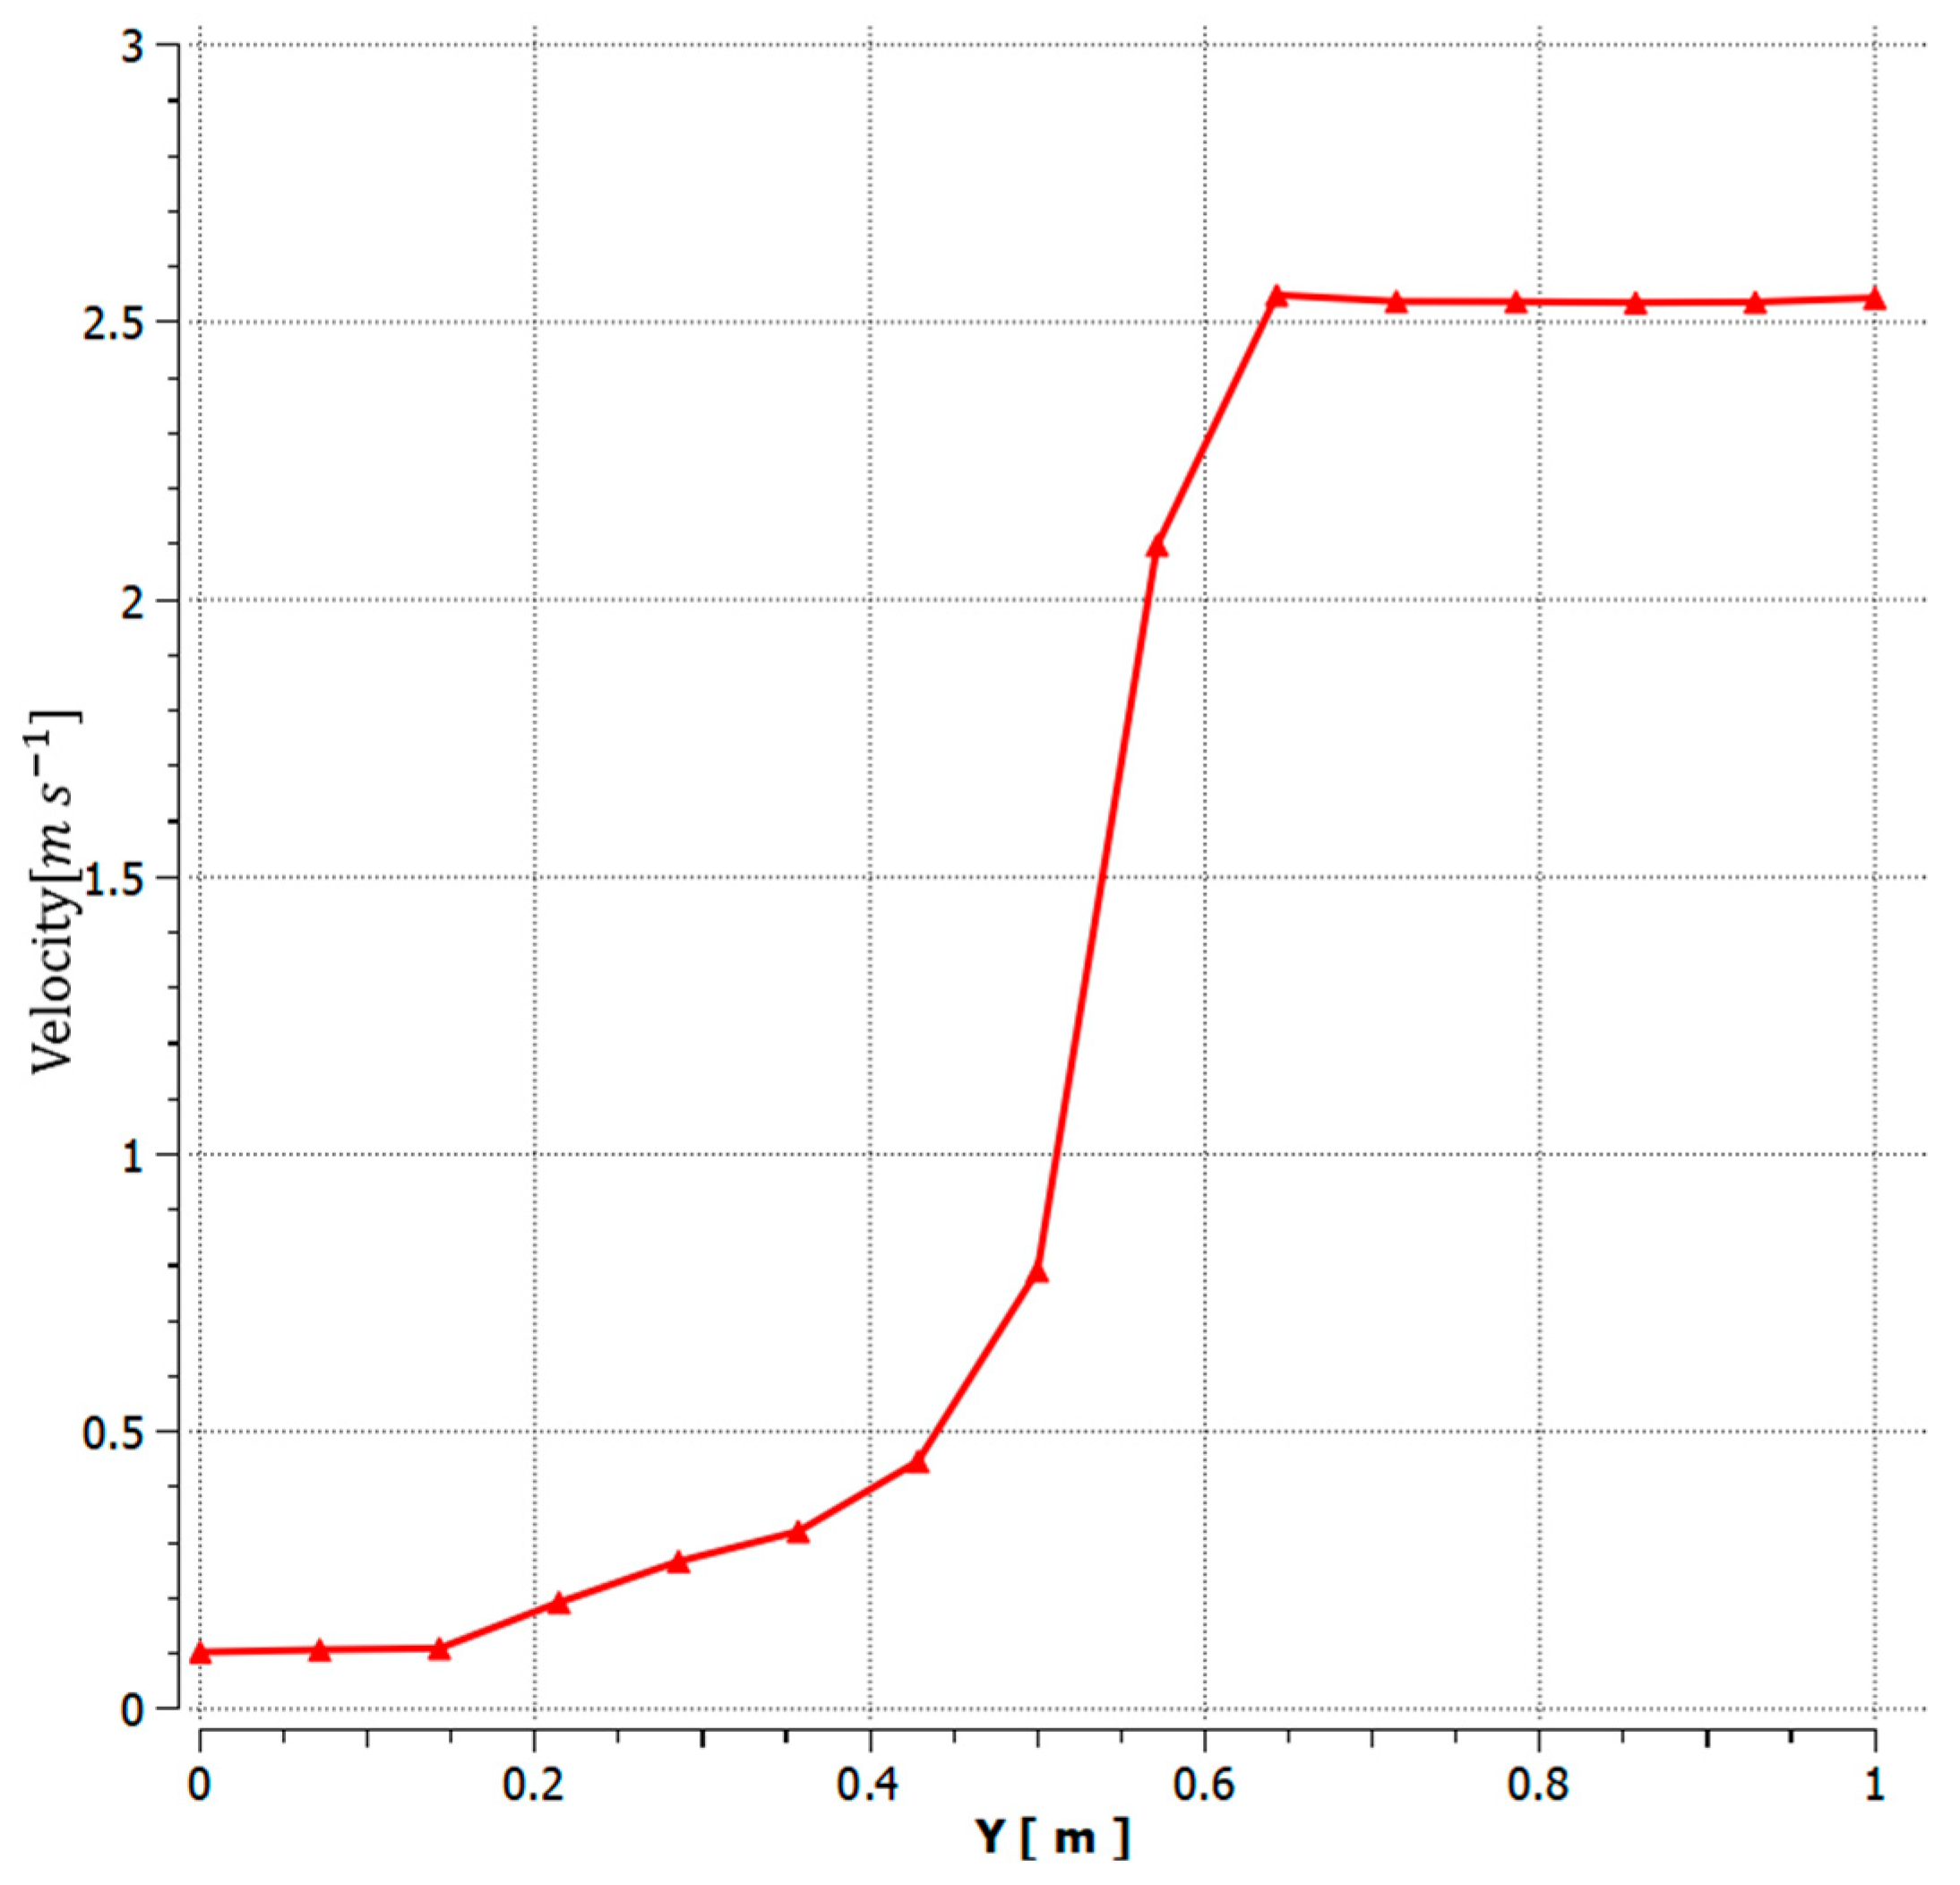
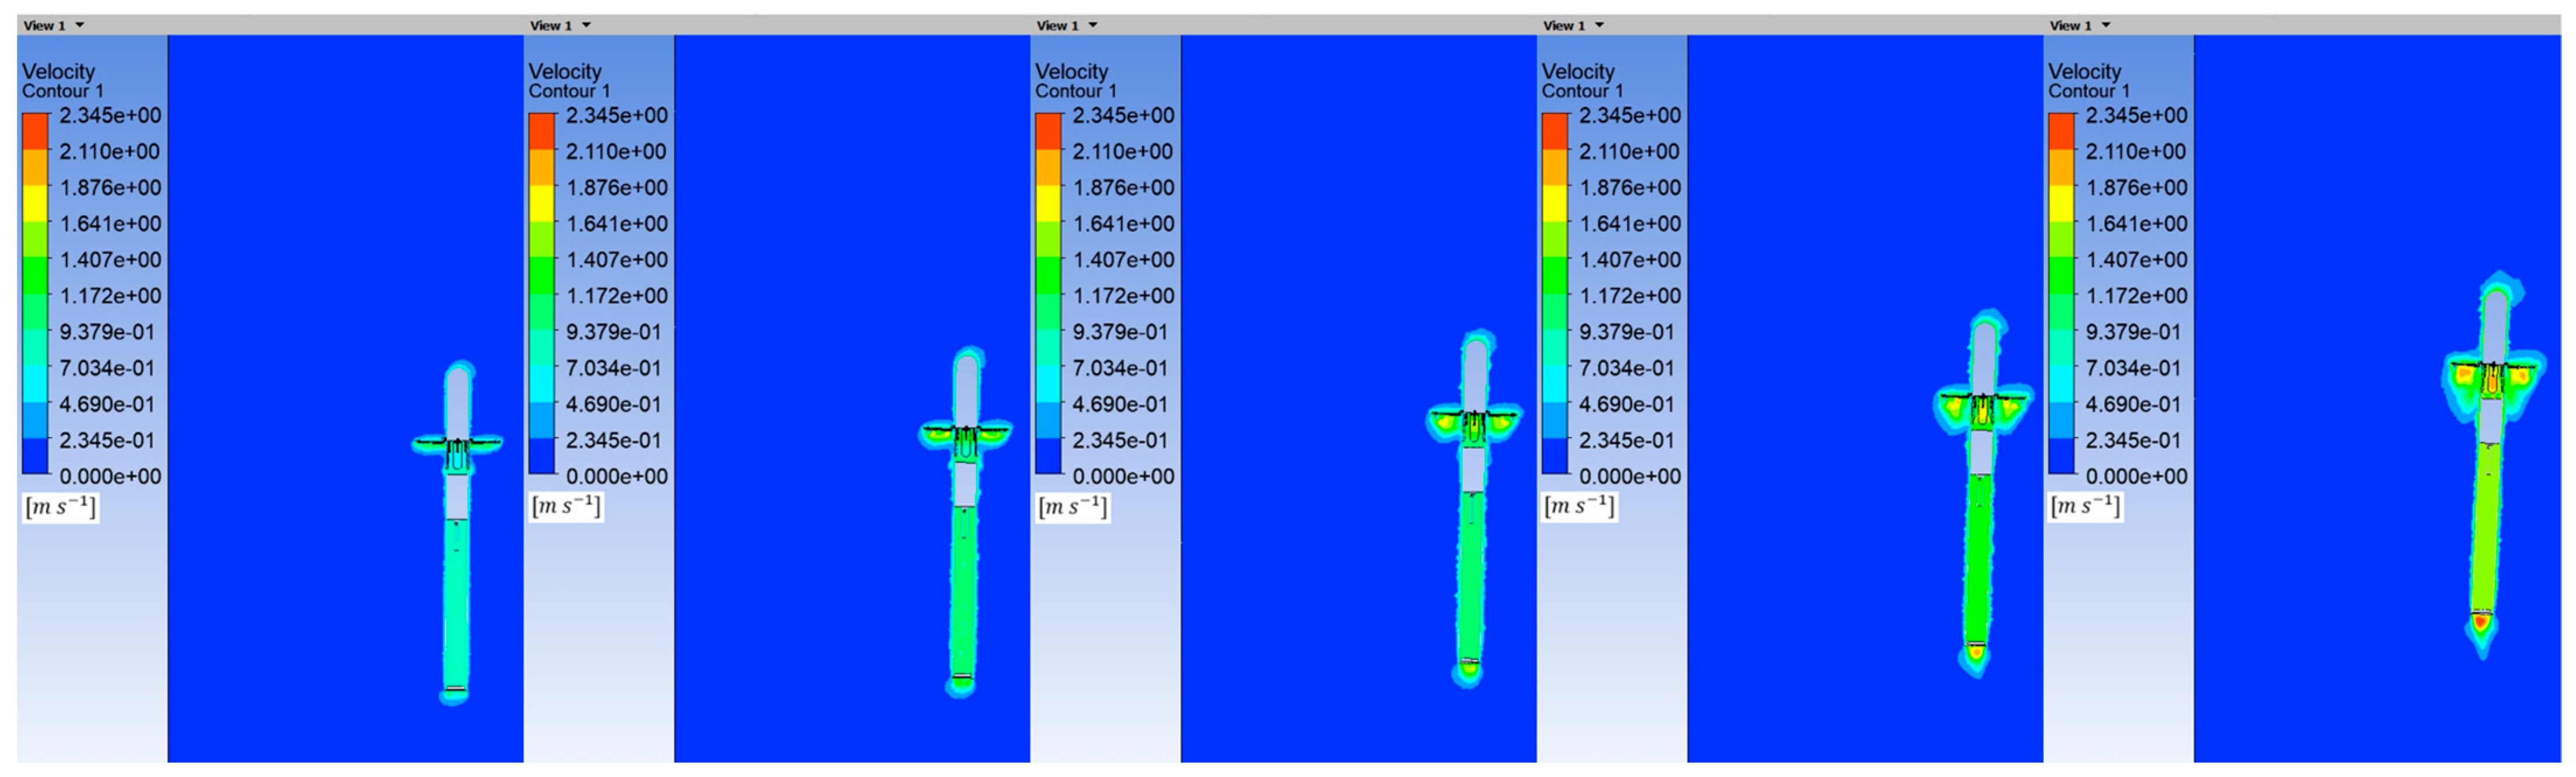
4.4. Numerical Simulation Results

To enhance the accuracy of the simulation results for the two mentioned processes, this study utilizes a finite volume simulation time step of 0.0001 s and a total of 20,000 time steps. These settings allow for thorough finite volume simulation analyses and calculations, enabling a detailed study of the motion states of the floating platform at two different time points.
Figure 13 illustrates the instantaneous velocity variation cloud chart of the SSXCTD floating platform immediately after separating from the loading platform. The total duration of the floating platform’s motion is 2 s, and there is a time interval of 0.5 s between two adjacent positions on the graph. From the figure, it is evident that the overall velocity of the floating platform is approximately 2.5 m/s at 2 s. Within 2 s of leaving the loading platform, the platform maintains a stable motion without any loss of stability, ascending with a relatively stable posture.
Figure 14 illustrates the displacement–velocity curve of the floating platform at the initial moment of upwelling. The horizontal axis represents the displacement of the floating platform, while the vertical axis represents its velocity. From the graph, it is evident that after the floating platform separates from the loading platform, it starts to ascend due to its own buoyancy, and the upwelling velocity gradually increases. As the upwelling displacement reaches approximately 0.7 m, the velocity stabilizes at 2.51 m/s. The curve demonstrates that after attaining a stable velocity, the floating platform maintains a smooth upward posture without any vibration, aligning with the results shown in the velocity cloud chart at the initial moment of upwelling in Figure 13.
Figure 15 displays the velocity cloud chart of the SSXCTD floating platform as it approaches the water surface, specifically during the 2 s interval after the previously mentioned attitude stabilizing fins have opened. The graph clearly indicates that, at the moment the fins open, the velocity of the floating platform notably decreases. However, it continues to ascend under the influence of its own buoyancy. Furthermore, during the final moments of the upwelling process, the floating platform maintains its stable motion and continues to rise steadily until it reaches the water surface.
Figure 16 illustrates the displacement–velocity curve of the floating platform at the moment when the stabilizing fins open during the final phase of upwelling. From the graph, it is evident that at the instant when the stabilizing fins open, the upwelling velocity of the floating platform rapidly decreases. Subsequently, it continues to ascend at a stable speed of 1.48 m/s. Once the velocity stabilizes, the floating platform maintains a steady upward posture without any signs of instability, and the upwelling speed remains relatively constant until it reaches the water surface. The results depicted in this curve are consistent with the velocity cloud chart shown in Figure 15.
From the above simulation results, it can be seen that during both the initial and the end moment of the floating of the float carrier, the floating motion attitude of the float carrier is kept stable and there is no loss of stability. It can also be seen from Figure 15 and Figure 16 that the attitude stabilizing airfoils have an obvious effect in slowing down the deceleration of the float carrier at the end of the floating moment and stabilizing the attitude. Therefore, from the results of the simulation calculations, it can be concluded that the PTMD has a remarkable effect on the stabilization of the motion attitude in the floating process of the float carrier.

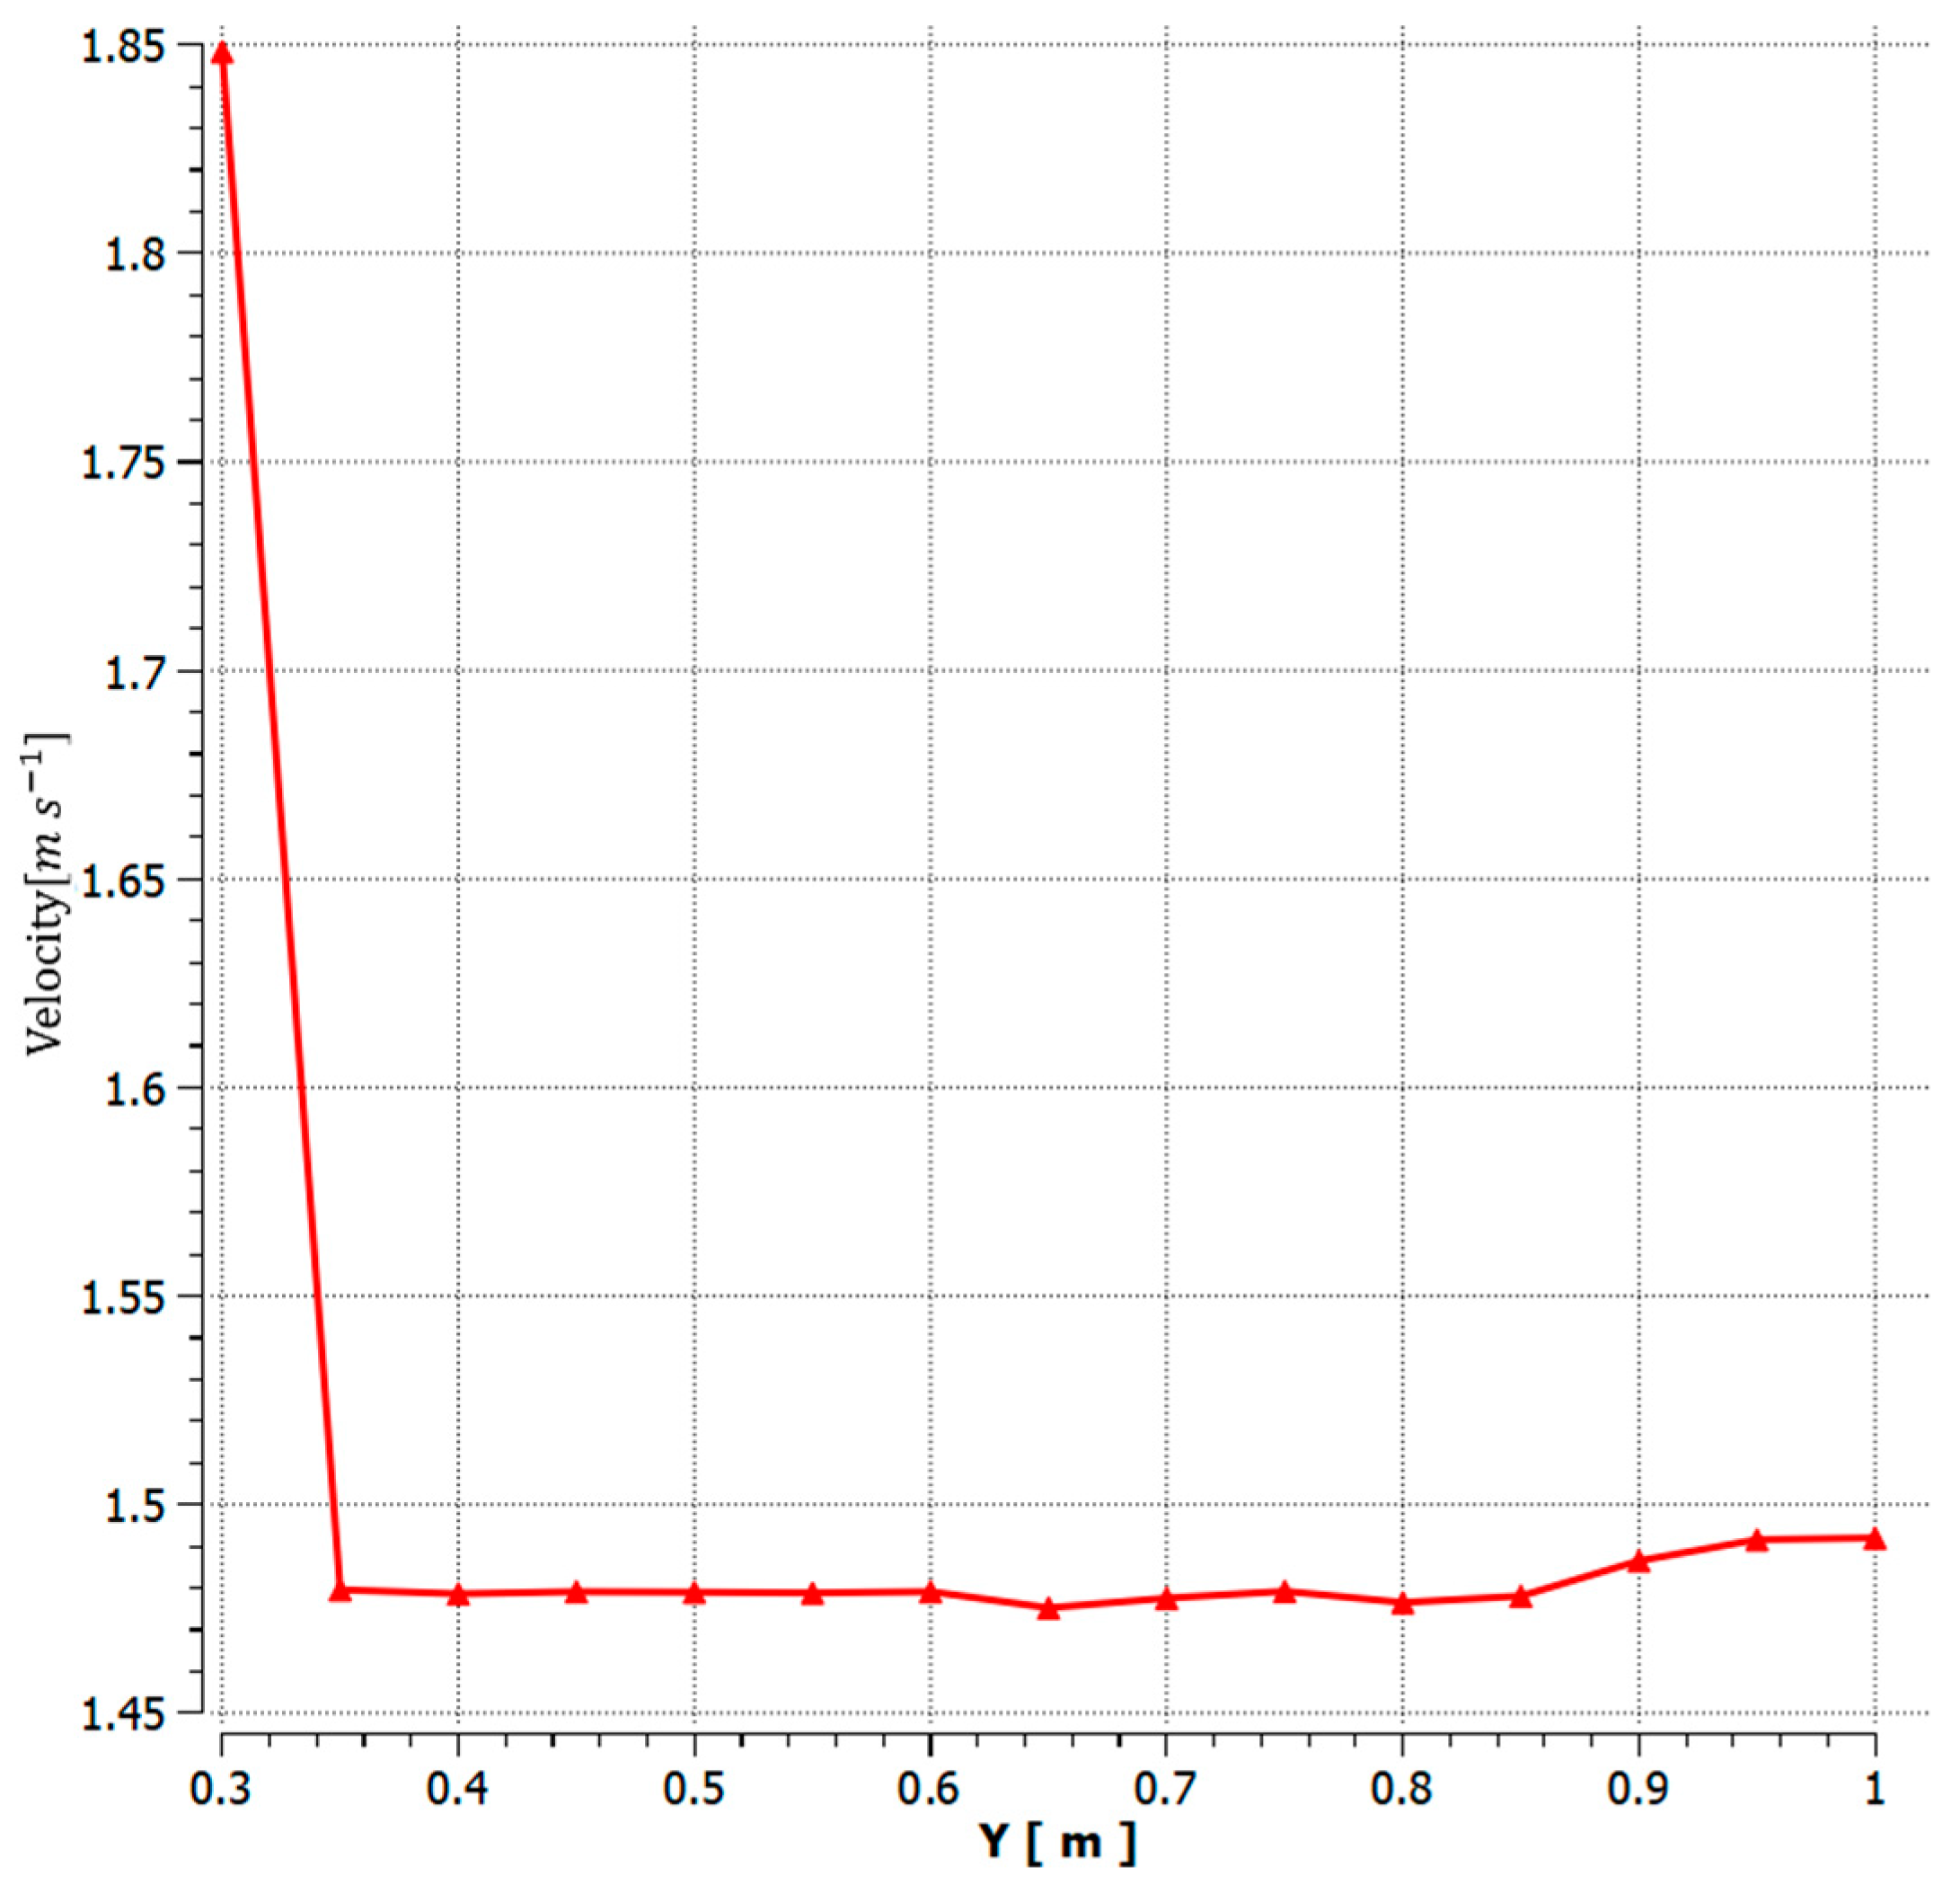
4.5. Comparison of Numerical Simulation Results

The obtained numerical simulation results in this paper are compared with the underwater non-propulsive carrier design proposed by Zhang Haiyang et al. [22] from the National Key Laboratory of Robotics at the Shenyang Institute of Automation, Chinese Academy of Sciences, which was not equipped with a PTMD and attitude-stabilizing fins. Figure 17 depicts the structural rendering of the underwater non-propulsive carrier designed by Zhang Haiyang et al. [22].
Utilizing the overlapping grid technique in STAR-CCM+, dynamic simulations were conducted for the buoyant ascent process of the carrier. The simulated fluid medium maintained a temperature (T) of 15 °C, a density (ρ) of 1025.91 kg/m3, a velocity (v) of 3 m/s, and a dynamic viscosity (μ) of 1.005 × 10⁻³ Pa·s, representing seawater. The turbulence model employed for simulation was the k-ε model with a wall spacing parameter y + of 20. Figure 18 illustrates the initial motion attitude of the non-propulsive underwater carrier without a PTMD, while Figure 19 portrays the motion attitude of the non-propulsive underwater carrier without a PTMD at a specific moment during its ascent process.
From Figure 18 and Figure 19, it is evident that the carrier without a PTMD exhibited significant angular deviations in its motion attitude during the buoyant ascent process, leading to severe instability. Conversely, as indicated in Figure 13, Figure 14, Figure 15 and Figure 16, the carrier equipped with a PTMD demonstrated a considerable improvement in attitude stability during the ascent process.

5. Conclusions

At present, the research on and applications of pressure-tuned mass damper (PTMD) systems in the field of marine detection instruments and equipment are limited. Therefore, exploring the application and research of PTMD systems in non-traditional areas presents significant potential for development. This study primarily aimed to establish computational models, conduct theoretical analyses, and perform numerical simulations to investigate the application of PTMD systems in the design and study of attitude stability control for a SSXCTD floating platform.
Firstly, we established a kinematic model for the SSXCTD float carrier, enabling an analysis to identify the factors influencing the carrier’s motion and attitude stability. Subsequently, we proposed a novel approach and design concept for a miniaturized pendulum-tuned mass damper which demonstrated excellent performance and applicability in mitigating flow-induced vibrations in the SSXCTD float carrier.
Secondly, we adopted a combined approach, utilizing MATLAB and ANSYS FLUENT, to conduct simulations and comparative analyses of the investigated pendulum-tuned mass damper’s control effectiveness concerning float carrier flow-induced vibrations. This approach surpassed traditional finite element analysis methods, offering heightened computational accuracy and efficiency. Moreover, the visual representation of the results enabled a more precise simulation of the system’s effectiveness.
Through the theoretical analysis, calculations, and numerical simulations conducted in this study, the following conclusions can be drawn:
(1) For an axially symmetric cylindrical object subjected to a unidirectional force in a flow field, its motion can be described as six-degrees-of-freedom motion. When it moves in directions other than the direction of the applied force, applying an additional moment in that direction can counteract the motion deviation and enhance its motion stability.
(2) The PTMD system can provide additional mass and an additional moment to the main structure during its motion. Based on the structural damping ratio of the SSXCTD floating device, the optimal parameters of the PTMD system were calculated using the Den Hartog formula as follows: the mass ratio between the mass block and the main structure, γ , is 5%; the ratio of natural frequencies, f , is 0.97; the damping ratio, ζ s , is 10%; and the optimal pendulum length, L, is 92.3 mm.
(3) The numerical simulation and finite volume analysis results demonstrate that the PTMD system exhibits excellent performance in controlling the flow-induced vibrations of the SSXCTD floating device, which is of significant importance in improving the accuracy and stability of measurements during operation.
In conclusion, this study provides an effective solution by applying the PTMD and other structural vibration reduction systems in marine instruments such as SSXCTD, effectively addressing the issue of flow-induced vibrations in ocean measurement equipment. The research presented in this paper has valuable implications for the design and optimization of other marine measurement instruments that may encounter similar vibration challenges.

6. Patents

The content studied in this paper has been awarded a certificate of invention patent by the People’s Republic of China.
Name of the invention: A self-correcting attitude-correcting underwater unpowered float carrier, method of use.
Inventors: Jie Liu, Yongchao Cui, Libin Du, Zezheng Liu, and Haijing He.
Patent number: ZL 2022 1 1401584.4

Author Contributions

Conceptualization, L.D.; methodology, J.L.; software, Y.C.; validation, J.L. and Y.M.; formal analysis, Z.L.; investigation, Y.M.; resources, Y.C. and Y.M.; data curation, Y.C.; writing—original draft preparation, Y.C.; writing—review and editing, J.L. and Y.M.; visualization, Y.C.; supervision, L.D.; project administration, L.D. All authors have read and agreed to the published version of the manuscript.

Funding

This research received no external funding.

Institutional Review Board Statement

Not applicable.

Informed Consent Statement

Not applicable.

Data Availability Statement

The data that support the findings of this study are openly available in Baidu Netdisk at https://pan.baidu.com/s/1_wZZj1JlBOSZPQWLlK7qqw?pwd=7777 (29 August 2023).

Conflicts of Interest

The authors declare no conflict of interest. The funders had no role in the design of the study; in the collection, analyses, or interpretation of data; in the writing of the manuscript; or in the decision to publish the results.

References

  1. Shi, X.; Su, Q. Development status of expendable ocean instruments and equipment. Acoust. Electron. Eng. 2015, 4, 46–48. [Google Scholar]
  2. Chen, W.; Zhang, L.; Sun, X.; Duan, J. Overview of the application and development of expendable ocean temperature-depth profiler. J. Oceanogr. 2020, 44, 114–122. [Google Scholar]
  3. Hu, Y.; Xu, J.; Cheng, C.; Zhou, H.; Cai, X. Passive vibration control of floating offshore wind turbine based on electromechanical inertial capacitance. J. Mech. Eng. 2023, 59, 202–211. [Google Scholar]
  4. Tan, J.; Ho, S.C.M.; Zhang, P.; Jiang, J. Experimental Study on Vibration Control of Suspended Piping System by SingleSided Pounding Tuned Mass Damper. Appl. Sci. 2019, 9, 285. [Google Scholar] [CrossRef]
  5. Guan, X.; Guo, H.; Wang, H.; Wang, Z. Parameter optimization of TMD based on genetic algorithm. J. Xi’an Univ. Archit. Technol. (Nat. Sci. Ed.) 2023, 55, 211–216. [Google Scholar] [CrossRef]
  6. Xia, H. Collision Damping and Vibration Reduction Control of Offshore Wind Turbine under Combined Wind and Wave Action. Master’s Thesis, Wuhan University of Technology, Wuhan, China, 2020. [Google Scholar] [CrossRef]
  7. Lockheed Martin. Submarine-Launched Expendable Profiling System; Lockheed Martin: Washington, DC, USA, 2003. [Google Scholar]
  8. Geng, B.; Xu, Z.; Pei, Y. Underwater motion modeling and simulation of unmanned carriers. Comput. Simul. 2017, 34, 6–9+67. [Google Scholar]
  9. Wang, C.; Shi, W. Optimal Design and Application of a Multiple Tuned Mass Damper System for an In-Service Footbridge. Sustainability 2019, 11, 2801. [Google Scholar] [CrossRef]
  10. Rong, J. Study on the attitude motion stability of unmanned carriers. Adv. Hydrodyn. (Ser. A) 1998, 1, 88–94. [Google Scholar]
  11. Ouyang, L. Design and Analysis of Tuned Mass Damper. Ph.D. Thesis, Huazhong University of Science and Technology, Wuhan, China, 2017. [Google Scholar]
  12. Li, H. Structural Vibration Control Research Based on Strong Magnetic Array Tuned Mass Damper. Ph.D. Thesis, Dalian University of Technology, Dalian, China, 2022. [Google Scholar] [CrossRef]
  13. Cai, Q.; Zhang, Y.; Wang, Y.; Zhang, P. Ballistic characterisation of uplift of large depth unpowered vehicle. Comput. Simul. 2012, 29, 38–41+50. [Google Scholar]
  14. Den Hartog, J.P. Mechanical Vibrations, 4th ed.; McGraw Hill: New York, NY, USA, 1956. [Google Scholar]
  15. Liu, X.; Shi, W.; Chen, X. Introduction to pendulum-type TMD and analysis of its vibration reduction performance. Struct. Eng. 2012, 28, 66–71. [Google Scholar] [CrossRef]
  16. Liu, L.; Tan, P.; Li, X.; Zhang, Y.; Zhou, F. Analysis of phase and control effect of TMD control system. J. Vib. Shock 2015, 34, 160–165. [Google Scholar] [CrossRef]
  17. Shi, W.; Wang, L.; Yan, J.; Shan, J. Research on the vibration reduction performance of an improved self-tuning pendulum-type TMD. J. Huazhong Univ. Sci. Technol. (Nat. Sci. Ed.) 2018, 46, 40–45. [Google Scholar] [CrossRef]
  18. Zhang, Z.; Zhai, J.; Zhang, X. Water trajectory simulation of unmanned carriers based on Simulink. Silicon Val. 2011, 22, 20–21+50. [Google Scholar]
  19. Zhang, H.; Gu, H.; Lin, Y.; Gao, H.; Feng, M. Analysis of inclined climbing up-floating characteristics of unmanned carriers. Chin. Ship Res. 2020, 15, 38–47. [Google Scholar] [CrossRef]
  20. Yuan, H.; Guan, Q.; Zhang, T. South Pacific ocean current speed prediction based on LSTM-BP combined model. Bull. Oceanogr. Limnol. 2022, 44, 10–16. [Google Scholar] [CrossRef]
  21. Wang, K.; Li, F.; Yang, X. Estimation of sea current velocity using ocean environmental noise. Appl. Acoust. 2022, 41, 263–269. [Google Scholar]
  22. Zhang, H. Research on Hydrodynamic Characteristics of Deep-Sea Vehicle without Power Uplift. Master’s Thesis, Northeastern University, Xi’an, China, 2020. [Google Scholar] [CrossRef]
Figure 1. Lockheed Martin SSXBT principle prototype, USA.
Jmse 11 01963 g001
Figure 2. Rendering of self-developed SSXCTD float carrier.
Jmse 11 01963 g002
Figure 3. SSXCTD float carrier model coordinate system.
Jmse 11 01963 g003
Figure 4. Computational model of a pontoon carrier equipped with PTMD.
Jmse 11 01963 g004
Figure 5. Amplitude and phase of response function versus excitation frequency for different mass ratios and their corresponding self-oscillation frequency ratios.
Jmse 11 01963 g005
Figure 6. Comparison of the structural amplitude attenuation before optimization.
Jmse 11 01963 g006
Figure 7. Comparison of amplitude attenuation of optimized structure.
Jmse 11 01963 g007
Figure 8. SSXCTD float carrier model.
Jmse 11 01963 g008
Figure 9. Calculation domain of the initial moment of the surfacing of SSXCTD float carriers.
Jmse 11 01963 g009
Figure 10. Calculation domain of the SSXCTD float carrier at the end moment of surfacing.
Jmse 11 01963 g010
Figure 11. Gridding of the computational domain at the initial moment of the SSXCTD float carrier surfacing.
Jmse 11 01963 g011
Figure 12. Gridding of the computational domain at the end moment of the SSXCTD float carrier surfacing.
Jmse 11 01963 g012
Figure 13. Velocity cloud at the initial moment of the surfacing of the SSXCTD float carrier.
Jmse 11 01963 g013
Figure 14. Displacement–velocity curve at the initial moment of float carrier surfacing.
Jmse 11 01963 g014
Figure 15. Velocity cloud at the end moment of float carrier surfacing.
Jmse 11 01963 g015
Figure 16. Displacement–velocity curve after the opening of stabilizing flaps at the final moment of floatation of the float carrier.
Jmse 11 01963 g016
Figure 17. Structural rendering of the underwater non-propulsive carrier without a PTMD.
Jmse 11 01963 g017
Figure 18. A motion attitude diagram of the underwater non-propulsive carrier without a PTMD at the initial moment of its buoyant ascent.
Jmse 11 01963 g018
Figure 19. A motion attitude diagram of the underwater non-propulsive carrier without a PTMD at a specific moment during its buoyant ascent process.
Jmse 11 01963 g019
Disclaimer/Publisher’s Note: The statements, opinions and data contained in all publications are solely those of the individual author(s) and contributor(s) and not of MDPI and/or the editor(s). MDPI and/or the editor(s) disclaim responsibility for any injury to people or property resulting from any ideas, methods, instructions or products referred to in the content.

