Article

Flow Field Pattern and Hydrodynamic Characteristics of a Grid Device Made with Various Grid Bar Spacings at Different Inclination Angles

1
College of Marine Sciences, Shanghai Ocean University, Shanghai 201306, China
2
National Engineering Research Center for Oceanic Fisheries, Shanghai 201306, China
3
Key Laboratory of Oceanic Fisheries Exploration, Ministry of Agriculture and Rural Affairs, Shanghai 201306, China
4
The Key Laboratory of Sustainable Exploitation of Oceanic Fisheries Resources, Shanghai Ocean University, Ministry of Education, Shanghai 201306, China
5
Scientific Observing and Experimental Station of Oceanic Fishery Resources, Ministry of Agriculture and Rural Affairs, Shanghai 201306, China
6
South China Sea Marine Survey Center, Ministry of Natural Resources, Guangzhou 510310, China
7
Faculty of Marine Science, Tokyo University of Marine Science and Technology, Minato, Tokyo 108-8477, Japan
*
Authors to whom correspondence should be addressed.
J. Mar. Sci. Eng. 2023, 11(10), 1966; https://doi.org/10.3390/jmse11101966
Submission received: 31 August 2023 / Revised: 28 September 2023 / Accepted: 9 October 2023 / Published: 11 October 2023

Abstract

:
The grid is a crucial component in constructing grid-type bycatch reduction devices. The grid’s structural characteristics and orientation significantly impact the hydrodynamic characteristics and efficacy of the separation device. Therefore, it is essential to thoroughly understand the grid device’s hydrodynamic characteristics and flow field to optimize its structure. Thus, this study used CFD numerical simulation and flume tank experiments to investigate the effects of inclination grid angles and grid bar spacing on hydrodynamic forces and flow fields around a circular grid. The results indicated that the hydrodynamic forces acting on the circular grid increased with higher flow velocity and inclination grid angle, decreasing with smaller grid bar spacing. Flow velocity acceleration zones were observed at the upper and lower ends of the grid and between the grid bars. Additionally, upwelling and vortices were present at the back of the grid. It was found that an increase in the inclination grid angle accelerated the vortex and wake effects.

1. Introduction

Since the 1960s, global fishing resources have witnessed a steady decline. This concerning trend has significantly elevated the focus on addressing issues related to bycatch and the discarding of non-targeted species within the realms of fishery research, technology, and management [1]. Consequently, numerous countries and fisheries organizations have mandated alterations to trawl codend structures and implemented bycatch reduction devices (BRDs) to enhance gear selectivity and curtail bycatch. This has resulted in the innovation of diverse specialized tools tailored to distinct trawl fisheries [2]. While mesh size and configuration modifications offer a viable avenue to enhance gear selectivity, this approach has drawbacks. Certain safeguarded non-target species, such as turtles, sharks, seals, and other large marine animals, continue to be inadvertently captured by trawling operations [3]. Selective devices like BRDs can be broadly classified based on their target species and structural design parameters. These encompass separator panels, grids, fisheyes, and other adaptations. Within this spectrum of alternatives, the grid-type bycatch reduction device has emerged as a particularly prevalent solution within trawl fisheries. This innovation facilitates the escape of undesired and juvenile fish, segregates non-target species, and augments overall catch quality. In this context, the straightforward design, consistent performance, and elevated separation efficiency of BRDs render them indispensable tools for species selection and bycatch mitigation [4].
The grid-type bycatch reduction device (BRD) is meticulously engineered to accommodate the target species’ distinct size and behavioral variations. This device typically comprises a flat filter structure adorned with obliquely positioned grid bars in front of the codend and frame. In conjunction, escape apertures, covering nets, and guiding funnels are intricately integrated to facilitate the seamless separation, diminution, and release of bycatch specimens [5]. The judicious installation and construction of the grid wield a substantial influence over the trawl’s selectivity performance. Amid these considerations, grid bar spacing emerges as the paramount determinant affecting separation efficacy. Oversized grid bar spacings could result in elevated bycatch passage, yielding suboptimal selection outcomes. Conversely, minimal grid bar spacing might engender obstructions from other entities during bottom trawling endeavors, potentially leading to the inadvertent loss of target catches [6,7].
The efficacy of catch separation through the implementing a BRD during practical applications is contingent upon factors including the inclination grid angle, grid bar spacing, and other relevant aspects [8]. Substantial strides have been achieved in refining the selectivity of trawl nets by modulating the design parameters of both the codend and BRD structures [3]. Grimaldo et al. [9,10] conducted a flume tank test to juxtapose the hydrodynamic attributes of various grid materials. Their investigation revealed that, at towing speeds ranging between 1.25 and 1.5 m/s, the flow intensity of water amid a rigid grid registered 1.0–1.25 m/s, accompanied by a characteristic area coefficient spanning 0.64–0.65. Drawing from these findings, they devised a Como’s grid composed of glass fiber and polyamide. This innovation boasted merits such as reduced weight, minimal deformation, robust flow resistance, and comparable selectivity to High-Density Polyethylene(HDPE) grids, yet demonstrated superior hydrodynamic performance [9,11]. Following Grimaldo’s theoretical underpinnings, a decrease in the area coefficient of the grid coincides with an elevation in water flow velocity transversing it, augmenting the likelihood of catches entering the codend. Experimental models vividly illustrated the water flow patterns both before and post-grid traversal. The obstruction created by the grid induced upwelling ahead of its structure. Furthermore, a smaller upstream surface area of the grid is observed as the inclination grid angle decreases, resulting in diminished upward force exerted on the water flow [12,13]. Veiga-Malta et al. [14] conducted model assessments to scrutinize the ramifications of inclination grid angles on hydrodynamic performance within the BRD. Their investigations revealed a downstream attenuation in flow velocity as inclination grid angles decreased. Similarly, Zhang et al. [15] identified grid bar spacing as a pivotal determinant impacting selection outcome, elucidating its pivotal role through their comprehensive evaluation of grid performance during actual operations.
Extensive research endeavors have been dedicated to scrutinizing the hydrodynamic performance of grids, primarily through the conduit of flume tank testing. This methodology is favored due to the intricate nature of operational complexities and the inherent challenges associated with conducting direct measurements at sea. Riedel et al. [16] harnessed flume tank testing to delve into the separation efficiency of the Nordmøre grid system for both fish and shrimp within girder shrimp trawls operating in the Gulf of Maine. Their investigation unveiled that optimal trawl performance was attained when the grid devices featured a grid bar diameter of 0.32 cm and an inclination grid angle of 30°. Likewise, Wakeford et al. [17] employed flume tank testing to meticulously outline the flow field dispersion within a codend-grid system. Their observations unveiled discernible patterns of turbulent flow located ahead of the captured specimens, accompanied by countercurrents proximate to the uppermost region of the codend. Cha et al. [18] embarked on an exploration encompassing the BRD system’s morphology, coupled with flow velocity fluctuations before and post-grid integration. Their findings demonstrated a decrease in water flow velocity following the installation of the BRD grid, with the difference in flow velocity before and after the BRD grid increasing in tandem with flow velocity. Although there were not relevant studies about the numerical simulation and flume tank experiments of the flow field around the BRD, numerical modeling examples were developed by many researchers to investigate the hydrodynamic characteristics and the flow field around the netting panel which enabled the structures to be assimilated into the BRD structures. For example, Bi et al. [19] studied the flow velocity reduction behind the plane net(s) with different solidities, spacing distances between two plane nets, and plane net numbers using ADV measurement. Bi et al. [20] proposed a numerical approach based on the joint use of the porous-media model and the lumped-mass model to solve the fluid–structure interaction problem between the flow and flexible nettings based on the iteration concept; Tu et al. [21] used a 3D multi-relaxation time (MRT) lattice Boltzmann model to simulate the flow field around a plane net in a constant current. They demonstrated that the flow velocity attenuation was mainly related to the net solidity of the plane net, with a higher velocity drop response related to a higher net solidity. Yao et al. [22] analyzed the feature of turbulence developing behind the filter device in a current flow, the flow fields at an intermediate downstream distance of an immersed grid in an open water channel using a two-dimensional (2D) Particle Image Velocimetry (PIV) system. They found that the vertical distributions of flow parameters reveal the diversity of flow characteristics in the water depth direction influenced by the free surface and the outer part of the turbulence boundary layer (TBL) from the channel bottom. Thierry et al. [23] (2021) Used Numerical modeling based on fluid–structure interaction in two-way coupling to identify the turbulent flow that develops around different parts of the bottom trawl. Wang et al. [24] (2023) numerically analyses the effects of inclination angles on local time-averaged and instantaneous flow fields, velocity reductions, and force coefficients and found that the inclination angles have dominant effects on the time-averaged velocity magnitudes around the net meshes and the hydrodynamic characteristic of netting.
However, it was observed from the previous studies that changing the bycatch reduction device’s structure and position resulted in a modification in BRD shape, trawl-BRD system drag, and stability, as well as the development of turbulent flow inside and around the trawl codend, including BRD. Therefore, it affects fish’s behavioral responses and movement patterns and greatly influences selectivity. However, relevant studies merely focused on the size selectivity of target species while needing an explanation and understanding of the physical mechanism of selectivity devices. The effect of the BRD with different structural parameters on the hydrodynamics and flow distribution characteristics also remains to be determined. To fill this gap in the literature, this study aims to perform computational fluid dynamics (CFD) numerical simulations to explore the effects of inclination angle and grid bar spacing on the hydrodynamic performance and flow field around the BRD. A numerical model was constructed based on the CFD method using the k-ω shear stress turbulent (SST) model. The results from the numerical model were validated with the experimental data obtained from the flume tank. These findings are expected to improve fishing gear selectivity and the numerical study of BRD.

2. Materials and Methods

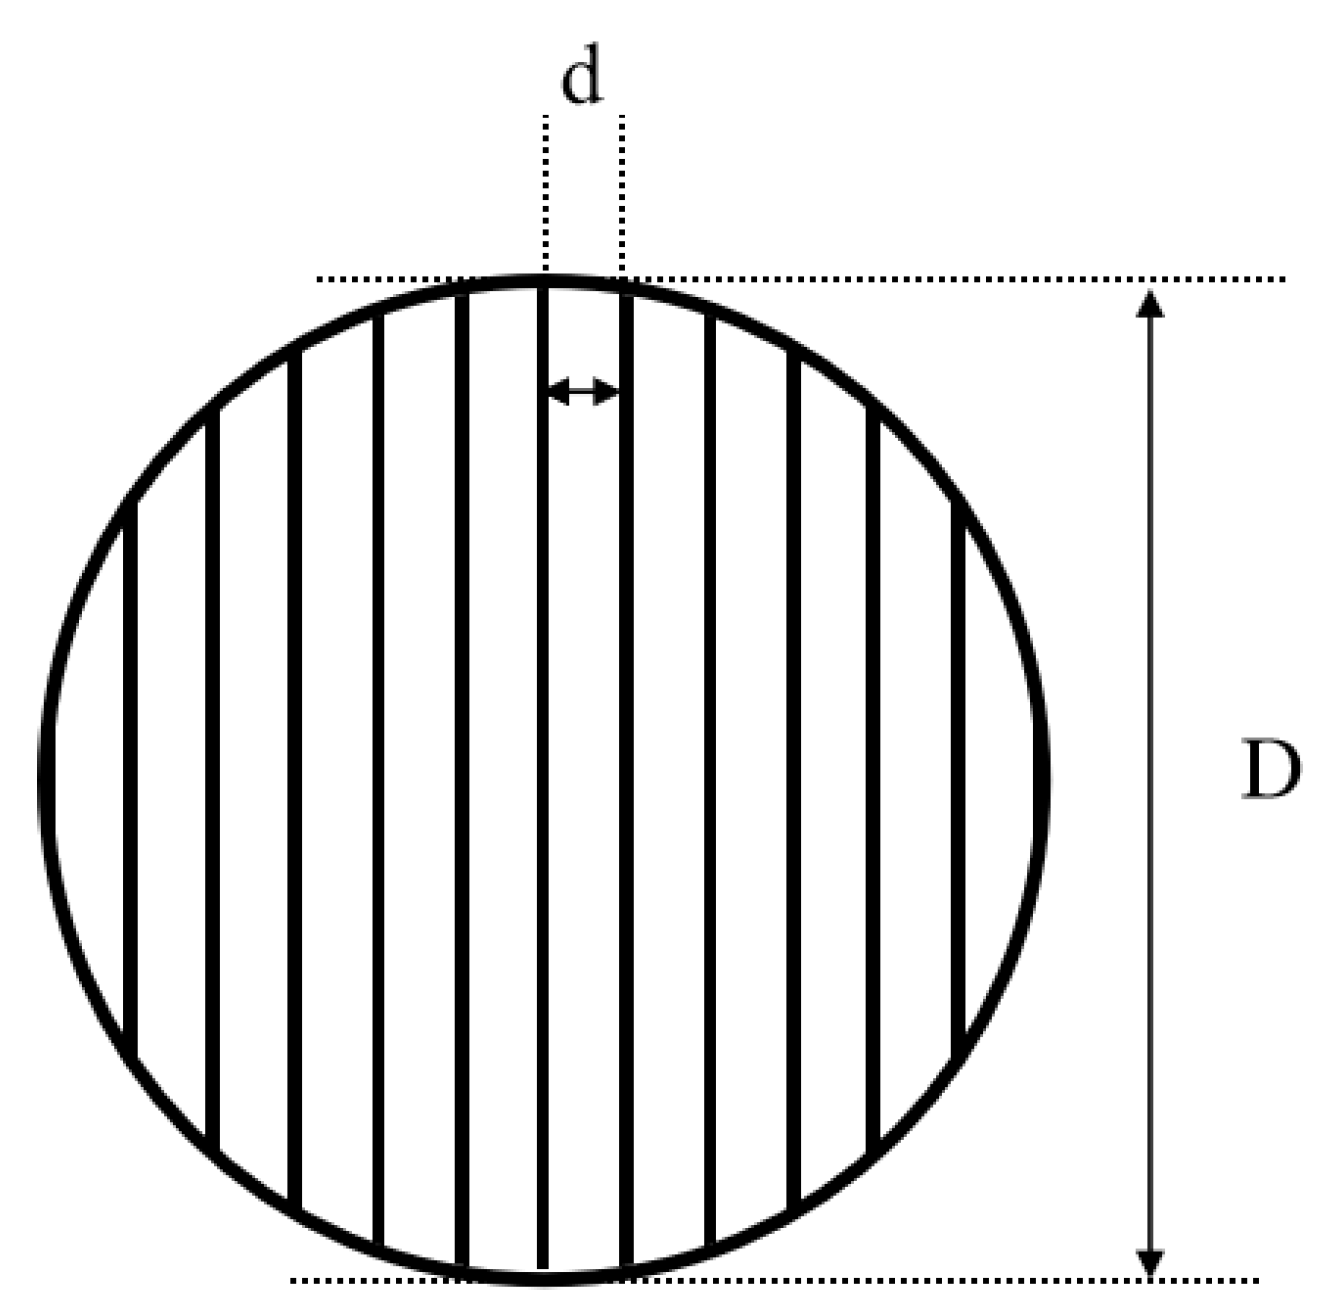
2.1. Circular Grid Design Structure

For this experimental study, a circular grid device, commonly used in beam shrimp trawl fisheries, was singled out as the chosen design for the bycatch reduction device (BRD), as depicted in Figure 1. The specific design parameters of this circular grid, including the grid bar spacing, were determined concerning the minimal grid spacing requirement and the preferences articulated by fishermen. A scale ratio of 1:3 was chosen to design the three models of circular grids were developed from the full-scale circular grid, each featuring distinct grid bar spacing values (7 mm, 11 mm, and 15 mm). These models were constructed based on the modified Tauti’s law developed as formulated by Hu et al. [25]. The circular grid model, encompassing a diameter (D) of 333 mm, was configured with a circular frame crafted from stainless steel, with a diameter of 6 mm. The grid bars, also forged from stainless steel, were 3 mm in diameter, as illustrated in Figure 1. Additionally, two additional circular grids were derived from the initial 7 mm grid spacing model by modifying the grid spacing while maintaining the same structure and dimensions. These iterations were undertaken to investigate the effects of grid bar spacing alterations systematically.

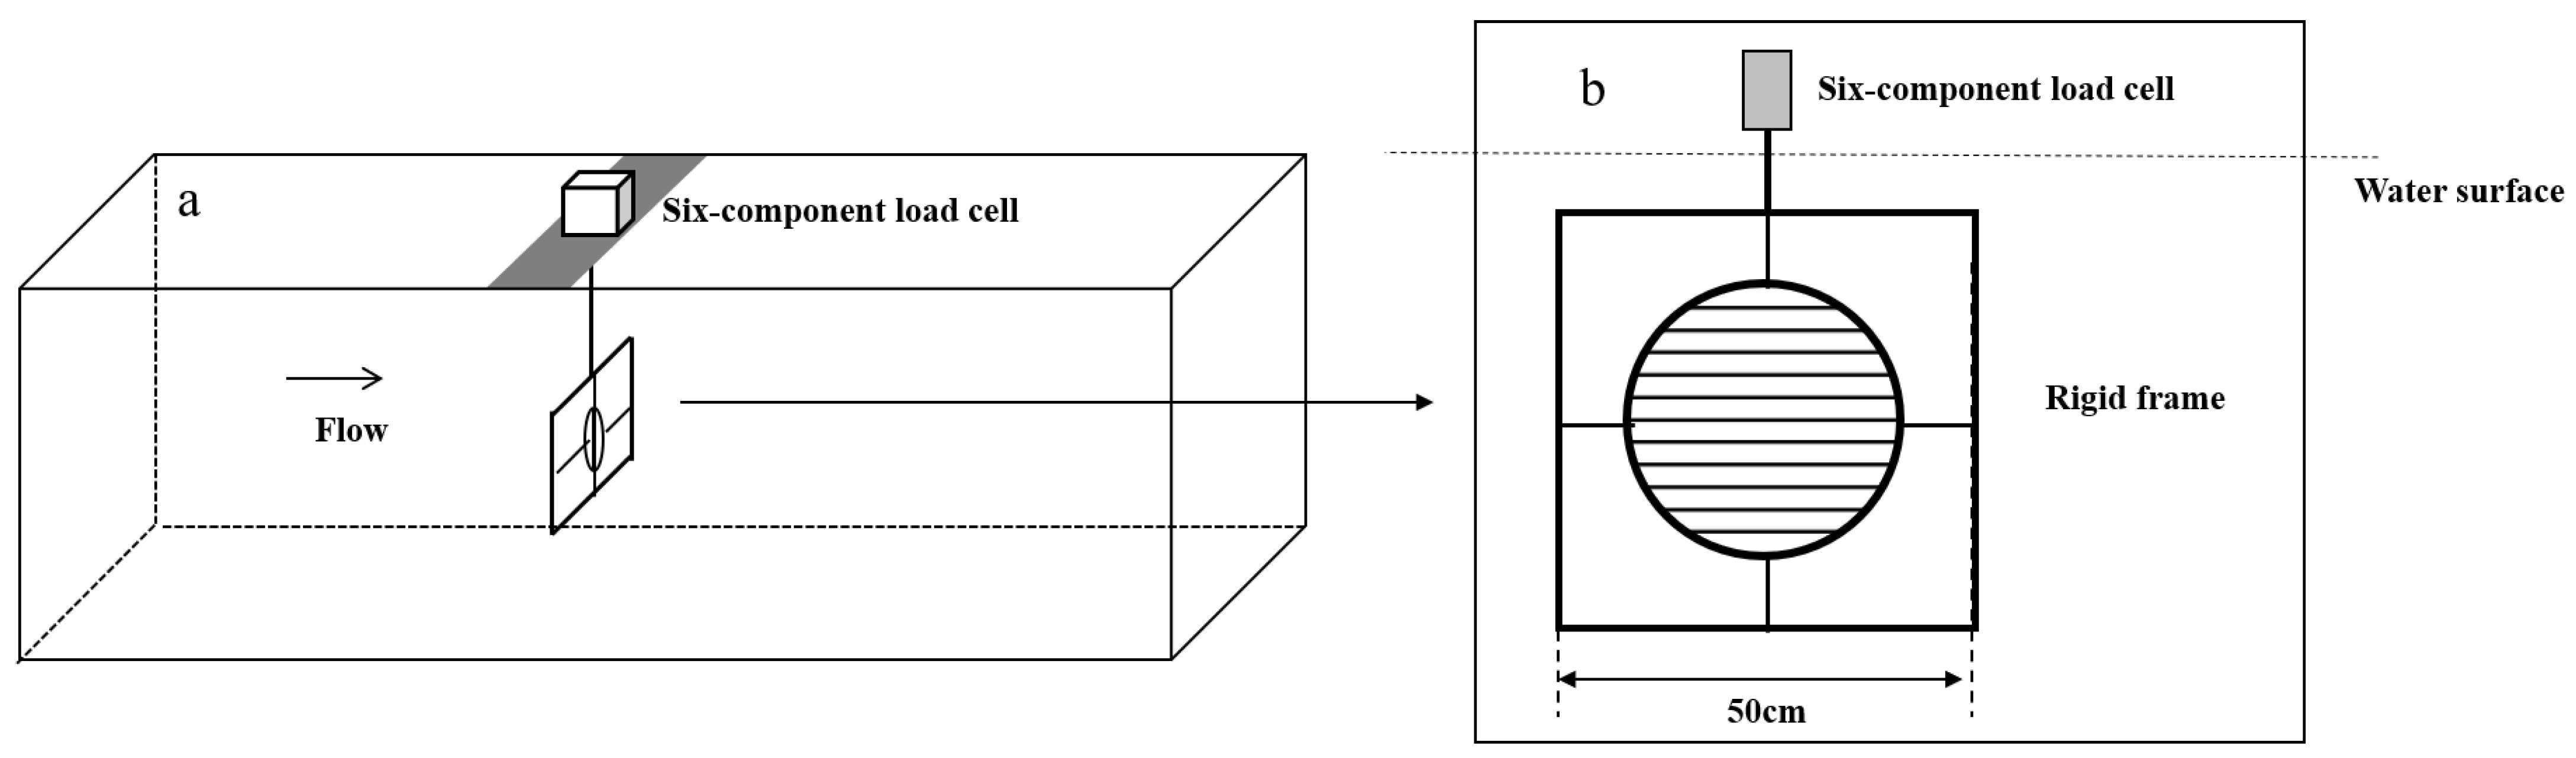
2.2. Physical Model Test Setup

Experimental measurements were conducted within the facilities of the National Center for Ocean Fishing Engineering Technology Research (NERCOF) flume tank at Shanghai Ocean University. The tests took place in a current circulation flume tank with the following dimensions: 15.0 m (length) × 3.5 m (width) × 2.3 m (depth). This flume tank was equipped to accommodate up to 530 tons of freshwater. The flow within the tank was induced by four contra-rotating impellers, which were powered by constant-speed hydraulic delivery pumps rated at 132 kW. These pumps facilitated flow velocities ranging from 0 to 1.5 m/s. The testing process involved observing the behavior of the circular grid system through a lateral viewing window situated on one side of the flume tank. The observations were captured in video recordings. The circular grid was attached within a square rigid frame in which a six-component load cell with a capacity of 5 kgf each and a specified accuracy of 2% was fixed (Denshikogyo Co., Tokyo, Japan). These load cells were calibrated and zeroed at both the start and end of each test, and their linearity was confirmed (Figure 2b). The hydrodynamic force signals, measured using the load cell, were amplified using a dynamic strain amplifier (DPM-6H, Tokyo Measuring Instruments Co., Ltd., Tokyo, Japan). These flow velocity signals were then sent to an A/D converter and a computer. Hydrodynamic force data were collected at a sampling frequency of 100 Hz, which included drag values applied to the frame under steady-state flow conditions over 30 s. The location of the grid models was central within the flume tank (Figure 3). In this experiment, the flow velocity was varied from 0.4 to 0.8 m/s in increments of 0.1 m/s. Furthermore, the inclination grid angle varied from 30° to 60° in increments 5°. The measurement was performed twice for each flow velocity. The water density of the flume tank was 999.8 kg/m3, and the water temperature was maintained in the range of 17.6–18.4 °C. The experimental diagram is elucidated In Figure 2 and Figure 3 presents the circular grid model in the flume tank.

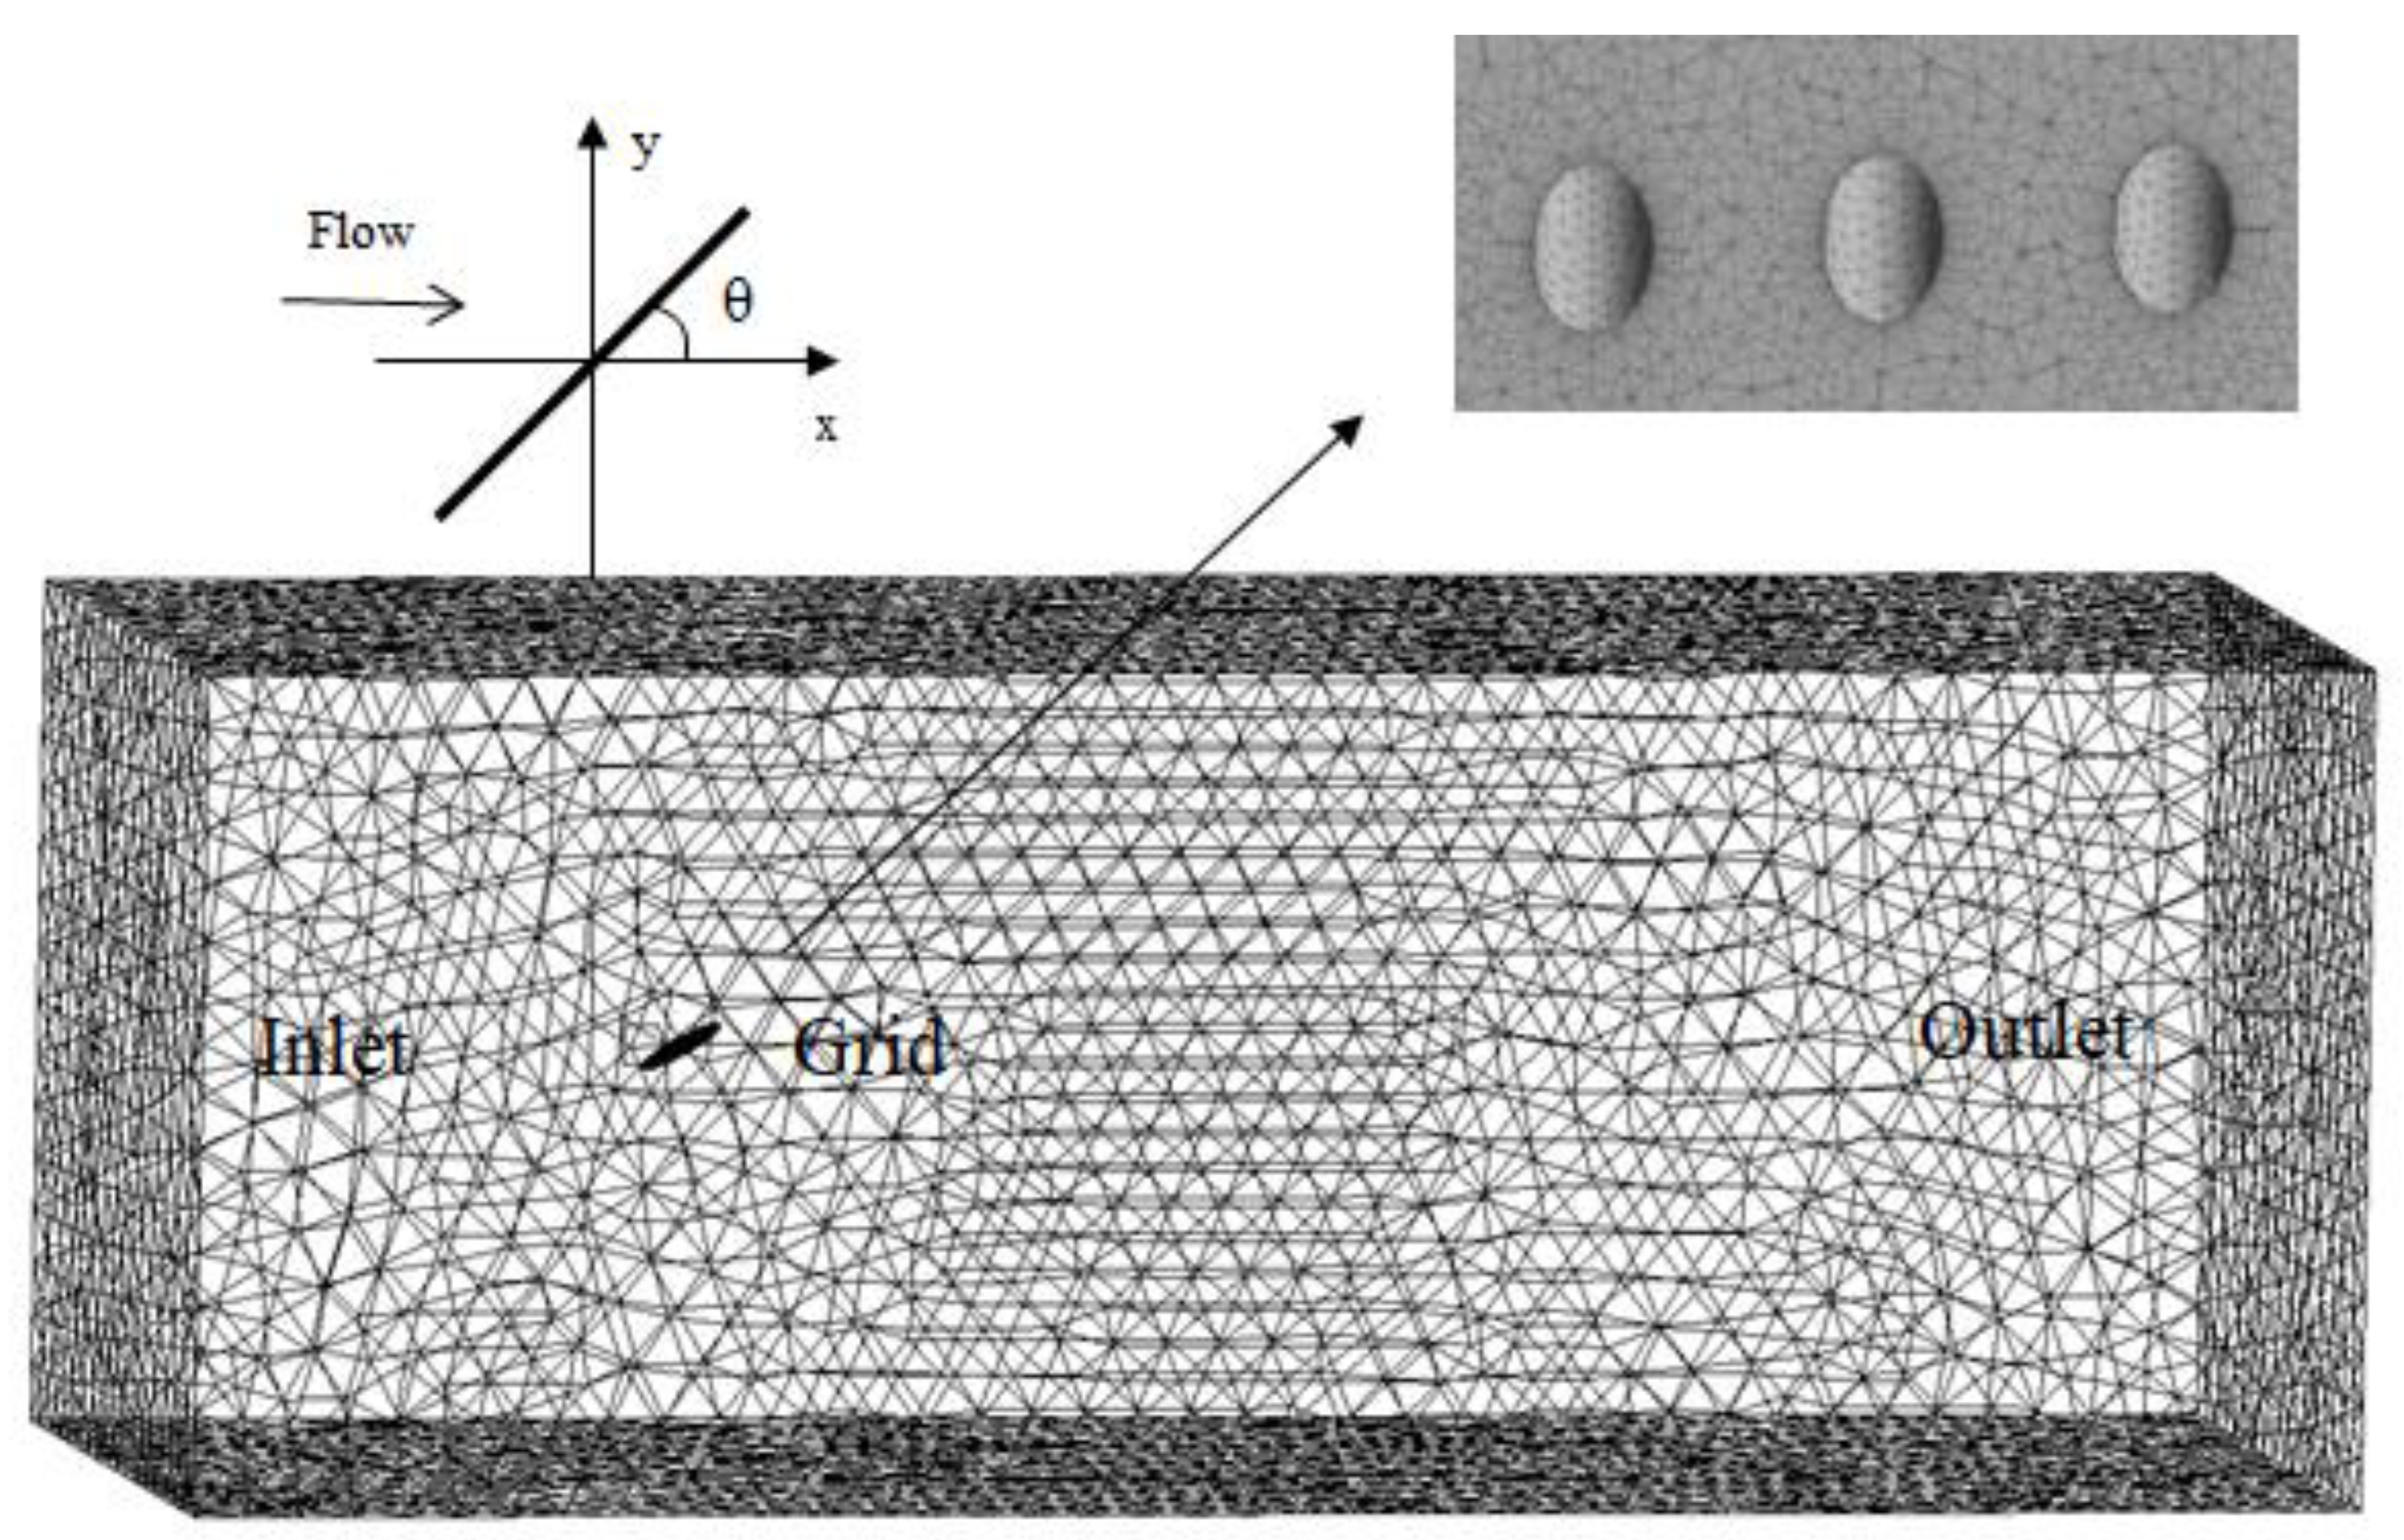
2.3. Numerical Fluid Flow Model

This study employed numerical simulations to analyze the flow field developed around the circular grid using ANSYS Fluent. For this purpose, the diverse circular grid configurations employed in the numerical simulations were devised as a succession of interconnected cylinders. These configurations mirrored the specifications utilized in the flume tests. Specifically, they maintained identical parameters to those implemented during the experimental phase. The computational fluid dynamics (CFD) framework was harnessed to unravel the interplay between the flow and the circular grid within a simulated water tank. The governing equations of the flow model were resolved using the finite volume method in conjunction with the shear stress transport (SST) k-ω turbulence model. The dynamics of the incompressible flow were delineated through the system of Reynolds-averaged Navier–Stokes (RANS) equations, where the Reynolds stress was approximated through an eddy viscosity model. This approach facilitated a comprehensive exploration of the flow field interaction with the circular grid within the confines of a virtual environment.
Since the fluid in this model is a single component and lacks heat exchange considerations, the fundamental principles of mass conservation and momentum conservation are essential to articulating the fluid’s behavior. These governing equations can be mathematically expressed in tensor notation within a Cartesian co-ordinate system, as follows:
ρ t + ρ u i x i = 0
ρ u i t + ρ u i u j x j = P x i + g i + x j μ u i x j ρ u i u j ¯ + S i
where t is time, μ is the fluid dynamic viscosity, g i is the gravitational force, ρ u i u j ¯ is the Reynolds stress, ρ is the density of the fluid, u i is the velocity component, x i is the spatial co-ordinate, u i is the fluctuation velocity, S i is a source term for the momentum equation and describing the resistance of the netting, and i, j = 1, 2, 3 (x, y, z). P is the transient pressure, and it is determined by the following equation:
P = p + ( 2 / 3 )   ρ k
where p is the time average pressure and k is the turbulent kinetic energy.
As mentioned earlier, the SST k-ω model [26] was utilized to characterize the Reynolds stresses within the system. This model effectively merges the foundational k-ε and Wilcox k-ω models by introducing two turbulence transport equations. The use of k–ω formulation in the inner parts of the boundary layer renders the model directly usable all the way down to the wall through the viscous sublayer. Hence, the SST k–ω model can be used as a low-Reynolds turbulence model without any extra damping functions. This model formulation also switches to a k–ɛ behavior in the free stream, thereby avoiding the oversensitivity of the k–ω model to the inlet-stream turbulence properties. In addition, this model produces slightly high turbulence levels in regions with large normal strain, such as regions with strong acceleration [26]. The mathematical formulation governing the SST k-ω model is as follows:
ρ k t = τ i j u i x j β * ρ ω k + x j μ + σ k μ t k x j
ρ ω t = 1 μ t τ i j u i x j β ρ ω 2 + x j μ + σ ω μ t ω x j + 2 1 F 1 ρ σ ω 2 1 ω k x j ω x j
μ t = a 1 ρ k m a x a 1 ω , Ω F 2
where is the magnitude of the viscosity.
The numerical representation of the governing equations was solved employing a three-dimensional pressure-based Navier–Stokes solver. Within this context, the simple algorithm was harnessed to effectively manage the intricacies of pressure-velocity coupling. The discretization methodology adopted a second-order approach for both the pressure and momentum equations, with the momentum equation specifically employing a second-order upwind scheme. The solver operates on a pressure-based framework, while the simulation is geared towards steady-state behavior. The velocity equation incorporates the absolute velocity for a comprehensive assessment. Throughout the numerical analysis, these computational methods and settings were deliberately chosen to ensure the production of robust and highly accurate simulations capturing the intricacies of the flow field surrounding the circular grid.
The dimensional computational domain for the simulation of the circular grid in the numerical flume tank was approximately 10 m in length, 4.6 m in width, and 4.6 m in height.
As depicted in Figure 4, the velocity-inlet boundary condition delineated the left boundary of the numerical water tank, while the pressure-outlet boundary condition characterized the right boundary. The remaining boundaries of the computational domain were defined as zero shear stress walls. The interaction interface between the fluid and the circular grid was modeled with a no-slip wall boundary condition, accounting for the viscosity-induced forces between the water flow and the circular grid. The numerical model adopts a right-handed, three-dimensional (3D) co-ordinate system. The front edge of the circular grid structure is positioned 3 m away from the water inlet, and the separation between the circular grid structure’s central axis and the two lateral walls amounts to 2.3 m (Figure 4). These carefully selected parameters ensure a seamless alignment and precision between the numerical simulation and experimental setup.
Unlike the other turbulent model, the k-ω SST model was integrated through the viscous sublayer without the need for a two-layer approach. This function can be used for a y + insensitive wall treatment by mixing the viscous sublayer formulation and the logarithmic layer formulation based on y + . Thus, the boundary layer smoothing method is used to deform the fluid-netting interaction wall during a moving deforming mesh simulation. A ground rate of 1.2, the maximum layers of y + = 50 and the first layer height of 1 mm were set around the netting structure model (Figure 4).
To attain an optimal mesh configuration, unstructured full-tetrahedral grids were deployed. These grids were characterized by a minimum mesh size of 0.025 m. The mesh generation was executed utilizing the ICEM-CFD 16.0 grid generation tool. Additionally, a curvature size function was incorporated, with a curvature normal angle of 12°, to refine the mesh near the netting (Figure 4). The grid boundary layer was subject to inflation, involving adding ten supplementary layers from the grid surface. This meticulous approach aimed to accurately represent the boundary layer, thereby augmenting the mesh density within this critical region. An illustrative example of mesh size distribution within the numerical water tank, featuring an inclination grid angle of 60°, is provided in Figure 3. The water flow was characterized by a 999.8 kg/m³ density and a viscosity coefficient of 0.001341 kg·m−1·s−1. To quantify the optimal mesh, an independent grid analysis was used, as shown in Table 1, and was conducted for four meshes: coarse, medium, fine, and finer. The total mesh size using coarse meshing was 47.17%, 71.88%, and 77.43% lower than that obtained using medium, fine, and finer meshes. The drag force obtained using coarse mesh was 7.22%, 22.32%, and 25.38% lower than that obtained with medium, fine, and finer meshes. The two fine meshes produced drag force results very similar, with a gap of 1.51%, and the comparison between the results obtained with fine mesh and the experimental data showed a difference of 3.27% (Table 1). The following study applied the fine mesh to maintain accurate simulation results and fast calculations (Figure 4).

2.4. Data Post-Processing

The hydrodynamic characteristics of the circular grid were assessed in both experimental tests and numerical simulations, primarily encompassing parameters such as the area coefficient (μ), the Reynolds number (Re), and the drag coefficient (Cd).
The Reynolds number Re is calculated using the following formula:
R e = V d ( b a r ) ν
where d ( b a r ) is the diameter of the grid bar and v is the kinematic viscosity of the fluid. The corresponding Reynolds numbers for the grid at different flow velocities are shown in Table 2.

3. Results

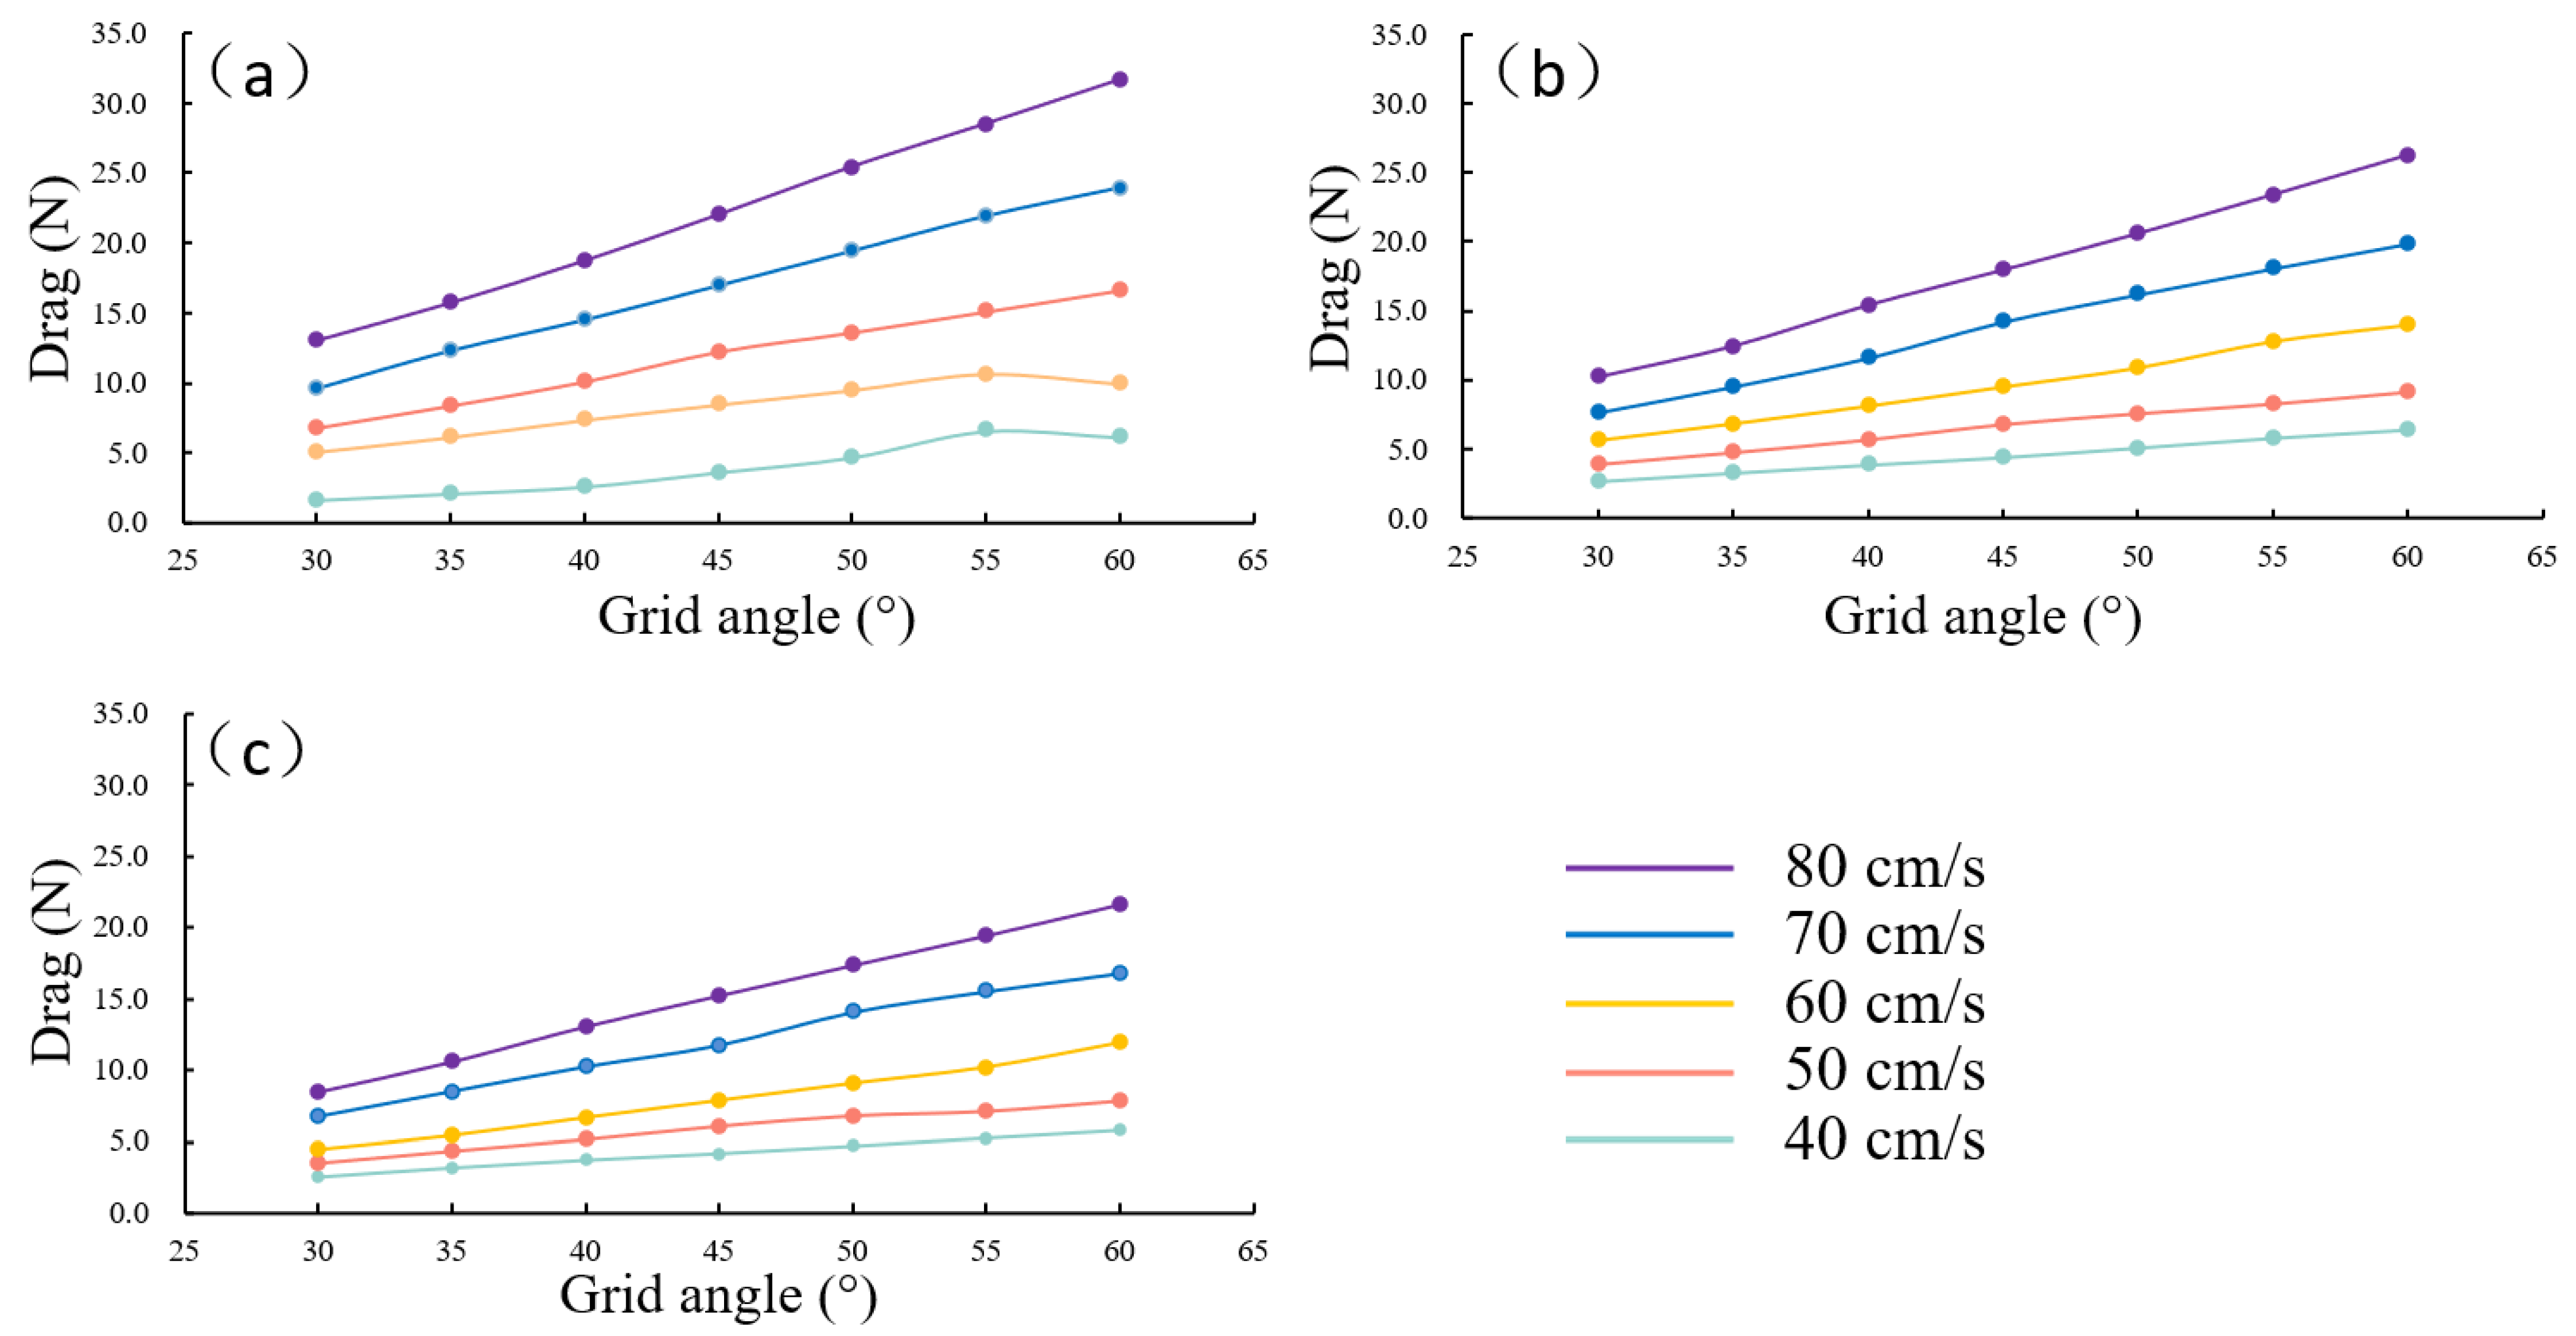
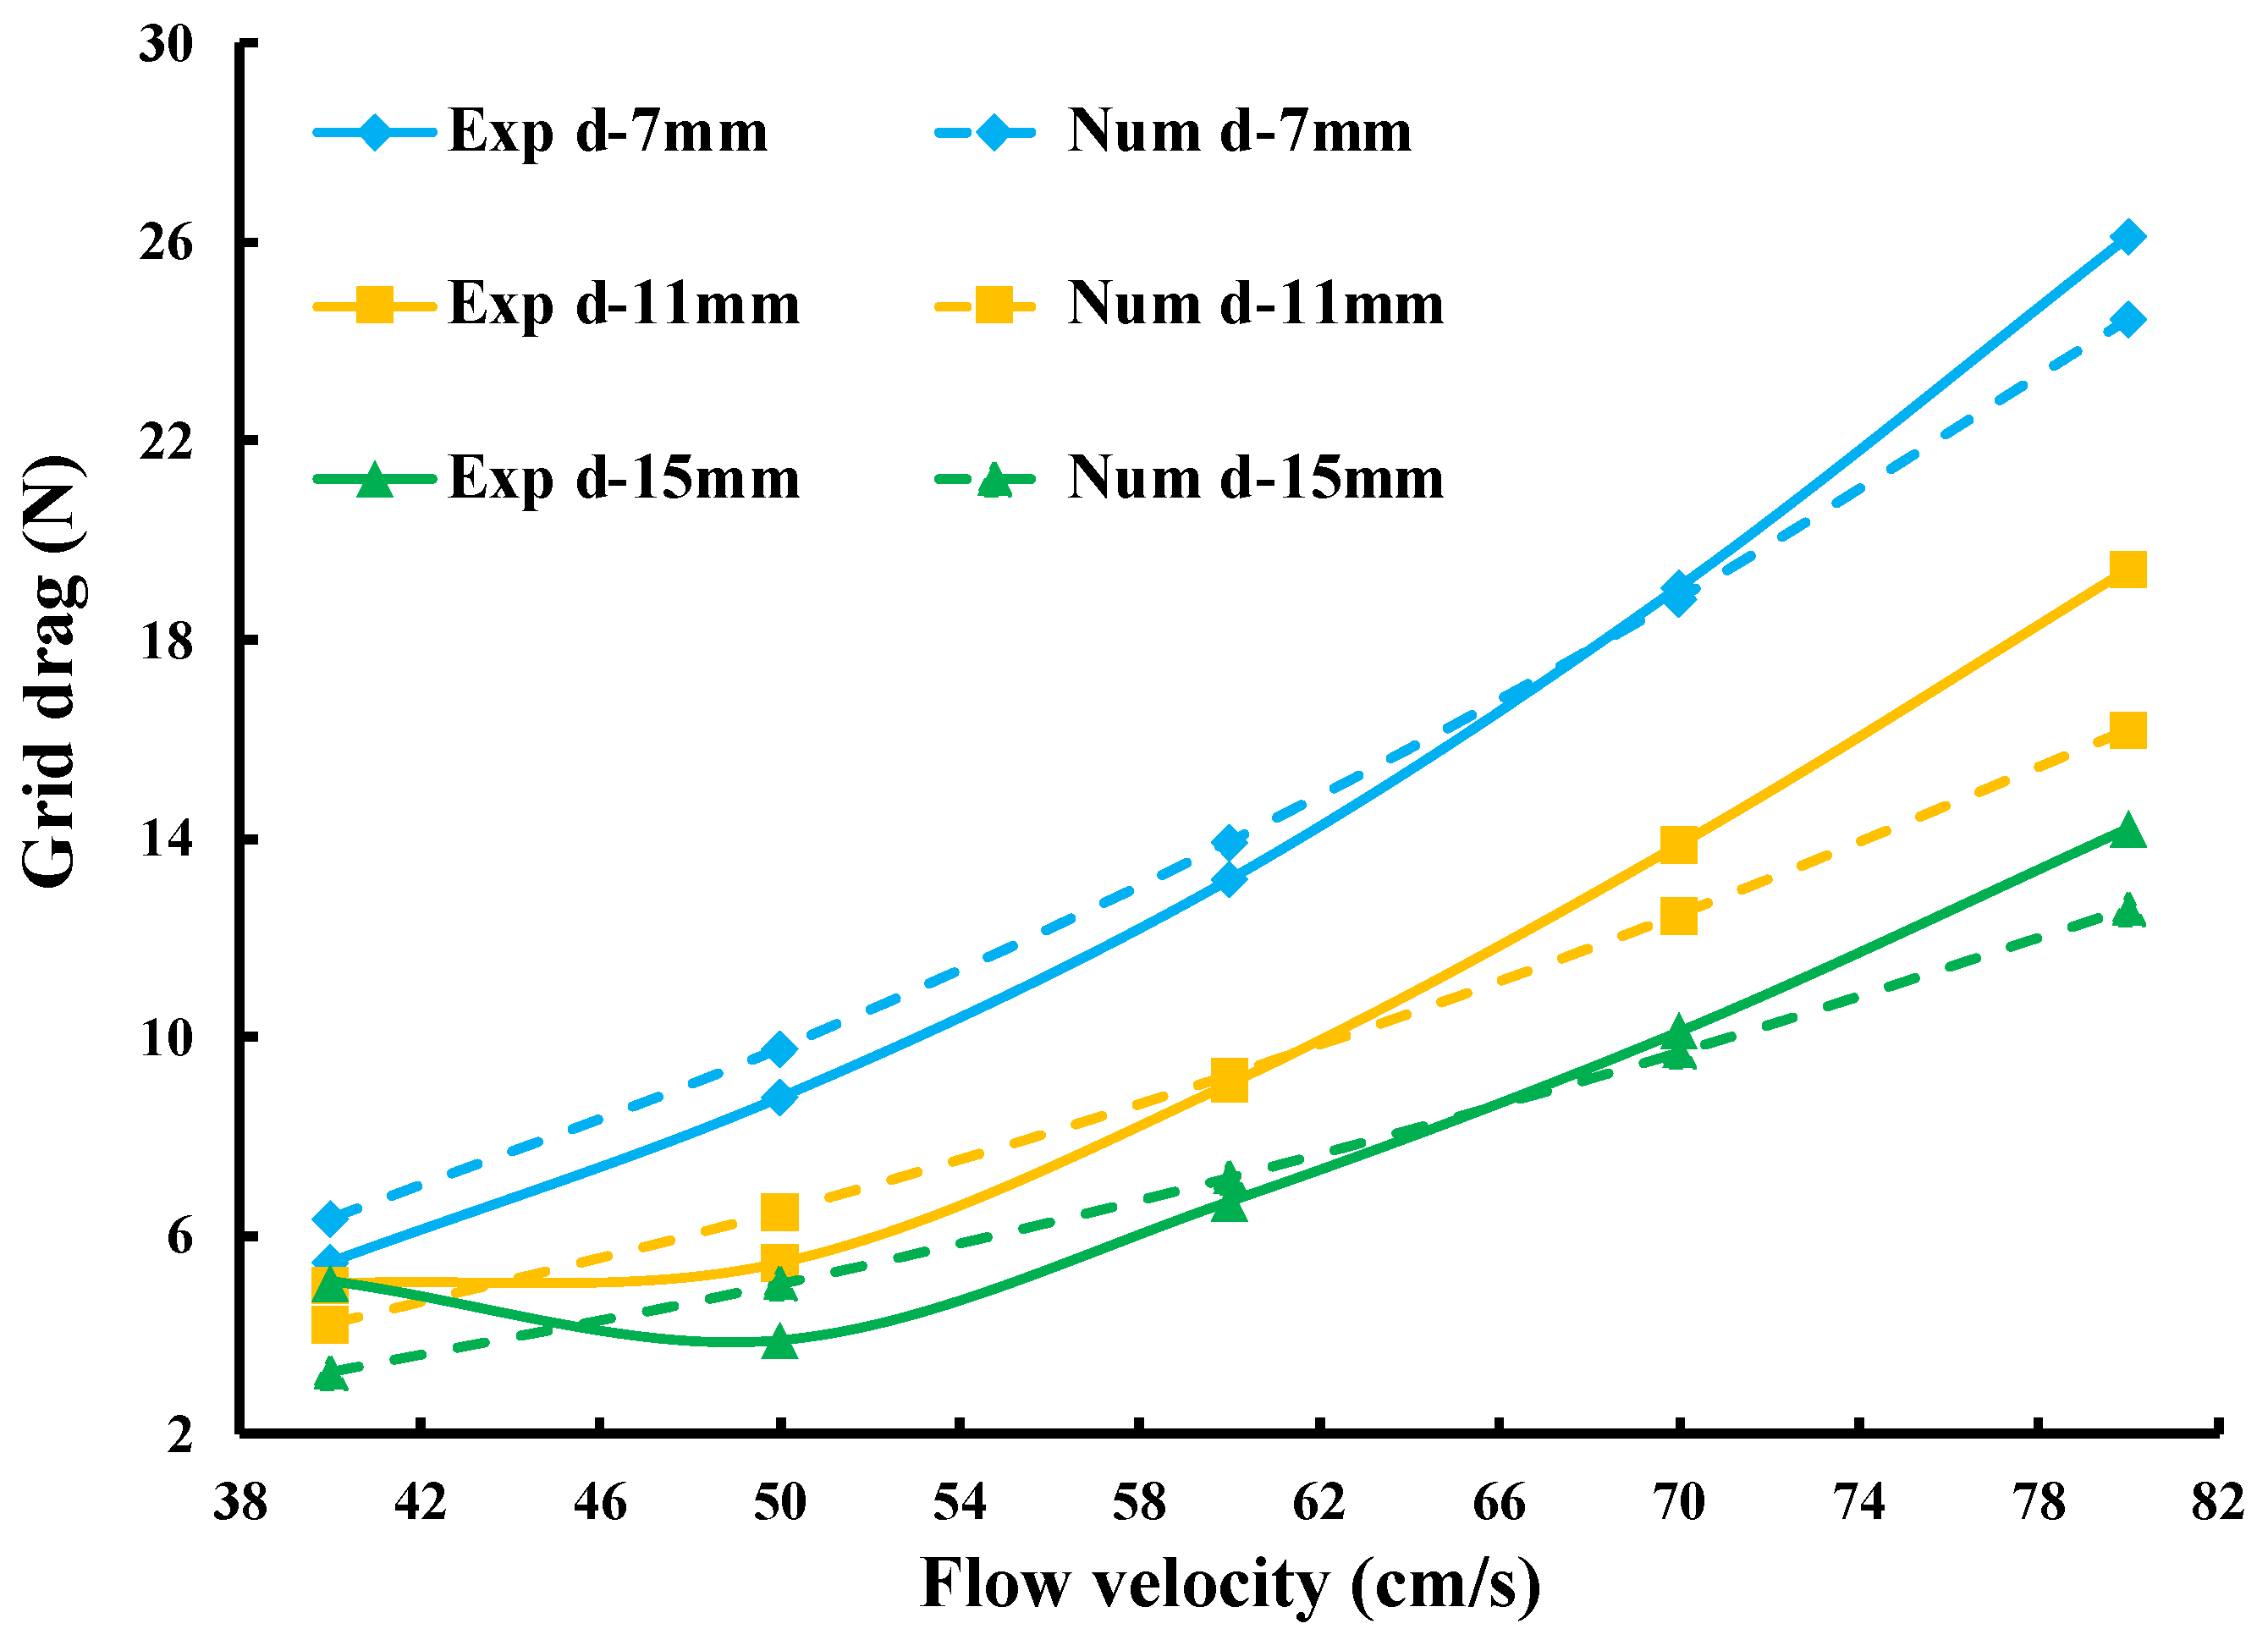
3.1. Influence of Grid Bar Spacing and Inclination Angle on Grid Drag

As depicted in Figure 5, a clear correlation is observed between grid drag and both flow velocity and inclination grid angle. Simultaneously, an inverse correlation is established between grid drag and grid bar spacing. Keeping flow velocity and grid bar spacing constant, an increasing inclination grid angle increases circular grid drag. Additionally, grid drag tends to amplify with increasing flow velocity, while it decreases as grid bar spacing increases.
At lower flow velocities (50 m/s) and inclination grid angles (30°), the circular grid with a grid bar spacing of 15 mm demonstrated a notably reduced grid drag compared to the drag of circular grid with the grid bar spacings of 7 mm and 11 mm. This reduction in grid drag amounted to a substantial 43.3% when contrasted with the circular grid employing a 7 mm grid bar spacing, and a still noteworthy 8% when juxtaposed with the grid employing an 11 mm grid bar spacing. Moreover, when considering higher inclination grid angles (60°) and flow velocities (80 cm/s), the grid drag experienced by the circular grid featuring grid bar spacings of 7 mm and 11 mm exceeded that of the circular grid with a grid bar spacing of 15 mm by 26.6% and 15.6%, respectively.
At lower flow velocities (50 m/s) and more modest inclination grid angles (30°), the circular grid with a grid bar spacing of 15 mm demonstrated a notably reduced grid drag compared to the drag of the circular grid with the grid bar spacings of 7 mm and 11 mm. Indeed, the circular grid drag with a grid bar spacing of 15 mm was about 43.3% and 8% lower than that of the drag of the circular grids with a grid bar spacing of 7 mm and 11 mm, respectively. Moreover, when considering higher inclination grid angles (60°) and elevated flow velocities (80 cm/s), the grid drags experienced by the circular grid featuring grid bar spacings of 7 mm and 11 mm exceeded those of the circular grid with a grid bar spacing of 15 mm by 26.6% and 15.6%, correspondingly.

3.2. Comparison of Drag Forces between Numerical Simulation and Experimental Results

Figure 6 presents the computed drag forces from numerical simulations and the corresponding measured drag forces obtained from the flume tank tests. Both sets of results, obtained from experimental and numerical simulations, consistently reveal a quadratic increase in circular grid drag with ascending flow velocities, while simultaneously reflecting a decrease in drag force as grid bar spacing increases (Figure 6). The numerical simulation results are more significant than experimental measurements in the range of flow velocities from 40 cm/s to 70 cm/s. As the flow velocity further increases beyond 70 cm/s, the flume tank test results were slightly greater than those obtained using the numerical simulation. A noticeable pattern appears when examining the average grid drag exerted by the grid at the various flow velocities. The drag forces obtained by numerical simulation agreed well with the experimental results, and the mean relative error was 0.88%, 8.15%, and 5.38% at 0.57 m/s for the grid bar spacing of 7, 11, and 15 mm, respectively. Therefore, this numerical simulation model can be adopted for the calculation of the hydrodynamic forces of the BRD circular grid.

3.3. Velocity Fluctuations about the Grid Bar Centerline

Figure 7 describe the flow velocities at the grid’s central point “C” across various inclination grid angles, maintaining an incoming flow velocity of 0.5 m/s. it can be seen that the flow velocity recorded at the center of the circular grid exceeds the initial inflow velocity, indicating an acceleration of the water flow as it passes through the circular grid. The flow velocity measured at the center of the circular grid shows an increasing trend with increasing inclination angle and decreasing grid spacing bars. However, even at lower inclination angles, the flow velocity at the center of the circular grid was significantly accelerated compared to the incoming flow velocity, by about 15.3%, 10.9%, and 7% at grid bar spacings of 7 mm, 11 mm, and 15 mm, respectively (Figure 6). In addition, the flow velocity at the center of the circular grid exceeded the incoming velocity by about 35.8%, 29%, and 20.9% at greater inclination angle (60°) for grid bar spacings of 7 mm, 11 mm, and 15 mm, respectively.

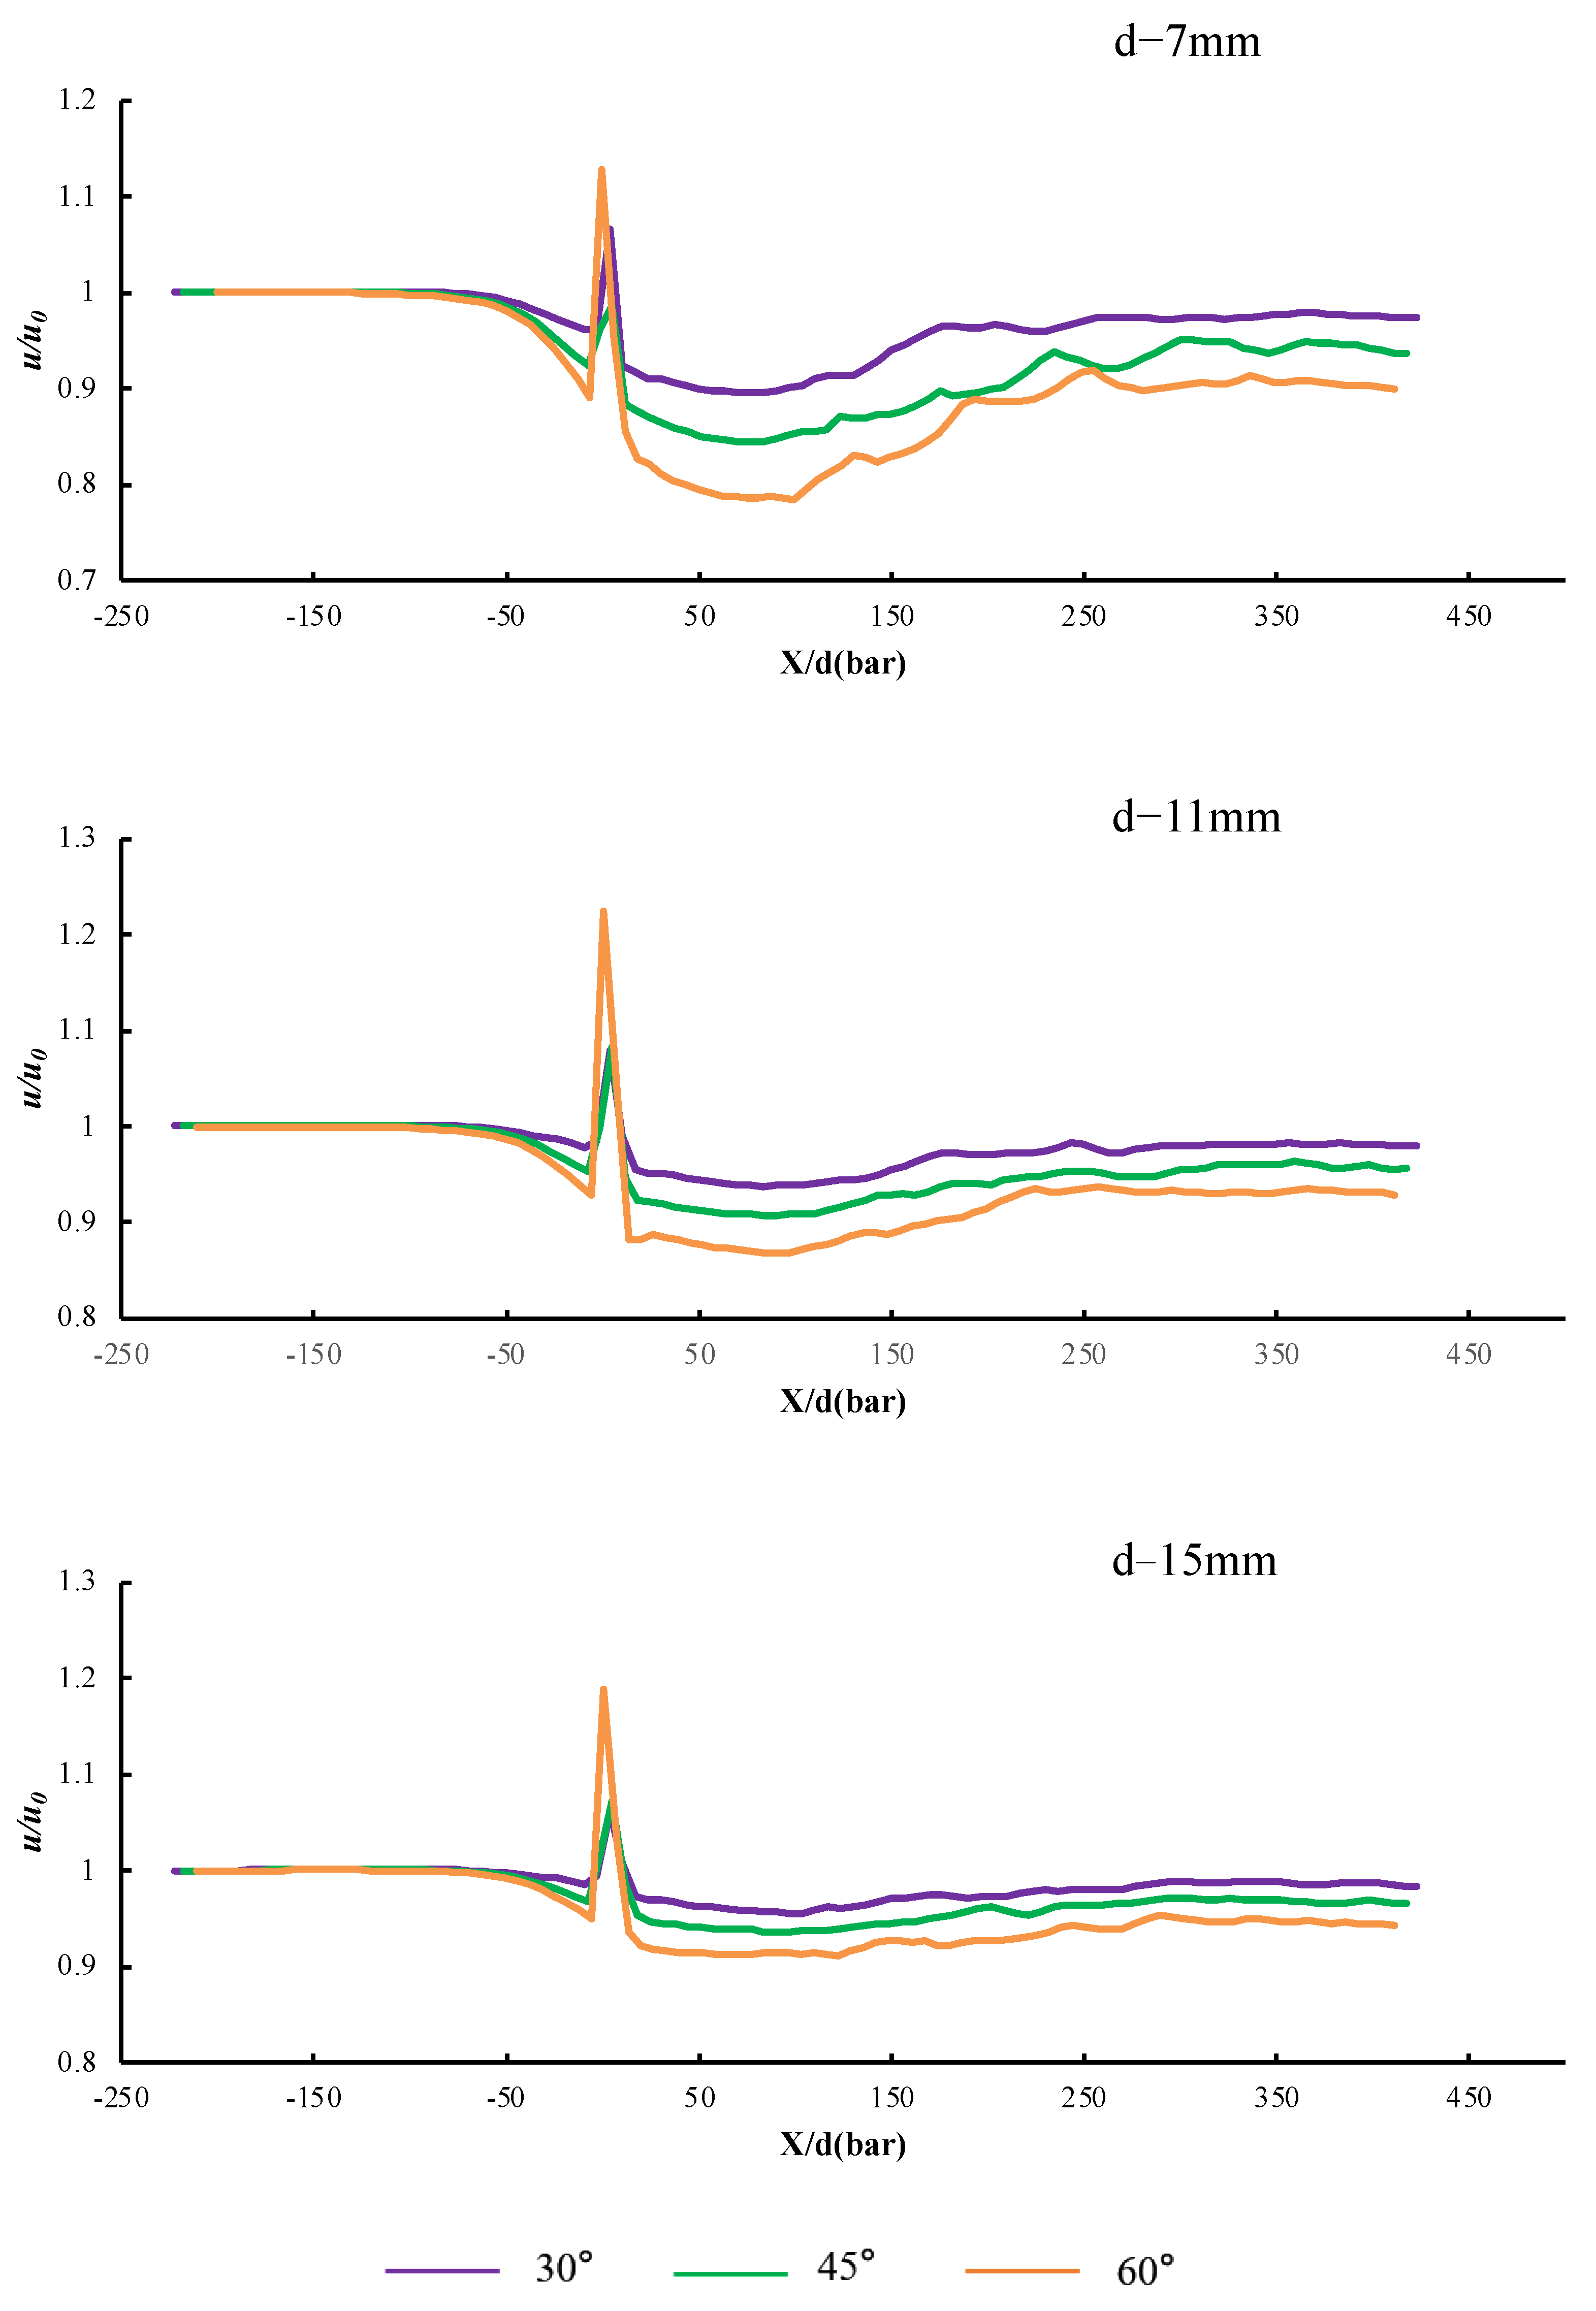
3.4. Velocity Field Curve along the Centerline of the Circular Grid

To undertake a quantitative analysis of the velocity reduction upstream and downstream of the circular grid, the velocity ratio was established at a point situated 0.5 m downstream from the grid. This ratio was defined utilizing the following equation (Equation (10)):
μ = V 0.5 V 0.5 V 0.5 × 100 %
where μ is the velocity ratio at 0.5 m downstream of the grid, V 0.5 is the velocity at 0.5 m downstream of the grid to the center point, and V 0.5 is the velocity at 0.5 m upstream of the grid to the center point.
As shown in Figure 8, the flow velocity fields were very close, with a gap of less than 1% at all grid bar spacings and inclination grid angles upstream from the circular grid. However, at 0.13 m < x < 0.2 m, the flow velocity field decreased as the x-direction increased and inclination grid angle decreased (Figure 8). In this case, the minimum flow velocity (0.39 m/s) was obtained at a grid bar spacing of 7 mm and an inclination grid angle of 60°. Downstream of the circular grid in the wake region, the flow velocity increased as the inclination grid angle decreased and the grid bar spacing increased. It was also observed that the flow velocity curves were slightly increased as the x-direction increased for the grid bar spacing of 7 and 11 mm, while at the grid bar spacing of 15 mm, they were decreased. On average, the velocity reduction downstream of the circular grid with grid bar spacings of 7 mm, 11 mm, and 15 mm was approximately 16.7%, 10.4%, and 7%, respectively.
Figure 9 illustrates the relationship between the flow velocity ratio through the circular grid and the inclination grid angle. It is noticeable that the velocity ratio increases as the inclination grid angles increases, while it decreases as the spacing grid bars increases (Figure 8). Among the different configurations, the highest velocity ratio through the circular grid was obtained at a grid bar spacing of 7 mm and an inclination grid angle of 60°, which was 20.85%. In contrast, the lowest velocity ratio was obtained at a grid bar spacing of 15 mm and an inclination grid angle of 30°, amounting to 4.8%. On average, the velocity ratios distribute through the circular grid were found to be 16.7%, 10.4%, and 7.2% for grid bar spacings of 7 mm, 11 mm, and 15 mm, respectively. These results illustrate the intricate dependence of the velocity ratio on both grid bar spacing and inclination grid angle, and contribute to a comprehensive understanding of flow properties develop through the circular grid.

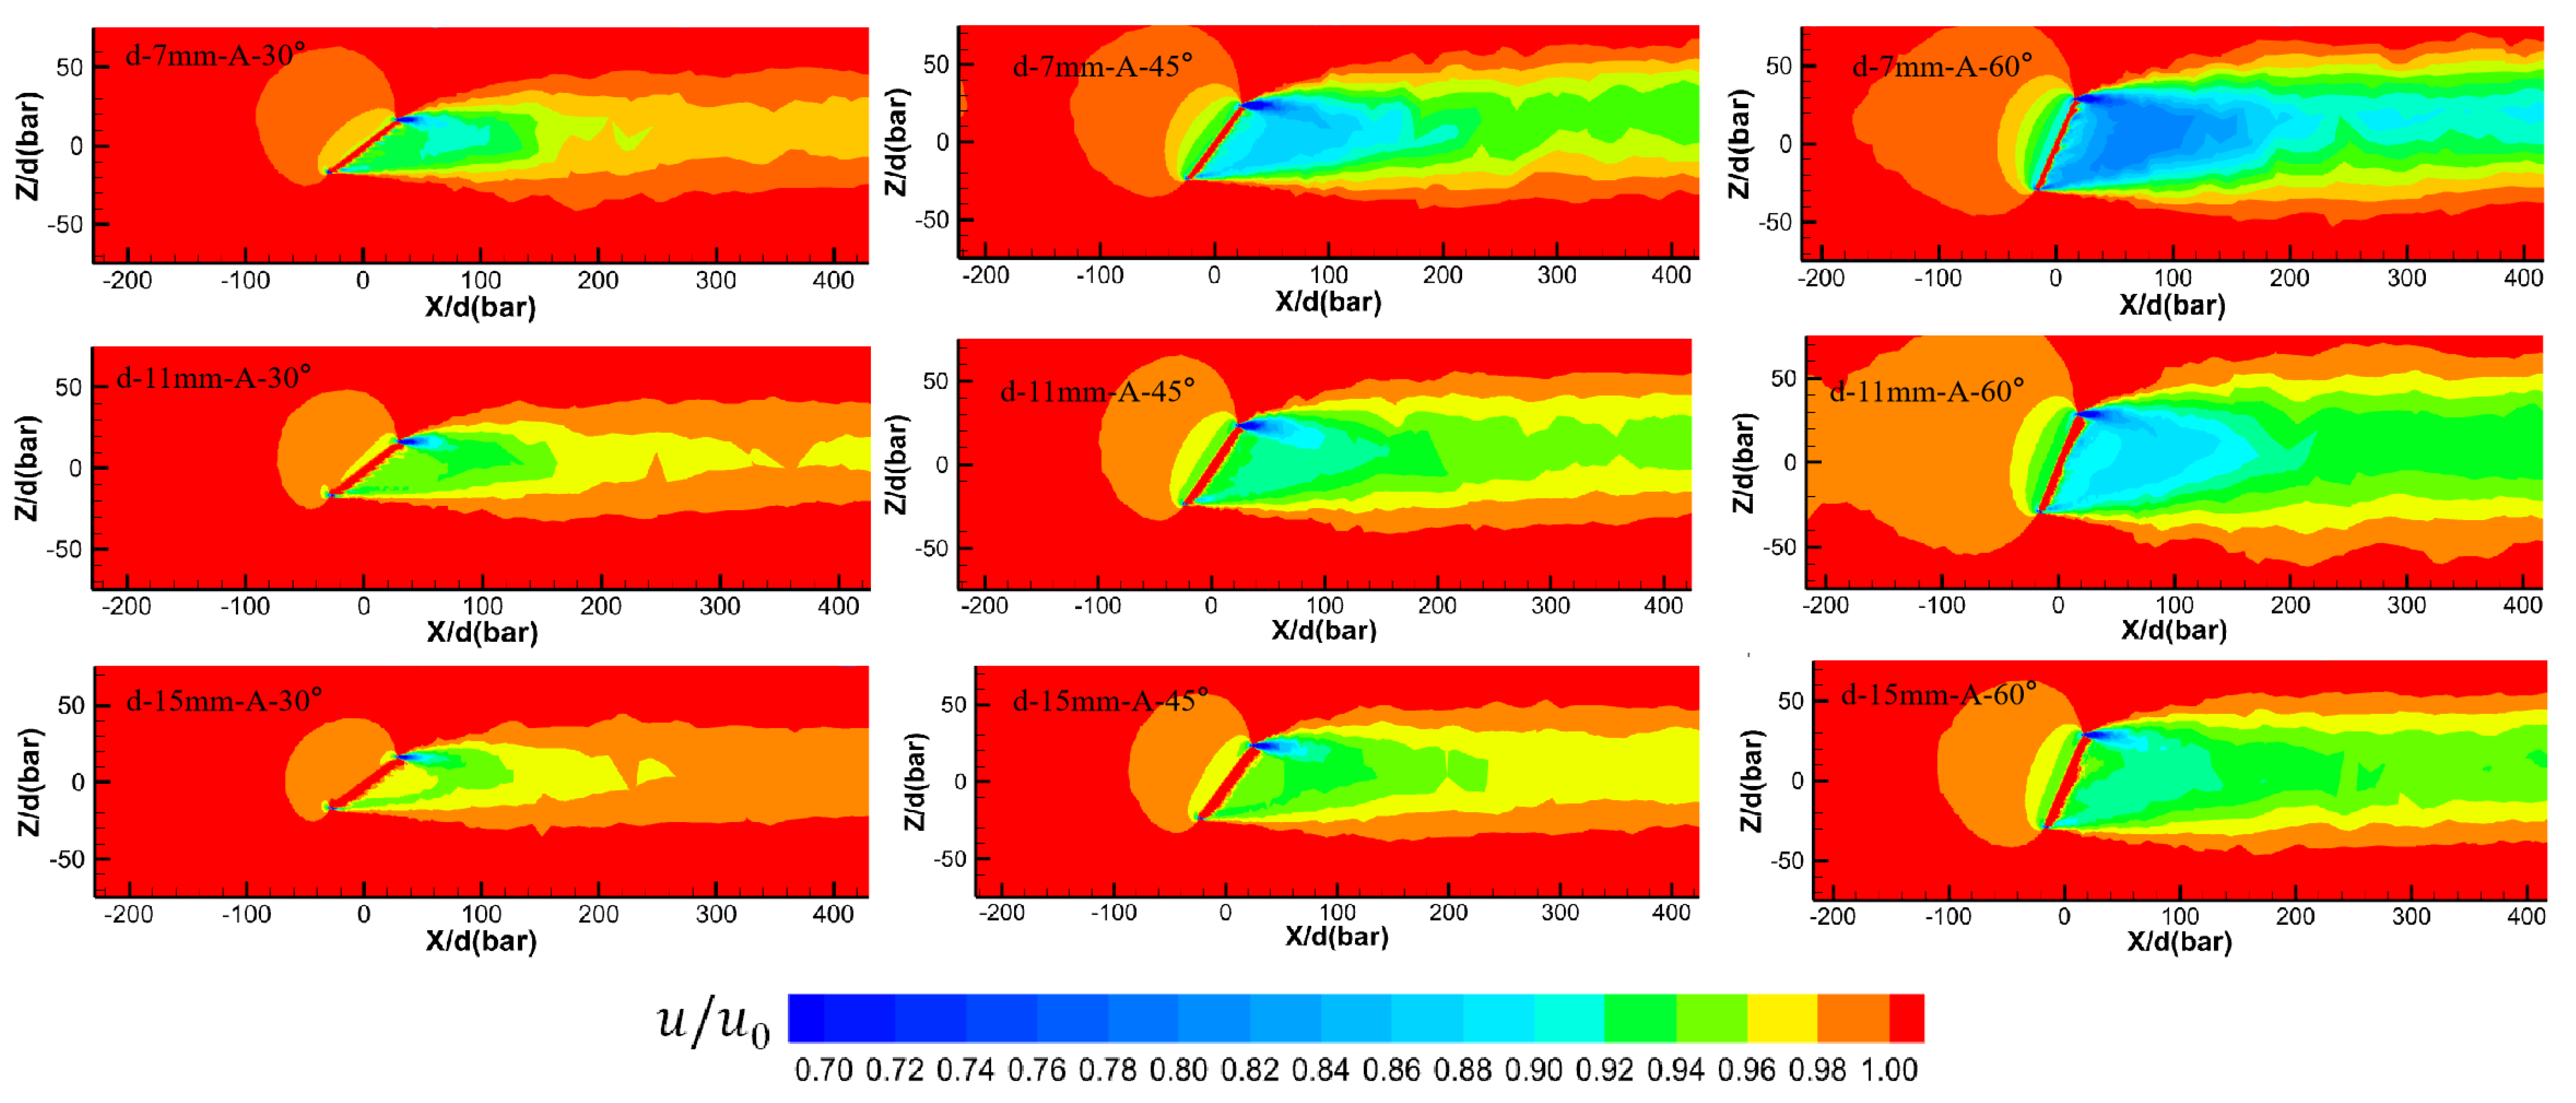
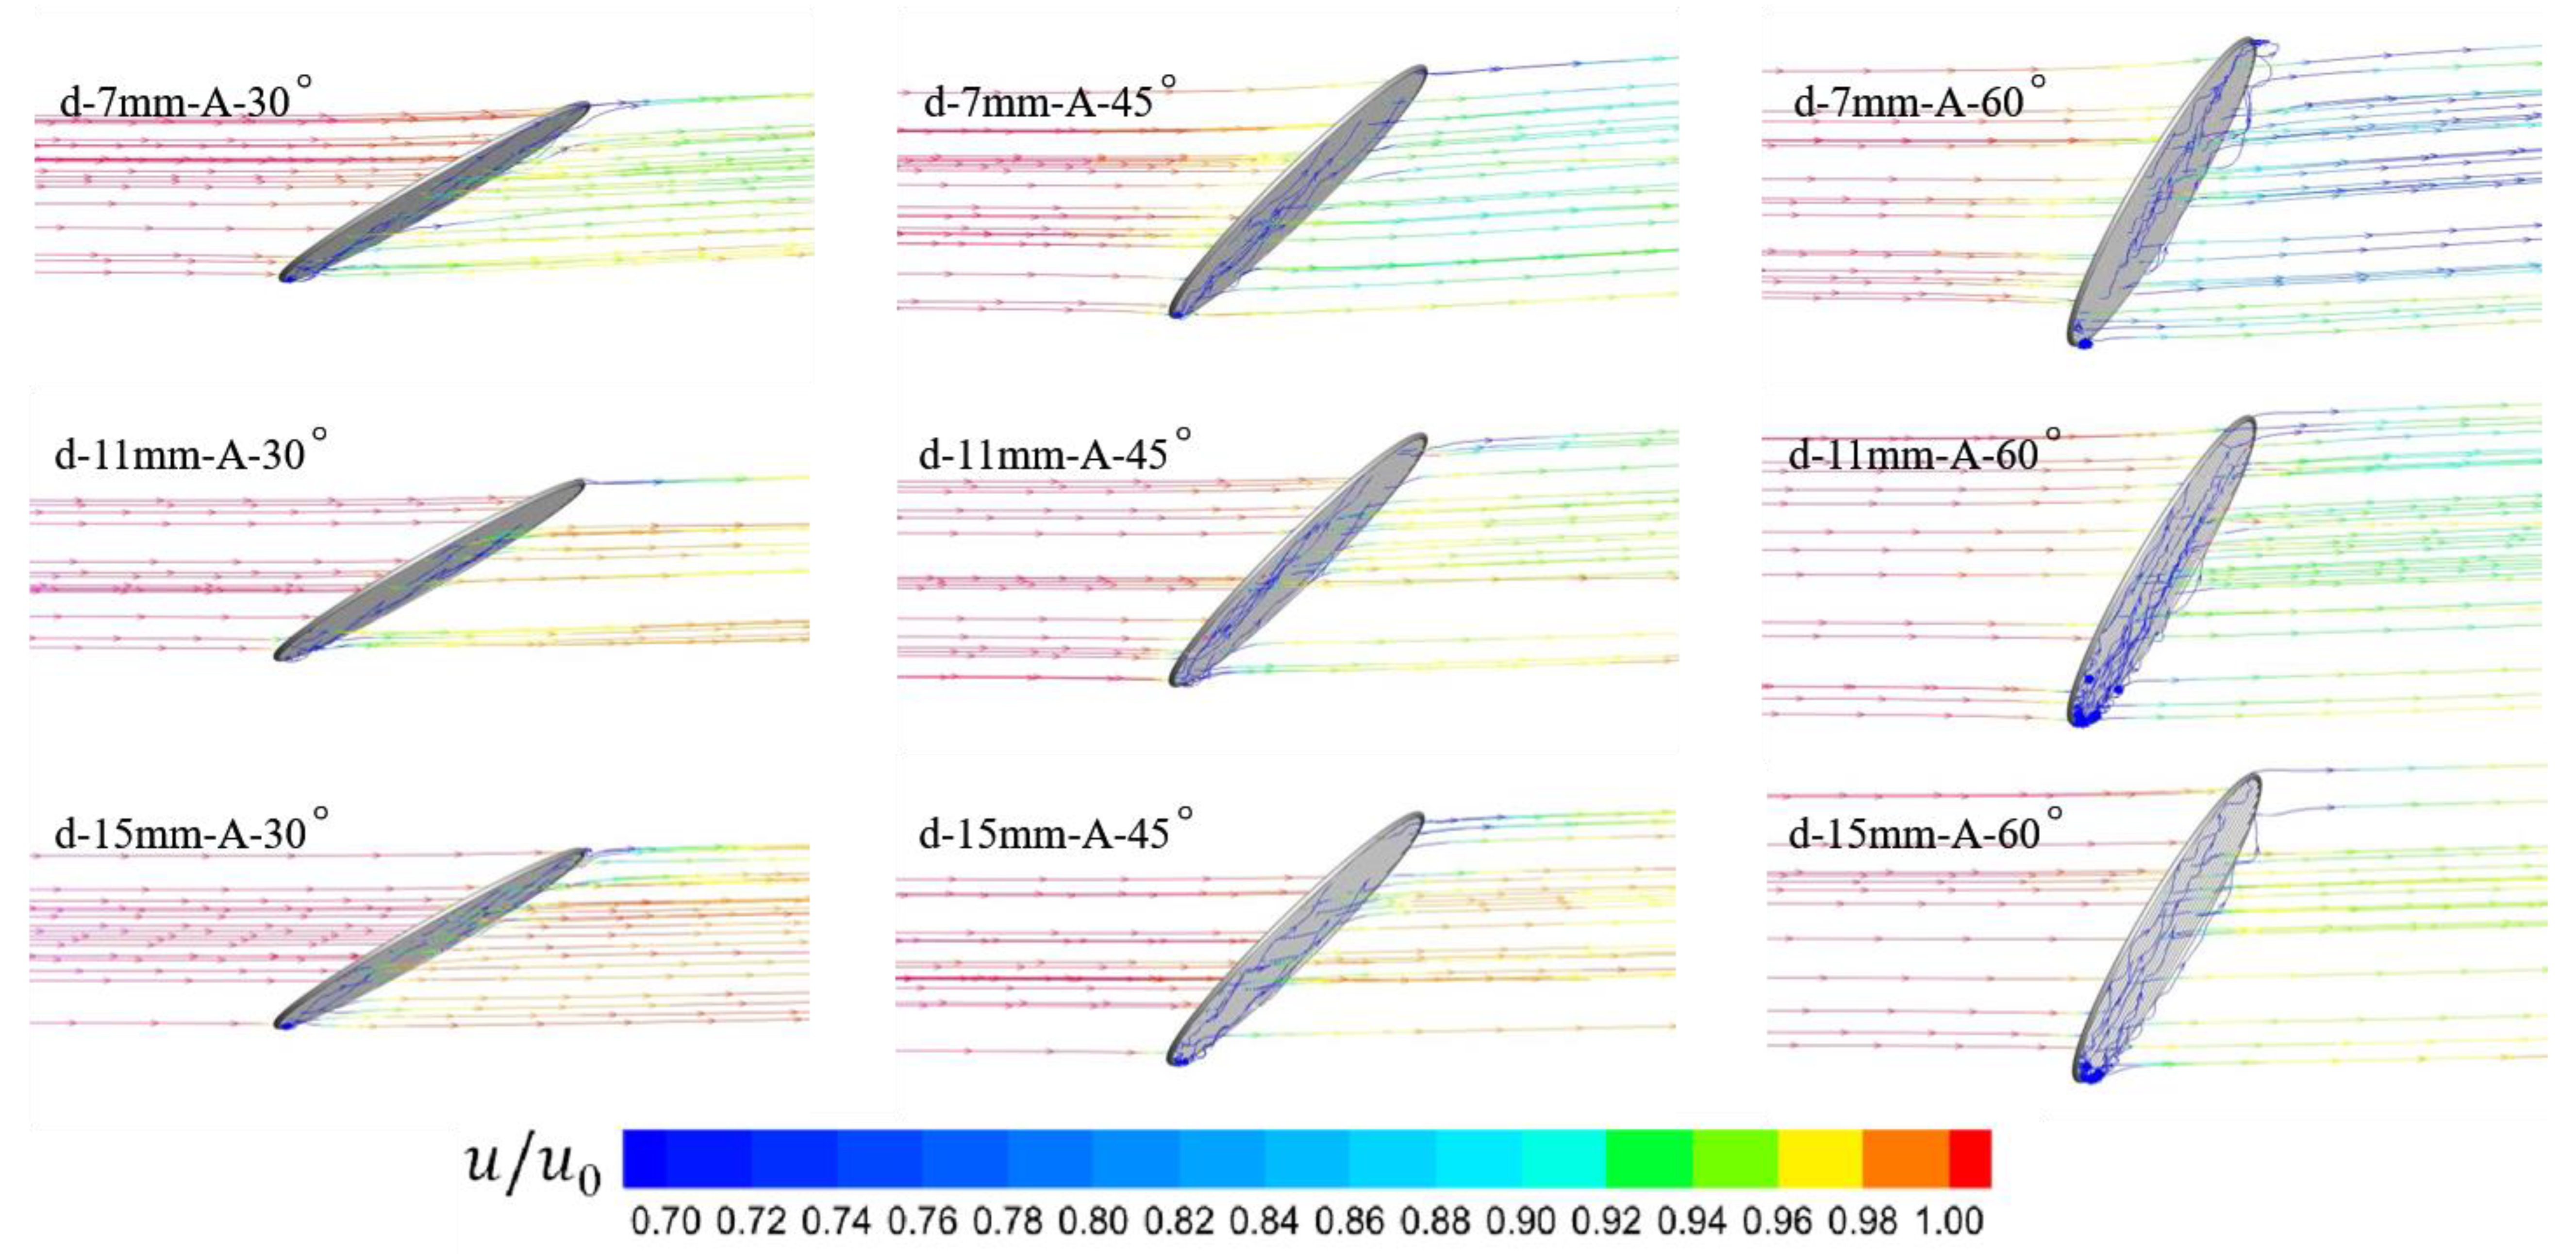
3.5. The Influence of Tilt Angle on the Flow Field Distribution around the Grid

The outcomes concerning the flow distribution around the circular grid reveal the emergence of turbulent flow patterns both upstream and downstream, suggesting of the development of a turbulent boundary layer. The observations indicate a minor region upstream of the circular grid where the flow velocity experiences a reduction. In contrast, a more substantial area characterized by diminished flow velocities is identified downstream, forming what is referred to as the wake region. In this wake region, the flow transitions to a turbulent boundary flow state (Figure 10). Notably, the velocity fields within this wake region display a notable sensitivity to both grid bar spacing and inclination grid angle. Specifically, the results manifest a substantial increase in velocity fields through the circular grid when employing a grid bar spacing of 15 mm, with a magnitude approximately 22% and 15% higher than grid bar spacings of 7 mm and 11 mm, respectively.
Furthermore, downstream flow velocities were quantified at approximately 0.46 m/s, 0.43 m/s, and 0.40 m/s for inclination angles of 30°, 45°, and 60°, respectively, using a grid bar spacing of 7 mm. Correspondingly, for 11 mm and 15 mm grid bar spacings, the downstream flow velocities registered were approximately 0.47 m/s, 0.45 m/s, and 0.44 m/s across the same inclination grid angles (Figure 9). Additionally, the velocity downstream of the circular grid at all grid bar spacings and inclination grid angles manages to recover around 80% of the incoming flow velocity. This restoration corresponds to the formation and progression of a turbulent boundary layer downstream of the codend wake. This transition is evident through the delineation of distinct layers (color gradations), with low flow velocity characterizing the vicinity of the downstream circular grid, gradually transforming into higher flow velocities as one moves away from the circular grid.
Figure 10 shows a visual representation of the 3D streamline flow surrounding the circular grid and provides insights into how these dynamics are affected by grid bar spacing and inclination grid angle. Discernible changes in streamline patterns emerge as a direct result of these variables. In the downstream region of the circular grid, remarkable phenomena like upwelling and eddy currents are observed to have a profound effect on the downstream turbulent flow pattern. Streamlines remain predominantly parallel when the inclination grid angle is set at 30°; however, for a grid bar spacing of 7 mm, certain streamlines exhibit oscillatory motions alternating between downward and upward around the circular grid structure. In addition, the intensification of wake effects with increasing inclination grid angles increases the occurrence of eddy currents downstream near the circular grid.
Figure 11 provides a visual representation of the 3D streamline flow surrounding the circular grid, offering insights into how these dynamics are shaped by grid bar spacing and inclination grid angle. Particularly, discernible alterations in streamline patterns manifest as a direct consequence of these variables. In the downstream region of the circular grid, noteworthy phenomena like upwelling and eddy currents are evident, exerting a profound influence on the progression of turbulent flow downstream. Streamlines remain predominantly parallel when the inclination grid angle is set at 30°; however, for a grid bar spacing of 7 mm, certain streamlines manifest oscillatory motions—alternating between descending and ascending around the circular grid structure. Furthermore, the intensification of wake effects with increased inclination grid angles accentuates the prominence of eddy currents proximate to the circular grid downstream.

4. Discussion

The investigation of grid-type bycatch reduction devices has gained paramount importance within contemporary scientific research. Ongoing studies in this field prioritize the development of lighter materials and endeavor to minimize the loss of targeted catches by optimizing their hydrodynamic performances. The inclination grid angle and grid bar spacings, serving as pivotal parameters, hold significant sway over the intensity of water flow. An emerging focus centers on assessing the energy consumption of these devices and the types of catches they yield. Consequently, understanding the intricate hydrodynamic forces at play within grid-type bycatch reduction devices, despite their complexity, stands as a foundational requirement to enhance comprehension and enhance the energy efficiency of both the BRD and codend system.
Moreover, the investigation unveils that the flow velocity at the circular grid’s center point, alongside the flow velocity’s dissipation along the flow direction, wields substantial influence over gear selectivity and fish behavior. This study effectively underscores that the primary factors dictating the hydrodynamic performance of the grid-type bycatch reduction device and the resultant development of turbulent flow patterns encompass inclination grid angles and grid bar spacings. These collective efforts are paramount in advancing the refinement and optimization of grid-type bycatch reduction devices. Ultimately, such advancements hold the potential to elevate their efficacy in terms of selectivity and contribute to the promotion of sustainable fishing practices.
The BRD is an essential component of the trawl codend system, which can easily allow the escape of unwanted fish and juvenile fish, which improves trawl selectivity. As emphasized earlier, the hydrodynamic performance of the BRD significantly influences the fish selection and the overall efficacy of the codend system [27,28]. In contrast to the study of Earyrs et al. [8], the present study and the previous study done by Araya-Schmidt et al. [29] showed reducing the grid bar spacings from 15 to 11 and 7 mm in the flume tank significantly increased the hydrodynamic performance of the BRD of the codend-BRD system and decreased the velocity deficit downstream to the BRD, which will reduce juvenile bycatch while maintaining a marine ecosystem. Indeed, this study demonstrated that the increase in grid angle and the decrease in bar spacing led to an increase in drag force of 12.19% and 25%, respectively. This phenomenon can be attributed to the alteration of water flow dynamics resulting from an expanded solid area (comprising grid bar spacing and inclination grid angle). This, in turn, redirects the water flow pattern, increasing the deflected flow and decreasing the flow traversing through the grid [14,27]. T When grid bar spacing is increases from 7 mm to 11 mm and 15 mm, velocity reduction registers at a minor 6.1% and 4.8%, respectively, for an inclination grid angle of 30°.
Conversely, an increase in inclination grid angle from 30° to 45° and 60° results in maximum velocity reductions of 12.6% and 8.6%, respectively, behind a circular grid when the grid bar spacing is widened from 7 mm to 11 mm and 15 mm. These observations deviate from experimental findings in the flume tank and camera observations conducted by Araya-Schmidt et al. [27,30], potentially attributed to variations in grid design and testing conditions. Echoing the hypothesis of Hickey et al. [31], the present study confirms that greater inclination grid angles yield increased flow velocity reductions behind the grid. This configuration prominently enhances the escape of non-target and juvenile fish, distinct from the outcomes associated with higher inclination grid angles. As a result, the study recommends the adoption of grid bar spacing of 11 mm alongside an inclination grid angle of 45° to achieve an optimized codend and grid-type bycatch reduction device.
The exploration of the difference between numerical simulation and physical model test results in this study is essential to comprehending the intricate hydrodynamic characteristics of grid-type bycatch reduction devices. As research advances, there is potential for further optimization and refinement of these devices, ultimately culminating in heightened operational efficiency and refined selective capabilities in practical fishing scenarios. In the numerical simulation results of the grid, discernible flow velocity attenuation zones are observed at both the front and rear ends of the grid, with the size of these attenuation zones varying with changes in the inclination grid angle and grid bar spacing. Along the incoming flow direction, the flow velocity begins to decrease in front of the grid, and the most substantial attenuation area is observed when the grid angle is 60°. Undoubtedly, the flow attenuation zone in front of the grid significantly impacts the behavior of fish. Indeed, the fact that the flow velocity in front of the grid was shallow when the grid bar spacing was lower, and the inclination angle was greater generated the greater unsteady turbulent flow downstream to the grid, probably the vortex shedding. The creation of this vortex shedding will affect the fish’s swimming and trajectory, resulting in a decrease in juvenile fish escape. Thus, using a greater inclination angle, such as 60°, and lower grid bar spacing, such as 7 mm, will hurt the fish’s behavior and will not solve the gear’s selectivity problem, which is an objective of using BRD.
The grid model is simplified to facilitate analysis and presents itself as an array of parallel cylinders. The presence of viscous forces causes the flow to detach on either side of the cylinder as it traverses it, eventually leading to alternating vortex shedding downstream of the cylinder. This dynamic leads to periodic variations in the force exerted on the cylinder. Empirical studies have confirmed that the drag of the grid is also subject to frequent fluctuations [32]. Understanding the intricate flow processes surrounding the grid profoundly accelerates our understanding of the intricate hydrodynamic interactions that transpire within grid-type bycatch reduction devices.
The inclination grid angle holds pivotal significance in enabling the practical functionality of the bycatch reduction device. Examining the correlation between the inclination grid angle and water flow velocity distinctly illustrates that an increased inclination grid angle leads to heightened acceleration within the flow field between the grid bars. Conversely, a reduced inclination grid angle yields diminished acceleration within the flow field. This observation resonates with the findings by Grimaldo [9], which assert that a more extensive grid angle corresponds to swifter water flow through the grid, augmenting the likelihood of fishing individuals being carried along with the flow and vice versa. Furthermore, a larger inclination grid angle engenders a shorter contact duration between the catch and the selective device in practical applications. This facilitates the passage of non-target species through the grid.
Conversely, a smaller inclination grid angle retards the pace at which catches traverse the grid, thereby extending the duration and probability of target fish swimming out through the escape window. Research conducted by Lsaksen et al. [33] aligns with this notion, suggesting that the grid angle of the grid-type bycatch reduction device, suited for fish and shrimp separation, should ideally fall within the range of 40° to 48° due to its superior separation efficiency. Comprehending the implications of the grid angle on water flow and separation efficiency stands as a pivotal factor in the pragmatic implementation of grid. Such understanding empowers the optimization of grid parameters to achieve maximal efficacy and sustainability in bycatch reduction within fisheries operations.
The findings of this study align with the outcomes observed by Zhang Jian [15] concerning the relationship between grid bar spacing and flow velocity. The trend indicates that smaller grid bar spacing corresponds to higher flow velocity between the bars, while more considerable grid bar spacing results in diminished flow velocity between bars. However, it’s crucial to note that in a grid-type bycatch reduction device tailored for fish and shrimp separation, excessive grid spacing could compromise its efficacy in segregating fish and shrimp. This scenario might allow more non-target fish species to traverse the grid, leading to heightened bycatch. Maintaining a constant grid angle while reducing bar spacing accelerates the flow velocity within the bar centers. This phenomenon is rooted in the continuity equation (law of conservation of mass), denoted as ρSV = constant, which dictates that the flow rate escalates as the cross-sectional area decreases.
Conversely, when the grid bar spacing is held constant, increasing the inclination grid angle augments the flow-receiving area of the grid. Consequently, this adds to the resistance against water flow, leading to an augmented pressure differential between the front and back facets of the grid. As a result, the flow velocity amplifies within the center of the grid [32]. Moreover, the hydrodynamic characteristics encompassing the grids significantly influence fish behavior. Enhancing water flow can effectively mitigate catch loss [15]. These insights underscore the necessity for meticulously considering grid bar spacing and inclination grid angle when devising and implementing grid-type bycatch reduction devices. Such consideration is essential for maximizing hydrodynamic efficiency, augmenting fish and shrimp separation effectiveness, and curtailing bycatch in fishing operations. Although the presence of BRD in the trawl codend allows an increase in the selectivity performance of the trawl net, the study of the flow field around the BRD showed that the unsteady turbulent flow developing around the circular grid greatly impacted the fish movement, thus affecting fish behavior and trawl selectivity, as we mentioned above. Indeed, it was demonstrated in this study that the more the inclination grid angle increased and the grid bar spacing decreased, the more the flow velocity deficit in the wake region downstream from the grid was significant. These more significant flow velocity deficits generated a greater unsteady turbulent flow around the circular in these conditions. This unsteady turbulent flow will deviate the fish trajectory in the trawl codend and drag the juvenile fish into the trawl codend, as evoked by Kim [34] and Thierry et al. [35]. To improve the Trawl selectivity and reduce the targeting of bycatch and juvenile fishes, it is recommended to use greater grid bar spacing and a lower inclination grid angle.

5. Conclusions

This study assessed the effect of grid bar spacing and inclination grid angle on the hydrodynamic characteristics and flow field around the circular grid structures For BRD by CFD simulation and physical experiment in the flume tank. The SST k-ω turbulence model simulates the flow field around different circular grids. The results show that:
(1)
The drag forces of the circular increased with increasing inclination grid angle and decreased with increasing grid bar spacing. Therefore, circular grids with lower inclination grid angles and greater grid bar spacings could yield a lower drag and improve the selectivity of the trawl net;
(2)
The drag forces obtained from the numerical simulation were consistent with experimental results, indicating that this CFD method is suitable to simulate the flow field around the BRD;
(3)
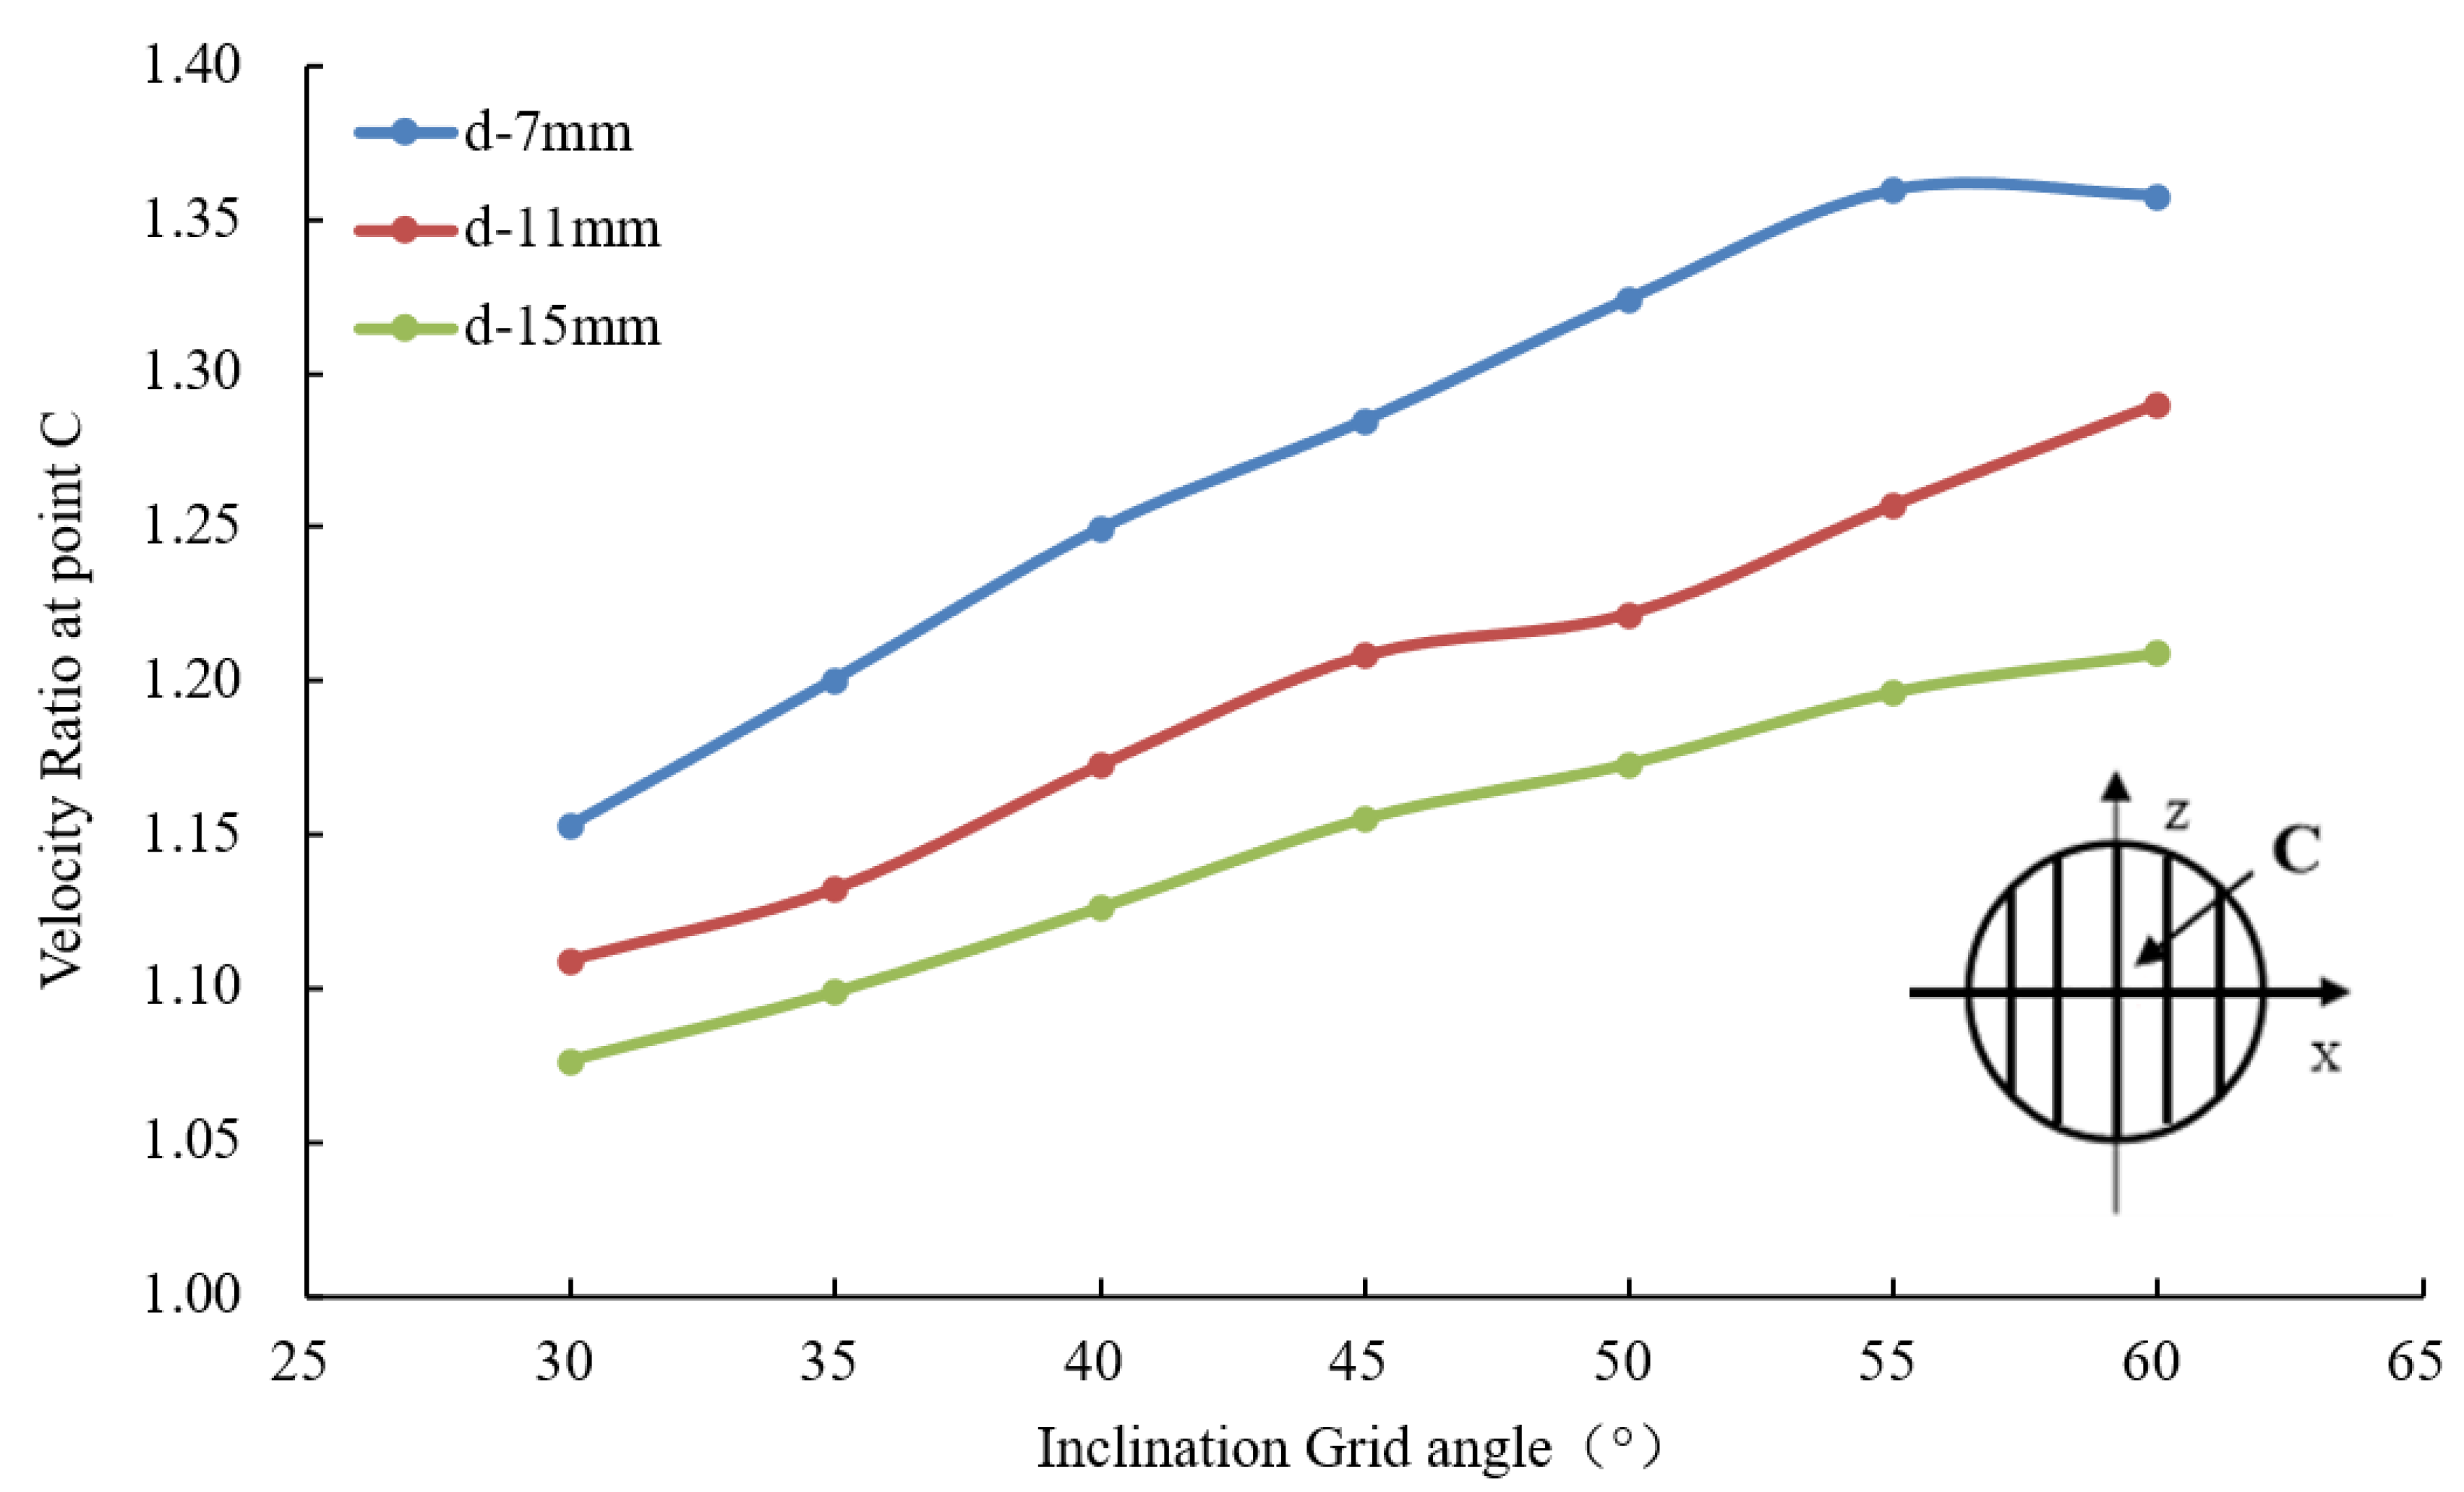
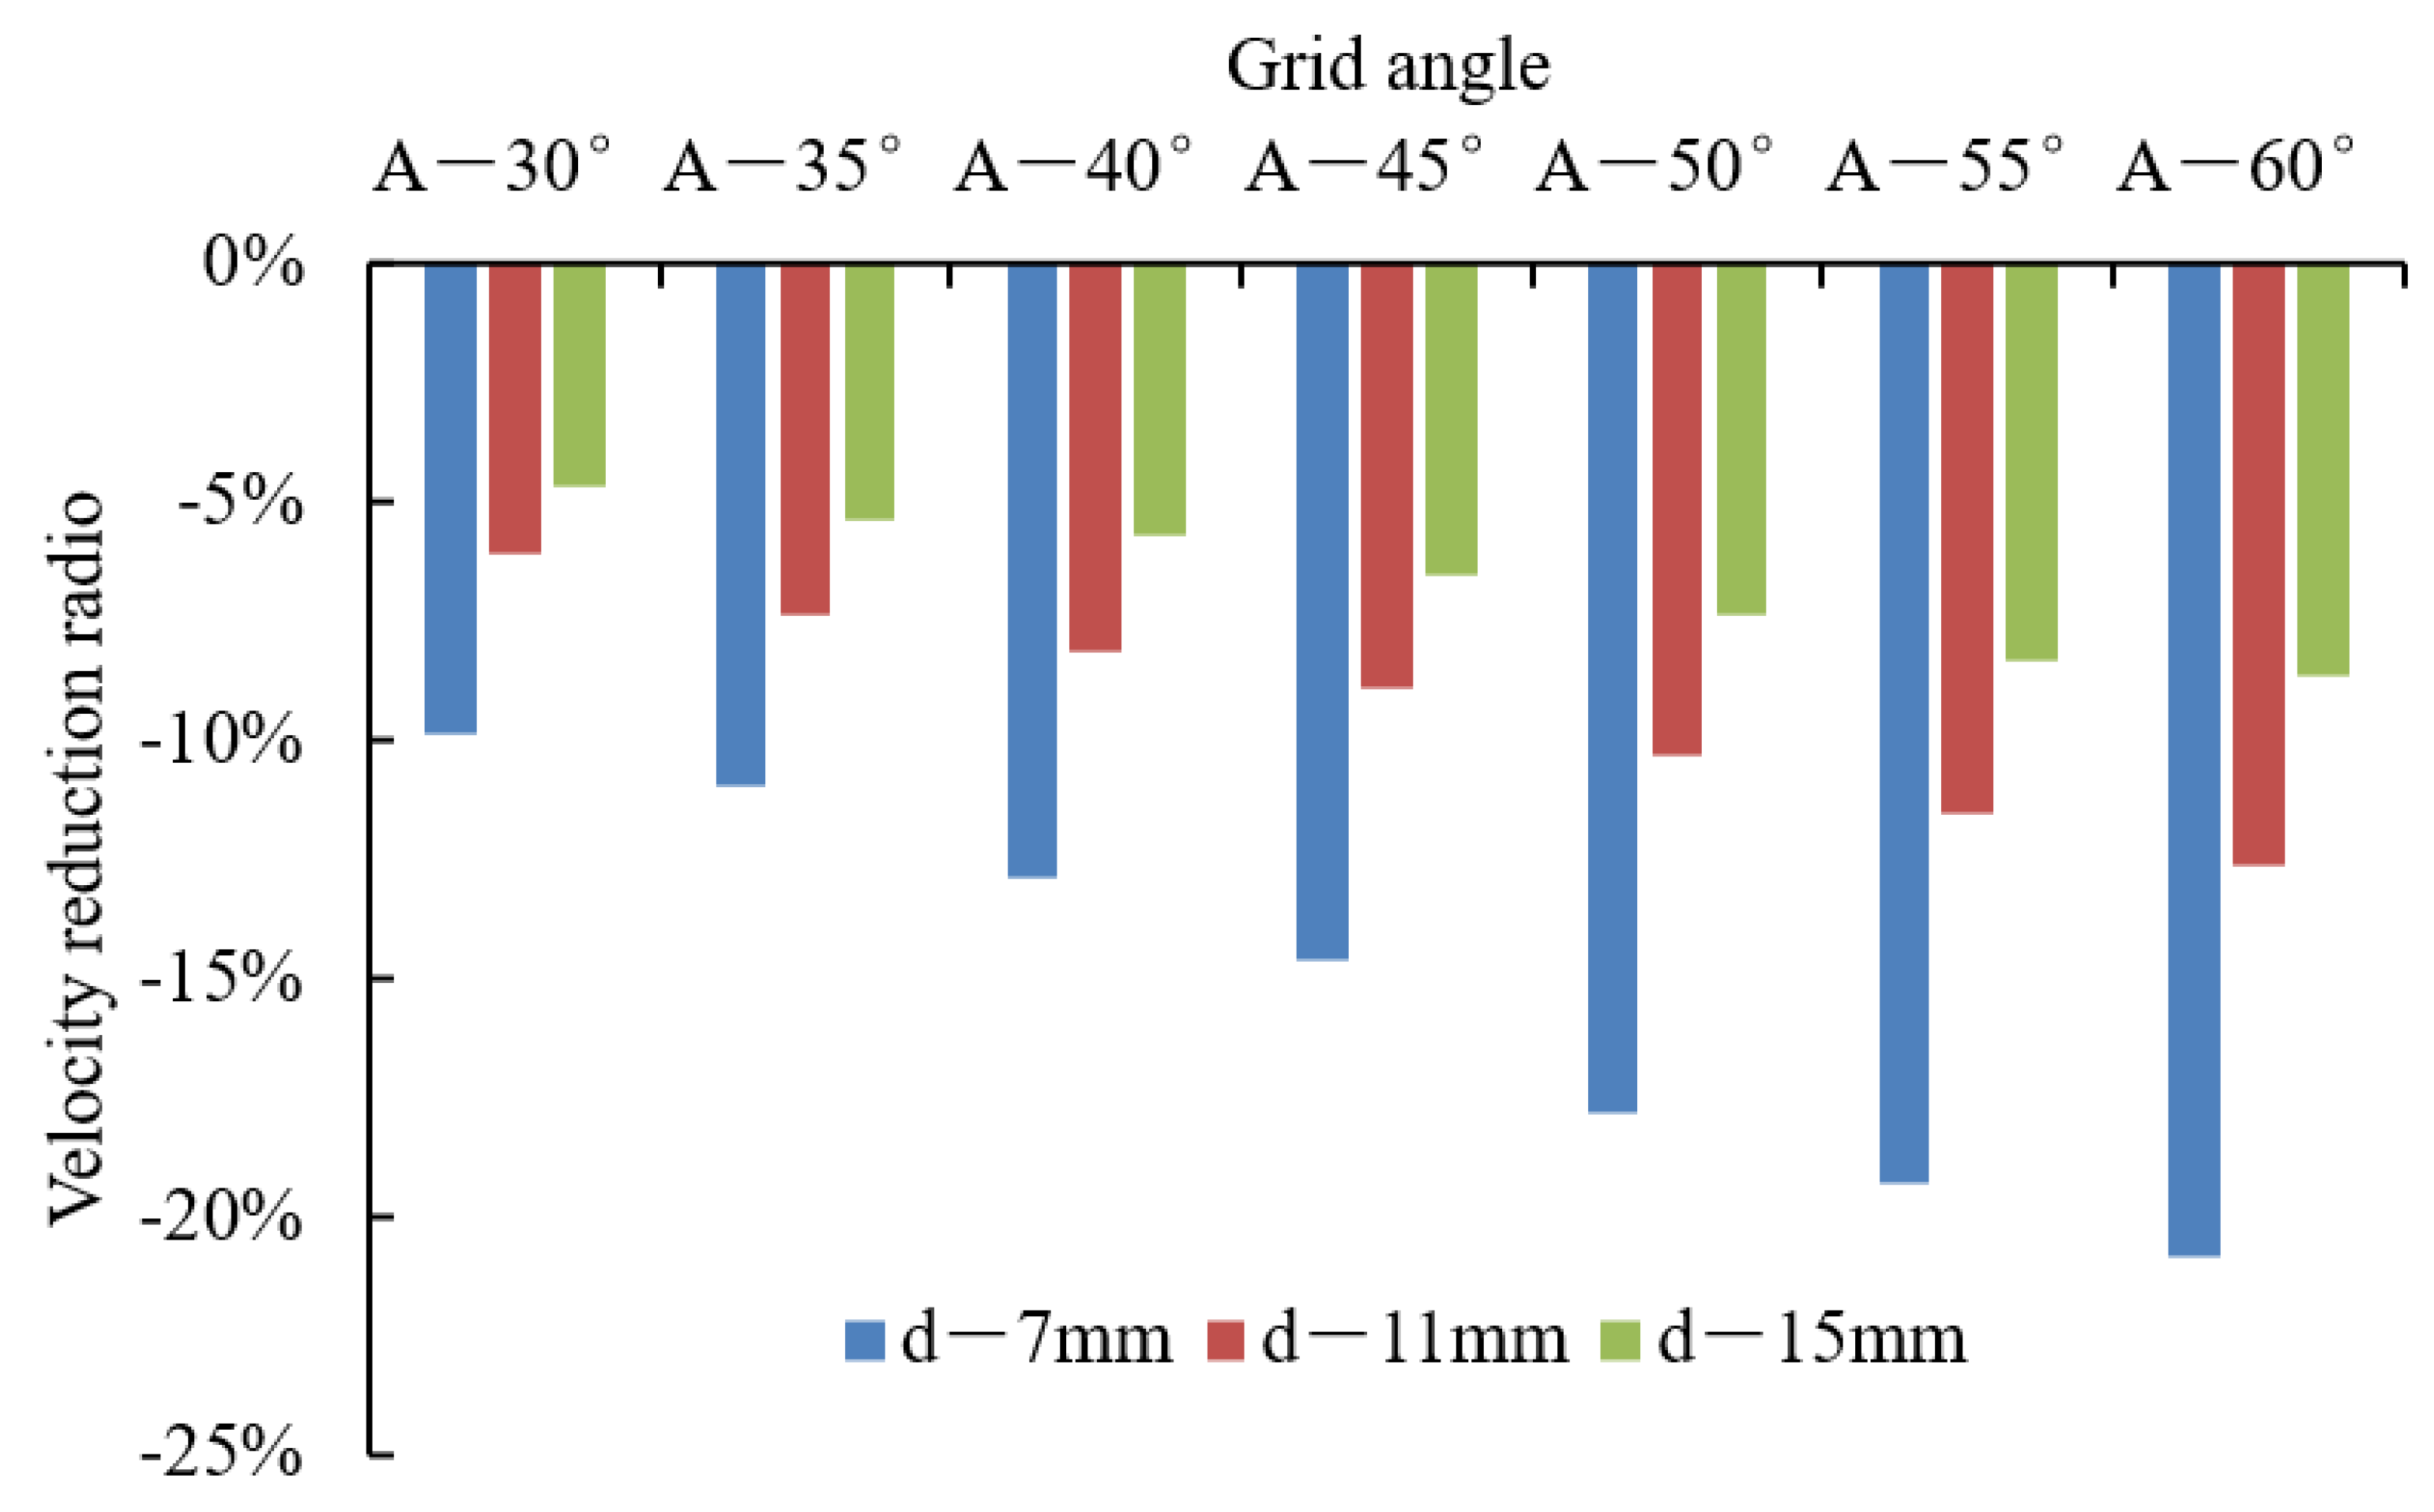
The flow velocity reduction downstream to the circular flow in the wake region differed significantly depending on the grid bar spacing and grid inclination angle. However, the velocity ratio in the wake region of the circular flow increased with increasing bar spacing and decreasing inclination grid angle;
(4)
The results of this study can be used to improve and optimize the design of the combined codend–BRD system, which has a great impact on how the fish move, which, in turn, has an impact on gear selectivity.

Author Contributions

Methodology, C.Z.; Investigation, C.Z., H.T., M.Z., F.Z. and. C.S.; Resources, C.Z. and L.Y.; Data curation, C.Z. and L.Y. Writing—original draft, C.Z. and H.T.; Writing—review & editing, N.N.B.T., L.X. and F.H. All authors have read and agreed to the published version of the manuscript.

Funding

This study was financially sponsored by the National Natural Science Foundation of China (grant no. 32373187) and the Natural Science Foundation of Shanghai (no. 23ZR1427000).

Institutional Review Board Statement

Not applicable.

Informed Consent Statement

Not applicable.

Data Availability Statement

The data that support the fundings of this study are available from the corresponding author upon reasonable request.

Conflicts of Interest

The authors declare no conflict of interest. The funders had no role in the design of the study; in the collection, analyses, or interpretation of data; in the writing of the manuscript; or in the decision to publish the results.

References

  1. Chen, X.X.; Huang, H.L.; Chen, X.Z. Research progress on by-catch reduction in the trawl fishery abroad. Mar. Fish. 2007, 8, 263–270. [Google Scholar] [CrossRef]
  2. Broadhurst, M.K.; Larsen, R.B.; Kennelly, S.J.; McShane, P. Use and success of composite square-mesh codends in reducing bycatch and in improving size-selectivity of prawns in Gulf St. Vincent, South Australia. Fish. Bull. 1999, 97, 434–448. Available online: https://spo.nmfs.noaa.gov/sites/default/files/03broadh.pdf (accessed on 1 June 2022).
  3. Broadhurst, M.K.; Millar, R.B.; Wooden, M.E.L.; Macbeth, W.G. Optimising codend configuration in a multispecies demersal trawl fishery. Fish. Manag. Ecol. 2006, 13, 81–92. [Google Scholar] [CrossRef]
  4. Grimaldo, E.; Brinkhof, J.; Herrmann, B.; Macbeth, W.G. Improved bycatch reduction in the mixed demersal trawl fishery for Norway pout (Trisopterus esmarkii). Estuar. Coast. Shelf Sci. 2023, 281, 108189. [Google Scholar] [CrossRef]
  5. Herrmann, B.; Sistiaga, M.; Larsen, R.B.; Nielsen, K.N.; Grimaldo, E. Understanding sorting grid and codend size selectivity of Greenland halibut (Reinhardtius hippoglossoides). Fish. Res. 2013, 146, 59–73. [Google Scholar] [CrossRef]
  6. Fan, W.; Sun, M.C. Experimental Studies on the Separation of Shrimp from Fish in Beam Trawling. Mar. Fish. 2000, 4, 106–109. [Google Scholar] [CrossRef]
  7. Wan, R.; Jia, M.X.; Guan, Q.L.; Huang, L.; Cheng, H.; Zhao, F.; He, P.; Hu, F. Hydrodynamic performance of a newly-designed Antarctic krill trawl using numerical simulation and physical modeling methods. Ocean Eng. 2019, 179, 173–179. [Google Scholar] [CrossRef]
  8. Eayrs, S. A Guide to Bycatch Reduction in Tropical Shrimp-Trawl Fisheries; Food and Agricultural Organization of the United Nations: Rome, Italy, 2007; pp. 10–25. ISBN 978-925-105-674-5. [Google Scholar]
  9. Grimaldo, E. The effects of grid angle on a modified Nordmore-grid in the Nordic Shrimp Fishery. Fish. Res. 2006, 77, 53–59. [Google Scholar] [CrossRef]
  10. Grimaldo, E.; Sistiaga, M.; Herrmann, B.; Cerbule, K.; Grimsmo, L.; Pettersen, H. Trawl Selectivity in the Barents Sea Demersal Fishery. In Fisheries and Aquaculture in the Modern World; Elsevier: Amsterdam, The Netherlands, 2016. [Google Scholar] [CrossRef]
  11. Grimaldo, E.; Larsen, R.B. The cosmos grid: A new design for reducing by-catch in the Nordic shrimp fishery. Fish. Res. 2005, 76, 187–197. [Google Scholar] [CrossRef]
  12. Feng, C.L.; Huang, H.L.; Chen, X.Z. Significance analysis on the main parameters of single boat mid-water trawl. Mar. Fish. 2007, 5, 8–12. [Google Scholar] [CrossRef]
  13. Feng, C.L.; Xu, G.D.; Huang, H.L.; Zhang, X.; Li, L.Z.; Zhang, Y.; Chen, X.Z. Efficiency analysis on the circular separator device for shrimp beam trawl. Mar. Fish. 2011, 33, 91–98. (In Chinese) [Google Scholar] [CrossRef]
  14. Veiga-Malta, T.; Breddermann, K.; Feekings, J.P.; Krag, L.; Paschen, M. Understanding the hydrodynamics of a size sorting grid in a crustacean fishery. Ocean Eng. 2020, 198, 106961. [Google Scholar] [CrossRef]
  15. Zhang, J.; Shi, J.G.; Zhang, P.; Sun, M.C.; Qian, W.G. Separating performance for shrimps of sorting grid rigged in beam trawls. J. Shanghai Ocean Univ. 2008, 17, 726–733. (In Chinese) [Google Scholar]
  16. Riedel, R.; DeAlteris, J. Factors affecting hydrodynamic performance of the Nordmøre Grate System: A bycatch reduction device used in the Gulf of Maine shrimp fishery. Fish. Res. 1995, 24, 181–198. [Google Scholar] [CrossRef]
  17. Rangaraju, P.R.; Olek, J.; Diamond, S. An investigation into the influence of inter-aggregate spacing and the extent of the ITZ on properties of Portland cement concretes. Cem. Concr. Res. 2010, 40, 1601–1608. [Google Scholar] [CrossRef]
  18. Cha, B.-J.; Cho, S.-K.; Ahn, H.-C.; Kim, I.-O.; Craig, R. Development of a bycatch reduction device (BRD) for shrimp beam trawl using flexible materials. Iran. J. Fish. Sci. 2012, 11, 89–104. [Google Scholar] [CrossRef]
  19. Bi, C.W.; Zhao, Y.P.; Dong, G.H.; Xu, T.-J.; Gui, F.-K. Experimental investigation of the reduction in flow velocity downstream from a fishing net. Aquac. Eng. 2013, 57, 71–81. [Google Scholar] [CrossRef]
  20. Bi, C.W.; Zhao, Y.P.; Dong, G.H.; Xu, T.-J.; Gui, F.-K. Numerical simulation of the interaction between flow and flexible nets. J. Fluids Struct. 2014, 45, 180–201. [Google Scholar] [CrossRef]
  21. Tu, G.; Liu, H.; Ru, Z.; Shao, D.; Yang, W.; Sun, T.; Wang, H.; Gao, Y. Numerical analysis of the flows around fishing plane nets using the lattice Boltzmann method. Ocean Eng. 2020, 214, 107623. [Google Scholar] [CrossRef]
  22. Yao, H.; Cao, L.; Wu, D.; Gao, Y.; Qin, S.; Yu, F. PIV study on grid-generated turbulence in a free surface flow. Water 2021, 13, 909. [Google Scholar] [CrossRef]
  23. Nsangue, B.T.N.; Tang, H.; Xu, L.; Hu, F.; Dong, S.; Achille, N.P.; Zou, B. Comparison between physical model testing and numerical simulation using two-way fluid-structure interaction approach of new trawl design for coastal bottom trawl net. Ocean Eng. 2021, 233, 109112. [Google Scholar] [CrossRef]
  24. Wang, G.; Cui, Y.; Guan, C.; Gong, P.; Wan, R. Effects of Inclination Angles on the Hydrodynamics of Knotless Net Panels in Currents. J. Mar. Sci. Eng. 2023, 11, 1148. [Google Scholar] [CrossRef]
  25. Hu, F.; Oozeki, Y.; Tokai, T.; Matuda, K. Scale model of a new midwater trawl system for sampling pelagic larval and juvenile fish. Fish. Sci. 2001, 67, 254–259. [Google Scholar] [CrossRef]
  26. Menter, F.R. Two-equation eddy-viscosity turbulence models for engineering applications. AIAA J. 1994, 32, 1598–1605. [Google Scholar] [CrossRef]
  27. Araya-Schmidt, T.; Bayse, S.; Winger, P.; Frank, C.H. Smaller bar spacings in a Nordmøre grid reduces the bycatch of redfish (Sebastes spp.) in the offshore Northern shrimp (Pandalus borealis) fishery of eastern Canada. Aquac. Fish. 2023, 8, 661–671. [Google Scholar] [CrossRef]
  28. Winger, P.; Eayrs, S.; Glass, C. Fish Behavior Near Bottom Trawls; John Wiley & Sons, Inc.: Hoboken, NJ, USA, 2010; pp. 65–103. ISBN 978-081-381-536-7. [Google Scholar]
  29. Araya-Schmidt, T.; Bayse, S.M.; Winger, P.D.; Santos, M.R. Juvenile redfish (Sebastes spp.) behavior in response to Nordmøre grid systems in the offshore northern shrimp (Pandalus borealis) fishery of Eastern Canada. Front. Mar. Sci. 2022, 9, 920429. [Google Scholar] [CrossRef]
  30. Araya-Schmidt, T.; Legge, G.; Santos, M.; Frank, C.H. Flume Tank Testing of an Innovative Footgear Technology Using Simulated Seabeds. J. Ocean Technol. 2021, 16, 2. Available online: https://www.researchgate.net/publication/352374638 (accessed on 1 June 2021).
  31. Hickey, W.M.; Brothers, G.; Boulos, D.L. Bycatch reduction in the Northern shrimp fishery. Can. Tech. Rep. Fish. Aquat. Sci. 1993, 1964, 41. [Google Scholar] [CrossRef]
  32. Thierry, B.N.N.; Tang, H.; Xu, L.X.; You, X.; Hu, F.; Achile, N.P.; Kindong, R. Hydrodynamic performance of bottom trawls with different materials, mesh sizes, and twine thicknesses. Fish. Res. 2020, 221, 105403. [Google Scholar] [CrossRef]
  33. Isaksen, B.; Valdemarsen, J.W.; Larsen, R.B.; Karlsen, L. Reduction of fish by-catch in shrimp trawl using a rigid separator grid in the aft belly. Fish. Res. 1992, 13, 335–352. [Google Scholar] [CrossRef]
  34. Kim, H.Y. Analysis of the turbulent flow and tilt in the cod-end of a bottom trawl during fishing operations. Ocean Eng. 2013, 64, 100–108. [Google Scholar] [CrossRef]
  35. Thierry, N.N.B.; Tang, H.; Xu, L.; Hu, F.; You, X.; David, M.A.; Achille, N.P. Identifying the turbulent flow developing in-side and around the bottom trawl by Electromagnetic Current Velocity Meter approach in the flume tank. J. Hydrodyn. 2021, 33, 636–656. [Google Scholar] [CrossRef]
Figure 1. Schematic diagram of model grid.
Jmse 11 01966 g001
Figure 2. The set-up of the flume tank experiment: (a) schematic diagram of the experimental set-up; and (b) schematic diagram of the rigid frame.
Jmse 11 01966 g002
Figure 3. Circular grid model in the flume tank of the NERCOF.
Jmse 11 01966 g003
Figure 4. Mesh distribution in the numerical simulation of a grid.
Jmse 11 01966 g004
Figure 5. (ac) Drag variation of grids with different bar spacing at different flow velocities and angles: (a) for 7 mm bar spacing, (b) for 11 mm bar spacing, and (c) for 15 mm bar spacing.
Jmse 11 01966 g005
Figure 6. Comparison of drag force between the numerical simulation and the physical test of the grid when perpendicular to the water flow.
Jmse 11 01966 g006
Figure 7. Velocity field at point C of the grid at different grid angles and grid bar spacings.
Jmse 11 01966 g007
Figure 8. X-axis velocity distribution in the center of the grid.
Jmse 11 01966 g008
Figure 9. Velocity reduction radio under different grid angles and bar spacings.
Jmse 11 01966 g009
Figure 10. Velocity distribution with different grid angles and bar spacings.
Jmse 11 01966 g010
Figure 11. Streamlines of grid with different grid angles and bar spacings.
Jmse 11 01966 g011
Table 1. Cross flow past the circular grid with different grid resolution at incoming velocity 0.5 m/s and inclination angle of 60° and grid bar spacing of 7 mm.
CaseTotal ElementsFd(N)
Coarse1,997,9075.78
Medium3,782,3396.23
Fine7,104,8857.63
Finer8,851,0007.75
Experiment-7.49
Table 2. Corresponding Reynolds numbers at different flow velocities.
V (m/s) R e
0.51911.17
0.62293.4
0.72675.64
0.83057.87
0.93440.1
Disclaimer/Publisher’s Note: The statements, opinions and data contained in all publications are solely those of the individual author(s) and contributor(s) and not of MDPI and/or the editor(s). MDPI and/or the editor(s) disclaim responsibility for any injury to people or property resulting from any ideas, methods, instructions or products referred to in the content.

