Article

Experimental Parameters Influencing the Cavitation Noise of an Oscillating NACA0015 Hydrofoil

by
Leonie S. Föhring
1,2,*,
Peter Møller Juhl
3 and
Dietrich Wittekind
4
1
Faculty of Mechanical Engineering, Kiel University of Applied Sciences, Grenzstraße 3, 24149 Kiel, Germany
2
Faculty of Engineering, University of Southern Denmark, DK-5230 Odense, Denmark
3
Siemens Gamesa Renewable Energy, DK-7330 Brande, Denmark
4
DW-ShipConsult GmbH, 24223 Schwentinental, Germany
*
Author to whom correspondence should be addressed.
J. Mar. Sci. Eng. 2023, 11(10), 2023; https://doi.org/10.3390/jmse11102023
Submission received: 18 September 2023 / Revised: 13 October 2023 / Accepted: 16 October 2023 / Published: 20 October 2023

Abstract

:
The strong increase in anthropogenic underwater noise has caused a growing intention to design quieter ships given that ship propellers are one of the dominating noise sources along the worldwide shipping routes. This creates an imminent demand for deeper knowledge on the noise generation mechanisms of propeller cavitation. A cavitating, oscillating two-dimensional NACA0015 hydrofoil is analyzed with hydrophone and high-speed video recording as a simplified and manipulatable representative of a propeller blade in a ship’s wake field for the identification of major influencing parameters on the radiated noise. A pneumatic drive allows the application of asymmetrical temporal courses of the angle of attack, a novel amendment to the widely reported sinusoidal setups. Three different courses are tested with various cavitation numbers. The combination of a moderate angle increase and a rapid decrease is found to generate significantly higher pressure peaks compared to symmetrical angular courses. Considering that the rapid change of the angle of attack caused by the inhomogeneous wake field behind the hull is the core of the cavitation occurrence, the understanding of its influence may contribute to the design of quieter ships in the future while still allowing for the necessary high propeller efficiency.

1. Introduction

Facing a continuously rising noise level along the worldwide shipping routes [1,2] and its negative impact on the marine fauna [3,4,5], both concern and demand for counteraction have grown among the relevant authorities, shipping operators and designers. While sheet cavitation has clearly been identified as the most common and simultaneously the loudest type of cavitation and thus the major noise source of typical merchant ships [6], its mitigation remains difficult given the complexness of the propeller—hull interaction. Especially the lower frequency range below 250 Hz that is used by baleen whales [4] demands further efforts and thus more insight [7].
One aspect with significant influence on the noise level radiated by the cavitating propeller blades is the character of the wake field created by the blocking effect of the ship’s hull, especially the gradient of the axial isotachs around the so-called 12 o’clock position [8]. Together with the general, upwards-directed flow behind the midship section, it causes a major change of the inflow conditions experienced by the propeller blade on its way through the upper part of its circular path. Several methods have been proposed for the quality assessment and improvement of wake fields focusing on the severance of the axial velocity, initiated by Huse [9], elaborated by Odabaşi and Fitzsimmons [8] and more recently addressed by Fahrbach [10], Bugalski and Szantyr [11]. They agree that a steep gradient of the wake field contributes to higher radiated noise levels and pressure fluctuations on the hull. Another aspect is the propeller blade geometry, which also determines the temporal course of the angle of attack experienced by the respective part of the blade where cavitation occurs. Ji et al. [12], Maquil [13] showed that significant differences exist between propellers with small and large skew with regard to noise emissions.
In order to isolate individual effects of the noise generation mechanisms of propeller cavitation, oscillating two-dimensional hydrofoils have become widely acknowledged as simplified models for a propeller blade in varying inflow conditions [14]. Based on fundamental observations of flow pattern and cavitation distribution [15], several studies have been conducted focusing on the cavitation behaviour and the accompanying noise emissions [16,17]. They identify the collapse of the sheet cavitation as the cause for the highest pressure peaks, a result that corresponds with observations made on cavitating propellers in an inhomogeneous wake field [12,18]. Another aspect of interest in fundamental [19] and more recent studies [20,21,22] is the dependency of the cyclic cavitation behaviour on the forced oscillation frequency with regard to the also present natural shedding mechanisms. They report a so-called lock-in phenomenon causing the cavitation behavior to follow the hydrofoil movement within a certain frequency range. Below this range, the cavitation evolution is dominated by the natural shedding mechanisms as on fixed foils, whereas the cavitation cycle is prevented from its typical evolution if the hydrofoil oscillates too fast, implying a certain inertia of the process. While applying various foil types from the NACA series or flat plates, all these studies share a sinusoidal course of the angle of attack, except Zhang et al. [22], where a symmetrical, triangular course is applied as well, though at lower oscillation frequencies.
As the inflow conditions in an inhomogeneous wake field are not necessarily symmetrical with regard to the increasing and decreasing course of the angle of attack, the present study enhances the field of studies on oscillating cavitating hydrofoils by investigating the cavitation behavior and the noise emissions with three different triangular courses, i.e., equilateral like Zhang et al. [22] as well as saw-tooth shaped. They are applied with four different cavitation numbers and two different reduced oscillation frequencies. The detailed setup is described in Section 2. One key finding is the significantly increased sound pressure emitted by the cavitation created during a moderately increasing angle of attack combined with a rapid decrease causing the sheet cavitation to collapse violently. The results are outlined in Section 3 and interpreted in Section 4.

2. Materials and Methods

2.1. Nomenclature and Symbols

AoA  angle of attack [°]
c  chord length [m]
f *   reduced frequency of oscillation = f o s c · c / U
f o s c   absolute frequency of oscillation [Hz]
f p a s s   limiting frequency of the FIR filter pass band [Hz]
f s t o p   limiting frequency of the FIR filter stop band [Hz]
p ( t )   sound pressure, time dependent [Pa]
p 0   ambient pressure in cavitation tunnel [Pa]
p v   vapor pressure of water [Pa]
r  distance sound source—receiver [m]
U  flow velocity [m/s]
V ( t )   cavitation volume, time dependent [m 3 ]
δ p a s s   FIR filter attenuation in the pass band [dB]
δ s t o p   FIR filter attenuation in the stop band [dB]
Δ f   frequency resolution in sound pressure level spectra [Hz]
ρ   water density [kg/m 3 ]
σ   cavitation number = ( p 0 p v ) / ( 0.5 ρ U 2 )
𝆇  saw-tooth shaped course of AoA with a fast increase
 ∧  equilateral course of AoA
  saw-tooth shaped course of AoA with a fast decrease

2.2. Experimental Setup

The experiments were conducted in the cavitation tunnel of the Kiel University of Applied Sciences, shown in Figure 1. The tunnel (Kempf & Remmers, Hamburg, Germany) is a closed-circuit facility with a testing section of 1.5 × 0.3 × 0.3 m. Its three-bladed propeller indicated in Figure 1 provides flow velocities up to 8.0 m/s. The vacuum pump (Heraeus, Hanau, Germany) generates absolute pressures down to 10.3 kPa. A NACA0015 hydrofoil was chosen which has been reported in a large number of both experimental and numerical cavitation studies [23,24], oscillating as well as with fixed angles of attack (AoA). The hydrofoil with a chord length c of 200 mm is mounted vertically between the upper and lower walls of the testing section as shown in Figure 2, allowing only a minimum gap to ensure the unhampered oscillation movement around the axis at 0.25 c. Its tiller is moved by a pneumatic drive whose oscillation can be controlled by throttle valves in order to slow down either the increase or the decrease in the angle of attack. The pneumatic system operates at oscillation frequencies of 6.0 to 10.0 Hz.
The sound pressure in the testing section was measured by a hydrophone (M8Q-C-0-004, GeoSpectrum Technologies, Dartmouth, NS, Canada) mounted in a short circular tube attached to the bottom of the testing section upstream of the hydrofoil. The angular position of the hydrofoil, the ambient pressure at the vertical center of the testing section and the rotational speed of the tunnel propeller controlling the flow speed are recorded by a measurement computer (J.E.T Systemtechnik, Norderstedt, Germany) at a sampling rate of 10 kHz synchronized with the hydrophone. The water temperature was kept constant throughout the measurements as well as the gas content of the water. High-speed video recordings were taken from the suction side of the hydrofoil with a frame rate of 240 fr/s (Apple, Cupertino, US-CA). Thus, each oscillation cycle comprises approximately 31 frames (1080 × 1980 pixels). They were synchronized by a LED indicating the running measurement visible at the margin of the video frames. Each measurement lasted 5 s comprising approximately 38 oscillation cycles. This set-up allows a detailed investigation of the relationship between the synchronized dynamic behavior of cavitation bubbles and the associated sound pressure.
A matrix of operation points was set up comprising the cavitation number σ defined by Equation (1); the reduced oscillation frequency f * defined by Equation (2) as proposed by Franc and Michel [15], describing the ratio of the oscillation period and the passage duration of a particle along the foil length in order to detach the results from the actual foil size; and the temporal course of the angle of attack. Based on an equilateral triangular shape for the latter (denoted ∧), its course was modified towards a saw-tooth shape in both directions (denoted 𝆇 and ⩘ respectively), creating either a fast increase with a slow decrease in the angle of attack or vice versa. For all shapes, the angle of attack oscillated between 5 ° and 11 ° . The values for σ and f * as well as the approximate relative position of the angular maximum within one cycle are listed in Table 1. Note that the blade passing frequencies of slowly rotating ocean going ship propellers have the same order of magnitude, e.g., 0.2 in [25]. The Reynolds number based on the chord length c lies at approximately 8 ×   10 5 for all operation points.
σ = p 0 p v 0.5 ρ U 2
f = f o s c · c U
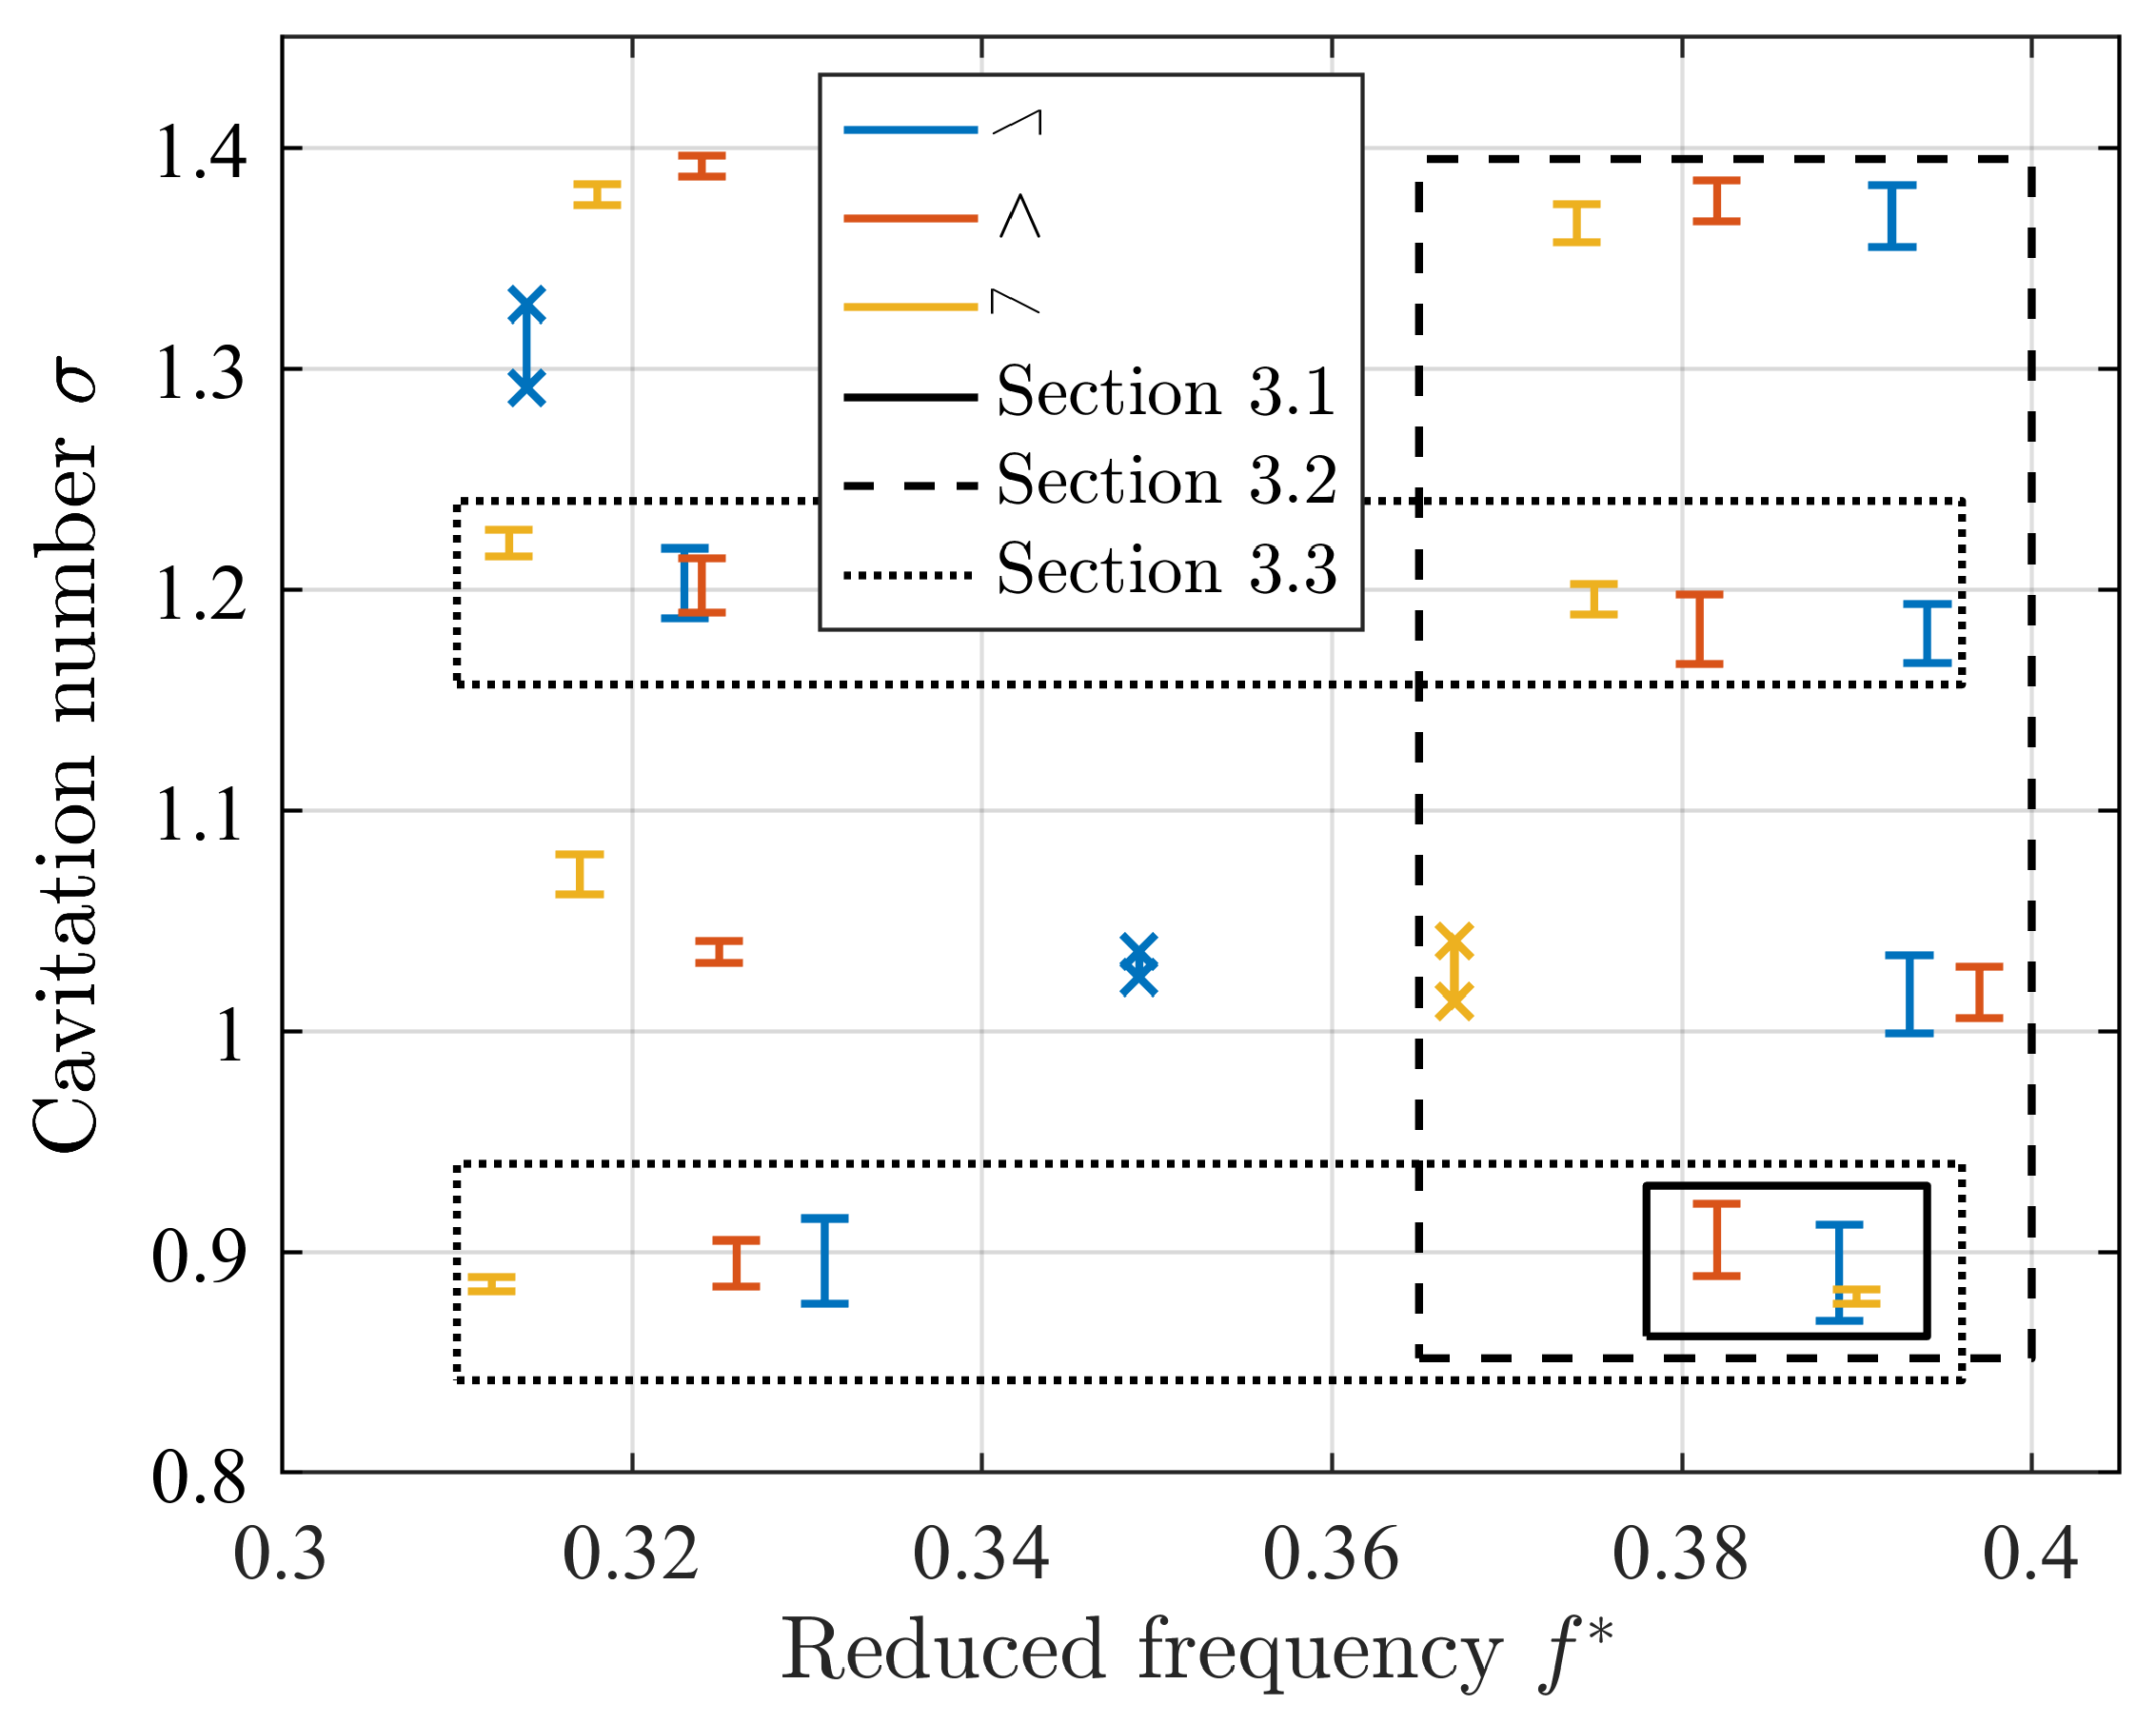
Within the unavoidable scattering of experimental setups, the data presented in the next section were chosen to provide as accurately comparable results as possible. Figure 3 gives an overview of the actual parameter ranges. While the oscillation frequency of the hydrofoil and the flow velocity are fixed for each measurement, the ambient pressure rises gradually during each measurement, because the vacuum pump was switched of to reduce background noise. This causes the displayed ranges of the cavitation number within each measurement. Variations of the reduced frequency are caused by limitations of reproducibility of the pneumatic oscillation frequency. Data taken into account in Section 3 are marked by boxes.

2.3. Post-Processing of Measurement Data

The post-processing of all measurement data was conducted in MATLAB® R2021b. The signal of the sound pressure was used to calculate the cavitation volume over time, following the model of an acoustic monopole (3) first introduced by Huse [26] and implemented in an double integration procedure with intermediate high-pass filtering by Föhring et al. [25]. The measured sound pressure p ( t ) was transferred into the second derivative of the cavitation volume V ¨ ( t ) taking into account the water density ρ of 988 kg/m 3 and the distance between the cavitation bubble and the hydrophone r of 0.3 m. Then, the volume acceleration V ¨ ( t ) was integrated twice with regard to time using the high-pass filter to remove the near-constant offset of the signal at each step.
V ¨ ( t ) = p ( t , r ) · 4 π r ρ
The high-pass filter used in this study was an FIR filter with a filter order of 11,791 comprising a stop band until f s t o p = 2.0 Hz with δ s t o p = 80 dB and a pass band from f p a s s = 4.5 Hz with δ p a s s = 0.5 dB, thus keeping the sharp transition between the stop and the pass band well clear from the oscillation frequency f o s c of approximately 7.7 Hz. The resultant volume signal V ( t ) was checked qualitatively for plausibility by a frame-by-frame comparison with the synchronized high-speed video recording and was found in close agreement with the visually observed cavitation extend. Note that the applicability of the monopole model of Equation (3) is limited due to the enclosed setup in the testing section with regard to the quantitatively exact calculation of the cavitation volume. However, these limitations and possible quantitative distortions apply to all measurements equally. The derived volume signal is therefore analysed with regard to its general behavior: Its shape and the differences between the various measuring points are considered to be unaffected by constant influences like reflection on the tunnel walls, especially in the low frequency range that implies large wave lengths of sound compared to the tunnel dimensions. The focus on qualitative features of the volume evolution allows also the comparison with the visually observed cavitation area which is confirmed to be proportional to the volume [27]. Hashimoto et al. [20] even focus only on the length of the cavitation bubble as an indicator for changes in the cavitation behaviour.
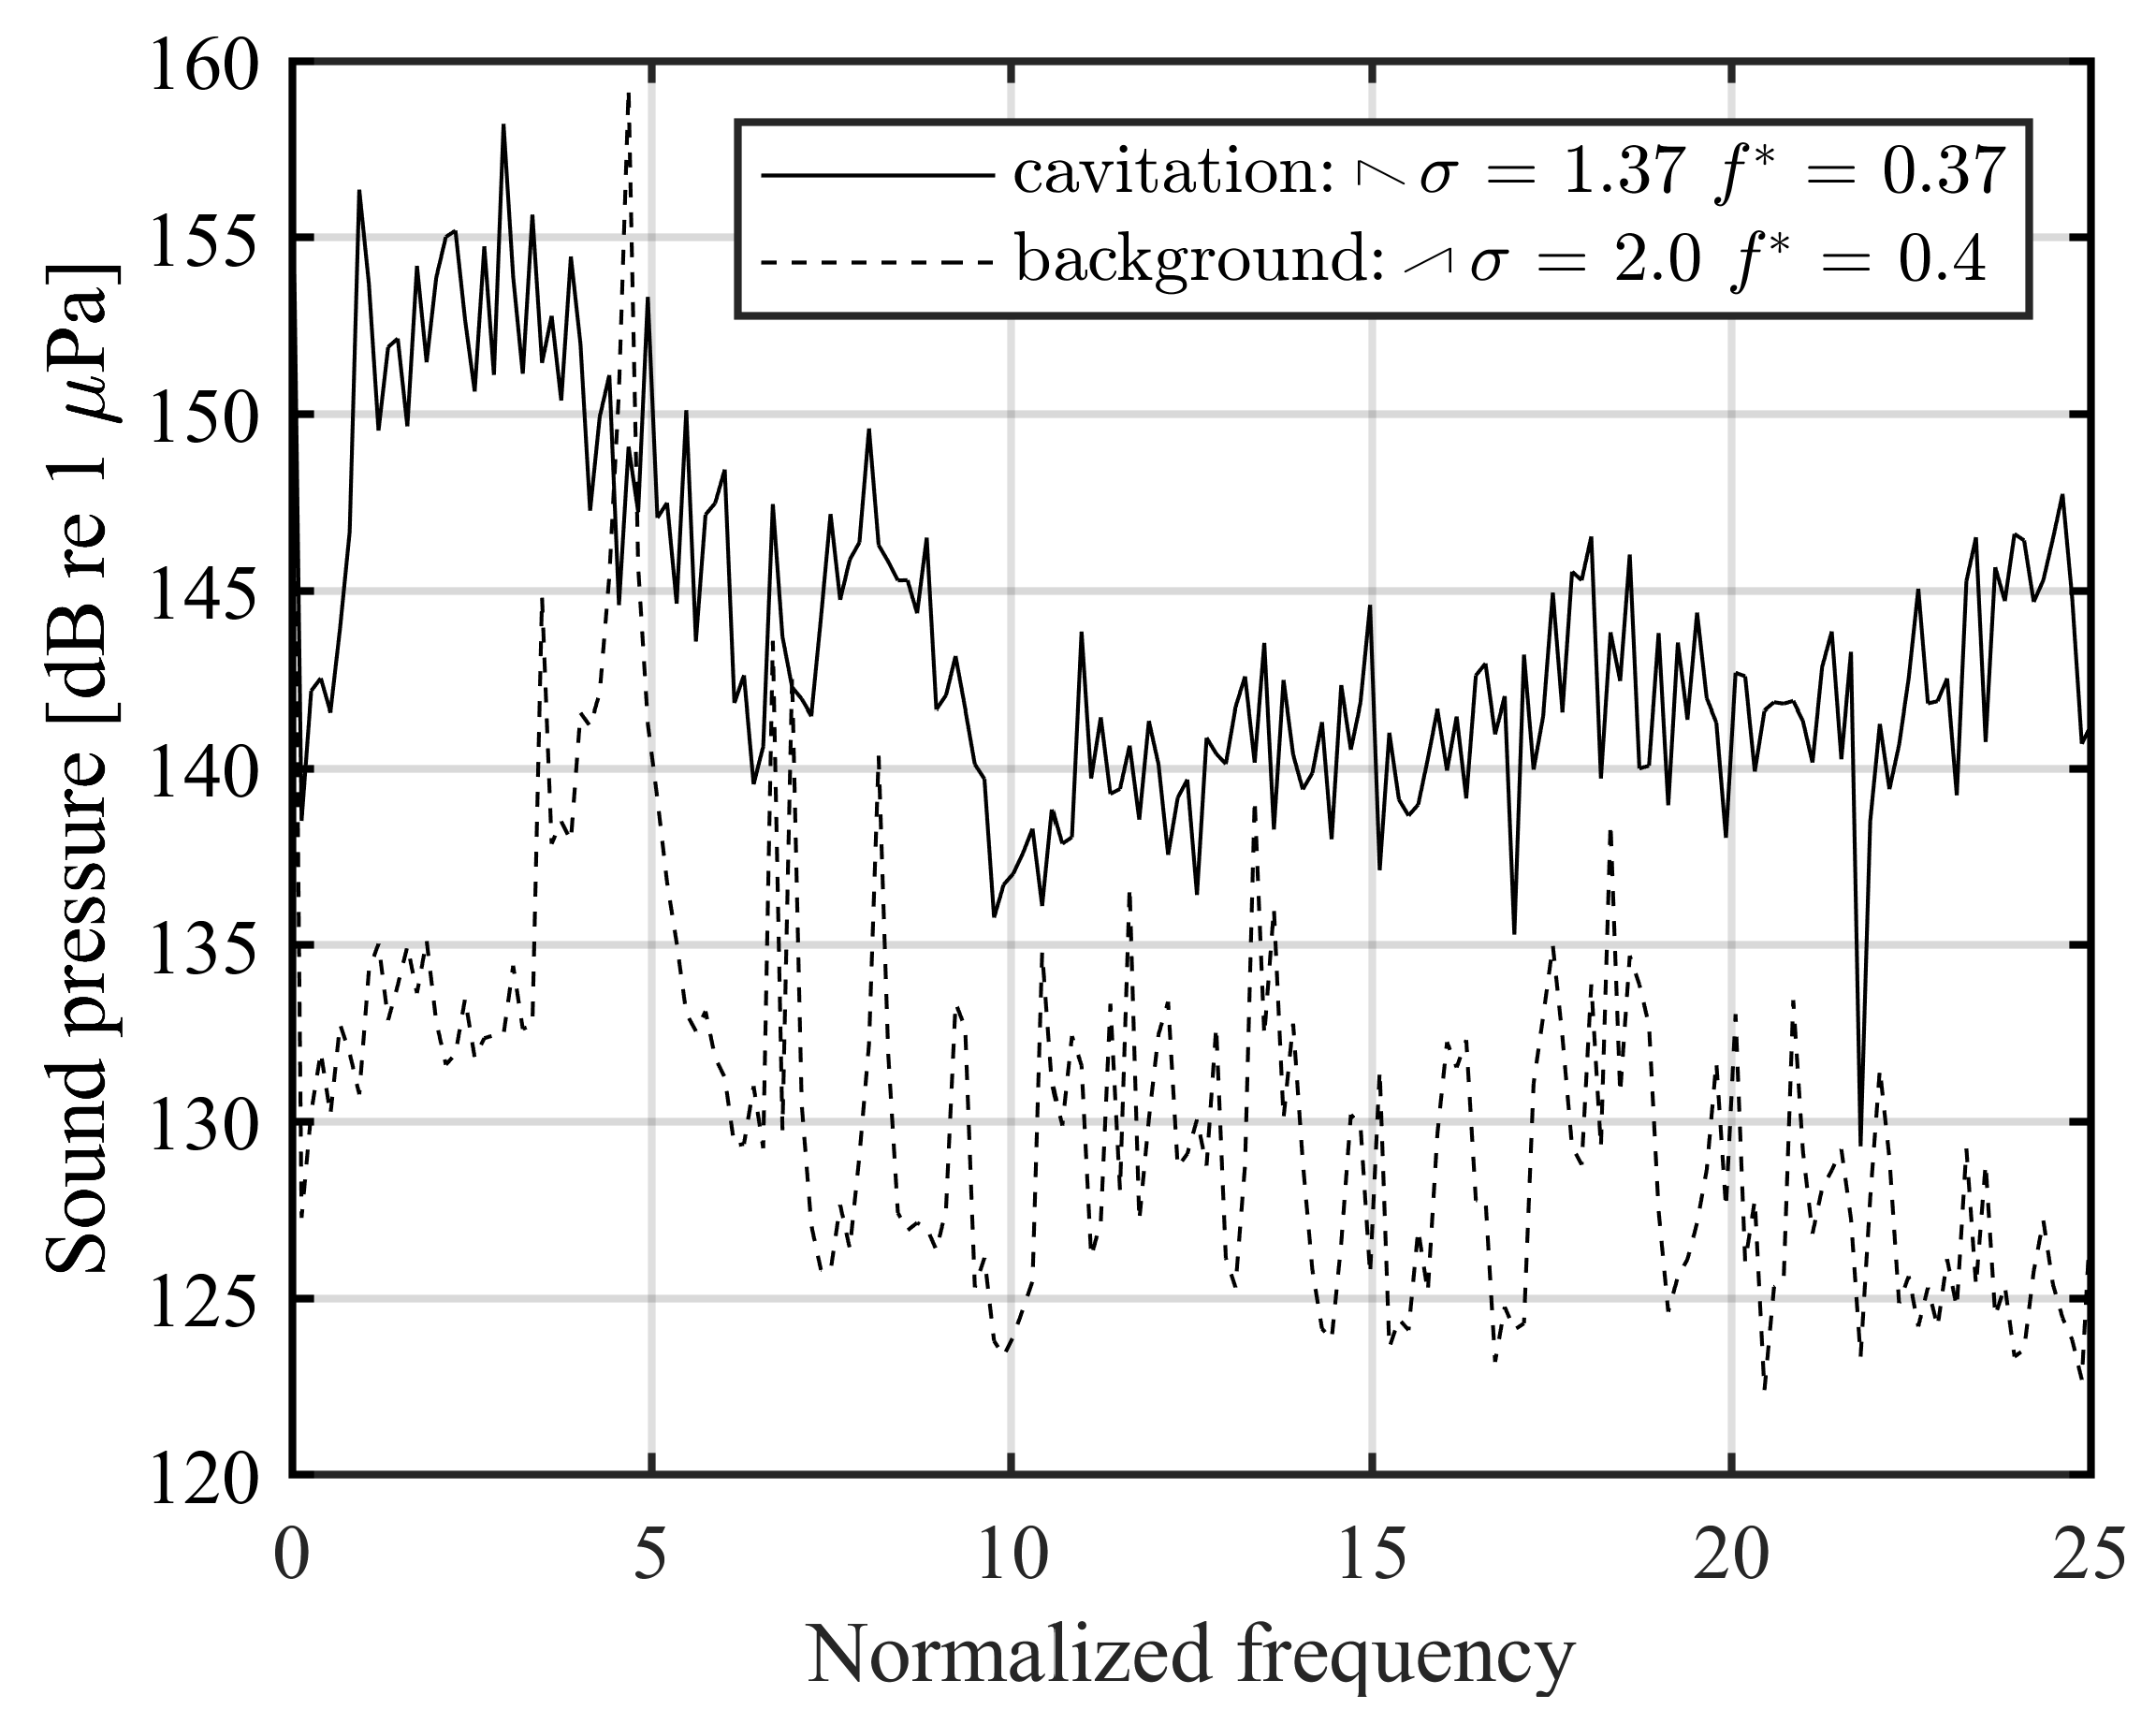
Prior to the measurement analysis, the extend of the background noise in the testing section of the cavitation tunnel was evaluated. It is dominated by the propeller in the lower part of the tunnel generating the circular flow and the pneumatic drive of the hydrofoil transferred into the testing section via the hydrofoil’s shaft and mounting. Figure 4 gives an overview of the sound pressure levels of the cavitating foil in comparison to the background noise measured with the hydrofoil oscillating at a typical flow speed without cavitation (ambient pressure increased accordingly). Even for the ‘quietest’ operation point (compare Section 3), the noise generated by the unsteady cavitation surpasses the background noise significantly throughout the frequency range. Therefore, the background noise is considered not to hamper the results presented in the next section despite one peak at approximately 5   f o s c .

3. Results

3.1. Influence of the Course of the Angle of Attack

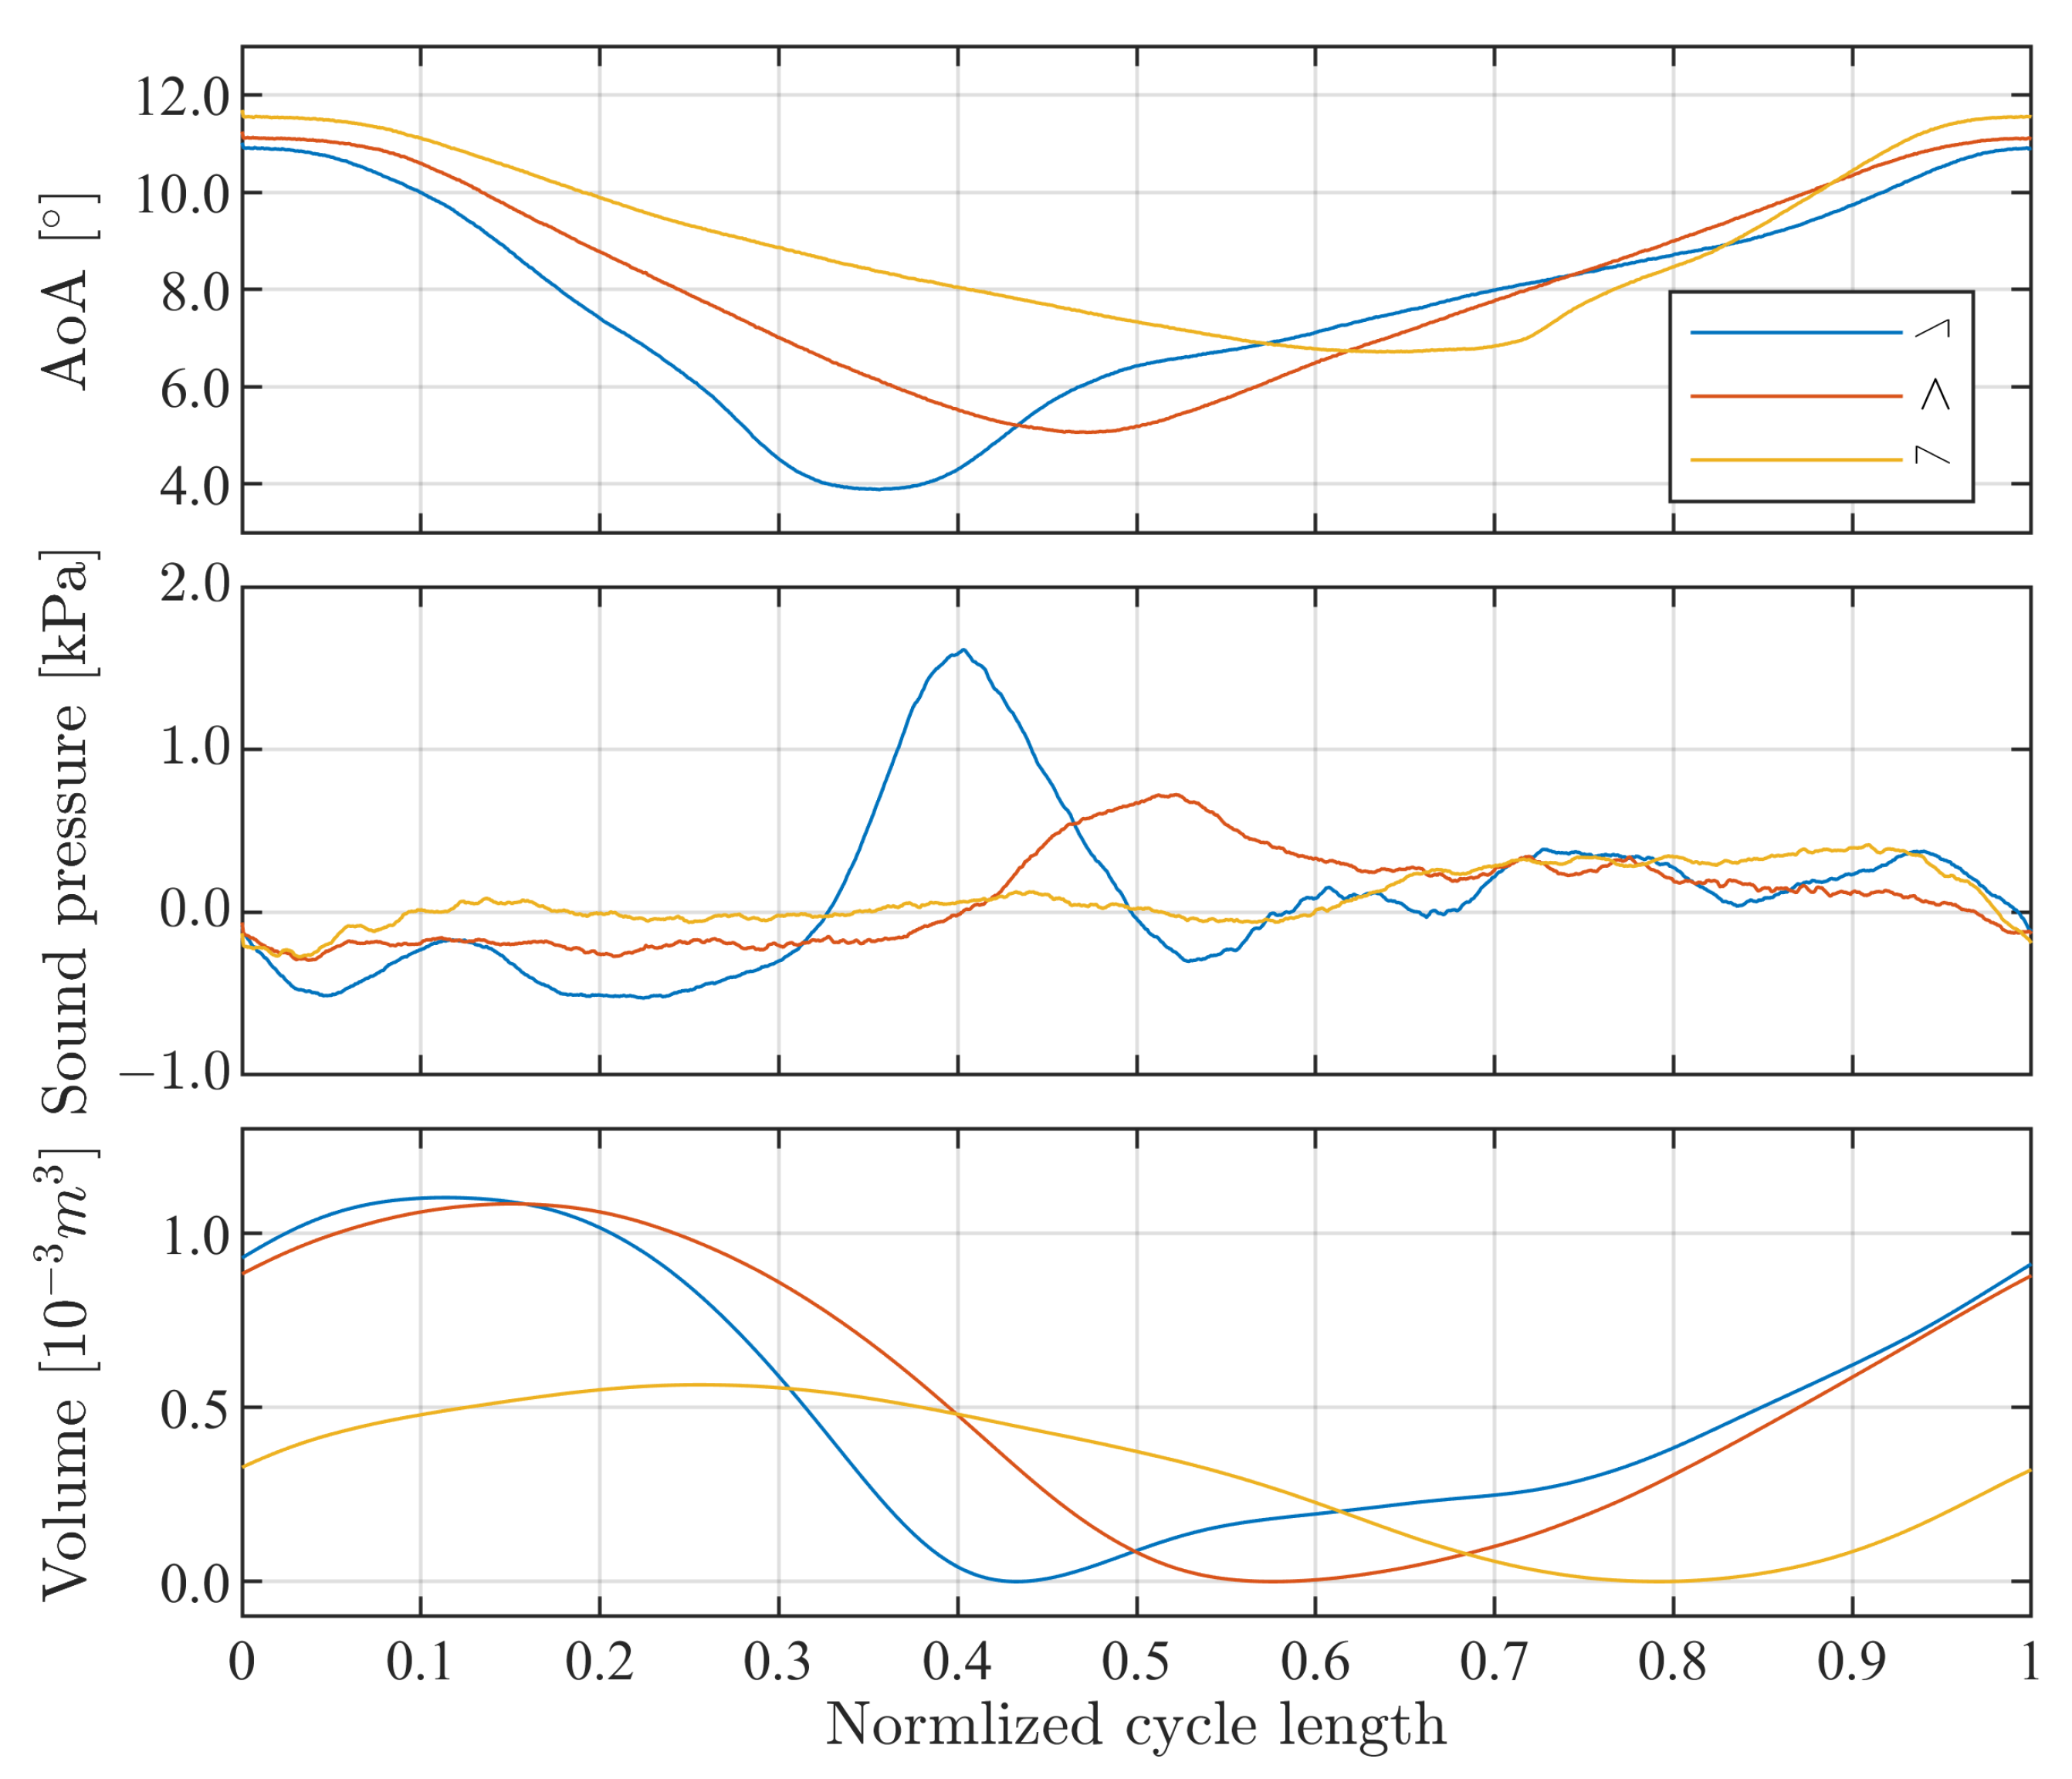
The influence of the temporal course of the angle of attack is first analyzed for a set of three measurements at a constant cavitation number, σ = 0.89, and a reduced frequency, f * = 0.39. The measurement signal is cut into sequences comprising one oscillation cycle each from one AoA maximum to the next in order to provide an undisturbed view on the collapse phase of the sheet cavitation. The sequences of the AoA, the recorded sound pressure and the calculated cavitation volume are scaled and resampled to a common cycle length enabling a time-synchronized average of all involved oscillation cycles [28].
As can be seen in Figure 5 for all three versions of the AoA course, the sheet cavitation grows steadily following the increasing angle of attack with a slight delay. Thus, the previously mentioned lock-in phenomenon is clearly observable as the foil movement governs the cavitation behavior. Concordantly, the collapse of the cavitation volume is accompanied by the maximum of the sound pressure within the cycle. The upper graph shows that due to the compressibility of the air in the pneumatic system, the course of the angle of attack does not describe the intended triangular pattern in perfect detail. However, the courses maintain the principal difference with regard to the AoA change. Due to limitation in the adjustment of the pneumatic drive the minimum angle of attack differs for the three course types, but the cavitation is confirmed to have fully collapsed by the high-speed video analysis, which is the basis to attribute the presented findings to the principal shape of the angular course.
Comparing the three types of the AoA course, a significantly increased sound pressure can be detected for the ⩘ course. A certain delay can be observed between the maximum of the angle of attack and the calculated cavitation volume, while the minima coincide more closely. The volume amplitude of the 𝆇 course is significantly smaller than for the other two types. This observation is found systematically among all operation points. Though the absolute volume amplitude of the ⩘ course is similar to the one of the ∧ course, the sound pressure emitted during the ⩘ course clearly surpasses the ∧ one. This observation is reflected in the calculated volume evolution, where the cavitation bubble collapses more rapidly due to the fast decreasing angle of attack. The manipulation of the temporal AoA course does not defer the collapse process from being the loudest part of the cavitation cycle. Neither of the analyzed AoA courses causes the noise of the growing cavitation bubble to surpass the noise emitted during the collapse.
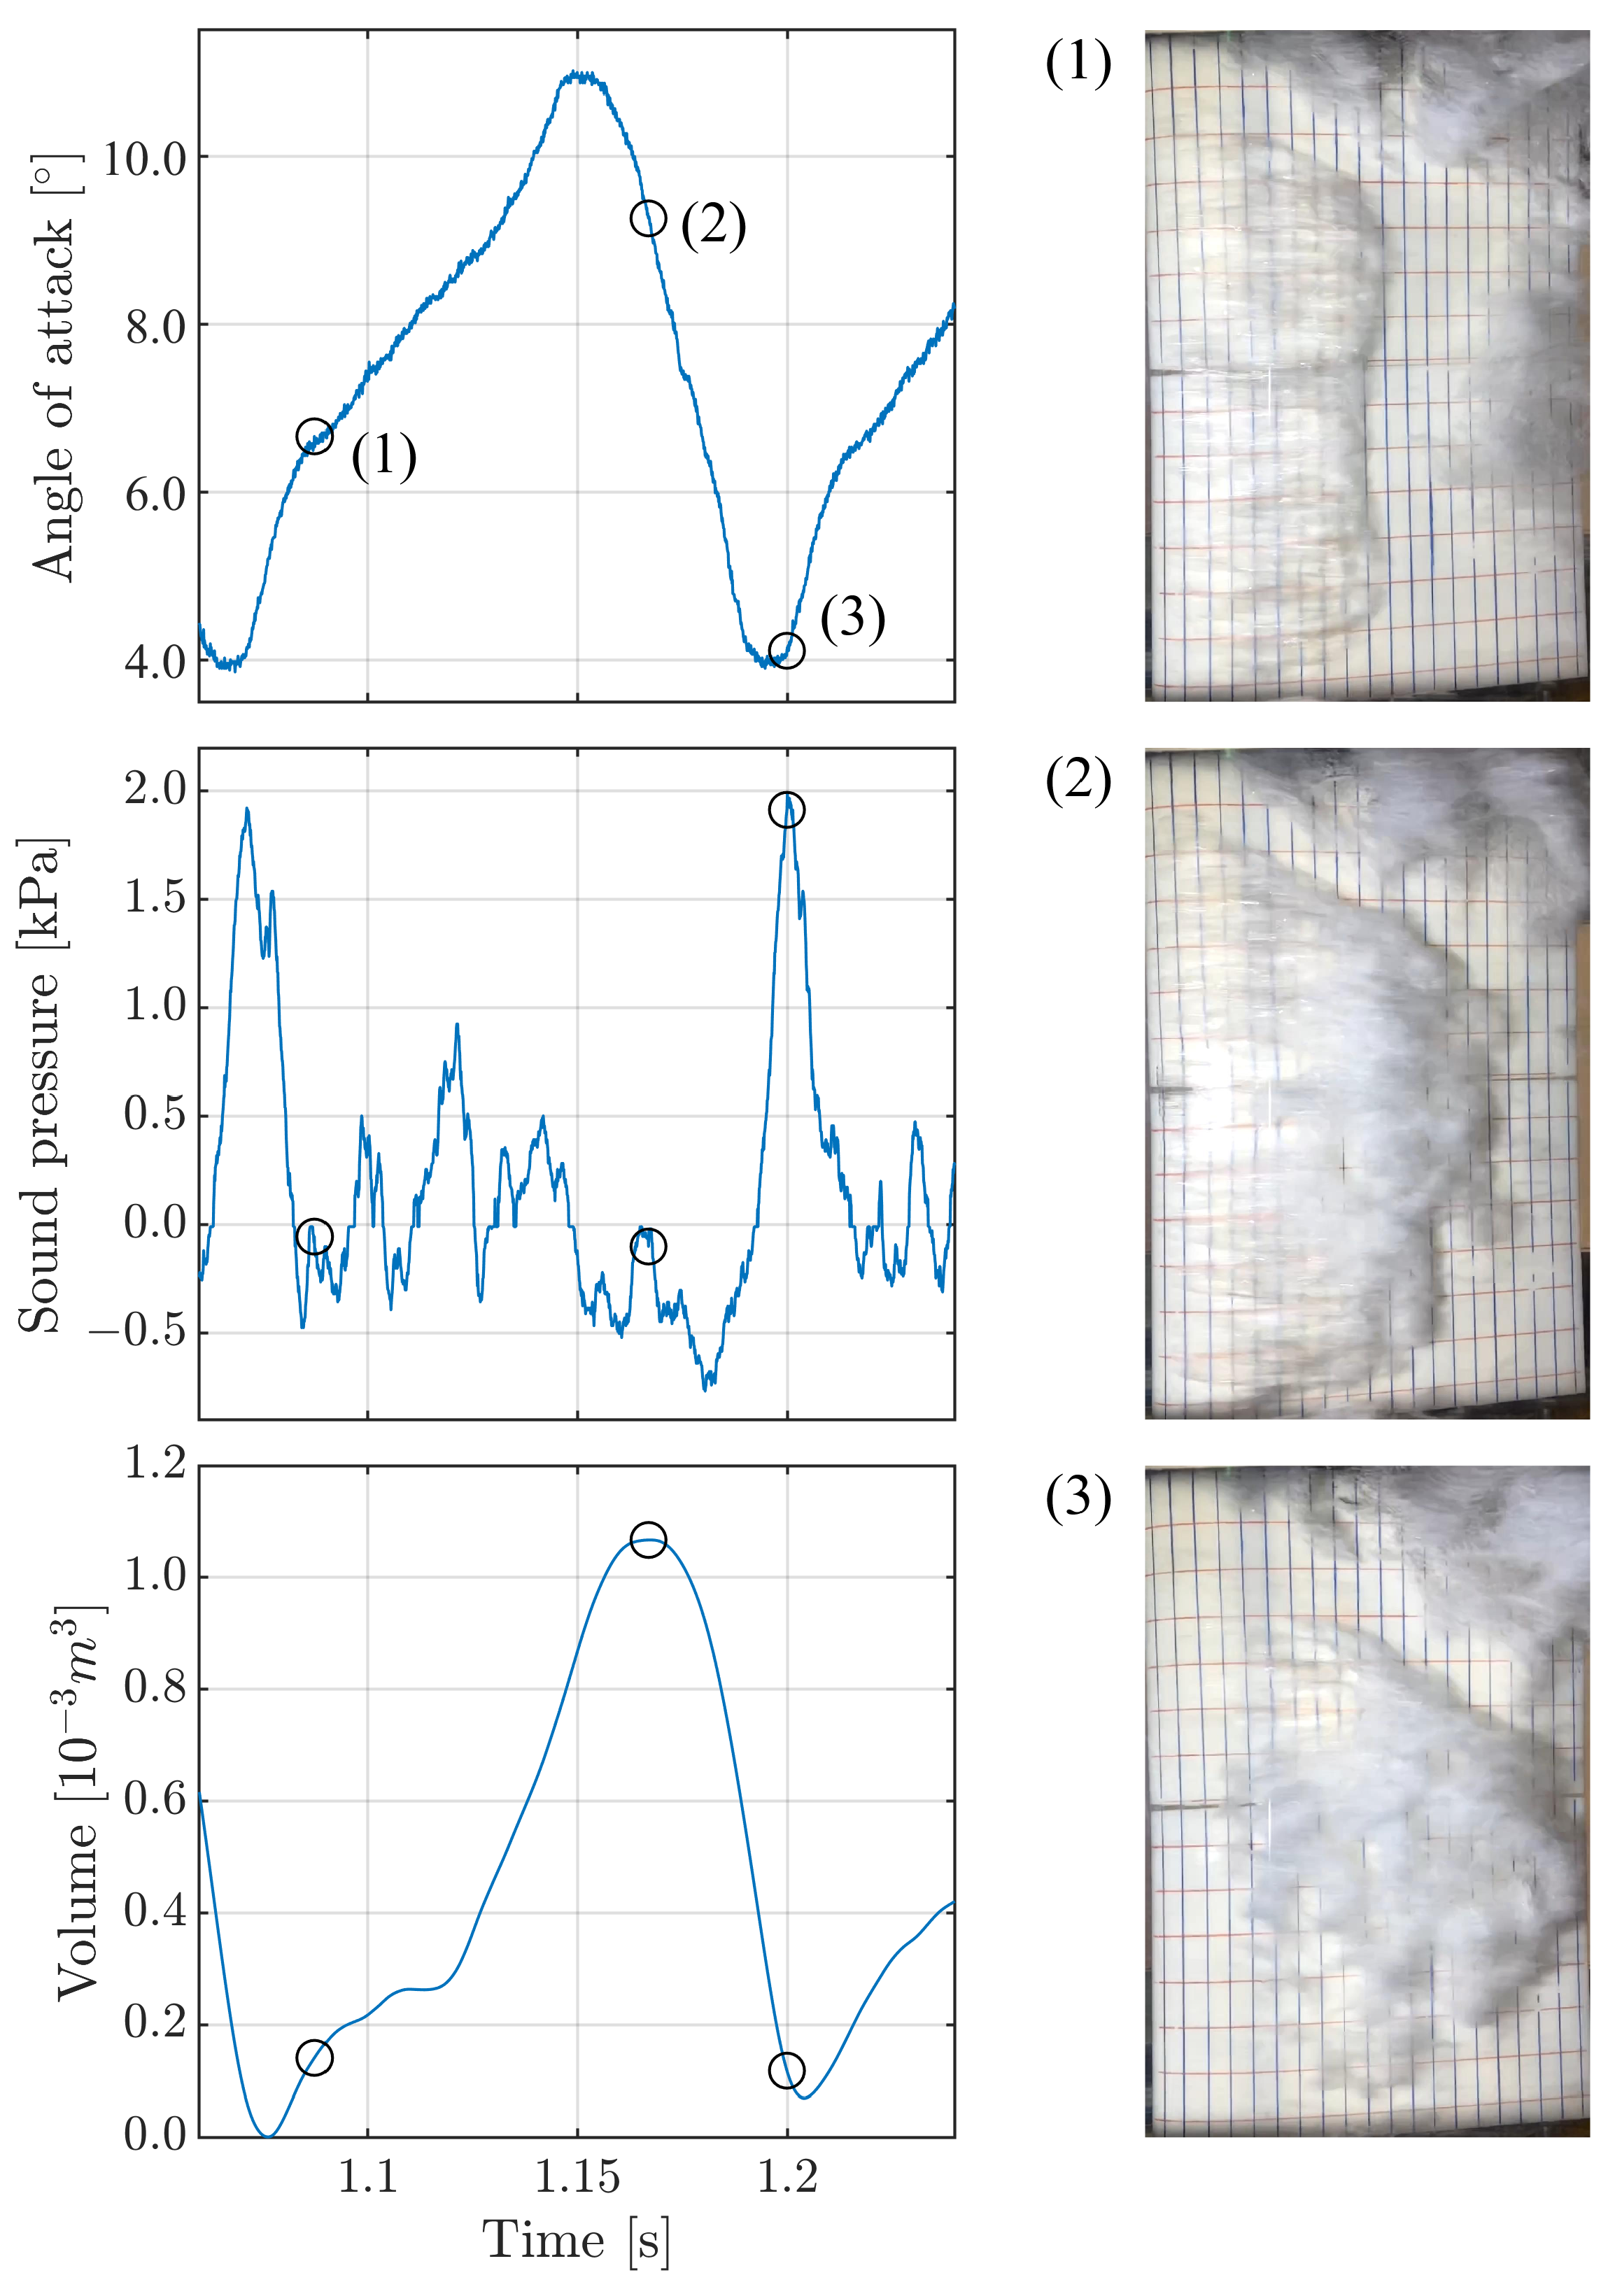
Figure 6 provides a more detailed view on one exemplary cycle from the ⩘ setup. Apart from the volume evolution depicted in the frames, the corresponding sound pressure shows a narrow and high peak at the end of the volume collapse, exceeding the mean signal in Figure 5 (middle) significantly. Due to the stochastic nature of the cavitation collapse, the exact position of the pressure peak varies within the cycle and is therefore underestimated in the average signal. The remainder of the collapsed cavitation bubble is visible in frame (3) when the pressure peak occurs. Nevertheless, the main coherent sheet cavitation bubble has collapsed, concordantly with the minimum of the calculated cavitation volume.
When examining the sound pressure in the frequency domain (Figure 7), the difference between the courses of the angle of attack becomes equally apparent. The peaks at the harmonics of the oscillation frequency increase for the ⩘ setup. Though Figure 4 shows that the cavitation increases the sound pressure level over a very broad frequency range, Figure 7 shows that the frequency range of interest lies below 10 f o s c , where significant peaks at the harmonics of the oscillation frequency occur. Therefore, the focus lies on this lower frequency range that is—with regard to the underlying issue of propeller noise—the most troublesome. The frequency resolution is found to have only negligible influence on the height of the harmonic peaks.

3.2. Influence of the Cavitation Number

The influence of the course of the angle of attack is now set into broader perspective by taking different cavitation numbers into account. Figure 8 presents a similar set of data as Figure 5 but for all four cavitation numbers defined in Table 1.
As can be seen in the bottom row of graphs, the observations outlined in the previous section repeat for all cavitation numbers: A fast decrease in the angle of attack generates the highest sound pressure at the cavitation collapse. Apart from that, the general influence of the cavitation number appears as expected with a smaller and more fluctuating cavitation volume as the cavitation number rises from left to right in the columns of Figure 8. Only the lowest cavitation number presents an unexplained exemption. The cavitation volume differs among the individual cycles with a standard deviation of approximately 10%, which is small compared to the differences shown in the bottom row of Figure 8.
A reproducible, though not yet explained peculiarity, is found for σ = 1.2: Concordantly this third cavitation number generates the highest sound pressure peaks throughout the matrix of operation points, even though the lower cavitation numbers provide a larger cavitation volume and a generally more pronounced cavitation behaviour. This phenomenon corresponds with the observations of Reisman et al. [17], where the highest noise emissions were also observed without explanation at an equal intermediate cavitation number ( σ = 1.2) independent from the oscillation frequency.
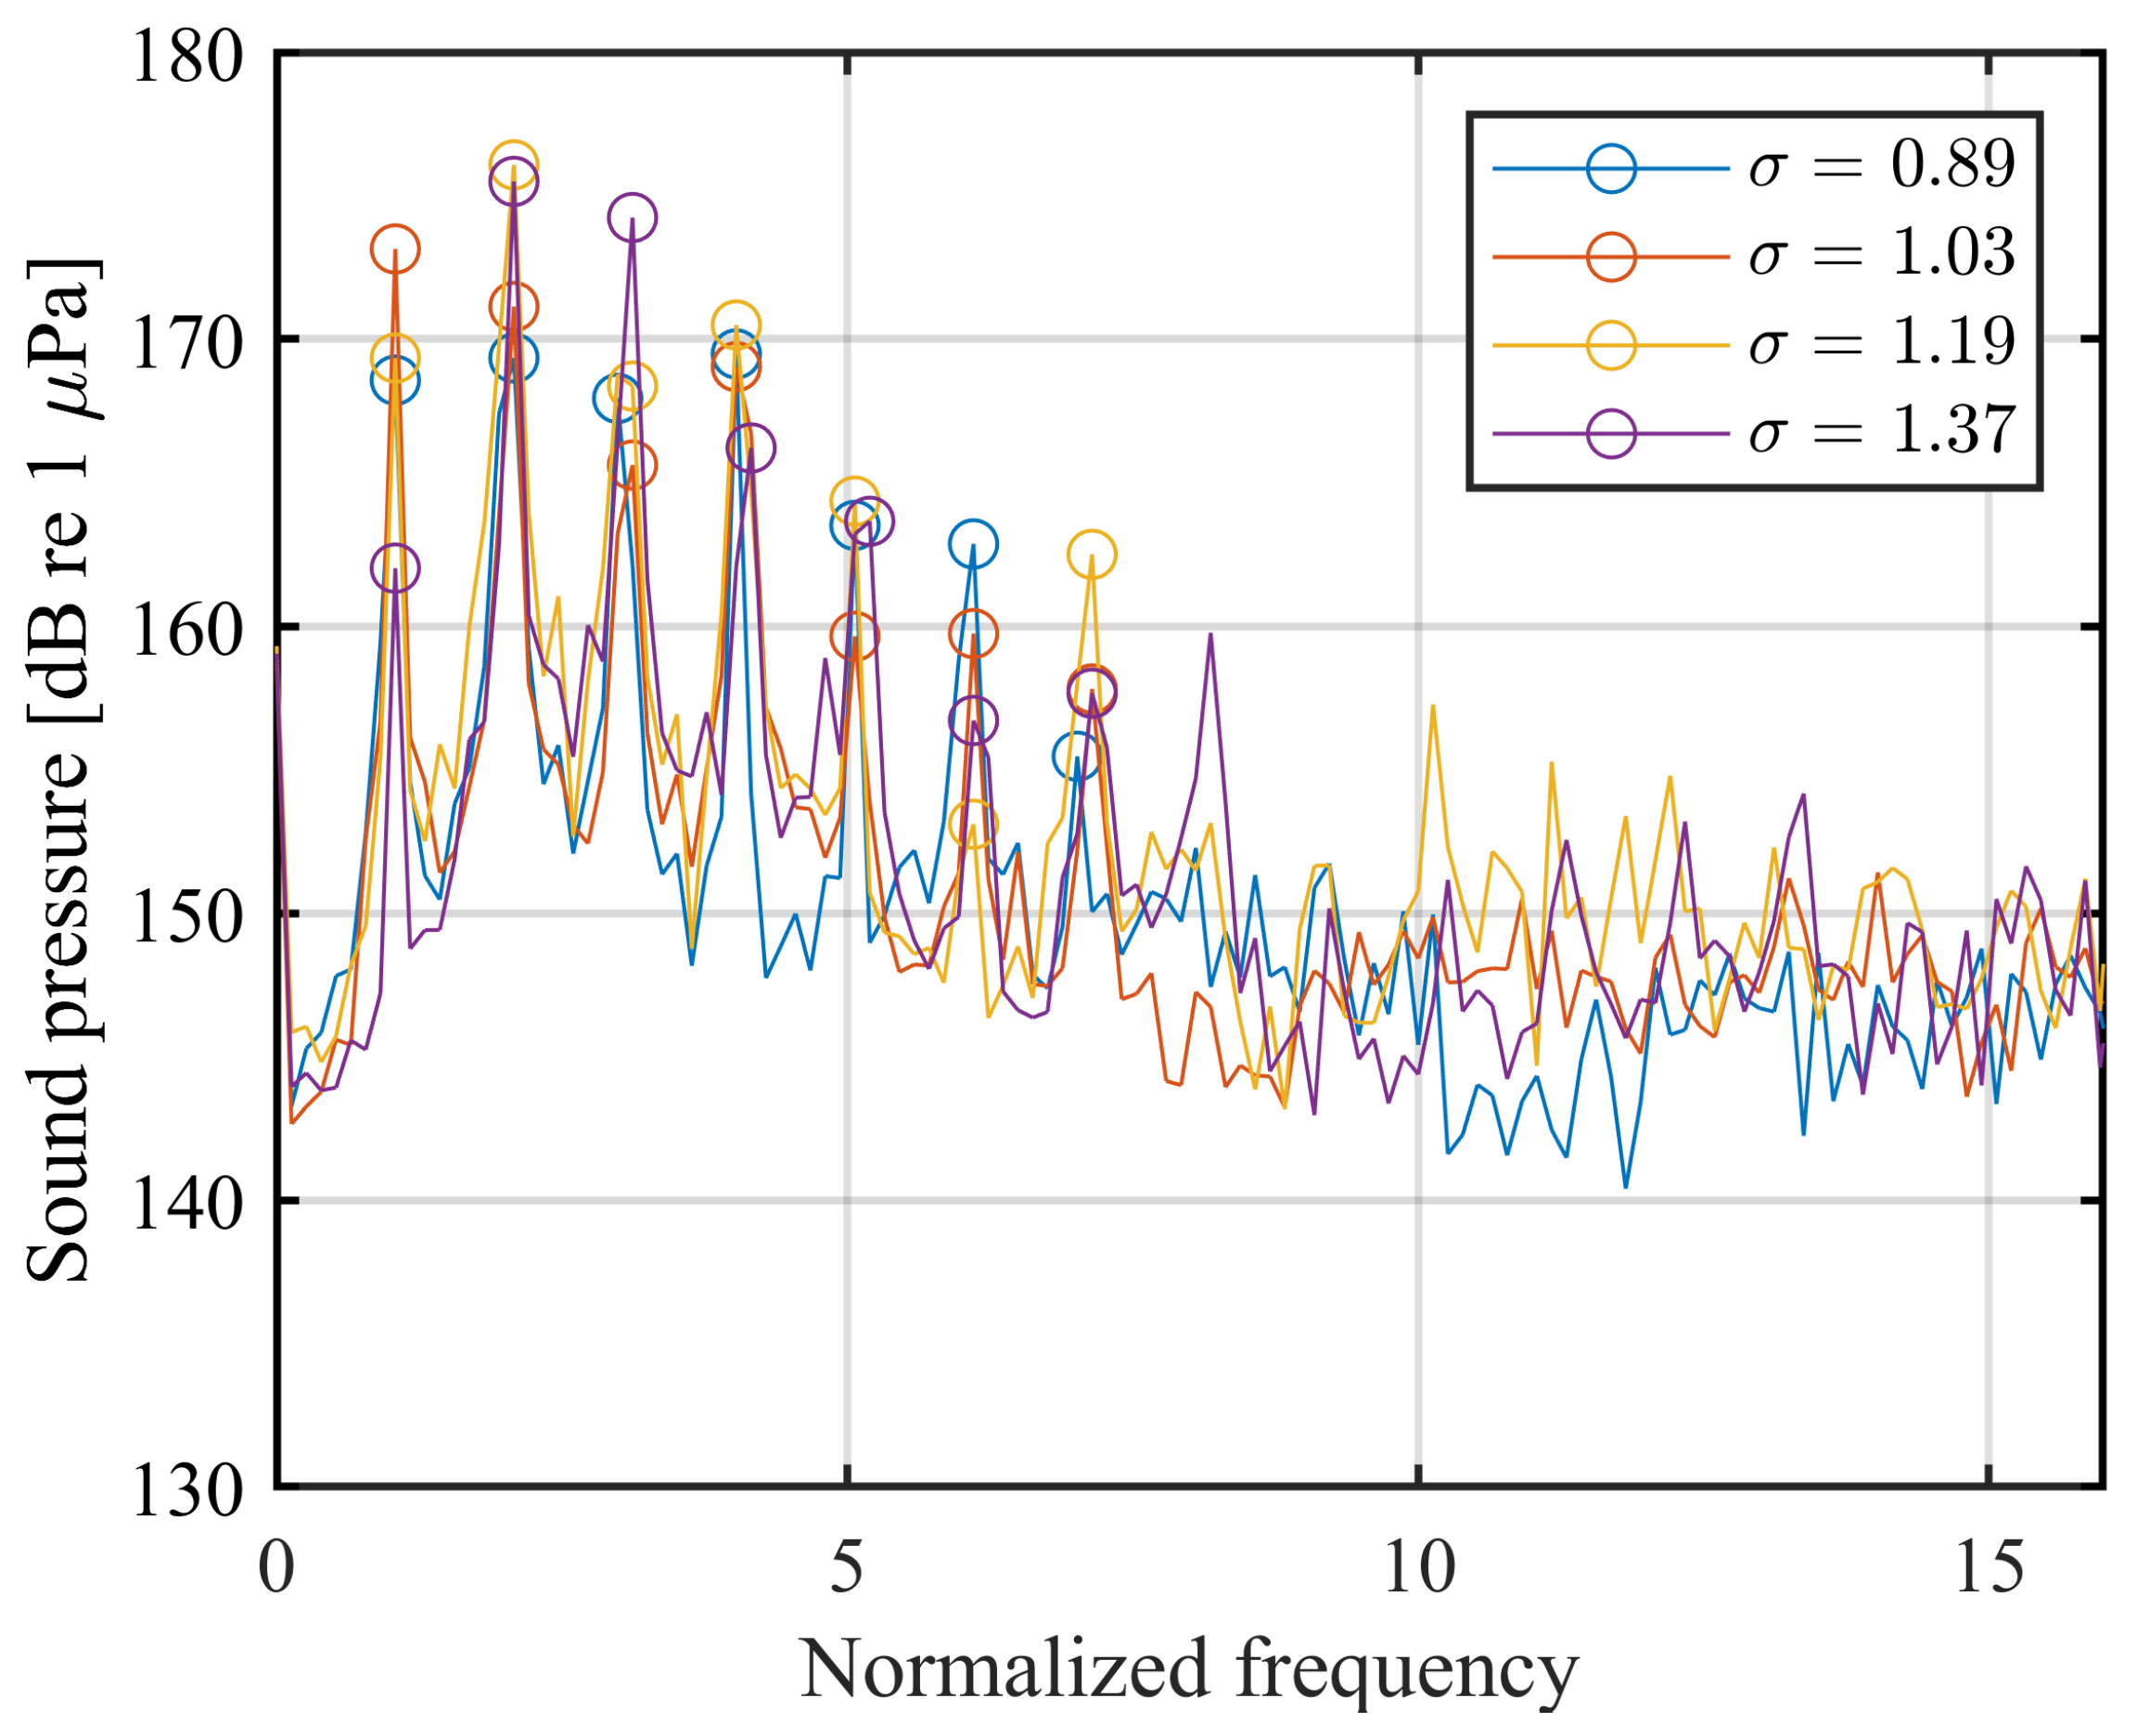
In favor of clarity, the spectral analysis of the sound pressure with regard to various cavitation numbers is performed only for the ⩘ course of the angle of attack. Figure 9 shows that an increase in σ within the given range has only a small influence on the sound pressure levels at the harmonics of the oscillation frequency compared to the variation of the AoA courses in Figure 7. The first seven harmonic peaks are marked for better readability, showing the prominence of the third cavitation number (1.2) observed in the time domain and also in the spectrum.

3.3. Influence of the Reduced Oscillation Frequency

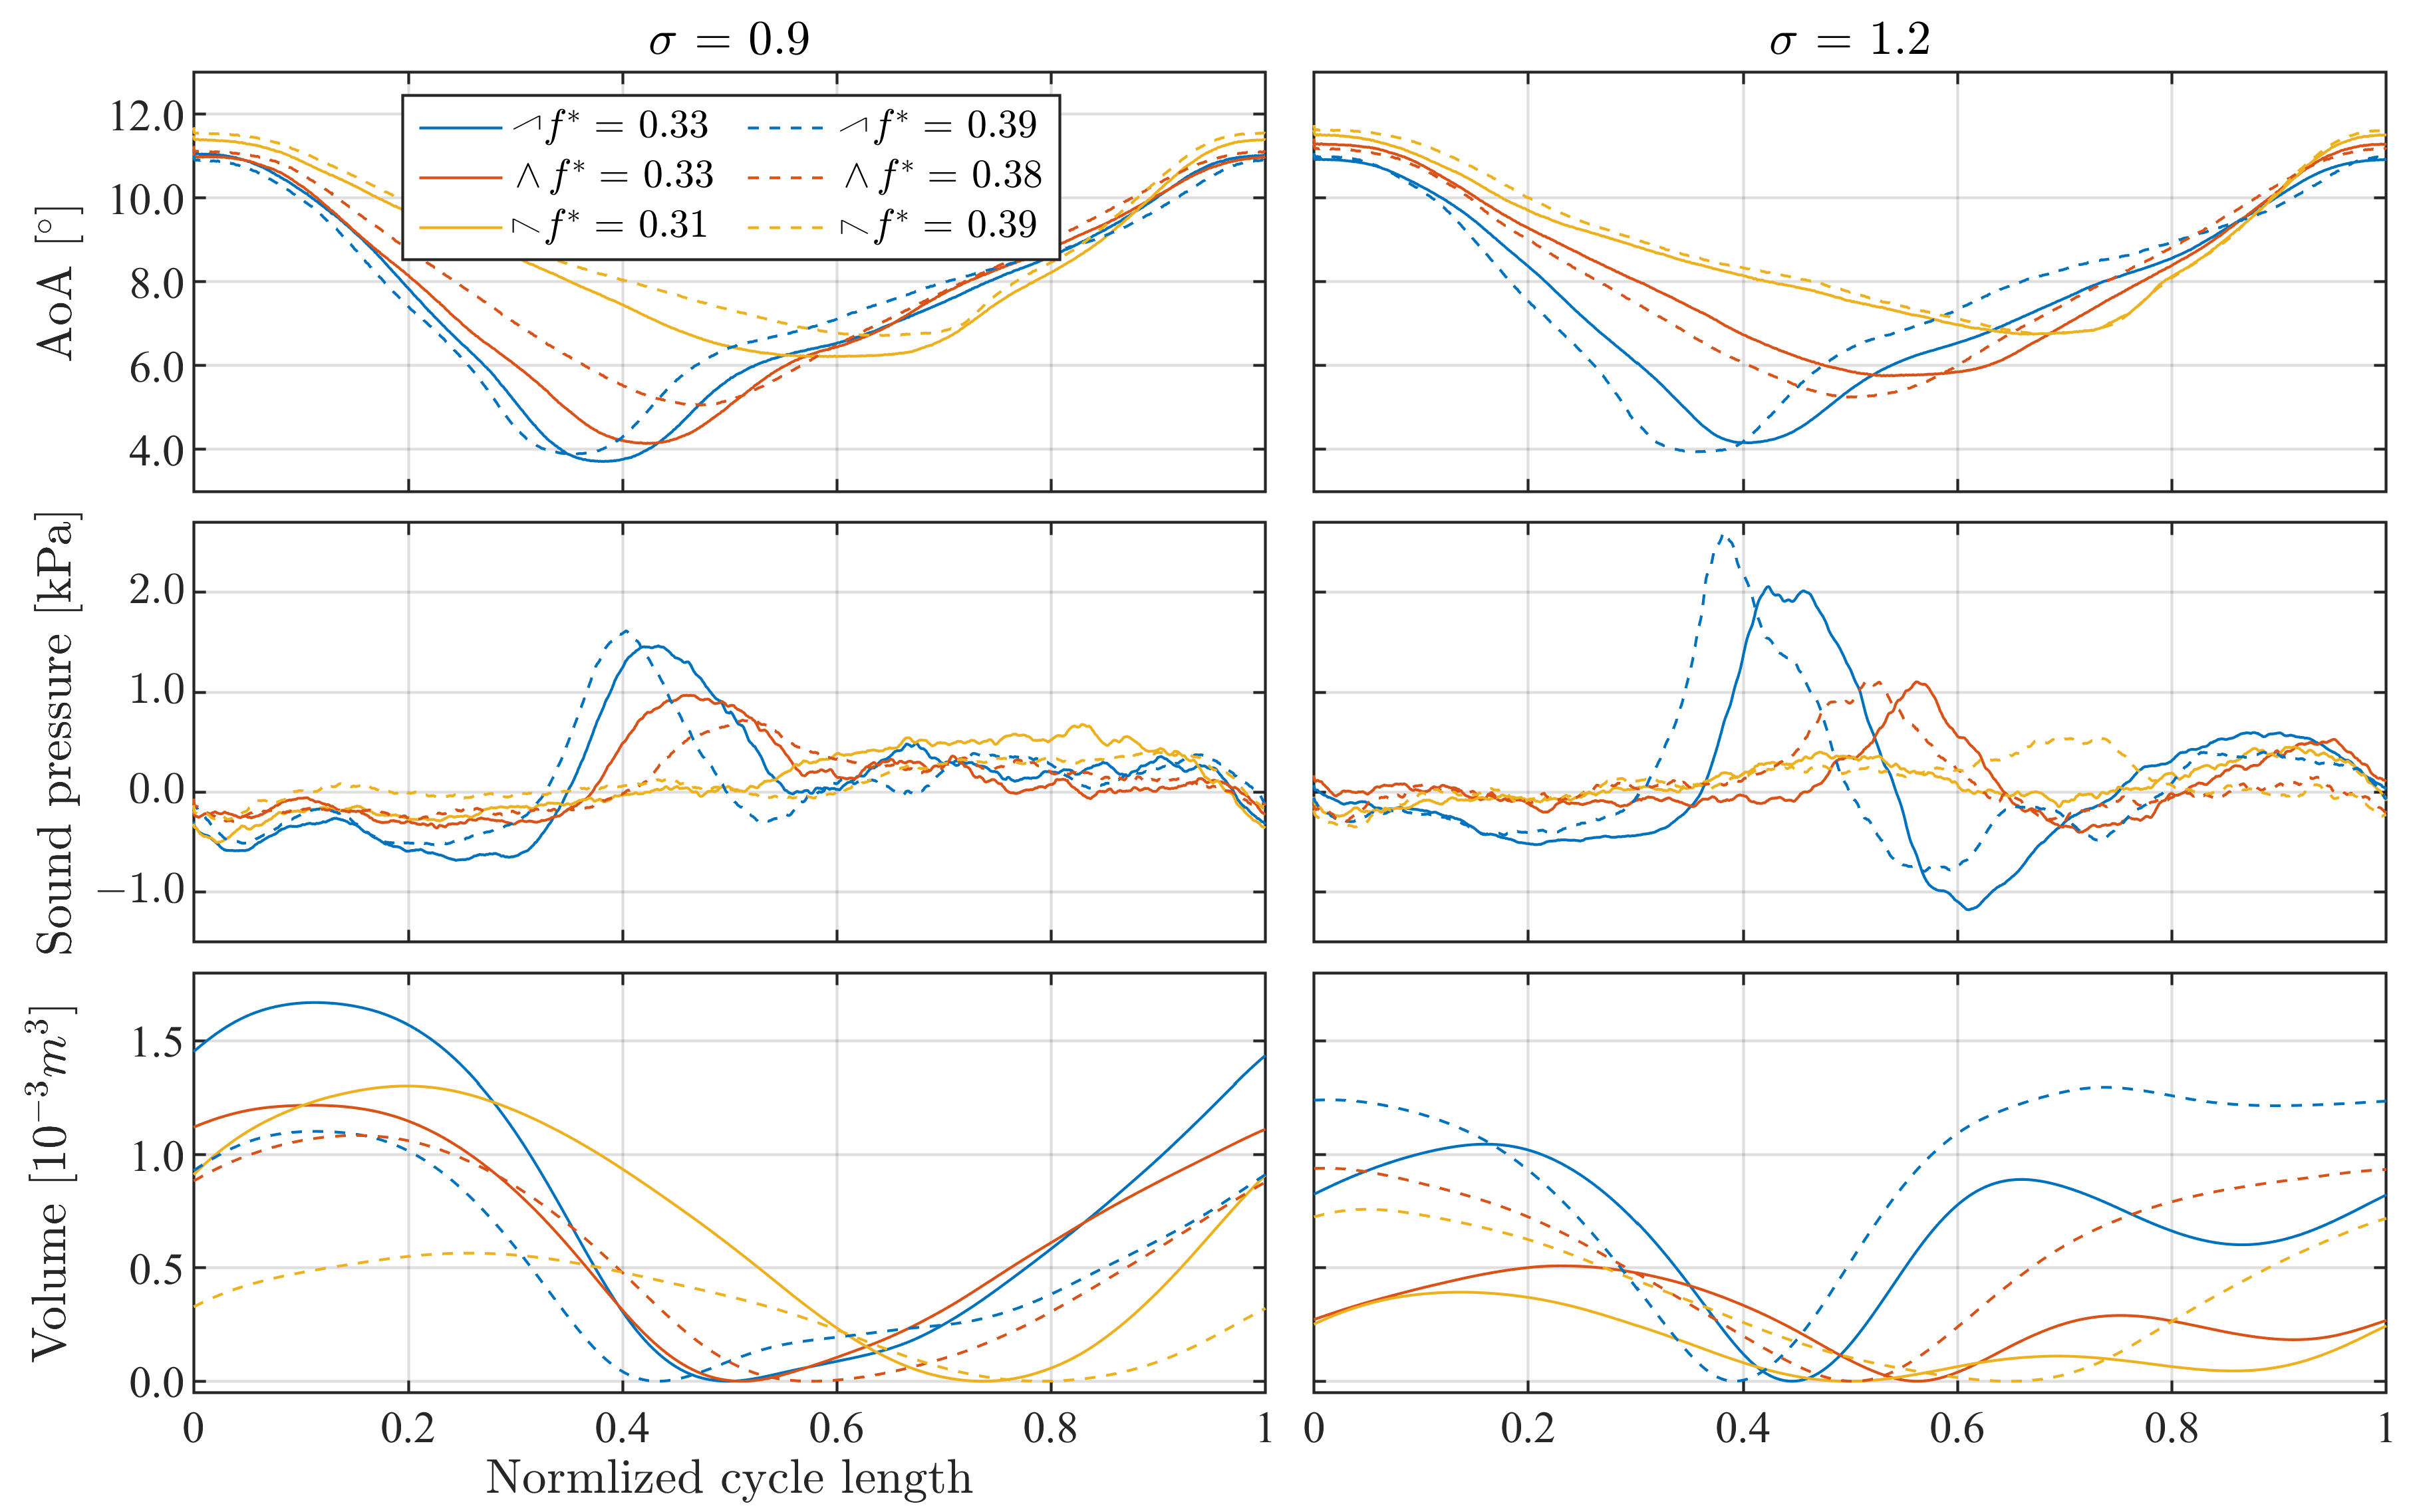
Corresponding to a small range of the reduced frequency compared to other studies [20,21], the differences in the sound pressure for different values of f * shown in Figure 10 and Figure 11 are small as well. Limited by the capabilities of the pneumatic drive, the range of tested reduced frequencies does not reach into areas where the cavitation behavior differs fundamentally from the one presented in the previous sections. Even the peculiarity pointed out in Section 3.2 is reproduced for both values of f * . Again, the spectral analysis is performed only for the ⩘ course of the angle of attack and for the lowest cavitation number as their influence is already outlined in the previous sections.

4. Discussion

The analysis of sound pressure and calculated cavitation volume in the time domain in combination with high-speed video frames shows concordantly that the cavitation evolution is related to the hydrofoil movement. The growth and collapse of the attached partial sheet cavitation follows—with a certain delay—the increase and decrease in the angle of attack. This observation agrees with the studies concerned with oscillating hydrofoils in similar ranges of the reduced frequency [16,17,19,20,21]. This lock-in phenomenon governs the sheet cavitation behavior for both symmetrical and asymmetrical courses of the angle of attack and confirms the major role of the hydrofoil movement with regard to the cavitation evolution.
The present study shows clearly that the altering of the temporal course of the angle of attack has a significantly stronger and invariable influence on the cavitation noise than the other analyzed parameters ( σ and f * ) within their respective ranges. Throughout the operation points, the ⩘ course of the AoA caused pressure peaks at the harmonics of the oscillation frequency that surpassed the peaks measured with the other temporal courses. Furthermore, while having a significant influence on the collapse process, neither of the angular courses transferred the occurrence of the sound pressure maximum from the collapse to the growth phase. This directs the focus of propeller optimization with regard to noise reduction from the entrance into the wake trough towards the egress range where the cavitation collapses.
As shown by Hashimoto et al. [20], the amplitude of the oscillating cavitation length as an indicator for the cavitation behaviour (Section 2.3) decreases for higher oscillation frequencies. Within the short period of an increasing angle of attack the cavitation bubble seems unable to reach the same extend as for slower oscillations even if the angular range is kept constant. This observation corresponds with the smaller volume evolution outlined in Section 3.1 for the 𝆇 course in comparison to its counterpart where a longer angular increase provides more time for the bubble growth.
The corresponding rapid angular decrease in the ⩘ course is therefore not directly comparable to faster symmetrical oscillation which lacks the generous growth phase. Having reached its full extend, the cavitation bubble is left to collapse violently, producing the highest sound pressure peaks among the three angular shapes. The studies [16,19] state concordantly that the highest pressure impulses are detected at the collapse of the cavity. The proportional correlation between the volume acceleration and the sound pressure defined in Equation (3) as outlined by Huse [26] indicates that (a) a larger volume tends to produce higher sound pressure peaks and (b) the abruptness of the collapse as another term for the temporal derivative strongly promotes higher sound pressure peaks as well.
Conversely, this means that the sound pressure peaks are reduced significantly by sustaining the collapsing sheet cavitation by means of a delayed angular decrease. Another similar way of noise reduction is presented as a second major finding of Reisman et al. [17]: Air injected into the cavitation bubble tends to mitigate the collapse rapidness and thus the corresponding sound pressure peak. This principle is transferred into practical application with the so-called Prairie system [29], though not adept for wide civilian usage due to technical efforts. However, both strategies based on the prolonging of the existence of the cavitation bubble point towards the quieter cavitation behavior. This may be aimed for either by optimizing the propeller design as analysed by Ji et al. [12] and recently discussed by Maquil [13] and/or smoothing the wake field shaped by the hull lines or appendices as investigated by Fahrbach [10], Bugalski and Szantyr [11].
Accompanying numerical simulations as well as further experimental work are needed to provide an even closer view on the cavitation behavior in the context of asymmetrically oscillating hydrofoils and perspectively ship propellers operating in inhomogeneous wake fields. Numerical simulations may enable the further decoupling of setup parameters, especially with regard to the angular course, in order to understand its correlation with the emitted cavitation noise in more detail and transfer it into propeller design. Especially, the noise reduction potential of the skew and the wake field as well as of some propulsion-improving devices (PIDs) requires further investigation. While the occurrence of significant propeller cavitation cannot reasonably be avoided within the tight efficiency demands imposed on the propellers of merchant ships, the acceptance or even prolongation of the angular range of the cavitation with a focus on a more moderate collapse phase, i.e., a minimum second derivative of the cavitation volume over time, may be the key towards quieter propellers.

Author Contributions

Conceptualization, L.S.F. and D.W.; methodology, L.S.F. and D.W.; software, L.S.F.; validation, L.S.F.; formal analysis, L.S.F. and P.M.J.; investigation, L.S.F.; resources, L.S.F. and D.W.; data curation, L.S.F.; writing—original draft preparation, L.S.F.; writing—review and editing, L.S.F., P.M.J. and D.W.; visualization, L.S.F.; supervision, P.M.J. and D.W. All authors have read and agreed to the published version of the manuscript.

Funding

We acknowledge financial support by Land Schleswig-Holstein within the funding program Open-Access Publikationsfonds.

Data Availability Statement

The data presented in this study are openly available in Zenodo at doi:10.5281/zenodo.10017155.

Conflicts of Interest

The authors declare no conflict of interest.

Abbreviations

The following abbreviations are used in this manuscript:
AoA  angle of attack
FIR  finite response filter
LED  light-emitting diode
NACA  foil type, first introduced by the National Advisory Committee for Aeronautics
PID  propulsion-improving device

References

  1. Hildebrand, J.A. Anthropogenic and natural sources of ambient noise in the ocean. Mar. Ecol. Prog. Ser. 2009, 395, 5–20. [Google Scholar] [CrossRef]
  2. Andrew, R.K.; Howe, B.M.; Mercier, J.A.; Dzieciuch, M.A. Ocean ambient sound: Comparing the 1960s with the 1990s for a receiver off the California coast. Acoust. Res. Lett. Online 2002, 3, 65–70. [Google Scholar] [CrossRef]
  3. Committee on Potential Impacts of Ambient Noise in the Ocean on Marine Mammals. Ocean Noise and Marine Mammals; National Academies Press: Washington, DC, USA, 2003. [Google Scholar]
  4. Merchant, N.D.; Witt, M.J.; Blondel, P.; Godley, B.J.; Smith, G.H. Assessing sound exposure from shipping in coastal waters using a single hydrophone and Automatic Identification System (AIS) data. Mar. Pollut. Bull. 2012, 64, 1320–1329. [Google Scholar] [CrossRef] [PubMed]
  5. Veirs, S.; Veirs, V.; Wood, J.D.; Johnson, M. Ship noise extends to frequencies used for echolocation by endangered killer whales. PeerJ 2016, 4, e1657. [Google Scholar] [CrossRef] [PubMed]
  6. The Specialist Committee on Cavitation Induced Pressure Fluctuation. Final Report and Recommendations to the 22nd ITTC. In Proceedings of the 22nd International Towing Tank Conference, Shanghai, China, 5–11 September 1999. [Google Scholar]
  7. Schuster, M.; Daniel, J.M.; Wittekind, D.K.; Föhring, L.S. Future requirements for ships to limit underwater noise in the oceans. In Proceedings of the 116th Congress of the German Society for Maritime Technology; Schiffbautechnische Gesellschaft e.V.: Hamburg, Germany, 2022; Volume 1. [Google Scholar]
  8. Odabaşi, Y.A.; Fitzsimmons, P.A. Alternative methods for wake quality assessment. Int. Shipbuild. Prog. 1978, 25, 34–42. [Google Scholar] [CrossRef]
  9. Huse, E. Effect of Afterbody Forms and Afterbody Fins on the Wake Distribution of Single Screw Ships; Publication No. r31-74; Norwegian Ship Model Experiment Tank: Trondheim, Norway, 1972. [Google Scholar]
  10. Fahrbach, M. Bewertung der Güte von Nachstromfeldern. Diploma Thesis, Technische Universität Hamburg-Harburg, Hamburg, Germany, 2004. Available online: https://docplayer.org/42565978-Bewertung-der-guete-von-nachstromfeldern.html (accessed on 17 September 2023).
  11. Bugalski, T.; Szantyr, J.A. Numerical Analysis of the Unsteady Propeller Performance in the Ship Wake Modified By Different Wake Improvement Devices. Pol. Marit. Res. 2014, 21, 32–39. [Google Scholar] [CrossRef]
  12. Ji, B.; Luo, X.; Wu, Y. Unsteady cavitation characteristics and alleviation of pressure fluctuations around marine propellers with different skew angles. J. Mech. Sci. Technol. 2014, 28, 1339–1348. [Google Scholar] [CrossRef]
  13. Maquil, T. Underwater Radiated Noise of Ship Propellers. Oral presentation during the HSVA-Webinar, Hamburger Schiffbauversuchsanstalt, Hamburg, Germany, 1 June 2023.
  14. Cavitation Committee. Session on Propulsion: Cavitation. In Proceedings of the 15th International Towing Tank Conference, The Hague, The Netherlands, 3–10 September 1978; Volume 2, pp. 145–163. [Google Scholar]
  15. Franc, J.P.; Michel, J.M. Unsteady attached cavitation on an oscillating hydrofoil. J. Fluid Mech. 1988, 193, 171–189. [Google Scholar] [CrossRef]
  16. McKenney, E.A.; Brennen, C.E. On the dynamics and acoustics of cloud cavitation on an oscillating hydrofoil. In Proceedings of the ASME Symposium on Cavitation and Gas-Liquid Flows in Fluid Machinery and Devices, Lake Tahoe, NV, USA, 19–23 June 1994; American Society of Mechanical Engineers: New York, NY, USA, 1994; pp. 195–202. [Google Scholar]
  17. Reisman, G.; McKenney, E.A.; Brennen, C.E. Cloud cavitation on an oscillating hydrofoil. In Proceedings of the Twentieth Symposium on Naval Hydrodynamics, Santa Barbara, CA, USA, 21–26 August 1994. [Google Scholar]
  18. Pereira, F.A.; Di Felice, F.; Salvatore, F. Propeller Cavitation in Non-Uniform Flow and Correlation with the Near Pressure Field. J. Mar. Sci. Eng. 2016, 4, 70. [Google Scholar] [CrossRef]
  19. Hart, D.P.; Brennen, C.E.; Acosta, A.J. Observations of Cavitation on a Three-Dimensional Oscillating Hydrofoil. In Proceedings of the 25th Cavitation and Multiphase Flow Forum, Toronto, ON, Canada, 4–7 June 1990; Volume 98, pp. 49–52. [Google Scholar]
  20. Hashimoto, A.; Watanabe, S.; Asahara, T.; Sato, K.; Tsujimoto, Y. Unsteady Characteristics of Cavitation on an Oscillating Hydrofoil. 1st Report. Experimental Observation of Cavity Behavior. Trans. Jpn. Soc. Mech. Eng. Ser. B 2001, 67, 391–397. [Google Scholar] [CrossRef]
  21. Kato, K.; Dan, H.; Matsudaira, Y. Lock-in Phenomenon of Pitching Hydrofoil with Cavitation Breakdown. JSME Int. J. Ser. B 2006, 49, 797–805. [Google Scholar] [CrossRef]
  22. Zhang, M.; Huang, B.; Wu, Q.; Zhang, M.; Wang, G. The interaction between the transient cavitating flow and hydrodynamic performance around a pitching hydrofoil. Renew. Energy 2020, 161, 1276–1291. [Google Scholar] [CrossRef]
  23. Kravtsova, A.; Markovich, D.M.; Pervunin, K.S.; Timoshevskiy, M.V.; Hanjalić, K. High-speed visualization and PIV measurements of cavitating flows around a semi-circular leading-edge flat plate and NACA0015 hydrofoil. Int. J. Multiph. Flow 2014, 60, 119–134. [Google Scholar] [CrossRef]
  24. Wu, J.; Ganesh, H.; Ceccio, S.L. Multimodal partial cavity shedding on a two-dimensional hydrofoil and its relation to the presence of bubbly shocks. Exp. Fluids 2019, 60, 66. [Google Scholar] [CrossRef]
  25. Föhring, L.S.; Juhl, P.M.; Wittekind, D.K. Cavitation volume behaviour derived from full-scale pressure fluctuations. Ships Offshore Struct. 2023, 18, 541–549. [Google Scholar] [CrossRef]
  26. Huse, E. Pressure Fluctuations on the Hull Induced by Cavitating Propellers; Publication No. 111; Norwegian Ship Model Experiment Tank: Trondheim, Norway, 1972. [Google Scholar]
  27. Pereira, F.A.; Avellan, F.; Dupont, P. Prediction of Cavitation Erosion: An Energy Approach. J. Fluids Eng. 1998, 120, 719–727. [Google Scholar] [CrossRef]
  28. Brandt, A. Noise and Vibration Analysis: Signal Analysis and Experimental Procedures; Wiley: Chichester, UK, 2011. [Google Scholar]
  29. Marine Environment Protection Committee. Ship Underwater Radiated Noise Technical Report and Matrix; Annex to 74th Session; International Maritime Organisation: London, UK, 2019. [Google Scholar]
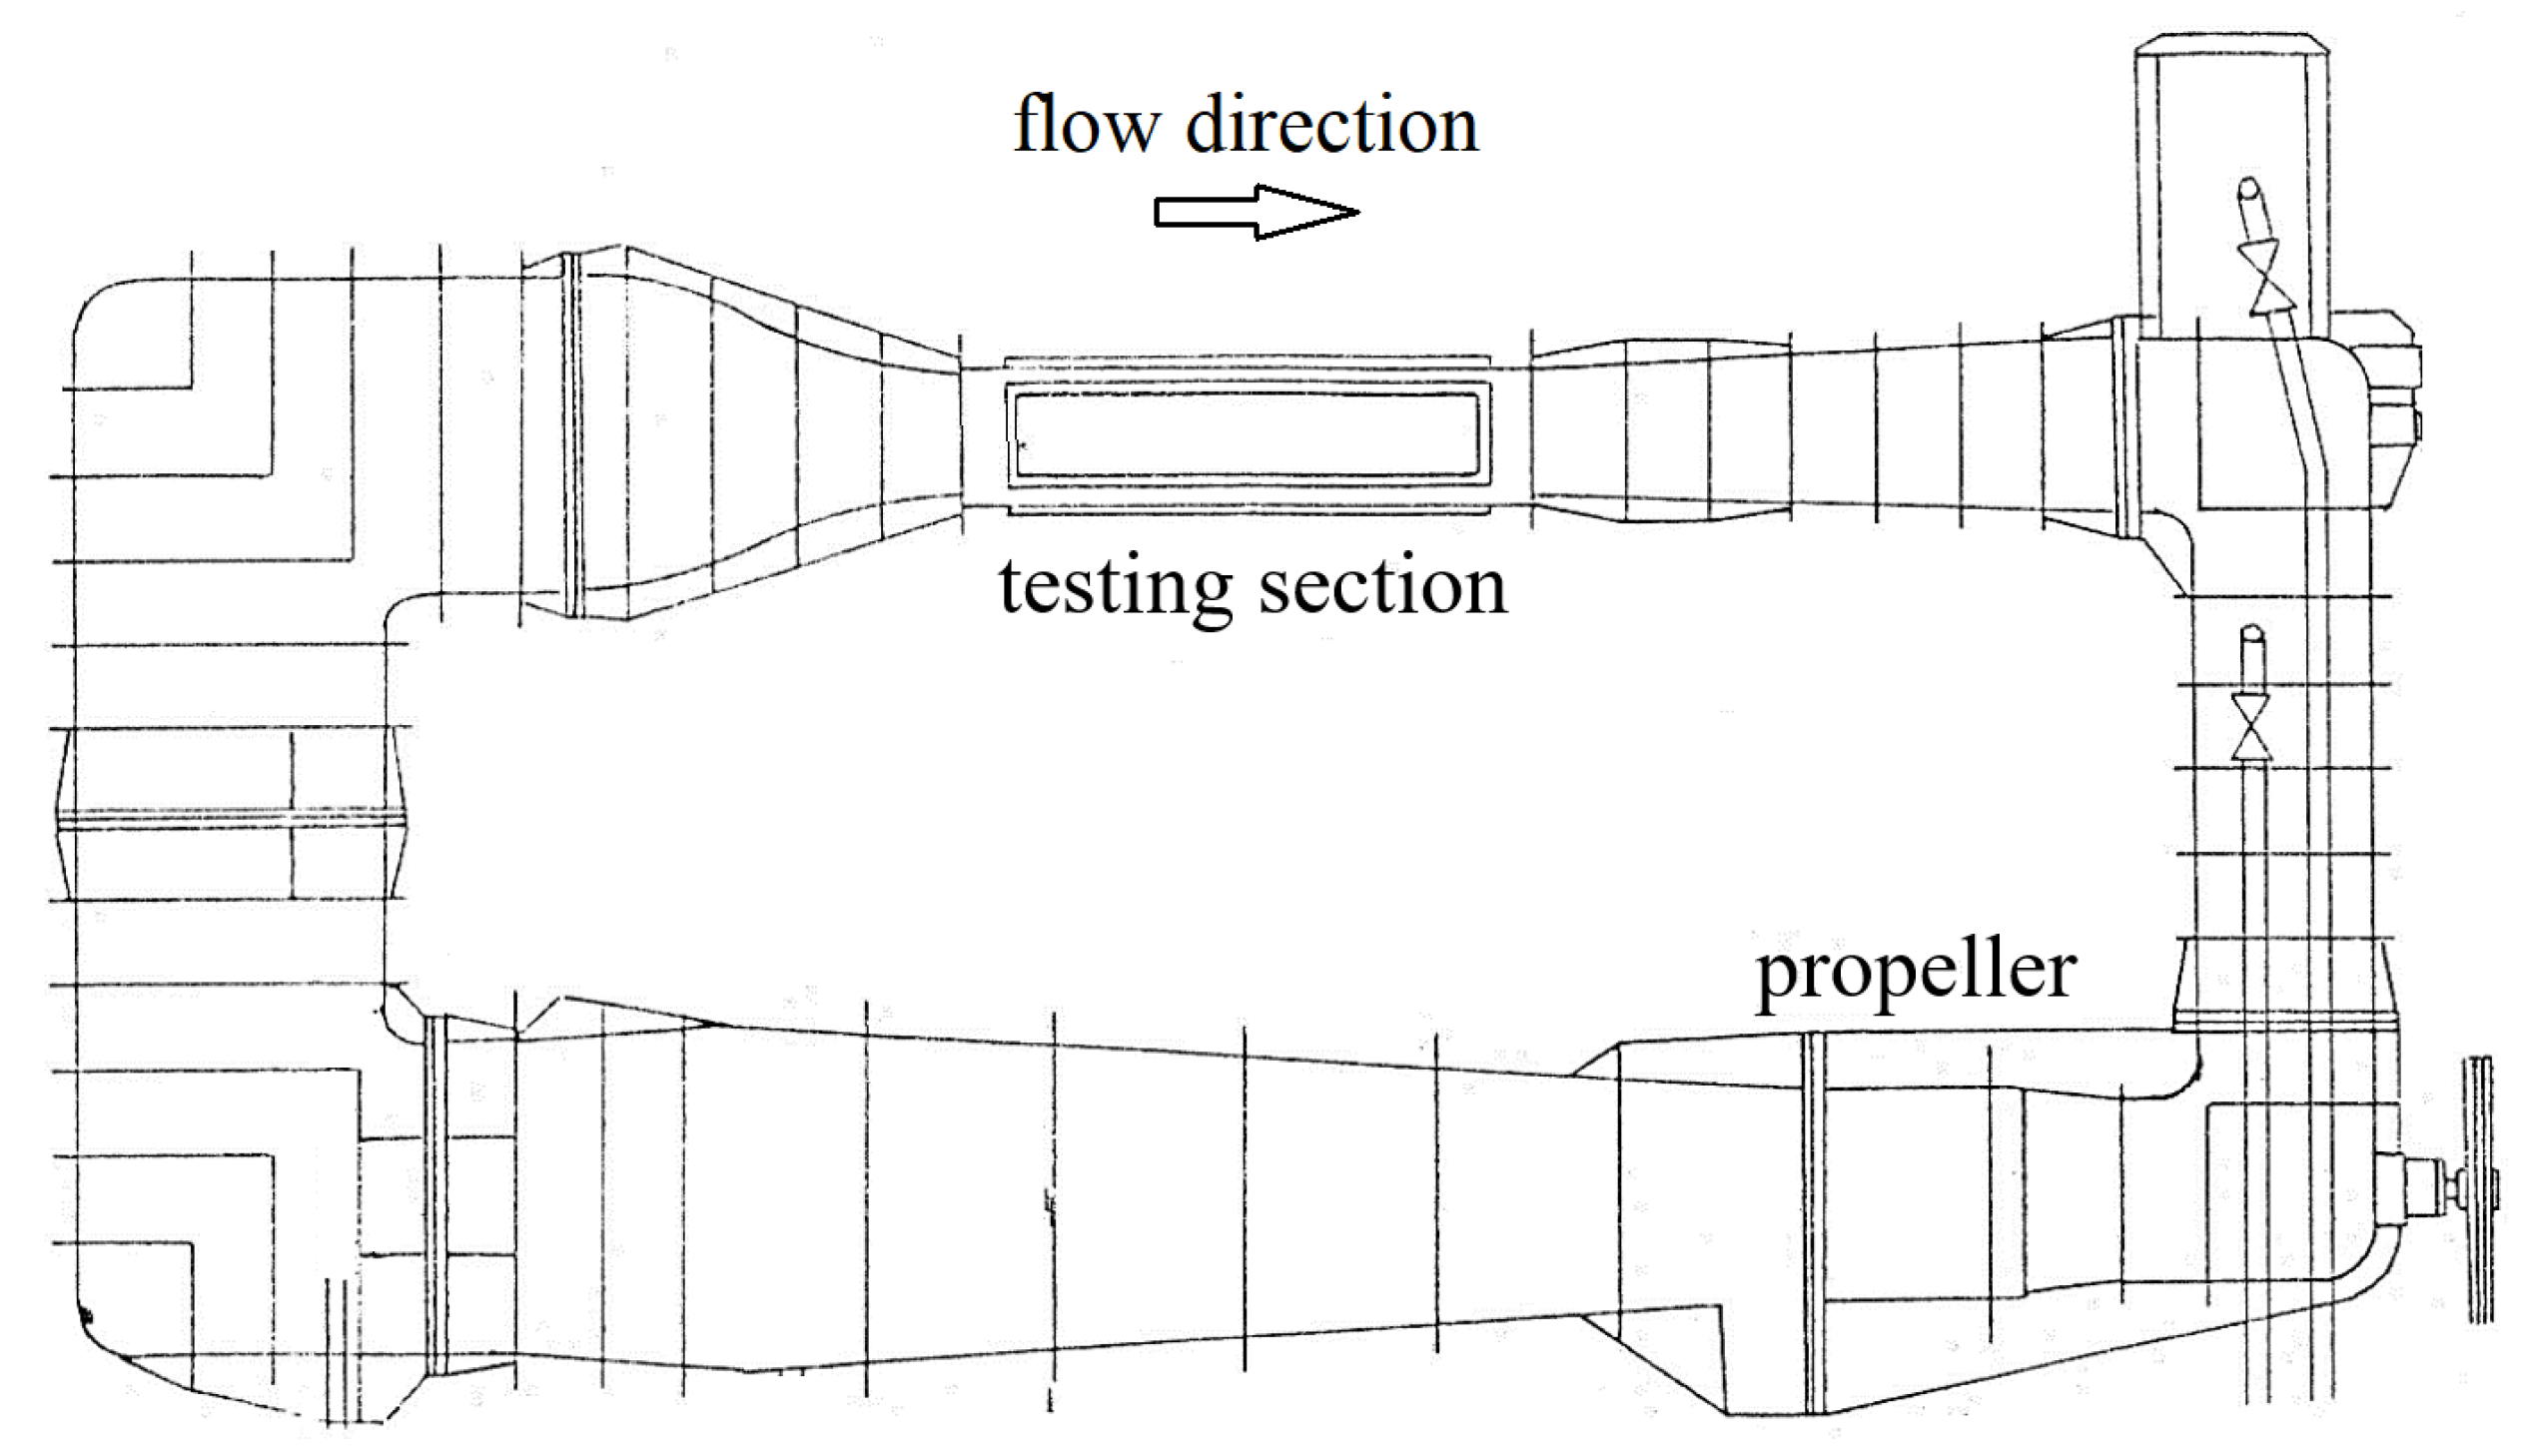
Figure 1. Schematic side view of the cavitation tunnel.
Jmse 11 02023 g001
Figure 2. Schematic arrangement of the hydrofoil and the measuring equipment at the testing section.
Jmse 11 02023 g002
Figure 3. Overview of experimental conditions ( σ and f * ) and sets of evaluated data for Section 3. Outliers are marked with ×.
Jmse 11 02023 g003
Figure 4. Sound pressure level spectra of cavitation noise at the ‘quietest’ operation point and the background noise in the testing section due to flow and hydrofoil drives at σ = 1.37 and f * = 0.37, frequency resolution Δ f = 1 Hz, rectangular window of 1 s, axis normalized with f o s c .
Jmse 11 02023 g004
Figure 5. Mean cycles of (top) the angle of attack, (middle) the sound pressure and (bottom) the calculated cavitation volume at σ = 0.89 and f * = 0.39 with three different courses of AoA.
Jmse 11 02023 g005
Figure 6. Comparison of visual and acoustic observations of an exemplary ⩘ oscillation cycle at σ = 0.89 and f * = 0.39. Left-hand column: time signals of (top) the angle of attack, (middle) the sound pressure and (bottom) the calculated cavitation volume. Right-hand column: three high-speed video frames as marked in the upper graph: (1) growth, (2) maximum extend and (3) collapse at the sound pressure peak. View direction as indicated in Figure 2 with the leading edge of the hydrofoil on the left margin, flow direction from left to right, vertical (blue) grid spacing 1 cm and horizontal (red) grid spacing 2 cm.
Jmse 11 02023 g006
Figure 7. Sound pressure level spectra for all three courses of the angle of attack at σ = 0.89 and f * = 0.39, frequency resolution Δ f = 1 Hz, rectangular window of 1 s, axis normalized with f o s c .
Jmse 11 02023 g007
Figure 8. Mean cycles for (top) angle of attack, (middle) sound pressure and (bottom) cavitation volume at four different cavitation numbers at f * = 0.38.
Jmse 11 02023 g008
Figure 9. Sound pressure level spectra at four different cavitation numbers σ and f * = 0.39 with the ⩘ course of the angle of attack, frequency resolution Δ f = 1 Hz, rectangular window of 1 s, axis normalized with f o s c .
Jmse 11 02023 g009
Figure 10. Mean cycles of (top) the angle of attack, (middle) the sound pressure and (bottom) the calculated cavitation volume at σ = 0.9 | 1.2 and both values of f * (0.33 – and 0.39 - -).
Jmse 11 02023 g010
Figure 11. Sound pressure level spectra at both reduced frequencies f * at σ = 0.9 with the ⩘ course of the angle of attack, frequency resolution Δ f = 1 Hz, rectangular window of 1 s, axis normalized with f o s c .
Jmse 11 02023 g011
Table 1. Operation points.
ParameterValues for Experimental Matrix
cavitation number σ 0.891.041.201.36
reduced oscillation frequency f * 0.320.39
position of maximum AoA within cycle0.3 ( 𝆇 )0.5 (∧)0.7 (⩘)
Disclaimer/Publisher’s Note: The statements, opinions and data contained in all publications are solely those of the individual author(s) and contributor(s) and not of MDPI and/or the editor(s). MDPI and/or the editor(s) disclaim responsibility for any injury to people or property resulting from any ideas, methods, instructions or products referred to in the content.