Article

Optimized Design of the Carrier Structure of an Autonomous Glide Marine Seismometer

1
School of Mechanical Engineering, Hangzhou Dianzi University, Hangzhou 310018, China
2
Second Institute of Oceanography, Ministry of Natural Resources of the People’s Republic of China, Hangzhou 310012, China
*
Author to whom correspondence should be addressed.
J. Mar. Sci. Eng. 2023, 11(11), 2124; https://doi.org/10.3390/jmse11112124
Submission received: 8 September 2023 / Revised: 16 October 2023 / Accepted: 24 October 2023 / Published: 7 November 2023
(This article belongs to the Section Ocean Engineering)

Abstract

:
Mobile Earthquake Recording in Marine Areas by Independent Divers (MERMAID) provides a possibility for long-term and large-scale observation of natural seismic P waves, but it does not have mobility and can only drift with ocean currents, resulting in observation equipment locations that are too sparse or too dense, both of which are not suitable for network observation. Therefore, this paper developed a new type of Autonomous Glide Marine Seismometer (AGMS) with mobility and the ability to adjust the observation position. The AGMS adopts a flying saucer shape, which has better hydrodynamic characteristics and better motion stability. This paper focused on the material, shape, and structure of the pressure-resistant shell for the selection of design and strength checking research. Using the finite element analysis method and introducing the initial defect, the results showed that the yield strength of the pressure-resistant shell decreases with the initial defect value. The calculation results were compared and analyzed with the relevant theoretical formulas and specification calculation results, and all the results met the design requirements. The results of this design could also provide reference for the design of related deep-sea pressure chambers.

1. Introduction

Seismology is an important geophysical discipline for the study of the solid Earth. The current understanding of the Earth’s internal structure, including the crust, mantle, and core, is largely based on data gathered through seismology. The understanding of seismic waves originating from earthquakes that propagate through the Earth’s interior to reach the Earth’s surface and are observed is another aspect of seismology [1,2,3]. With the advent of modern digital broadband seismometers, researchers now have the opportunity to study the Earth’s structure in greater depth and with greater precision. Currently, a large number of digital broadband seismic networks have been deployed around the world. However, compared to the very dense stations on land, there are only a few seismic stations in the oceans—an area encompassing nearly two-thirds of the world—especially in the southern hemisphere. This uneven distribution of stations poses a significant challenge for tectonic and structural studies on a global scale. Due to the lack of seismic stations and low seismicity in ocean basins, there are numerous white patches without data, greatly limiting our understanding of global-scale stratigraphic imaging [3,4].
For a long time, the Ocean Bottom Seismometer (OBS) has been one of the main means of detecting deep structures on the seafloor. These detectors are placed directly on the seabed and can be used to detect both natural earthquakes and artificial seismic profiles. However, the high cost of the seafloor seismograph instrument itself, as well as the geophysical voyages required for OBS delivery, source excitation, and recycling, make this method prohibitively expensive. While progress has been made in recent decades, the coverage is still limited in relation to the vast expanse of the ocean [5,6]. In addition, some countries have carried out the construction of a fixed seabed seismic monitoring network, which is a new platform for observation of the oceans and can realize long-term and real-time seismic observation [7,8,9]. However, the detected area is very small compared to the vast ocean, which greatly limits our understanding of the structure of the Earth’s solidosphere. To address these issues, Professor Nolet proposed the use of Mobile Earthquake Recording in Marine Areas by Independent Divers (MERMAID), which can move with ocean currents to achieve large-scale seismic observation at sea [2,3,10]. In 2003, a prototype was successfully developed, capable of diving down to the maximum depth of the seafloor and recording a magnitude 6 seismic signal from a distance of 5000 km.
Currently, operating mobile ocean seismographs move with ocean currents at a rate of nearly 4 km per day [2,10]. However, we face two problems: a single movable seismograph can be pushed to the shore, resulting in premature loss of its earthquake observation function, and the seismograph may not be in the ideal position to observe earthquakes following the ocean currents, yielding data that does not reveal the global structure. Therefore, we have developed a marine seismometer system with mobility. This system operates differently from traditional fixed land seismic stations, bottom-sitting submarine seismographs, and MERMAID. It is suspended at a certain depth in the sea, allowing it to maneuver with ocean currents. With the ability to correct its position and glide according to commands, it can record earthquake information for extended periods and capture seismic signals from various locations. As a result, it is possible to create a seismic network covering vast ocean areas, which addresses the issue of a lack of seismic networks in the ocean (excluding islands). This system is particularly ideal for conducting tomography in large sea areas. And it can realize near-real-time, large-scale, and long-term observation of seabed seismic signals, thus laying a solid foundation for marine seismic research and the study of the earth’s structure, activity, and processes, as well as support seismic monitoring in the deep sea.
This paper presents a proposed design for a mobile ocean seismometer, which includes a brief overview of its structure design and mode of operation. The pressure-resistant shell is given particular attention, with a study of its design combined with the working mode. An ellipsoid ballast tank composed of 7075-T6 aluminum alloy is designed to meet the necessary specifications. The yield ultimate strength of the pressure-resistant shell is obtained through theoretical calculation and finite element simulation, and the results are thoroughly compared and analyzed to ensure that the ultimate strength meets all service requirements.

2. Materials and Methods

2.1. Design Indicators and Working Modalities

Low background noise near the SOFAR (sound fixing and ranging channel) layer allows for detection of information-rich seismic P waves [1,11,12]. After the AGMS is placed in the appropriate sea area, when the large earthquake signal (≥6 magnitude) is collected at the hovering depth or after reaching the working cycle, it will automatically float and communicate with the monitoring center for data transmission.
The AGMS mainly consists of seven parts: a pressure-resistant shell, observation module, energy module, buoyancy adjustment module, center of gravity adjustment module, central control module, and monitoring module. According to the requirements, the maximum working depth of the seismometer is 2000 m, the maximum sinking and floating speed is 0.35 m/s, and the weight is less than 200 kg. According to the actual application requirements, the working mode of the AGMS can be changed, and the buoyancy adjustment can be used to autonomously complete basic tasks such as diving, hovering, and floating. The process of repeatability is high, and a typical cyclic profile can be divided into five phases (shown in Figure 1).
(1)
Surface stage
The AGMS floats on the surface of the water under maximum buoyancy, with the upper antenna exposed to the water surface to complete the self-test and surface test to ensure that there are no errors in the various commands, and then it waits for the mission command.
(2)
Glide down stage
After receiving instructions to descend, its gravity drainage volume remains unchanged, and the AGMS is adjusted to a negative buoyancy state using a variable speed for a uniform descend. At the same time, the direction and glide angle can be adjusted to glide to the target area.
(3)
Signal acquisition stage
The AGMS is lowered to the desired depth and its buoyancy is adjusted to match gravity, achieving a neutral buoyancy state. At this point, the hydrophone is activated to monitor underwater acoustic signals, and any seismic waves detected are recorded; P-wave information is captured and stored for data analysis. Specifically, data from 2 to 5 min before and after the maximum wave peak are intercepted and saved. If no seismic waves are detected, the device will automatically surface after 7 days of drifting with ocean currents.
(4)
Ascending stage
During the ascending stage, the AGMS turns off its hydrophone and adjusts to a positive buoyancy state before accelerating to a uniform speed and floating to the surface.
(5)
Communication stage
During this phase, the communication module is activated to keep the AGMS in a state of maximum buoyancy and to ensure that the AGMS antenna is above the water’s surface in order to establish contact with the monitoring center for data transmission and GPS positioning. After the data and command are transmitted successfully, clock calibration will be performed. The AGMS position will drift due to ocean currents, wind, waves, etc. This error range will be set according to the specific observation task. For the time being, the distance between its position and the intended observation position should not exceed 500 m. Otherwise, we will use the distance between the GPS position and the target observation area to control the AGMS to adjust its orientation and glide angle, so that it will glide and dive towards the target area.

2.2. Design Solutions for Carrier Profiles and Pressure-Resistant Structures

At present, the main long-period observation platforms are a self-sinking profiling buoy-type ocean observation platforms [13,14] (Array for Real-time Geostrophic Oceanography, Argo) and the underwater Glider [15]. However, these detectors have the following deficiencies in seismic observations: the long column structure of Argo is prone to swaying during underwater observation and, like MERMAID, will face drifting with ocean currents; Glider is capable of long-term maneuvering observations, but it is suitable for continuous sawtooth observations and is not suitable for long-term, fixed-depth, and hovering observations.
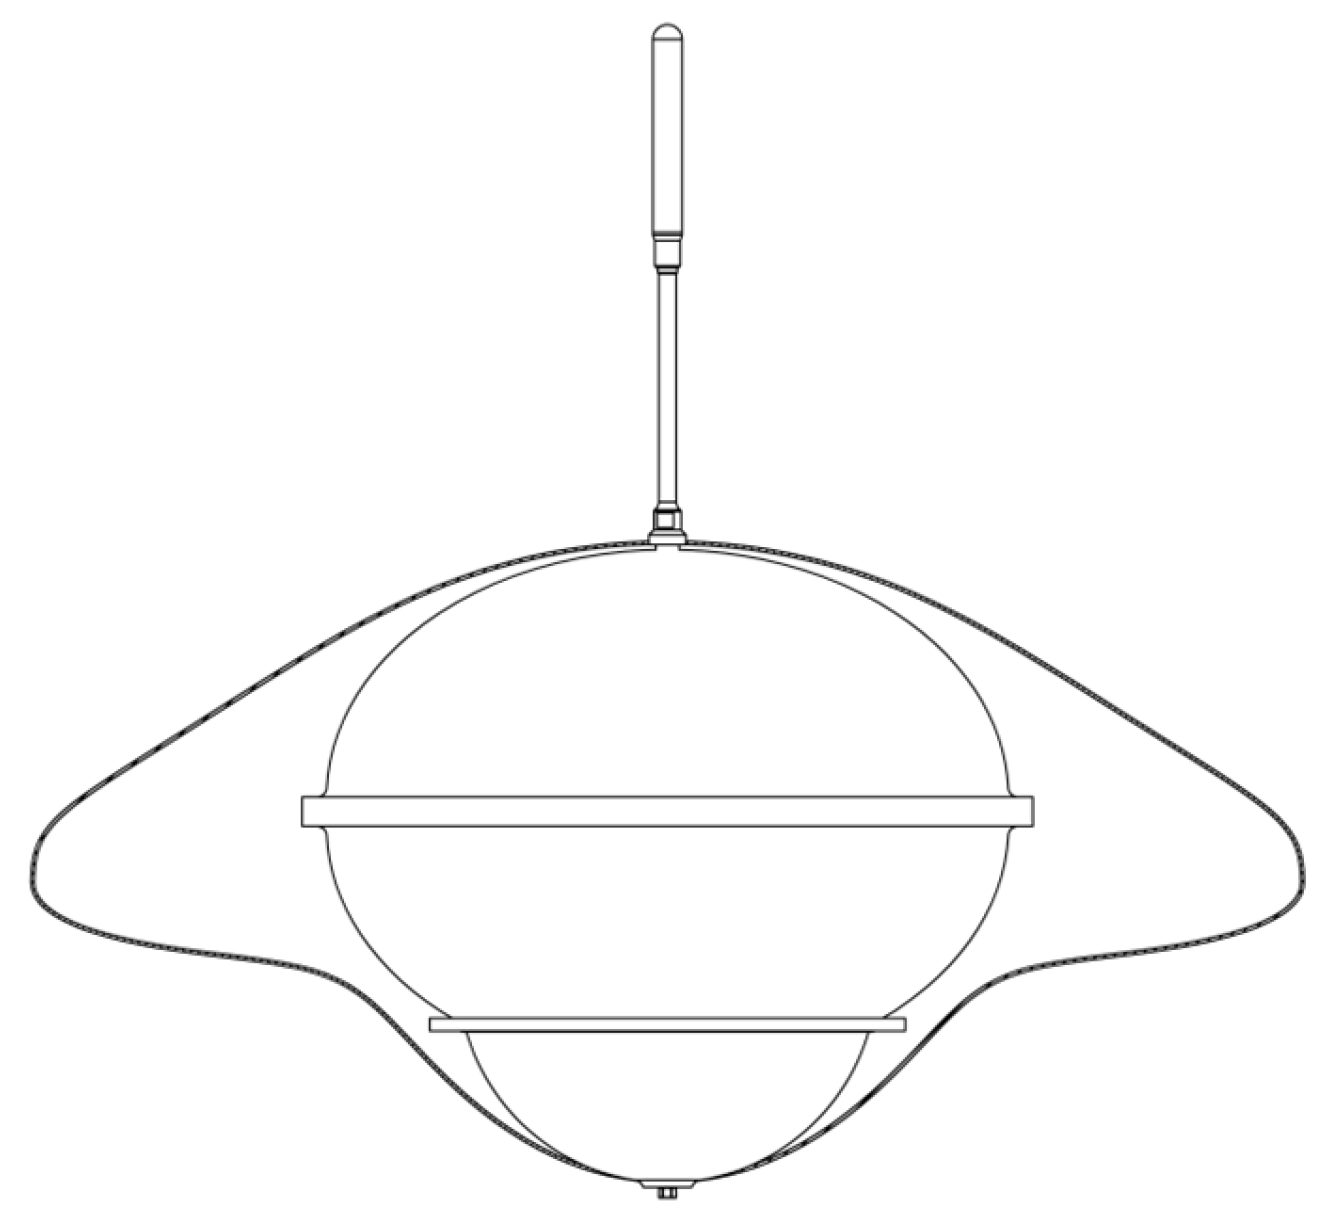
After analyzing the pros and cons of the observation platforms mentioned earlier, we have determined that a circular disk shape is the ideal carrier design. The disk-shaped submersible boasts the same benefits as traditional underwater gliders, including low energy consumption, extended endurance, remote monitoring capabilities, and more. In addition, its smaller steering space allows for increased flexibility in various angles and directions. The rotating shape is also less affected by complex currents, making it suitable for long-term, fixed-depth, and hovering observation. Plus, the disk shape’s hydrodynamic characteristics and superior motion stability make it a better choice than a spherical shape. However, due to the mission’s focus on optimizing the motorized marine seismometer’s gliding dive/lift resistance ratio, we must consider an asymmetric disc-shaped shell with a 1300 mm diameter and 650 mm height. While one-piece molding is difficult, and the structural strength is insufficient, increasing the shell’s thickness to meet the pressure resistance results in a heavier overall weight and higher manufacturing costs. Additionally, adding internal strengthening structures will affect the internal space layout. Thus, to reduce processing costs and improve internal space utilization, we have adopted a pressure-resistant cabin plus fairing combination approach, as shown in Figure 2.

3. Pressure-Resistant Shell Design

The stability, strength, and sealing of the pressure-resistant shell are crucial components of the motorized marine seismograph [16]. The success of the seismograph’s normal operation directly depends on these factors. The pressure-resistant shell is the primary source of buoyancy for the entire equipment, and its own weight and drainage weight ratio have a direct impact on the payload and work efficiency [17]. It is important to note that a smaller weight-displacement ratio of the pressure-resistant shell will reduce the total weight of the submersible and provide greater effective buoyancy. However, while designing the pressure-resistant housing of the seismometer, it is crucial to prioritize its stability and minimize the ratio of its own weight to the displacement to ensure underwater safety of the equipment [18].

3.1. Structural Form and Material Selection

Common pressure tanks include spherical, ellipsoidal, and cylindrical shapes. Considering the strength and working environment, spherical shapes are generally selected for submersible vessels with a depth greater than 800 m [17]. However, the spherical shell has low space utilization, which is not convenient for the layout of the internal cabin. Considering the stroke of the attitude adjustment mechanism, if the spherical pressure hull is used, the total drainage volume will be larger than that of the ellipsoid shell, and the total weight of the equipment will increase. The ellipsoid pressure chamber has a better mass drainage ratio, higher internal space utilization rate, and is conducive to fitting the disc shell. Therefore, a pressurization chamber composed of two ellipsoidal heads is designed.
At present, there are metal and non-metal materials in the ballast tank [19,20,21]. The commonly used diving equipment materials are steel, titanium alloy, aluminum alloy, glass steel, glass, ceramics, etc. The selection of materials is mainly based on assembly type, corrosion resistance, brittleness, specific strength, specific stiffness, formability, and economics. After comprehensive consideration, 7075-T6 aluminum alloy is adopted, because it has good plasticity, heat treatment, and low-temperature strength after solution treatment, and it is mainly used for high-stress structural parts with high strength requirements and strong corrosion resistance [22]. The geometric and physical parameters of the pressurization chamber design are shown in Table 1.

3.2. Base Material Thickness Calculation and Design

The maximum working pressure of the pressure-resistant capsule is 20 MPa, which was formed by die forging and milling. To reduce the redundant weight, according to the standard [23] and Rules for Classification of Diving Systems and Submersibles [24] (CCS), the design temperature was 2 °C, the allowable stress safety factor was S = 0.85, the calculated pressure safety factor K was 1.25, and Pj = 25 MPa; the known yield stress σ for 7075-T6 materials is 440 MPa, and thus the allowable stress of the material is:
[σ] = 0.85σs = 0.85 × 440 MPa = 374 MPa
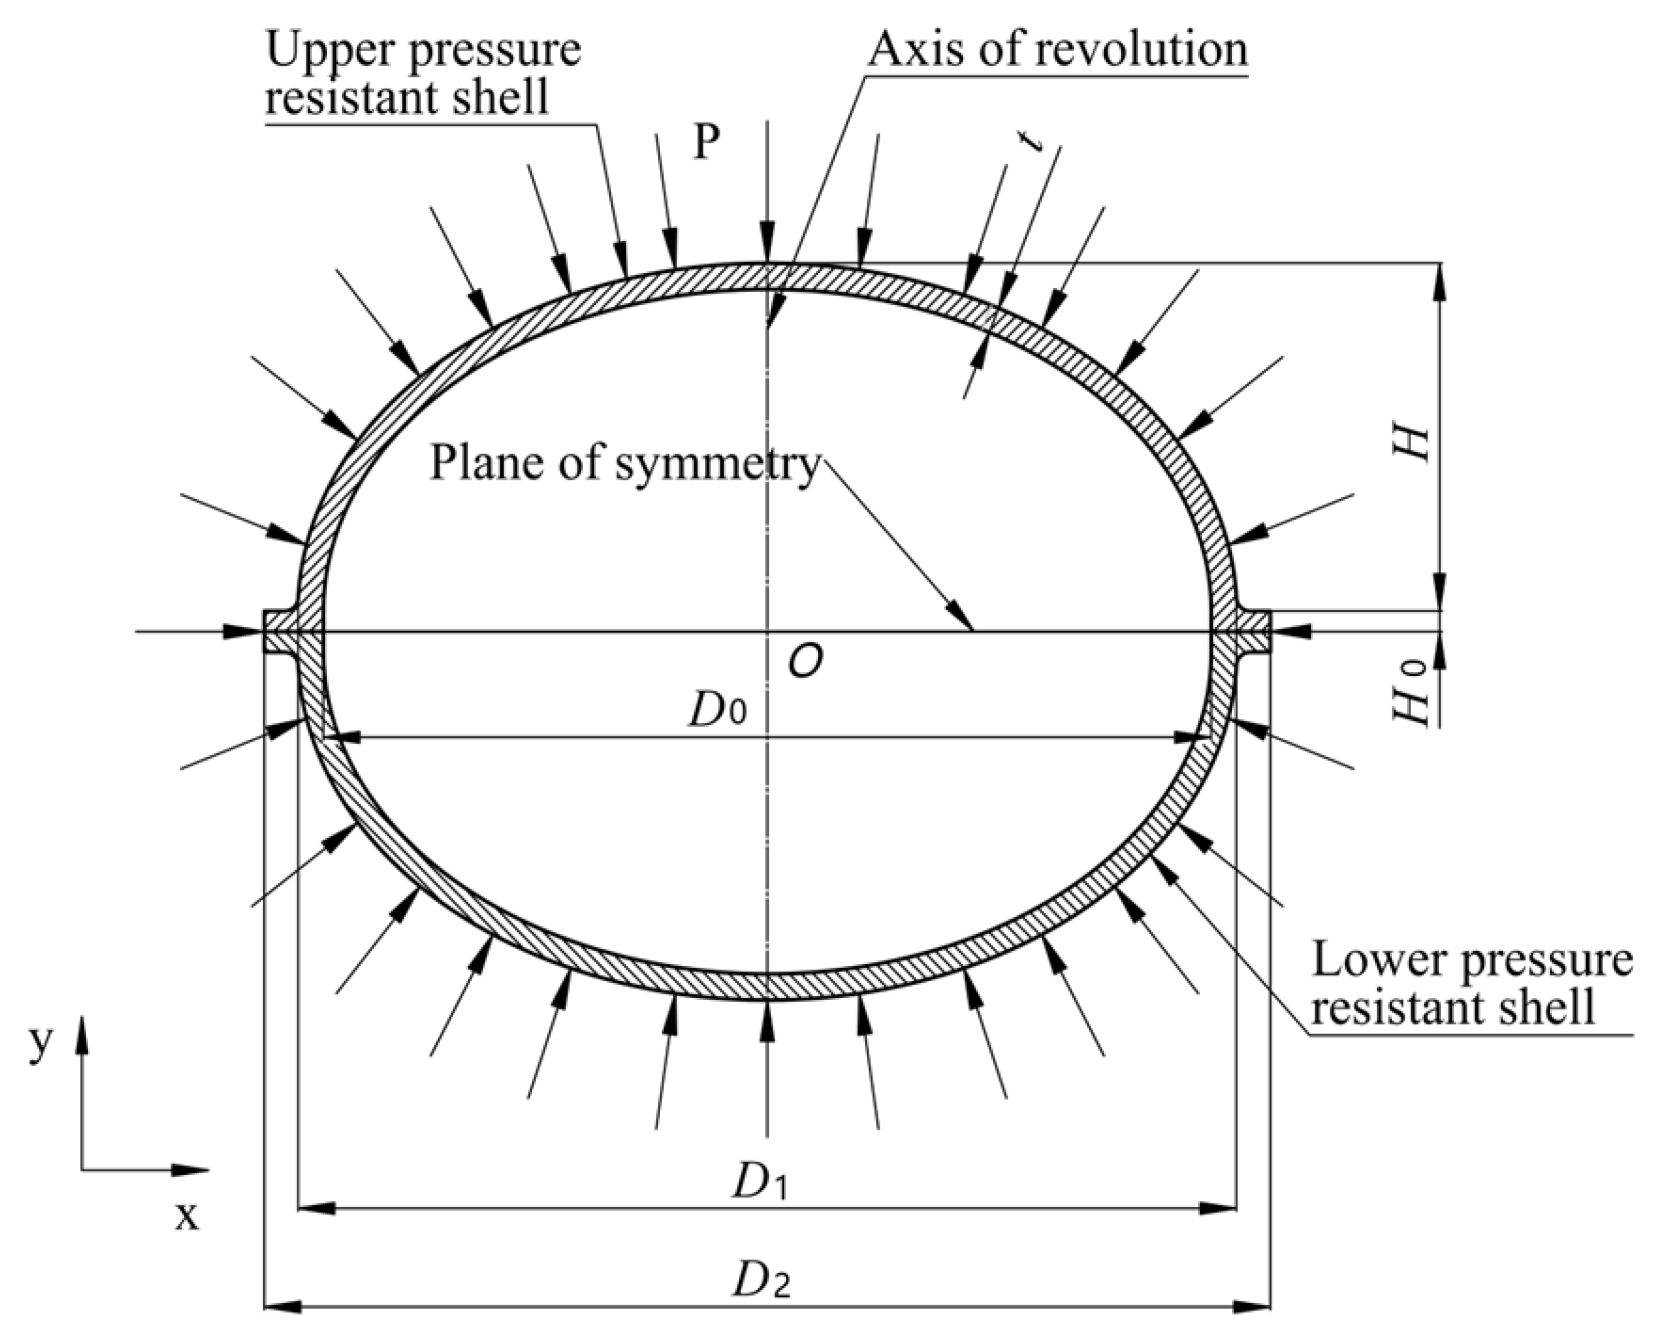
When subject to external pressure as per the CCS guidelines (refer to Figure 3), ellipsoidal heads must undergo strength and stability calibration in line the CCS guidelines, respectively. During calibration, the equivalent radius Rd (mm) is employed as the radius of the spherical shell, and it is calculated using the following formula:
R d = D 0 D 1 4 H mm
In this formula, D0 is the ellipsoid inner diameter, mm; D1 is the ellipsoid outer diameter, mm; and H is the ellipsoid depth, mm.
To calculate the stress of the pressure chamber, we used the following equation:
σ = P j R d 2 t σ   MPa
The thickness of the pressure capsule is calculated according to the following formula:
t h = y P j D 1 2 σ φ 0.5 P j   mm
where y is elliptic head shape factor [23], which is 0.66; Pj is the calculated pressure, Mpa; th is the calculated thickness of the head, mm; D1 is the inner diameter of the head, mm; [σ] is the material’s allowable stress at room temperature, MPa; and φ is the welded joint coefficient, and this value is 1.0.
Replacing each design data with Formula (4), we obtain:
t h 0.66 × 25 × 700 2 × 374 × 1 0.5 × 25 = 15.7 mm
The nominal thickness t is the thickness rounded up after calculating the thickness th and adding the negative deviation of the material thickness C1 and corrosion margin C2. The milling error C1 is 2 mm, corrosion margin C2 is 1 mm, and nominal thickness t ≥ 18.7 mm. According to the buckling check formula in Section 4.6.3 of the CCS, 19 mm, 20 mm, and 21 mm thicknesses were selected for the buckling calculation.

3.3. Stress Calculation and Check

Section 4.6.3 of the CCS was used for the buckling calculation and check:
P e = 0.84 E C 2   MPa
where the elastic modulus of the 7075-T6 material is E = 71 Gpa. The ratio t/R is used to determine C, as shown in the CCS [24].
σ e = P e 2 C   MPa
The pressure-resistant capsule flexion is calculated as:
P cr = C s C z P e   MPa
where Cs is determined by parameters σe/σs and Cz is determined by parameters σe/σs (Please search in CCS [24]).
According to the calculation results in the Table 2, when the thickness t = 19 mm, the strength meets the requirements of the buckling calculation.

4. Stability Analysis of the Pressure-Resistant Shell

As the most important pressure structure, the pressure-resistant shell needs sufficient stability. According to the design size of the pressure-resistant shell, the pressure-resistant spherical shell of the equipment has a radius-thickness ratio of more than 20, which belongs to the range of the thin shell. When they are exposed to high external pressure, the structure can be prone to buckling, and this critical buckling load is highly influenced by the geometric shape, wall thickness, material properties, and initial imperfections [25,26,27]. The instability analysis of the thin shell should be carried out according to the nonlinear large deflection theory [28]. There is a lot of information about the qualitative theory of stability of thin shells. Many scholars have proposed approximate stability formulas for spherical shells [29], and the practical stability formulas for spherical shells mainly include the Kármán–Tsien formula, the Taylor pool formula, and so on.
At present, scholars around the world study the strength stability of the pressure-resistant shell of the submersible by using the finite element analysis method [25,26,27,28,29,30]. They compare and analyze it with the relevant theoretical formulas and related standards. The linear buckling analysis of pressure-resistant shell does not consider the influence of material and geometric nonlinearity. Its stress–strain relationship is linear, and the elastic matrix is only related to the material [31]. If the shell has undergone plastic deformation before destabilization, it is necessary to consider the effects of geometric and material nonlinearities. Nonlinear buckling analysis is performed using a combination of arc length and Newton’s methods, which ensures the realism of the buckling loads [31,32].
In this paper, finite element analysis is used to investigate the strength stability of the pressure-resistant shell. In the first step, linear buckling analysis is carried out to output the nodal displacements of the model. In the second step, the arc length method is used in the nonlinear buckling analysis, and the initial deflection is introduced. The material and geometric nonlinearities are considered to obtain the load–displacement curves with the buckling loads at different initial deflections. And The results are compared with the classical stability theory formula, Kármán–Tsien formula [17], CCS (2018 edition), GL specification [33], and Taylor pool formula [17,30] to analyze whether the pressure chamber meets the use requirements.

4.1. Finite-Element Analysis of Linear Buckling

The pressure-resistant shell is composed of two identical semi-elliptical heads. The head ellipsoid diameter D1 is 700 mm, the height H is 254 mm, and the thickness t is 19 mm. The head flange diameter D2 is 750 mm and the flange thickness H0 is 15 mm. Numerical simulations and buckling analysis of the pressured chamber were carried out under a uniform external pressure P of 25 MPa, as shown in Figure 4. Initially, the geometry is modeled in ANSYS design modeler and the corresponding material properties are assigned using the ‘engineering data’ option in the ANSYS static structural tool. The pressurization chamber is made of high strength aluminum alloy with material properties of modulus of elasticity (E), Poisson’s ratio (ν), and yield strength (σs), as provided by the manufacturer and listed in Table 1 as along with other important parameters. A 10-node solid cell SOLID187 was used to delimit the mesh with a grid size of 10 mm. The local grid size at the rounded corners was 1.5 mm. Ball shell the mesh division and boundary conditions are shown in Figure 5.
The pressure-resistant shell works underwater without any constraints, but it is required to eliminate the structural rigid body displacement for the calculation using the finite element displacement method [34]. This is because the pressure-resistant shell is an axisymmetric structure and the upper and lower head structures are the same. In the force analysis, the structure on the symmetry plane can be considered to have no relative displacement in the Y-axis. Therefore, on the symmetry plane we select points A, B, and C to constrain the six degrees of freedom of the pressure-resistant shell. Take the X-axis that has passed the center point O and the intersection points A and B of the outer contour of the model. Points A and B are displaced freely in the X-axis direction, and the remaining free directions are 0. Take the intersection point C between the Z-axis of the center point O and the outer contour of the model, point C is displaced freely in the Z-axis direction, and the rest of the free directions are 0. At this point, the pressure-resistant shell as a whole is constrained in both the x, y, and z translation and the x, y, and z rotation directions. However, it does not affect the deformation trend of the structure in the stress analysis, which is more in line with the actual situation, as shown in Figure 5. Eigen buckling analysis requires stress stiffness matrix to evaluate the critical buckling pressure. This stress stiffness matrix is calculated in the static structural tool by applying the unit pressure with above mentioned boundary conditions. The stress stiffness matrix of the structure is transferred to eigen buckling analysis tool to evaluate the critical buckling pressure and corresponding mode shapes [35]. The first eight eigenvalue modes are output (see Figure 6), and the results of the first eight eigenvalue buckling are shown in Table 3.
Using the classical theory of spherical shell stability, we can determine the elastic instability pressure of a model with a spherical shell of radius Rd through a theoretical formula, yielding a value of Pe = 150.78 MPa. Upon analyzing the results of linear buckling for the first mode of the first eight order buckling modes of the three grids, we found that the elastic instability forces obtained were 156.9225 MPa, 156.4225 MPa, and 156.2475 MPa, respectively. These values are very similar to the theoretical value, indicating that the deviation between the results obtained using a 10 mm grid and the theoretical value is already very small. After conducting linear buckling finite element analysis, we replaced the value in Table 3 with the corrected result of 156.4225 MPa for Pe. However, the critical instability force obtained after CCS correction was found to be 56.477 MPa.

4.2. Nonlinear Flexion Analysis

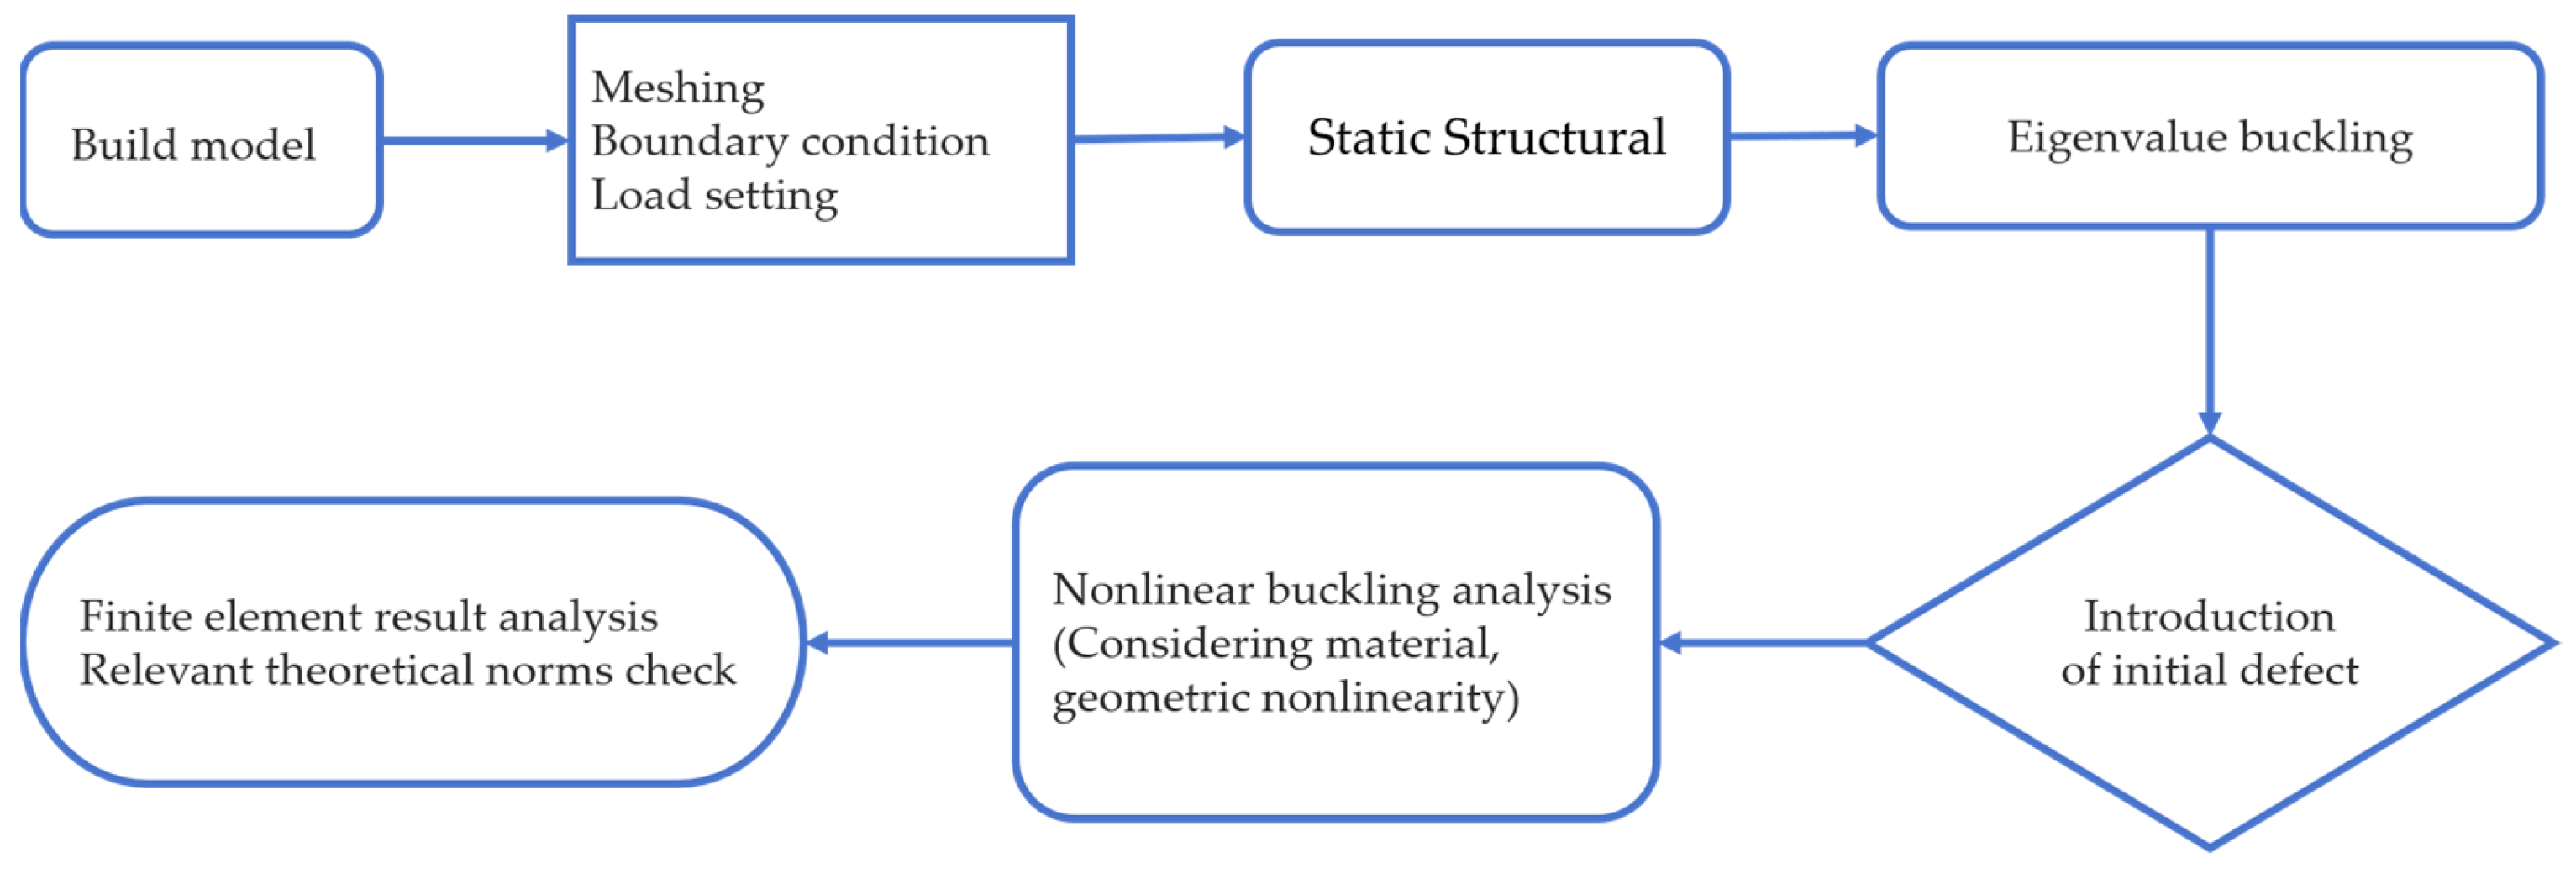
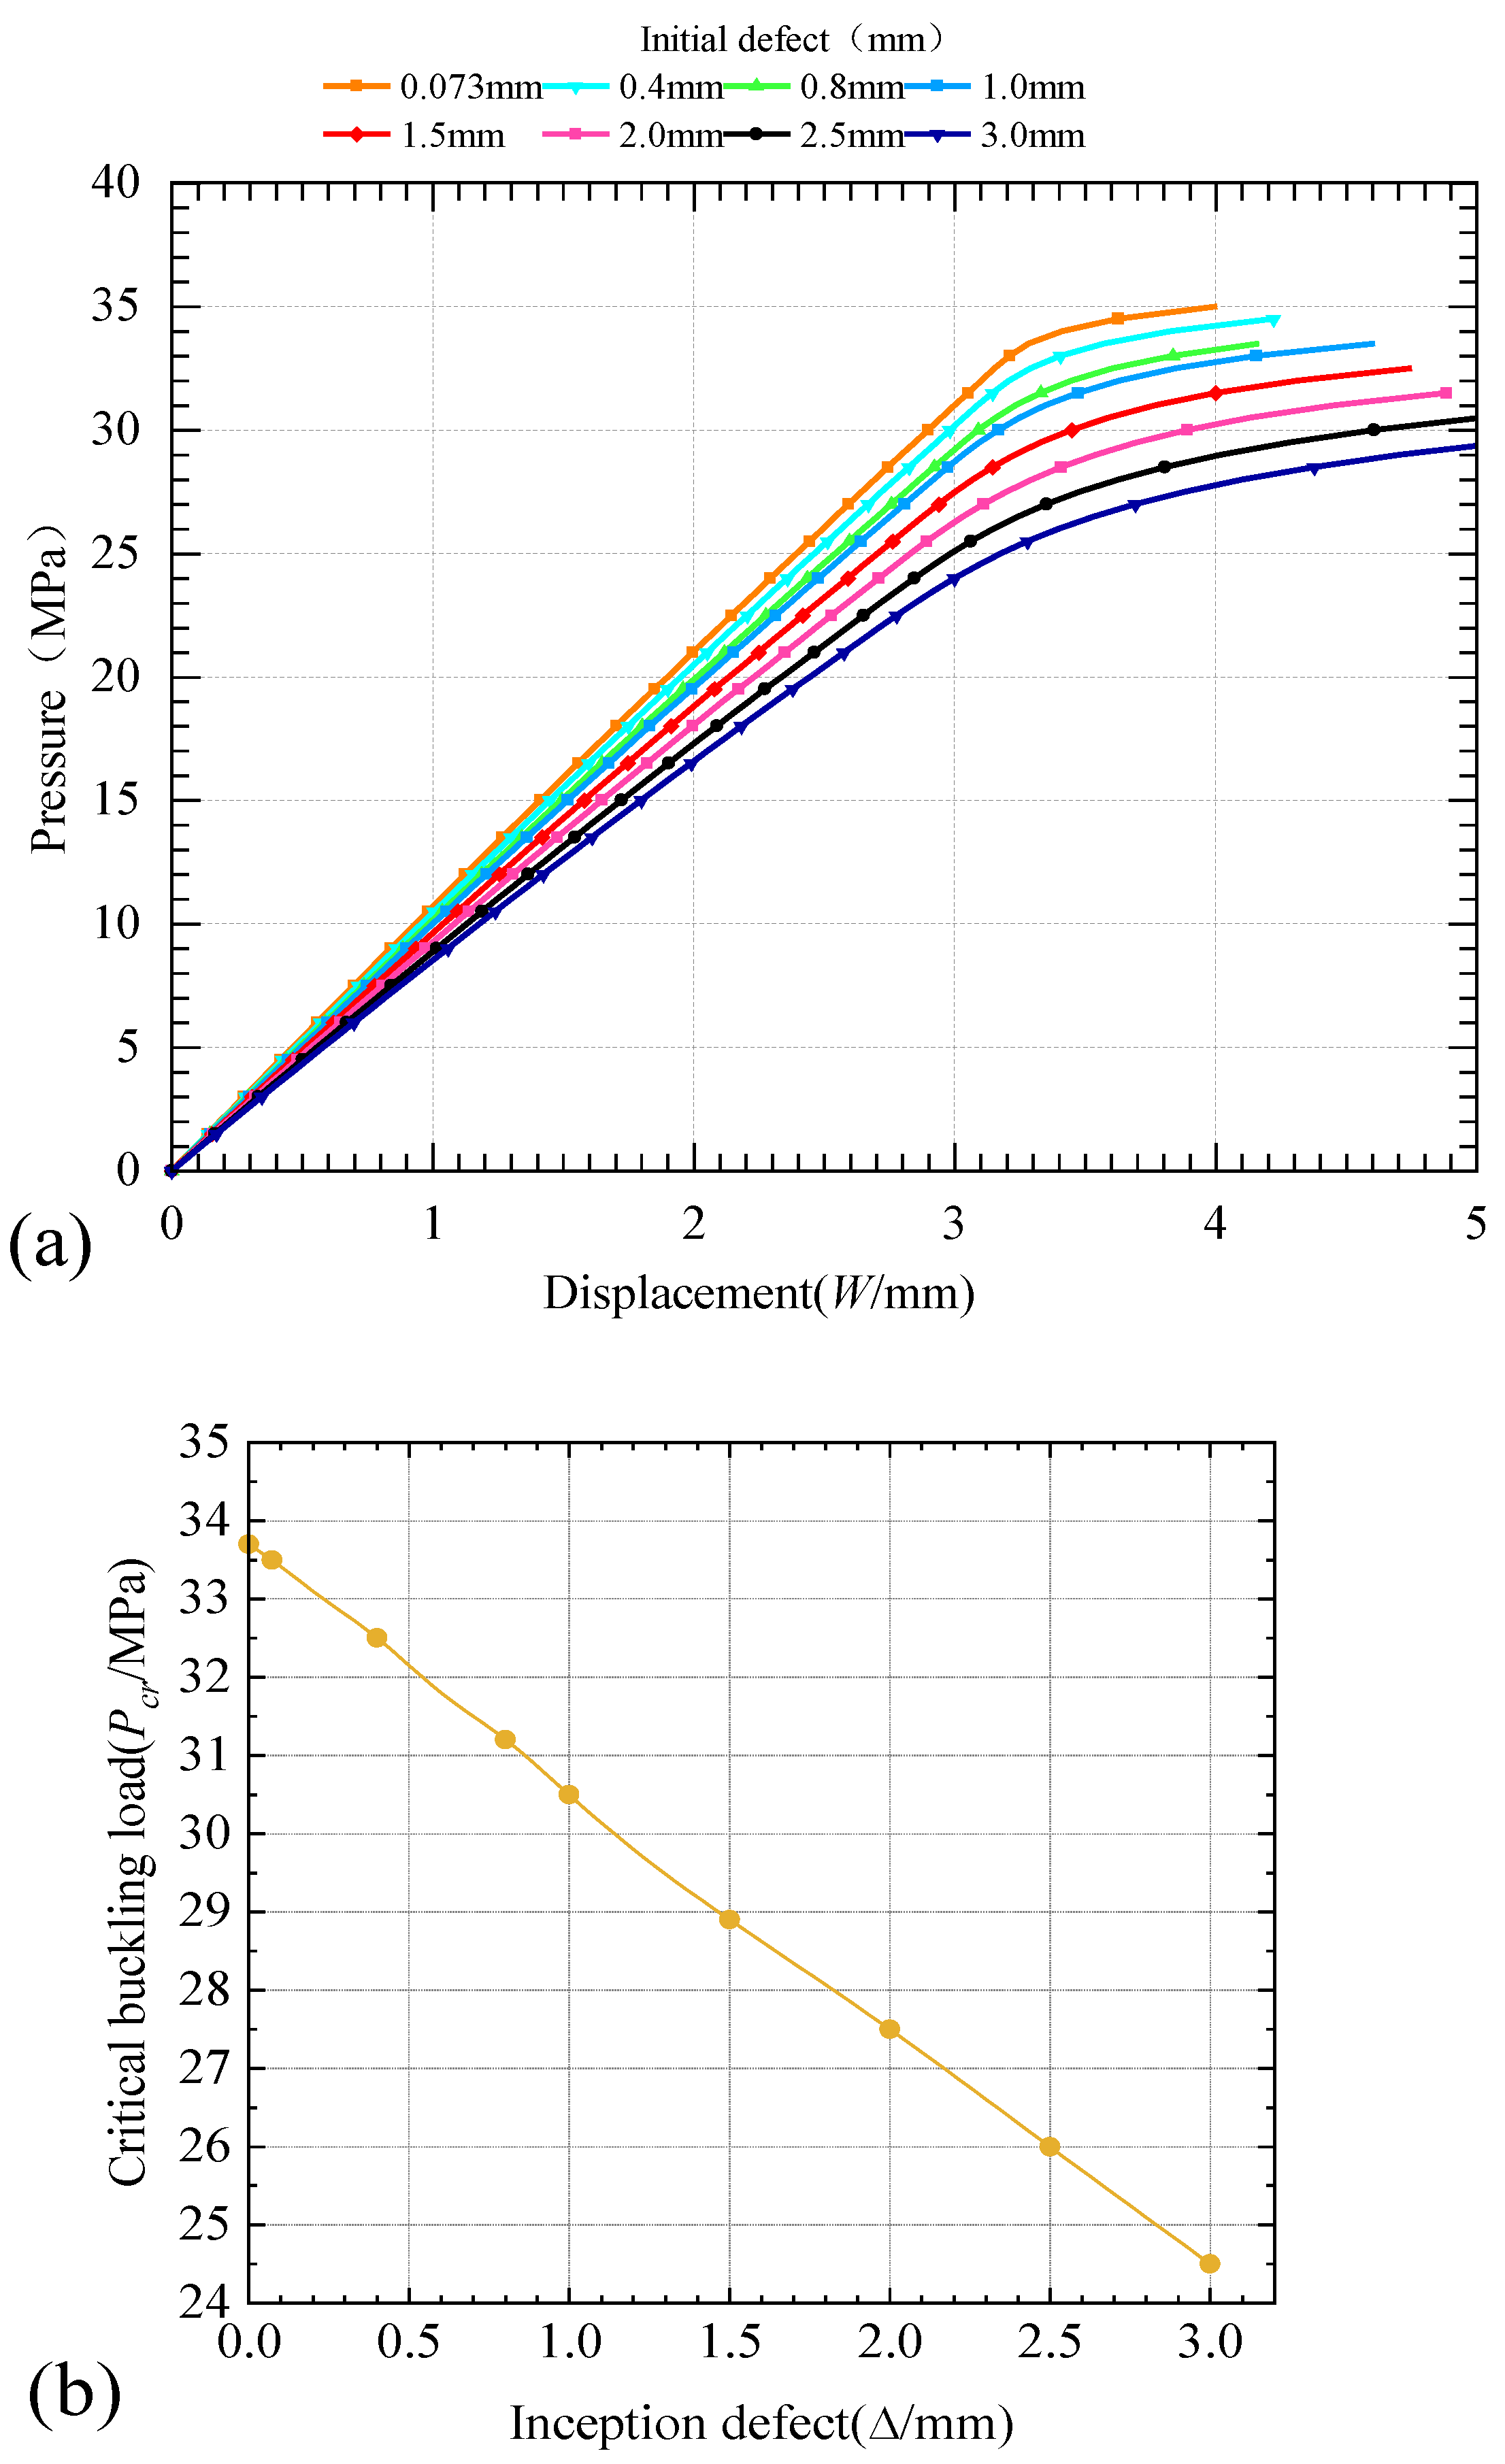
Linear buckling analysis estimates the critical buckling loads of structures within elastic regions without considering geometric imperfections and nonlinearities of materials and geometries, leading to an overestimation of buckling loads and resulting in uncertainty in the design process. To overcome this problem, a nonlinear buckling analysis is performed in a static structural tool by combining geometric defects, geometric nonlinearities, and nonlinearities of the material. The incremental iterations are controlled to finally obtain the load–displacement curve, and the load corresponding to the highest point of the curve is the critical instability force. In the first step, the model is subjected to linear buckling analysis. In the second step, the static arc-length method is used, and the initial defects are introduced. The first order eigenvalue instability mode is used to introduce the initial deflection by modifying the keywords to analyze the impact of initial defects on the stability of the structure. The initial deflection ranges from 0 to 3 mm. The third step is to set the maximum load. The elastic critical instability force is 156.4225 MPa as obtained in the first step, and a pressure greater than this value is applied to the pressure-resistant compartment when nonlinear buckling is carried out and a value of 200 MPa is used. The fourth step sets the time and number of steps of the analysis step, the total time of the step is set to 20,000 s, and the number of steps is set to 400. Figure 7 shows the flowchart of the nonlinear buckling analysis. After several calculations with different initial deflections, the results of pressure and displacement curves applied to the pressure-resistant shell are shown in Figure 8.
According to the findings depicted in Figure 8b, there is a distinct linear correlation between Pcr and the initial deflection f. As the initial deflection f rises, Pcr declines consistently. To be precise, a 2 mm increase in initial deflection resulted in a reduction in Pcr of 18.6%. Consequently, the size of the initial deflection plays a crucial role in the critical instability. Thus, it is essential to improve the machining precision of the pressure-resistant shell to tackle this problem effectively.

4.3. Analysis of Results and Comparison

Table 4 shows the results of calculating the ultimate strength of pressure-resistant shell by different methods including empirical formulas, specifications, and finite element analysis. The experimental mean value of the Kármán–Tsien formula is calculated most closely to CCS and is relatively conservative compared to other methods. Although some methods differ significantly, the initial deflection results of the nonlinear buckling analysis, 0.073 mm, are closer to the GL specification and Taylor pool formulation and higher than the CCS results. According to CCS, when the true sphericity is less than 1.005, the initial defect value is 2.28 mm. The buckling pressure is 26.8 MPa according to Figure 8b, which is only 3.96% different from the CCS result, and its strength can also meet the design requirements. In general, the various methods in the table can provide reliable stability calculation results, and even the most conservative results will be greater than the computational pressure, which indicates that the design scheme is feasible.

5. Discussion

The AGMS is a groundbreaking piece of marine seismic observation equipment that addresses the limitations of its traditional counterparts, including limited mobility, high observation costs, and lengthy data return periods. With its capacity for long-term, fixed-depth, and hovering observations, this technology boasts numerous potential applications in marine seismic network detection. In addition, AGMS can also carry other sensors for observation, such as temperature sensors, salinity sensors, chlorophyll sensors, dissolved oxygen sensors, etc., which all have great application value. In the future, we will further improve the working time and working depth of AGMS so that it can play a more important role in ocean observation like the global Argo program. We delve into the design of a pressure-resistant shell for the motorized marine seismometer, yielding the following conclusions:
(1)
This paper mainly discussed the AGMS’s design parameters and working mode. We accomplished the structural design of a pressure-resistant shell and performed strength analysis and checks. Our calculations affirmed that the design strength satisfied all essential criteria.
(2)
Ellipsoidal pressure-resistant compartments have limited examples, and varying theoretical formulas produce differing calculation results. Additionally, there was a lack of theoretical analyses for high-strength aluminum alloys utilized in deep-sea, pressure-resistant shells. To ensure structural stability, our design considered multiple reference standards and maintained a minimum stability strength value greater than the calculated strength. However, this approach may result in unnecessary weight, which we will optimize through experimentation in subsequent structural optimization studies.
(3)
Moving forward, our team will continue researching the pressure-resistant structure of the motorized marine seismometer, focusing on stability and sealing and conducting pressure tests on the pressure-resistant structure. Since the ellipsoid pressurization chamber has no spherical pressurization structural strength and the aluminum alloy is not ideal for corrosion resistance and in strength, we will consider other structural forms and materials in the future to further improve the working depth and service life of AMGS. We hope that our study will contribute to the observation of ocean networking.

Author Contributions

Conceptualization, X.Z. and K.L.; methodology, X.Z., H.Q. and K.L.; soft-ware, K.L.; validation, K.L., X.Z., H.Q. and F.H.; formal analysis, X.Z., K.L. and H.Q.; investigation, X.Z., K.L. and H.Q.; resources, X.Z. and H.Q.; data curation, K.L.; writing—original draft preparation, K.L., X.Z. and H.Q.; writing—review and editing, K.L., X.Z. and H.Q.; visualization, K.L.; supervision, X.Z. and H.Q.; project administration, X.Z. and F.H.; funding acquisition, X.Z. and H.Q. All authors have read and agreed to the published version of the manuscript.

Funding

This research was funded by the National Key R&D Program of China (Grant No. 2021YFC3101401), the Zhejiang Provincial Key R&D Program (Grant No. 2021C03186), and the Shanghai Jiao Tong University “Deep Blue Program” Fund (Grant No. SL2103).

Data Availability Statement

Data sharing not applicable. No new data were created or analyzed in this study. Data sharing is not applicable to this article.

Conflicts of Interest

The authors declare no conflict of interest.

References

  1. Ding, W.W.; Huang, H.; Zhu, X.; Sun, G.; Niu, X. New mobile oceanic seismic recording system and its application in marine seismic exploration. J. Prog. Geophys. 2019, 34, 292–296. (In Chinese) [Google Scholar]
  2. Hello, Y.; Ogé, A.; Sukhovich, A.; Nolet, G. Modern mermaids: New floats image the deep Earth. EOS Trans. Am. Geophys. Union 2011, 92, 337–338. [Google Scholar] [CrossRef]
  3. Sukhovich, A.; Bonnieux, S.; Hello, Y.; Irisson, J.; Simons, F.J.; Nolet, G. Seismic monitoring in the oceans by autonomous floats. Nat. Commun. 2015, 6, 8027. [Google Scholar] [CrossRef]
  4. Jones, N. Global seismic network takes to the seas. Nature 2014, 507, 151. [Google Scholar] [CrossRef]
  5. Hao, T.Y.; You, Q.Y. Progress of homemade OBS and its application on ocean bottom structure survey. J. Geophys. 2011, 54, 3352–3361. (In Chinese) [Google Scholar]
  6. Wang, J.; Qiu, Y.; Yan, P. A joint investigation using OBS, multi-channel seismic and gravity data across the southwestern sub-basin of the South China Sea. J. Trop. Oceanogr. 2019, 38, 81–90. (In Chinese) [Google Scholar]
  7. Li, F.H.; Lu, Y.G.; Wang, H.B.; Guo, Y.G.; Zhang, F. Research Progress and Development Trend of Seafloor Observation Network. J. Bull. Chin. Acad. Sci. 2019, 34, 321–330. (In Chinese) [Google Scholar]
  8. Yin, L.; Li, Y.B.; Ma, J.G. Present status of marine observation technology. J. Ship Electron. Eng. 2013, 33, 4–7. (In Chinese) [Google Scholar]
  9. Zhu, J.J.; Sun, Z.X.; Lian, S.M.; Yin, J.P.; Li, Z.G. Review on cabled seafloor observatories in the world. J. Trop. Oceanogr. 2017, 36, 20–33. (In Chinese) [Google Scholar]
  10. Nolet, G.; Hello, Y.; Lee, S.V.; Bonnieux, S.; Ruiz, M.C.; Pazmino, N.A.; Deschamps, A.; Regnier, M.M.; Font, Y.; Chen, Y.J. Imaging the Galápagos mantle plume with an unconventional application of floating seismometers. J. Sci. Rep. 2019, 9, 1326. [Google Scholar] [CrossRef]
  11. Joubert, C.; Nolet, G.; Bonnieux, S.; Deschamps, A.; Dessa, J.X.; Hello, Y. P-Delays from Floating Seismometers (MERMAID), Part I: Data Processing. J. Seismol. Res. Lett. 2016, 87, 73–80. [Google Scholar] [CrossRef]
  12. Huang, H.; Zhang, C.; Ding, W.; Zhu, X.; Sun, G.; Wang, H. Design of the Depth Controller for a Floating Ocean Seismograph. J. Mar. Sci. Eng. 2020, 8, 166. [Google Scholar] [CrossRef]
  13. Wang, H.; Zhang, R.; Wang, G.; An, Y.; Jin, B. Quality control of Argo temperature and salinity observation profiles. J. Geophys. 2012, 55, 577–588. (In Chinese) [Google Scholar]
  14. Gould, W.J. From Swallow floats to Argo-the development of neutrally buoyant floats. J. Deep Sea Res. II 2005, 52, 529–543. [Google Scholar] [CrossRef]
  15. Rudnick, D.L.; Davis, R.; Eriksen, C.C.; Fratantoni, D.M. Underwater gliders for ocean research. J. Mar. Technol. Soc. J. 2004, 38, 73–84. [Google Scholar] [CrossRef]
  16. Liu, T. Analysis and Design of Deep-Sea Submersible Structures. Ph.D. Thesis, China Ship Scientific Research Center, Wuxi, China, 2001. Volume 2. (In Chinese). [Google Scholar]
  17. Shi, D.P.; Li, C.C. Structural Strength of Submersible; Shanghai Jiao Tong University Press: Shanghai, China, 1991; p. 6. [Google Scholar]
  18. Zhu, J.M. Design of Submersible; Shanghai Jiaotong University Press: Shanghai, China, 1992. [Google Scholar]
  19. Zhang, Y.; Lai, C.L.; He, W.P.; Liu, Y. Review of materials selection and application of submersible pressure hull structure. J. Ship Sci. Technol. 2022, 44, 1–6. (In Chinese) [Google Scholar] [CrossRef]
  20. Turner, S.E. Underwater implosion of glass spheres. J. Acoust. Soc. Am. 2007, 121, 844–852. [Google Scholar] [CrossRef]
  21. Luo, S.; Li, Y.; Wang, W. Development and prospects of non-metallic submersible pressure hull. Chin. J. Ship Res. 2020, 15, 9–18. (In Chinese) [Google Scholar]
  22. YST479-2005; General Industrial Aluminum and Aluminum Alloy Forgings. National Nonferrous Metals Standardization Technical Committee: China.
  23. GB 150. 1~150. 4—2011. S. Pressure Vessel, China. National Standard of the People’s Republic of China. Available online: https://members.wto.org/crnattachments/2011/tbt/CHN/11_1135_00_et.pdf (accessed on 1 June 2022).
  24. China Classification Society. Rules for Classification of Diving Systems And Submersibles; People’s Communications Press: Beijing, China, 2018; pp. 9+22–47. Available online: https://www.ccs.org.cn/ccswzen/articleDetail?id=201910000000003438 (accessed on 1 June 2022).
  25. Zhang, J.; Wang, W.; Wang, F.; Tang, W.; Cui, W.; Wang, W. Elastic buckling of externally pressurized Cassini oval shells with various shape indices. Thin-Walled Struct. 2018, 122, 83–89. [Google Scholar] [CrossRef]
  26. Jansen, E. The Influence of Initial Geometric Imperfections on Composite Shell Stability and Vibrations. In Stability and Vibrations of Thin Walled Composite Structures; Abramovich, H., Ed.; Woodhead Publishing: Vienna, Austria, 2017; pp. 509–548. [Google Scholar]
  27. Wagner, H.N.R.; Niewohner, G.; Pototzky, A.; Huhne, C. On the imperfection sensitivity and design of tori-spherical shells under external pressure. J. Int. Press. Vessel Pip. 2021, 191, 104321. [Google Scholar] [CrossRef]
  28. Zhou, C.T. Elastic-Plastic Stability Theory of Thin Shells; National Defense Industry Press: Beijing, China, 1979; pp. 1–125. [Google Scholar]
  29. Chen, T.Y.; Chen, B.Z. Mechanics of Elastic Thin Shells, 1st ed.; Huazhong Institute of Technology Press: Hubei, China, 1983; pp. 177–241. [Google Scholar]
  30. Renhua, W.; Minghua, Y.; Zili, W. Ultimate strength analysis of pressure spherical hull of manned deep-ocean submersibles. J. Jiangsu Univ. Sci. Technol. Nat. Sci. Ed. 2006, 20, 1–5. (In Chinese) [Google Scholar]
  31. Renhua, W.A.; Minghua, Y.U.; Liangbi, L.I. Influence of initial deflection on plastic stability of manned deep-sea submersible’s pressure sphere hull. J. Ocean. Eng. 2005, 23, 111–115. (In Chinese) [Google Scholar]
  32. Narayana, Y.V.; Gunda, J.B.; Reddy, P.R.; Markandeya, R. Non-linear Buckling and Post-buckling Analysis of Cylindrical Shells Subjected to Axial Compressive Loads: A Study on Imperfection Sensitivity. Nonlinear Eng. 2013, 2, 83–95. [Google Scholar] [CrossRef]
  33. Germanischer Lloyd Aktiengesellschaft. Rules for Classification and Construction, 1-Ship Technology, 5-Underwater Technology, 2-Manned Submersibles. S. Sweden: Germanischer Lloyd Aktiengesellschaft in 2009 (GL). 2009. Available online: https://sea.edu/wp-content/uploads/2022/02/Guidelines_for_Design_and_Contruction_of_Large_Modern_Yacht_Rigs.pdf (accessed on 5 June 2022).
  34. Li, L.; Wang, R.; Yu, M.; Wang, Z. Nonlinear Finite Element Analysis of Pressurized Spherical Shell for Manned Deep Submersible. J. Shipbuild. China 2005, 46, 11–18. (In Chinese) [Google Scholar]
  35. Barathan, V.; Rajamohan, V. Nonlinear buckling analysis of a semi-elliptical dome: Numerical and experimental investigations. J. Thin-Walled Struct. 2022, 171, 108708. [Google Scholar] [CrossRef]
  36. Wang, X.S. Pressure Vessel; East China University of Science and Technology Press: Shanghai, China, 2018; p. 107. [Google Scholar]
Figure 1. Working cycle section of the motorized marine seismometer.
Jmse 11 02124 g001
Figure 2. Shape and pressure-resistant structure of mobile marine seismometer.
Jmse 11 02124 g002
Figure 3. Ellipsoidal seal head.
Jmse 11 02124 g003
Figure 4. Schematic of the pressure shell with load and boundary conditions.
Jmse 11 02124 g004
Figure 5. Setting of pressure-resistant shell boundary conditions and result of static stress analysis.
Jmse 11 02124 g005
Figure 6. Eigenvalue buckling modes.
Jmse 11 02124 g006
Figure 7. Flow chart of the nonlinear buckling analysis.
Jmse 11 02124 g007
Figure 8. (a) Applied pressure vs. displacement curve under different initial defects; (b) effect of initial deflection on flexion strength.
Jmse 11 02124 g008
Table 1. Geometric and physical parameters of ballast chamber design.
ItemsSymbols/UnitsParameter
Model shape/spheroidicity
The ratio of the length axis/1.38
External diameter D 1 / mm 700
Modulus of elasticity E / MPa 71,000
Poisson ratio ν 0.33
Limit of proportionalityσp/MPa300
Yield strength σ S 440
Tensile strength σ b / MPa 500
Table 2. Buckling results of different thicknesses.
t/mm192021
C0.0360.03720.0392
CS0.3850.3730.355
CZ0.93780.940.959
Pj/Mpa252525
Pe/Mpa77.2982.5391.65
Pcr/Mpa27.90528.9231.20
Table 3. Buckling results of the first 8 order eigenvalues with 10 mm mesh.
The Flexion Mode OrderGrid Buckling FactorElastic Instability Force (MPa)
15.2569156.4225
25.2605156.5123
35.4482161.205
45.4485161.2125
55.4686161.715
65.469161.725
76.0304175.76
86.0383175.9575
Table 4. The buckling critical values obtained by different methods.
Computational MethodPj (MPa)Pcr (MPa)
Kármán–Tsien formula2540.12
The experimental mean value of Kármán–Tsien formula [36]2527.47
CCS2527.905
GL standard2534.41
Taylor pool formula2535.19
Linear flexion (corrected by CCS)2556.477
Nonlinear flexion2533.5
Disclaimer/Publisher’s Note: The statements, opinions and data contained in all publications are solely those of the individual author(s) and contributor(s) and not of MDPI and/or the editor(s). MDPI and/or the editor(s) disclaim responsibility for any injury to people or property resulting from any ideas, methods, instructions or products referred to in the content.