
Stability Analysis and Environmental Influence Evaluation on a Hybrid Mooring System for a Floating Offshore Wind Turbine


Abstract
:1. Introduction
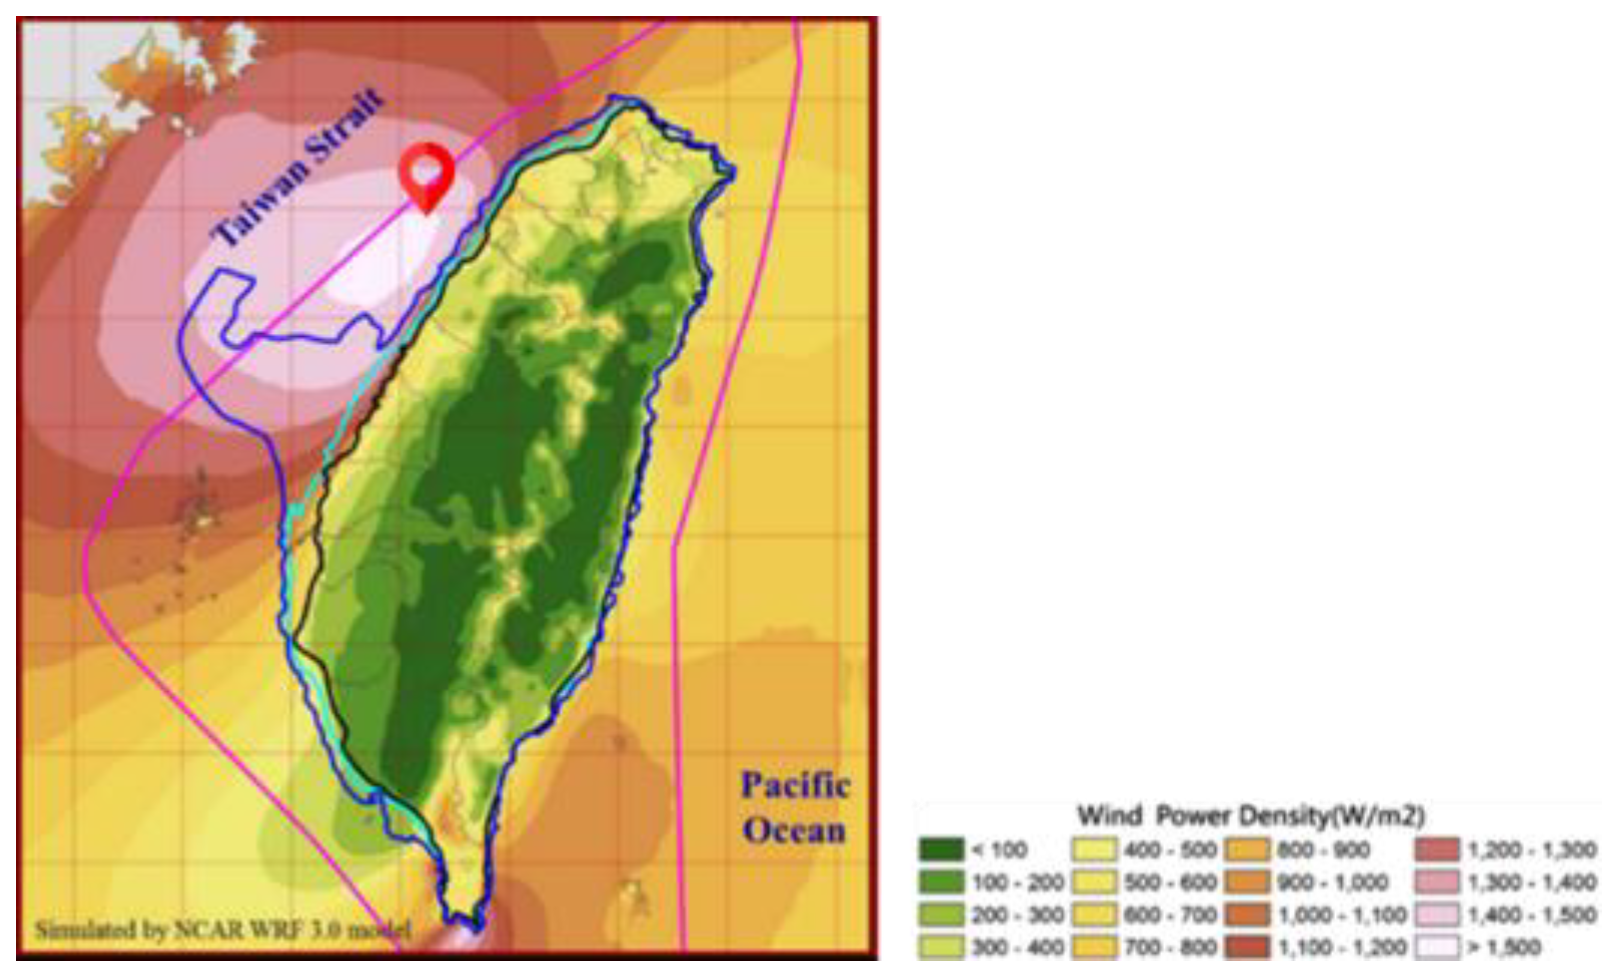
1.1. Marine Data
1.2. Floating Platform and Wind Turbine
1.3. Synthetic Fiber Ropes
1.4. Hybrid Mooring System
1.4.1. Theory and Properties
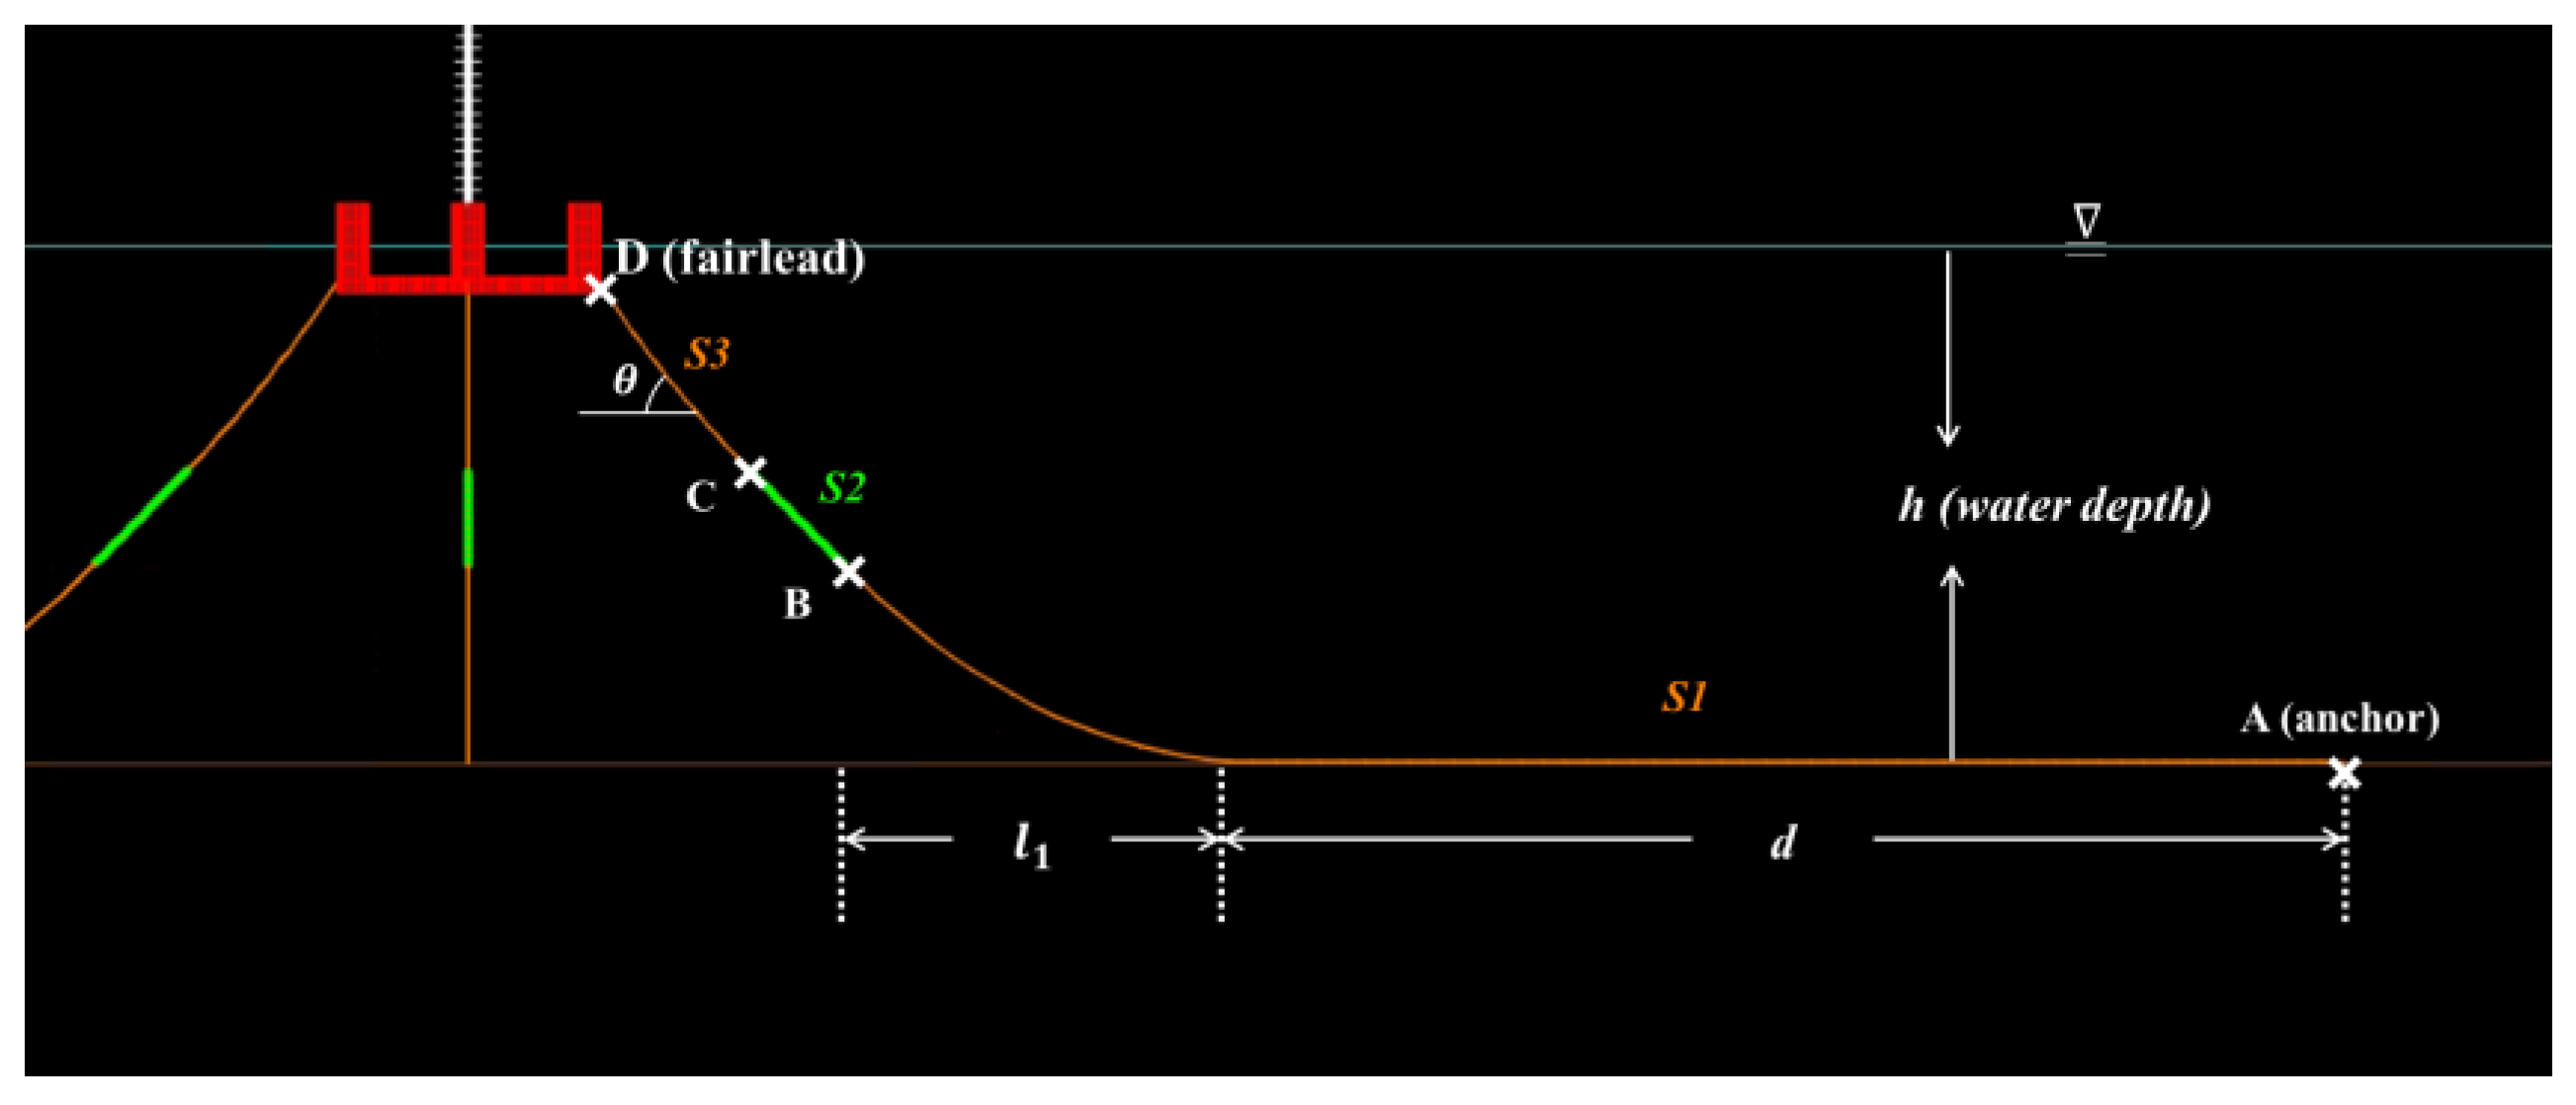
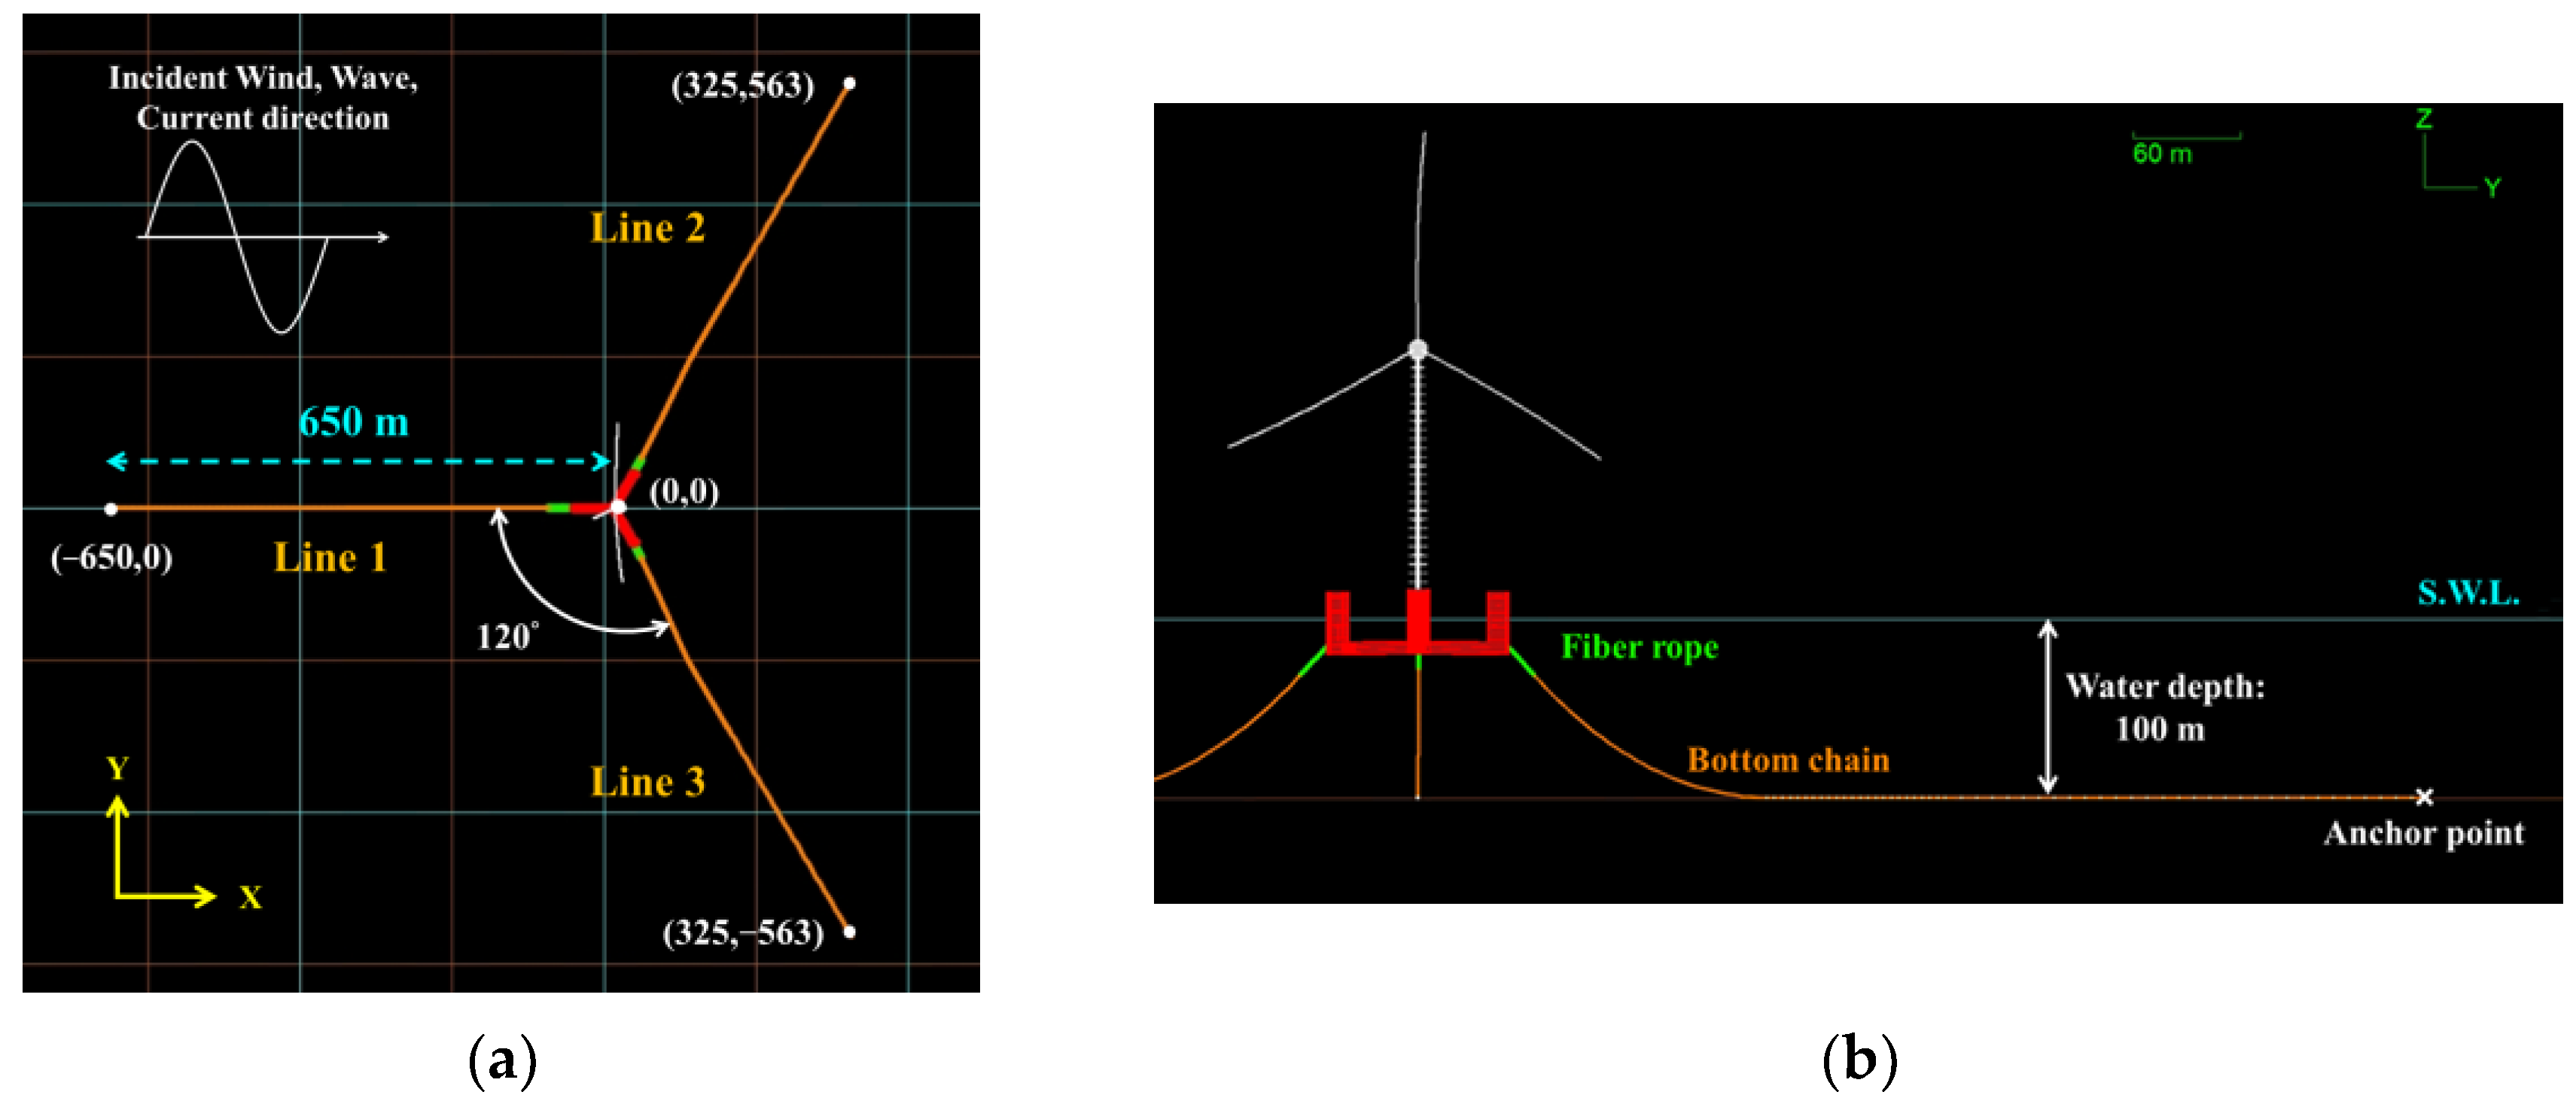
1.4.2. Applications and Design Symbols
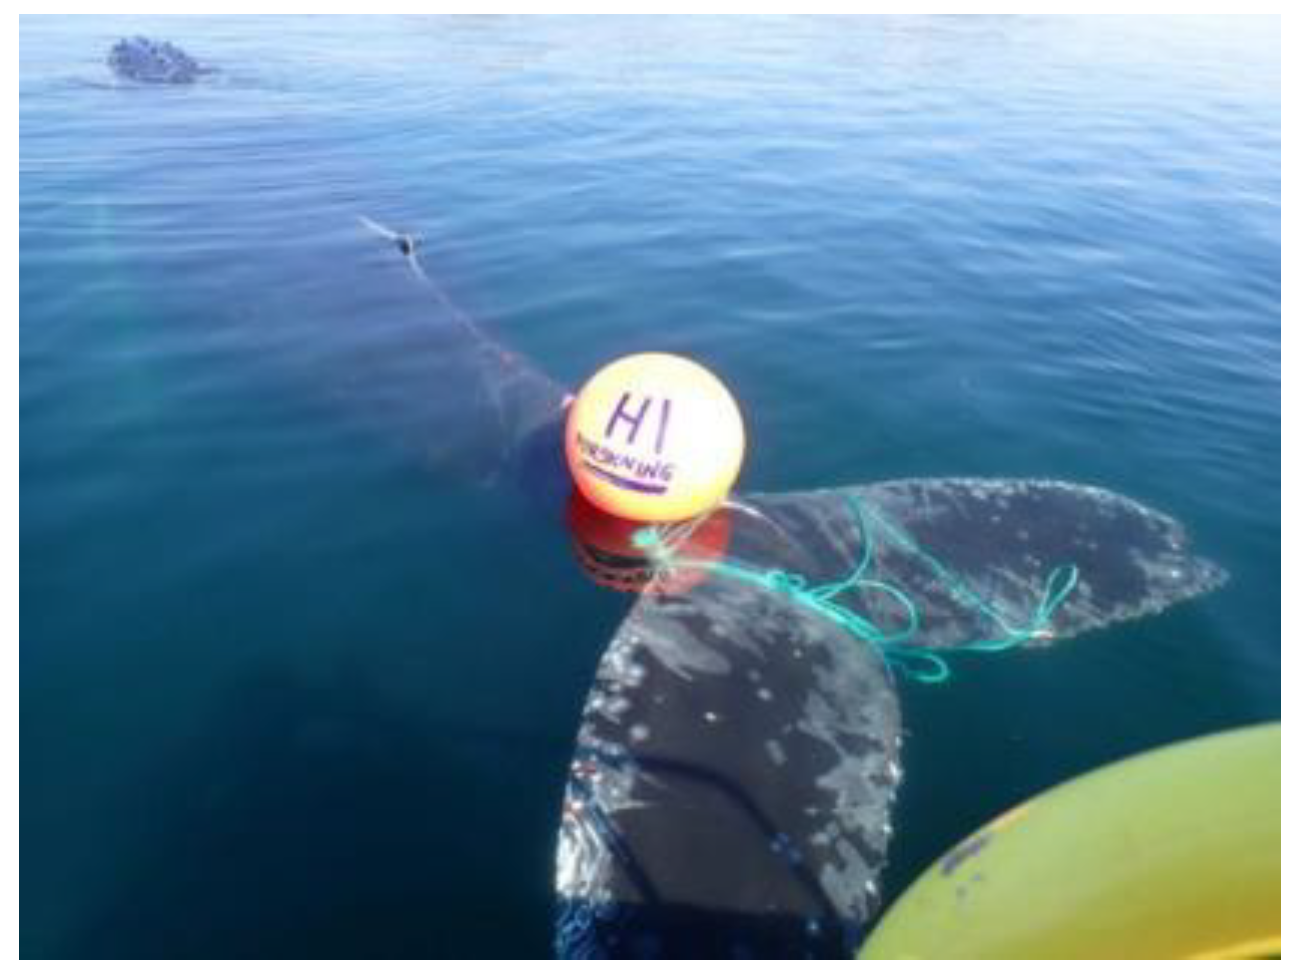
1.5. Entanglement Assessment
- Tension characteristics;
- Mooring becomes slack and tensioned due to the floater motion. Slack mooring has a higher entanglement risk. The tension characteristics are described in terms of the relation between restoring force and platform surge motion;
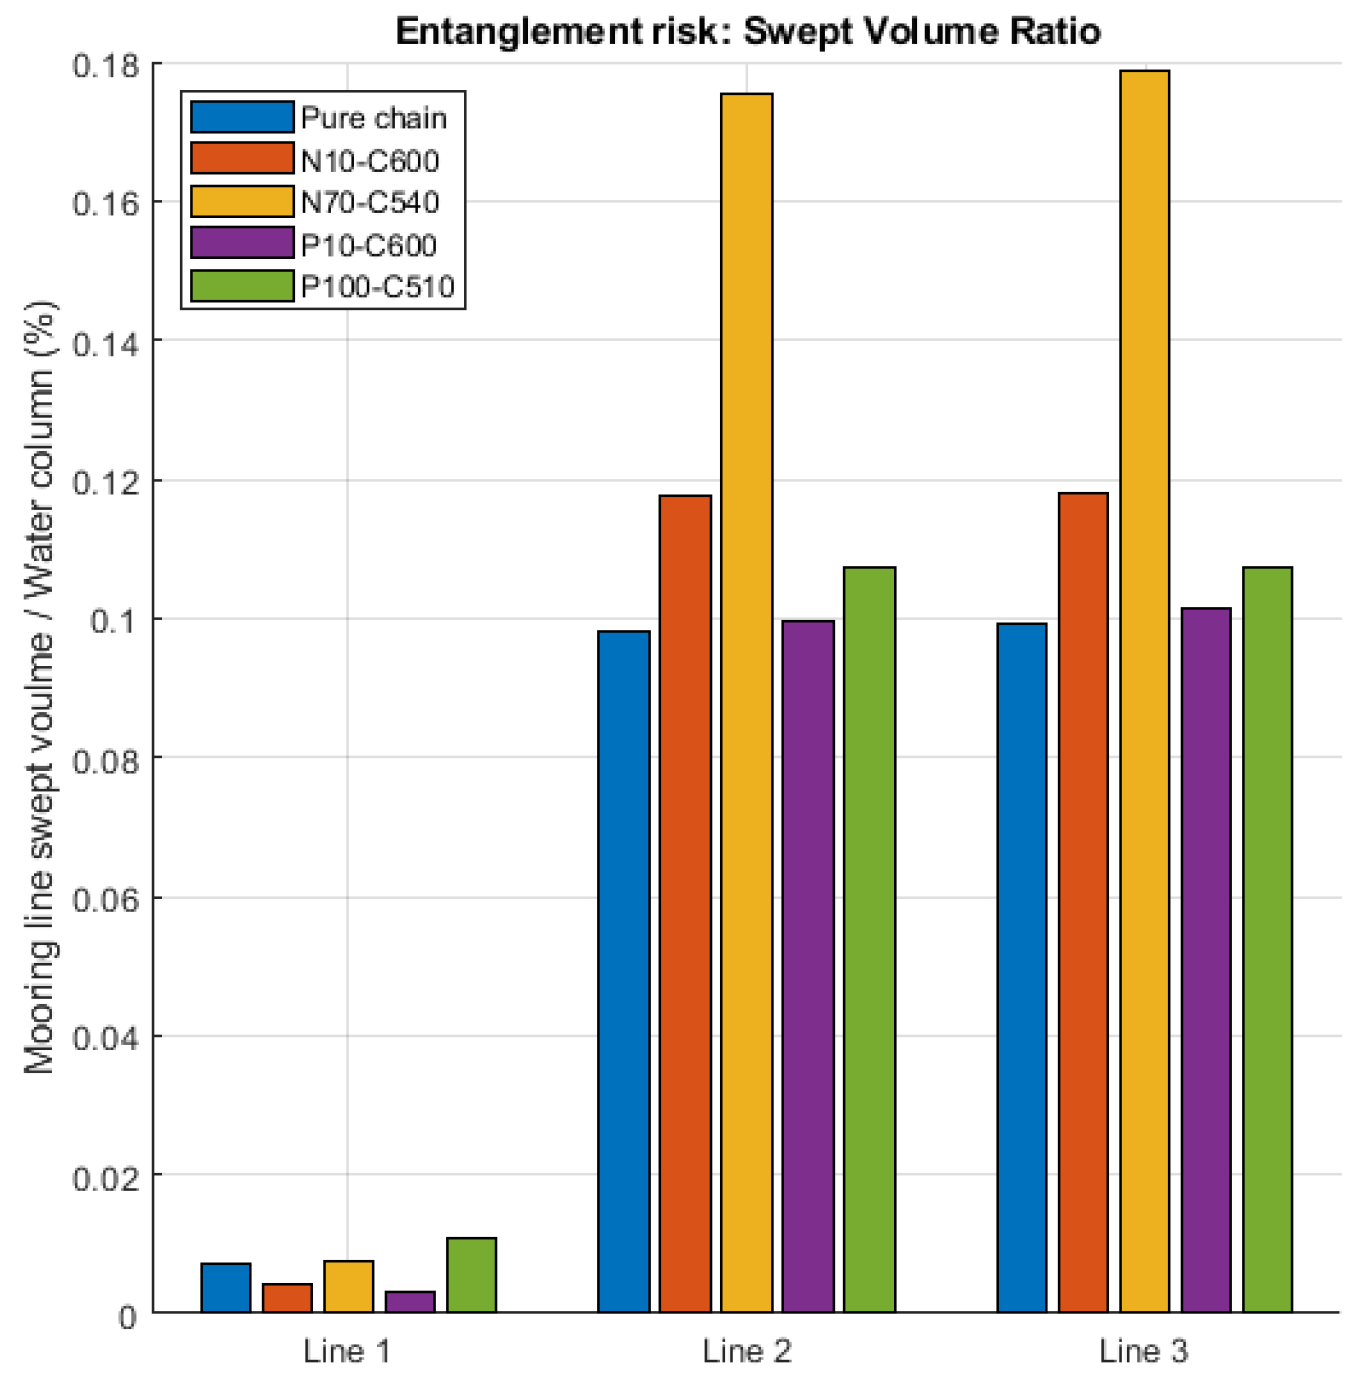
- Mooring line swept volume ratio;
- The swept volume estimates the volume of water occupied by the mooring line. A higher mooring line swept volume means more significant movement of the mooring, and this leads to a higher risk of contact between marine mammals and mooring lines;
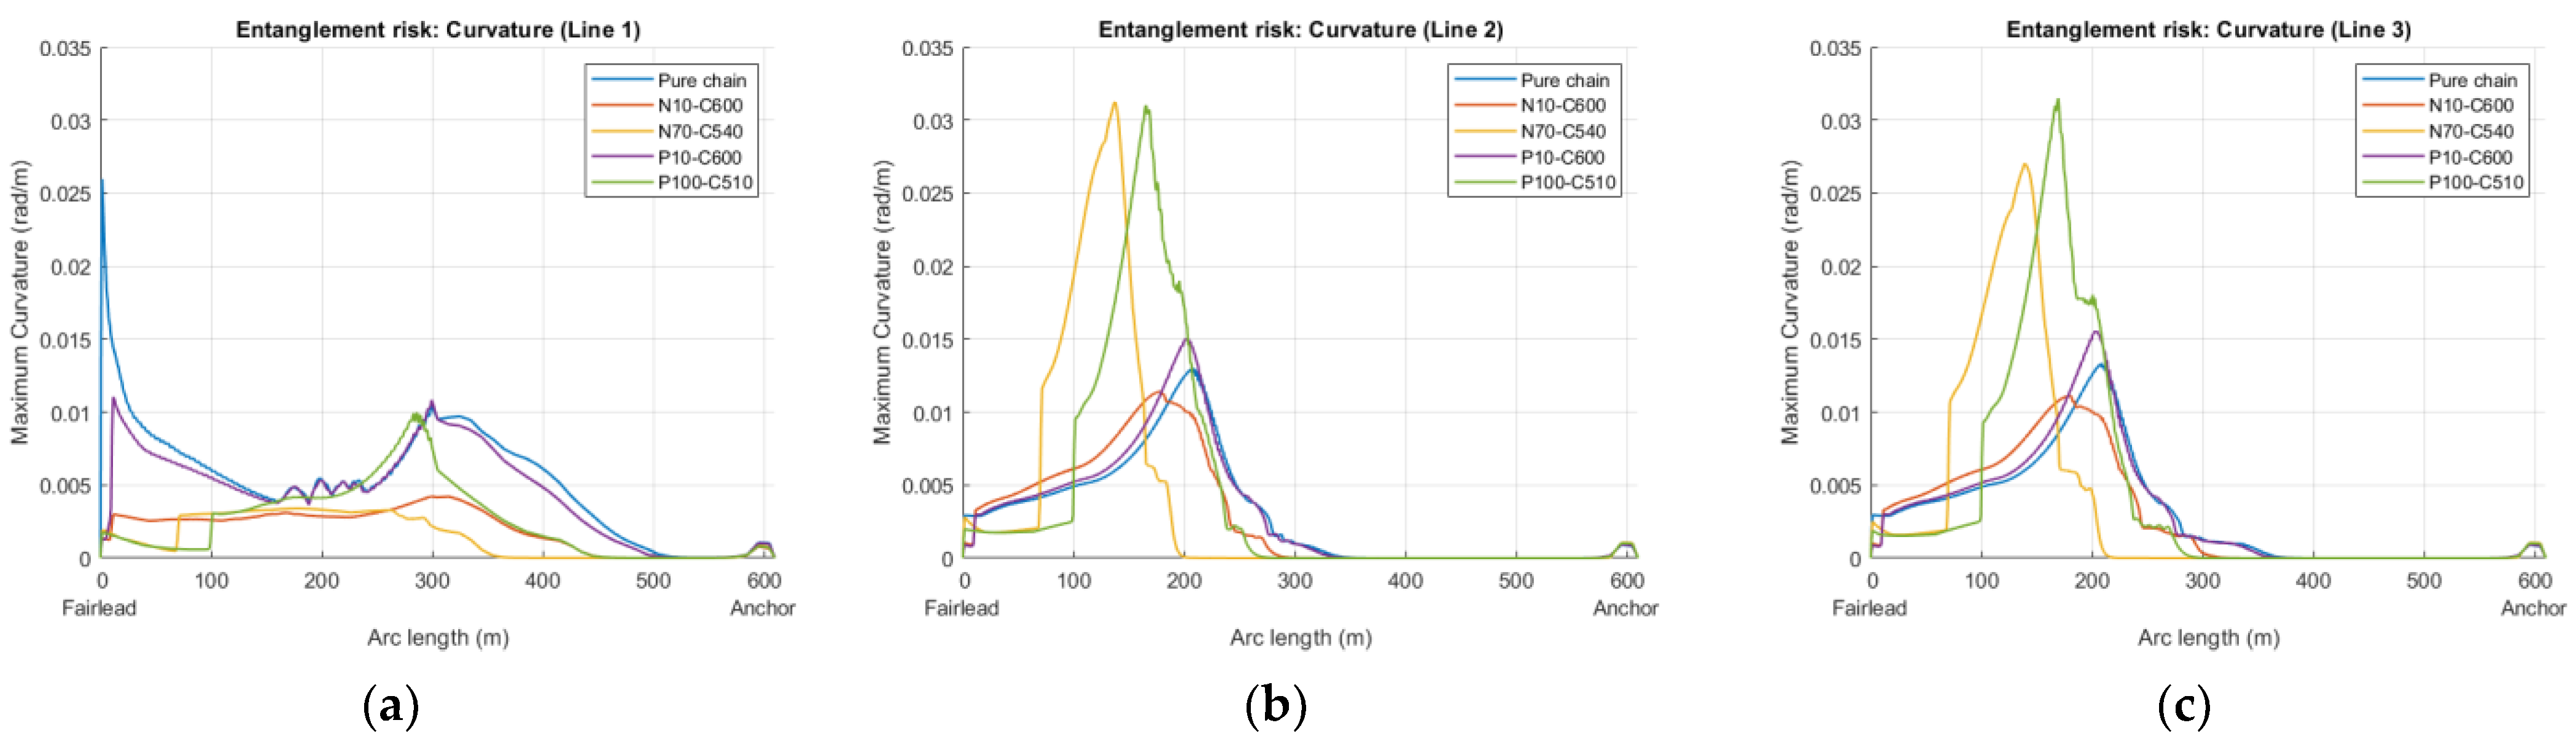
- Mooring line curvature;
- The curvature of the mooring line is the angle change at a specific point on the mooring line, which is expressed in degrees per meter. The higher curvature of the mooring causes a greater entanglement risk because the bending line could loop around the body of marine mammals.
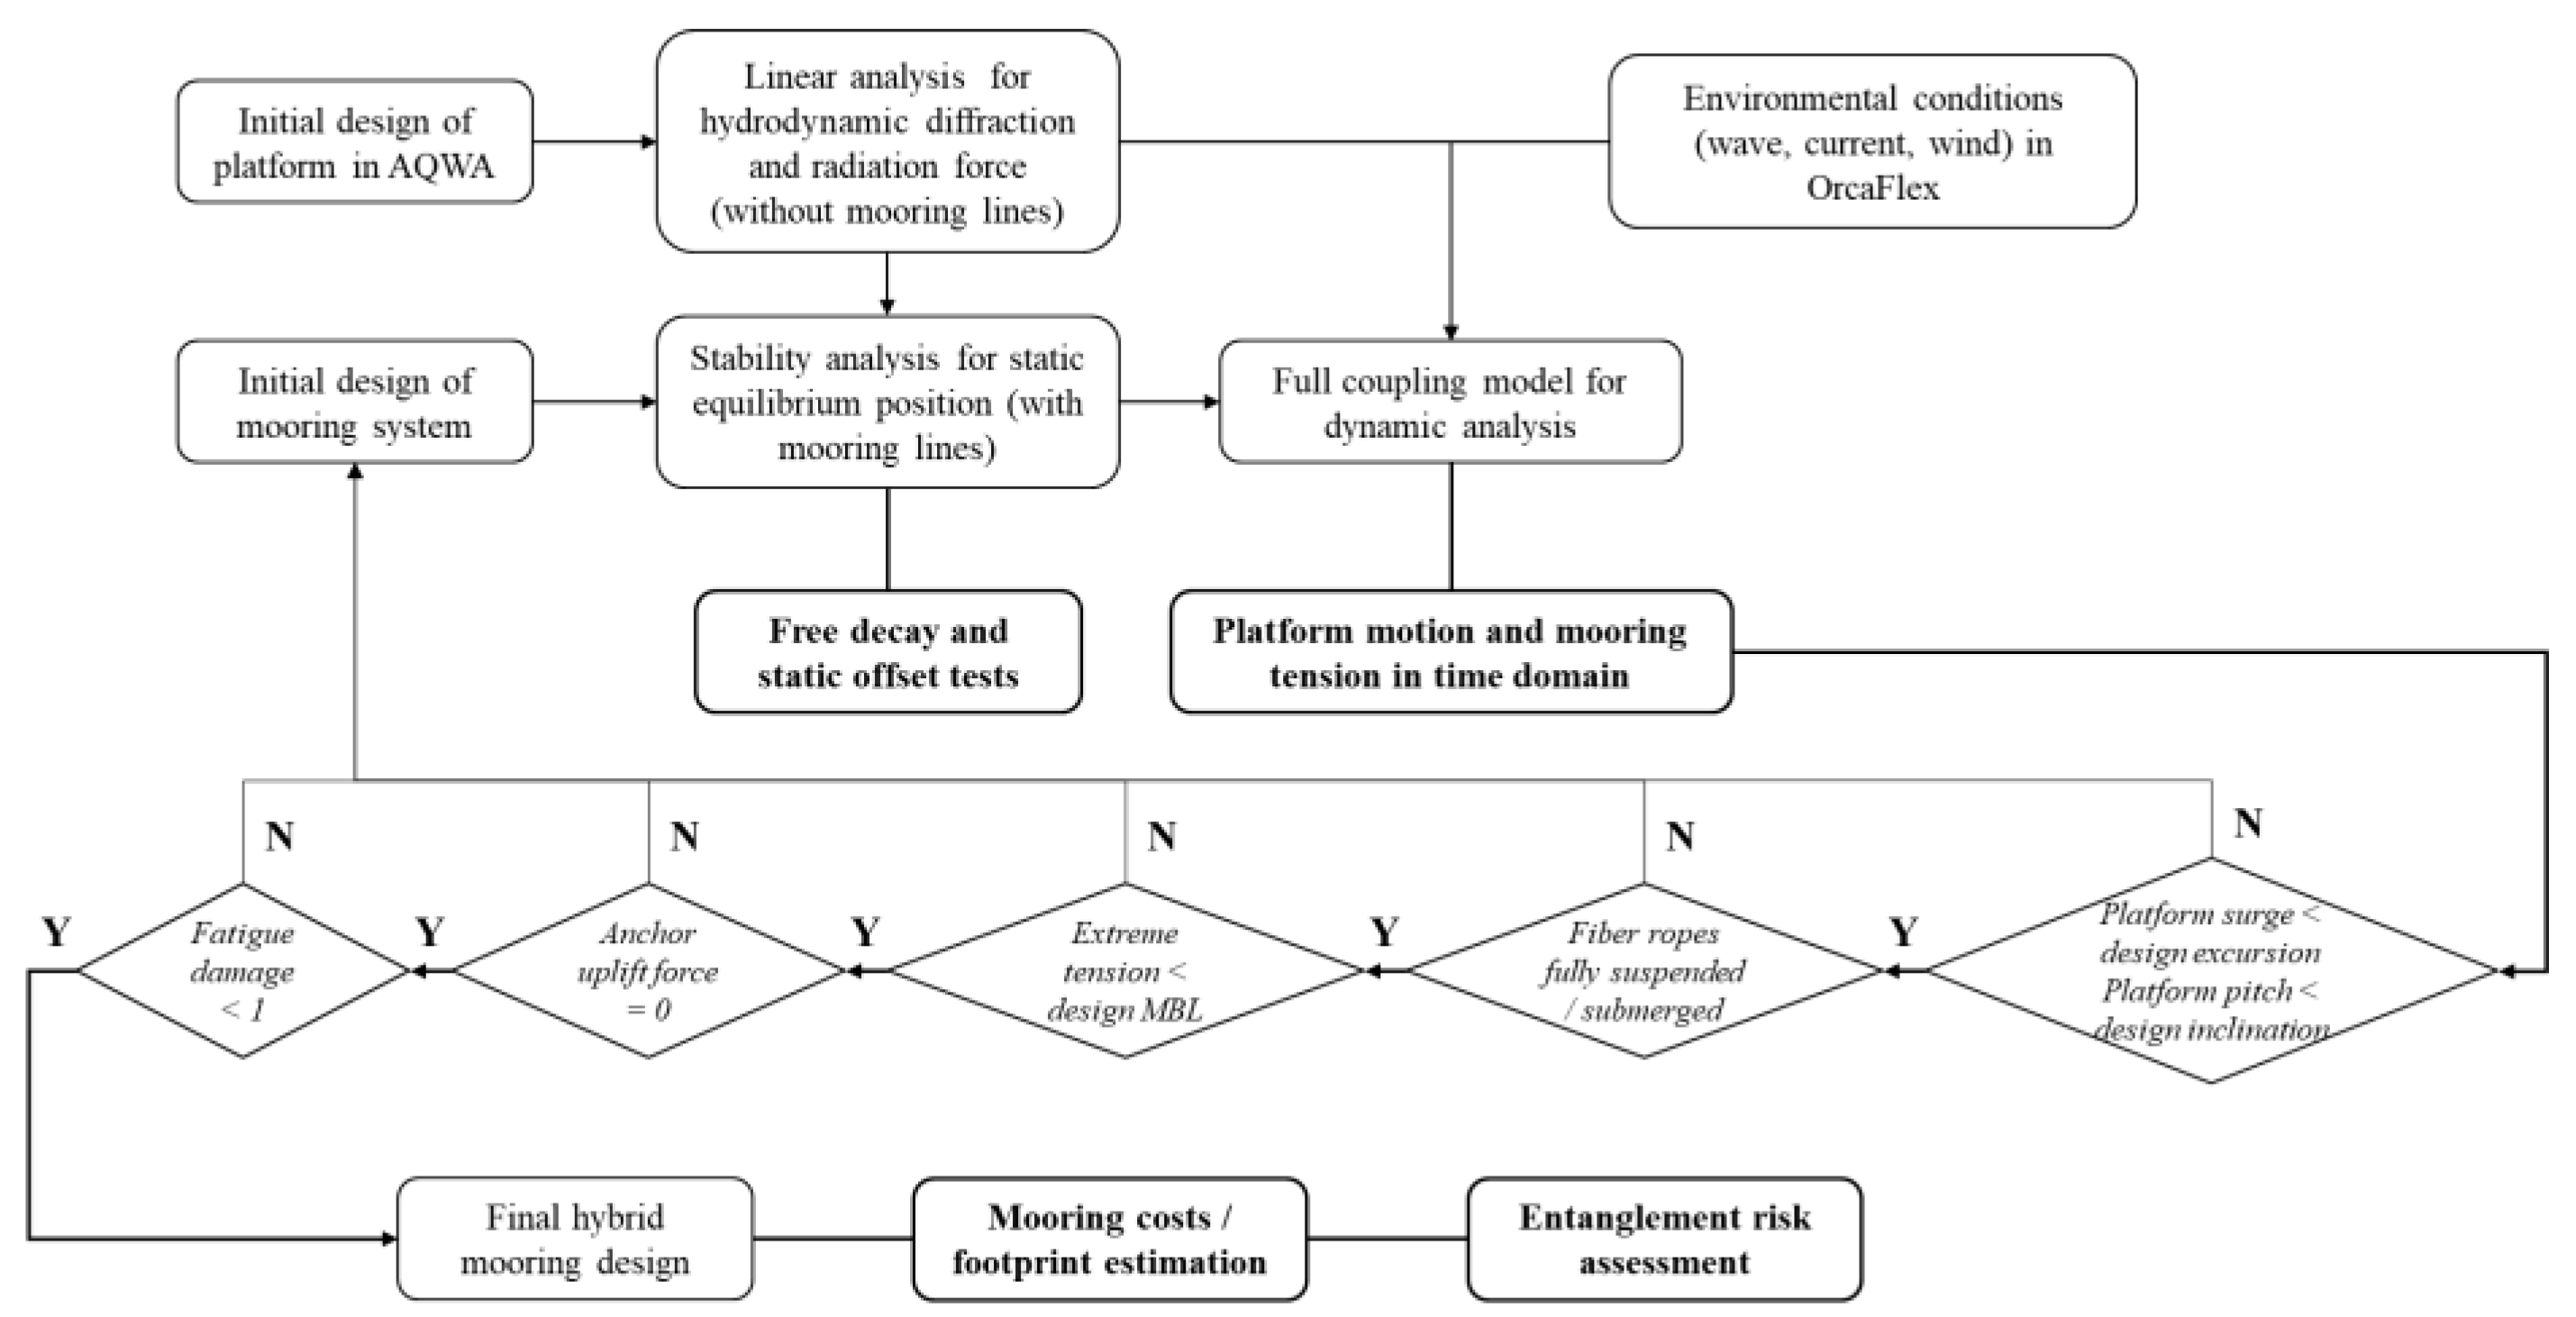
2. Methodology
2.1. ANSYS AQWA
2.2. Orcina OrcaFlex
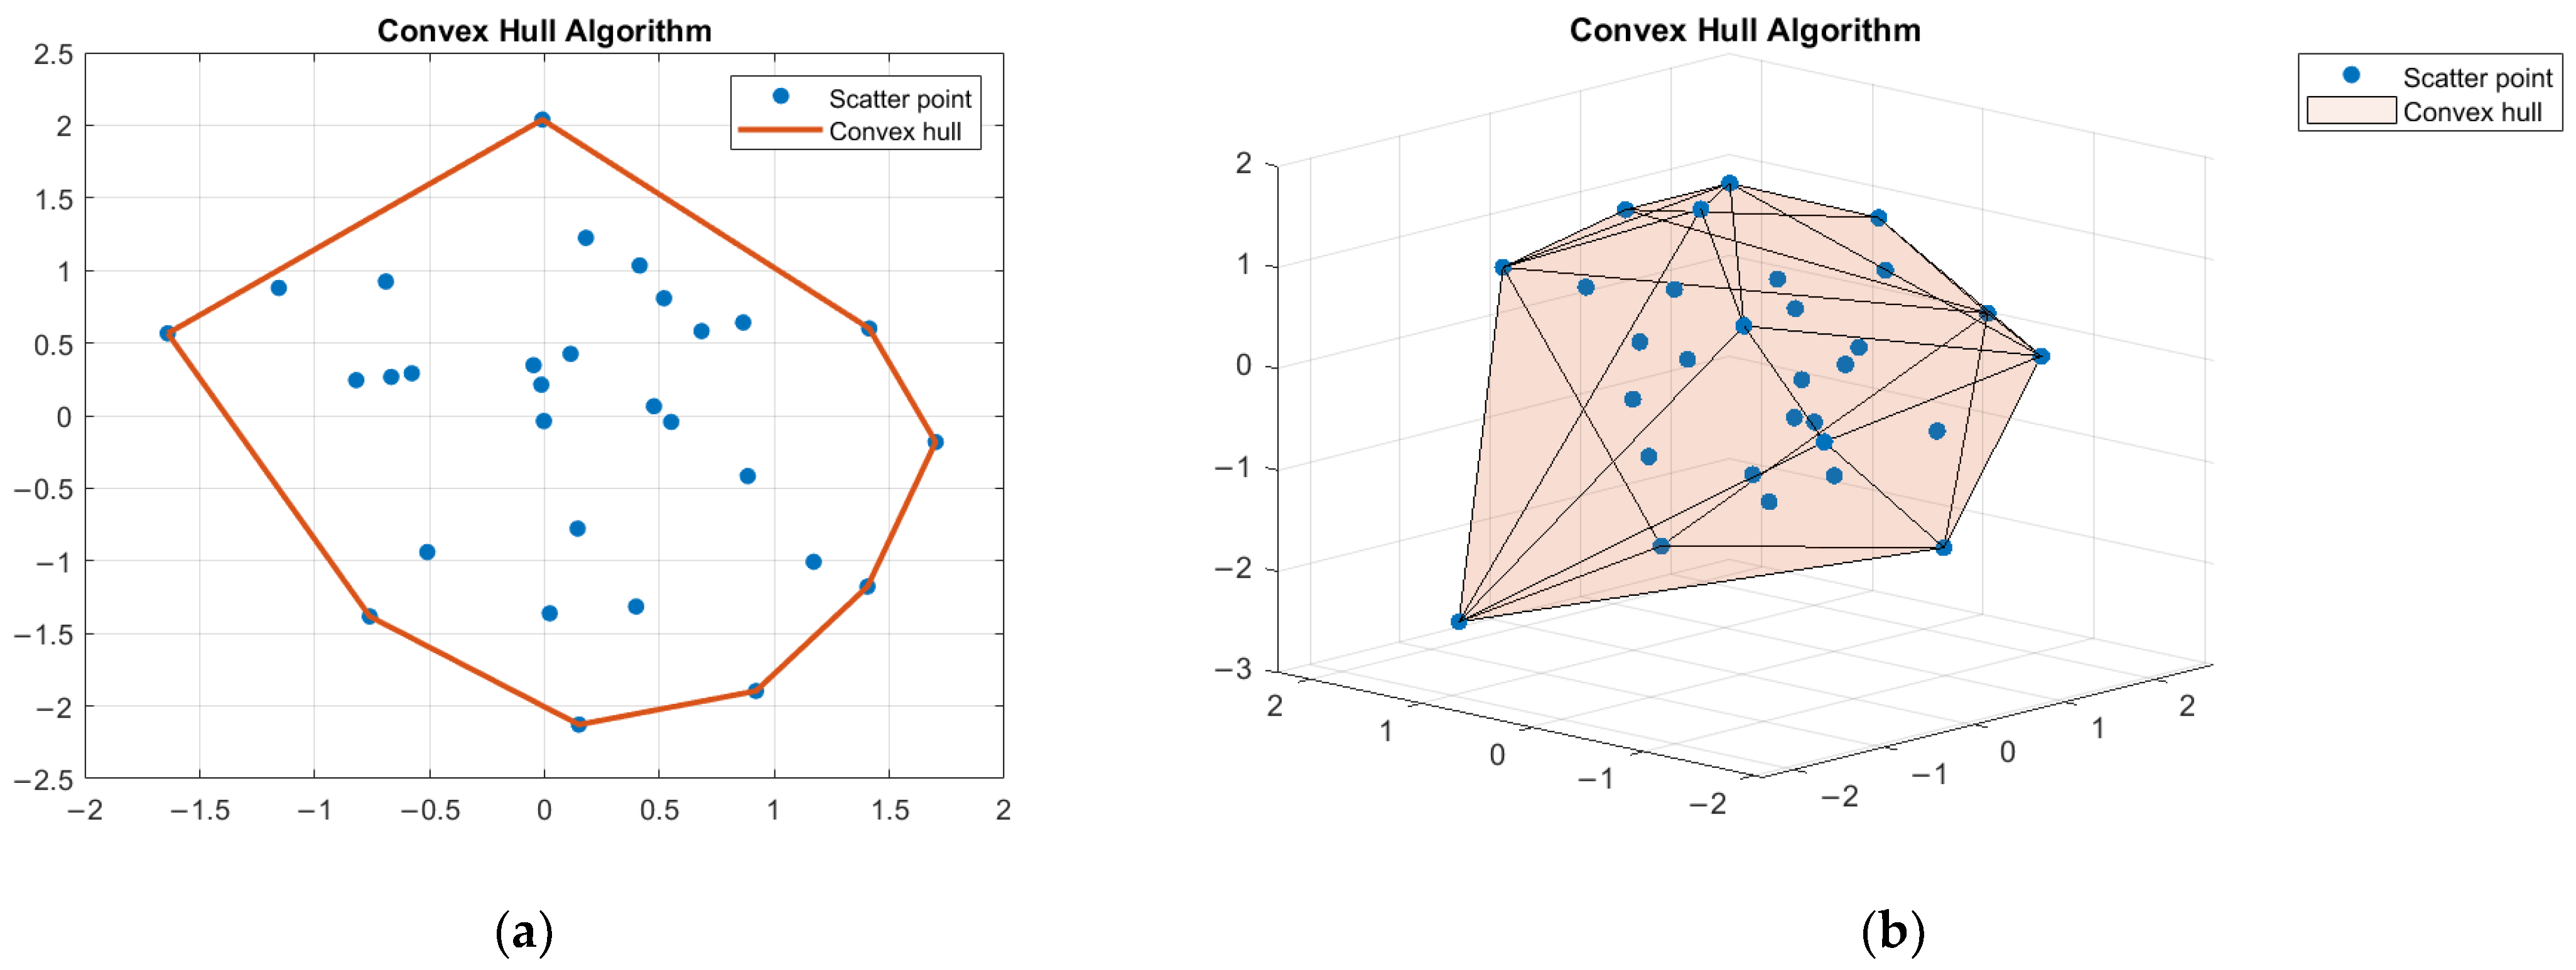
2.3. Convex Hull Algorithm
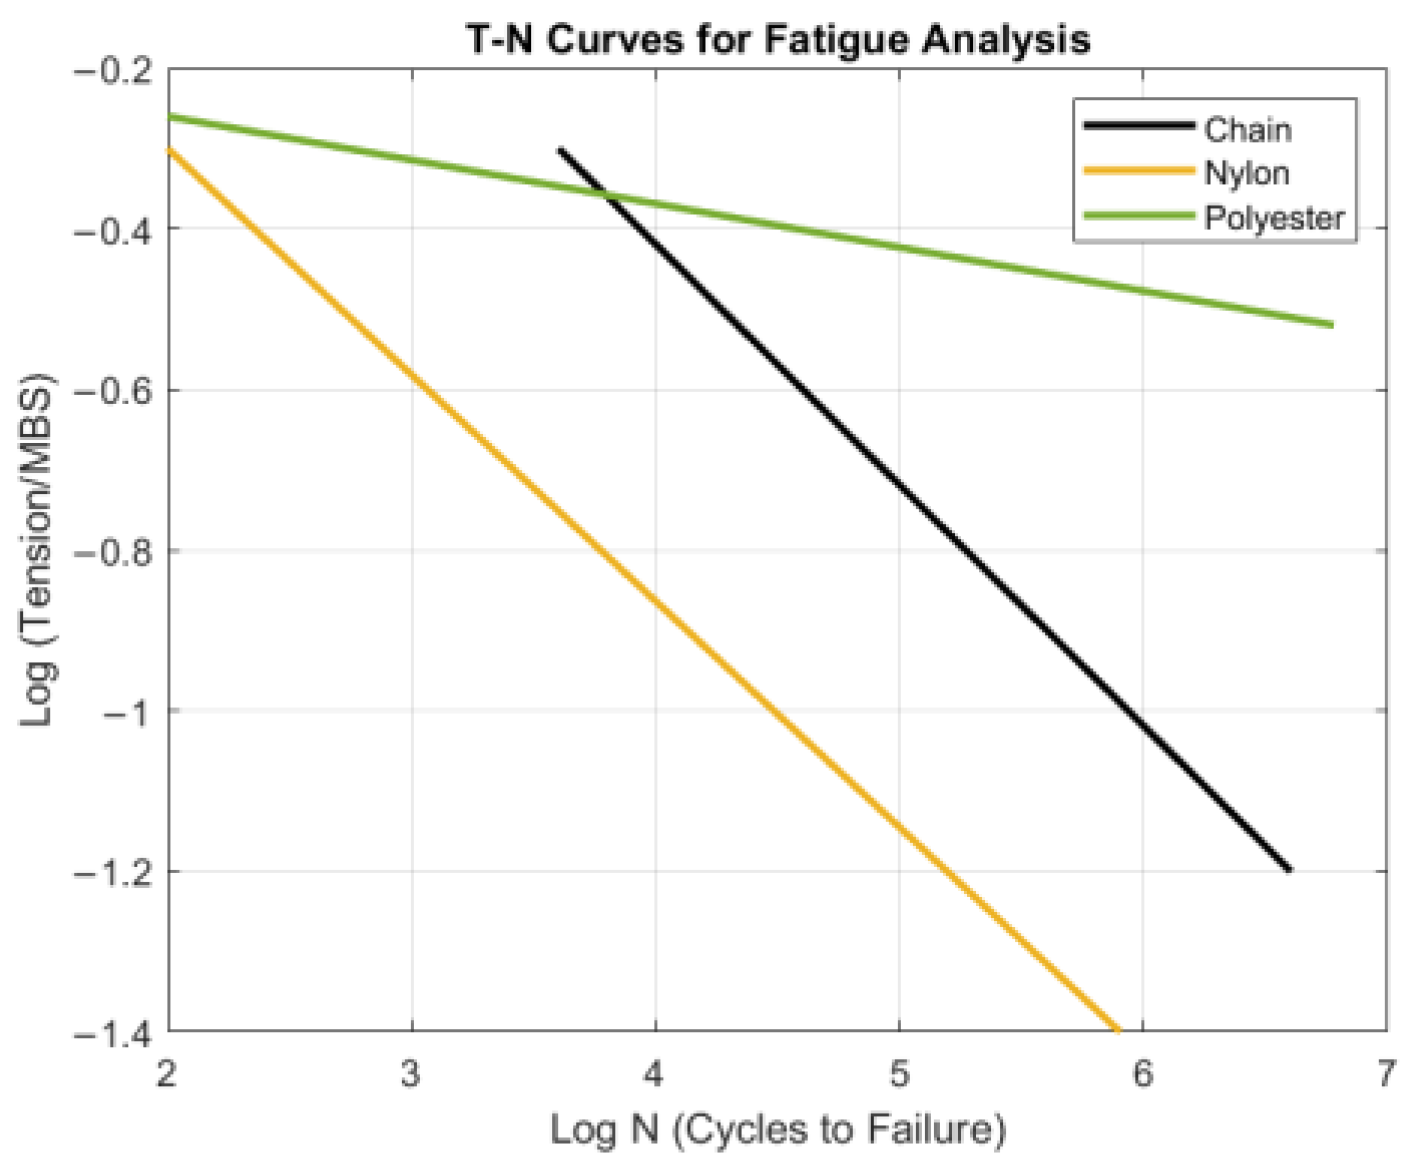
2.4. Fatigue Analysis
3. Results and Discussions
3.1. Preliminary Screening
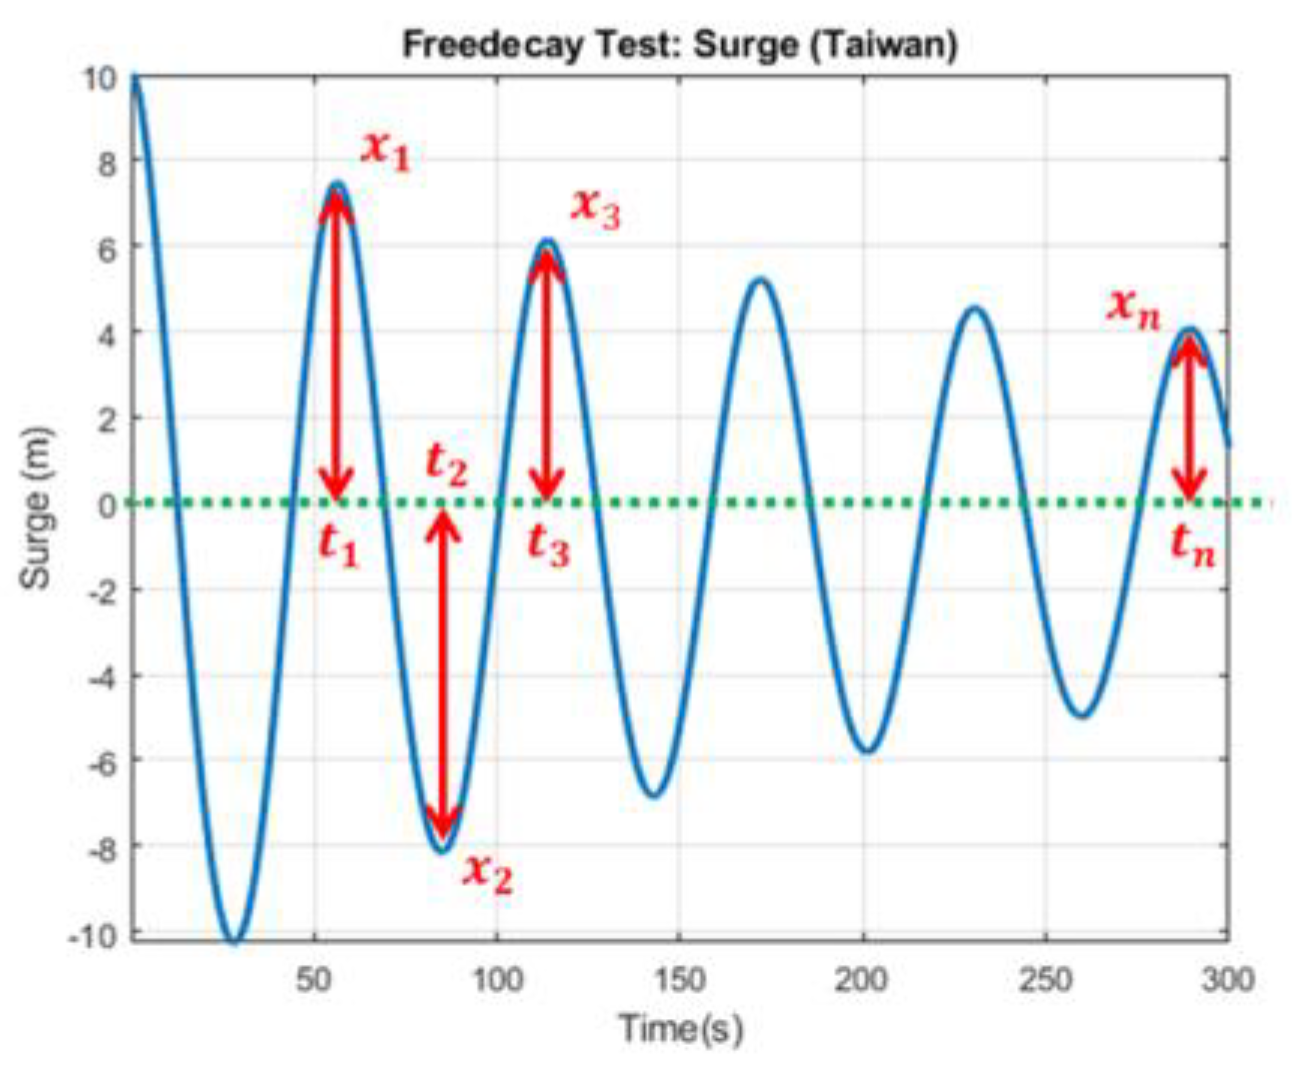
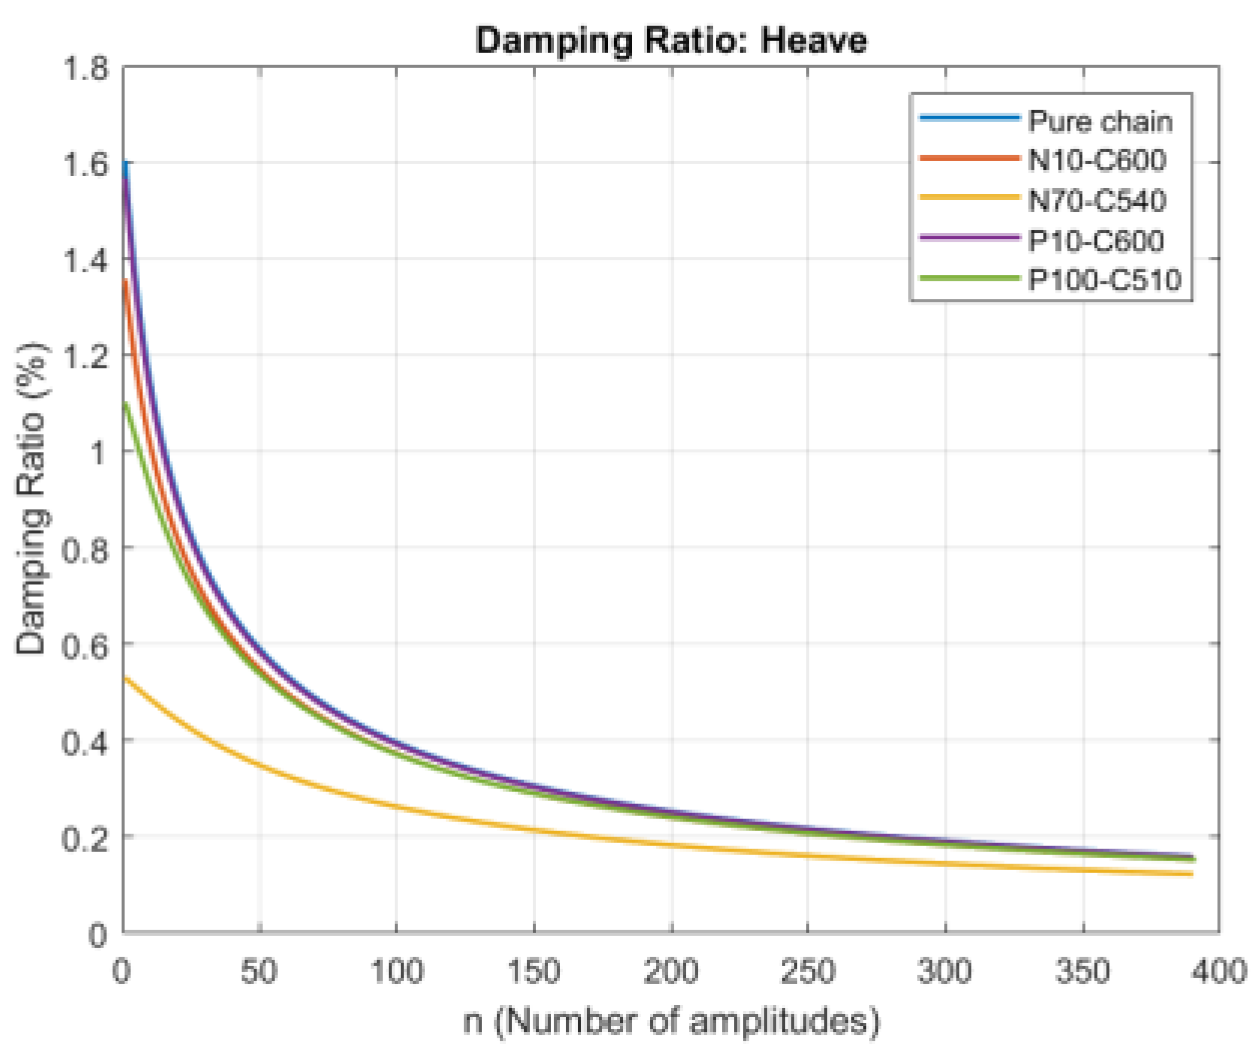
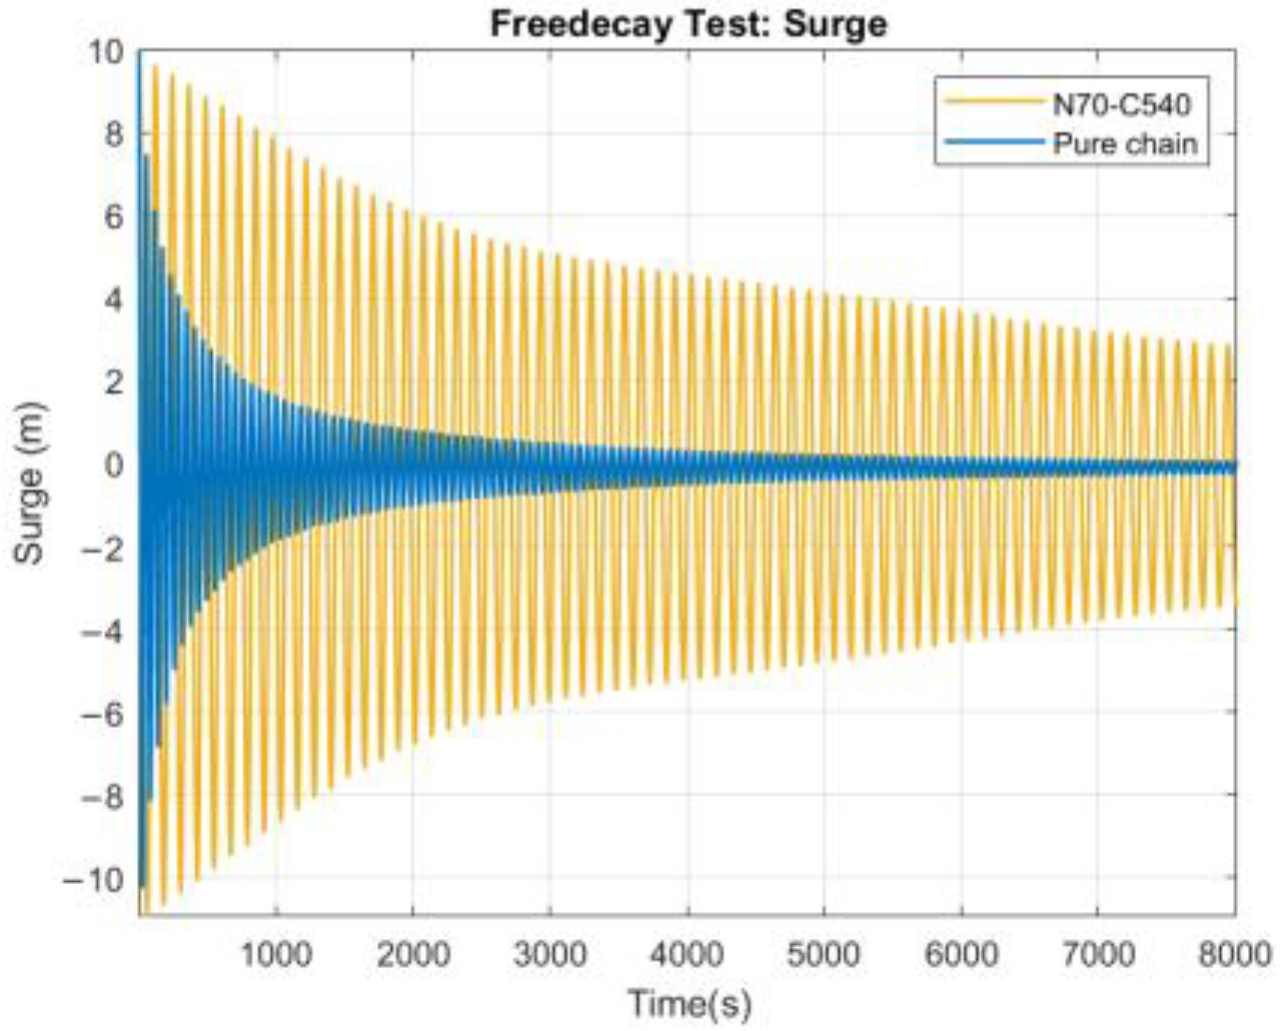
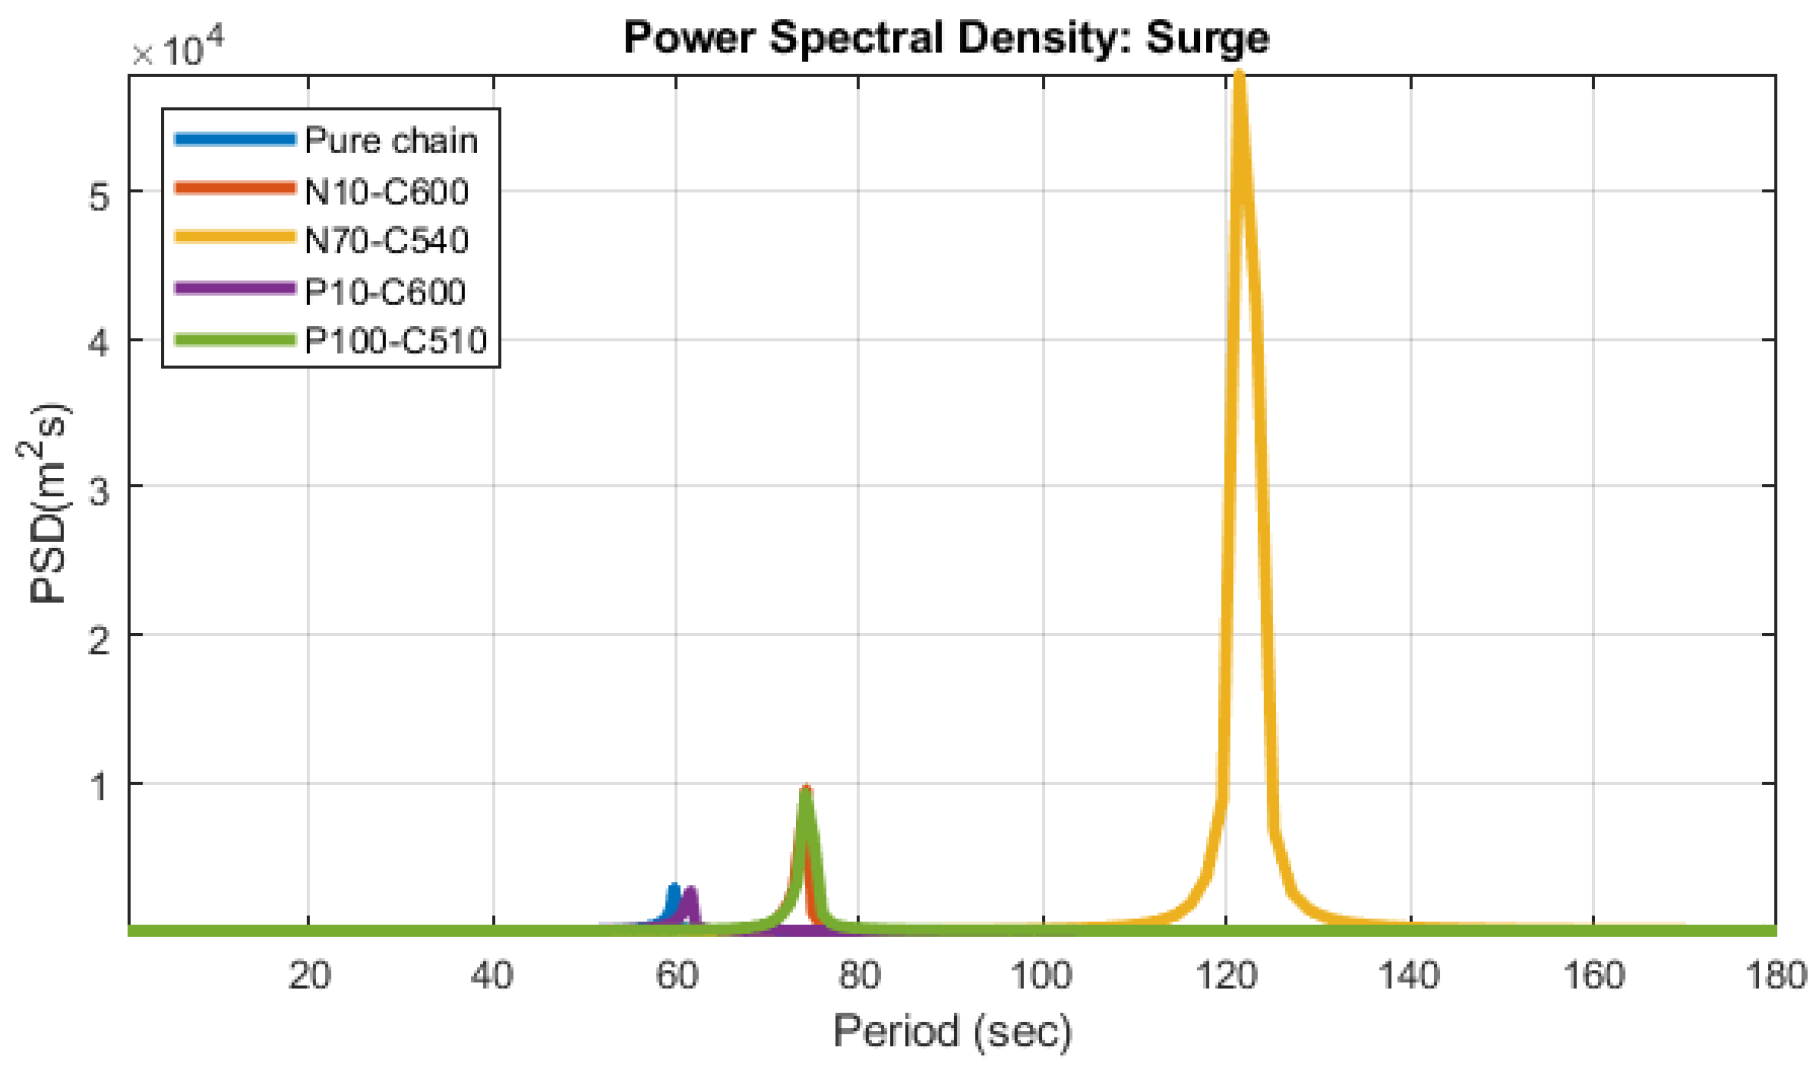
3.2. Free Decay
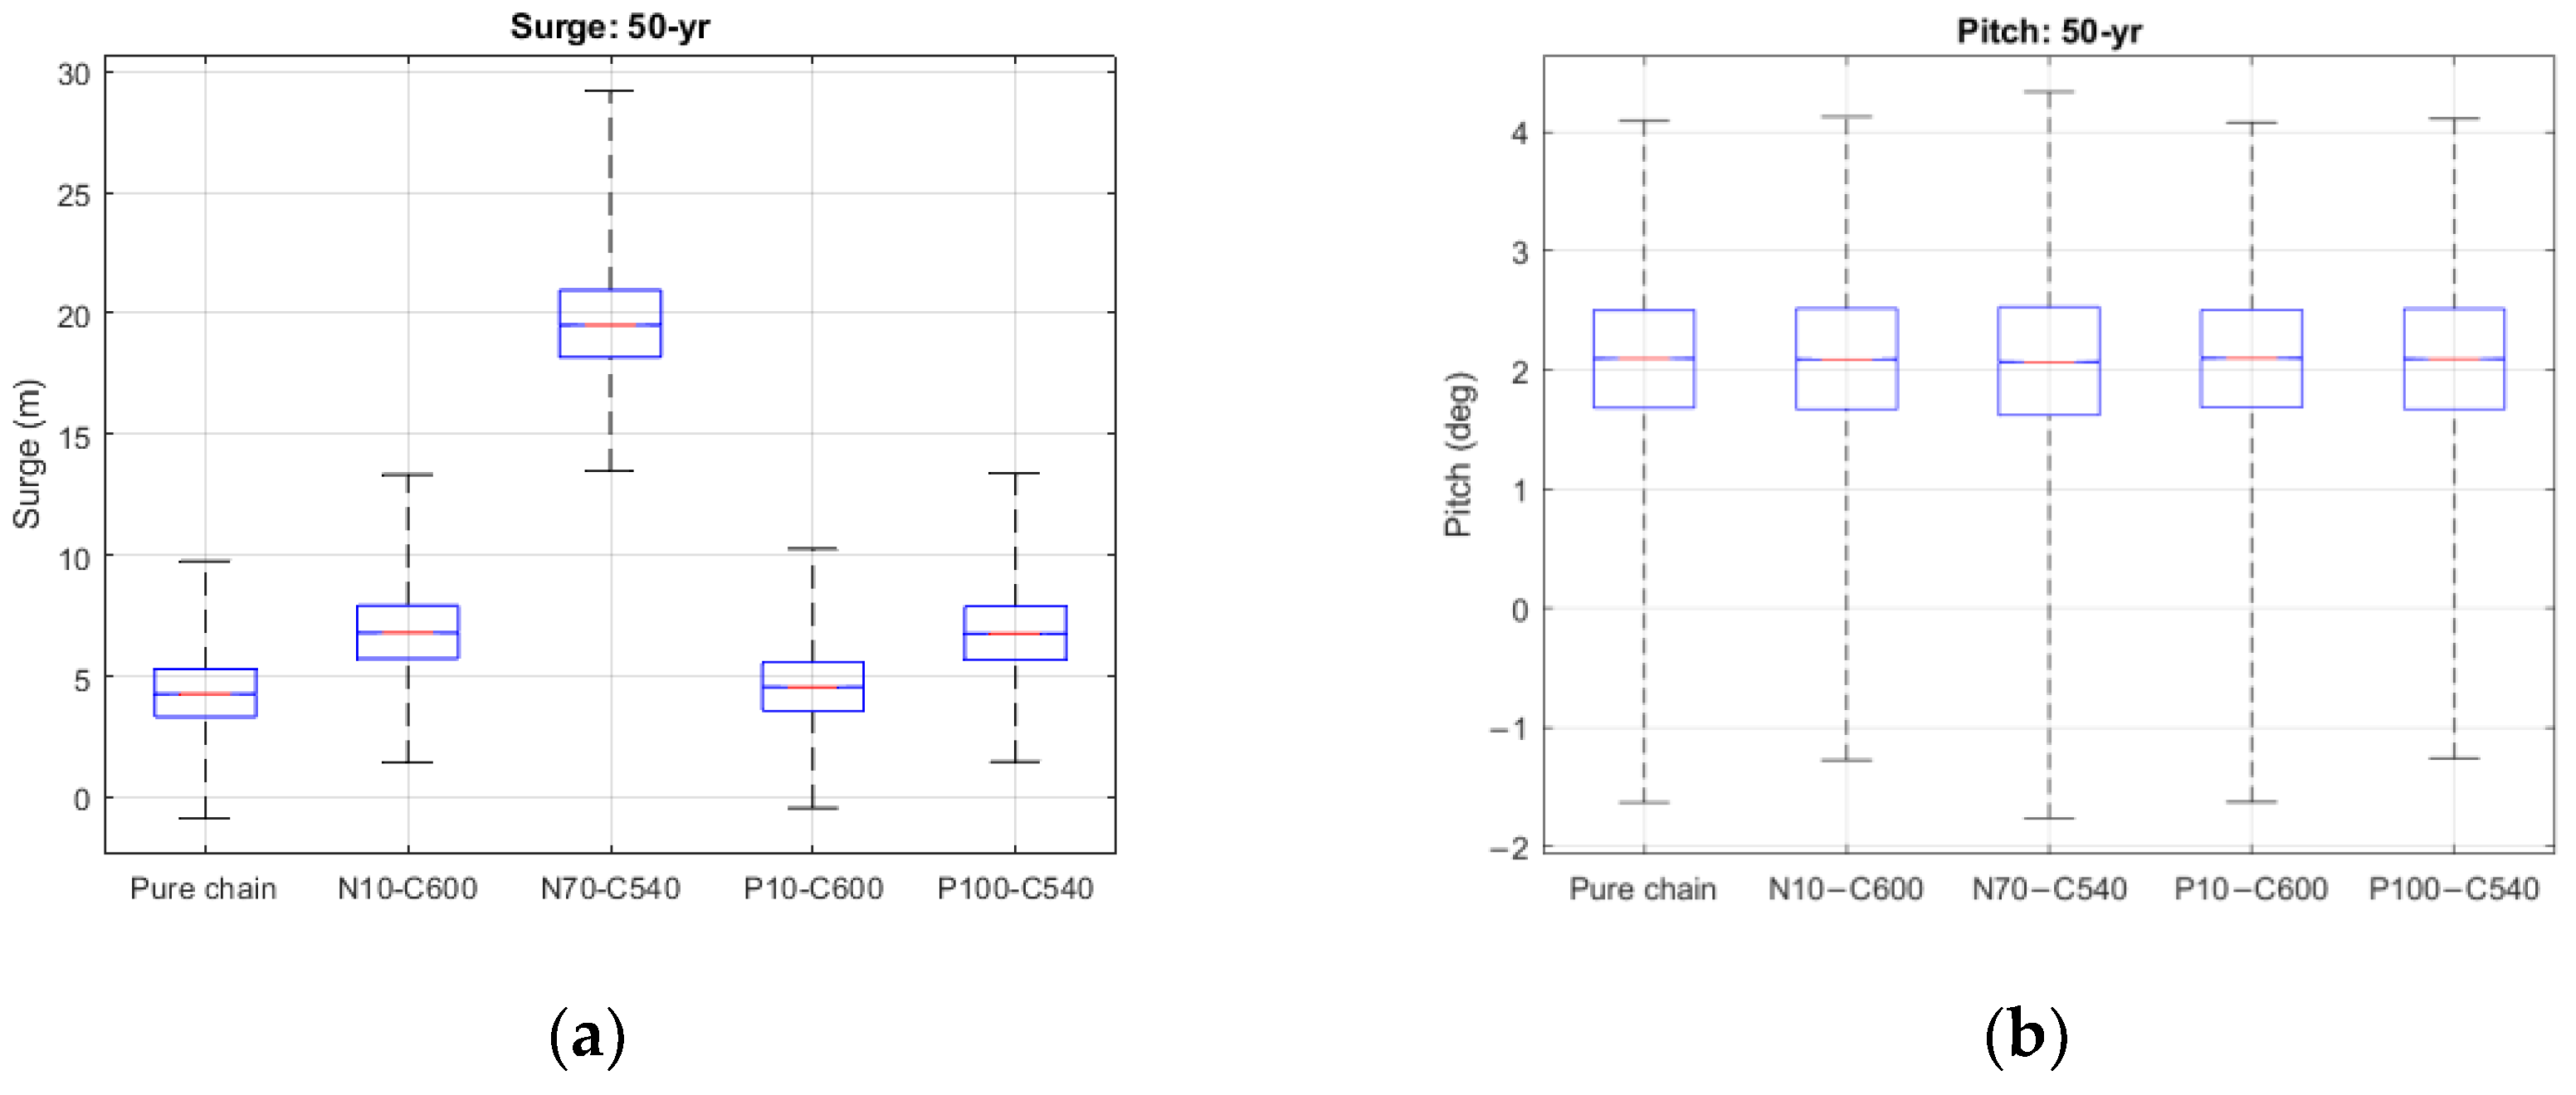
3.3. Irregular Waves
3.4. Mooring Costs Estimation
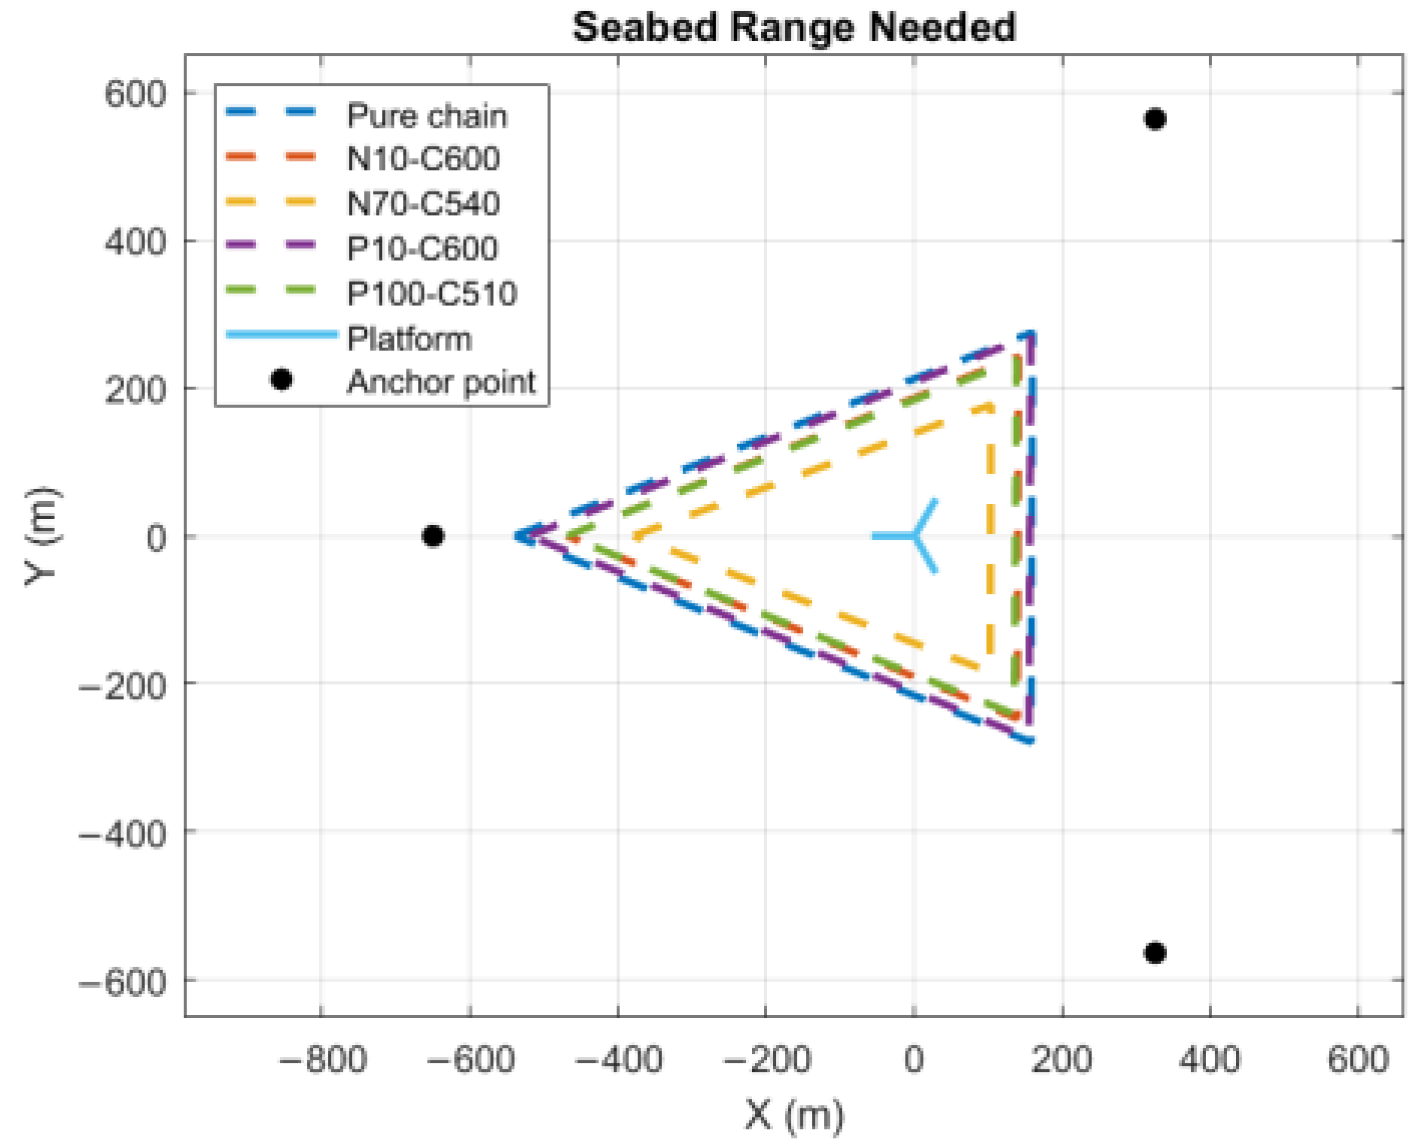
3.4.1. Footprint Area
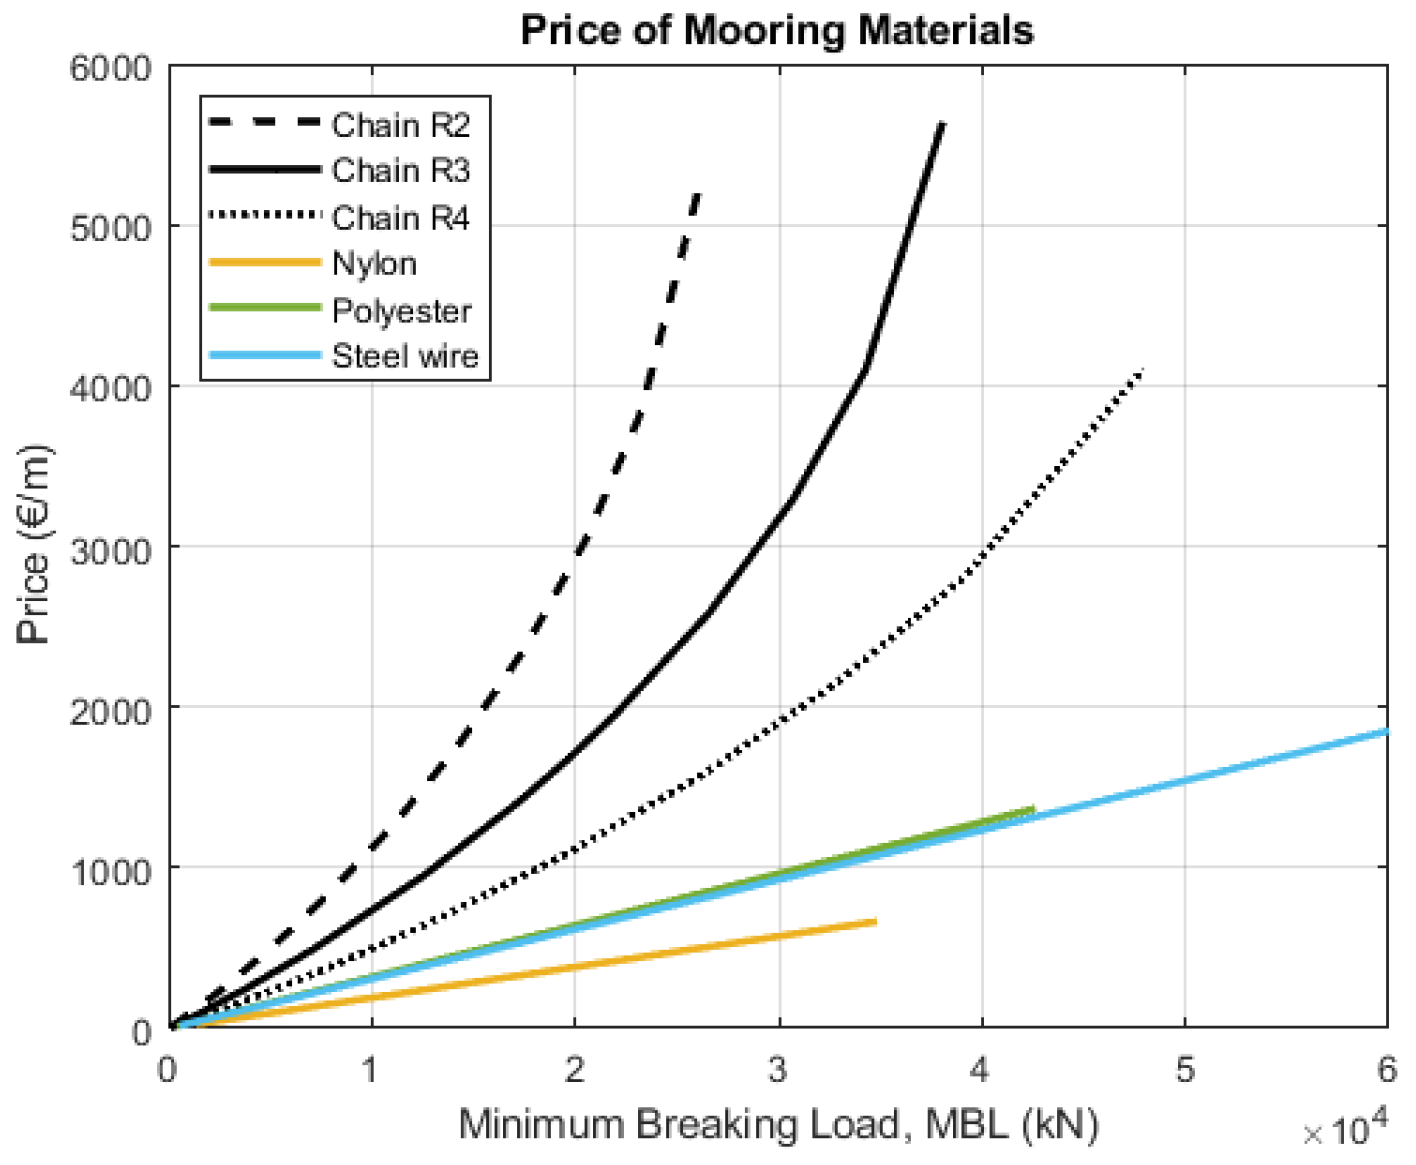
3.4.2. Mooring Costs
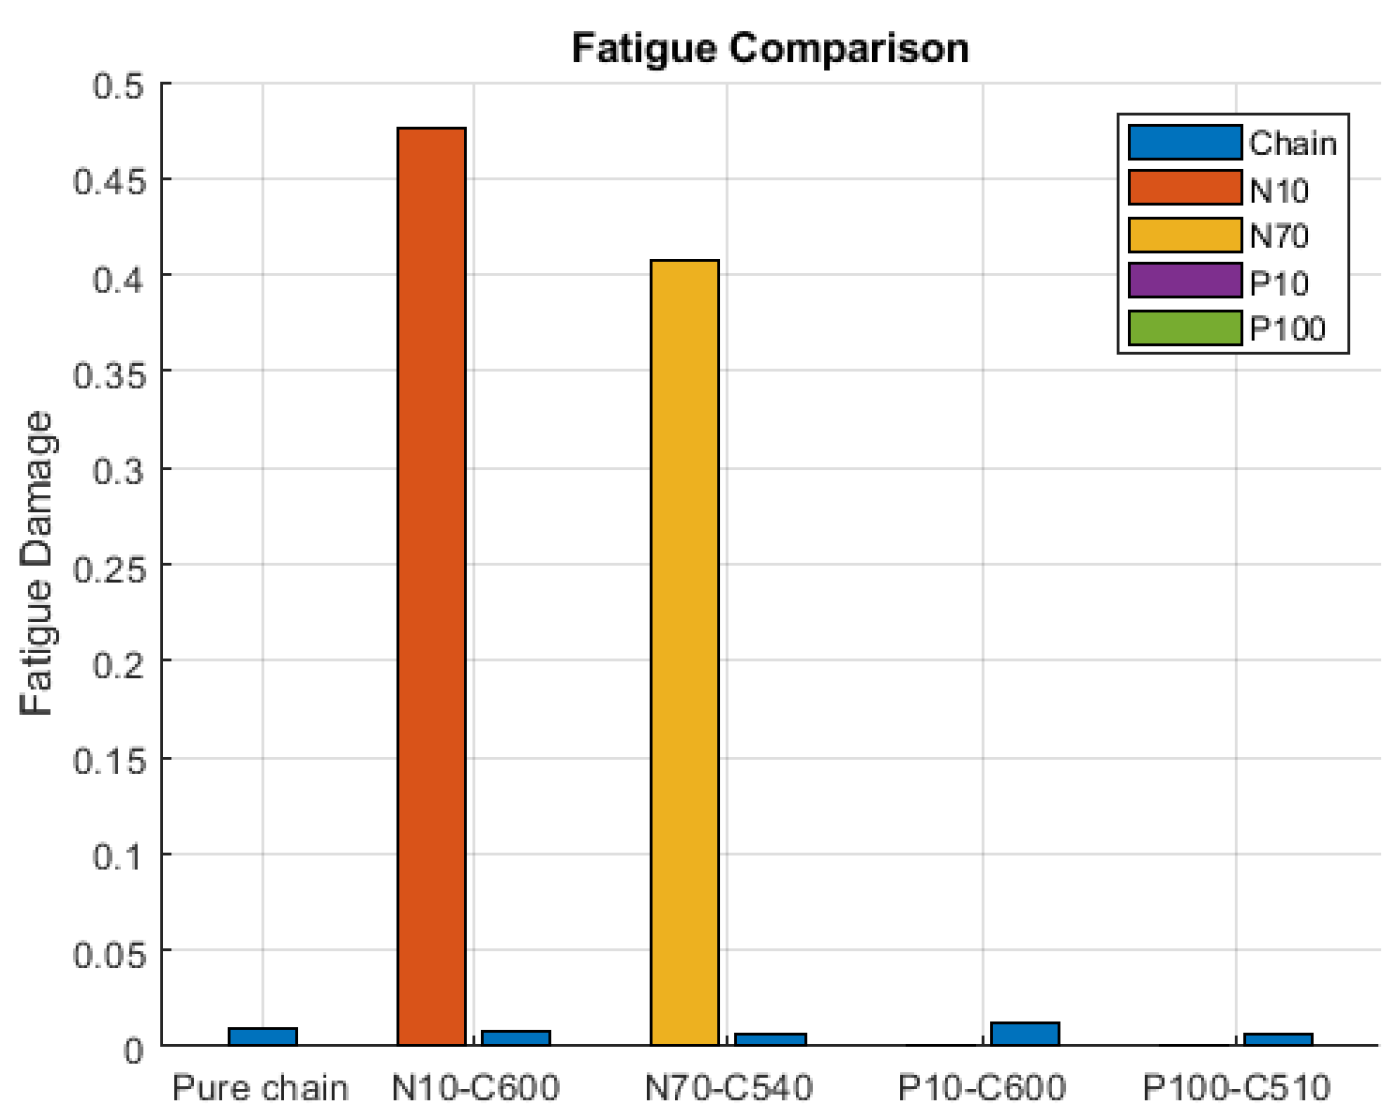
3.5. Fatigue Analysis
3.6. Entanglement Assessment
3.6.1. Mooring Line Swept Volume
3.6.2. Curvature
3.6.3. Tension Characteristics
4. Conclusions
Author Contributions
Funding
Institutional Review Board Statement
Informed Consent Statement
Data Availability Statement
Conflicts of Interest
References
- Gao, A.M.Z.; Huang, C.H.; Lin, J.C.; Su, W.N. Review of recent offshore wind power strategy in Taiwan: Onshore wind power comparison. Energy Strategy Rev. 2021, 38, 100747. [Google Scholar] [CrossRef]
- Emanuel, Chole. Floating Wind Holds Promise, but Delivery Is Challenging. TGS|4C Offshore. 26 June 2023. Available online: https://www.4coffshore.com/news/floating-wind-holds-promise2c-but-delivery-is-challenging-nid27749.html (accessed on 18 November 2023).
- Castillo, F.T.S. Floating Offshore Wind Turbines: Mooring System Optimization for LCOE Reduction. 2020. Available online: http://www.diva-portal.org/smash/record.jsf?pid=diva2:1484541 (accessed on 17 December 2022).
- Weller, S.D.; Johanning, L.; Davies, P.; Banfield, S.J. Synthetic mooring ropes for marine renewable energy applications. Renew. Energy 2015, 83, 1268–1278. [Google Scholar] [CrossRef]
- Davies, P.; Reaud, Y.; Dussud, L.; Woerther, P. Mechanical behaviour of HMPE and aramid fibre ropes for deep sea handling operations. Ocean. Eng. 2011, 38, 2208–2214. [Google Scholar] [CrossRef]
- Utsunomiya, T.; Sato, I.; Tanaka, K. At-sea experiment on durability and residual strength of polyester rope for mooring of floating wind turbine. In International Conference on Offshore Mechanics and Arctic Engineering; American Society of Mechanical Engineers: New York, NY, USA, 2019; Volume 58882, p. V009T13A017. [Google Scholar]
- Xu, S.; Wang, S.; Soares, C.G. Experimental investigation on the influence of hybrid mooring system configuration and mooring material on the hydrodynamic performance of a point absorber. Ocean. Eng. 2021, 233, 109178. [Google Scholar] [CrossRef]
- Xue, X.; Chen, N.Z.; Wu, Y.; Xiong, Y.; Guo, Y. Mooring system fatigue analysis for a semi-submersible. Ocean. Eng. 2018, 156, 550–563. [Google Scholar] [CrossRef]
- Wu, Y.; Wang, T.; Eide, Ø.; Haverty, K. Governing factors and locations of fatigue damage on mooring lines of floating structures. Ocean. Eng. 2015, 96, 109–124. [Google Scholar] [CrossRef]
- Xu, K.; Larsen, K.; Shao, Y.; Zhang, M.; Gao, Z.; Moan, T. Design and comparative analysis of alternative mooring systems for floating wind turbines in shallow water with emphasis on ultimate limit state design. Ocean. Eng. 2021, 219, 108377. [Google Scholar] [CrossRef]
- DNVGL-ST-0119; Floating Wind Turbine Structures. DNV: Oslo, Norway, 2018.
- Ou, S.H. Parametric determination of wave statistics and wave spectrum of gravity waves. Ph.D. Thesis, Tainan Hydraulics Laboratory of Water Resources Planning Commission-Ministry of Economic Affairs and National Cheng Kung University, Tainan, Taiwan, 1977. [Google Scholar]
- Justad, A.A. Wind Turbines for the Power Supply for Offshore Fish Farms: A Case Study for the Norwegian West Coast. Master’s Thesis, University of Agder, Kristiansand, Norway, 2017. [Google Scholar]
- Gaertner, E.; Rinker, J.; Sethuraman, L.; Zahle, F.; Anderson, B.; Barter, G.E.; Abbas, N.J.; Meng, F.; Bortolotti, P.; Skrzypinski, W.; et al. IEA Wind TCP Task 37: Definition of the IEA 15-Megawatt Offshore Reference Wind Turbine; No. NREL/TP-5000-75698; National Renewable Energy Lab. (NREL): Golden, CO, USA, 2020. [Google Scholar]
- Allen, C.; Viscelli, A.; Dagher, H.; Goupee, A.; Gaertner, E.; Abbas, N.; Hall, M.; Barter, G. Definition of the UMaine VolturnUS-S Reference Platform Developed for the IEA Wind 15-Megawatt Offshore Reference Wind Turbine; No. NREL/TP-5000-76773; National Renewable Energy Lab. (NREL): Golden, CO, USA, 2020. [Google Scholar]
- Herduin, M.; Banfield, S.; Weller, S.D.; Thies, P.R.; Johanning, L. Abrasion process between a fibre mooring line and a corroded steel element during the transit and commissioning of a marine renewable energy device. Eng. Fail. Anal. 2016, 60, 137–154. [Google Scholar] [CrossRef]
- Sraul, C.; Hong, D.P.; Arnal, V.; Reynaud, M. Effect of marine growth on floating wind turbines mooring lines responses. In CFM 2017-23ème Congrès Français de Mécanique; AFM, Maison de la Mécanique: Courbevoie, France, 2017. [Google Scholar]
- Garza-Rios, L.O.; Bernitsas, M.M.; Nishimoto, K.; Matsuura, J.O.P.J. Dynamics of spread mooring systems with hybrid mooring lines. J. Offshore Mech. Arct. Eng. 2000, 122, 274–281. [Google Scholar] [CrossRef]
- Ma, K.T.; Luo, Y.; Kwan, C.T.T.; Wu, Y. Mooring System Engineering for Offshore Structures; Gulf Professional Publishing: Houston, TX, USA, 2019. [Google Scholar]
- McKenna, H.A.; Wong, R.K. Synthetic fiber rope, properties and calculations relating to mooring systems. In OED Volume 7: Deepwater Mooring and Drilling, Symposium Presented at the ASME Winter Annual Meeting, New York, NY, USA, 2–7 December 1979; No. Conf Paper; The National Academies of Sciences, Engineering, and Medicine: Washington, DC, USA.
- Johanning, L.; Smith, G.H. Station keeping study for WEC devices including compliant chain, compliant hybrid and taut arrangement. In Proceedings of the International Conference on Offshore Mechanics and Arctic Engineering, Estoril, Portugal, 15–20 June 2008; Volume 48234, pp. 587–596. [Google Scholar]
- Qiao, D.; Ou, J. Global responses analysis of a semi-submersible platform with different mooring models in South China Sea. Ships Offshore Struct. 2013, 8, 441–456. [Google Scholar] [CrossRef]
- OrcaFlex Manual; Orcina Ltd.: Daltongate Ulverston Cumbria, UK, 2019.
- Benjamins, S.; Harnois, V.; Smith HC, M.; Johanning, L.; Greenhill, L.; Carter, C.; Wilson, B. Understanding the Potential for Marine Megafauna Entanglement Risk from Renewable Marine Energy Developments. 2014. Available online: https://ore.exeter.ac.uk/repository/bitstream/handle/10871/21616/Understanding?sequence=1 (accessed on 11 April 2022).
- Harnois, V.; Smith, H.C.; Benjamins, S.; Johanning, L. Assessment of entanglement risk to marine megafauna due to offshore renewable energy mooring systems. Int. J. Mar. Energy 2015, 11, 27–49. [Google Scholar] [CrossRef]
- Parra, G.J.; Schick, R.; Corkeron, P.J. Spatial distribution and environmental correlates of Australian snubfin and Indo-Pacific humpback dolphins. Ecography 2006, 29, 396–406. [Google Scholar] [CrossRef]
- Kim, H.; Jeon, G.Y.; Choung, J.; Yoon, S.W.; Kim, H. Study on Mooring System Design of Floating Offshore Wind Turbine in Jeju Offshore Area. Int. J. Ocean. Syst. Eng. 2013, 3, 209–217. [Google Scholar]
- Aqwa Theory Manual; ANSYS, Inc.: Southpointe, PA, USA, 2021.
- Chung, J.; Hulbert, G. A Time Integration Algorithm for Structural Dynamics with Improved NumericalDissipation: The Generalized-α Method; University of California: Riverside, CA, USA, 1993. [Google Scholar]
- Chan, T.M. Optimal output-sensitive convex hull algorithms in two and three dimensions. Discret. Comput. Geom. 1996, 16, 361–368. [Google Scholar] [CrossRef]
- Shu, H.; Yao, A.; Ma, K.T.; Ma, W.; Miller, J. API RP 2SK 4th Edition-An Updated Stationkeeping Standard for the Global Offshore Environment. In Offshore Technology Conference; OnePetro: Richardson, TX, USA, 2018. [Google Scholar]
- Lee, Y.L.; Tjhung, T. Rainflow cycle counting techniques. In Metal Fatigue Analysis Handbook: Practical Problem-solving Techniques for Computer-aided Engineering; Elsevier: Amsterdam, The Netherlands, 2011; Volume 89. [Google Scholar]
- DNVGL-RP-0286; Coupled Analysis of Floating Wind Turbines. DNV: Oslo, Norway, 2019.
- DNVGL-OS-E301; Position Mooring. DNV: Oslo, Norway, 2015.
- DNVGL-OS-E302; Offshore Mooring Chain. DNV: Oslo, Norway, 2018.
- DNVGL-OS-E303; Offshore Fibre Ropes. DNV: Oslo, Norway, 2015.
- Ikhennicheu, M.; Lynch, M.; Doole, S.; Borisade, F.; Matha, D.; Dominguez, J.L.; Vicente, R.D.; Habekost, T.; Ramirez, L.; Potestio, S.; et al. Review of the State of the Art of Mooring and Anchoring Designs, Technical Challenges and Identification of Relevant DLCs. Core Wind: Brussels, Belgium, 2020. [Google Scholar]
- Lamarque, C.H.; Pernot, S.; Cuer, A. Damping identification in multi-degree-of-freedom systems via a wavelet-logarithmic decrement—Part 1: Theory. J. Sound Vib. 2000, 235, 361–374. [Google Scholar] [CrossRef]
- Wang, Y.; Chen, H.C.; Koop, A.; Vaz, G. Verification and validation of CFD simulations for semi-submersible floating offshore wind turbine under pitch free-decay motion. Ocean. Eng. 2021, 242, 109993. [Google Scholar] [CrossRef]
- Klingan, K.E. Automated Optimization and Design of Mooring Systems for Deep Water. Master’s Thesis, Norwegian University of Science and Technology, Trondheim, Norway, 2016. [Google Scholar]
- Ridge IM, L.; Banfield, S.J.; Mackay, J. Nylon fibre rope moorings for wave energy converters. In Proceedings of the OCEANS 2010 MTS/IEEE SEATTLE, Seattle, WA, USA, 20–23 September 2010; pp. 1–10. [Google Scholar]


| Sea State Case | Normal | Monsoon | 50-Year Return Period |
|---|---|---|---|
| 1.67 | 3.58 | 9.1 | |
| 5.17 | 8.79 | 12.7 | |
| 7.32 | 7.3 | 28.9 | |
| * | 10.77 | 10.77 | 42.55 |
| 0.65 | 0.65 | 1 | |
| * | 0 | 0 | 0 |
| Wind turbine state | Operating | Operating | Parking |
| Hsinchu | Probability (%) | Annual During Time (h) |
|---|---|---|
| Normal sea state | 66.66621 | 5839.96 |
| Monsoon sea state | 33.33311 | 2919.98 |
| 50-year return period | 0.00068 | 0.06 |
| Sum | 100 | 8760 |
| Parameter | Value (Unit) |
|---|---|
| Platform type | Semi-submersible |
| Platform mass (with turbine) | 20,131 (t) |
| Draft (with turbine) | 20 (m) |
| Vertical center of gravity from SWL | −2.234 (m) |
| Actual volumetric displacement | 19,634 (m3) |
| Mass moments of inertia () | (t × m2) |
| Mass moments of inertia () | (t × m2) |
| Mass moments of inertia () | (t × m2) |
| Mass moments of inertia () | (t × m2) |
| Parameter | Value (Unit) |
|---|---|
| Blade mass | 65.7 (t) |
| RNA mass | 1446 (t) |
| Tower mass | 1211 (t) |
| Tower diameter at base | 10 (m) |
| Rotor diameter | 240 (m) |
| Hub height | 150 (m) |
| Hub diameter | 6 (m) |
| Cut-in wind speed | 3 (m/s) |
| Cut-out wind speed | 25 (m/s) |
| Rated wind speed | 10.77 (m/s) |
| Advantages | Disadvantages |
|---|---|
| Cost-effective | Tension–elongation relations |
| Good tension performance | Dynamic stiffness |
| Lighter weight | Lower stiffness/strength |
| Less corrosion | Increase drag diameter in marine growth |
| Mooring System | Catenary | Taut Type | Hybrid Type |
|---|---|---|---|
| Suitable water depth (Qiao et al., 2013 [22]) | 70–500 m | More than 250 m | More than 70 m |
| Station-keeping mechanism | Weight of suspended segment of lines | Elastic elongation of rope characteristics | Restoring force from the weight and elasticity of ropes |
| Mooring line materials | Chain | Fiber and steel wire | Chain, fiber, and steel wire |
| Force on anchor | Horizontal only | 30–45 degrees (90 degrees for TLP) | Horizontal only |
| Touchdown to the seabed | Mooring and anchor | Anchor only | Mooring and anchor |
| Mooring System | Catenary | Taut Type | Hybrid Type |
| Footprint range | Large | Small | Medium |
| Platform response by wave force | Medium | Small | Medium |
| Pretension on fairlead point | Low | High | Medium |
| Cost of mooring | Expensive | Cheap | Medium |
| Cost of anchor | Cheap | Expensive | Cheap |
| Cost of O&M | Cheap | Expensive | Medium |
| Installation complexity | Easy | Complicated | Medium |
| Parameter | Value (Unit) |
|---|---|
| Water depth | 100 (m) |
| Anchor depth | 100 (m) |
| Anchor radial spacing | 650 (m) |
| Fairlead depth | 14 (m) |
| Fairlead radial spacing | 58 (m) |
| Total unstretched length 1 | 610 (m) |
| Case Symbol | Length of Fiber Rope in the Middle (m) | Length of Bottom Chain (m) | Color of Case |
|---|---|---|---|
| Pure chain | - | 610 | Blue |
| N10-C600 | 10 m of Nylon | 600 | Orange |
| N70-C540 | 70 m of Nylon | 540 | Yellow |
| P10-C600 | 10 m of Polyester | 600 | Purple |
| P100-C510 | 100 m of Polyester | 510 | Green |
| Diameter of Nylon (m) | MBL (kN) | Tension Level ≤ 70% MBL (kN) | Maximum Tension in Simulation (kN) | Pass (O) or Not Pass (X) |
|---|---|---|---|---|
| 0.2 | 5574 | 3902 | 5600 | X |
| 0.3 | 12,540 | 8778 | 6126 | O |
| 0.4 | 22,300 | 15,610 | 6895 | O |
| Diameter of Polyester (m) | MBL (kN) | Tension Level ≤ 70% MBL (kN) | Maximum Tension in Simulation (kN) | Pass (O) or Not Pass (X) |
| 0.2 | 6819 | 4773 | 8554 | X |
| 0.3 | 15,340 | 10,738 | 9367 | O |
| 0.4 | 27,270 | 19,089 | 9710 | O |
| Materials | Chain | Nylon | Polyester |
|---|---|---|---|
| Line type/grade | R3 studless | Eight-strand Multiplait | Eight-strand Multiplait |
| Mass per unit length | 685 (kg/m) | 58.3 (kg/m) | 71.8 (kg/m) |
| Axial stiffness | 3270 (MN) | 10,620 (kN) | 98,100 (kN) |
| Minimum breaking load, MBL | 22,286 (kN) | 12,540 (kN) | 15,340 (kN) |
| Nominal diameter | 0.185 (m) | 0.3 (m) | 0.3 (m) |
| Drag coefficient () | 2.4 | 1.2 | 1.2 |
| Drag coefficient () | 1.15 | 0.008 | 0.008 |
| Natural Period (s) | Pure Chain | N10-C600 | N70-C540 | P10-C600 | P100-C510 |
|---|---|---|---|---|---|
| Surge | 59.8 | 74.2 | 121.4 | 61.6 | 74.1 |
| Sway | 59.3 | 73.2 | 119.6 | 61.1 | 74.1 |
| Heave | 20.4 | 20.4 | 20.4 | 20.4 | 20.4 |
| Roll | 27.2 | 27.3 | 27.8 | 27.2 | 27.5 |
| Pitch | 27.2 | 27.3 | 27.8 | 27.1 | 27.5 |
| Yaw | 64.9 | 71.5 | 98.9 | 65.4 | 81.1 |
| Case | ) | Area Reduction |
|---|---|---|
| Pure chain | 193,182 | - |
| N10-C600 | 148,878 | 23% |
| N70-C540 | 87,009 | 55% |
| P10-C600 | 183,681 | 5% |
| P100-C510 | 145,050 | 25% |
| Property | Chain R3 | Nylon | Polyester | Steel Wire |
|---|---|---|---|---|
| Unit mass of price (EUR/kg) (Klingan, 2016) [40] | 2.45 | 4.116 | 6.86 | 4.9 |
| Mass per length (kg/m) [19] | ||||
| MBL (kN) [23] |
| Case | Chain | Nylon | Polyester | Sum (EUR) | Cost Reduction |
|---|---|---|---|---|---|
| Price (EUR/m) | 1669 | 240 | 493 | - | - |
| Pure chain | 3,053,611 | - | - | 3,053,611 | - |
| N10-C600 | 3,003,552 | 7197 | - | 3,010,749 | 1% |
| N70-C540 | 2,703,197 | 50,378 | - | 2,753,575 | 10% |
| P10-C600 | 3,003,552 | - | 14,777 | 3,018,329 | 1% |
| P100-C510 | 2,553,019 | - | 147,769 | 2,700,788 | 12% |
| Case | Chain | Nylon | Polyester | Sum (EUR) | Cost Reduction |
|---|---|---|---|---|---|
| Price (EUR/m) | 1669 | 240 | 493 | - | - |
| Pure chain | 1,764,448 | - | - | 1,764,448 | - |
| N10-C600 | 1,472,612 | 7197 | - | 1,479,809 | 16% |
| N70-C540 | 775,643 | 50,378 | - | 826,021 | 53% |
| P10-C600 | 1,662,769 | - | 14,777 | 1,677,546 | 5% |
| P100-C510 | 1,002,212 | - | 147,769 | 1,149,980 | 35% |
| Category | Pure Chain | Hybrid with Nylon | Hybrid with Polyester | |
|---|---|---|---|---|
| Platform stability | Excursion (surge) | Small | Large | Medium |
| Inclination (pitch) (related to efficiency) | Medium | Medium | Medium | |
| Mooring system | Tension performance | Worse | Better | Medium |
| Fatigue damage | Small | Large | Small | |
| Footprint area | Large | Small | Medium | |
| Mooring costs | Large | Small | Medium | |
| Entanglement assessment | Mooring line swept volume | Small | Large | Small |
| Mooring line curvature | Small | Large | Medium | |
| Tension characteristics | Small | Large | Medium | |
Disclaimer/Publisher’s Note: The statements, opinions and data contained in all publications are solely those of the individual author(s) and contributor(s) and not of MDPI and/or the editor(s). MDPI and/or the editor(s) disclaim responsibility for any injury to people or property resulting from any ideas, methods, instructions or products referred to in the content. |
© 2023 by the authors. Licensee MDPI, Basel, Switzerland. This article is an open access article distributed under the terms and conditions of the Creative Commons Attribution (CC BY) license (https://creativecommons.org/licenses/by/4.0/).
Share and Cite
Lin, T.-H.; Yang, R.-Y. Stability Analysis and Environmental Influence Evaluation on a Hybrid Mooring System for a Floating Offshore Wind Turbine. J. Mar. Sci. Eng. 2023, 11, 2236. https://doi.org/10.3390/jmse11122236
Lin T-H, Yang R-Y. Stability Analysis and Environmental Influence Evaluation on a Hybrid Mooring System for a Floating Offshore Wind Turbine. Journal of Marine Science and Engineering. 2023; 11(12):2236. https://doi.org/10.3390/jmse11122236
Chicago/Turabian StyleLin, Tzu-Hsun, and Ray-Yeng Yang. 2023. "Stability Analysis and Environmental Influence Evaluation on a Hybrid Mooring System for a Floating Offshore Wind Turbine" Journal of Marine Science and Engineering 11, no. 12: 2236. https://doi.org/10.3390/jmse11122236
APA StyleLin, T.-H., & Yang, R.-Y. (2023). Stability Analysis and Environmental Influence Evaluation on a Hybrid Mooring System for a Floating Offshore Wind Turbine. Journal of Marine Science and Engineering, 11(12), 2236. https://doi.org/10.3390/jmse11122236