Abstract
The authors have developed a method to estimate the catch efficiency of sampling gear using acoustic information. Since different sampling conditions will cause different sampling results, it is necessary to know more details about catch efficiency to quantitatively catch juvenile fish. In this study, we estimated the catch efficiency of a framed midwater trawl (FMT) for juvenile walleye pollock, and investigated differences in the catch efficiency of the FMT due to various influencing factors. To clarify the effects of different sampling conditions on catch efficiency, we investigated changes in catch efficiency by survey time (daytime and nighttime), net color (black and cyan), and towing speed (2 kt, 3 kt, 4 kt). It was quantitatively shown that the catch efficiency was higher at nighttime than during the daytime, the catch efficiency of black net was higher than that of cyan net, and the catch efficiency was higher at the faster towing speed. Comparing the estimated catch efficiency under different conditions, we found that survey time was the most important influencing factor.
1. Introduction
It was thought that sampling tools used in fisheries resource surveys have reached the stage of perfection in the 1980s, but the existing collection results were not always quantitative which had become clear with the subsequent generalization of acoustic surveys and deep-sea observation technology [1]. Furthermore, it is difficult to quantitatively catch juvenile fish using existing juvenile fish sampling gear in estimating the biomass of new recruits. Therefore, the MOHT (Matsuda–Oozeki–Hu Trawl) and the FMT (framed midwater trawl), which are new sampling gear suitable for quantitative collection of larvae and juvenile, have been developed [2,3,4,5,6]. The development of these sampling gear has opened new research fields, such as elucidating food webs based on quantitative sampling results, and estimating the catch efficiency of sampling gear using acoustic observation equipment, which had been difficult previously [1].
Catch efficiency is an important quantitative indicator for sampling gear such as FMT [7]. It is known that the size composition and density information of organisms obtained using sampling gear is biased from the population due to differences in catch efficiency [8,9]. Therefore, in order to conduct quantitative collection, it is necessary to understand the efficiency of the sampling gear used for the target organisms. Catch efficiency is expressed as the product of filtration rate, entering rate, and retention probability [10,11]. Among these parameters, the filtration rate and the retention probability are directly affected by the mesh size of the net used. When organisms are caught using an ideal sampling device that has sufficiently large net opening area, small mesh size that does not allow organisms to escape, and is capable of high-speed trawl, then the catch efficiency is equal to the entering rate [12]. However, the actual entering rate varies depending on multiple factors which mainly include the scale of sampling gear used, the towing speed, and the biological characteristics of target organisms. Fujimori (2007) compared the density of juvenile walleye pollock (mean body length 17 mm), which was determined in a sampling test using FMT at various towing speeds, and standardized it with the SV value measured with a quantitative echo sounder [12]. The results showed that the density increased as the towing speed increased, with 0.45 ind./m3 at 2 kt, 0.7 ind./m3 at 3 kt, and 1.3 ind./m3 at 4 kt, respectively. Furthermore, Itaya et al. (2007) showed that the sampling density of FMT for Diaphus spp. and Engraulis japonicus would be higher when using the larger net opening area and the faster towing speed [13]. As suggested by Barkley (1964), the efficiency of sampling gear changes depending on the relative relationship between the towing speed and the escape speed of target organisms [14].
On the other hand, fish mainly recognize the net of sampling gear visually and perform an escape behavior. Biological factors such as swimming ability and visual recognition ability change depending on the growth stage of the organism itself, but visual recognition ability in particular is also influenced by environmental factors. It has been reported that the response of juvenile walleye pollock to nets differs depending on the illuminance conditions [15]. However, acoustic resource surveys are often conducted both day and night. Doray et al. (2010) estimated the trawl efficiency for benthic fish species such as hake (Merluccius merluccius) using the ratio of catch to biomass estimated by acoustic methods, and reported that the trawl efficiency was extremely higher at nighttime than during the daytime [16]. Additionally, Rakowitz et al. (2012) observed the behavior of fish in front of the net opening of a trawl using a dual-frequency identification sonar DIDSON, and found that the rate of avoidance responses was higher during the daytime (44%) than at nighttime (6%), suggesting that differences in the light condition caused this difference [17]. Zooplankton methodology manual of ICES [18] recommended avoiding the use of light-colored sampling gear and using dark-colored sampling gear instead to reduce the escape of target organisms. However, according to Jůza et al. (2012) [19], the catch efficiencies of nets made with black and white fabric were compared during the daytime, and no significant changes were found in population density or body length of European perch (Perca fluviatilis), Pike perch (Sander lucioperca), Ruff (Gymnocephalus cernua), and the fish of Cyprinidae family.
There are few previous studies that have attempted to estimate the catch efficiency of sampling gear using acoustic information from quantitative echo sounders [20,21]. Furthermore, there are few studies that estimate the catch efficiency of sampling gear for larvae and juvenile [22]. Lu et al. (2018) developed a method of using acoustic information to estimate the catch efficiency of FMT for juvenile fish [22]. Since there are a wide variety of factors that influence the catch efficiency, it is necessary to know in detail the relationship between various sampling conditions and the catch efficiency in order to ensure the quantitative catch using FMT. In this paper, we aimed to determine the effects of survey time, net color, and towing speed on the catch efficiency of FMT for juvenile walleye pollock (Gadus chalcogrammus) by comparing the densities of fish caught in each haul to the reference densities derived from quantitative echo-sounder observations.
2. Materials and Methods
2.1. Data Sampling and Preliminary Processing
Experiments were carried out in the water around Funka Bay, Hokkaido (Figure 1), aboard T/S Ushiomaru (179 t). The samples were caught using a framed midwater trawl (FMT [5]) which has a square frame composed of four stainless steel pipes (length 2 m, diameter 43 mm). The length of the net was approximately 8.5 m to the rear end of the bucket, the front body net was made of nylon moji net (diameter 240, mesh opening 1.5 mm), and the rear codend was equipped with a mesh panel. (Standard: PE40, mesh inner diameter 526 μm) for draining water appropriately to prevent transient pressure from water flow from being applied to the caught organisms in the bucket [7]. The FMT was horizontally towed through the sound scattering layer (SSL) as seen by the quantitative echo sounder (please refer to the description below for details). A flowmeter (Rigosha Co., Ltd., Tokyo, Japan) was attached to the mouth opening of FMT to calculate the filtered water volume of each haul. A depth monitor PI50 (SIMRAD, Kongsberg Maritime AS, Horten, Norway) was attached to the upper part of FMT to monitor the towing depth in real time (Figure 2).
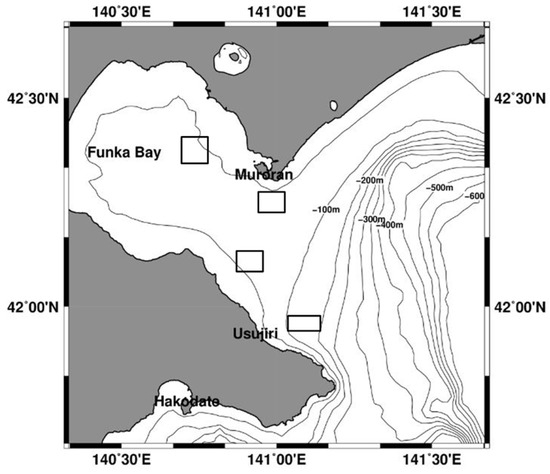
Figure 1.
Survey areas. The boxes represent the trawl sampling and acoustic data collection areas.
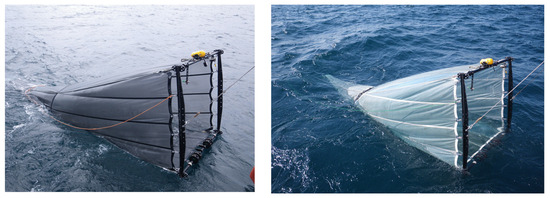
Figure 2.
FMT with the black net (left) and the cyan net (right).
To examine the effects of net color and survey time, the experiments using FMT with different net colors (black and cyan) were conducted in June 2013, June 2014, May and June 2015 (Figure 2). The speed through water (STW) was approximately 3 kt (about 1.5 m s−1) which was measured by a shipboard acoustic doppler current system. After the black net (cyan net) was towed three times, the FMT replaced with the cyan net (black net) was towed three times in the same direction again from the first trawl location. A total of 42 sampling experiments were conducted by different net colors: 12 times on each color during the day, and 9 times on each color at night.
On the other hand, to estimate the effect of towing speed, the experiments using FMT with the black net were conducted in April and May 2015 (Figure 2). The STW was set to approximately 2 kt, 3 kt, and 4 kt with the propeller pitch angle constant, respectively. A total of 15 sampling experiments were conducted by different towing speeds: 3 times at 2 kt and 3 kt, and 9 times at 4 kt.
The collected samples were preserved in 10% buffered formalin solution on board. In the land lab, all juvenile walleye pollock were extracted from the sample and counted, and then divided by the filtered water volume to calculate the trawl density. The fork lengths (FLs), rounded to the nearest 0.1 mm, were measured using an electronic caliper (Mitutoyo, Absolute 500). In addition, if more than 100 individuals were collected per haul, body lengths were measured for 100 individuals haphazardly selected.
The acoustic data were recorded using a quantitative echo-sounder EK60 (SIMRAD, Kongsberg Maritime AS, Horten, Norway) with a frequency of 38 kHz, beam width of 7°, pulse width of 1.024 ms, pulse interval of 1 s, and range of 3 m to seabed or 500 m. The EK-60 was calibrated every April using a tungsten-carbide sphere with a diameter of 38.1 mm (WC 38.1) following the method described by Foote et al. (1987) [23]. Since juvenile walleye pollack has a swim bladder and is larger than zooplankton, the echogram threshold was set at −70 dB to minimize the effect of acoustic scattering by zooplankton [24]. The noise measurements in passive acoustic mode were conducted at speeds of 0 kt, 2 kt, 3 kt, 4 kt, 9 kt, and 10 kt in May 2014 and April 2016. As a result, we did not find that the noise level got louder over time and we found that the noise level became lower as the depth became shallower and the STW decreased. The maximum noise of 300 m was −81.5 dB at 10 kt, which ensured that the signal-to-noise ratio was greater than 10 under all experimental conditions [25]. Echograms were processed using the hydroacoustic data-processing software Echoview 9 (Echoview Software Pty Ltd., Hobart, TAS, Australia). We preprocess acoustic data using the “Impulse Noise Removal” operator and “Background Noise Removal” to remove “impulsive noise (IN)” and “background noise (BN)” as the first step [26,27]. The identification of attenuated signals was carried out through visual inspection of the echogram and we did not find the existence as a result. The mean SV (volume backscattering strength) was calculated along the FMT tow trajectories which were defined as the range enclosed by a width of 4 m (frame height is 2 m) and at the towing depth (based on the depth sensor attached to the FMT) for the duration of each haul (Figure 3).
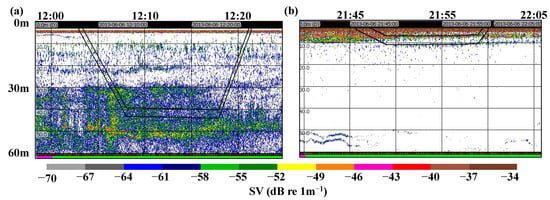
Figure 3.
The typical SV echograms of 38 kHz recorded during the daytime (a) and nighttime (b). All horizontal hauls of (a,b) were of 10 min duration, and the warp length was 150 m and 25 m, respectively. Black polygons represent trawl trajectories. The trawls were conducted outside of one hour before and after sunrise and sunset.
2.2. Estimation of Catch Efficiency Using Acoustic Data
Lu et al. (2018, in Japanese [22]) and Lu et al. (2021, in English [28]) explained the specific logical derivation process; therefore, we only give a brief explanation in this article. Catch efficiency, q, can be expressed as:
where f is the filtration rate, (ind.m−3) is the sampling density of organisms caught by FMT (net density), is the backscattering cross section (equivalent to target strength (TS) in decibels, and (m−3) is the volume backscattering coefficient (equivalent to SV in decibels).
The filtration rate is calculated using the ratio between the volume calculated from the flowmeter and the volume of the water column that the net passed through, which is expressed as the product of the towing speed, towing time, and opening area [29]. The filtration rates of the FMT applied in this study were 1.0 at 2 kt, 0.8 at 3 kt, and 0.6 at 4 kt, which were the mean value in May 2015, June 2013, and April 2015, respectively. Net density is expressed as the ratio of trawl catch per haul and the filtered water volume calculated from the flowmeter value. When the target organism is a single taxon and is measured by a quantitative echo sounder, and can be calculated using length and density from the sampling gear, and the catch efficiency q can be estimated for mean size which is measured by a quantitative echo sounder.
Sadayasu (2005) measured the TS of juvenile walleye pollock using the tethered method and calculated the average TS from the pitch angle characteristics of the obtained TS [30]. Then, the relationship between the average TS () and fork length of juvenile walleye pollock with a fork length of 10 cm or less was calculated using Equation (2). Therefore, the average TS of the caught individuals was calculated using the same formula in this study.
3. Results
3.1. Characteristics of Net Sampling under Different Times and Net Colors
The number of individuals collected was 23 to 4402 ind. in 2013, 0 to 872 ind. in 2014, and 0 to 6794 ind. in 2015 (Table 1). In both experiments, the number of juveniles caught using the black net was higher than that using the cyan net at night, but there was no significant difference between net colors during the daytime.

Table 1.
Summary of towing conditions of FMT under different survey times and net colors at the towing speed of 3 kt.
In order to analyze the effects of net color and day/night on the number of juveniles caught, we conducted a two-way analysis of variance test (ANOVA) and assumed that catches were not affected by net color and day/night (Table 2). In addition, the trawl was not carried out at night in May 2015; therefore, a one-way analysis ANOVA was conducted on net color (Table 2). As a result, p < 0.05 was obtained in all experiments except June 2015, indicating that there was a factorial effect and interaction between net color and survey time, which had a strong influence on the number of fish caught.
Table 2.
Analysis of variance on the number of catches under different survey times and net colors.
Furthermore, we conducted a simple main effect analysis for 2013 and 2014, where there was a significant difference in the interaction (Table 3). It was confirmed that the effect of net color was weak during the daytime (p > 0.05), and the effect of day/night was particularly strong (p < 0.02).
Table 3.
Analysis of variance on the simple main effect under different survey times and net colors.
The mean fork length and standard deviation of the juvenile walleye pollock caught in June 2013 (Figure 4) were 31.8 ± 5.4 mm (day/black), 31.8 ± 4.9 mm (day/cyan), 46.6 ± 10.1 mm (night/black), and 35.1 ± 6.6 mm (night/cyan), respectively. In June 2014 (Figure 4), they were 38.3 ± 5.0 mm (day/black), 31.6 ± 10.0 mm (day/cyan), 43.6 ± 4.9 mm (night/black), and 40.5 ± 5.4 mm (night/cyan), respectively. In May 2015 (Figure 4), they were 27.5 ± 3.3 mm (day/black) and 27.9 ± 3.7 mm (day/cyan), respectively. In June 2015 (Figure 4), they were 50.7 ± 6.0 mm (night/black) and 49.7 ± 5.8 mm (night/cyan), respectively.
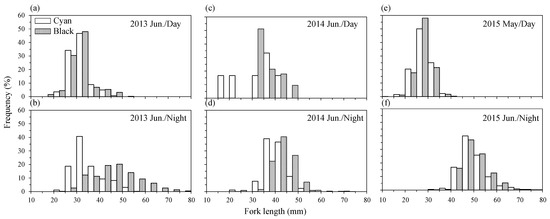
Figure 4.
Comparison of length frequency distribution of juvenile walleye pollock caught by FMT under different net colors during the daytime (a) and nighttime (b) in June 2013, daytime (c) and nighttime in June 2014 (d), daytime in May 2015 (e) and nighttime in June 2015 (f).
The Kolmogorov−Smirnov test (KS test) was performed to test the difference in the shape of the body length distribution of juvenile walleye pollock caught by the black net and cyan net (Table 4). At night, the body length distribution was shown to be significantly different depending on the net color (p < 0.01). There was a tendency to catch larger individuals in the black net than in the cyan net at night (Figure 4). However, there was no significant difference in body length distribution due to the difference in net color during the day.
Table 4.
The results of Kolmogorov−Smirnov test on fork length distribution under different net colors.
3.2. Characteristics of Net Sampling at Different Towing Speeds
Table 5 shows the FMT towing conditions and measured SV in the towing speed comparison experiment. The number of individuals caught by different towing speeds was 1204 to 5040 ind. (daytime/4 kt), 896 to 19,616 ind. (night/3 kt), and 8729 to 19,891 ind. (night/4 kt) in April, and 1654 to 4932 ind. (night/4 kt) and 1059 to 3968 ind. (night/2 kt) in May, respectively. When the body length of juvenile walleye pollack is relatively small in April, the number of individuals caught by 4 kt was greater than by 3 kt at night. Similarly, even at the speed of 4 kt, the number of individuals caught at nighttime was greater than during the daytime. On the other hand, when the body length of young walleye pollock grows in May, there was no difference in the number of individuals caught at 4 kt and 2 kt, even at night.
Table 5.
Summary of towing conditions of FMT at different towing speeds.
In order to analyze the effects of towing speed and survey time on the number of individuals caught, a one-way ANOVA was conducted under each condition (Table 6). We found that there was a difference (p > 0.05) in the number of individuals caught between different speeds (2 kt, 3 kt, and 4 kt) at night. In addition, in the case of high-speed towing (4 kt), it was confirmed that there was a difference in the number of individuals caught between day and night (p = 0.07).
Table 6.
Analysis of variance on the number of catches at different towing speeds.
The body length distribution of juvenile walleye pollock obtained under each condition is shown in Figure 5, divided by the time and towing speed. In April 2015, the mean fork length and standard deviation of juvenile walleye pollock were 16.1 ± 2.8 mm (night/3 kt), 16.8 ± 5.0 mm (night/4 kt), and 15.4 ± 2.6 mm (daytime/4 kt), respectively. In May 2015, they were 30.6 ± 5.0 mm (night/4 kt) and 30.1 ± 5.6 mm (night/2 kt), respectively. The mean body length of the juvenile fish caught using the 4 kt high speed was slightly larger than that obtained using the low speed.
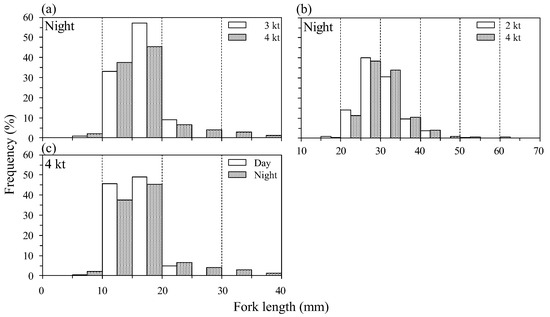
Figure 5.
Comparison of length frequency distribution of juvenile walleye pollock caught by FMT at different towing speeds with the black net during the nighttime in April 2015 (a) and in May 2015 (b). And, comparison of length frequency distribution of juvenile walleye pollock caught by FMT at a speed of 4 kt with the black net during the daytime and nighttime in April 2015 (c).
The KS test was performed to examine differences in the shape of body length distribution (Table 7). The results showed that there was no change in body length distribution at night even with different towing speeds (p > 0.05), and the body length was larger at night than during the day at a high speed of 4 kt.
Table 7.
The results of Kolmogorov−Smirnov test on fork length distribution under different towing speeds.
3.3. Estimation of Catch Efficiency under Different Conditions
The catch efficiencies of FMT for juvenile walleye pollock under different survey times and net colors (Table 8) were calculated using Equation (1). In June 2013, the catch efficiencies were <0.01 (day/cyan), 0.01–0.02 (day/black), 0.01–0.04 (night/cyan), and 0.16–0.20 (night/black), respectively. In June 2014, the catch efficiencies were <0.01 (day/cyan), <0.01 (day/black), 0.01–0.02 (night/cyan), and 0.17–0.20 (night/black), respectively. In May 2015, the catch efficiencies were 0.01–0.06 (day/cyan) and 0.04–0.07 (day/black), respectively. In June 2015, the catch efficiencies were <0.01 (day/cyan), <0.01 (day/black), 0.03–0.13 (night/cyan), and 0.01–0.32 (night/black), respectively.
Table 8.
Estimated catch efficiencies under different survey times and net colors.
During the day, the catch efficiency of both black and cyan nets was extremely low (<0.02), and no difference was observed between them. When the black net was used during the daytime, it was found that the catch efficiency for juvenile walleye pollock (10–50 mm) decreased as the body length increased (R2 = 0.73). In the case of the cyan net, the overall catch efficiency was low (<0.01), and the body length dependence seen with the black net was not observed.
On the other hand, the catch efficiency at night was clearly higher on black mesh than on cyan mesh in 2013 and 2014 (Table 8). Regarding the difference between day and night, it was found that the catch efficiency at night was higher than during the day, regardless of the net color (Table 8).
Table 9 shows the catch efficiency of FMT with different towing speeds. In April 2015, the catch efficiency was 0.30–0.52 (night/3 kt), 0.56–0.74 (night/4 kt), and 0.15–0.24 (day/4 kt), respectively. In May 2015, they were 0.25–0.47 (night/4 kt) and 0.14–0.22 (night/2 kt), respectively. The catch efficiency was high at a high towing speed of 4 kt in both cases. At a towing speed of 4 kt, the estimated catch efficiency of nighttime was 3 to 4 times higher than during the day. It was also found that the larger the body length, the lower the catch efficiency.
Table 9.
Estimated catch efficiencies at different survey times and towing speeds.
4. Discussion
4.1. Effect of Survey Time on Catch Efficiency
According to the model of catch efficiency proposed by Barkley [29], catch efficiency varies depending on factors such as the area of net opening, the towing speed relative to water column, the swimming speed when fish avoid the coming net, and the reaction distance. No matter how other conditions change, when the reaction distance approaches 0 (the reaction time also approaches 0), the catch efficiency approaches 1. The reaction distance is the distance from trawl to fish when the fish takes action after seeing the trawl, and it changes depending on the survey times. In this study, it was found that when the towing speed was 3 kt, the catch efficiency at nighttime was higher than that during the daytime, regardless of the net color (Table 8). In addition, when the towing speed was 4 kt with black net, the catch efficiency at nighttime was 3 to 4 times higher than that during the daytime (Table 9). It can be obtained that the survey time has the most important influence on the catch efficiency of FMT for juvenile walleye pollock.
On the other hand, the mean body length of the juvenile walleye pollock caught at nighttime was larger than that during the daytime, regardless of net color (Figure 4). The differences in the mean body length between nighttime and daytime were 14.8 mm for black net and 3.3 mm for cyan net in 2013, respectively. In 2014, the differences were 5.3 mm and 8.9 mm, respectively. The mean body length was also larger at night than that during the daytime at the high speed.
Vessel noise and warps vibrations have also been implicated as factors that trigger avoidance/escaping behavior in fish [31]. In this experiment, the night trawl experiments were mainly conducted near the sea surface due to the diel vertical migration (DVM) of organisms, and the towing depths were about 10 m located about 15 m behind the vessel. Although these factors seem to affect the catch efficiency greatly, the catch efficiency at night was higher than that during the day. It can be inferred that the survey time in the field greatly affects the sight of juvenile walleye pollock, and that the escape ability improves in a bright environment during the day and decreases at night.
4.2. Effect of Net Color on Catch Efficiency
The catch efficiency of bottom trawl for benthic fishes such as hake (Merluccius merluccius) varied significantly between day and night in the previous studies [16], but there were few precedents for examining sampling efficiency based on differences in net color in addition to time. In experiments conducted from 2013 to 2015, the number of individuals caught using the black net was clearly higher than that of cyan net at night. However, no significant difference was observed depending on the net color during the daytime. Specifically, juvenile walleye pollock can visually recognize both black net and cyan net in the same way during the high-light environments, and perform an escape behavior. In a low-light environment at night, black mesh is harder to see than cyan mesh; therefore the catch efficiency of cyan net is lower and that of black net is higher.
Regarding the results that larger fishes were able to be caught by FMT with the black net at nighttime than that of cyan net, all trawls were carried out at depths below 15 m (Table 1), and because the warp length was short, it was likely that the area around the nets was not completely dark due to the influence of the ship’s lights. In general, the surface layer is easily affected by environmental illumination, and the net is visible to some extent. The visual acuity and swimming ability of fish develop as they grow, and large juvenile fish were able to see the cyan net. As a result of avoiding the coming net, the black net had higher catch efficiency than the cyan net at nighttime.
It is thought that the illuminance of the survey area and the contrast of net color with the background color are important for the color vision discrimination ability of fish. In the future, it was considered necessary to quantitatively measure the light environment such as light intensity and spectral distribution in the field, and further investigate the visual acuity and color vision abilities of target organisms.
On the other hand, it was found that the catch efficiency for juvenile walleye pollock (10–50 mm) decreased as the body length increased when the black net was used during the daytime in this study. Ryer and Olla [32] showed that the swimming speed of juvenile walleye pollock (body length 60–75 mm) was 1.0–2.2 times the body length per second during feeding. The escape speed of fish during collection was close to the maximum swimming speed and could be thought to also depend on body length. The swimming speed of the fish increased as the size of the fish increased, and then the ability of the fish to avoid nets also increased. Fujimori et al. (2008) showed that the body length of juvenile walleye pollock that has been caught varies greatly depending on season [7]. Therefore, in order to quantitatively evaluate juvenile fish at each growth stage, it will be necessary to estimate the catch efficiency of each subdivided body length class under various towing conditions.
4.3. Effect of Towing Speed on Catch Efficiency
In April and May 2015, differences in catch efficiency were observed due to differences in towing speed (2 kt, 3 kt, 4 kt) at nighttime (Table 6). In general, even if the avoidance ability of fish remains constant, the reaction time will become shorter and the catch efficiency will increase with the increase in towing speed. In April and May, high-speed towing showed higher catch efficiency than low-speed towing (Table 9).
In the case that the towing depth was the same, increasing the towing speed by 1 kt resulted in a 1.1–2.5 times increase in catch efficiency for juvenile walleye pollock with a mean fork length of 16 mm caught in April. Furthermore, when increasing the towing speed by 2 kt, the catch efficiencies were changed by 1.1–3.4 times for juvenile walleye pollock with a mean fork length of 30 mm caught in May. These results demonstrate that, the reaction time becomes shorter and the catch efficiency increases with the increase in towing speed as shown in the Barkley model [9]. However, it was not clear how much the catch efficiency would increase if the towing speed was increased in steps of 1 kt.
The filtration rate will be strongly affected by the towing speed [24]. In this study, we used the ratio between the volume calculated from the flowmeter and the volume of the water column that the net passed through from echograms. The filtration rate was max (1.0) at the speed of 2 kt, and it gradually became smaller as the towing speed increased. The catch efficiency itself is very low during the day and the accuracy of the filtration rate becomes extremely important in this case; therefore, special caution is required. In the future, it will be necessary to increase the number of trawls and conduct research on a finer scale.
Past research on the target of cod (Gadus morhua) and other benthic fishes had shown that the relationship between acoustic measurements and trawl estimates was dependent on factors such as time, season, size class, vertical distribution, towing depth, and the effective fishing range of bottom trawl [33,34]. In this study, we estimated the catch efficiency of FMT for juvenile walleye pollack under various conditions, but there were a wide variety of factors that influence catch efficiency, including biological factors, environmental factors, and towing conditions. In order to ensure the quantitative nature of catch using FMT, it is necessary to keep in mind the influence of these factors.
5. Conclusions
In order to clarify the influence of various sampling conditions on catch efficiency of FMT for juvenile walleye pollock, we investigated changes in catch efficiency by survey time (day and night), net color (black/cyan), and towing speed (2 kt, 3 kt, 4 kt). It was found that the catch efficiency was higher at night than that during the day regardless of the net color. The catch efficiency of black net was higher than that of cyan net, but there was not much difference during the day. As we hypothesized that the catch of high-speed towing was high, filtration rate issues need to be considered in quantitative trawl resource surveys.
Author Contributions
Conceptualization, K.I. and T.M.; methodology, All authors; software, Z.L. and T.M.; validation, Z.L., T.M. and Y.F.; formal analysis, Z.L.; investigation, Z.L., T.M. and Y.F.; resources, K.I. and T.M.; data curation, Z.L. and T.M.; writing—original draft preparation, Z.L.; writing—review and editing, T.M., Y.F. and K.I.; visualization, Z.L.; supervision, T.M. and Y.F.; project administration, T.M.; funding acquisition, T.M. All authors have read and agreed to the published version of the manuscript.
Funding
This research received no external funding.
Institutional Review Board Statement
Not applicable.
Informed Consent Statement
Not applicable.
Data Availability Statement
Data is contained within the article.
Acknowledgments
We would like to thank the captain and crew of T/S Ushiomaru for their great cooperation during the surveys, as well as S. Taya and the members of lab “SOKKIES”. We are extremely grateful to the editor and the anonymous reviewers for their valuable comments and suggestions, which have helped improve the quality of our manuscript.
Conflicts of Interest
The authors declare no conflict of interest.
References
- Oozeki, Y. Present status of the development of quantitative-sampling gears for juvenile fishes. Nippon. Suisan Gakkaishi 2007, 73, 923–924. [Google Scholar] [CrossRef][Green Version]
- Mehot, R.D. Frame trawl for sampling pelagic juvenile fish. Calcofi. Rep. 1986, XXVII, 267–278. [Google Scholar]
- Aoki, I.; Miura, T.; Imai, N.; Komatsu, T. Sampling large larvae and juveniles of pelagic fish with a frame-type midwater Trawl. Nippon. Suisan Gakkaishi 2000, 66, 10–17. [Google Scholar] [CrossRef]
- Hu, F.; Oozeki, Y.; Tokai, T.; Matuda, K. Scale model of a new midwater trawl system for sampling pelagic larval and juvenile fish. Fish. Sci. 2001, 67, 254–259. [Google Scholar] [CrossRef]
- Itaya, K.; Fujimori, Y.; Shiode, D.; Aoki, I.; Yonezawa, T.; Shimizu, S.; Miura, T. Sampling performance and operational quality of a frame trawl used to catch juvenile fishes. Fish. Sci. 2001, 67, 436–443. [Google Scholar] [CrossRef]
- Oozeki, Y.; Hu, F.; Kubota, H.; Sugisaki, H.; Kimura, R. Newly designed quantitative frame trawl for sampling larval and juvenile pelagic fish. Fish. Sci. 2004, 70, 223–232. [Google Scholar] [CrossRef]
- Fujimori, Y.; Yamashita, Y.; Abe, M.; Itaya, K.; Mukai, T. A trousers-type framed midwater trawl for simultaneous sampling of plankton and micronekton—Size selectivity of minnow netting for euphausiids. Fish. Eng. 2008, 44, 197–204. [Google Scholar] [CrossRef]
- Wileman, D.A.; Ferro, R.S.T.; Fonteyne, R.; Millar, R.B. Manual of Methods of Measuring the Selectivity of Towed Fishing Gears; ICES Cooperative Research Reports No. 215; ICES: Copenhagen, Denmark, 1996; pp. 1–126. [Google Scholar]
- Godø, O.R.; Karp, W.A.; Totland, A. Effects of trawl sampling variability on precision of acoustic abundance estimates of gadoids from the Barents Sea and the Gulf of Alaska. ICES J. Mar. Sci. 1998, 55, 86–94. [Google Scholar] [CrossRef]
- Nakamura, M. An estimation of capture probability on anchovy larvae Engrauris japonicus with a 60cm-BONGO net. Nippon. Suisan Gakkaishi 1989, 55, 1893–1898. [Google Scholar] [CrossRef][Green Version]
- Nakamura, M. Change of catch efficiency of a plankton net depending on towing speed. Nippon. Suisan Gakkaishi 1992, 58, 861–869. [Google Scholar] [CrossRef]
- Fujimori, Y. Development of a towed sampling gear for the survey of sound scattering layer. Nippon. Suisan Gakkaishi 2007, 73, 925–926. [Google Scholar] [CrossRef]
- Itaya, K.; Fujimori, Y.; Shimizu, S.; Komatsu, T.; Miura, T. Effect of towing speed and net mouth size on catch efficiency in framed midwater trawls. Fish. Sci. 2007, 73, 1007–1016. [Google Scholar] [CrossRef]
- Barkley, R.A. The theoretical effectiveness of towed-bet samplers as related to sampler size and to swimming speed of organisms. ICES J. Mar. Sci. 1964, 29, 146–157. [Google Scholar] [CrossRef]
- Fujimori, Y.; Shiode, D.; Baba, N.; Shimizu, S.; Miura, T. Behavior of juvenile walleye pollock Theragra Chalcogramma in relation to time and illuminance. Nippon. Suisan Gakkaishi 1999, 65, 26–32. [Google Scholar] [CrossRef]
- Doray, M.; Mahévas, S.; Trenkel, V.M. Estimating gear efficiency in a combined acoustic and trawl survey, with reference to the spatial distribution of demersal fish. ICES J. Mar. Sci. 2010, 67, 668–676. [Google Scholar] [CrossRef]
- Rakowitz, G.; Tušer, M.; Říha, M.; Jůza, T.; Balk, H.; Kubečka, J. Use of high-frequency imaging sonar (DIDSON) to observe fish behaviour towards a surface trawl. Fish. Res. 2012, 123–124, 37–48. [Google Scholar] [CrossRef]
- Harris, R.; Wiebe, P.; Lenz, J.; Skjoldal, H.R.; Huntley, M. ICES Zooplankton Methodology Manual; Academic Press: London, UK, 2000; pp. 1–684. [Google Scholar]
- Jůza, T.; Čech, M.; Kubečka, J.; Vašek, M.; Peterka, J.; Kratochvíl, M.; Frouzová, J.; Matěna, J. The influence of the trawl mouth opening size and net colour on catch efficiency during sampling of early stages of perch (Perca fluviatilis) and pikeperch (Sander lucioperca) in the bathypelagic layer of a canyon-shaped reservoir. Fish. Res. 2012, 123–124, 21–25. [Google Scholar] [CrossRef]
- O’Driscoll, R.; Rose, G.; Anderson, J. Counting capelin: A comparison of acoustic density and trawl catchability. ICES J. Mar. Sci. 2002, 59, 1062–1071. [Google Scholar] [CrossRef]
- Lu, Z. Study on Estimating the Catch Efficiency of Sampling Gear for Juvenile and Zooplankton Using an Acoustic Method. Ph.D. Thesis, Hokkaido University, Sapporo, Japan, 2019; pp. 1–158. [Google Scholar]
- Lu, Z.; Mukai, T.; Fujimori, Y.; Iida, K. Estimating the catch efficiency of a framed midwater trawl for juvenile walleye pollock (Gadus chalcogrammus) using an acoustic method. Fish. Eng. 2018, 55, 135–144. [Google Scholar] [CrossRef]
- Foote, K.G.; Knudsen, H.P.; Vestnes, G.; MacLennan, D.N.; Simmonds, E.J. Calibration of Acoustic Instruments For Fish Density Estimation: A Practical Guide; Technical Report, ICES Cooperative Research Reports No. 144; ICES: Copenhagen, Denmark, 1987; pp. 1–72. [Google Scholar]
- Demer, D.A. An estimate of error for the CCAMLR 2000 survey estimate of krill biomass. Deep-Sea Res. 2004, 51, 1237–1251. [Google Scholar] [CrossRef]
- Korneliussen, R.J.; Diner, N.; Ona, E.; Fernandes, P.G. Recommendations for the Collection of Multi-Frequency Acoustic Data; ICES CM 2004; ICES: Copenhagen, Denmark, 2004; pp. 1–15. [Google Scholar]
- De Robertis, A.; Higginbottom, I. A post-processing technique to estimate the signal-to-noise ratio and remove echosounder background noise. ICES J. Mar. Sci. 2007, 64, 1282–1291. [Google Scholar] [CrossRef]
- Ryan, T.E.; Downie, R.A.; Kloser, R.J.; Keith, G. Reducing bias due to noise and attenuation in open-ocean echo integration data. ICES J. Mar. Sci. 2015, 72, 2482–2493. [Google Scholar] [CrossRef]
- Lu, Z.; Mukai, T.; Fujimori, Y.; Iida, K. Estimating the sampling efficiencies of a framed midwater trawl and ring net for zooplankton using an acoustic method net for zooplankton using an acoustic method. J. Mater. Sci. Technol. 2021, 29, 185–196. [Google Scholar] [CrossRef]
- Barkley, R.A. Selectivity of towed-net samplers. Fish. Bull. 1972, 70, 799–820. [Google Scholar]
- Sadayasu, K. Research on Precise Estimation of Target Strength of Fish. Ph.D. Thesis, Hokkaido University, Sapporo, Japan, 2005; pp. 1–260. [Google Scholar]
- Robertis, A.D.; Handegard, N.O. Fish avoidance of research vessels and the efficacy of noise-reduced vessels: A review. ICES J. Mar. Sci. 2013, 70, 34–35. [Google Scholar] [CrossRef]
- Ryer, C.; Olla, B. Altered search speed and growth: Social versus independent foraging in two pelagic juvenile fishes. Mar. Ecol. Prog. Ser. 1997, 153, 273–281. [Google Scholar] [CrossRef]
- Hjellvik, V.; Michalsen, K.; Aglen, A.; Nakken, O. An attempt at estimating the effective fishing height of the bottom trawl using acoustic survey recordings. ICES J. Mar. Sci. 2003, 60, 967–979. [Google Scholar] [CrossRef]
- Gauthier, S.; Rose, G.A. Diel vertical migration and shoaling heterogeneity in Atlantic redfish: Effects on acoustic and bottom-trawl surveys. ICES J. Mar. Sci. 2005, 6, 75–85. [Google Scholar] [CrossRef]


Disclaimer/Publisher’s Note: The statements, opinions and data contained in all publications are solely those of the individual author(s) and contributor(s) and not of MDPI and/or the editor(s). MDPI and/or the editor(s) disclaim responsibility for any injury to people or property resulting from any ideas, methods, instructions or products referred to in the content. |
© 2023 by the authors. Licensee MDPI, Basel, Switzerland. This article is an open access article distributed under the terms and conditions of the Creative Commons Attribution (CC BY) license (https://creativecommons.org/licenses/by/4.0/).