
The Lateral Behavior of Large-Diameter Monopiles for Offshore Wind Turbines Based on the p-y Curve and Solid FEM Methods

Abstract
:1. Introduction
2. Offshore Full-Scale In Situ Test of Pile
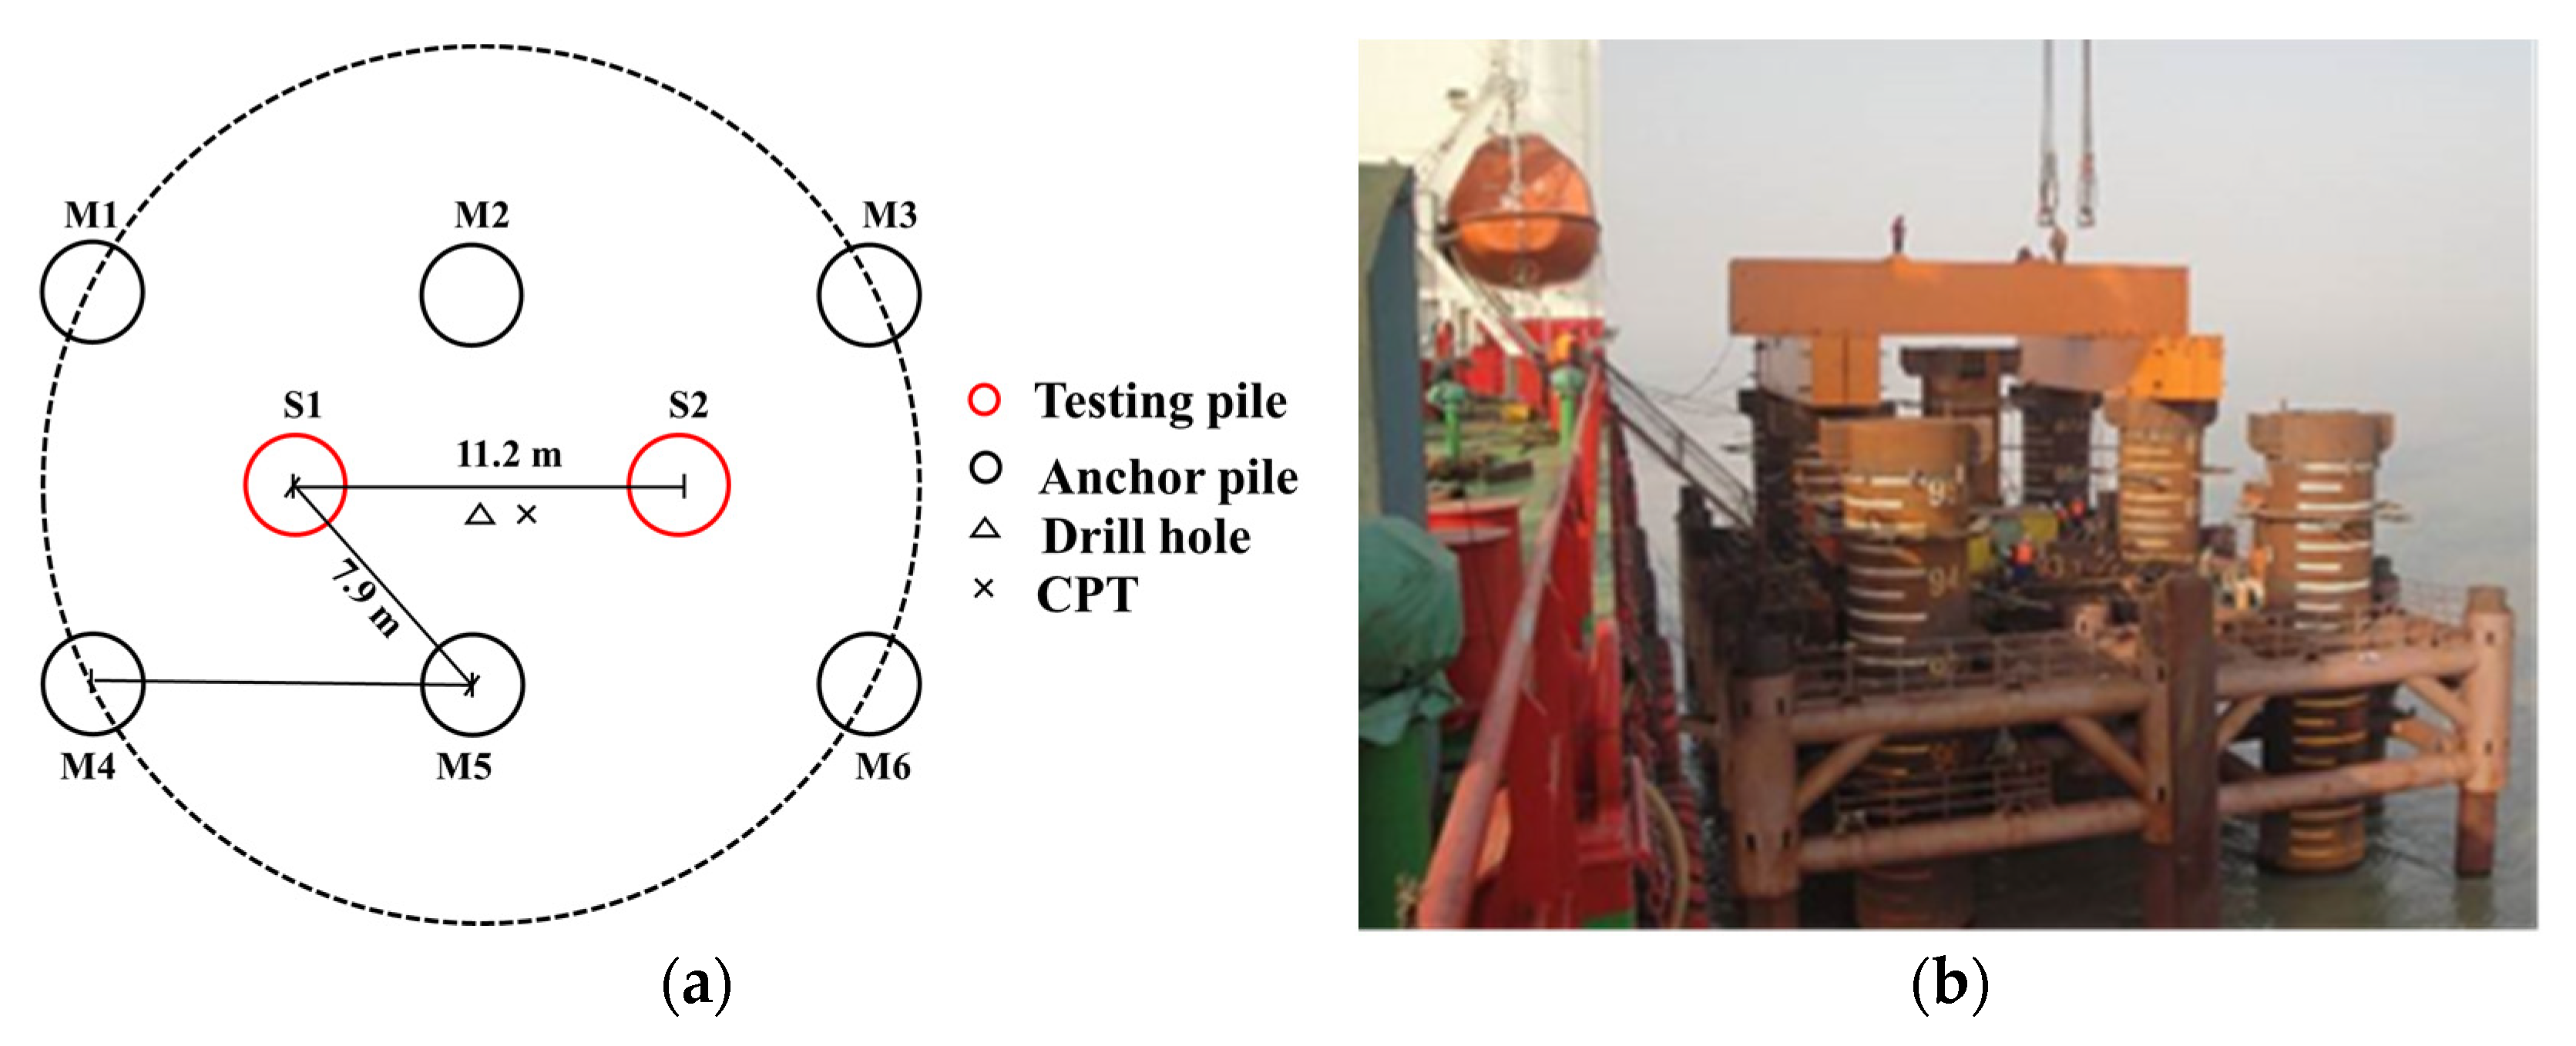
2.1. Testing Pile Arrangement and Soil Seabed Parameters
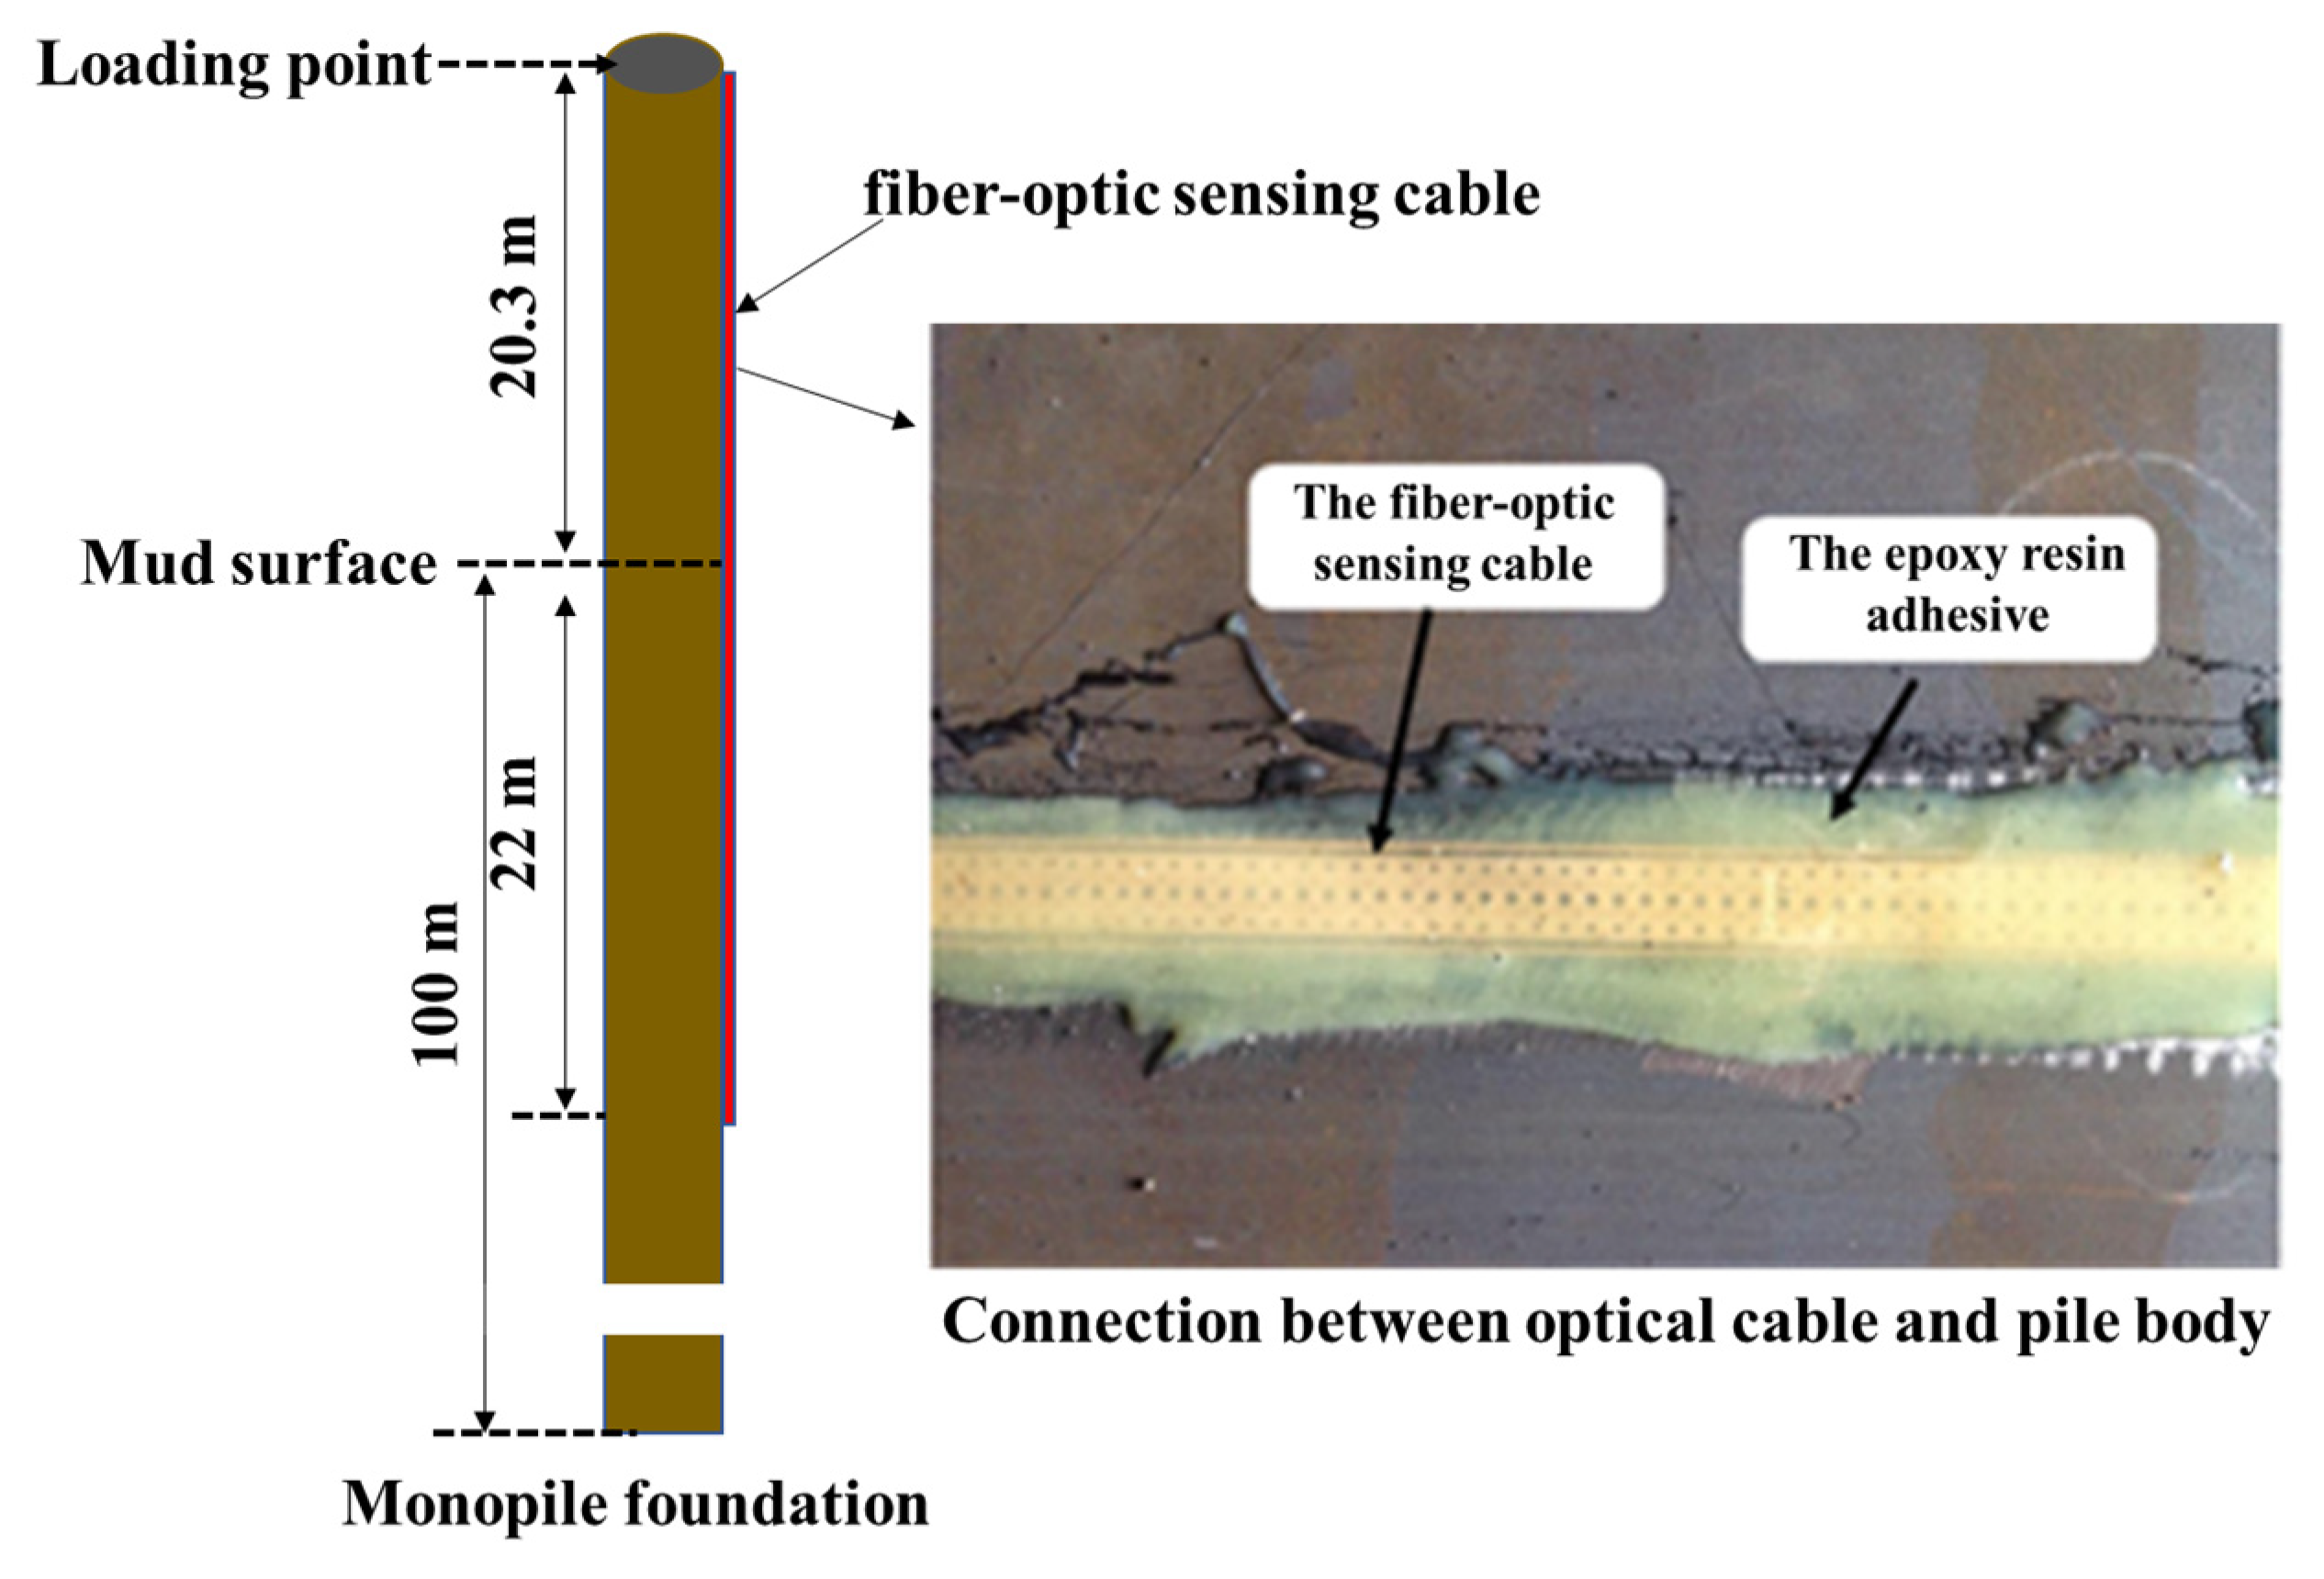
2.2. Testing Instrument Arrangement and Loading Method
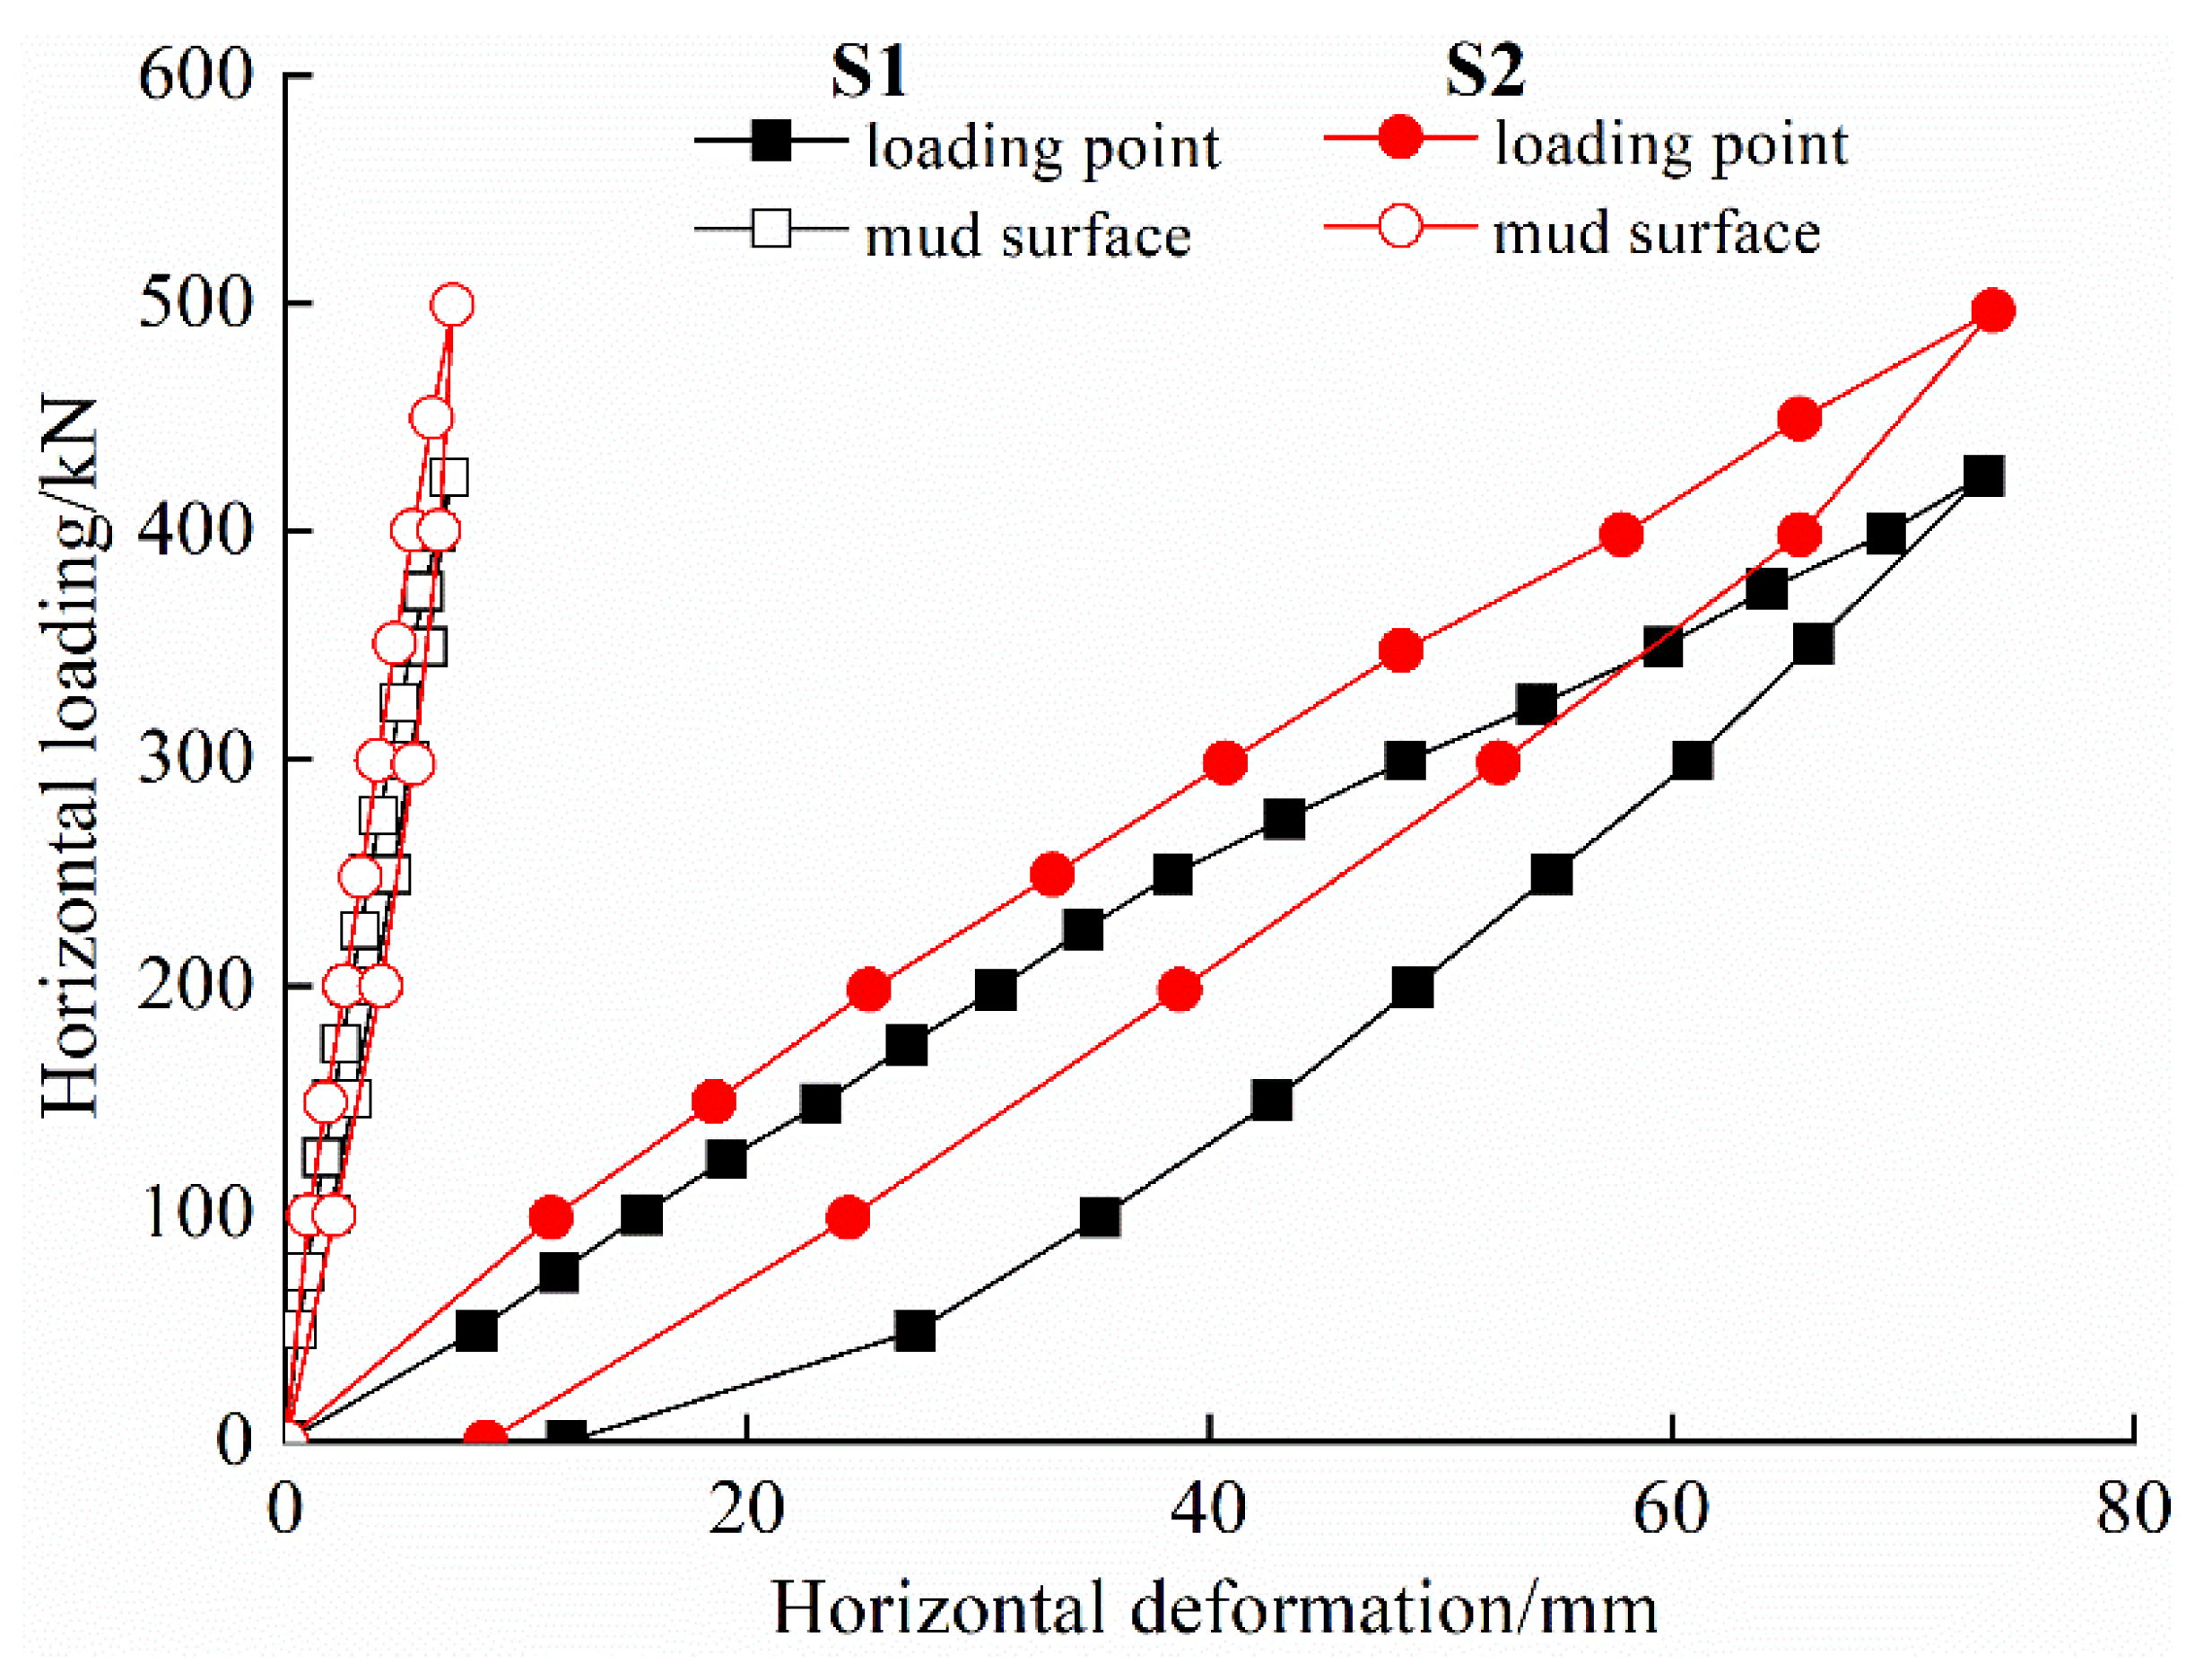
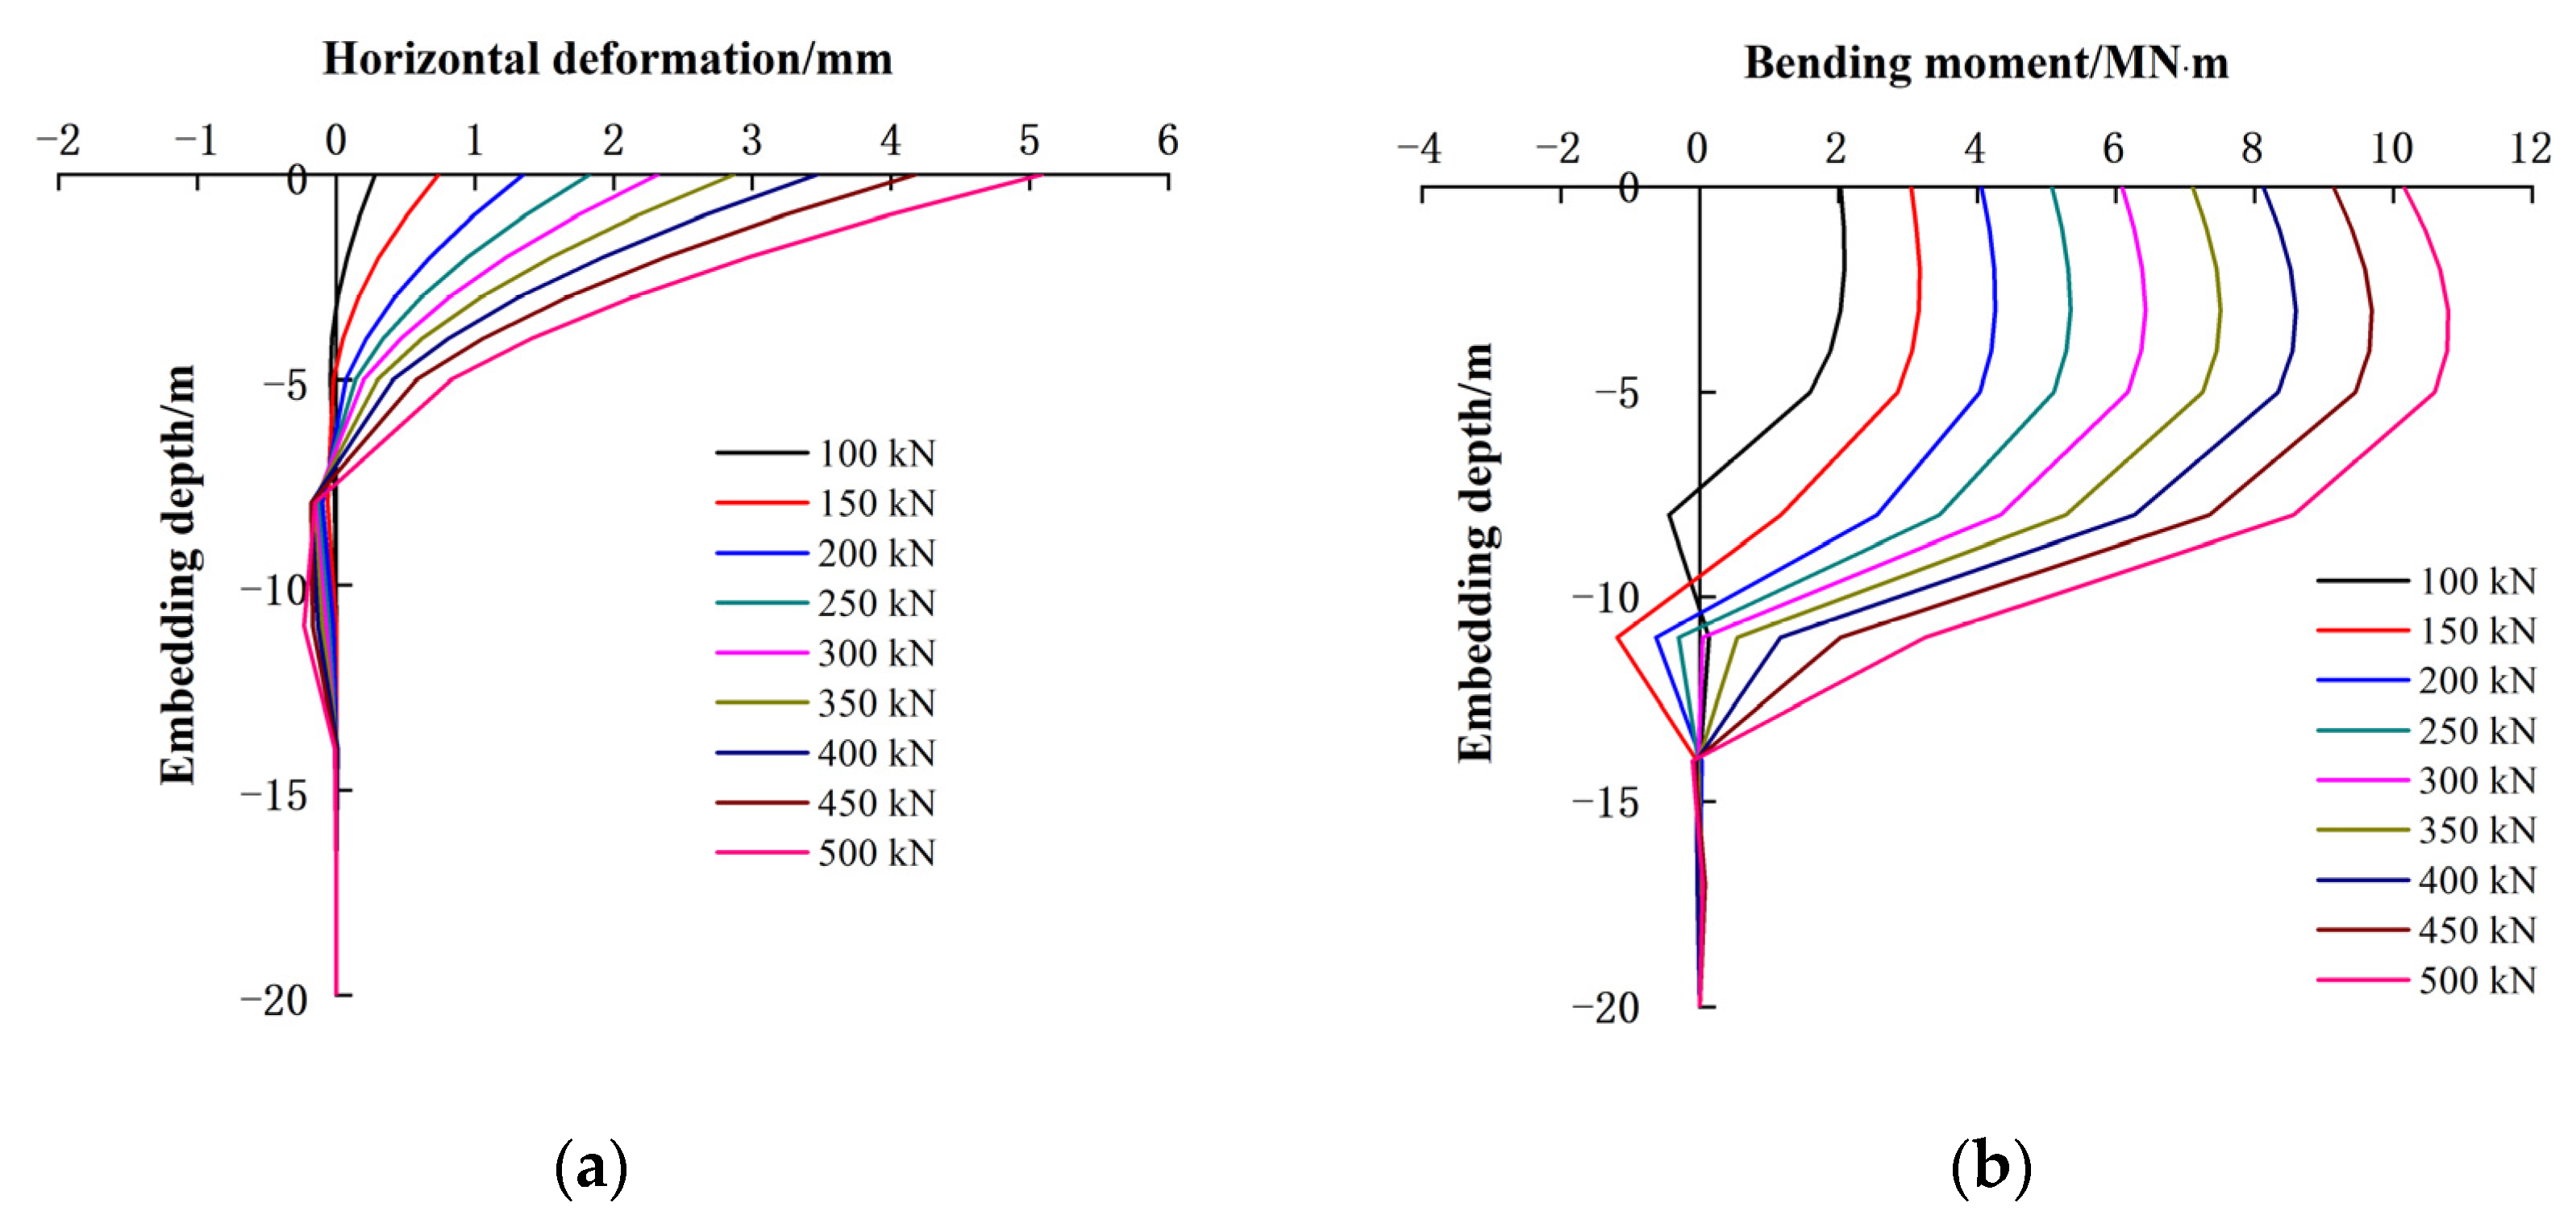
2.3. Testing Result and Analysis
3. Testing Pile Analysis Based on the P-Y Curve and Solid Finite Element Method
3.1. The P-Y Curve Method
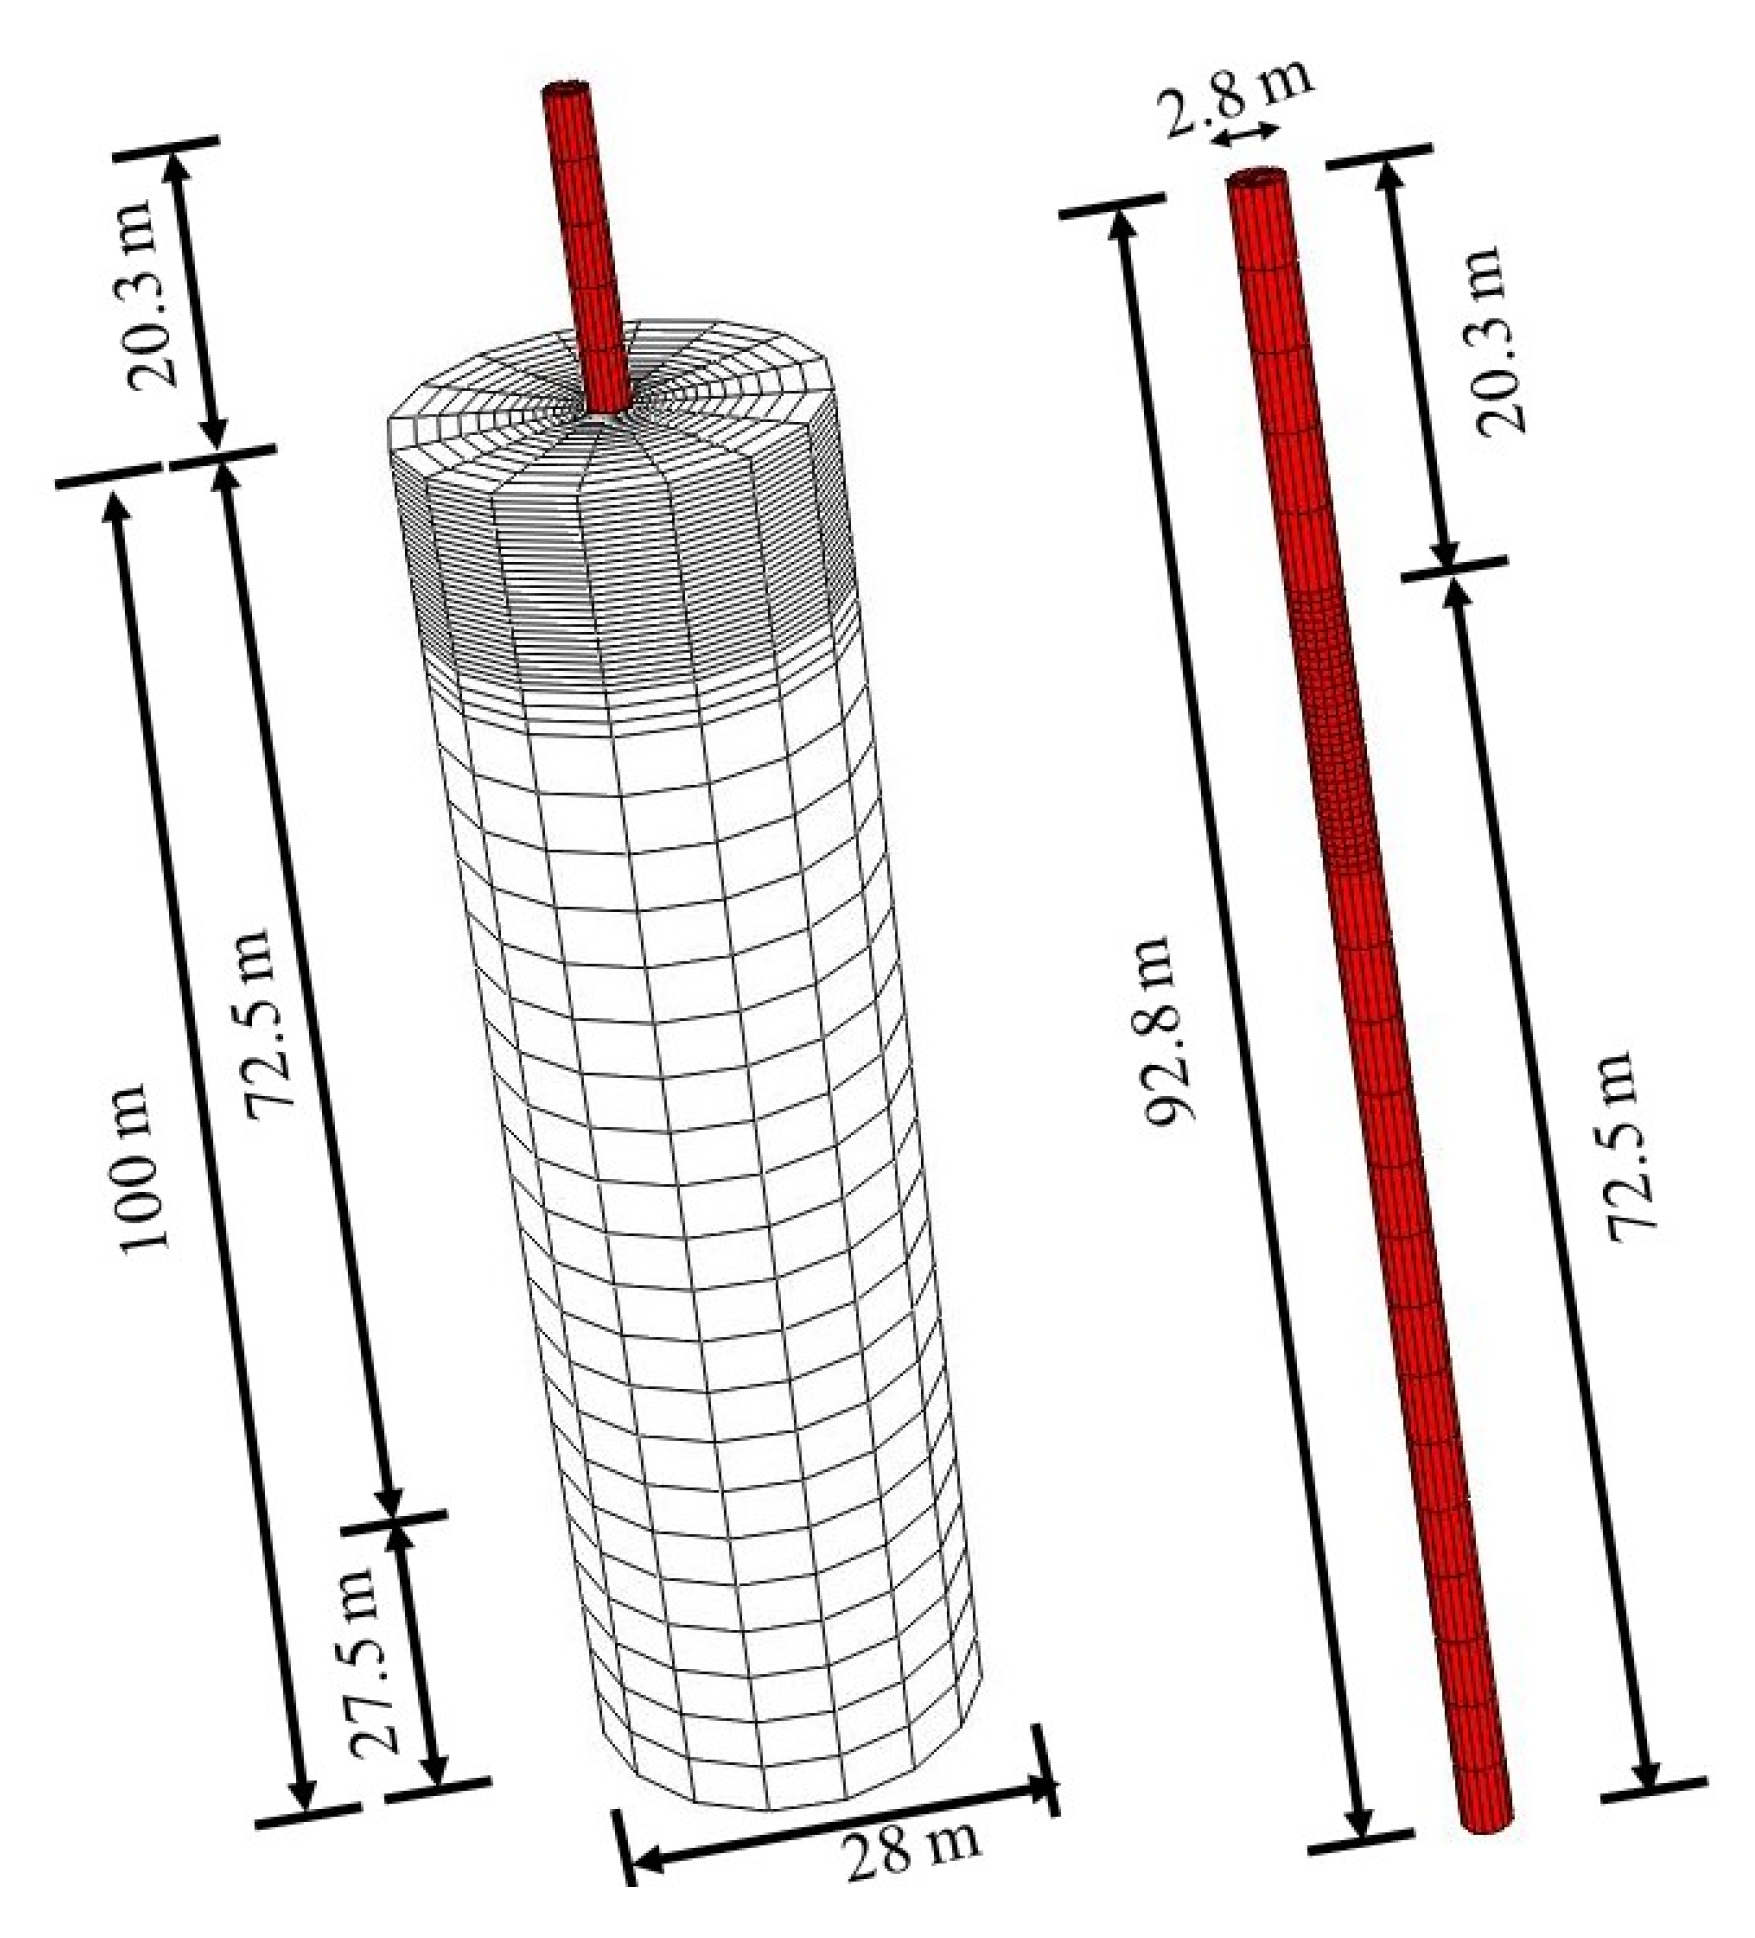
3.2. The Solid Finite Element Method
4. Result Analysis and Discussion
5. Conclusions
- (1)
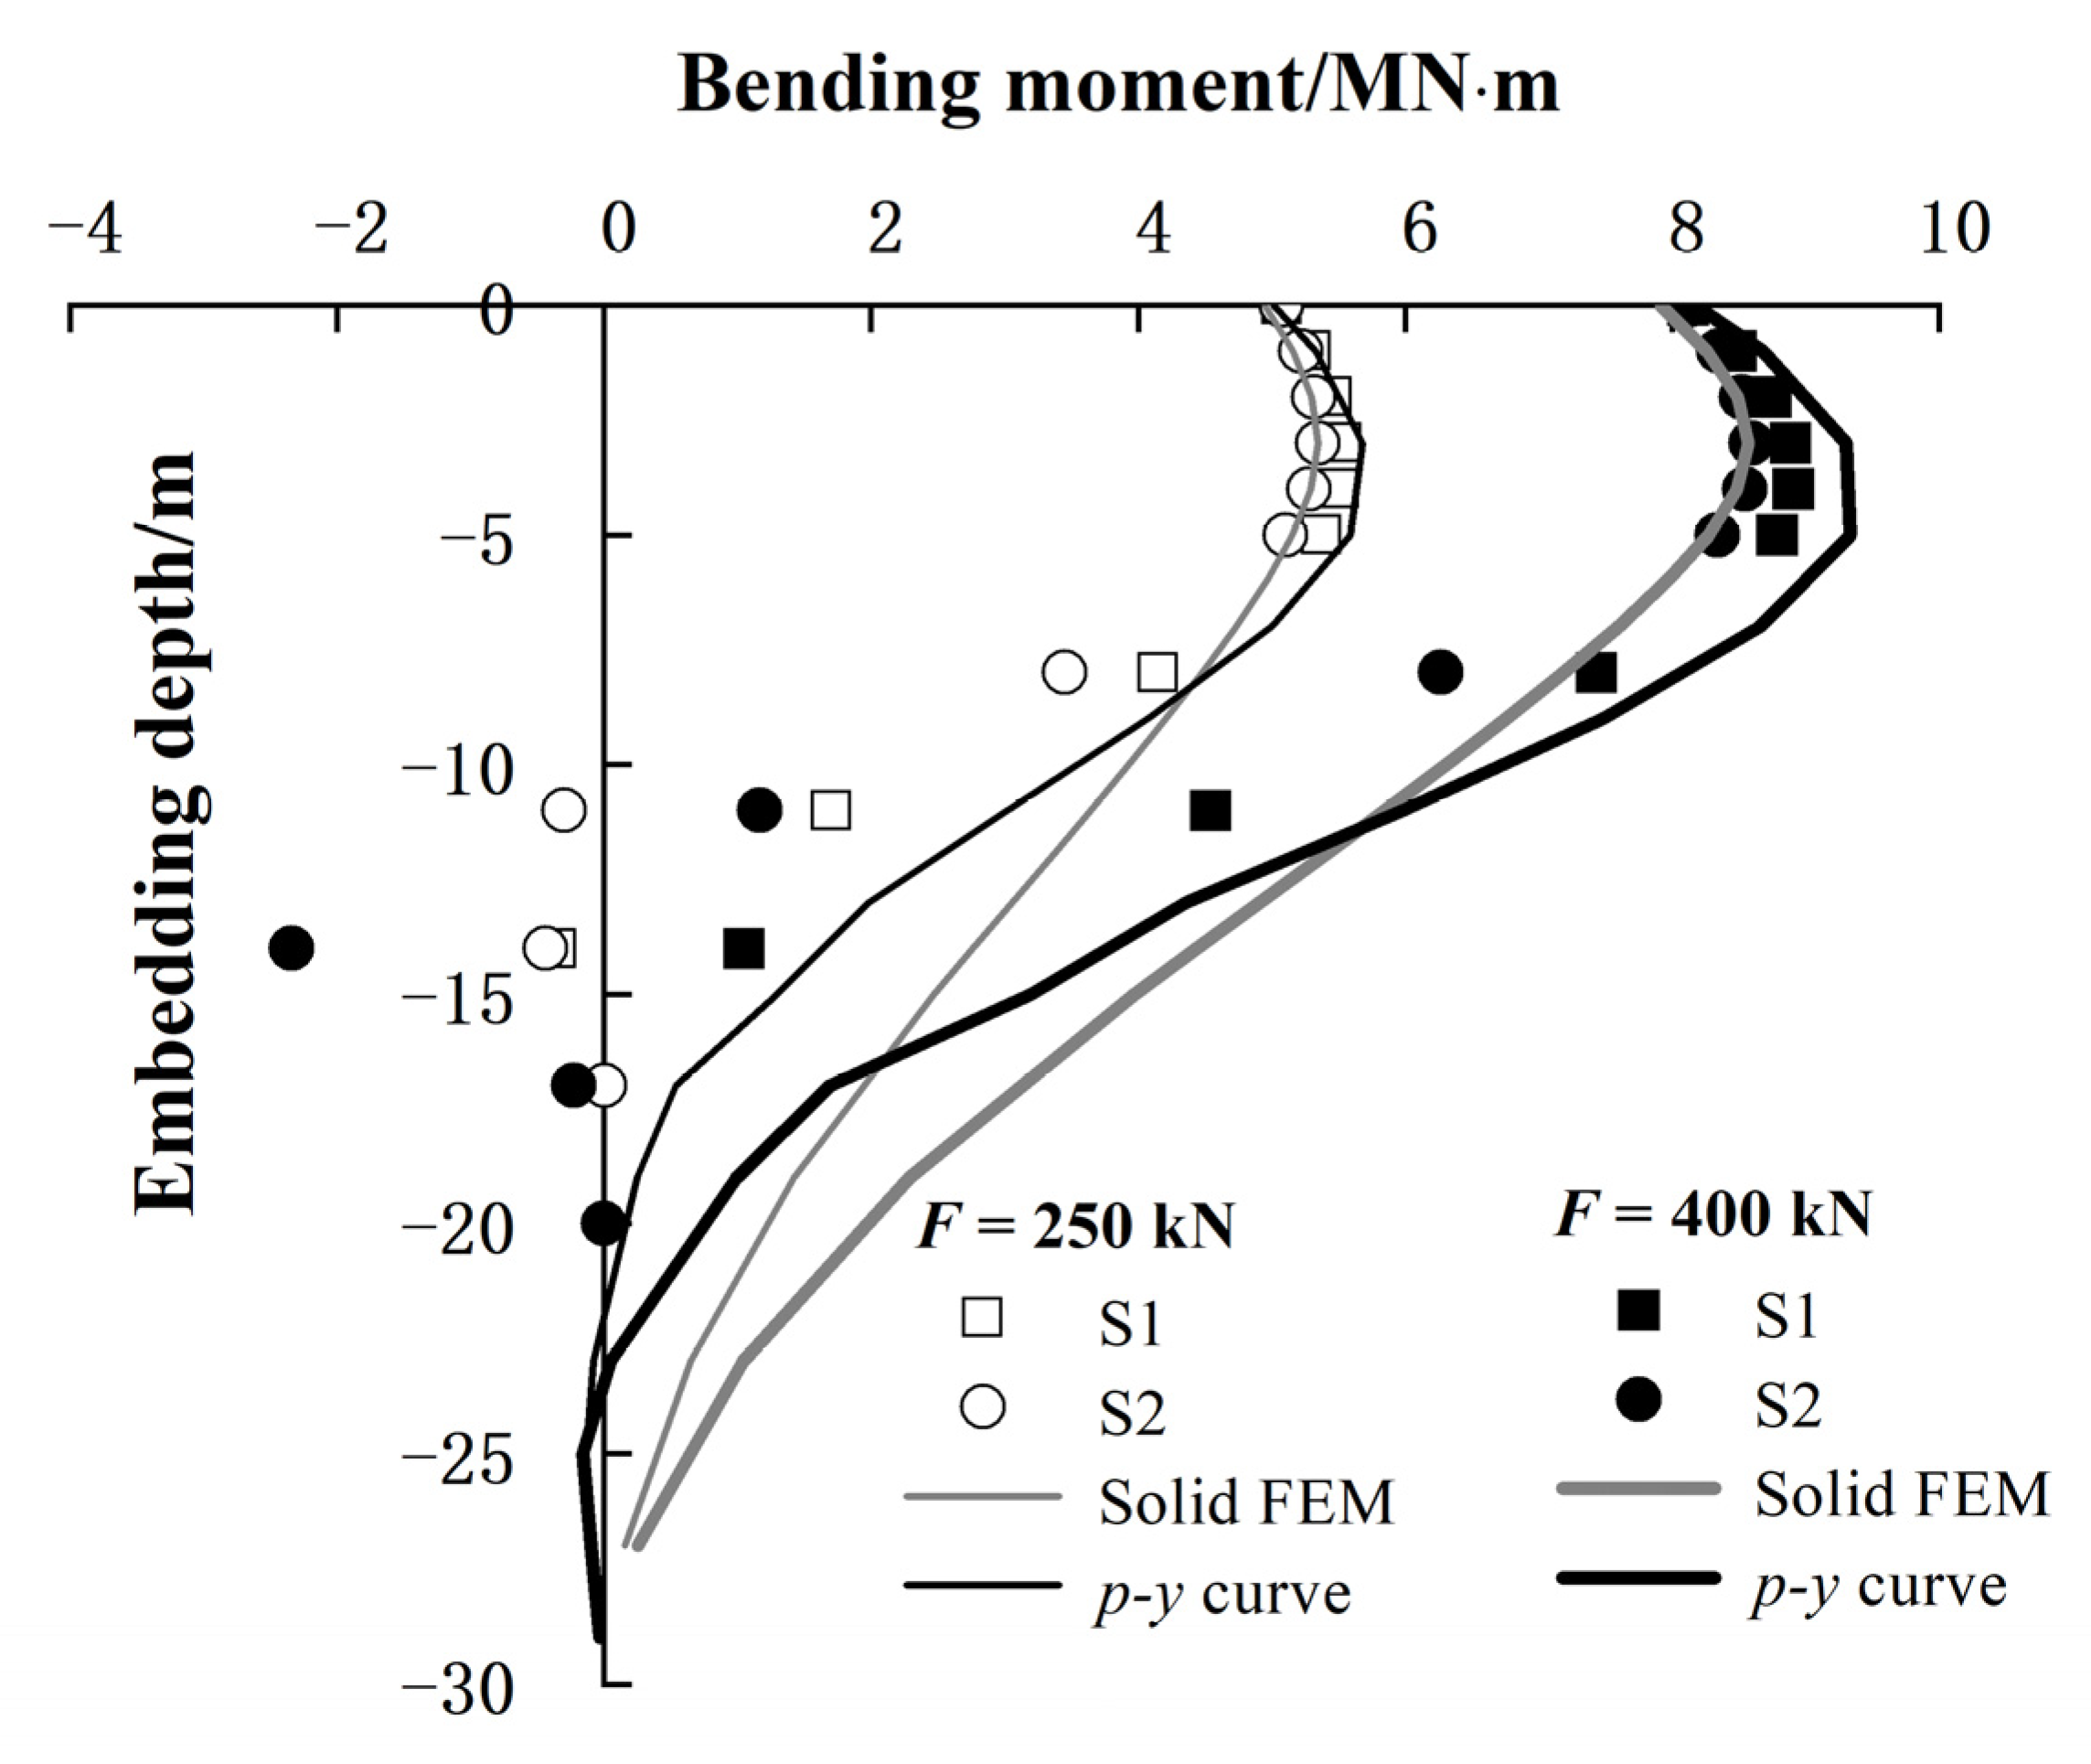
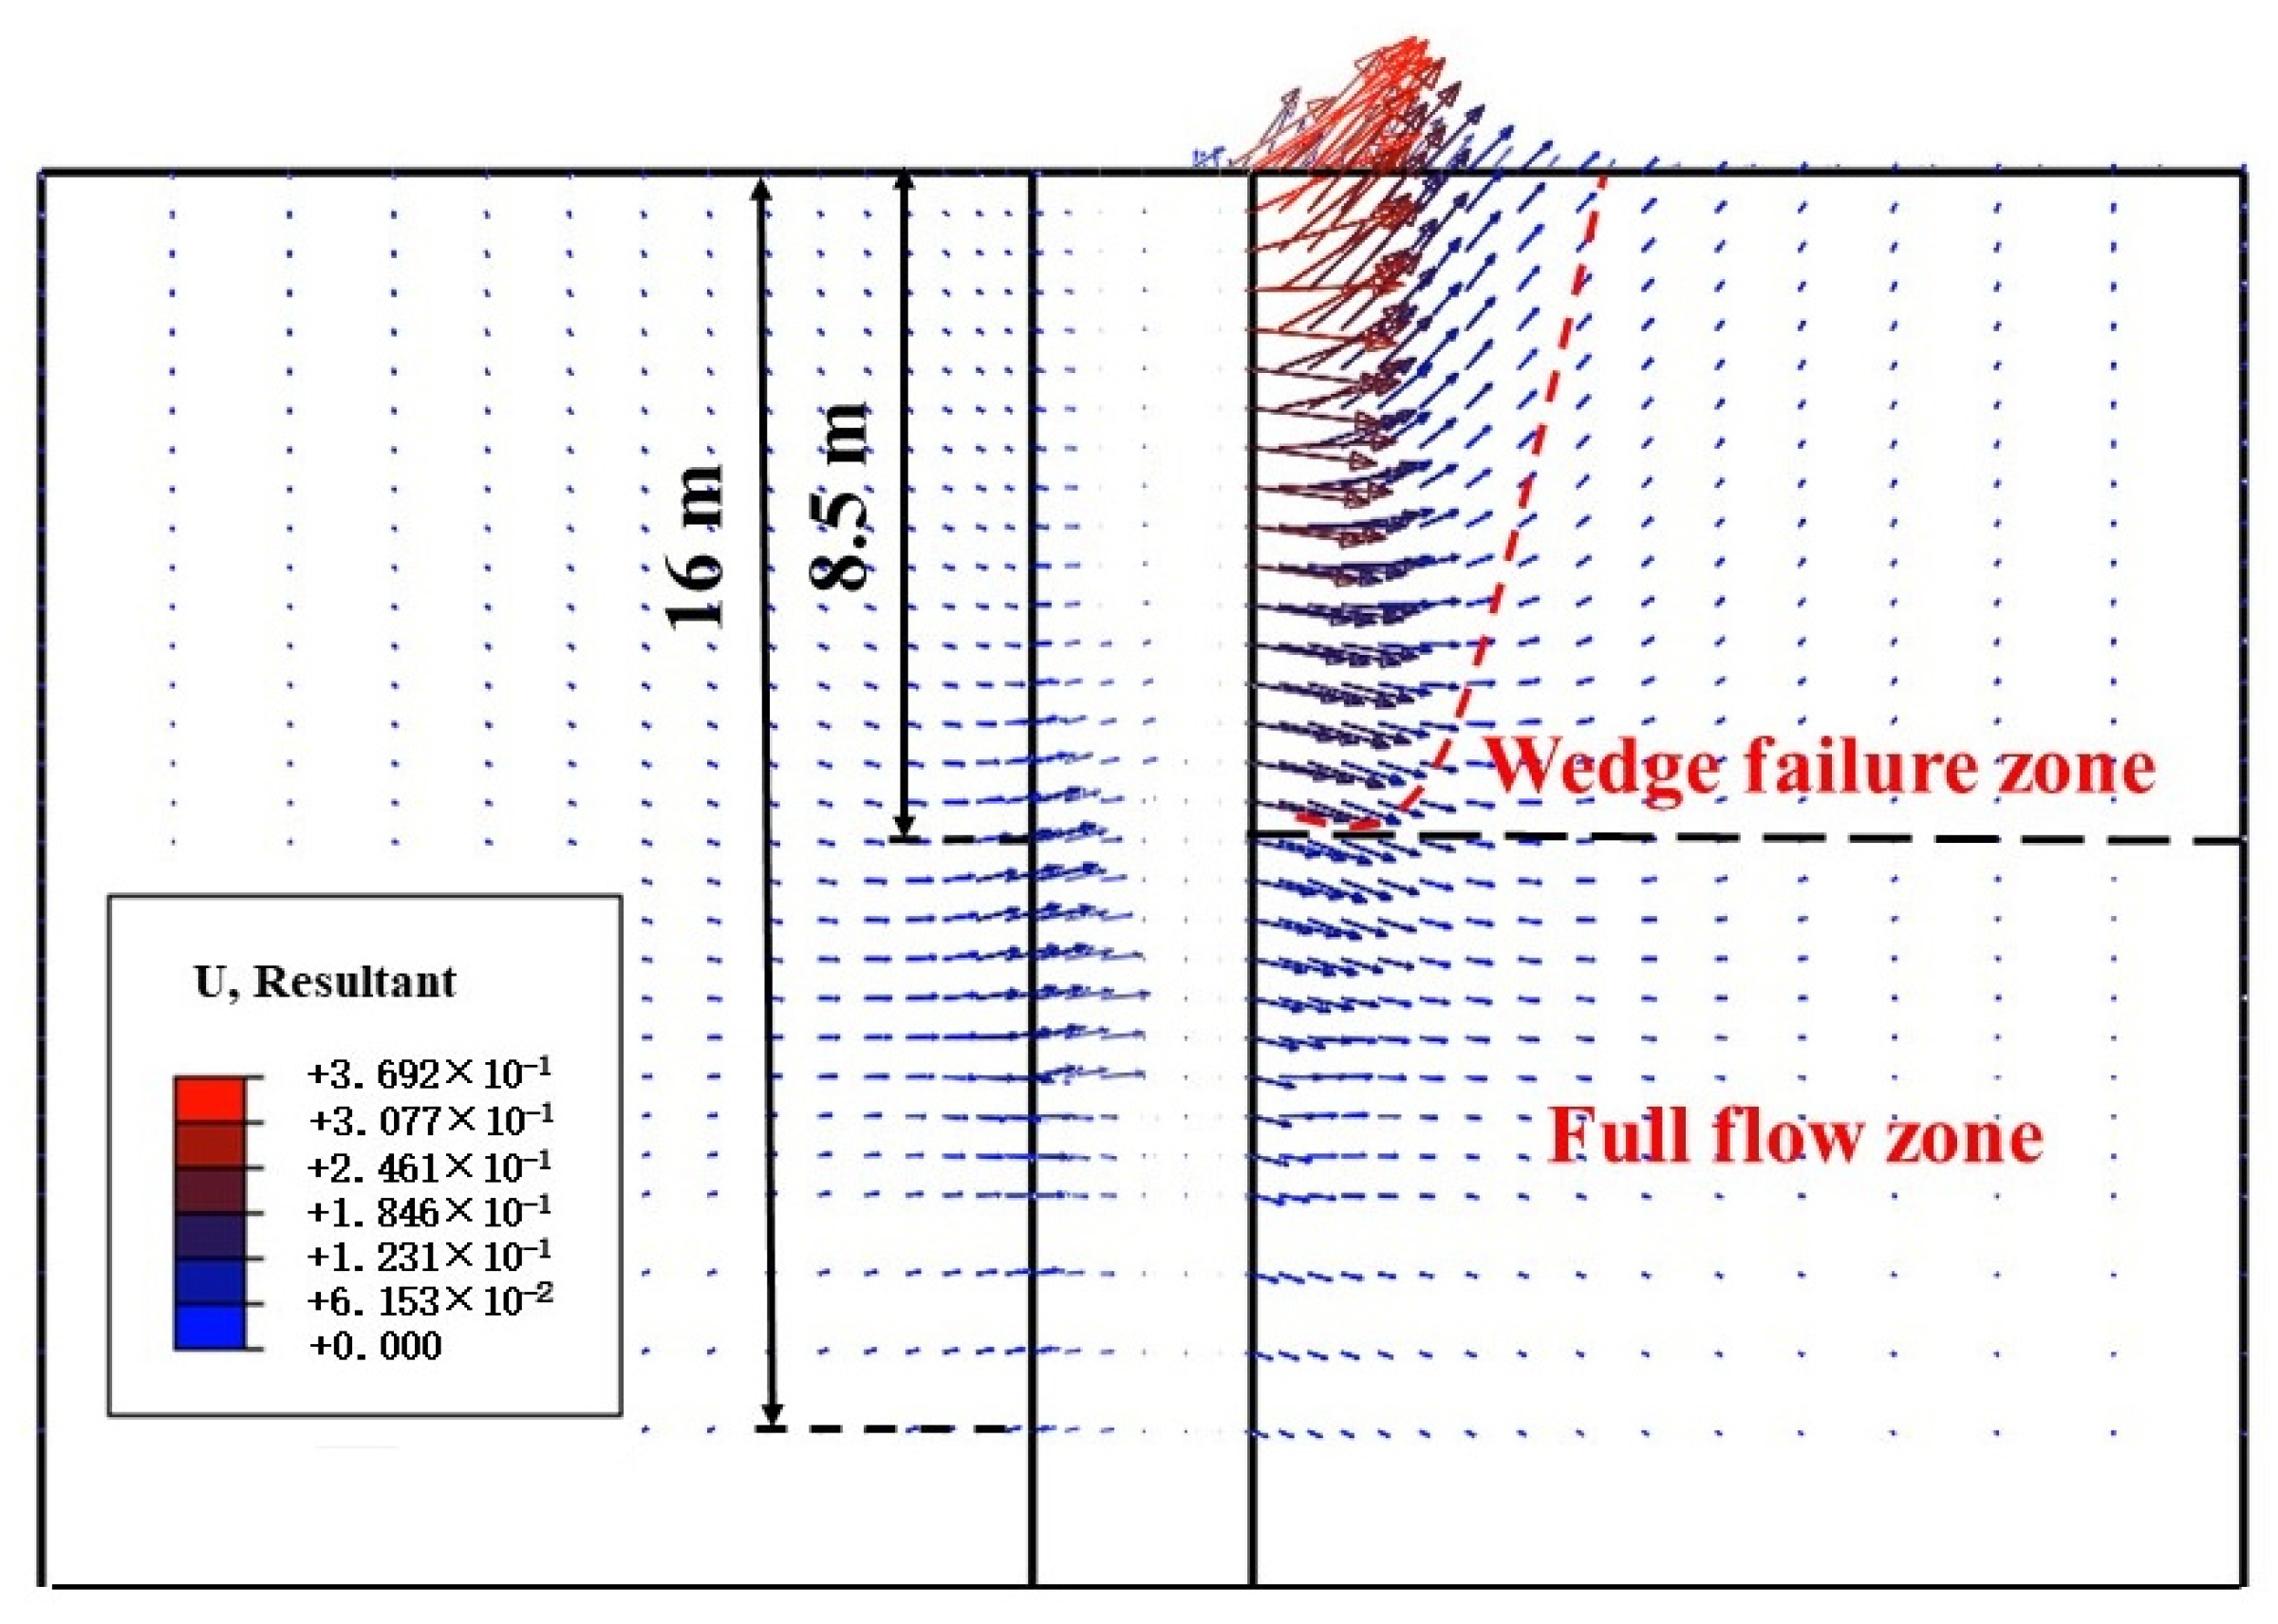
- The testing pile under horizontal loads presents the typical response of a flexible pile, with the influence range of horizontal loading limited to 5.7 D below the mud surface. The loaded indicator of the testing pile shows a significant linear response with the increase in the loading, i.e., the pile head displacement, bending moment, and deformation of the pile. In addition, the maximum bending moment of the pile gradually moves down with the increase in horizontal loading and tends to be a stable value up to 1.1 D below the mud surface.
- (2)
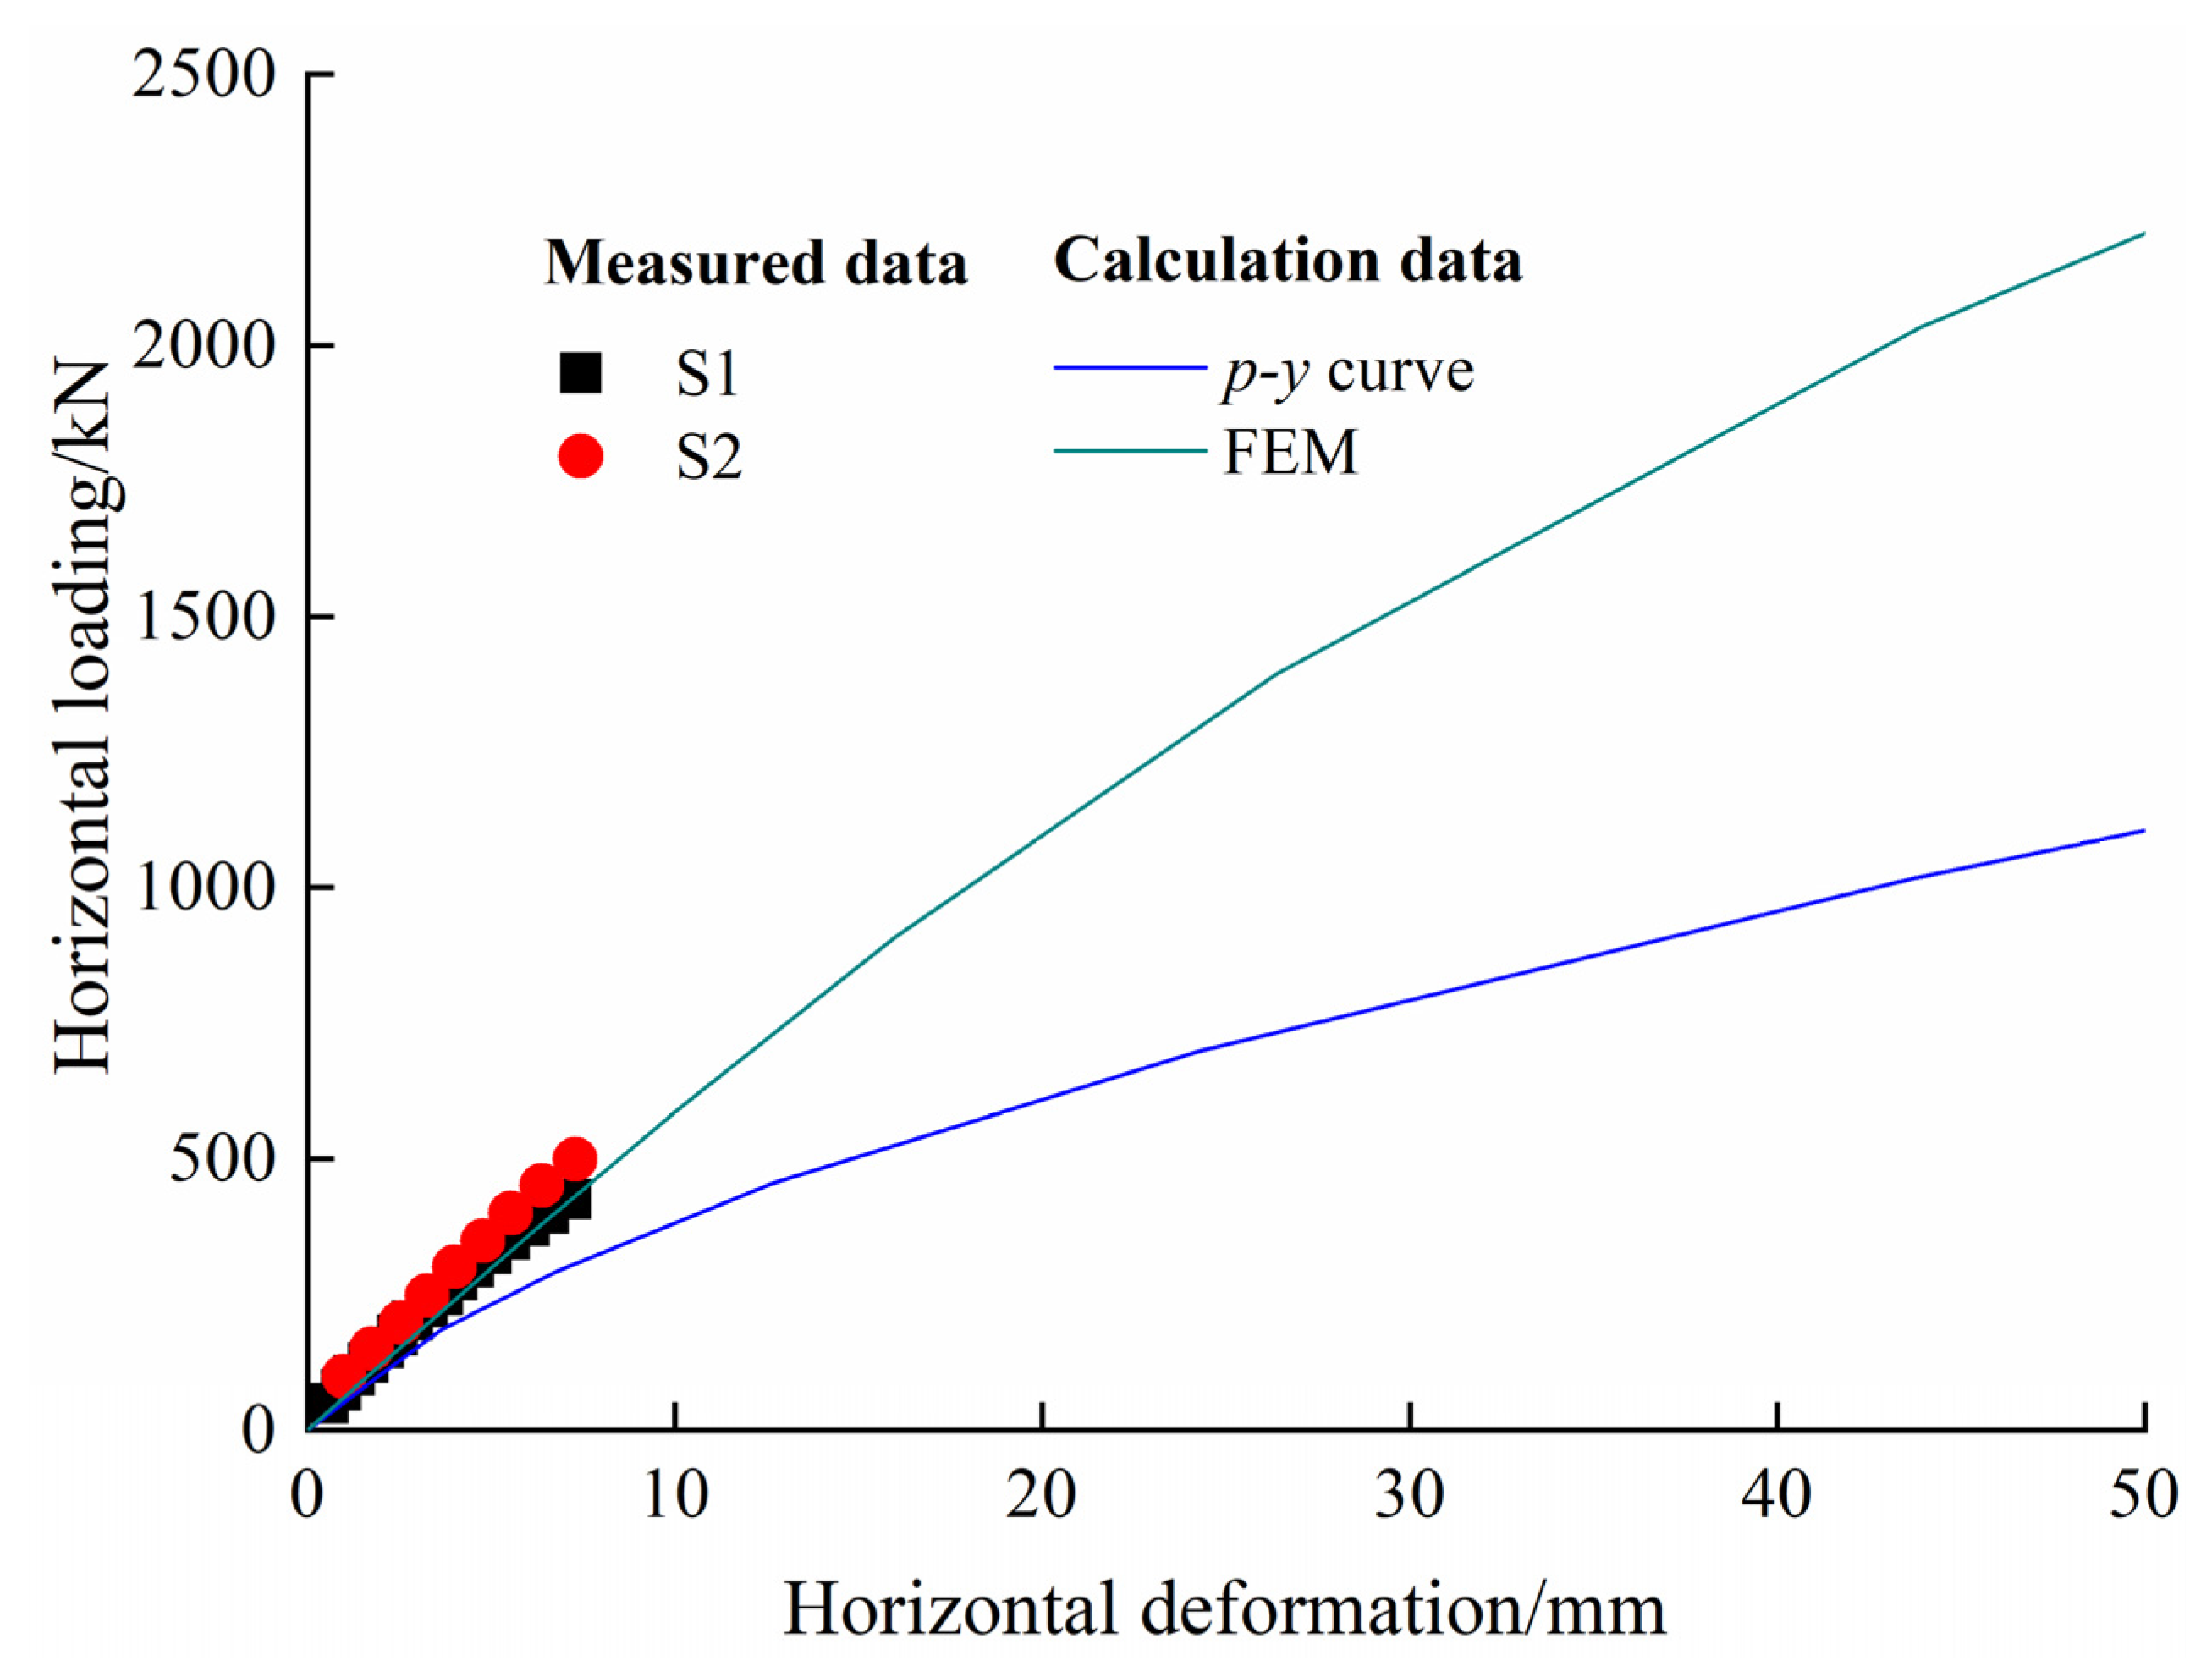
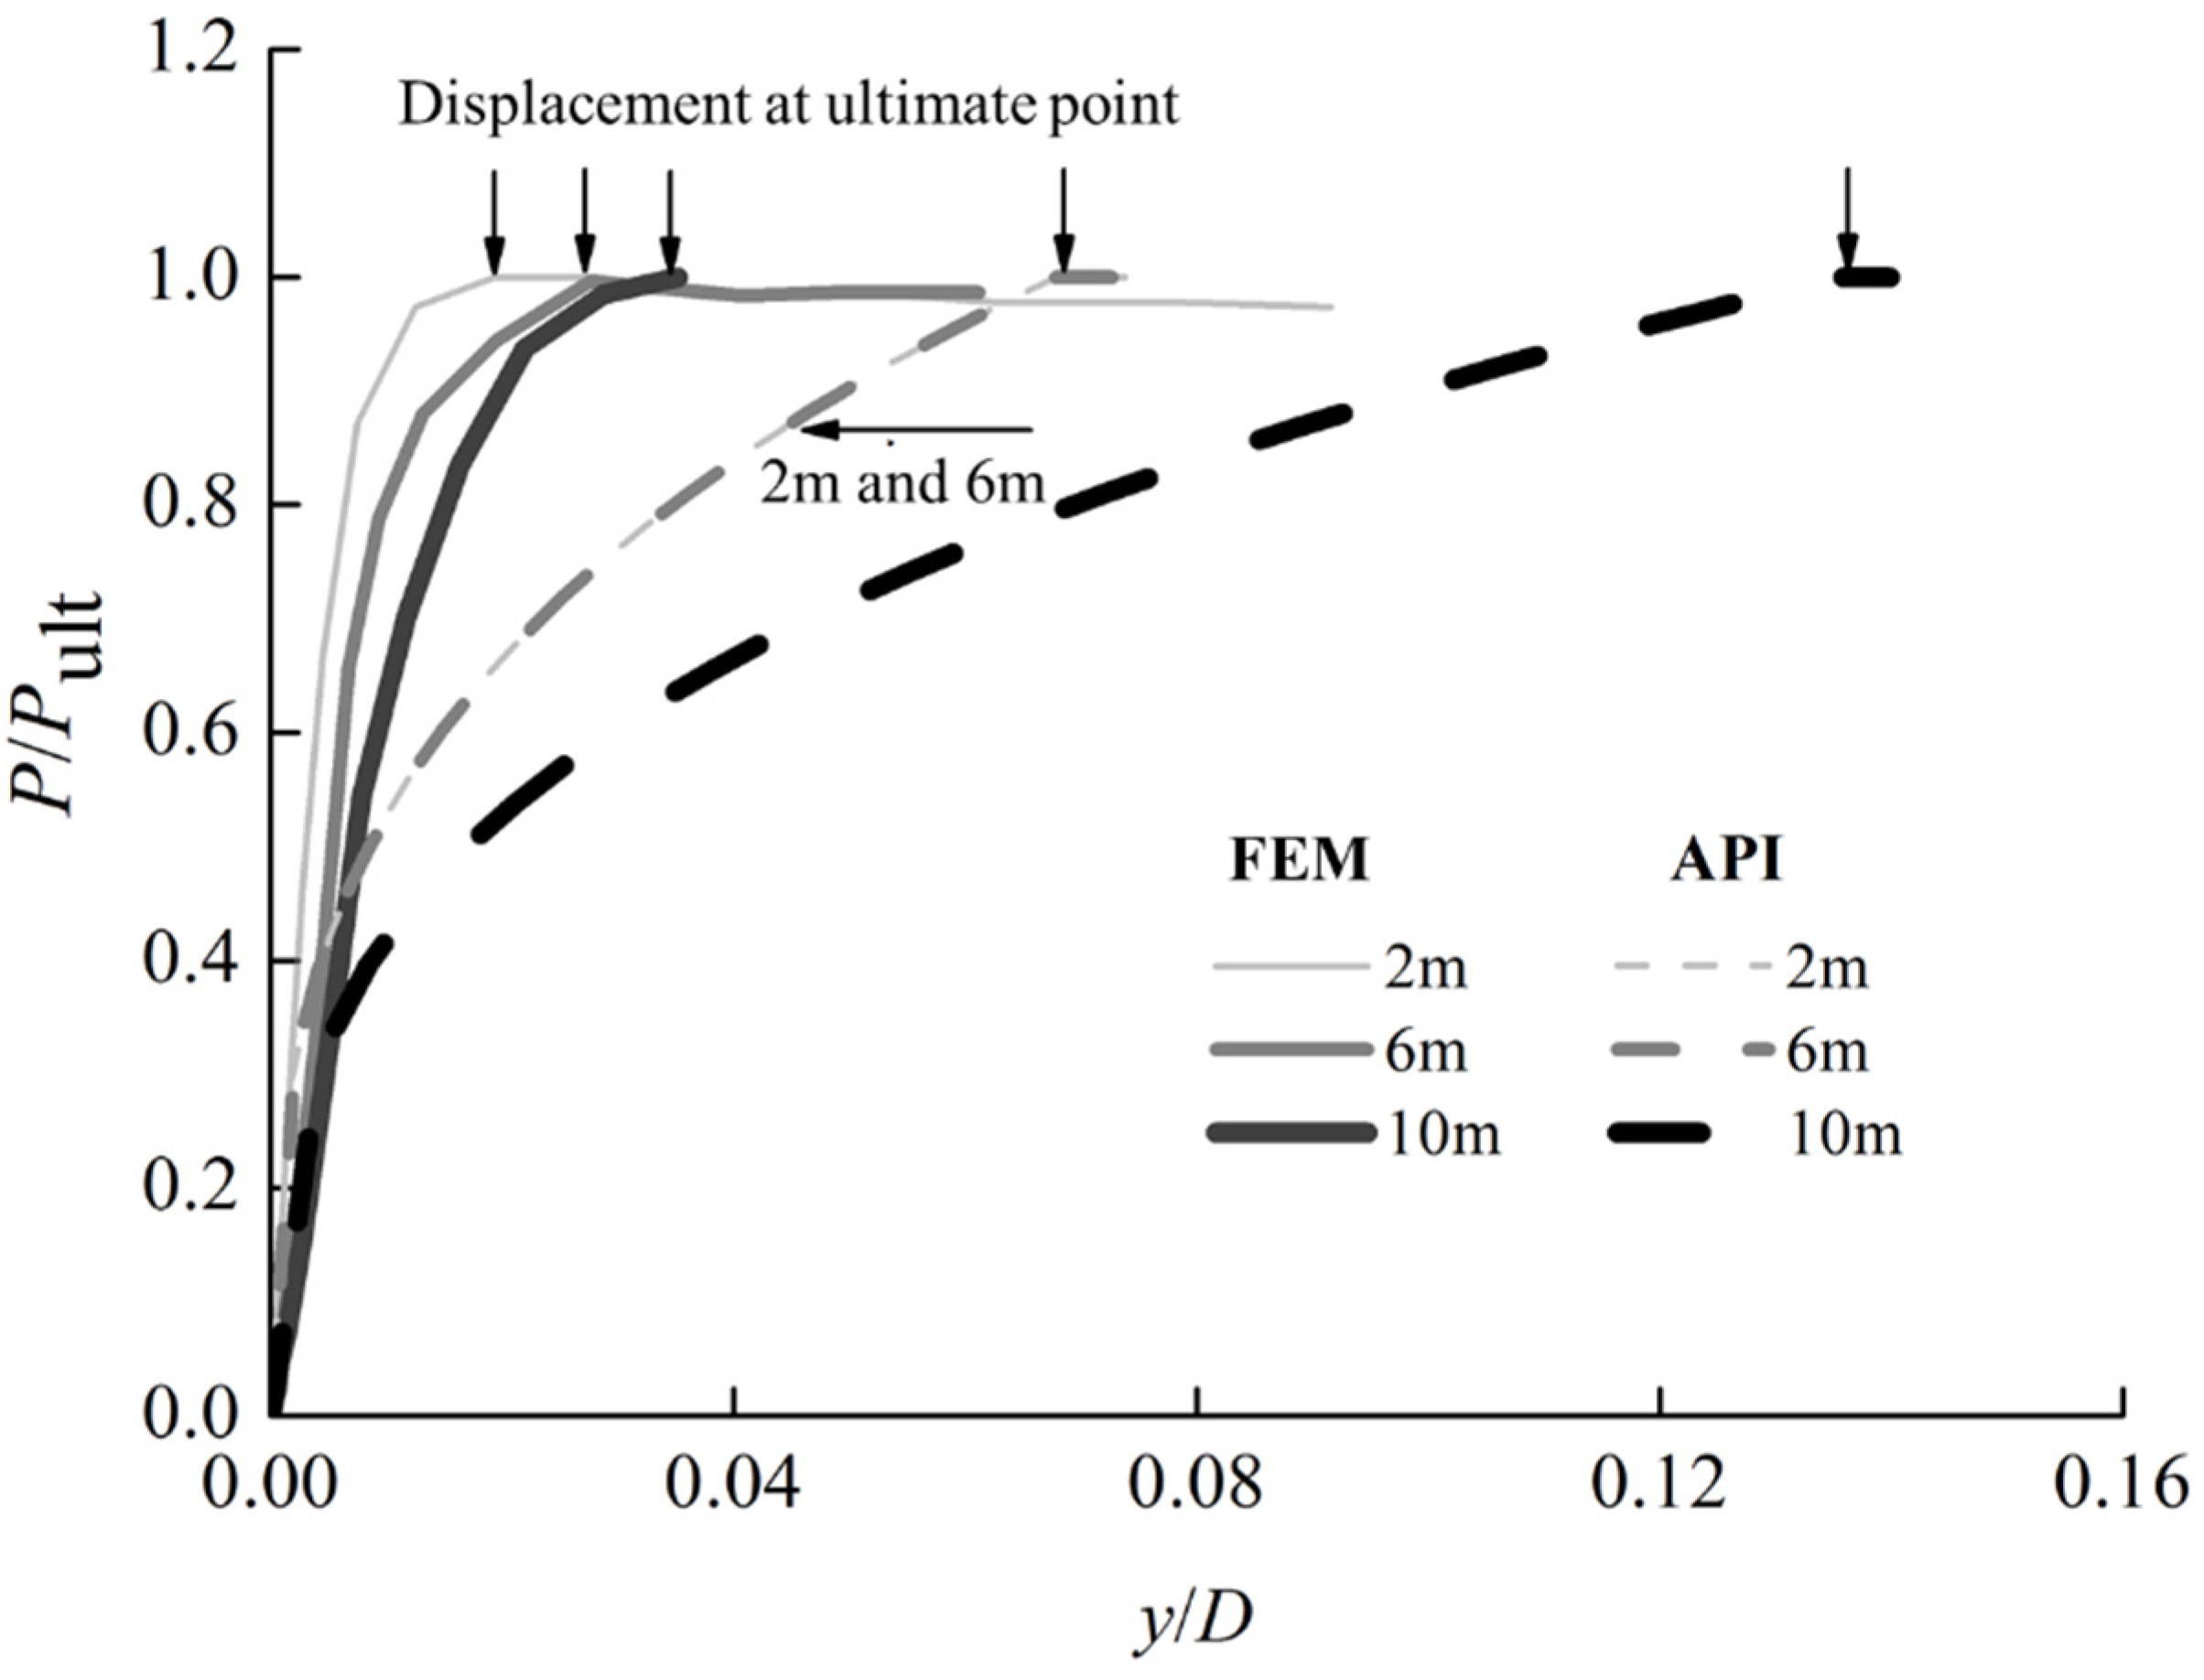
- There are differences in design results for monopile foundations obtained by the p-y curve and the solid finite element method. The p-y curve recommended by the API specification tends to be flexible on the whole, resulting in a conservative calculation result. Under the condition of small displacement, the calculation result by the solid finite element method is close to the measured result, however, there is a risk of overestimating the ultimate bearing capacity under the condition of large displacement.
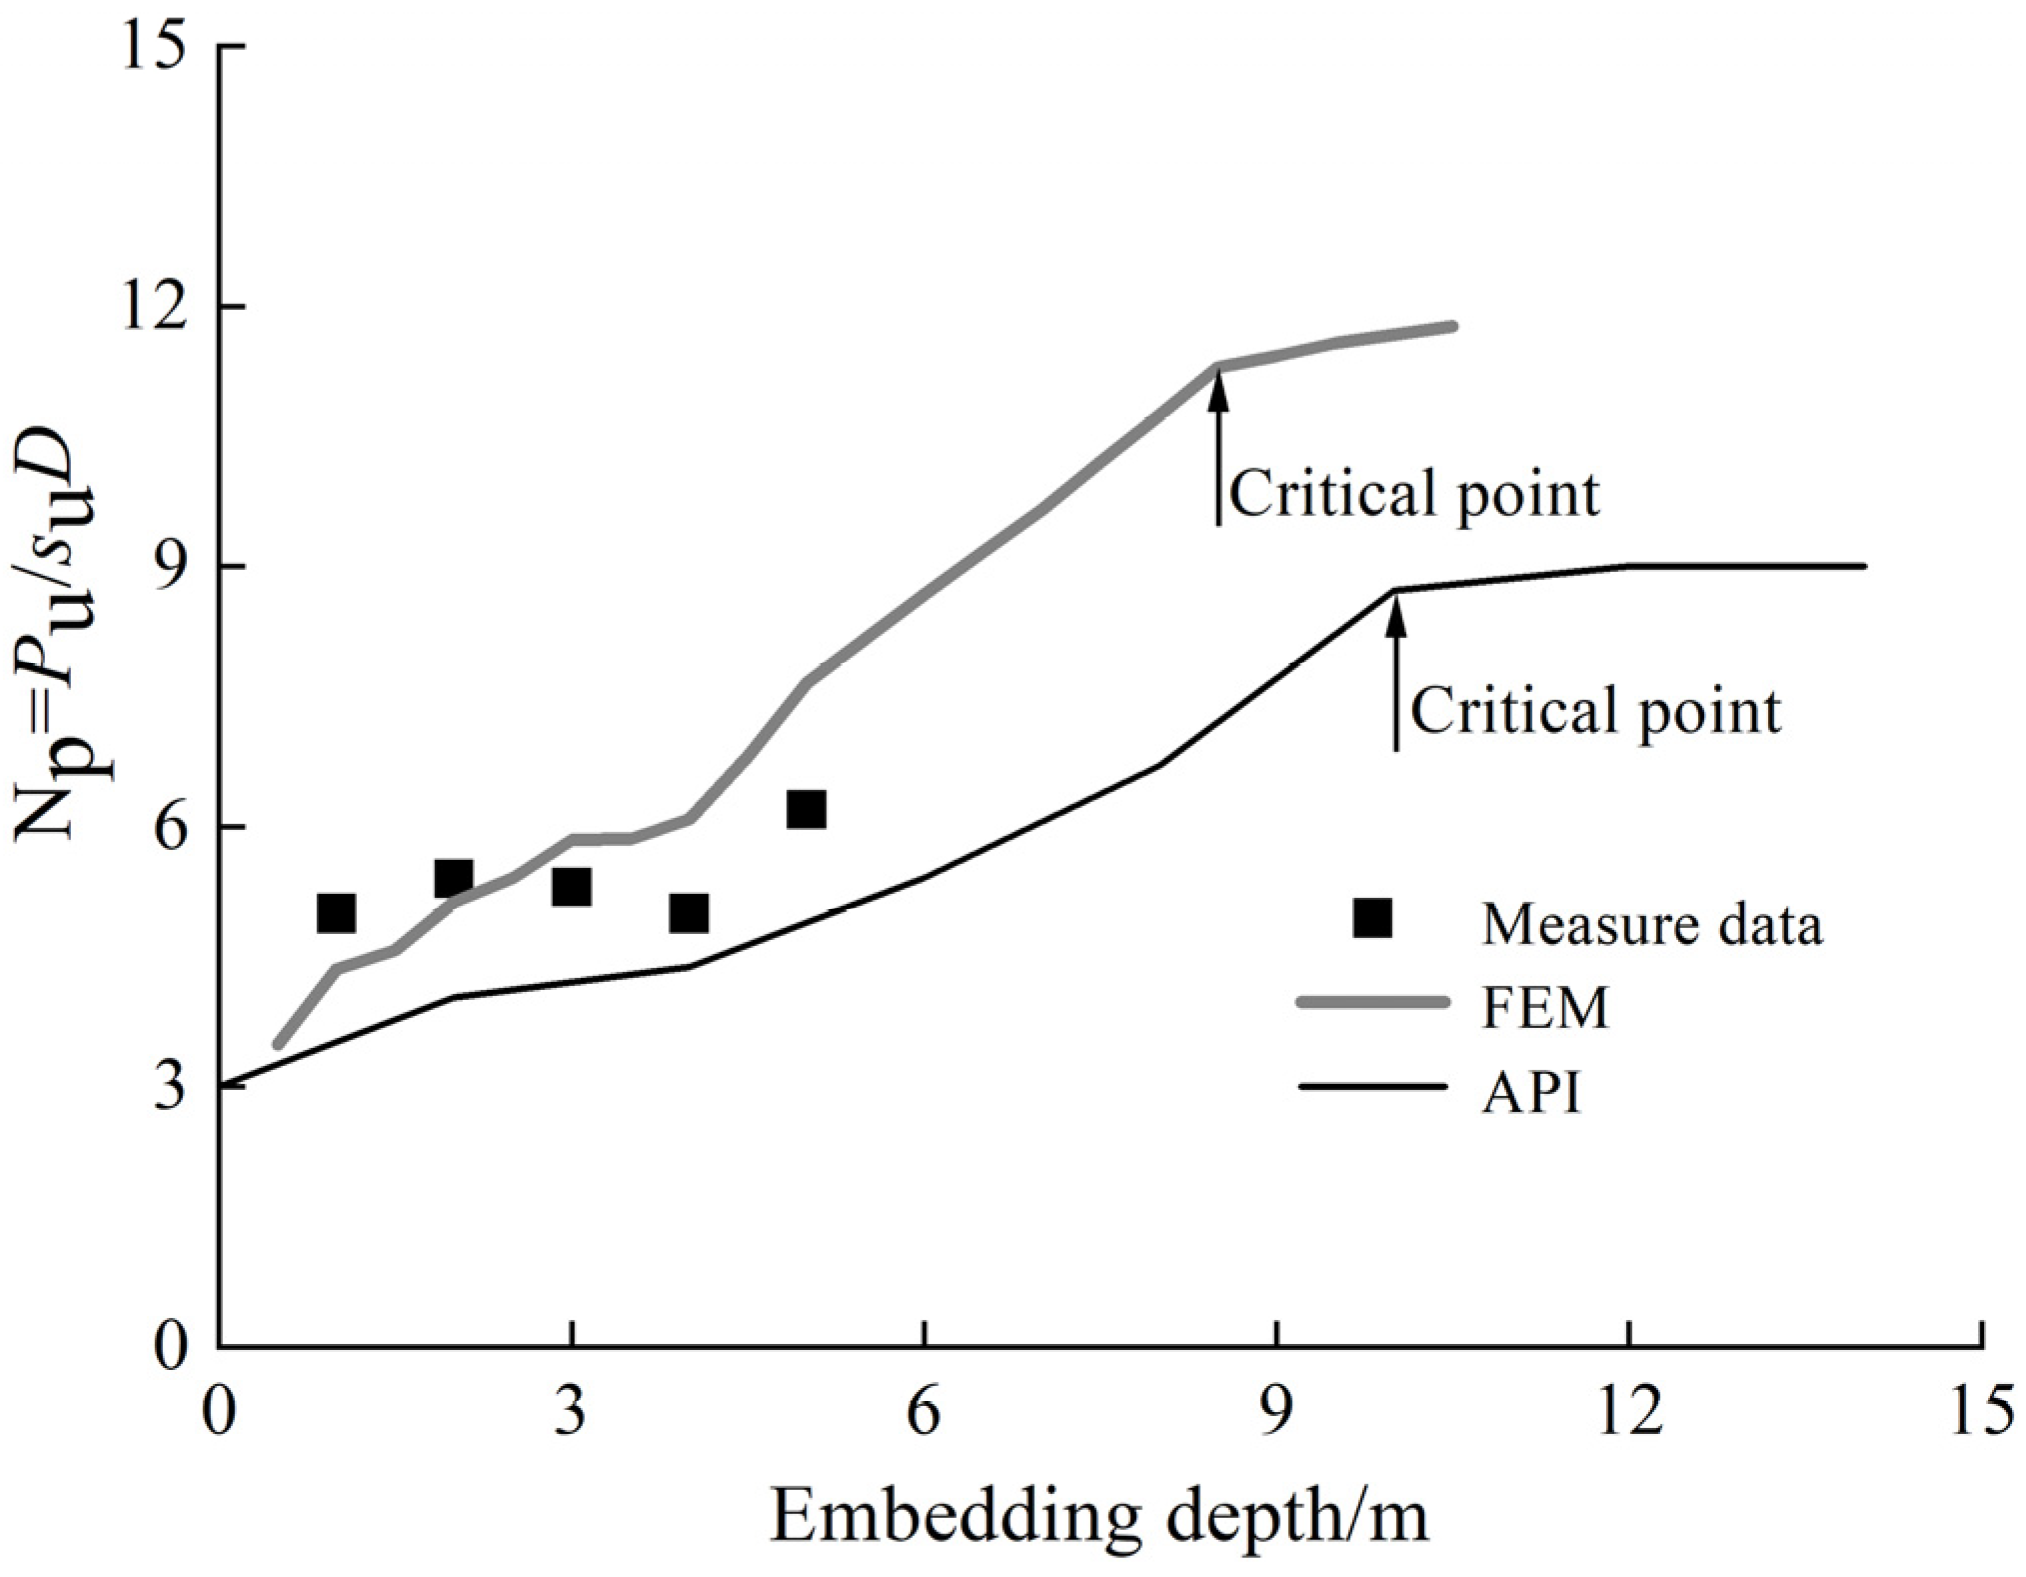
- (3)
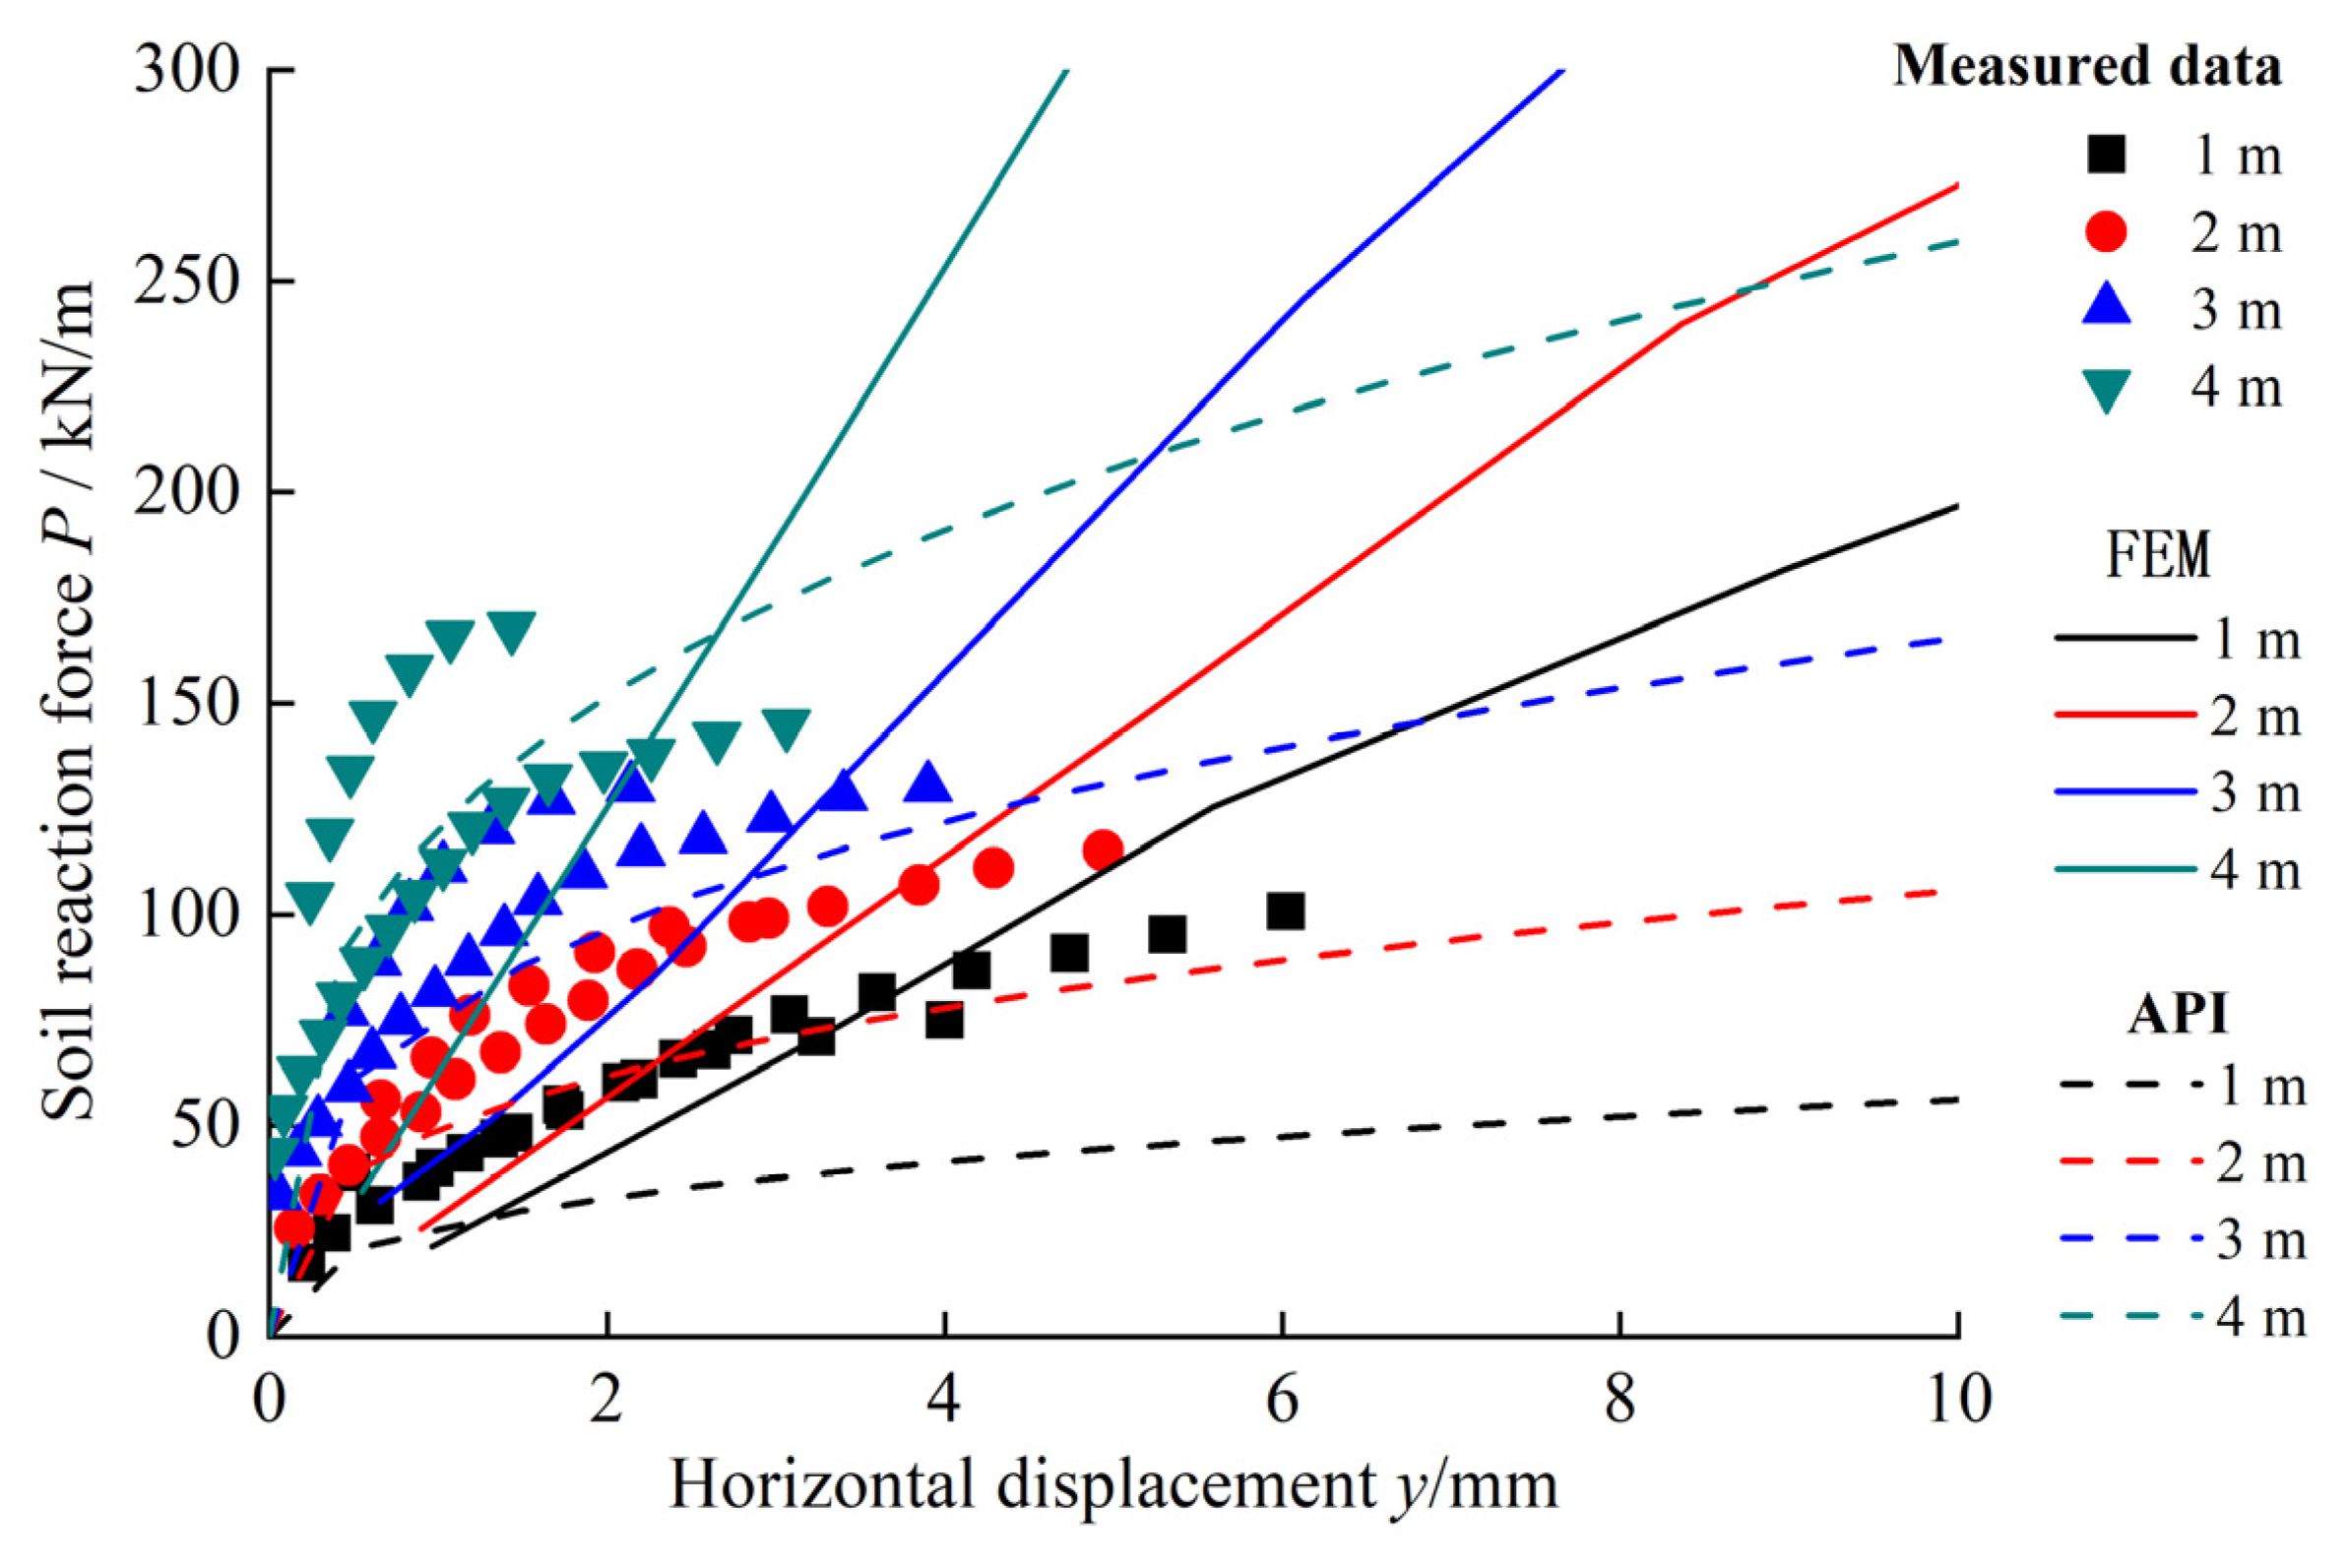
- The reason for the significant difference between the p-y curve method recommended by the API specification and the solid finite element method is that the stiffness of the p-y curve method recommended by the API specification is significantly lower than that of the finite element method, and its displacement corresponding to the ultimate soil reaction (over 0.65 D) is much larger than that of the solid finite element method (about 0.03 D). Moreover, the stable value of the ultimate reaction () calculated by the solid finite element method is close to 12, which is significantly higher than the recommended value of 9 in the API specification.
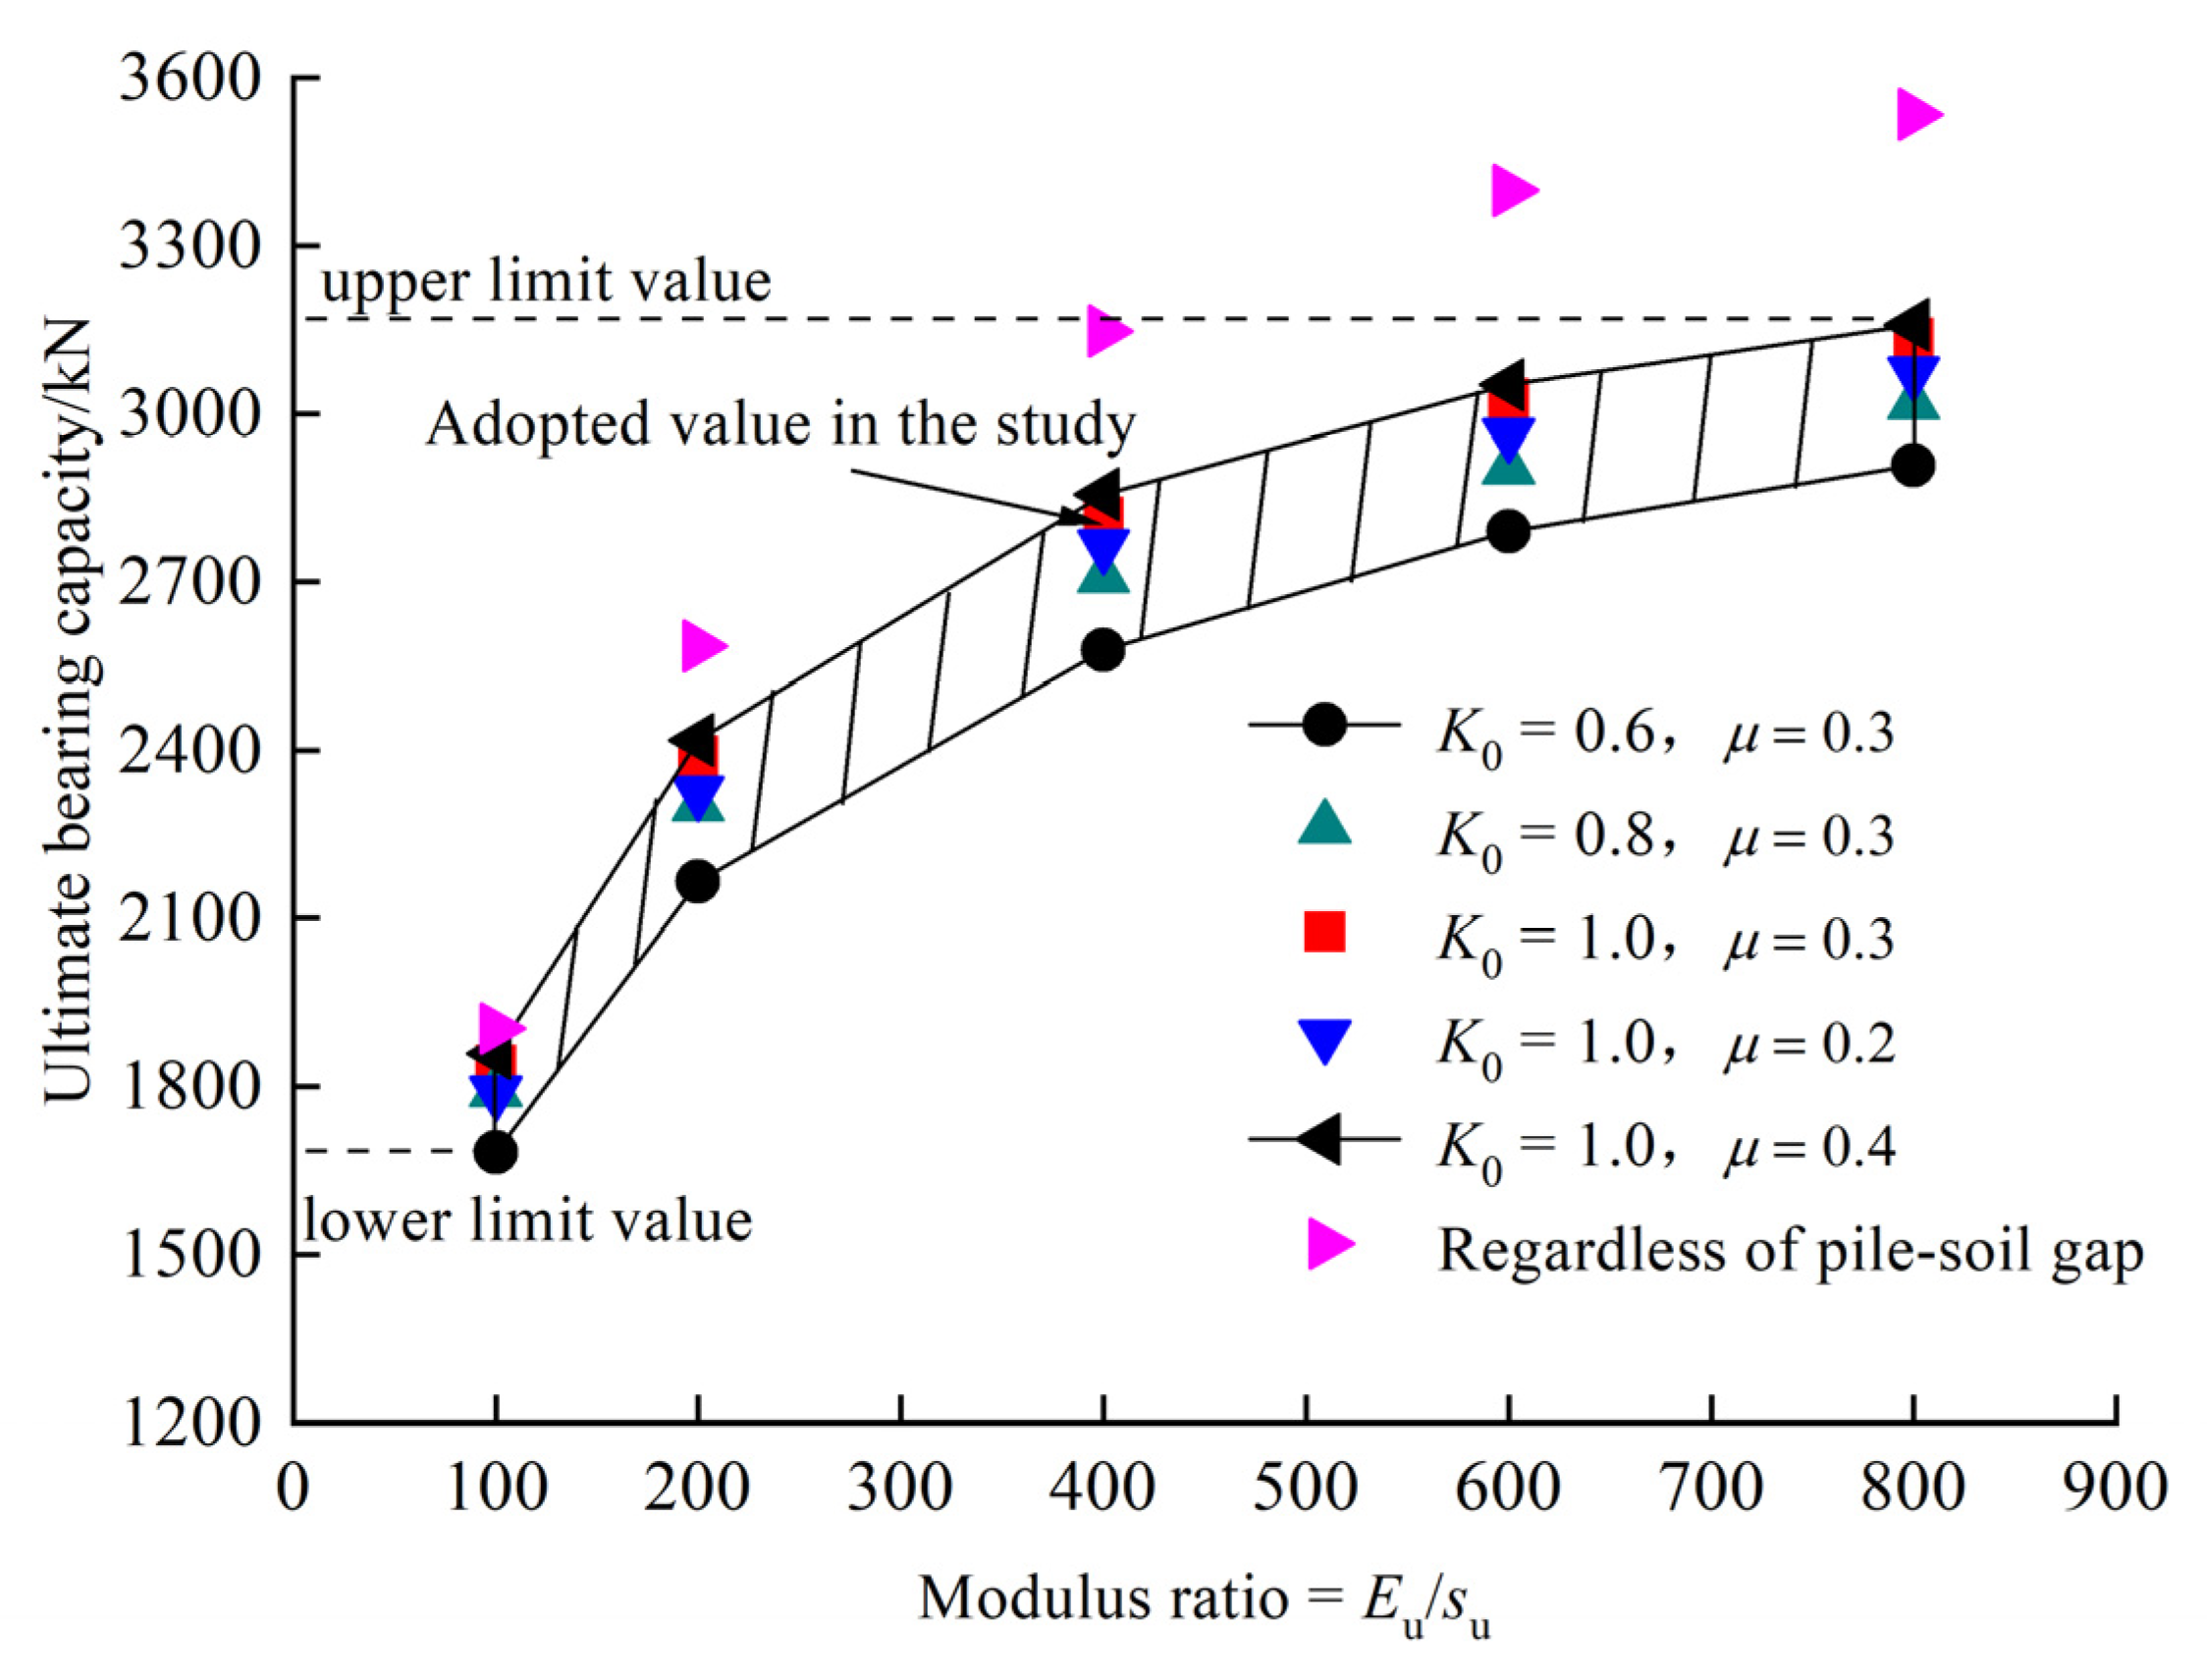
- (4)
- The design result obtained by the solid finite element method depends heavily on the values of relevant parameters. For an offshore wind farm dominated by clay soil, the upper and lower values of the ultimate bearing capacity of the pile differ by 1.7 times if different modulus ratios are selected. Under the condition that there is no reliable basis, it is suggested that the relatively conservative results obtained by parameter analysis should be used as the design reference in a reasonable range. Without a reliable basis and data, sensitivity and parameter analysis within a reasonable range is suggested to be conducted to select relatively conservative calculation results as the design basis.
- (5)
- The influence of the pile–soil gap must be considered with the solid FEM adopted in the design of the monopile foundation, and bonding between pile and soil can significantly overestimate the stiffness and bearing capacity of the pile, resulting in unsafe design results.
Author Contributions
Funding
Institutional Review Board Statement
Informed Consent Statement
Data Availability Statement
Conflicts of Interest
References
- Wang, X.; Zeng, X.; Li, X.; Li, J. Investigation on offshore wind turbine with an innovative hybrid monopile foundation: An experimental based study. Renew. Energy 2019, 132, 129–141. [Google Scholar] [CrossRef]
- Gupta, B.K.; Basu, D. Offshore wind turbine monopile foundations: Design perspectives. Ocean Eng. 2020, 213, 107514. [Google Scholar] [CrossRef]
- Arany, L.; Bhattacharya, S.; Macdonald, J.; Hogan, S.J. Design of monopiles for offshore wind turbines in 10 steps. Soil Dyn. Earthq. Eng. 2017, 92, 126–152. [Google Scholar] [CrossRef]
- Hu, R.; Lu, Y.; Leng, H.; Liu, H.; Shi, W. A novel countermeasure for preventing scour around monopile foundations using Ionic Soil Stabilizer solidified slurry. Appl. Ocean Res. 2022, 121, 103121. [Google Scholar] [CrossRef]
- Zheng, H.; Du, W.; Li, Y. Development status of offshore wind power at home and abroad. Hydropower New Energy 2018, 32, 75–77. [Google Scholar]
- Zhang, C.; Li, X.; Ma, C.; Li, M. Study on economical efficiency of ocean energy generation in China. IOP Conf. Ser. Earth Environ. Sci. 2023, 1171, 012003. [Google Scholar] [CrossRef]
- Aminoroayaie, Y.O.; Mousavi, S.H.; Kavianpour, M.R.; Movahedi, A. Numerical modeling of sediment scouring phenomenon around the offshore wind turbine pile in marine environment. Environ. Earth Sci. 2018, 77, 776. [Google Scholar] [CrossRef]
- Dai, S.; Han, B.; Wang, B.; Luo, J.; He, B. Influence of soil scour on lateral behavior of large diameter offshore wind turbine monopile and corresponding scour monitoring method. Ocean Eng. 2021, 239, 109809. [Google Scholar] [CrossRef]
- Cuéllar, V.P. Pile Foundations for Offshore Wind Turbines: Numerical and Experimental Investigations on the Behaviour under Short-Term and Long-Term Cyclic Loading; Technische Universitaet Berlin: Berlin, Germany, 2011; Volume 257. [Google Scholar]
- Alrwashdeh, S.; Al-Saraireh, F.; Alrwashdeh, S.S.; Alsaraireh, F.M. Wind energy production assessment at different sites in Jordan using probability distribution functions. Artic. ARPN J. Eng. Appl. Sci. 2018, 13, 8163–8172. [Google Scholar]
- Alrwashdeh, S.S. Investigation of Wind Energy Production at Different Sites in Jordan Using the Site Effectiveness Method. Energy Eng. J. Assoc. Energy Eng. 2019, 116, 47–59. [Google Scholar] [CrossRef]
- Lau, B.H. Cyclic Behaviour of Monopile Foundations for Offshore Wind Turbines in Clay; University of Cambridge: Cambridge, UK, 2015. [Google Scholar]
- He, B.; Wang, L.; Hong, Y. Field testing of one-way and two-way cyclic lateral responses of single and jet-grouting reinforced piles in soft clay. Acta Geotech. 2017, 12, 1021–1103. [Google Scholar] [CrossRef]
- Matlock, H. Correlations for design of laterally loaded piles in soft clay. In Offshore Technology in Civil Engineering’s Hall of Fame Papers from the Early Years; ASCE: Reston, VA, USA, 1970; pp. 77–94. [Google Scholar]
- Reese, L.C.; Cox, W.R.; Koop, F.D. Analysis of laterally loaded piles in sand. In Offshore Technology in Civil Engineering Hall of Fame Papers from the Early Years; ASCE: Reston, VA, USA, 1974; pp. 95–105. [Google Scholar]
- Achmus, M.; Kuo, Y.S.; Abdel-Rahman, K. Behavior of monopile foundations under cyclic lateral load. Comput. Geotech. 2009, 36, 725–735. [Google Scholar] [CrossRef]
- Cheng, X.; Wang, T.; Zhang, J.; Liu, Z.; Cheng, W. Finite element analysis of cyclic lateral responses for large diameter monopiles in clays under different loading patterns. Comput. Geotech. 2021, 134, 104104. [Google Scholar] [CrossRef]
- Kato, B.; Bhattacharya, S.; Wang, Y. Evaluation of post-storm soil stiffness degradation effects on the performance of monopile-supported offshore wind turbines in clay. Ocean Eng. 2023, 282, 114338. [Google Scholar] [CrossRef]
- American Petraleum Institute. Recommended practice for planning, designing and constructing fixed offshore platforms. In API Recommended Practice 2A-WSD (RP2A-WSD), 21st ed.; API: Washington, DC, USA, 2014. [Google Scholar]
- Veritas, D.D.N. DNV-OS-J101 Offshore Standard. Design of Offshore Wind Turbine Structures. 2010. Available online: https://pdfcoffee.com/dnv-os-j101-design-of-offshore-wind-turbine-structurepdf-pdf-free.html (accessed on 10 November 2023).
- CCCC Third Harbor Consultants Co., Ltd. Code for Pile Foundation of Harbor Engineering (JTS167-4-2012); China Communications Press: Beijing, China, 2012. [Google Scholar]
- Mu, L.; Kang, X.; Li, W. Analytical method for single pile under V-H-M combined loads in sand. Chin. J. Geotech. Eng. 2017, 39, 153–156. (In Chinese) [Google Scholar]
- Lu, W.; Zhang, G. New p-y curve model considering vertical loading for piles of offshore wind turbine in sand. Ocean Eng. 2020, 203, 107228. [Google Scholar] [CrossRef]
- Finn, W.L.; Dowling, J. Modelling effects of pile diameter. Can. Geotech. J. 2015, 53, 173–178. [Google Scholar] [CrossRef]
- Hong, Y.; He, B.; Wang, L. Cyclic lateral response and failure mechanisms of a semi-rigid pile in soft clay: Centrifuge tests and numerical modelling. Can. Geotech. J. 2017, 54, 806–824. [Google Scholar] [CrossRef]
- Lu, F. Research on the Application of Cone Penetration Test in Offshore Geotechnical Engineering; Tianjin University: Tianjin, China, 2005. [Google Scholar]
- Ministry of Housing and Urban-Rural Development of the People’s Republic of China. Technical Code for Testing of Building Foundation Piles (JGJ 106-2014); China Building Industry Press: Beijing, China, 2014. [Google Scholar]
- Reese, L.C.; Van Impe, W.F. Single Piles and Pile Groups under Lateral Loading; Balkema: Rotterdam, The Netherlands, 2001. [Google Scholar]
- Systèmes, D. Abaqus Analysis User’s Manual; Simulia Corp.: Providence, RI, USA, 2007. [Google Scholar]
- Wang, J.; Chen, Y. Application of ABAQUS in Civil Engineering; Zhejiang University Press: Hangzhou, China, 2006. [Google Scholar]
- Ou, C.; Wu, T.; Hsieh, H. Analysis of Deep Excavation with Column Type of Ground Improvement in Soft Clay. J. Geotech. Engrg. 1996, 122, 709–716. [Google Scholar] [CrossRef]
- Steven, J.B.; Audibert, J.M.E. Re-examination of py curve formulations. In Proceedings of the Offshore Technology Conference, Houston, TX, USA, 30 April–3 May 1979. [Google Scholar]
- Zhang, C.; White, D.; Randolph, M. Centrifuge Modeling of the Cyclic Lateral Response of a Rigid Pile in Soft Clay. Can. Geotech. J. 2011, 137, 717–729. [Google Scholar] [CrossRef]
- Jeanjean, P. Re-assessment of p-y curves for soft clays from centrifuge testing and finite element modeling. In Proceedings of the Offshore Technology Conference, Houston, TX, USA, 4–7 May 2009. [Google Scholar]
- Chen, Y.; Lee, Y. Evaluation of lateral interpretation criteria for drilled shaft capacity. J. Geotech. Geoenviron. Eng. 2010, 136, 1124–1136. [Google Scholar] [CrossRef]
- Poulos, H.G.; Davis, E.H. Pile Foundation Analysis and Design; Wiley: New York, NY, USA, 1980. [Google Scholar]


| Parameter | E/MPa | c/kPa | ||
|---|---|---|---|---|
| Steel pile | 210,000 | 0.3 | - | - |
| Mucky silty clay | 16.8 | 0.49 | 33.6 | 0.1 |
| Sand | 23.75 | 0.49 | 1 | 32 |
Disclaimer/Publisher’s Note: The statements, opinions and data contained in all publications are solely those of the individual author(s) and contributor(s) and not of MDPI and/or the editor(s). MDPI and/or the editor(s) disclaim responsibility for any injury to people or property resulting from any ideas, methods, instructions or products referred to in the content. |
© 2023 by the authors. Licensee MDPI, Basel, Switzerland. This article is an open access article distributed under the terms and conditions of the Creative Commons Attribution (CC BY) license (https://creativecommons.org/licenses/by/4.0/).
Share and Cite
Li, T.; Yu, X.; He, B.; Dai, S. The Lateral Behavior of Large-Diameter Monopiles for Offshore Wind Turbines Based on the p-y Curve and Solid FEM Methods. J. Mar. Sci. Eng. 2023, 11, 2354. https://doi.org/10.3390/jmse11122354
Li T, Yu X, He B, Dai S. The Lateral Behavior of Large-Diameter Monopiles for Offshore Wind Turbines Based on the p-y Curve and Solid FEM Methods. Journal of Marine Science and Engineering. 2023; 11(12):2354. https://doi.org/10.3390/jmse11122354
Chicago/Turabian StyleLi, Tao, Xinran Yu, Ben He, and Song Dai. 2023. "The Lateral Behavior of Large-Diameter Monopiles for Offshore Wind Turbines Based on the p-y Curve and Solid FEM Methods" Journal of Marine Science and Engineering 11, no. 12: 2354. https://doi.org/10.3390/jmse11122354