
Parametric Study on Mooring System Design of Submerged Floating Tunnel under Extreme Wave and Seismic Excitation


Abstract
:1. Introduction
2. Numerical Model
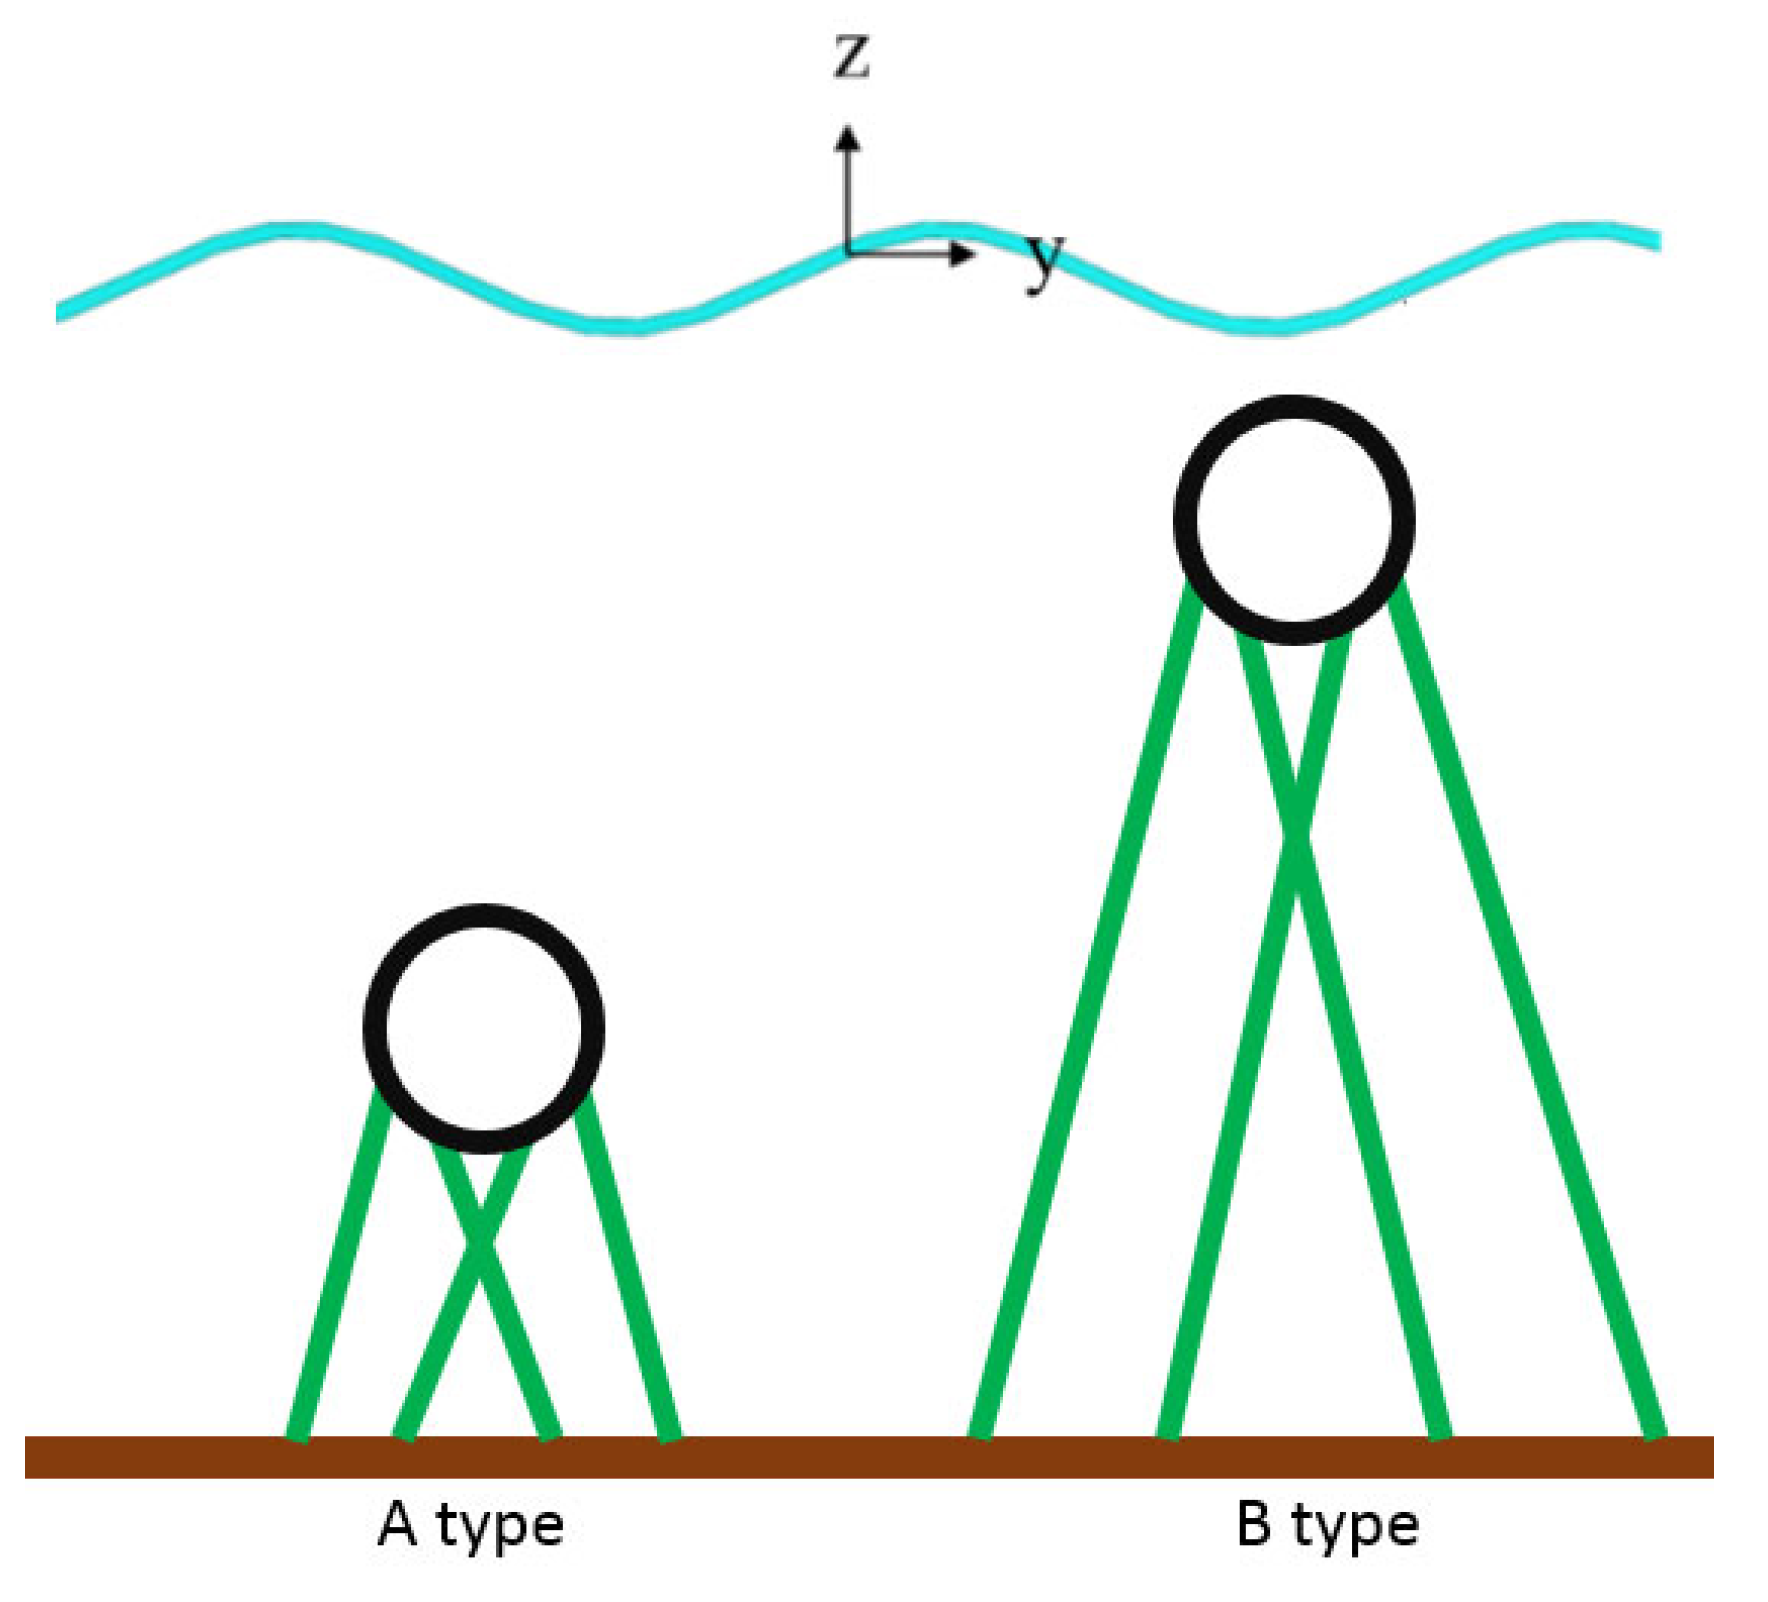
2.1. Configuration
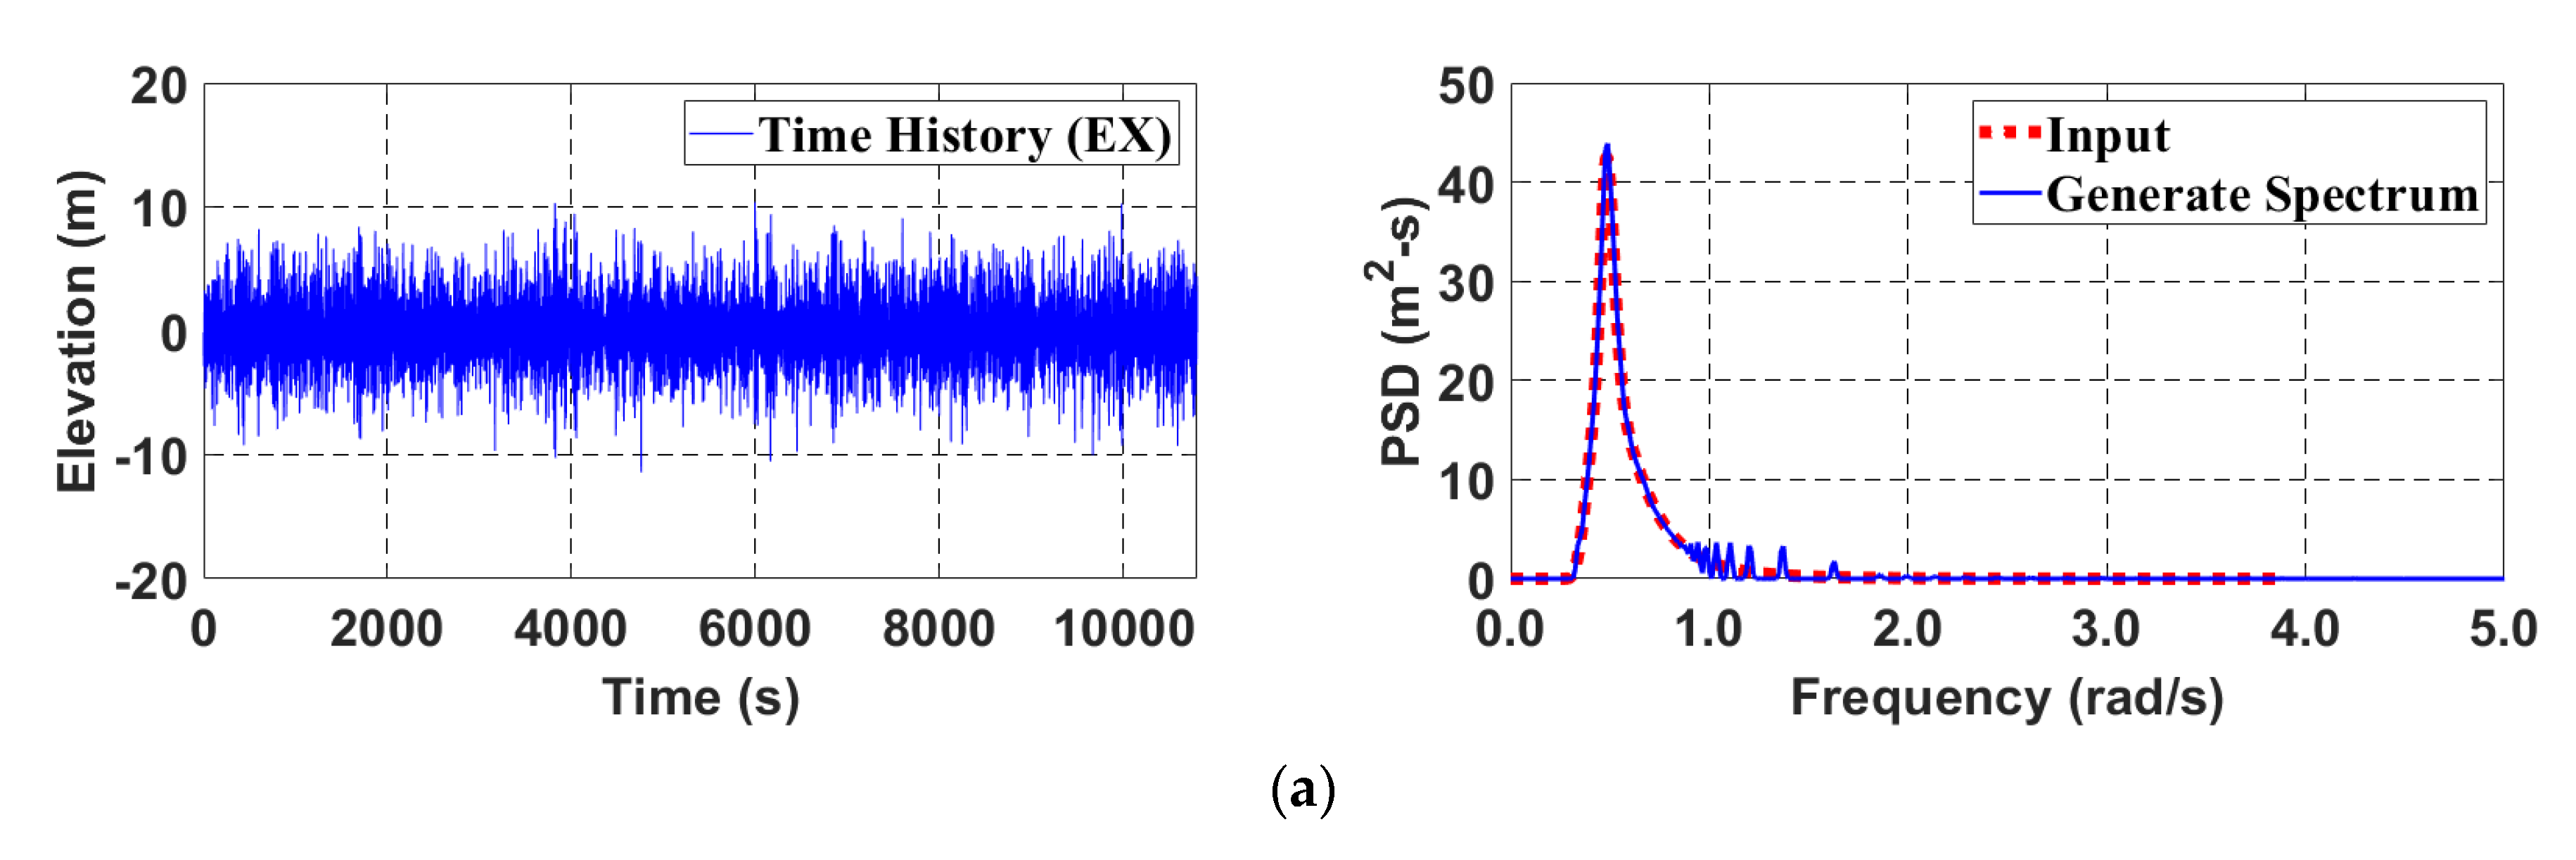
2.2. Environmental Conditions
2.3. Time-domain Simulation
- ;
- ;
- ;
- ;
- ;
- ;
- ;
- ;
- ;
- ;
- ;
- ;
- ;
- ;
- .
- ;
- ;
- ;
- ;
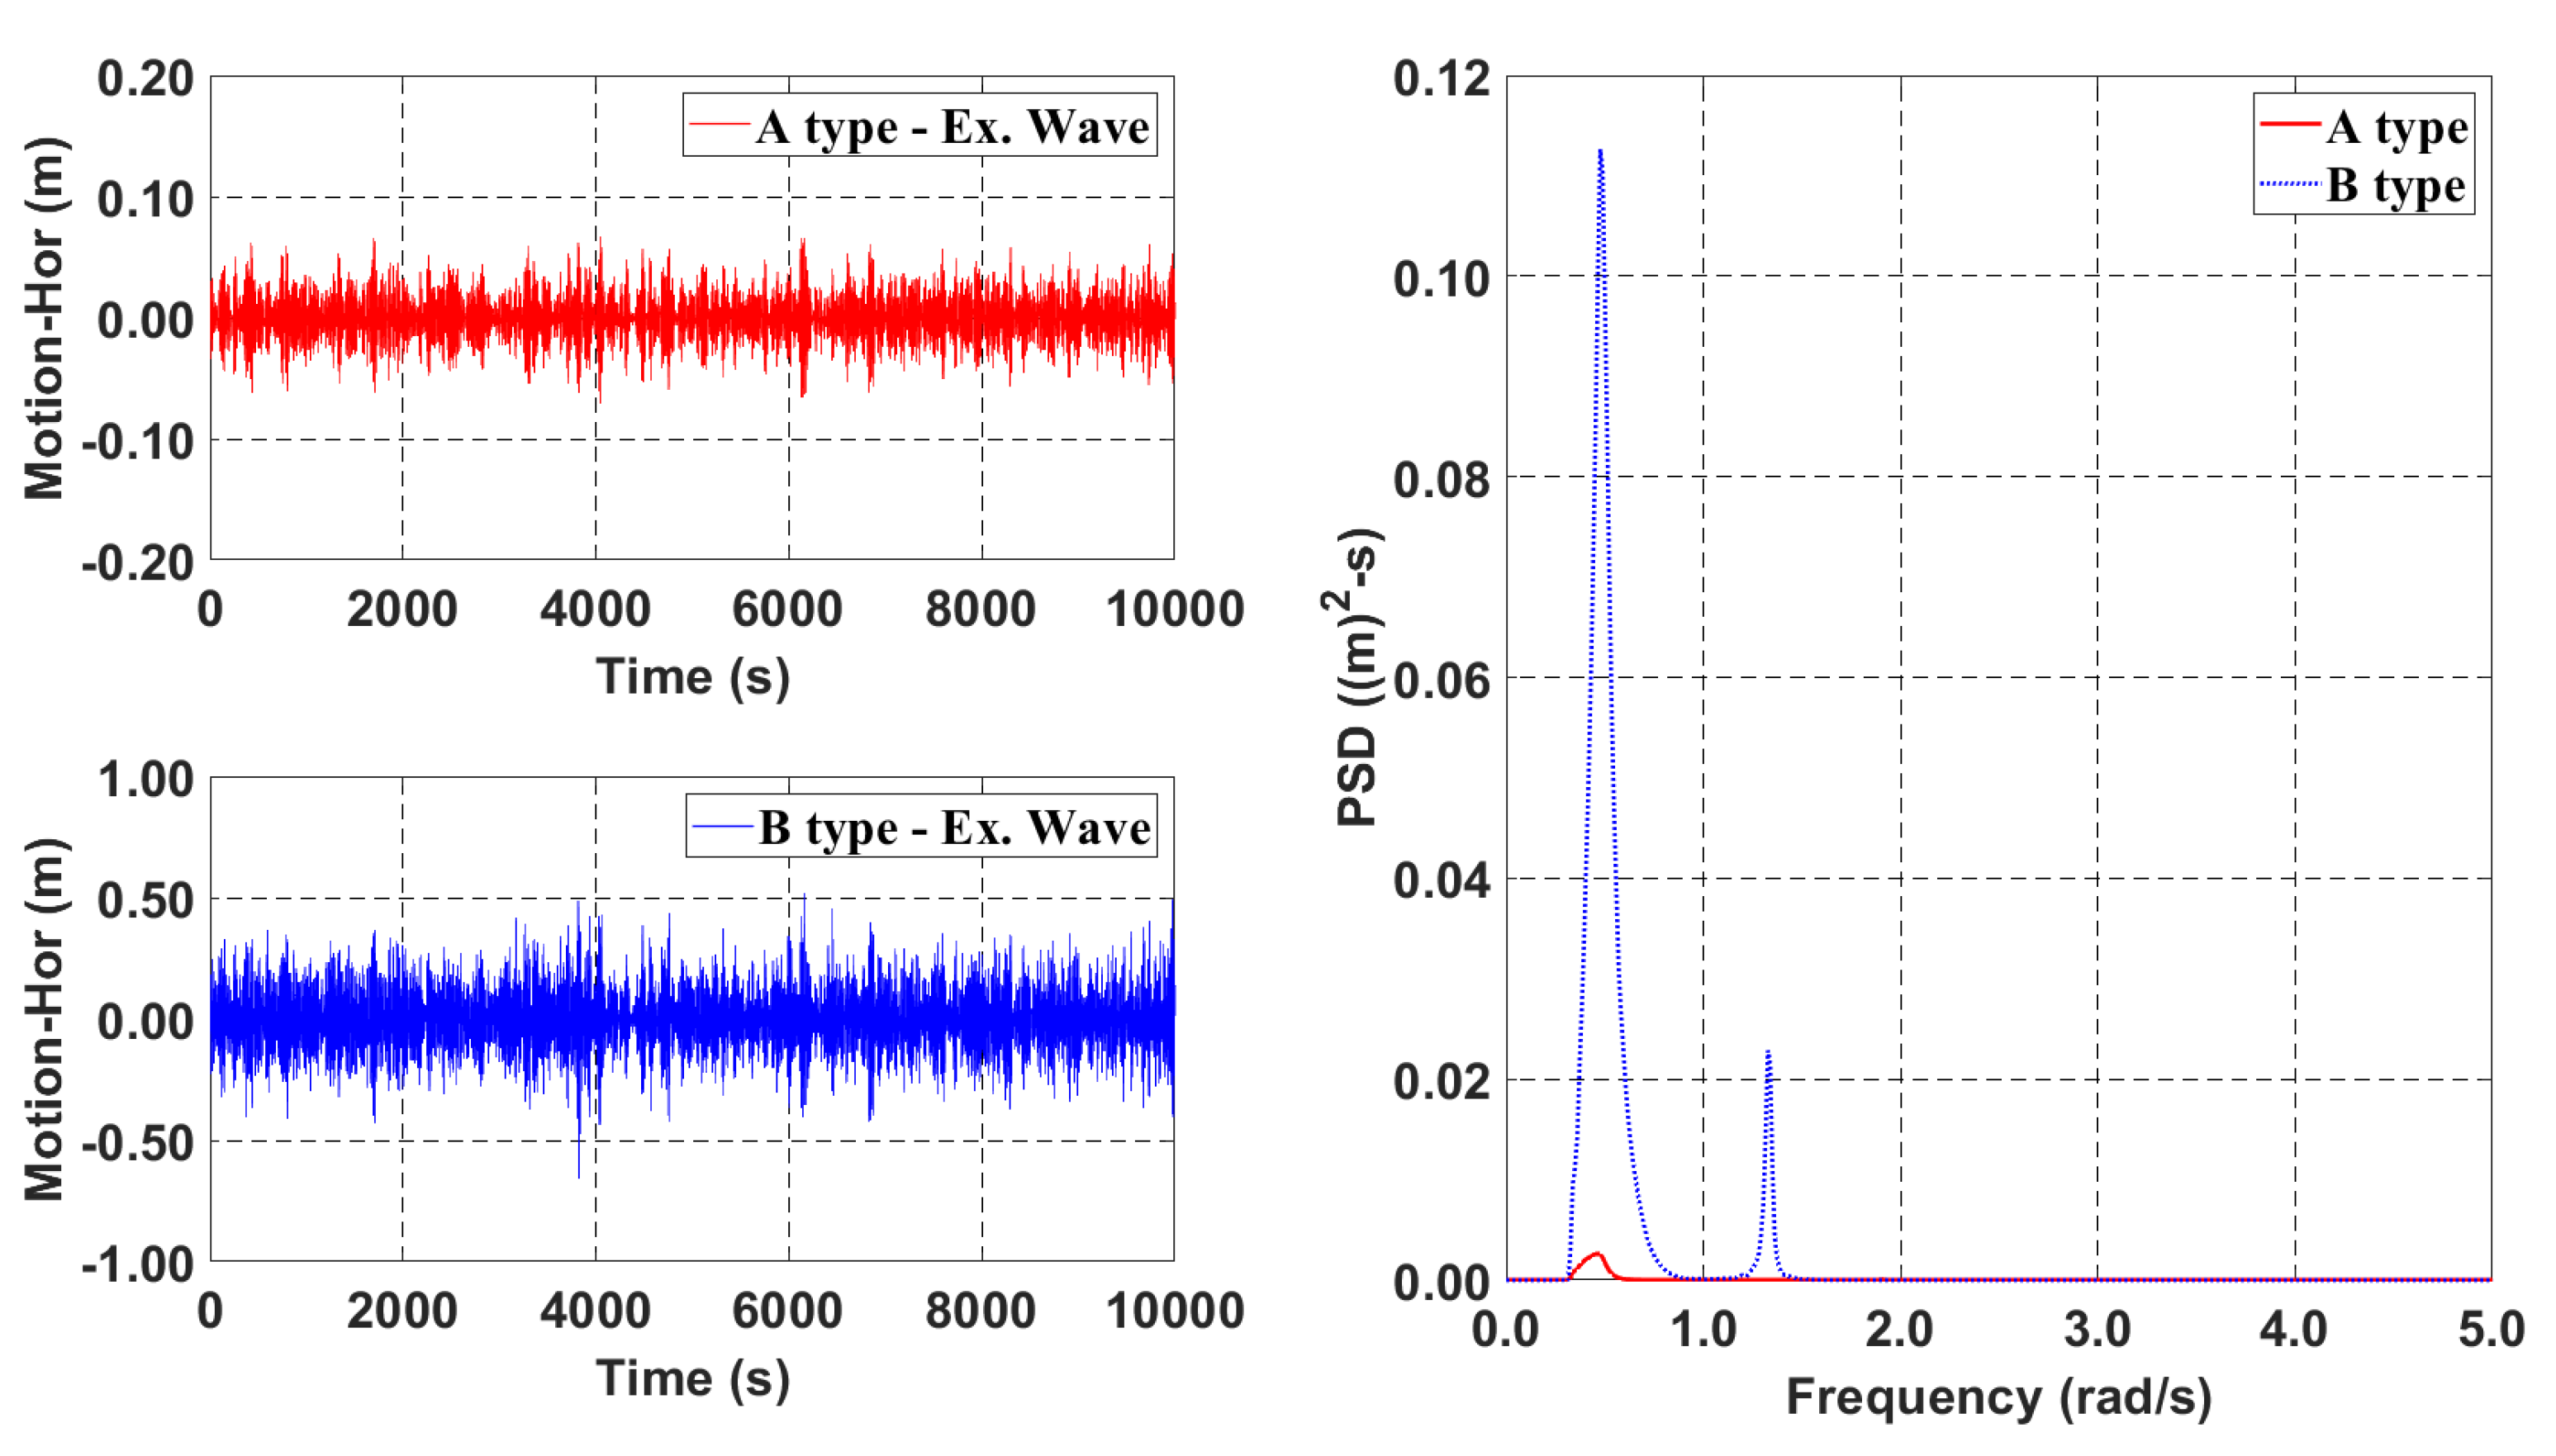
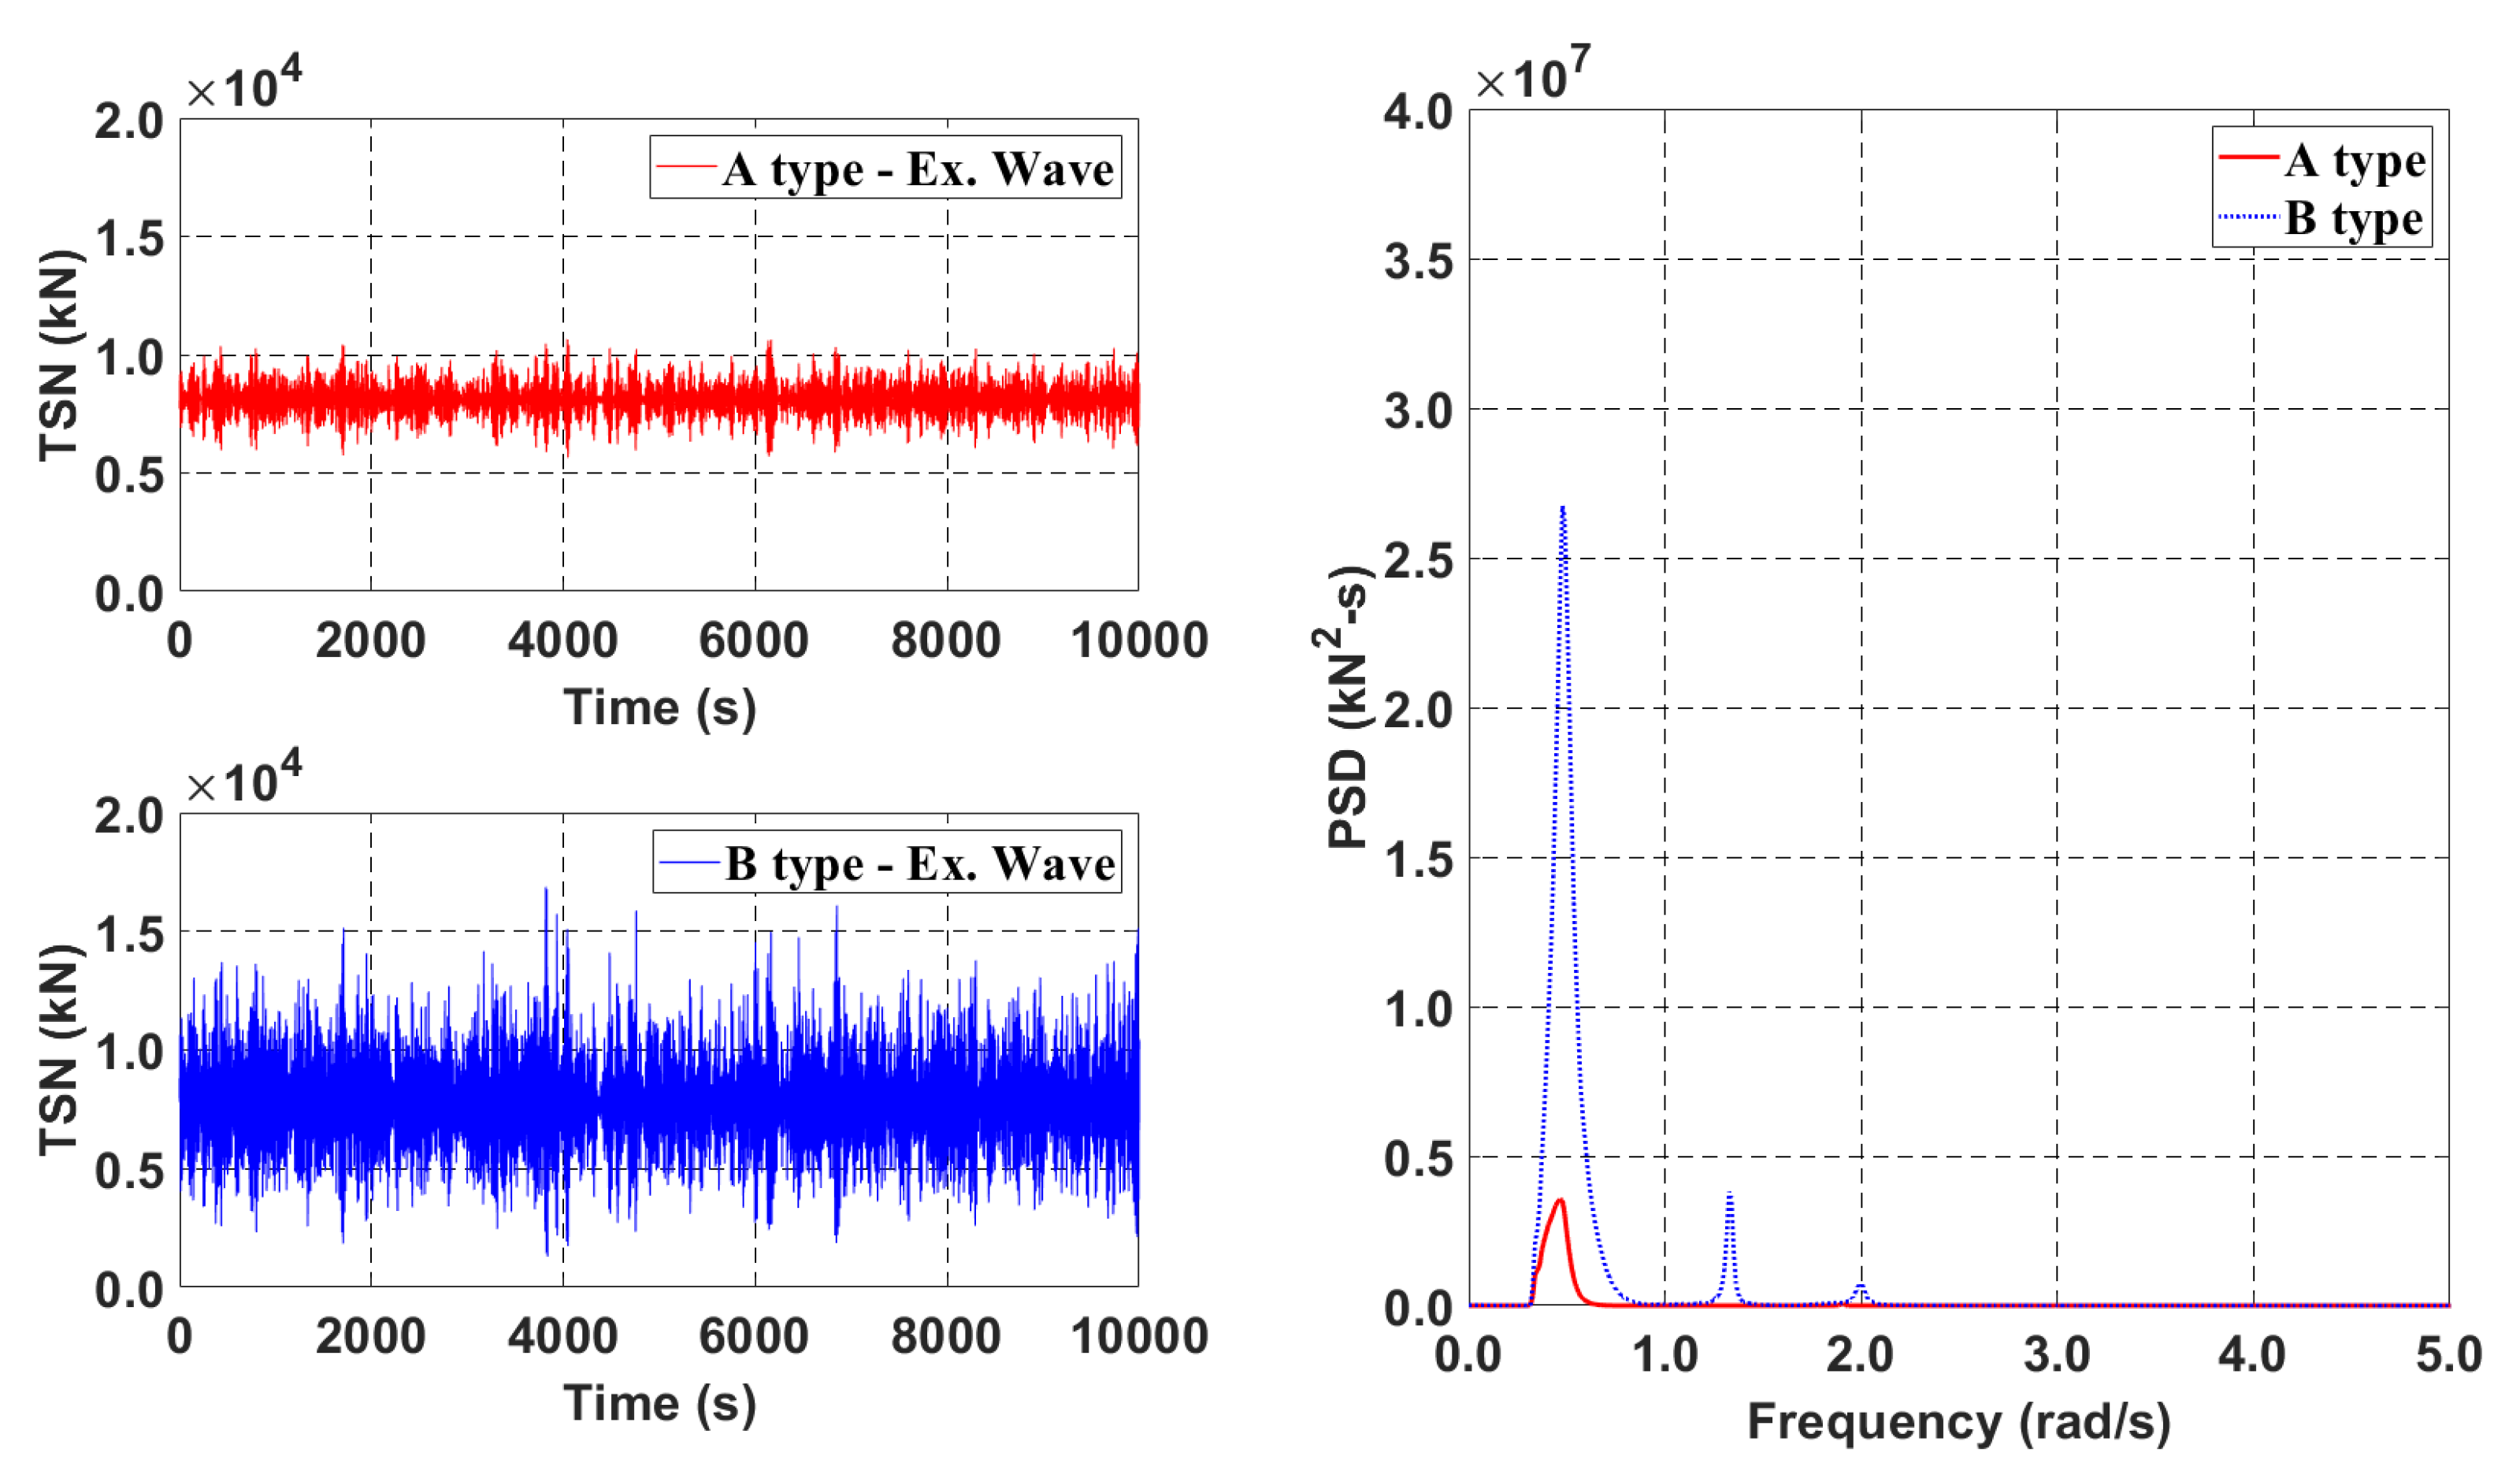
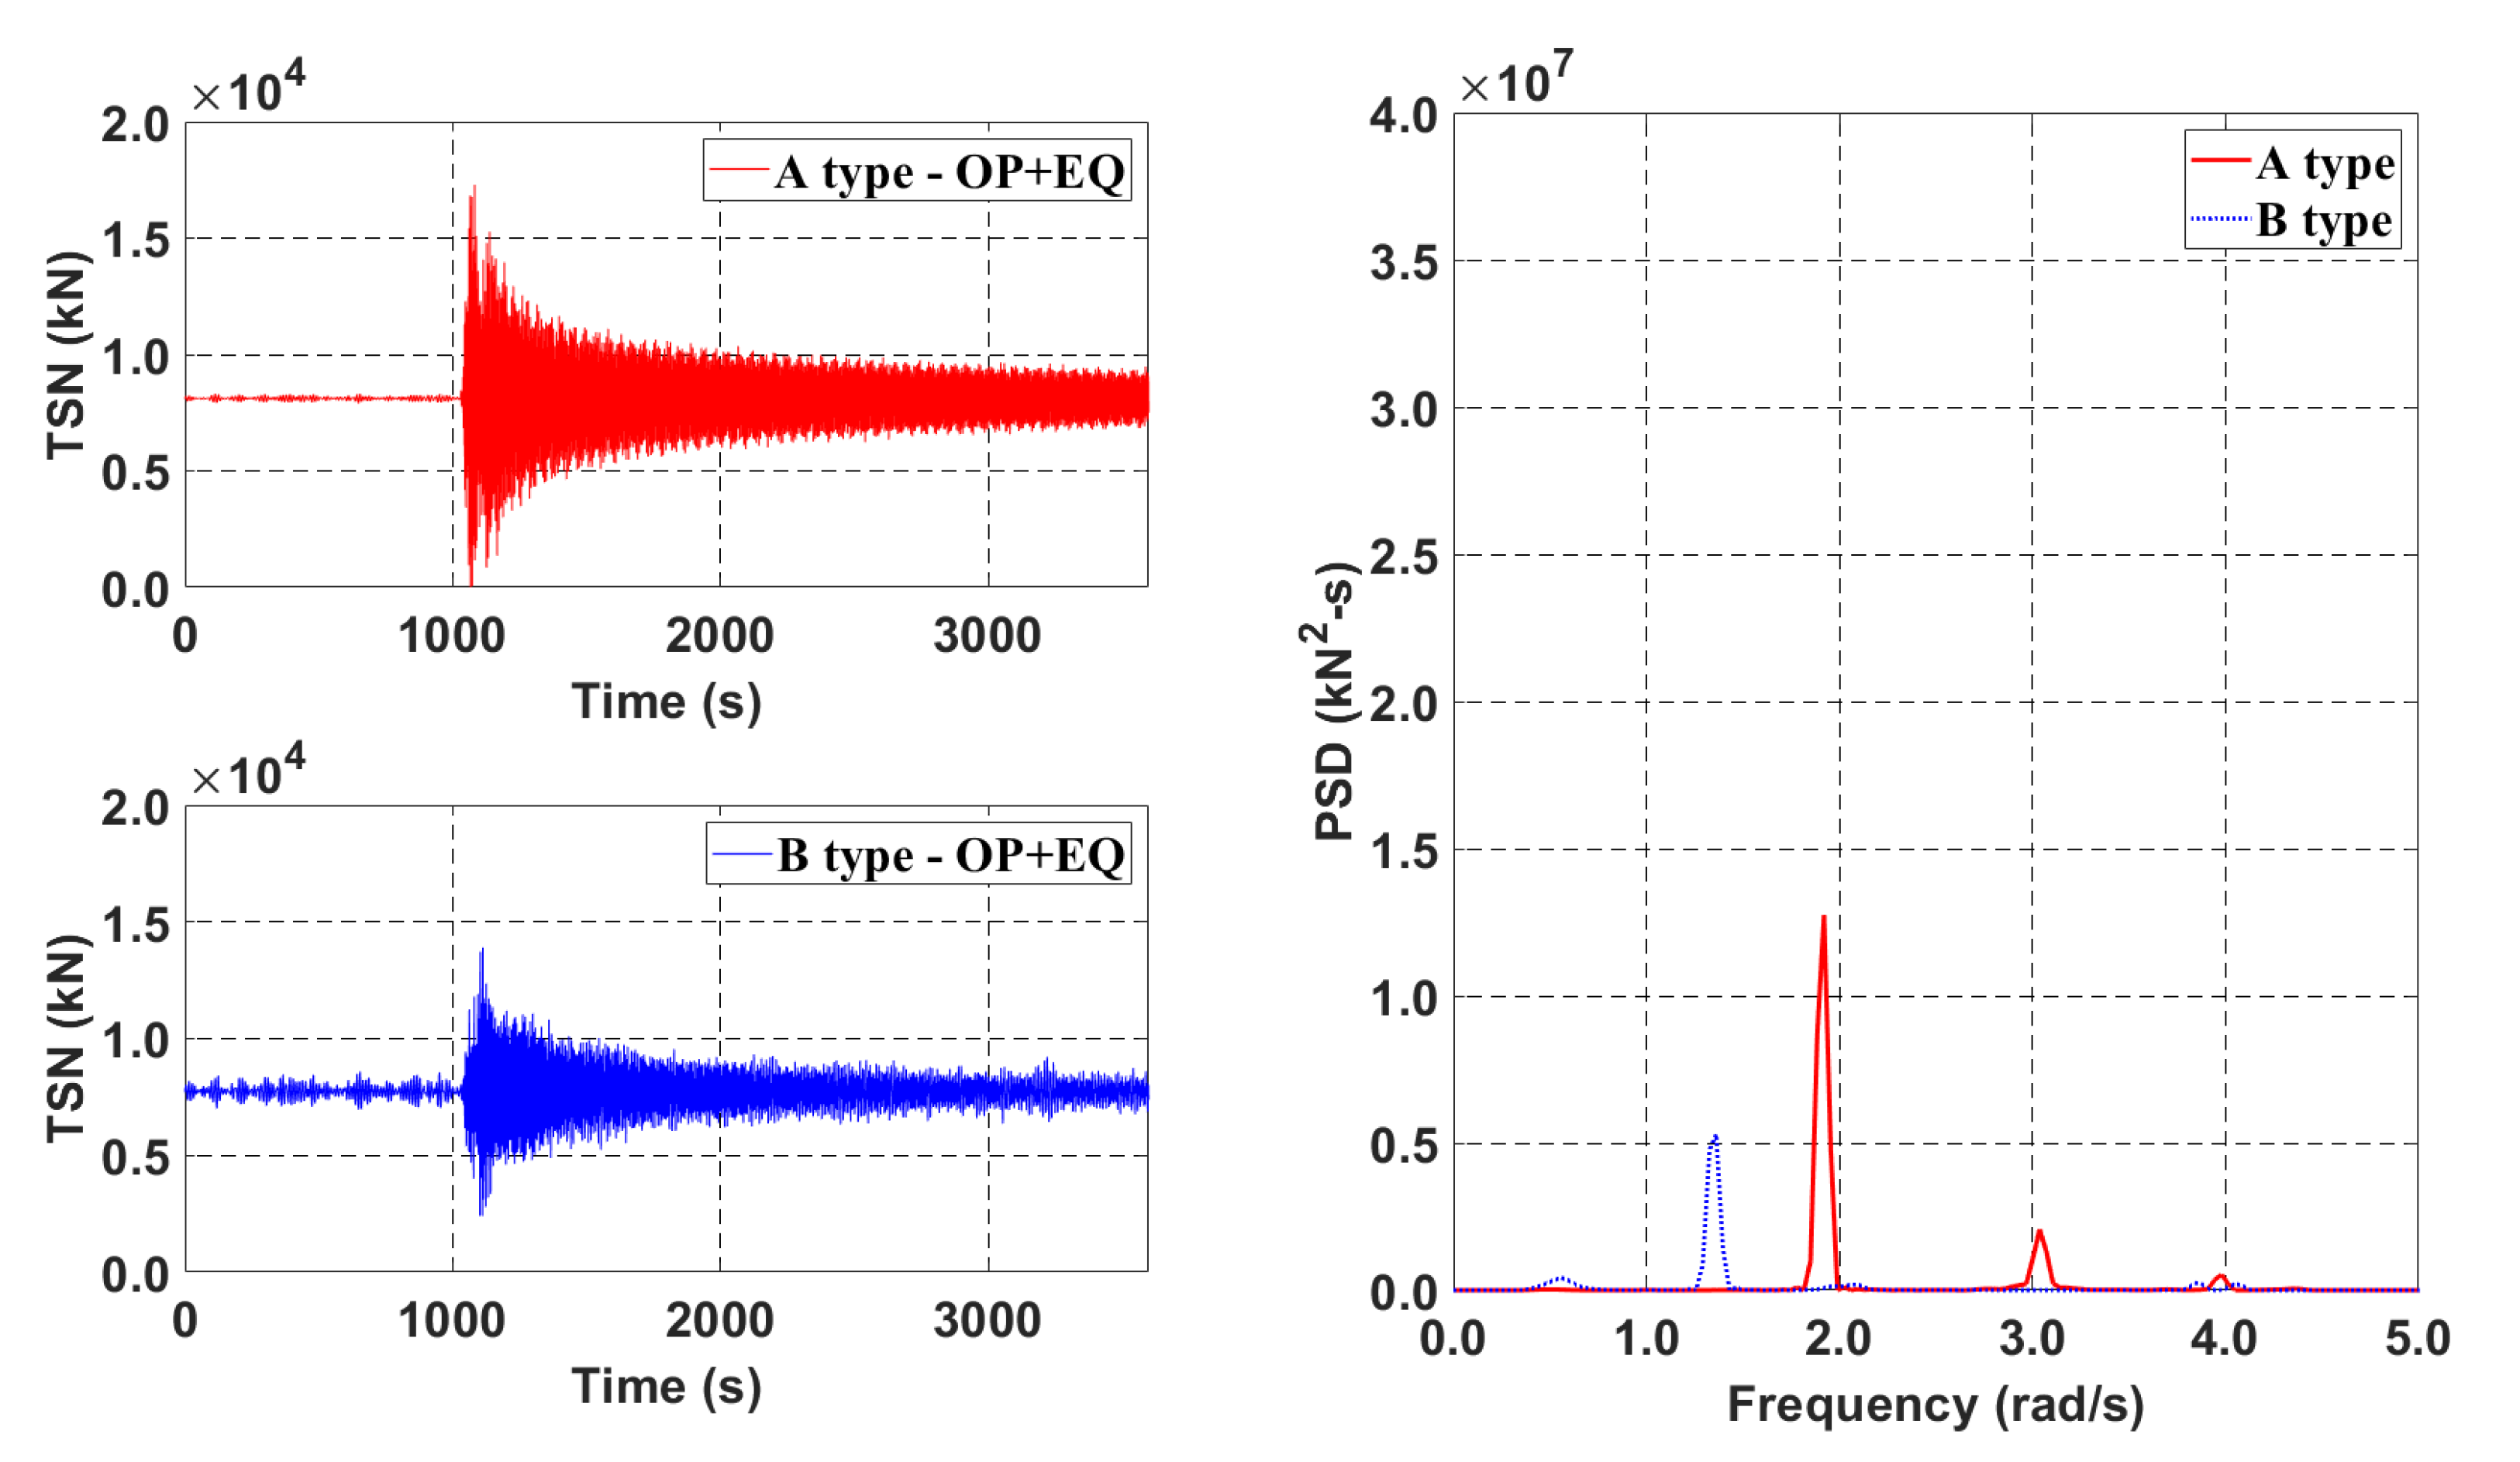
3. Effect of Submerged Depth
4. Submerged-Depth Compromise Model (C-Type)
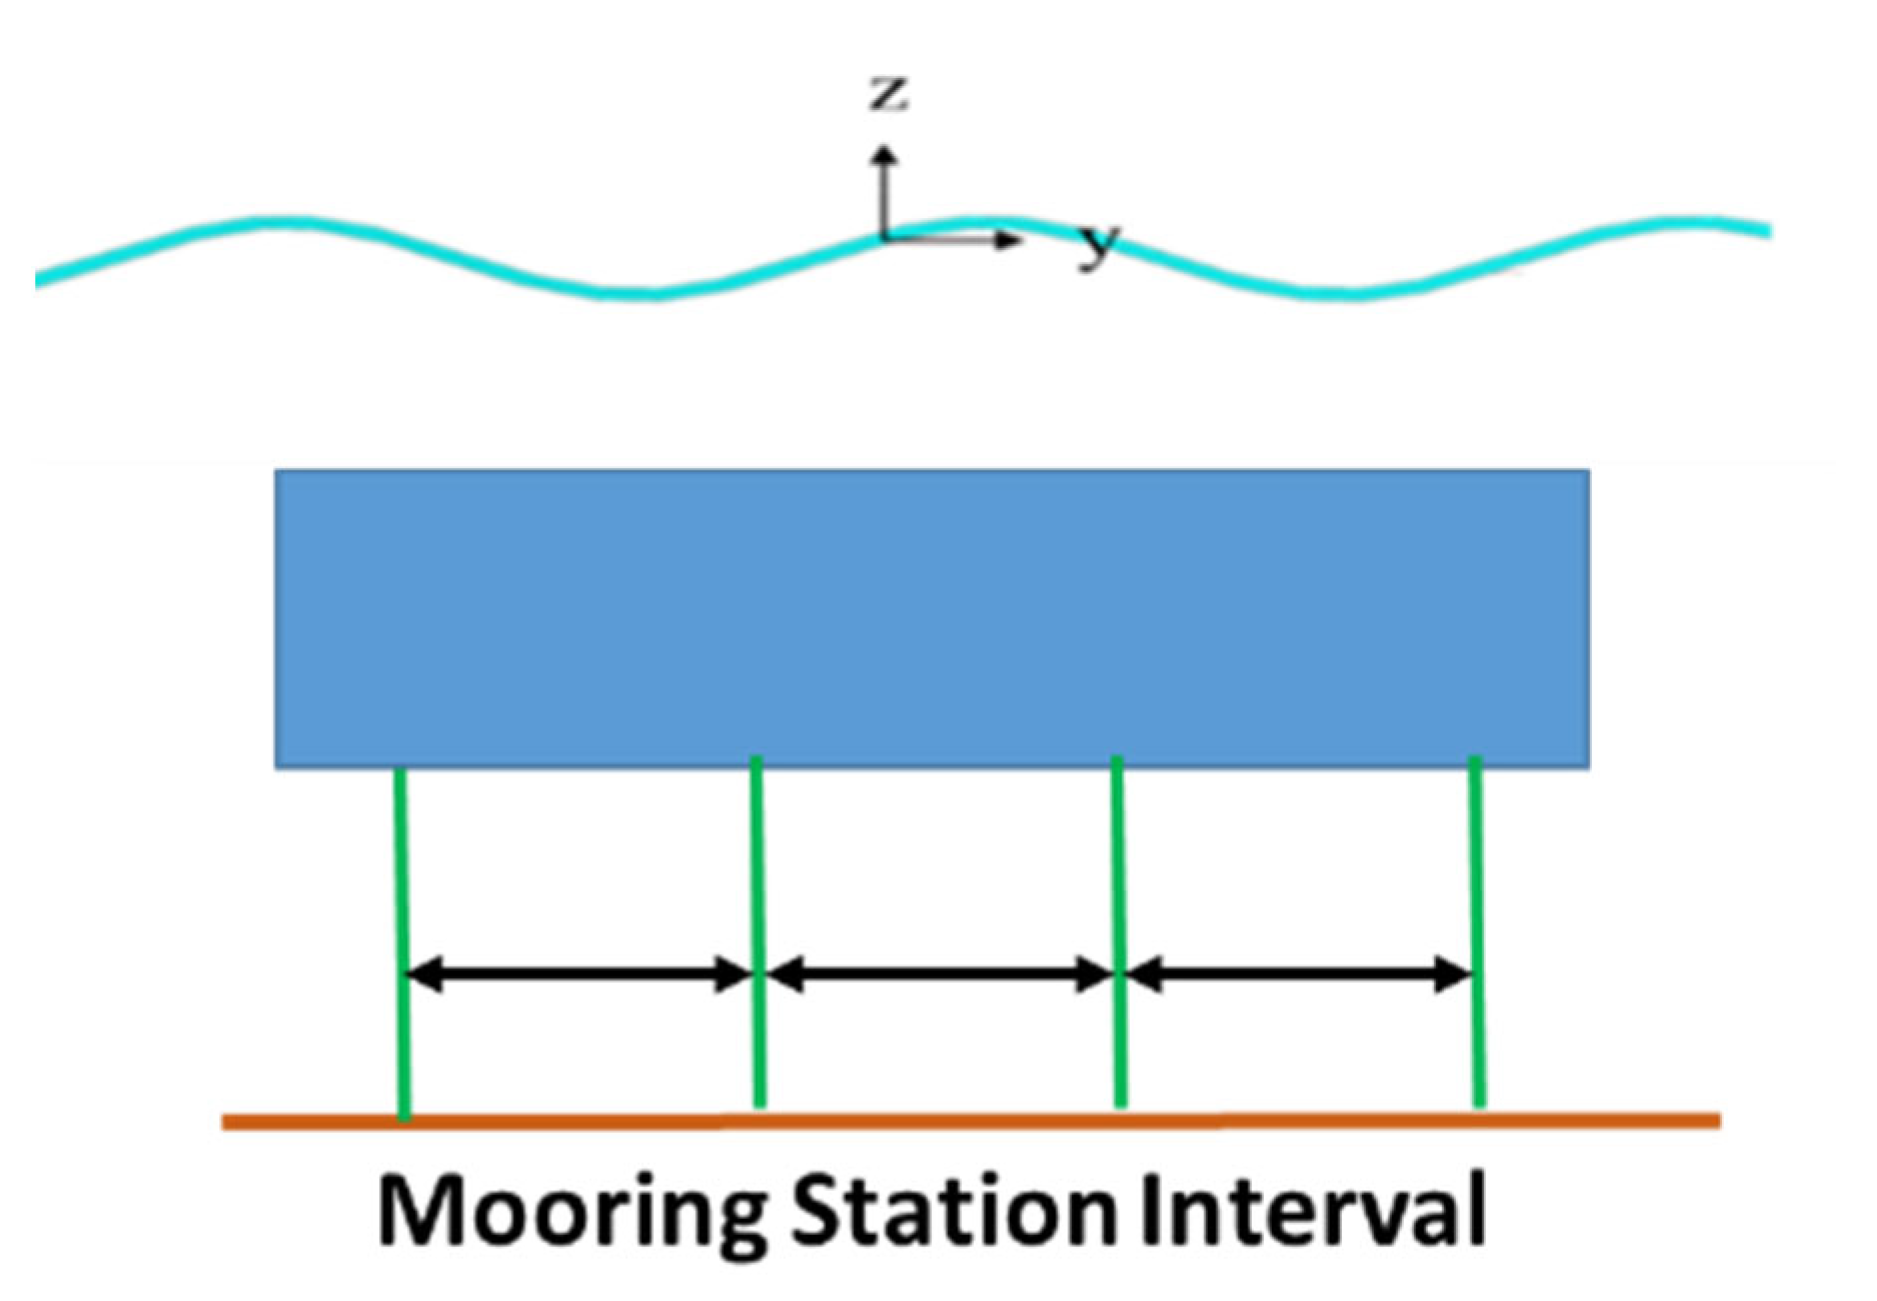
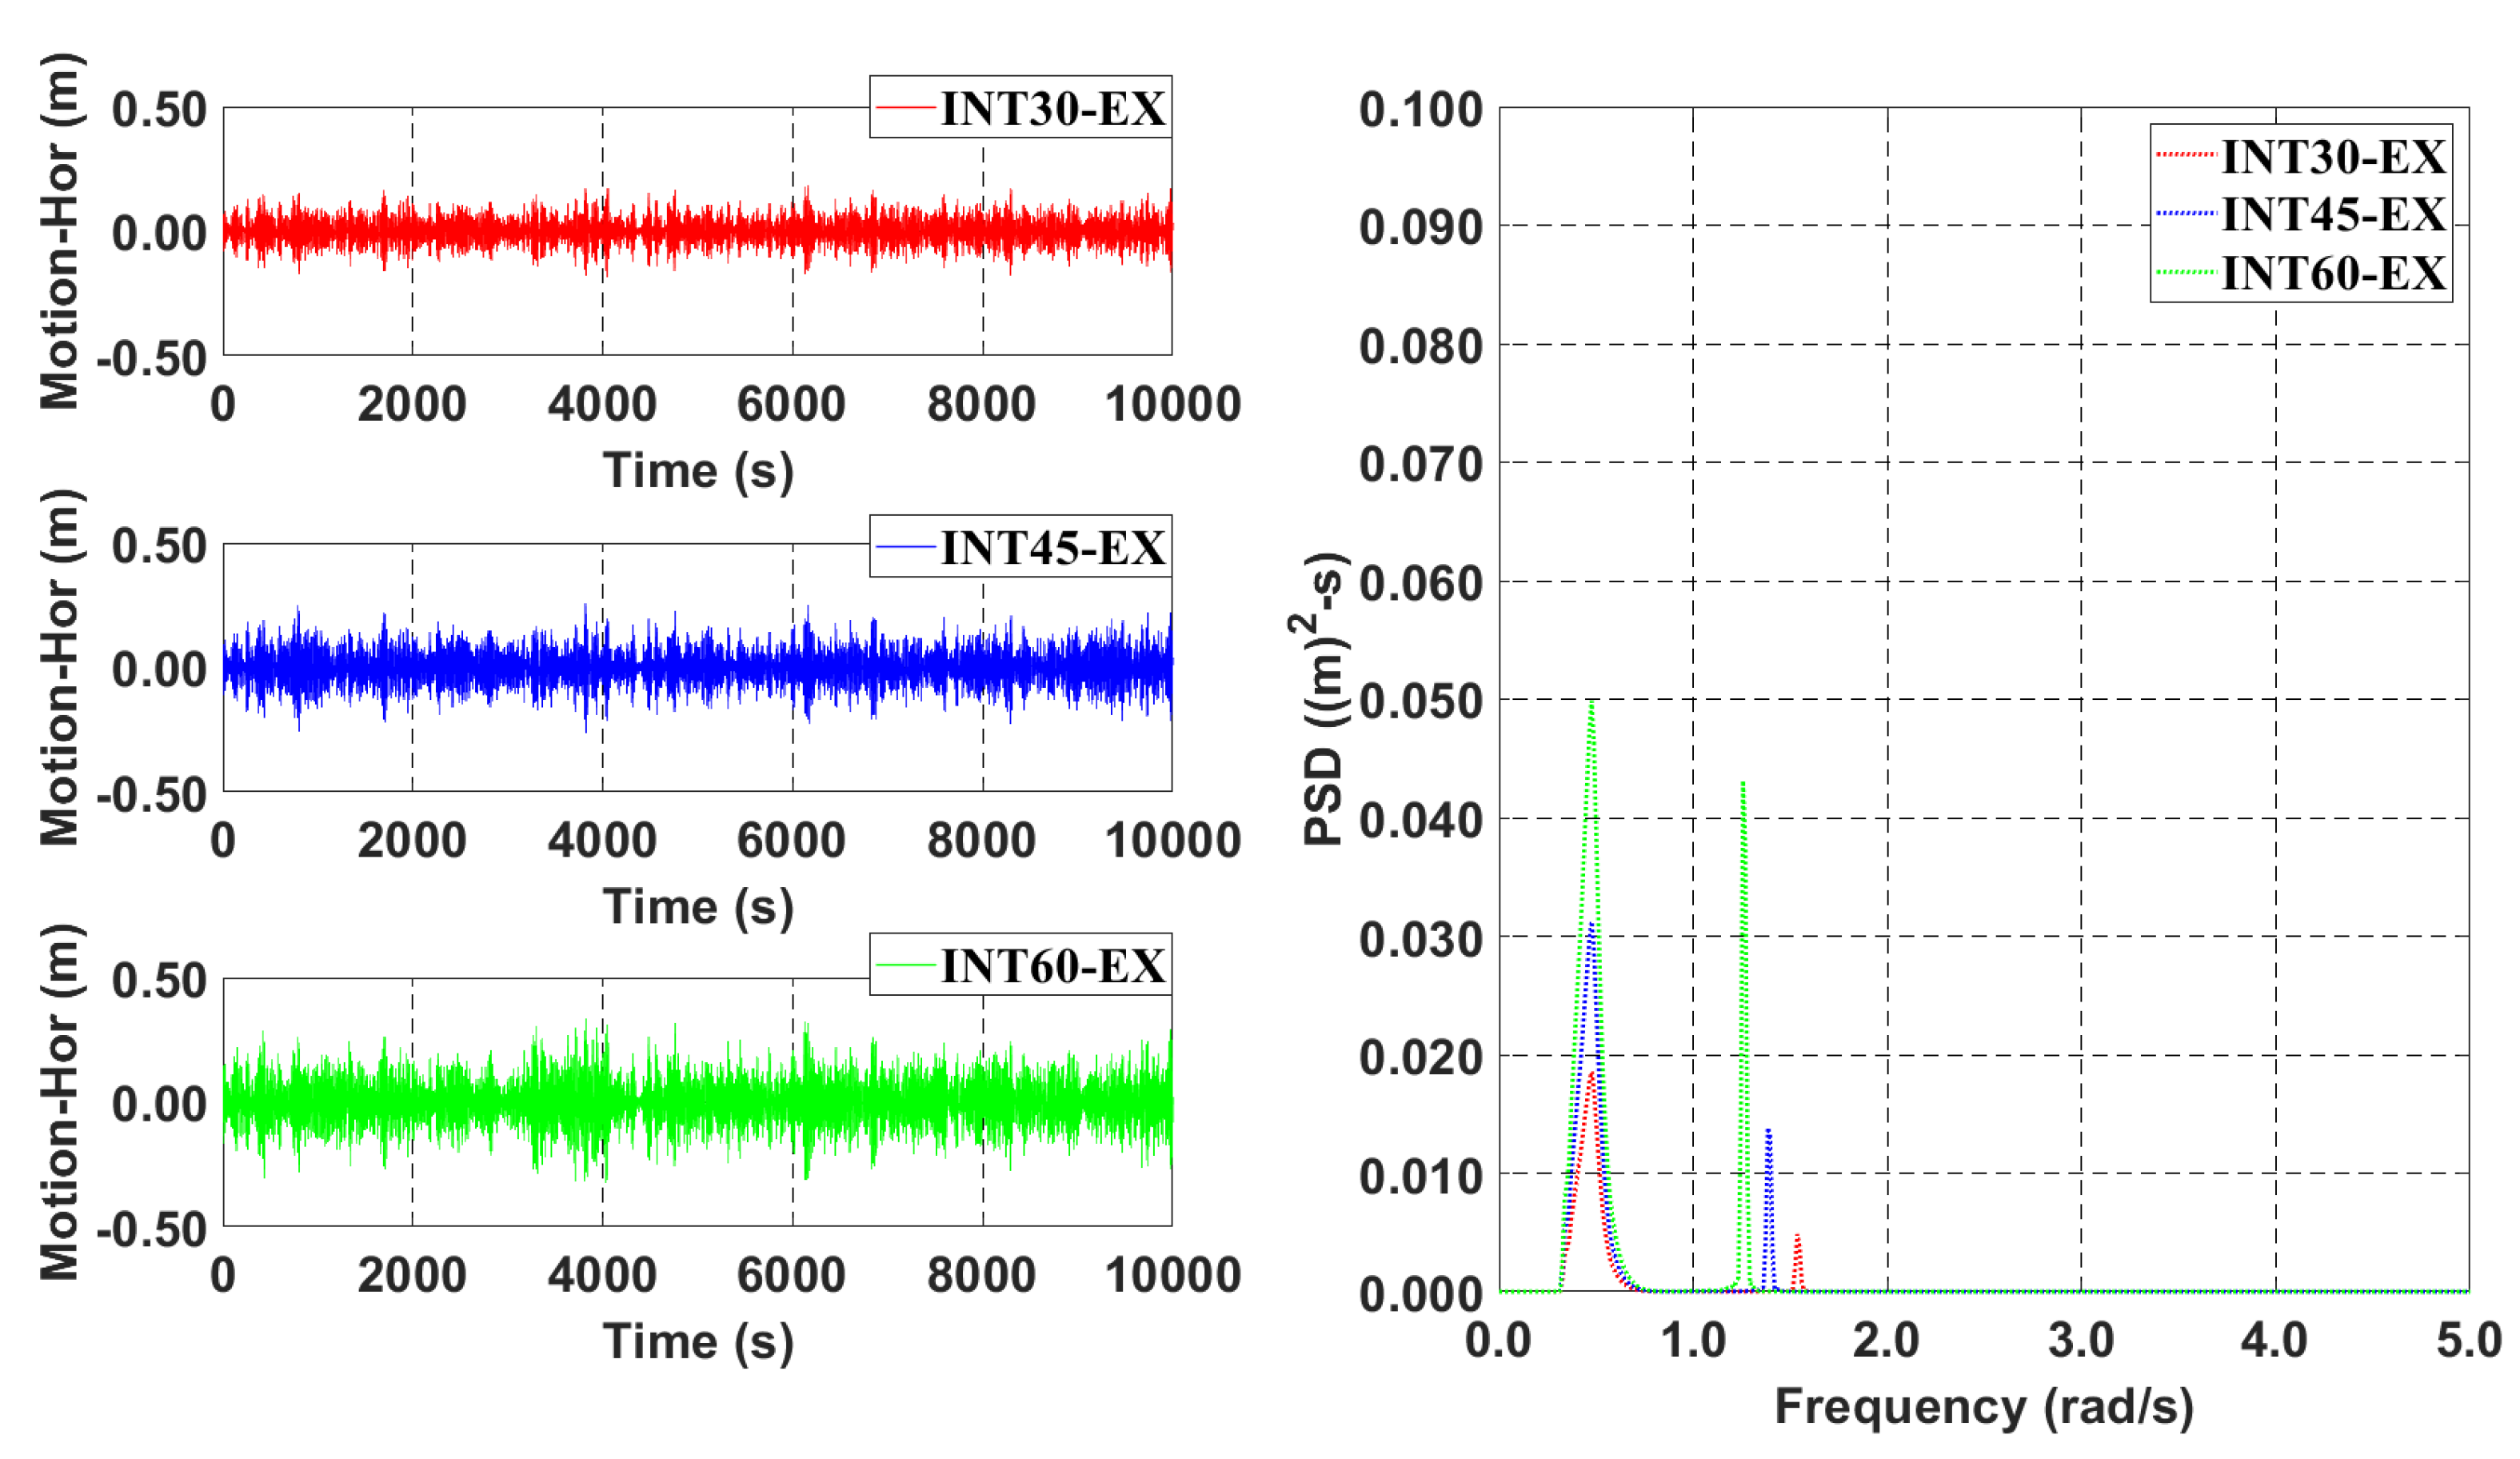
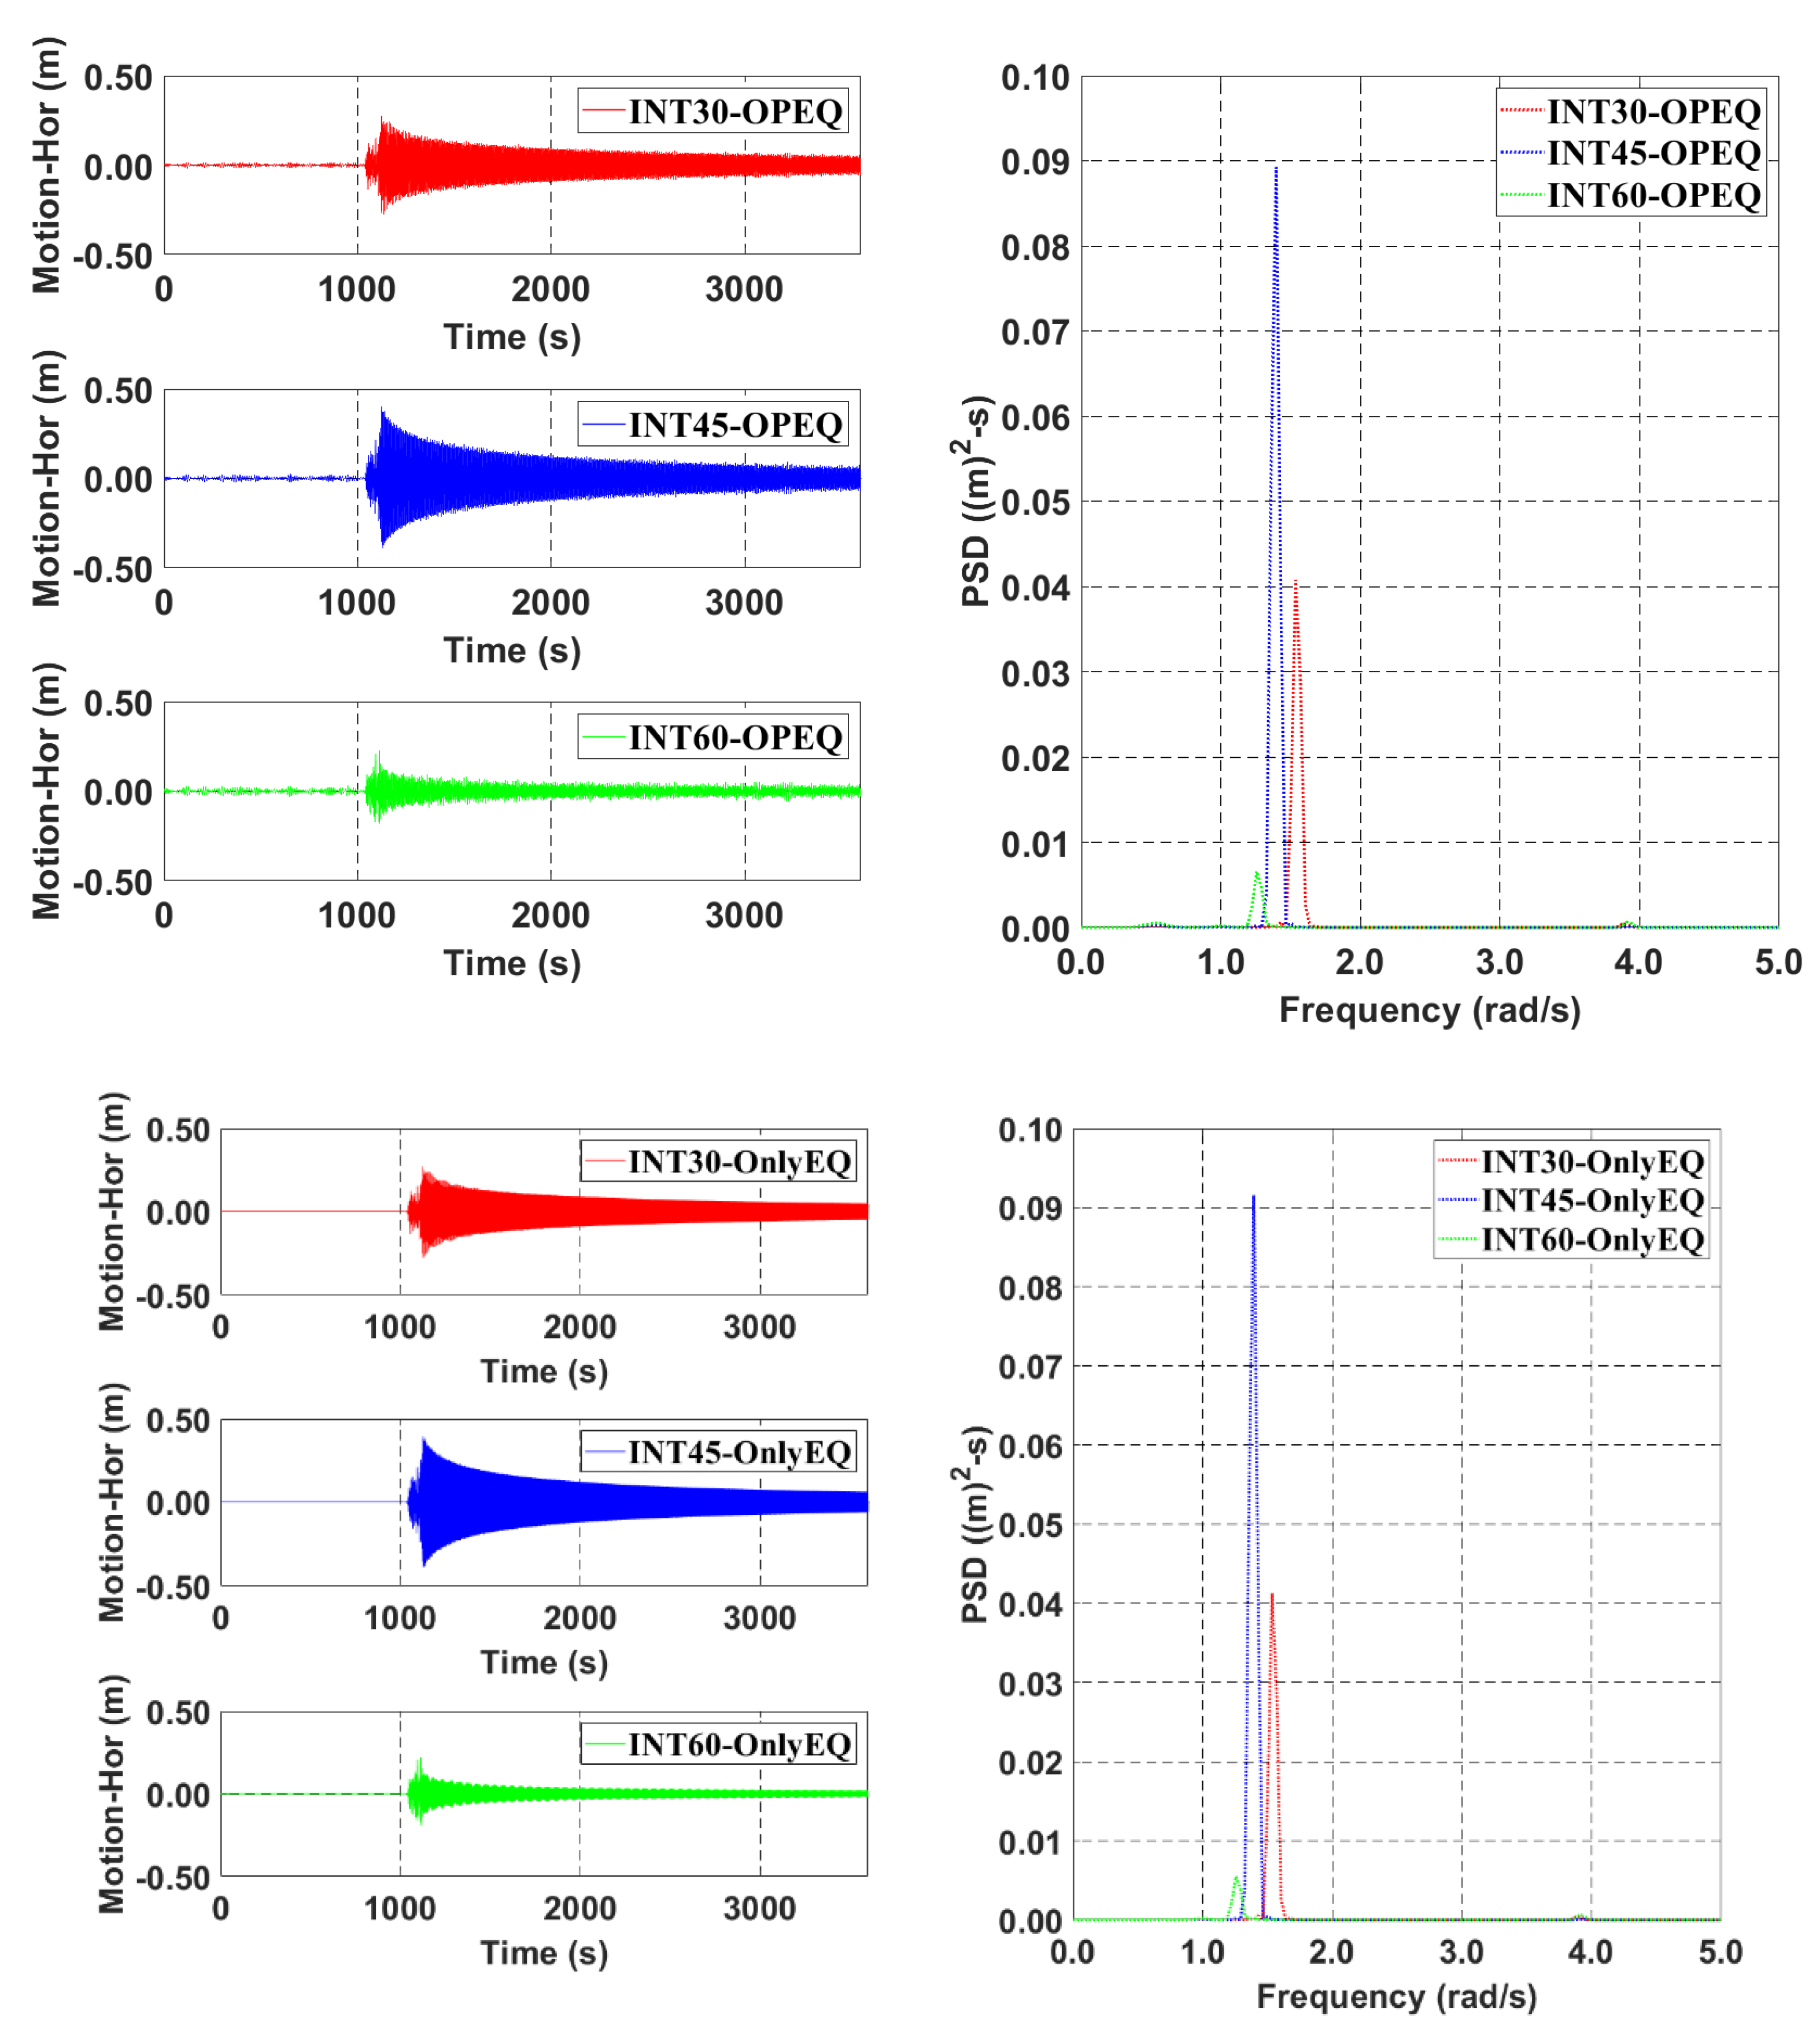
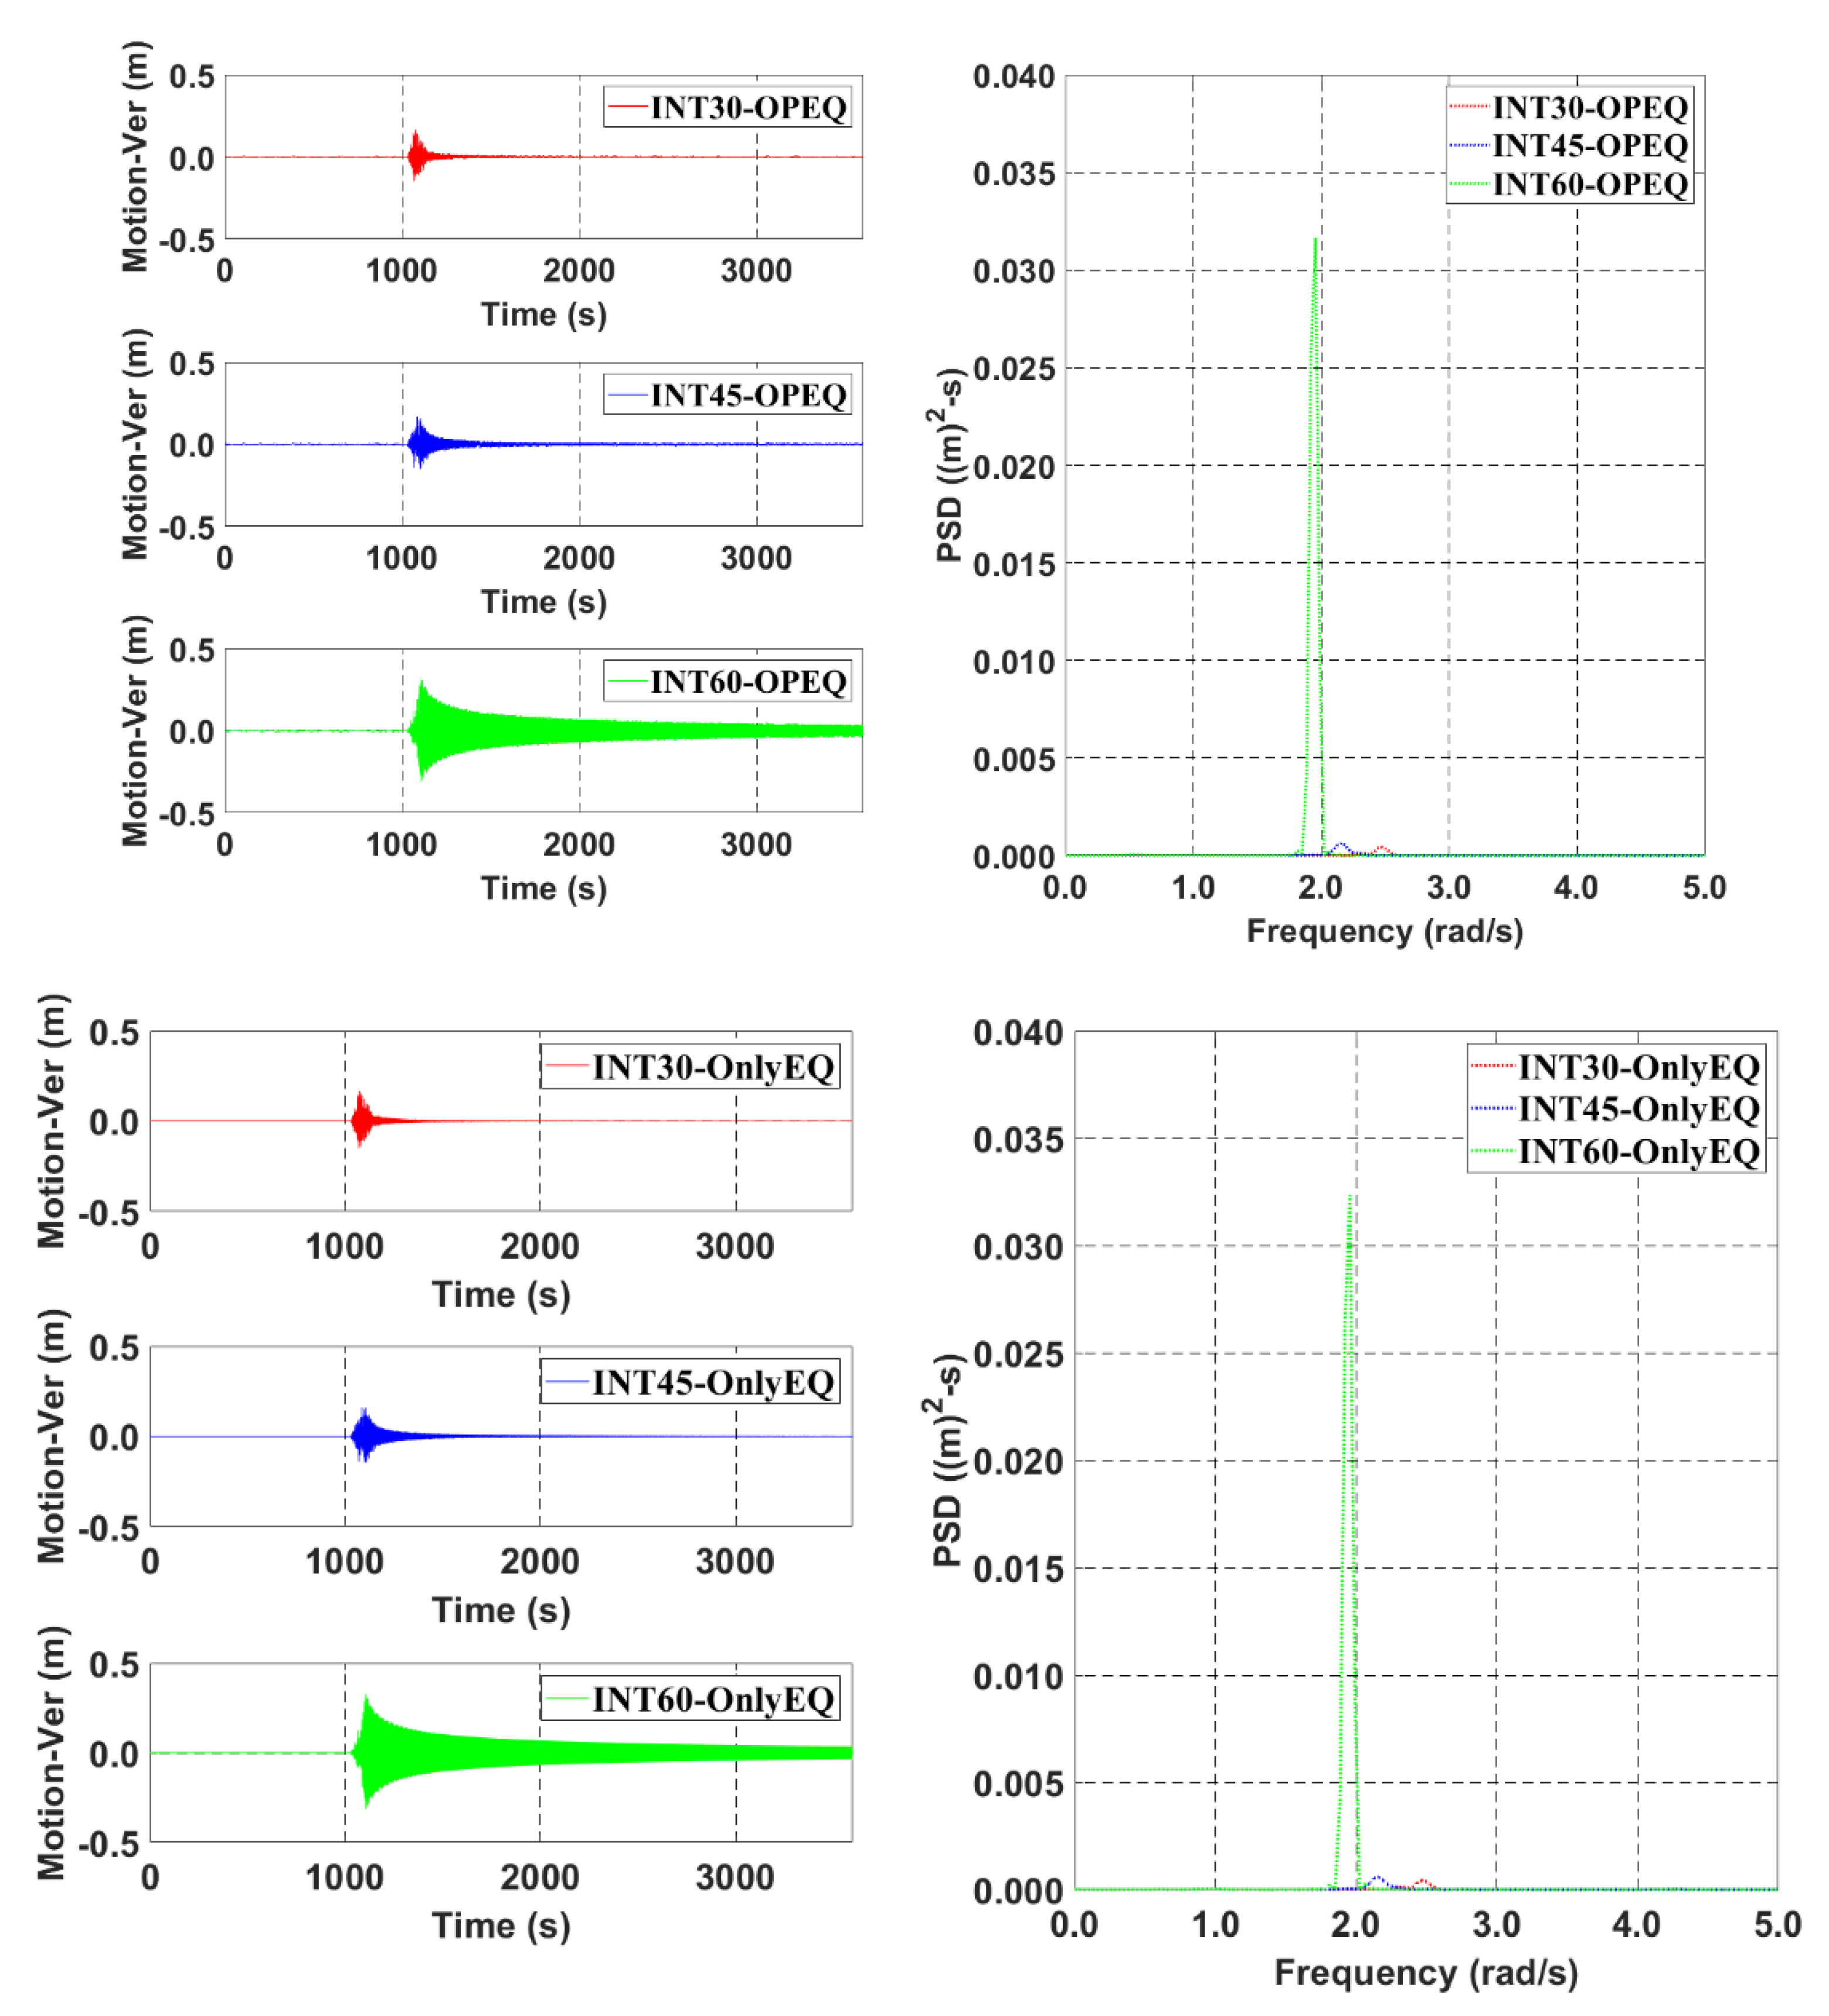
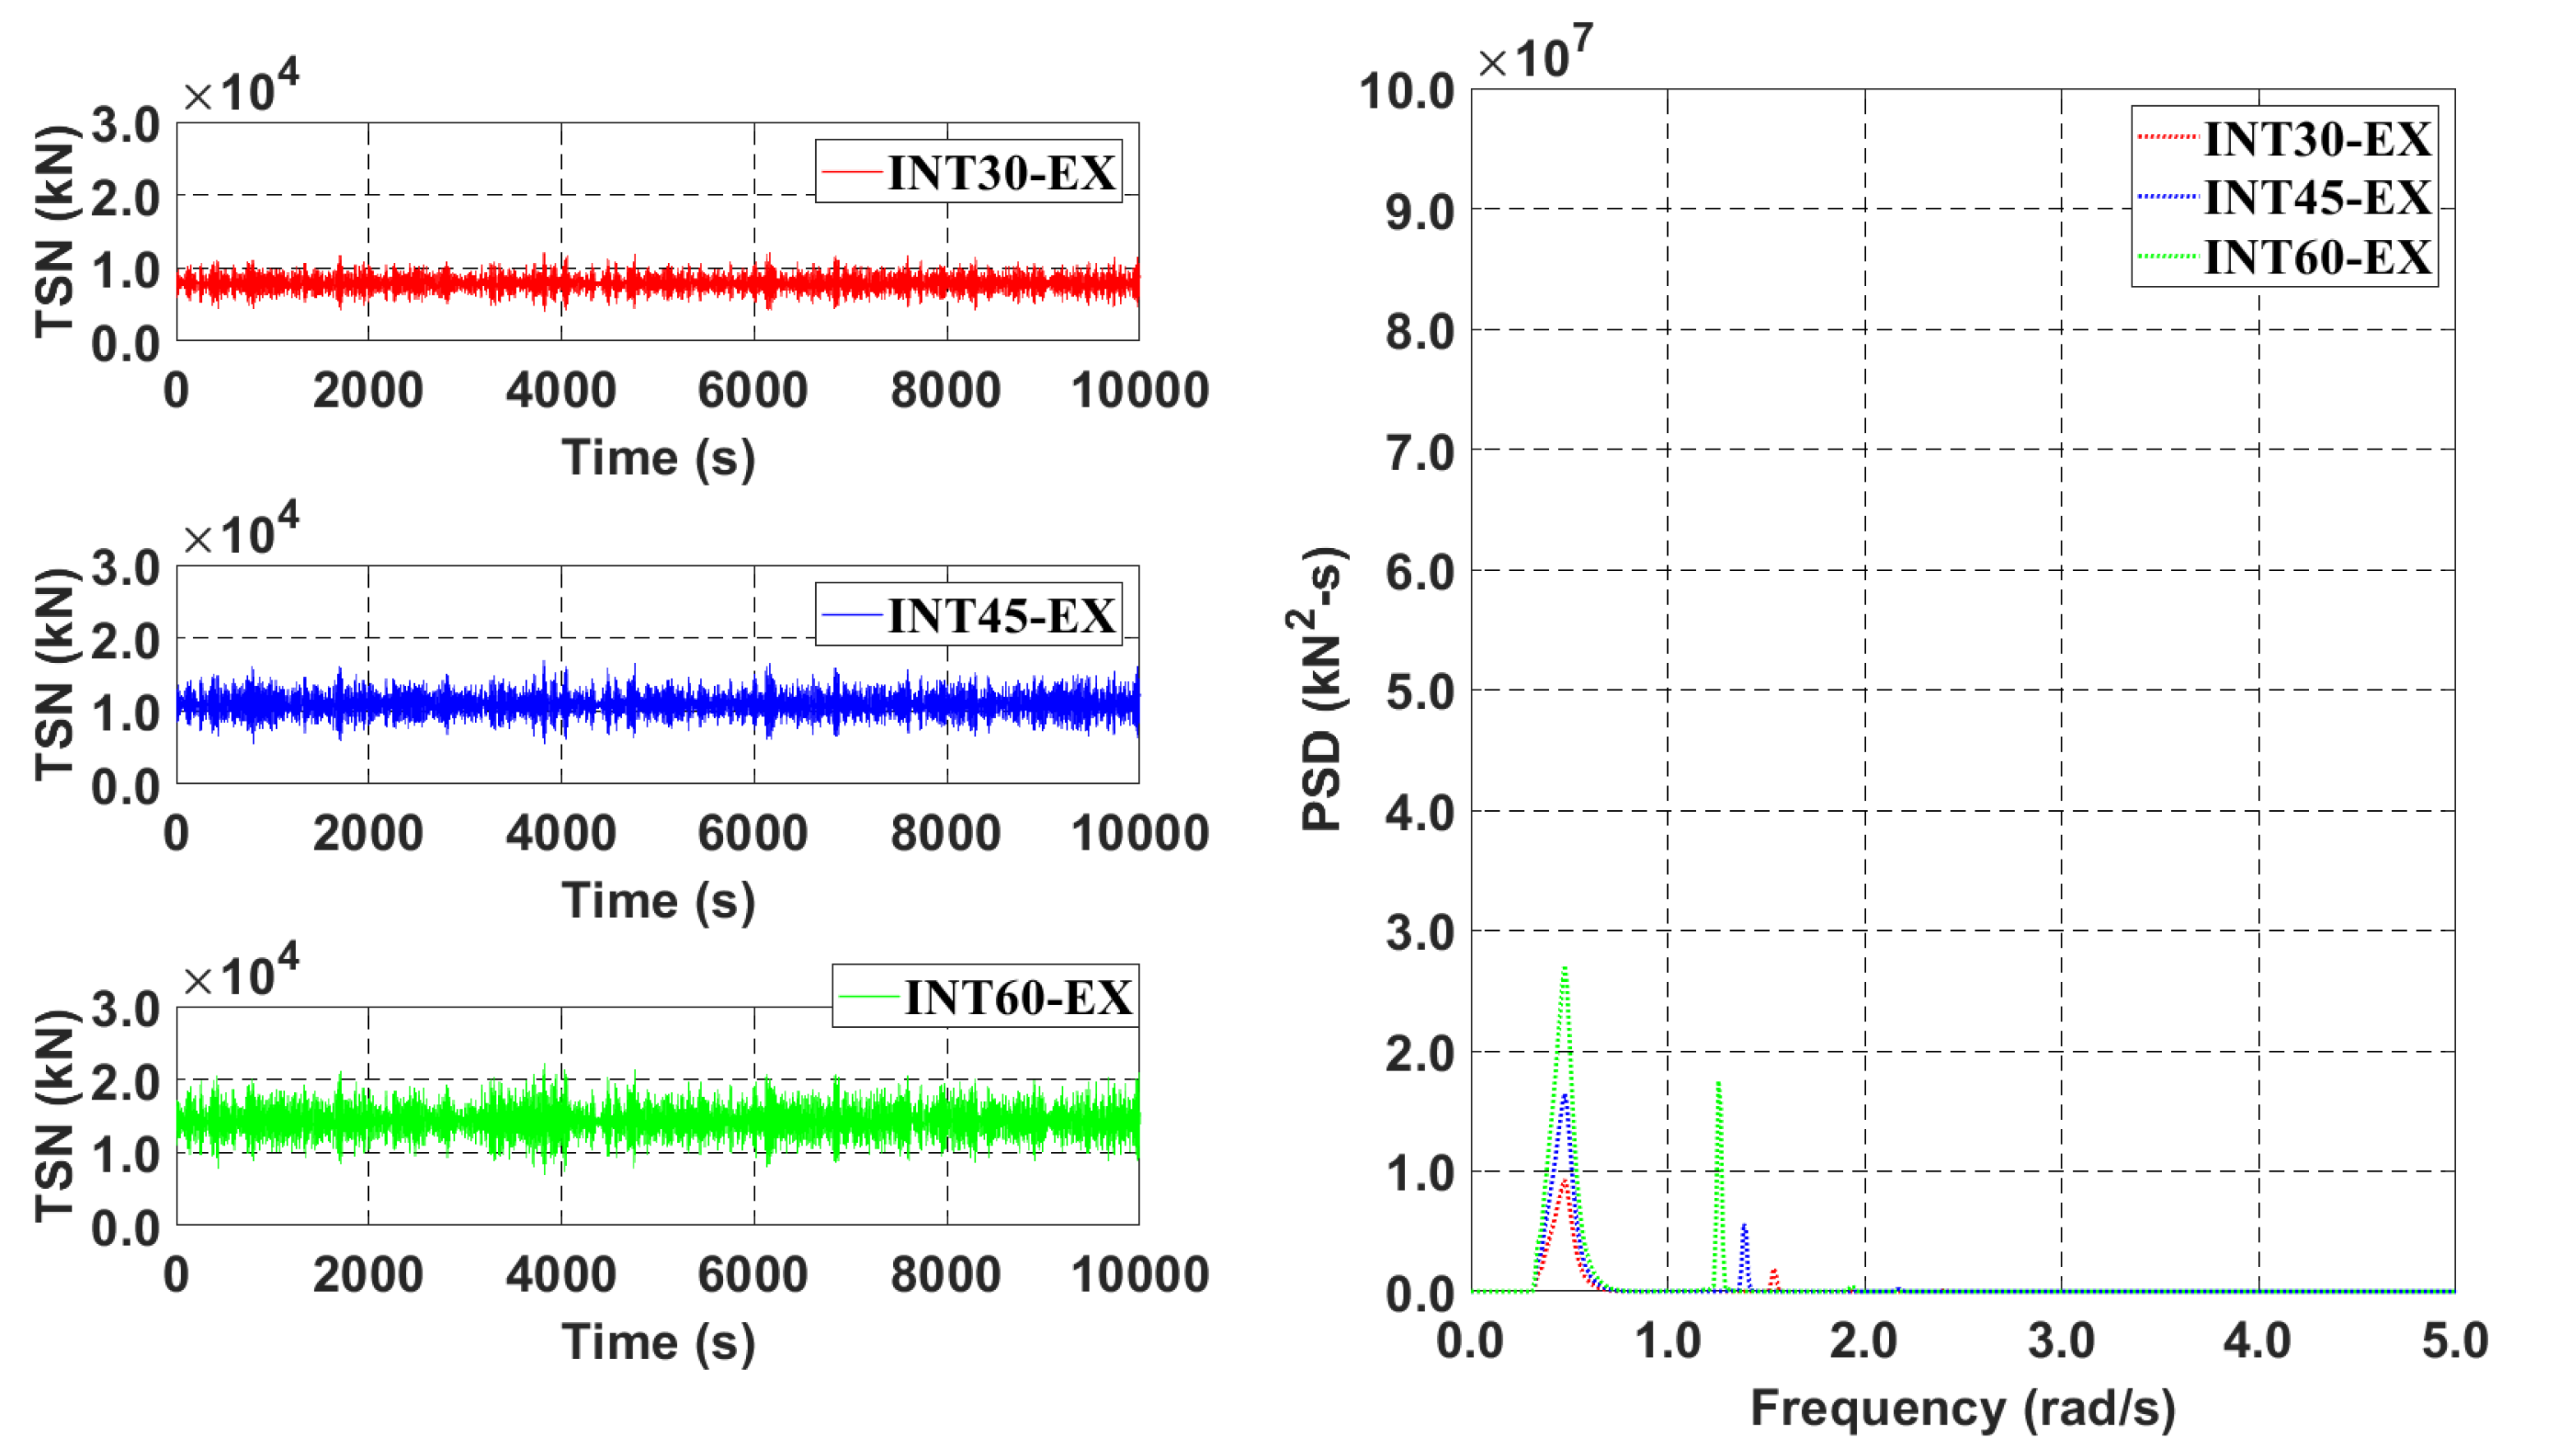
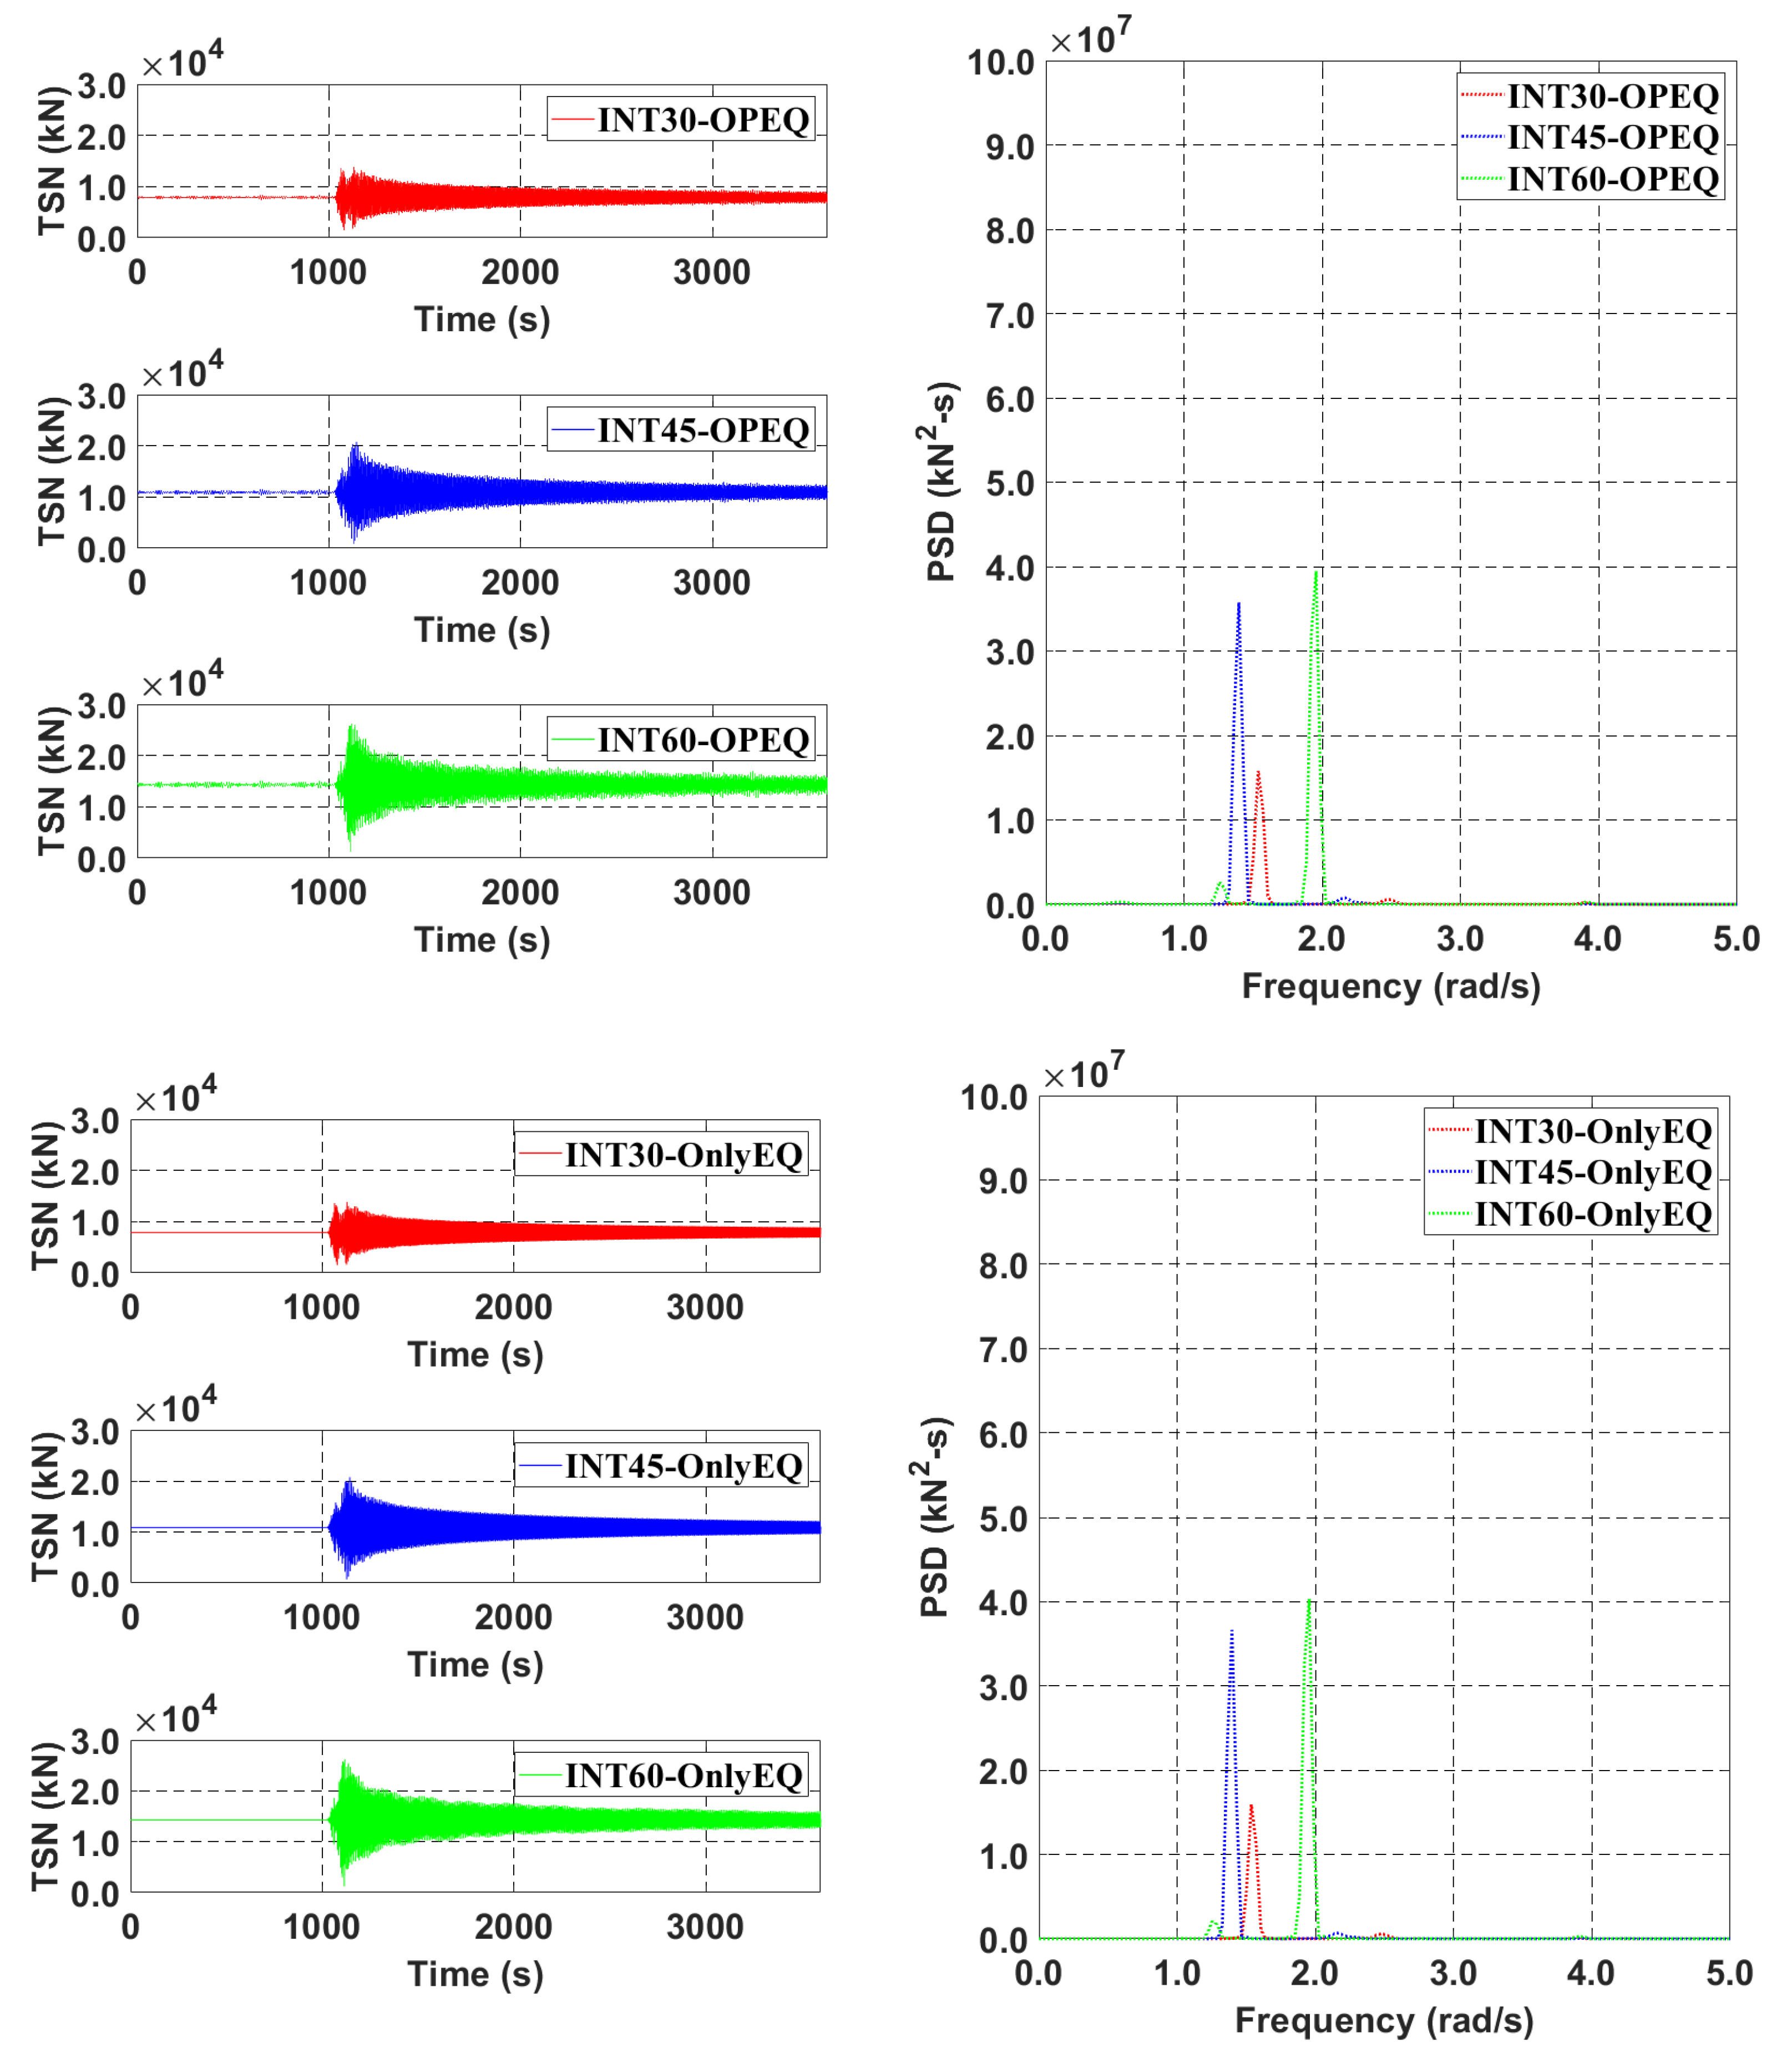
5. Mooring Station Installation Interval Effect
6. Conclusions
Author Contributions
Funding
Institutional Review Board Statement
Informed Consent Statement
Data Availability Statement
Conflicts of Interest
Appendix A. Summary of Statistical Results

| Type | A-Type | ||||||||
| Mooring Interval | 30 m | 45 m | 60 m | ||||||
| Item | Horizontal Motion | Vertical Motion | ML #3 Tension | Horizontal Motion | Vertical Motion | ML #3 Tension | Horizontal Motion | Vertical Motion | ML #3 Tension |
| m | m | kN | m | m | kN | m | m | kN | |
| Max. | 0.0671 | 0.0130 | 10,648.81 | 0.0904 | 0.0189 | 15,021.00 | 0.1185 | 0.0261 | 20,048.75 |
| Min. | −0.0708 | −0.0148 | 5656.23 | −0.0962 | −0.0221 | 8169.78 | −0.1150 | −0.0302 | 10,970.46 |
| Mean | 0.0000 | −0.0001 | 8116.23 | 0.0000 | −0.0001 | 11,656.58 | 0.0000 | −0.0002 | 15,513.68 |
| STD | 0.0198 | 0.0040 | 721.84 | 0.0265 | 0.0058 | 984.79 | 0.0342 | 0.0077 | 1285.96 |
| Type | B-Type | ||||||||
| Mooring Interval | 30 m | 45 m | 60 m | ||||||
| Item | Horizontal Motion | Vertical Motion | ML #3 Tension | Horizontal Motion | Vertical Motion | ML #3 Tension | Horizontal Motion | Vertical Motion | ML #3 Tension |
| m | m | kN | m | m | kN | m | m | kN | |
| Max. | 0.5170 | 0.1906 | 16,870.94 | 0.7101 | 0.2311 | 22,733.26 | 0.8822 | 0.3042 | 28,495.34 |
| Min. | −0.6537 | −0.2738 | 1293.36 | −0.7403 | −0.3035 | 1409.34 | −0.8073 | −0.4087 | 2377.27 |
| Mean | 0.0000 | 0.0004 | 7779.55 | 0.0000 | −0.0009 | 10,487.15 | −0.0001 | −0.0021 | 13,564.82 |
| STD | 0.1306 | 0.0443 | 2010.73 | 0.1693 | 0.0595 | 2741.02 | 0.2181 | 0.0786 | 3607.98 |
| Type | C-Type | ||||||||
| Mooring Interval | 30 m | 45 m | 60 m | ||||||
| Item | Horizontal Motion | Vertical Motion | ML #3 Tension | Horizontal Motion | Vertical Motion | ML #3 Tension | Horizontal Motion | Vertical Motion | ML #3 Tension |
| m | m | kN | m | m | kN | m | m | kN | |
| Max. | 0.1838 | 0.0490 | 12,189.47 | 0.2600 | 0.0671 | 16,919.03 | 0.3370 | 0.0863 | 22,249.23 |
| Min. | −0.1848 | −0.0624 | 4084.07 | −0.2599 | −0.0836 | 5458.68 | −0.3247 | −0.1115 | 7000.06 |
| Mean | 0.0000 | −0.0003 | 7905.31 | 0.0000 | −0.0005 | 10,927.20 | 0.0000 | −0.0007 | 14,326.68 |
| STD | 0.0517 | 0.0147 | 1144.03 | 0.0685 | 0.0203 | 1548.11 | 0.0900 | 0.0268 | 2046.23 |
| Type | A-Type | ||||||||
| Mooring Interval | 30 m | 45 m | 60 m | ||||||
| Item | Horizontal Motion | Vertical Motion | ML #3 Tension | Horizontal Motion | Vertical Motion | ML #3 Tension | Horizontal Motion | Vertical Motion | ML #3 Tension |
| m | m | kN | m | m | kN | m | m | kN | |
| Max. | 0.1744 | 0.1133 | 17,291.76 | 0.1356 | 0.2544 | 24,629.90 | 0.2307 | 0.2660 | 31,509.47 |
| Min. | −0.1701 | −0.1153 | 10.21 | −0.1345 | −0.2273 | 16.15 | −0.2341 | −0.2530 | 21.59 |
| Mean | 0.0000 | 0.0001 | 8109.86 | 0.0000 | 0.0001 | 11,646.08 | 0.0000 | 0.0001 | 15,502.02 |
| STD | 0.0298 | 0.0085 | 1115.83 | 0.0140 | 0.0310 | 1959.88 | 0.0529 | 0.0318 | 2683.83 |
| Type | B-Type | ||||||||
| Mooring Interval | 30 m | 45 m | 60 m | ||||||
| Item | Horizontal Motion | Vertical Motion | ML #3 Tension | Horizontal Motion | Vertical Motion | ML #3 Tension | Horizontal Motion | Vertical Motion | ML #3 Tension |
| m | m | kN | m | m | kN | m | m | kN | |
| Max. | 0.2788 | 0.1836 | 13,895.45 | 0.2565 | 0.2163 | 16,056.17 | 0.3032 | 0.2734 | 21,351.29 |
| Min. | −0.2455 | −0.1517 | 2411.62 | −0.2007 | −0.1953 | 4141.90 | −0.3425 | −0.2503 | 4929.63 |
| Mean | 0.0000 | 0.0003 | 7739.02 | 0.0000 | 0.0001 | 10,438.30 | 0.0000 | 0.0001 | 13,494.08 |
| STD | 0.0523 | 0.0118 | 765.20 | 0.0375 | 0.0184 | 682.91 | 0.0413 | 0.0367 | 1068.40 |
| Type | C-Type | ||||||||
| Mooring Interval | 30 m | 45 m | 60 m | ||||||
| Item | Horizontal Motion | Vertical Motion | ML #3 Tension | Horizontal Motion | Vertical Motion | ML #3 Tension | Horizontal Motion | Vertical Motion | ML #3 Tension |
| m | m | kN | m | m | kN | m | m | kN | |
| Max. | 0.2738 | 0.1667 | 13,817.47 | 0.4022 | 0.1625 | 20,680.71 | 0.2229 | 0.3291 | 26,142.16 |
| Min. | −0.2724 | −0.1487 | 1501.24 | −0.3877 | −0.1502 | 812.12 | −0.1812 | −0.3119 | 1316.54 |
| Mean | 0.0000 | 0.0003 | 7890.84 | 0.0000 | 0.0002 | 10,905.37 | 0.0000 | 0.0002 | 14,296.01 |
| STD | 0.0559 | 0.0095 | 1142.12 | 0.0809 | 0.0113 | 1660.16 | 0.0263 | 0.0500 | 1838.12 |
References
- Paik, I.Y.; Oh, C.K.; Kwon, J.S.; Chang, S.P. Analysis of wave force induced dynamic response of submerged floating tunnel. KSCE J. Civ. Eng. 2004, 8, 543–550. [Google Scholar] [CrossRef]
- Ge, F.; Lu, W.; Wu, X.; Hong, Y. Fluid-structure interaction of submerged floating tunnel in wave field. Procedia Eng. 2010, 4, 263–271. [Google Scholar] [CrossRef]
- Di Pilato, M.; Perotti, F.; Fogazzi, P. 3D dynamic response of submerged floating tunnels under seismic and hydrodynamic excitation. Eng. Struct. 2008, 30, 268–281. [Google Scholar] [CrossRef]
- Long, X.; Ge, F.; Wang, L.; Hong, Y. Effects of fundamental structure parameters on dynamic responses of submerged floating tunnel under hydrodynamic loads. Acta Mech. Sin. 2009, 25, 335–344. [Google Scholar] [CrossRef]
- Cifuentes, C.; Kim, S.; Kim, M.; Park, W. Numerical simulation of the coupled dynamic response of a submerged floating tunnel with mooring lines in regular waves. Ocean Syst. Eng. 2015, 5, 109–123. [Google Scholar] [CrossRef]
- Lu, W.; Ge, F.; Wang, L.; Wu, X.; Hong, Y. On the slack phenomena and snap force in tethers of submerged floating tunnels under wave conditions. Mar. Struct. 2011, 24, 358–376. [Google Scholar] [CrossRef]
- Ghimire, A.; Prakash, O. Intangible study for the design and construction of submerged floating tunnel. Imp. J. Interdiscip. Res 2017, 3, 721–724. [Google Scholar]
- Deng, S.; Ren, H.; Xu, Y.; Fu, S.; Moan, T.; Gao, Z. Experimental study of vortex-induced vibration of a twin-tube submerged floating tunnel segment model. J. Fluids Struct. 2020, 94, 102908. [Google Scholar] [CrossRef]
- Chen, Z.; Xiang, Y.; Lin, H.; Yang, Y. Coupled vibration analysis of submerged floating tunnel system in wave and current. Appl. Sci. 2018, 8, 1311. [Google Scholar] [CrossRef]
- Jin, C.; Kim, G.-J.; Kim, S.-J.; Kim, M.; Kwak, H.-G. Discrete-module-beam-based hydro-elasticity simulations for moored submerged floating tunnel under regular and random wave excitations. Eng. Struct. 2023, 275, 115198. [Google Scholar] [CrossRef]
- Marco, Z.; Giuseppe, C.P.; Giuseppe, T.; Marco, S. On the influence of shallow underground structures in the evaluation of the seismic signals. Ing. Sismica 2021, 38, 23–35. [Google Scholar]
- Muhammad, N.; Ullah, Z.; Choi, D.-H. Performance evaluation of submerged floating tunnel subjected to hydrodynamic and seismic excitations. Appl. Sci. 2017, 7, 1122. [Google Scholar] [CrossRef]
- Jin, C.; Kim, M. Dynamic and structural responses of a submerged floating tunnel under extreme wave conditions. Ocean Syst. Eng. 2017, 7, 413–433. [Google Scholar]
- Indridason, B. Earthquake Induced Behavior of Submerged Floating Tunnels with Tension Leg Anchorage; Institutt for Konstruksjonsteknikk: Trondheim, Norway, 2013. [Google Scholar]
- Luoa, G.; Chen, J.; Zhou, X. Effects of various factors on the VIV-induced fatigue damage in the cable of submerged floating tunnel. Pol. Marit. Res. 2015, 22, 76–83. [Google Scholar] [CrossRef]
- Kunisu, H.; Mizuno, S.; Mizuno, Y.; Saeki, H. Study on submerged floating tunnel characteristics under the wave condition. In Proceedings of the Fourth International Offshore and Polar Engineering Conference, Osaka, Japan, 10–15 April 1994. [Google Scholar]
- Kunisu, H. Evaluation of wave force acting on Submerged Floating Tunnels. Procedia Eng. 2010, 4, 99–105. [Google Scholar] [CrossRef]
- Oh, S.-H.; Park, W.S.; Jang, S.-C.; Kim, D.H. Investigation on the behavioral and hydrodynamic characteristics of submerged floating tunnel based on regular wave experiments. KSCE J. Civ. Environ. Eng. Res. 2013, 33, 1887–1895. [Google Scholar] [CrossRef]
- Seo, S.-i.; Mun, H.-s.; Lee, J.-h.; Kim, J.-h. Simplified analysis for estimation of the behavior of a submerged floating tunnel in waves and experimental verification. Mar. Struct. 2015, 44, 142–158. [Google Scholar] [CrossRef]
- Li, Q.; Jiang, S.; Chen, X. Experiment on pressure characteristics of submerged floating tunnel with different section types under wave condition. Pol. Marit. Res. 2018, 25, 54–60. [Google Scholar] [CrossRef]
- Yang, Z.; Li, J.; Zhang, H.; Yuan, C.; Yang, H. Experimental study on 2D motion characteristics of submerged floating tunnel in waves. J. Mar. Sci. Eng. 2020, 8, 123. [Google Scholar] [CrossRef]
- Oh, S.-H.; Park, W.S.; Jang, S.-C.; Kim, D.H.; An, H.D. Physical experiments on the hydrodynamic response of submerged floating tunnel against the wave action. In Proceedings of the 7th International Conference on Asian and Pacific Coasts, APAC 2013, Bali, Indonesia, 24–26 September 2013; pp. 582–587. [Google Scholar]
- Chung, W.C.; Jin, C.; Kim, M.; Hwang, J.-y. Comparison Study and Forensic Analysis between Experiment and Coupled Dynamics Simulation for Submerged Floating Tunnel Segment with Free Ends under Wave Excitations. CMES-Comput. Model. Eng. Sci. 2023, 136, 413–433. [Google Scholar] [CrossRef]
- Zhang, H.; Yang, Z.; Li, J.; Yuan, C.; Xie, M.; Yang, H.; Yin, H. A global review for the hydrodynamic response investigation method of submerged floating tunnels. Ocean Eng. 2021, 225, 108825. [Google Scholar] [CrossRef]
- Xu, W.; Ma, Y.; Liu, G.; Li, M.; Li, A.; Jia, M.; He, Z.; Du, Z. A review of research on tether-type submerged floating tunnels. Appl. Ocean Res. 2023, 134, 103525. [Google Scholar] [CrossRef]
- Won, D.; Park, W.-S.; Kang, Y.J.; Kim, S. Dynamic behavior of the submerged floating tunnel moored by inclined tethers attached to fixed towers. Ocean Eng. 2021, 237, 109663. [Google Scholar] [CrossRef]
- Fitriyah, D.K.; Suswanto, B.; Wahyuni, E. Analysis mooring system configuration of submerged floating tunnel. IPTEK J. Proc. Series 2017, 3, 116–119. [Google Scholar] [CrossRef]
- Jin, C.; Kim, M. The effect of key design parameters on the global performance of submerged floating tunnel under target wave and earthquake excitations. Comput. Model. Eng. Sci. 2021, 128, 315–337. [Google Scholar] [CrossRef]
- Al Atik, L.; Abrahamson, N. An improved method for nonstationary spectral matching. Earthq. Spectra 2010, 26, 601–617. [Google Scholar] [CrossRef]
- Sun, Z.-Z.; Bi, C.-W.; Zhao, S.-X.; Dong, G.-H.; Yu, H.-F. Experimental analysis on dynamic responses of an electrical platform for an offshore wind farm under earthquake load. J. Mar. Sci. Eng. 2019, 7, 279. [Google Scholar] [CrossRef]
- Zhao, S.-X.; Bi, C.-W.; Sun, Z.-Z. Engineering analysis of the dynamic characteristics of an electrical jacket platform of an offshore wind farm under seismic loads. Appl. Ocean Res. 2021, 112, 102692. [Google Scholar] [CrossRef]
- Orcina, L. OrcaFlex User Manual, Version 11.0 d; Orcina: Ulverston, UK, 2020. [Google Scholar]
- Longridge, J.; Randall, R.; Zhang, J. Comparison of experimental irregular water wave elevation and kinematic data with new hybrid wave model predictions. Ocean Eng. 1996, 23, 277–307. [Google Scholar] [CrossRef]
- Jin, C.; Kim, M.-H. Time-domain hydro-elastic analysis of a SFT (submerged floating tunnel) with mooring lines under extreme wave and seismic excitations. Appl. Sci. 2018, 8, 2386. [Google Scholar] [CrossRef]


| Main Tunnel | ||||||
|---|---|---|---|---|---|---|
| BWR | Length | OD | Bending Stiffness | Axial Stiffness | Young’s Modulus | Minimum Submerged Depth |
| [-] | m | m | N-m2 | N | N/m2 | m |
| 1.3 | 700 | 20 | 1.34 | 3.23 | 3.0 | 61.5 |
| Mooring Chain Properties | |||
|---|---|---|---|
| Bar Diameter | Type | Density | Axial Stiffness |
| m | [-] | ton/m3 | N |
| 0.18 | Studless Chain | 0.645 | 2.77 |
| Extreme Wave (100 Y Return) | Extreme Earthquake (200 Y Return) | Extreme Earthquake with Operating Wave | |
|---|---|---|---|
| Hs(m) | 11.70 | [-] | 2.00 |
| Tp(s, rad/s) | 13.0, 0.483 | [-] | 11.0, 0.571 |
| Gamma | 2.14 | [-] | 2.14 |
| Earthquake | [-] | 200 y S5 | 200 y S5 |
| Type | Submerged Depth | Mooring Line Length | |
|---|---|---|---|
| Long | Short | ||
| m | m | m | |
| A-type | −111.5 | 50.23 | 38.68 |
| B-type | −61.5 | 107.965 | 96.417 |
| Type | Wet Natural Frequency (rad/s) | |||
|---|---|---|---|---|
| Horizontal Mode | Vertical Mode | |||
| 1st | 2nd | 1st | 2nd | |
| A-type | 1.92 | 2.42 | 3.06 | 3.11 |
| B-type | 1.34 | 2.04 | 2.15 | 2.43 |
| Submerged Depth | Mooring Line Length | ||
|---|---|---|---|
| Long | Short | ||
| m | m | m | |
| C-type | −86.5 | 79.097 | 67.550 |
| Station Interval (m) | Wet Natural Frequency (rad/s) | |||
|---|---|---|---|---|
| Horizontal | Vertical | |||
| 1st | 2nd | 1st | 2nd | |
| 30 | 1.55 | 2.24 | 2.43 | 2.70 |
| 45 | 1.39 | 2.26 | 2.19 | 2.77 |
| 60 | 1.27 | 2.19 | 1.95 | 2.62 |
Disclaimer/Publisher’s Note: The statements, opinions and data contained in all publications are solely those of the individual author(s) and contributor(s) and not of MDPI and/or the editor(s). MDPI and/or the editor(s) disclaim responsibility for any injury to people or property resulting from any ideas, methods, instructions or products referred to in the content. |
© 2023 by the authors. Licensee MDPI, Basel, Switzerland. This article is an open access article distributed under the terms and conditions of the Creative Commons Attribution (CC BY) license (https://creativecommons.org/licenses/by/4.0/).
Share and Cite
Chung, W.C.; Jin, C.; Kim, M.; Kim, S. Parametric Study on Mooring System Design of Submerged Floating Tunnel under Extreme Wave and Seismic Excitation. J. Mar. Sci. Eng. 2023, 11, 2357. https://doi.org/10.3390/jmse11122357
Chung WC, Jin C, Kim M, Kim S. Parametric Study on Mooring System Design of Submerged Floating Tunnel under Extreme Wave and Seismic Excitation. Journal of Marine Science and Engineering. 2023; 11(12):2357. https://doi.org/10.3390/jmse11122357
Chicago/Turabian StyleChung, Woo Chul, Chungkuk Jin, MooHyun Kim, and Sewon Kim. 2023. "Parametric Study on Mooring System Design of Submerged Floating Tunnel under Extreme Wave and Seismic Excitation" Journal of Marine Science and Engineering 11, no. 12: 2357. https://doi.org/10.3390/jmse11122357