Article

The Impact of IMTA on the Spatial and Temporal Distribution of the Surface Planktonic Bacteria Community in the Surrounding Sea Area of Xiasanhengshan Island of the East China Sea

1
Water Environment and Ecology Engineering Research Center, Shanghai Institution of Higher Education, Shanghai Ocean University, Shanghai 201306, China
2
Shanghai Engineering Research Center of River and Lake Biochain Construction and Resource Utilization, Shanghai 201702, China
3
College of Marine Ecology and Environment, Shanghai Ocean University, Shanghai 201306, China
*
Authors to whom correspondence should be addressed.
These authors contributed equally to this work.
J. Mar. Sci. Eng. 2023, 11(3), 476; https://doi.org/10.3390/jmse11030476
Submission received: 13 January 2023 / Revised: 19 February 2023 / Accepted: 20 February 2023 / Published: 23 February 2023
(This article belongs to the Section Marine Aquaculture)

Abstract

:
The growing world population has produced an increasing demand for seafood, and the aquaculture industry is under corresponding pressure to fill this demand. The offshore ecology and environment are under significant threat with the continuous expansion of the scale and intensity of aquaculture. Integrated multi-tropic aquaculture (IMTA) is a healthy and sustainable mariculture model based on ecosystem-level management, and has become popular in recent years. It is an effective way to cope with the significant changes in offshore ecosystems under multiple stressors. Phytoplankton bacteria are essential to maintaining the marine ecosystem’s balance and stability. Investigating the changes in the community structure of marine planktonic bacteria can elucidate the impact of mariculture on the marine ecological environment. This study took the fish-shell IMTA system with natural macroalgae nearby as the object, and monitored the plankton community’s structure in the system’s surface seawater for four quarters from July 2020 to April 2021. The space–time distribution characteristics and influencing factors of the plankton community in the surface water were examined. The results showed no significant difference between the planktonic bacterial communities at different sampling sites. There was also no significant difference in the α-diversity index. However, the dominant species and abundance of planktonic bacteria at the sampling sites differed significantly. Proteobacteria and Bacteroides were the dominant groups of planktonic bacteria. The results of the distance-based redundancy analysis demonstrated that chemical oxygen demand, chlorophyll a, and dissolved oxygen constituted the primary environmental factors affecting the planktonic bacterial community structures. The heatmap also showed that NH4+- N, temperature, and salinity levels were also related to certain planktonic bacteria. This study preliminarily identified the distribution of the surface bacterial plankton community and its response to changes in environmental factors in the sea area near Xiasanhengshan Island. The results provide a preliminary basis for assessing the health and stability of the IMTA system in open sea areas.

1. Introduction

Fishery resources have decreased markedly in recent years due to climate change, overfishing, habitat destruction, and marine pollution [1,2]. Aquaculture is a vital marine industry with substantial added-value, and provides high-quality marine products globally [3]. The output of Chinese aquaculture has exceeded over 2/3 of the world’s aggregate output. However, when aquaculture activities are carried out in open sea areas, inappropriate aquaculture structures will cause aquaculture waste to be discharged into the open sea, becoming a major source of marine pollution [2,4,5]. The integrated multi-trophic aquaculture (IMTA) model is a recently proposed healthy and sustainable mariculture concept based on ecosystem-level management [2,6,7]. The IMTA system comprises feeding animals, filter-feeding shellfish, macroalgae, sediment-feeding animals, and other organisms of different trophic levels [7,8,9,10]. Through species combinations of different niches, aquaculture waste generated in the production process can be fully utilized [2,5,7,9,10,11].
Microbes are susceptible to the environment and are important environmental indicator organisms [12]. As a consequence, marine microorganisms constitute essential research objects of marine environment bioremediation [13,14]. Extant literature demonstrated that marine bacteria, the dominant group of marine microorganisms, played a key role in the material cycle of offshore ecosystems [13,15]. Many studies have shown that microorganisms serve critical ecological functions as a whole in the form of a community, and community response can comprehensively reflect environmental disturbance [16]. For example, a microbial community structure can rapidly respond to changes in water temperature, pH value, dissolved oxygen, ammonia nitrogen, phosphate, total organic carbon, chemical oxygen demand, and other factors [17,18]. It has also been reported that changes in the microbial community structure in mariculture can indicate the impact of mariculture on marine ecological environments [13,19,20]. Therefore, in offshore aquaculture ecosystems, the community structure and diversity of planktonic bacteria may be critical indicators to assess the health and stability of aquaculture ecosystems.
Xiasanhengshan Island is located in the central sea area of the Shengsi Archipelago of the Zhoushan Islands in the East China Sea. The island is dominated by rocks, and has an area of approximately 0.54 km2 [21]. Since 2016, farmers have cultivated Acanthopagrus schlegelii, Larimichthys crocea, and Mytilus coruscus in the waters near the island. Many macroalgae grow in the intertidal zone of the island, fish culture cages, and shellfish culture rafts. Based on sustainable mariculture, this study built the IMTA system that combined fish, cultured in cages, and mussels, cultured in rafts, and fully utilized the attached macroalgae around the island. We monitored the dynamics and diversity of bacterial communities on the surface of seawater in the four quarters of a year, and explored the impact of changes in the marine environment on microbial communities. By investigating the diversity, structure, and difference of phytoplankton communities in different trophic levels in the IMTA system, we can evaluate the micro-ecological effects of the IMTA system, and thus provide a preliminary basis for evaluating the health and stability of the IMTA system.

2. Materials and Methods

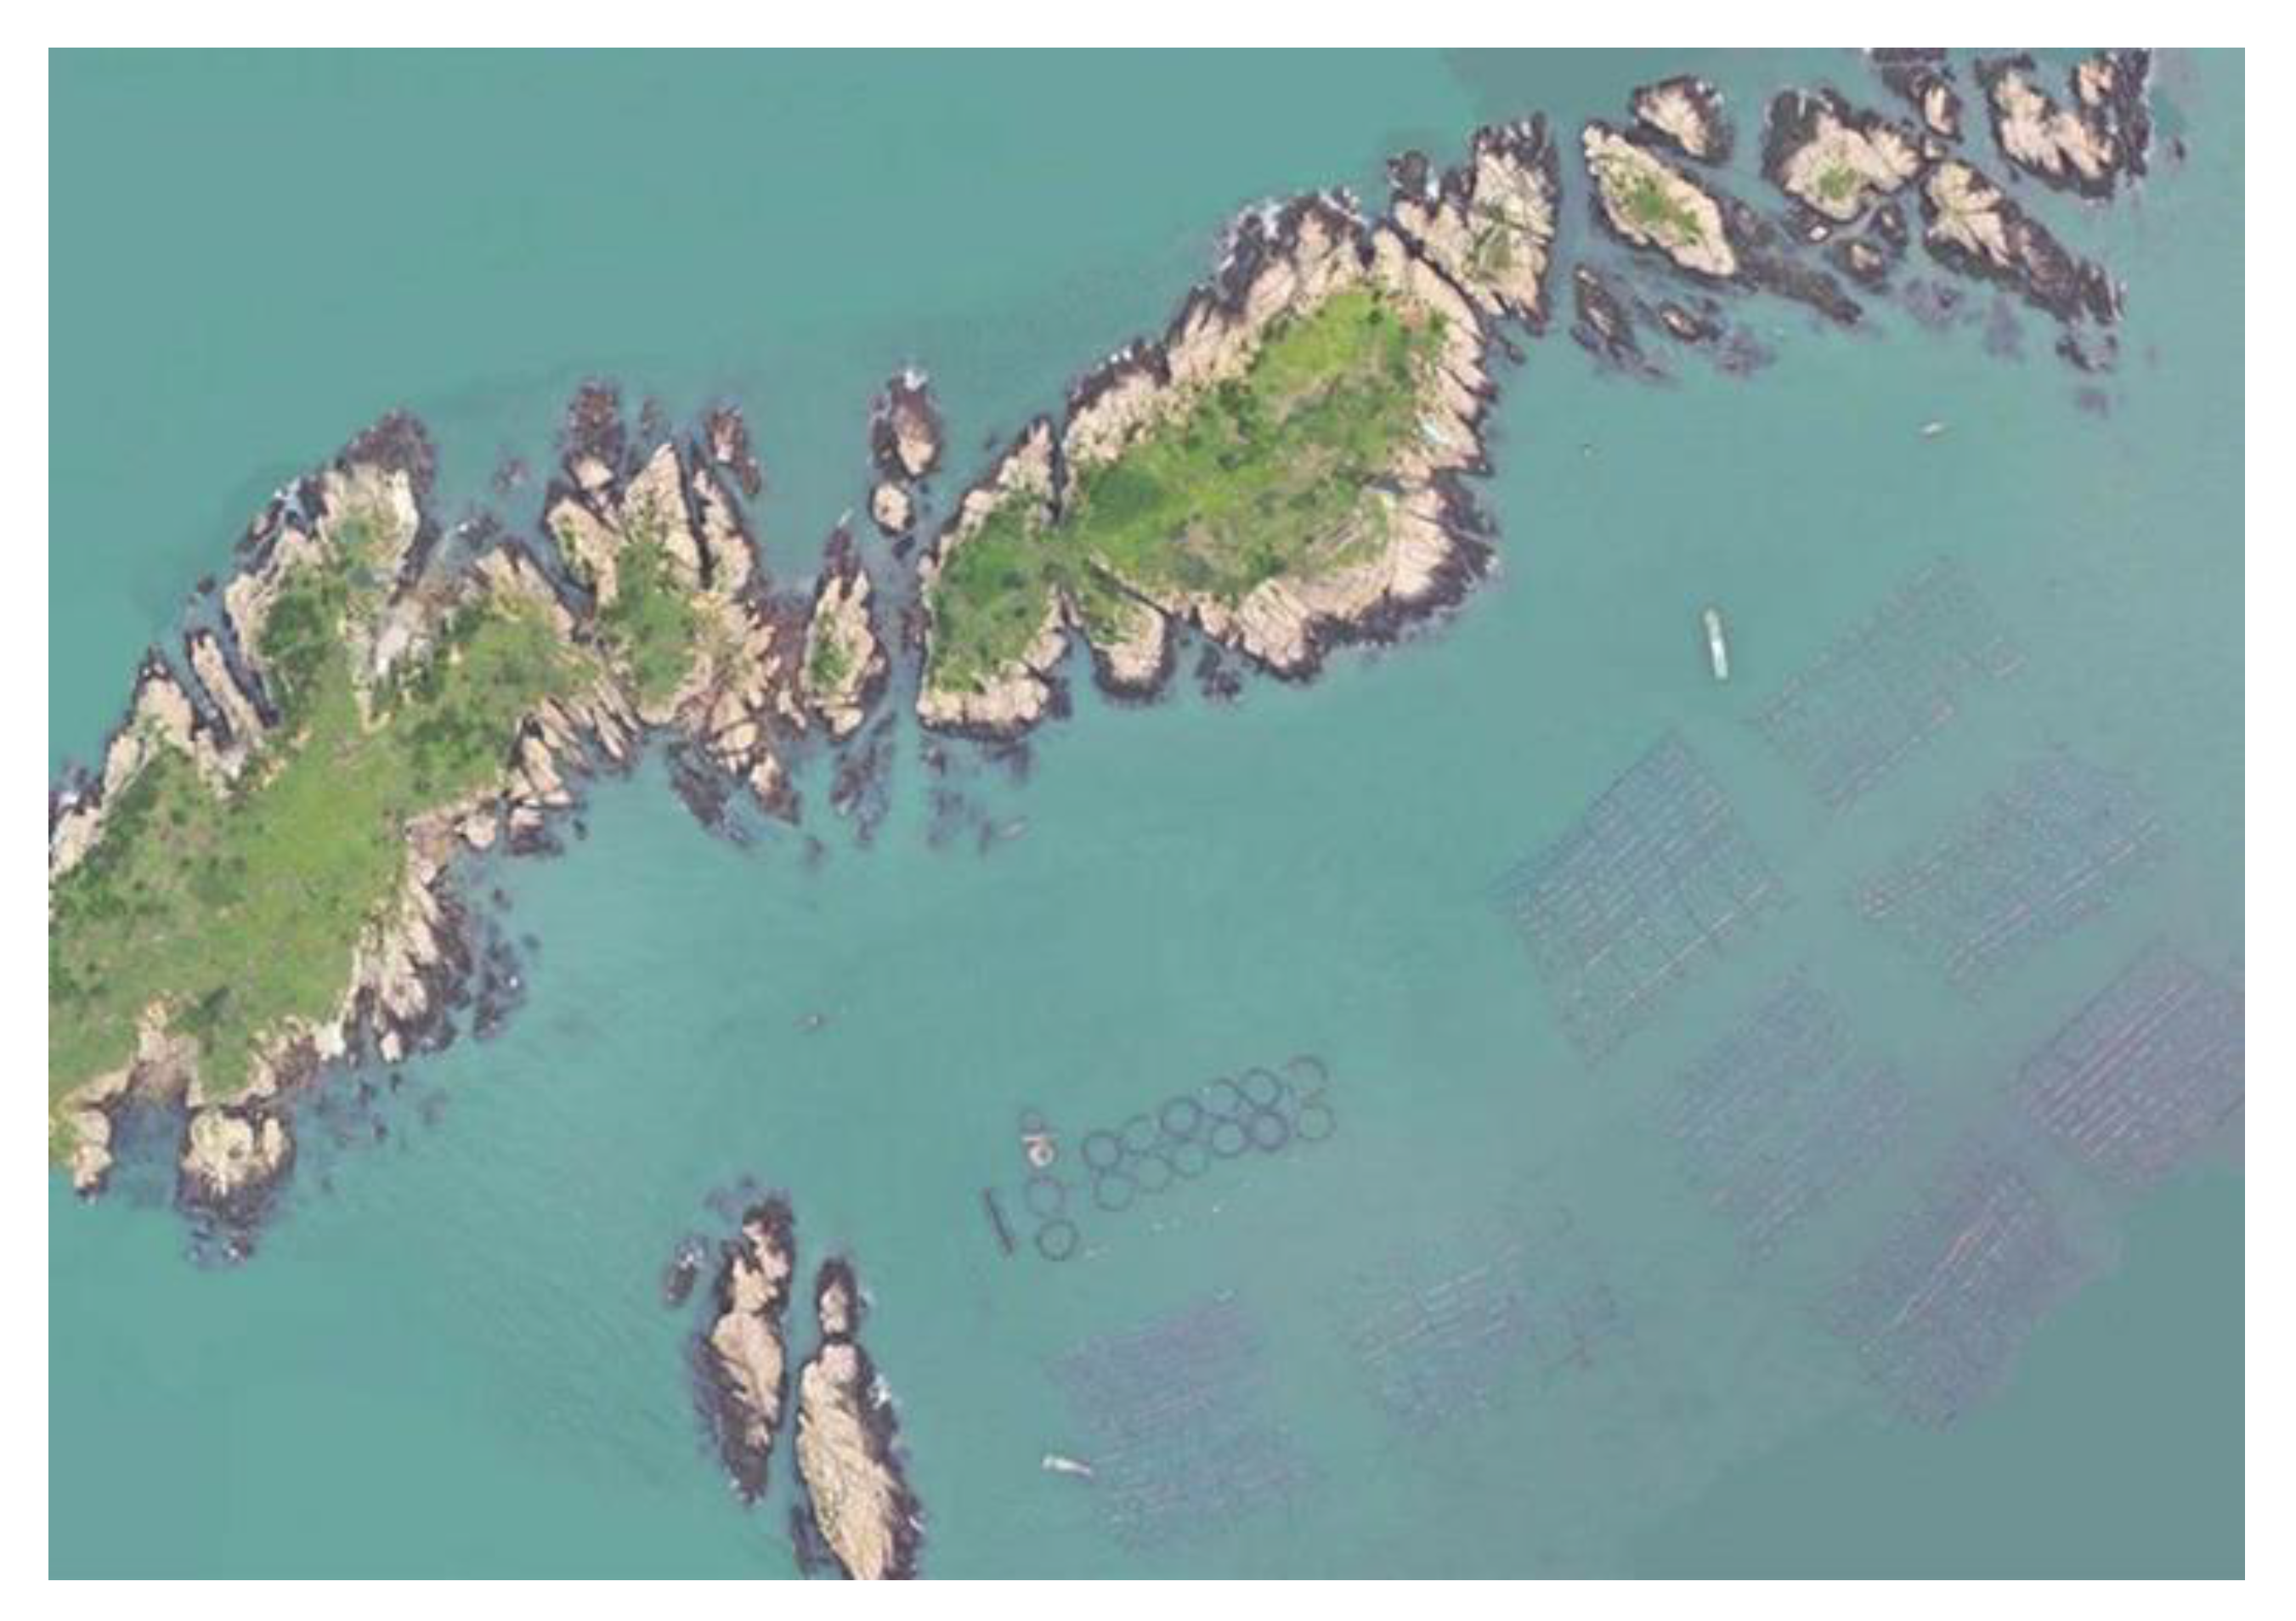
2.1. Study Area Profile and Study Site

In the sea area near Xiasanhengshan Island, the average depth of the sea is 20 m, and the velocity of the surface water is 0.1–0.5 m/s during neap tide and 0.2–0.7 m/s during spring tide. Many macroalgae grow in the rocky intertidal zone around the Xiasanhengshan Island all year, with a distribution area of about 2000 m2, mainly including Phaeophycophyta, Rhodophyta, and Chlorophyta. In 2020–2021, there were 14 fish cages in the sea area (Figure 1 and Figure 2), the diameter of a single cage is 16 m, and the raft culture area of Mytilus coruscus reached 200 mu (Figure 1 and Figure 2).
In this study, the aquaculture area near Xiasanhengshan Island in the East China Sea was sampled in July 2020 (summer), October 2020 (autumn), January 2021 (winter), and April 2021 (spring). The microbial sampling points are indicated in Figure 2, with four sampling points. Specifically: W1 is located near the natural distribution area of macroalgae in the intertidal zone of the island; W2 is located in the middle of the fish culture cage; W3 is located in the shellfish raft culture area; and W4 is the sea area where no aquaculture activities have been carried out, which is approximately 200 m away from the shellfish breeding raft. The obtained data are termed a “season-station.”

2.2. Sample Collection and Processing

A water sampler was used to collect 0.5 L (for the determination of environmental, physical, and chemical properties) and 2.5 L (for DNA extraction and sequencing) of water samples 0.5 m below the sea’s surface. There were three parallel samples at each sampling point. It was collected with sterile plastic bottles, placed in a low-temperature environment, and quickly transported to the laboratory. After fully shaking the water sample, ordinary filter membranes were used to pre-filter it, larger organisms and particles were removed, and then a pore size of 0.22 μM GF/F glass fiber filter membrane was used to filter the water samples. Three parallel samples at each sampling point were mixed into one sample for DNA extraction and sequencing. The entire process was operated under low temperatures. Finally, the filter membrane filtered by microorganisms was placed into a sterile centrifuge tube, and it was stored in a refrigerator at −80 °C for DNA extraction.

2.3. Determination of Environmental Physical and Chemical Properties

The salinity, temperature, dissolved oxygen (DO), and pH of each station were measured on-site. The water samples used to detect the five nutrients, total nitrogen (TN), total phosphorus (TP), chlorophyll a, and chemical oxygen demand (COD) were collected with 500 mL polyethylene bottles and returned to the laboratory for testing. The collection, storage, and monitoring of water quality samples were conducted in accordance with the guidelines of Marine Investigation Part 4: Investigation of Chemical Elements of Seawater and the Specifications for Marine Investigation Part 6: Investigation of Marine Biology. The silicon molybdenum yellow method determined active silicate (SiO32−- Si). Active phosphate (PO43−-P) was determined by the ascorbic acid reduction phosphorus molybdenum blue method, and nitrite (NO2−-N) was determined by the diazo azo method. The zinc cadmium reduction method determined nitrate (NO3−-N). Ammonium salt (NH4+-N) was oxidized by sodium hypobromite. The potassium persulfate oxidation method was employed to identify the concentration of TP and TN, and COD was determined by the alkaline potassium permanganate method. Chlorophyll a was determined by spectrophotometry, and the water quality data were analyzed according to the GB 3097-1997 Sea Water Quality Standard.

2.4. Sequencing Experiment Process

DNA extraction, PCR amplification, and high-throughput sequencing were carried out by the Shanghai Meiji Biomedical Technology Co., Ltd. (Shanghai, China). After genomic DNA was extracted, the integrity of the extracted genomic DNA was detected by 1.0% agarose gel electrophoresis. TransGen AP221-02: TransStart Fastpfu DNA Polymerase, 20 μL reaction system, and the primers used for PCR amplification were also synthesized by the Shanghai Meiji Biological Technology Co., Ltd. The primer design is shown in Table 1. PCR products were detected by 2.0% agarose gel electrophoresis, and then cut and recovered by the Axy Prep DNA gel recovery kit (AXYGE). The PCR products were quantified using the blue fluorescent quantitative system (QuantiFluor ™- ST, Promega Company, Beijing, China), and they were mixed according to the sequencing quantity demand of samples. The final product of PCR was delivered to Shanghai Meiji Biological Technology Company Co., Ltd., for Illumina Miseq sequencing.

2.5. Data Processing and Bioinformatics Analysis

Relevant statistical analysis was carried out on the online cloud platform provided by Shanghai Meiji Biological Technology Co., Ltd. The corresponding number of operational taxons (OTUs) was obtained by high-throughput sequencing. Based on the OTUs, a diversity index analysis was conducted. The original sequencing sequence was controlled and filtered by Trimmatic software. Using Uparse (version 7.0.1090, http://drive5.com/uparse/ (accessed on 24 November 2021)), the OTUs with a similar level of 97% were selected for the statistical analysis of biological information, the illusion in the process of OTU clustering was removed, and an OTU table was generated. The software analyzed the sequence through the RDP Classifier (version 2.11, https://sourceforge.net/projects/rdp-classifier/ (accessed on 24 November 2021)), and the classification confidence threshold was 0.7. SPSS 26.0 was used for the one-way ANOVA. p < 0.05 indicated a significant difference. R3.6.3 was used to analyze the relationship between seawater environmental factors and planktonic bacteria.

3. Results and Analysis

3.1. Fish and Shellfish Culture and Yield in the IMTA System and Macroalgae Distribution of Xiasanhengshan Island

The biomass of macroalgae in the intertidal zone of the islands and reefs in the sea area in the spring, summer, autumn, and winter was 4522 kg, 1339 kg, 1693 kg, and 2195 kg, respectively, and the biomass of macroalgae in the raft was 1733 kg, 1918 kg, 1687 kg, and 807 kg, respectively. The main dominant species of macroalgae were Sargassum thunbergii, Sargassum fusiforme, Ulva lactuca, Grateloupia turuturu, and Laurencia composita. In May 2020, we put 30,000 Larimichthys crocea, about 350 g/tail, 20,000 Acanthopagrus schlegelii, about 100 g/tail, and 50 tons of Mytilus coruscus into the sea. Due to the impact of typhoons and cold currents, by February 2021, approximately 10,000 Larimichthys crocea were harvested, with an average of 750 g/tail, 20,000 Acanthopagrus schlegelii, with an average of 400 g/tail, and the annual yield of Mytilus coruscus was 250 tons. We fed four tons of artificial feed and 15 tons of wild fish during the breeding period.

3.2. Characteristic Analysis of Environmental Factors

Table 2 presents the hydrologic and chemical parameters of Xiasanhengshan Island. The surface water temperature in the sea area followed seasonal variations, fluctuating between 9.62 °C and 25.01 °C, with the highest occurring in summer and the lowest in winter. In addition, there was no significant difference among the four sites in the same season. The average surface salinity in the sea area was 31.03 ± 4.02, with the highest being in winter and the lowest in summer. The average pH value in the sea area was 8.13, with the highest occurring in spring and the lowest in autumn. The average dissolved oxygen in the sea area was 11.15 mg·L−1, with the highest being in winter and the lowest in summer. There is no significant difference between the four points of chlorophyll a concentration in spring seawater. The chl-a’s content was different at four points in summer, which at sum-W3 was 1.087 μ G·L−1, which was 2–3 times higher than other points in the same season. In autumn, the chl-a’s content in seawater W1 was the highest, and W4 was the lowest chl-a content in winter, which had no difference among the four points, with an average of 0.147 μ G·L−1. The average COD in the sea area was 1.36 mg·L−1, with the highest in summer and as high as 3.70 mg·L−1. The COD of the W2 point was the highest of the four points in different seasons, especially in autumn, and its value was twice that of other points. The TN value of different points had no difference only in spring, and differences existed between different points in other seasons. Especially in winter, the TN value of W1 was only 11.5% of W3 and W4. Except for DIP, no significant difference was found in the different times and spaces (p > 0.05). Other water quality indicators exhibited significant seasonal differences.

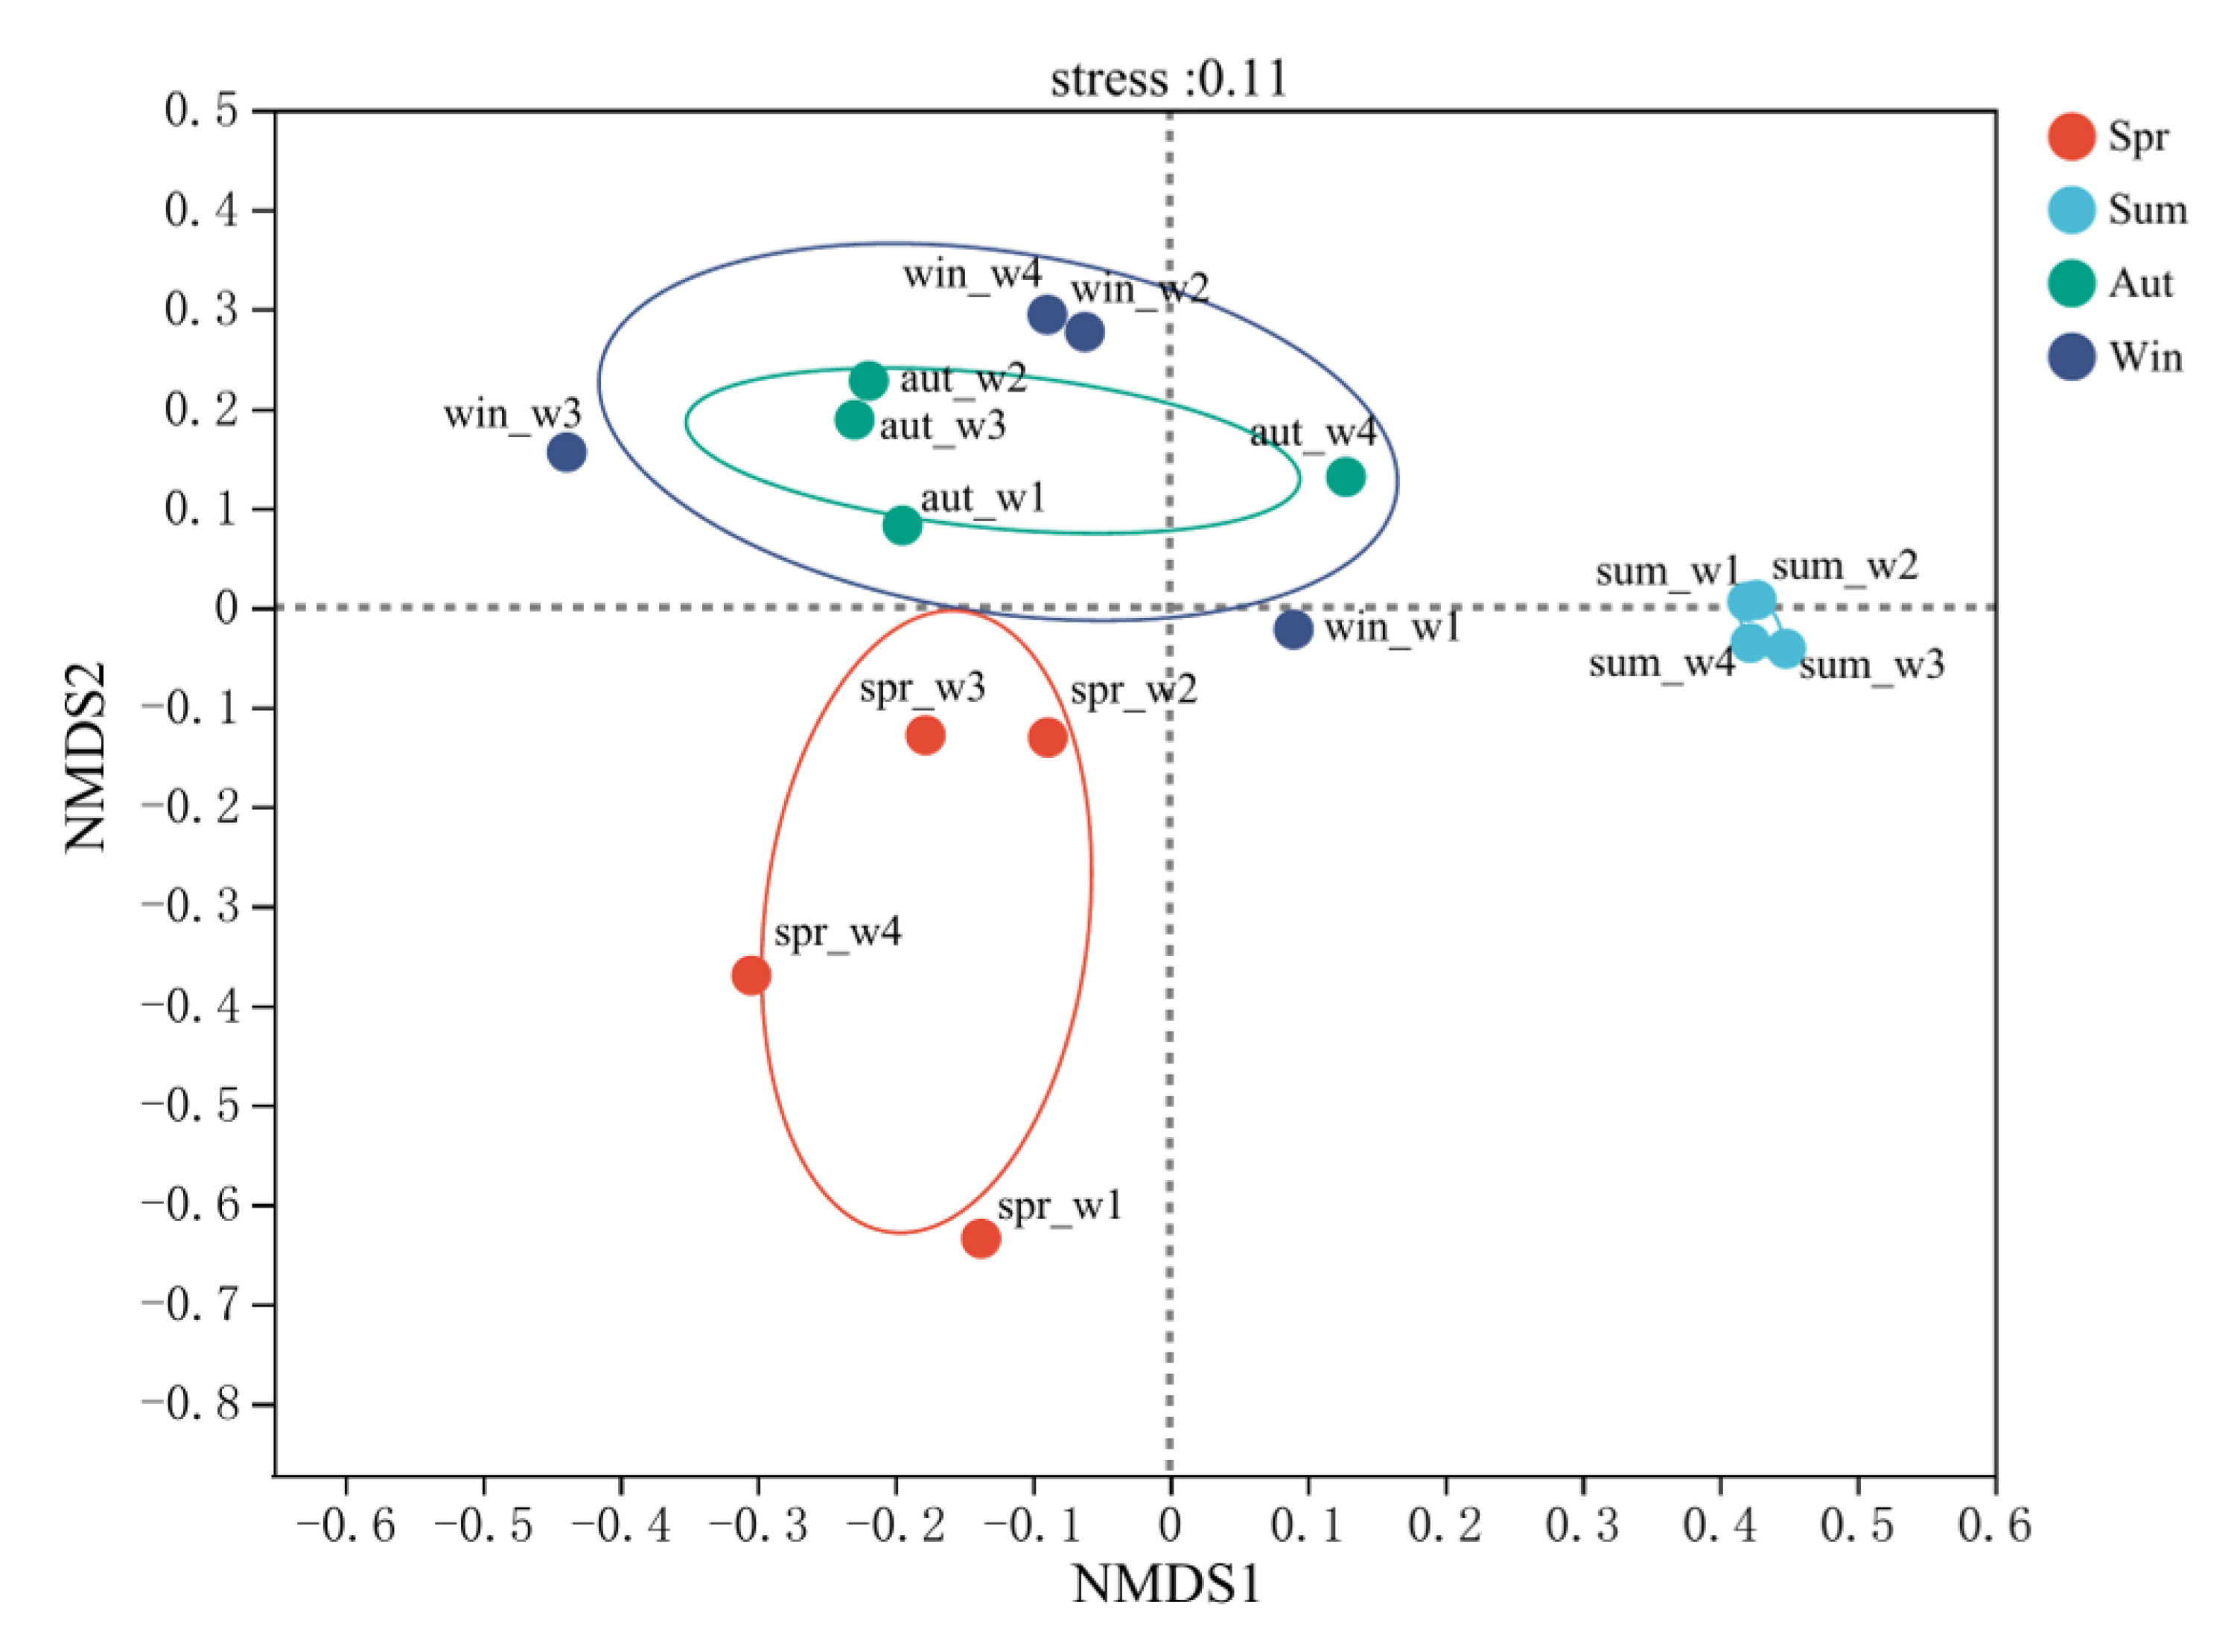
3.3. Diversity Assessment of Planktonic Bacteria

A total of 2313 OTU bacteria of 40 phyla, 93 classes, 238 orders, 387 families, 780 genera, and 1400 species were detected in the study sea area by high-throughput sequencing. As shown in Table 3, the coverage of all samples was more significant than 0.98, indicating that the sample sequencing results can reflect the actual situation of the samples. All samples were grouped by the season and sampling point to be compared. The Shannon index determined the level of microbial species diversity. It can be seen from the Shannon index that the microbial diversity index in autumn was significantly higher than that in spring, summer, and winter. The four points of the Shannon index are similar in summer and autumn. The Shannon index of the W1 point in spring is the lowest among the four points, and W2 is the highest. There is a specific difference between the four points, but no statistically significant difference exists. The Shannon index of win-W3 is the lowest in the same quarter, only 2.749, while the Shannon index of other points in the same quarter is greater than 4. Moreover, there was no significant difference in the diversity index between spring, summer, and winter. The seasonal variation of microbial community evenness was also consistent with that of diversity. The Shannon even index indicates the level of microbial community evenness. Its seasonal variation was as follows: autumn > winter > spring > summer, in which autumn was significantly higher than the other three quarters. The Shannon even index of win-W3 is lower than other points in winter and is the lowest among all Shannon even index data, only 0.4401. According to the ACE index in the table, except that there was no significant difference in the microbial richness index between summer and winter, significant differences were observed in the microbial richness of other seasons, with the highest species richness occurring in autumn and the lowest in spring. The ACE index of spr-W1 is lower than other points in spring, which is also the lowest of all ACE data, only 388.845. The highest value of aut-W4 was 1838.24, while the ACE index at other points in the same quarter was around 1400. The ACE index of win-W3 was the lowest in the same quarter, and there was no apparent difference between the other three points.

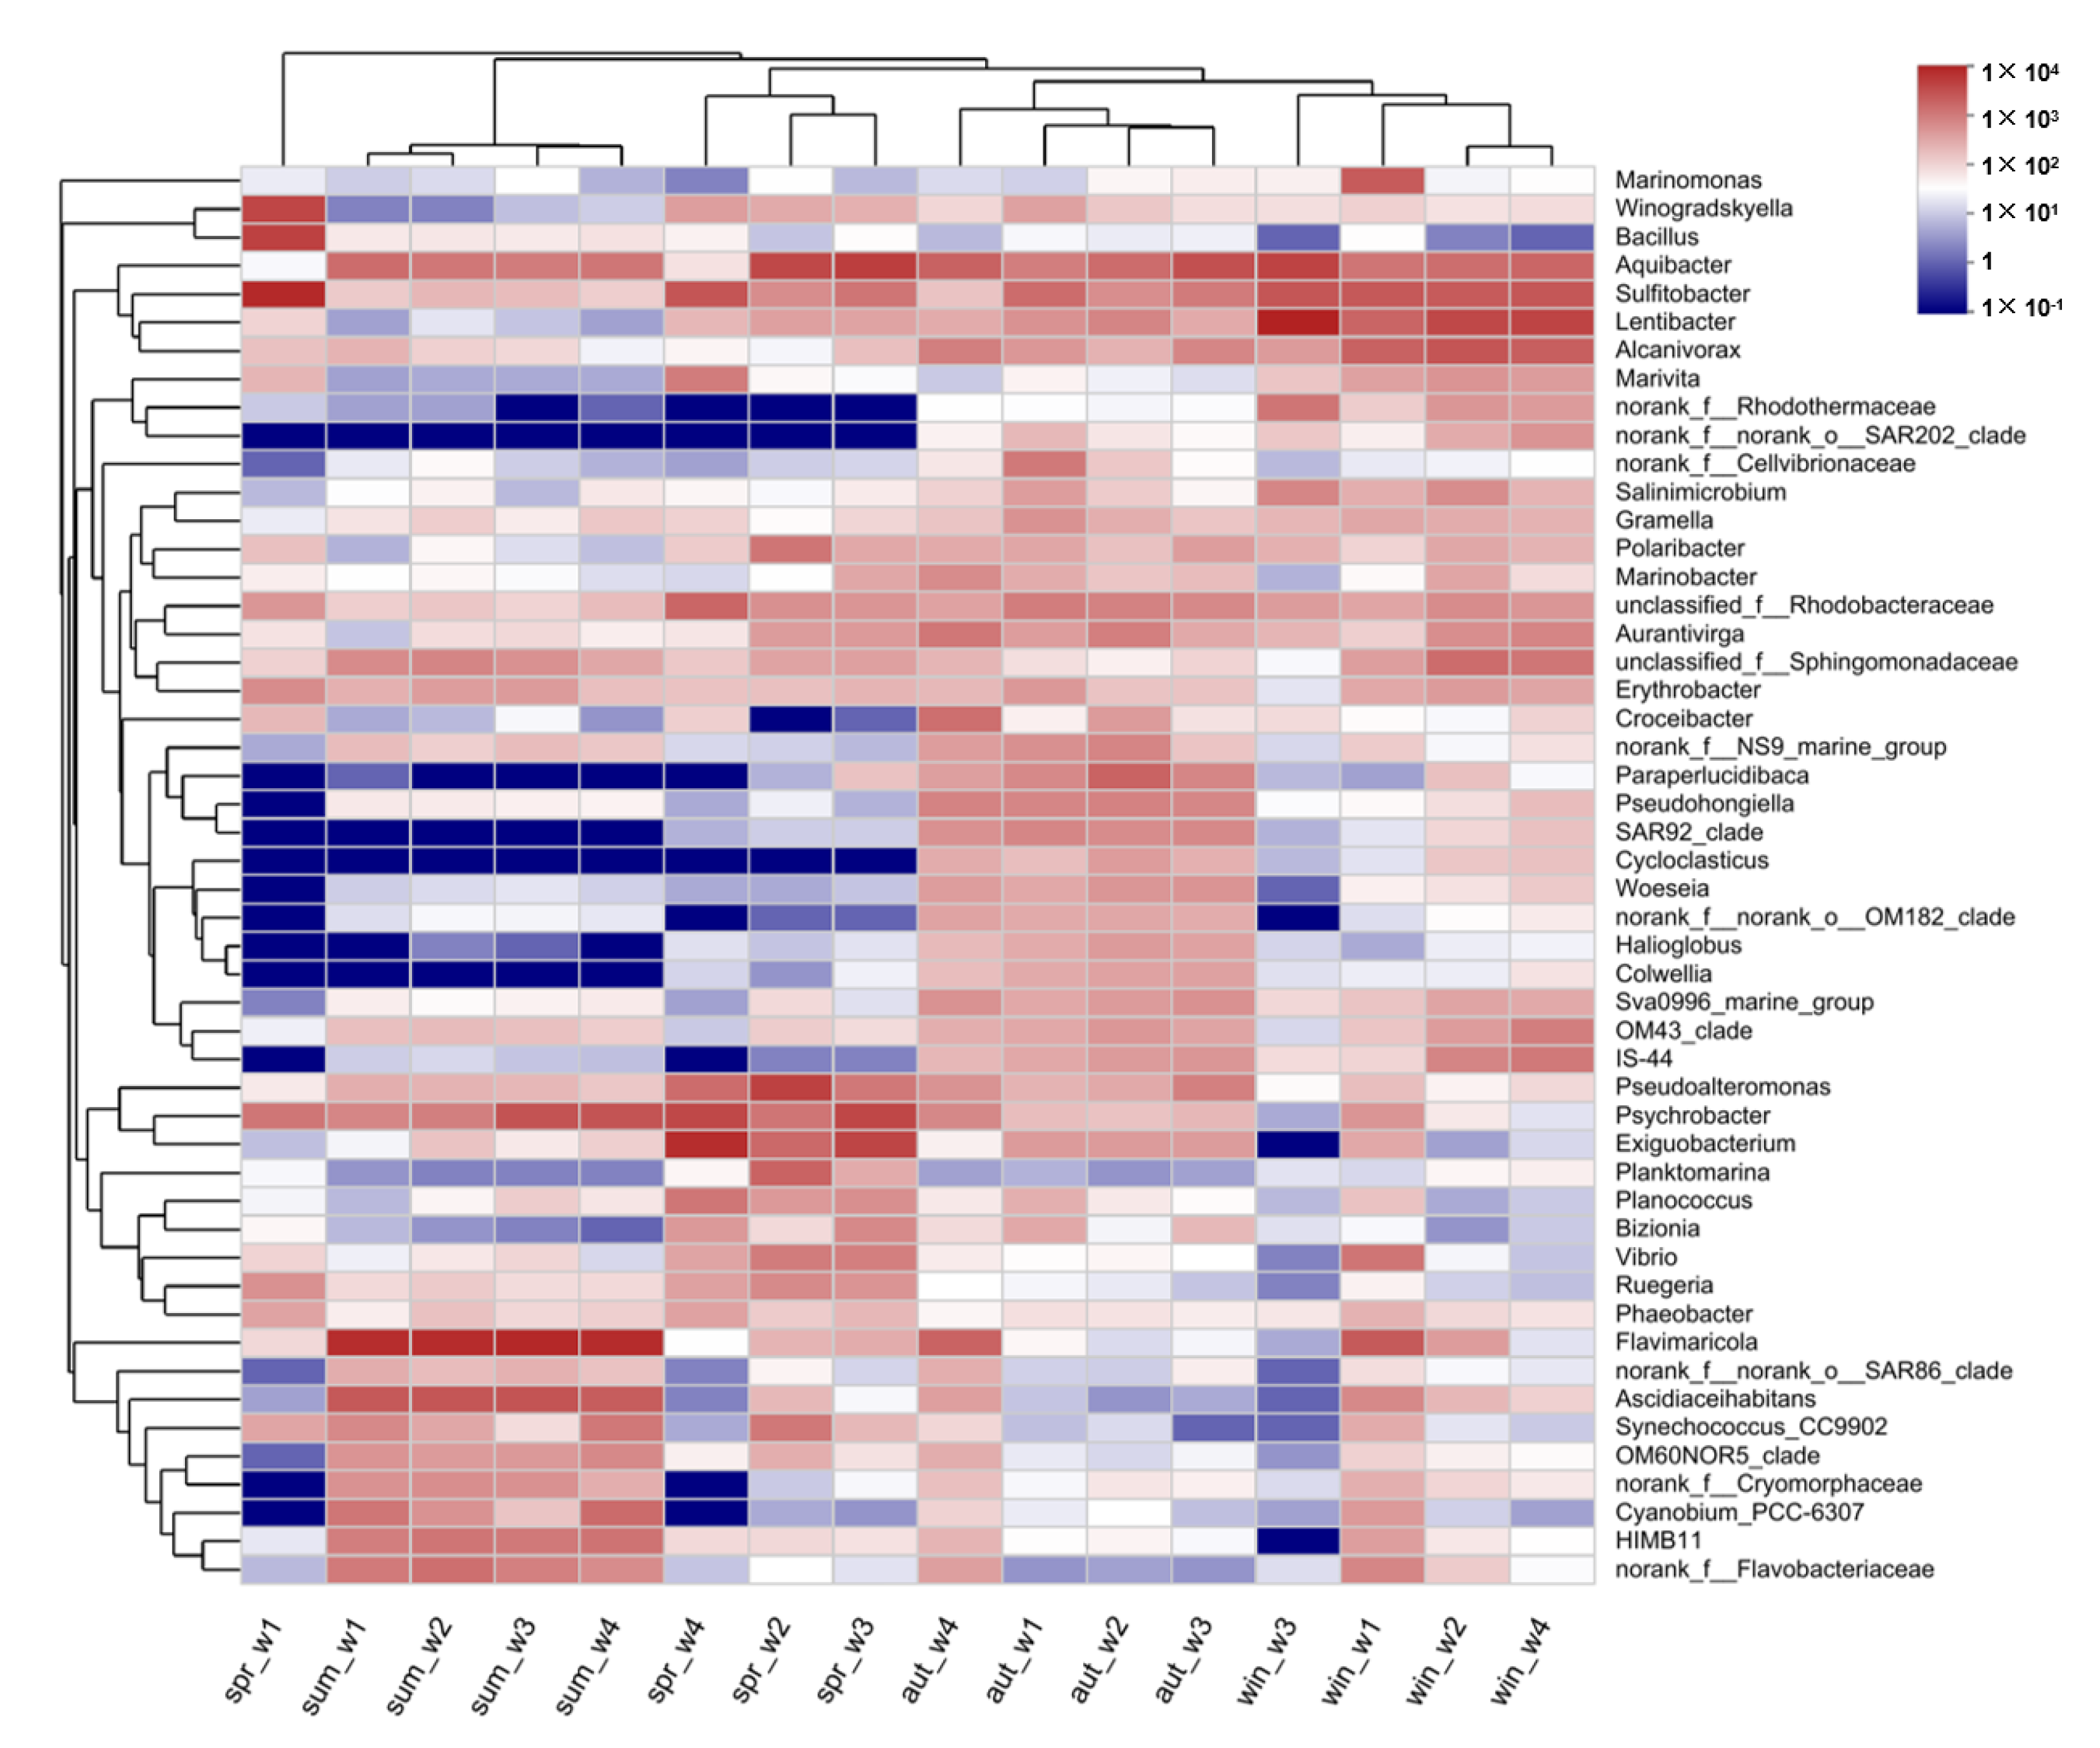
3.4. Species Composition of Planktonic Bacteria Community

According to the results of the taxonomic analysis at the phyla level (Figure 3), there was a notable difference between the seasons, as well as the sampling points. The bacterial sequences in the samples of each experimental group were mainly distributed in 12 species, which were Proteobacteria, Bacteroides, Firmicutes, Cyanobacteria, Actinobacteria, Chloroflexi, Desulfobacterota, Planctomycota, Verrucomicrobiota, Dadabateria, Deinococotota, and Campilobacterota. The first dominant phyla at all sampling points in each season was Proteobacteria, and the second dominant phyla was Bacteroides, except in the spr-W4 sampling point, which was Firmicutes. In spring, the third-dominant phyla at each point was Firmicutes, while in summer, the third-dominant phyla was Cyanobacteria, and in autumn and winter, the third-dominant phyla was Sctinomycetes. As shown in Figure 3, there were marked differences for the species composition and abundance between sampling points.
Figure 4 shows the diversity analysis of planktonic bacteria at the class level, and the dominant classes of planktonic bacteria varied significantly among the seasons and sampling points. In spring, the top three classes with a higher abundance at spr-W2 and spr-W3 were Bacteroidia, Gammaproteobacteria, and Alphaproteobacteria, respectively; whereas, at spr-W1 and spr-W4, the top three classes were Alphaproteobacteria, Gammaproteobacteria, and Bacilli, respectively. In summer, the top three abundance classes of planktonic bacteria were Alphaproteobacteria, Bacteroidia, and Gammaproteobacteria, respectively; whereas, at sum-W1 and sum-W2, the top three abundance classes of planktonic bacteria were Alphaproteobacteria, Gammaproteobacteria, and Bacteroidia. The top three abundance classes in autumn were Gammaproteobacteria, Bacteroidia, and Alphaproteobacteria, respectively. In winter, the top three abundance classes of planktonic bacteria at win-W1, win-W2, and win-W4 were Gammaproteobacteria, Bacteroidia, and Alphaproteobacteria, respectively; whereas, the top three abundance classes of planktonic bacteria at win-W3 were Alphaproteobacteria, Bacteroidia, and Gammaproteobacteria, respectively.
The distribution of all samples at the genus level is shown in Figure 5. Compared with spatial change, the seasonal change of the bacterial community structure was more significant. The difference between the distribution of planktonic bacteria in spr-W1 and other sites was the largest, and the abundance of Sulfitobacter, Bacillus, and Winogradskyella in spr-W1 was high. The distribution of planktonic bacteria in spr-W2 and spr-W3 was similar, and the dominant genera were Aquiibacter and Exobacterium. Exiguobacterium, Psychrobacter, and Sulfitobacter were dominant in spr-W4. The dominant genera of sum-W1 and sum-W2 were the same, including Flavobacterium and Ascidiaceihabitans. The communities of planktonic bacteria in sum-W3 and sum-W4 were similar, and the dominant genera were Flavobacterium and Ascidiaceihabitans. The distribution of planktonic bacteria in aut-W1, aut-W2, and aut-W3 were similar to that in aut-W4, which was different from that in aut-W4; this difference was Flavobacterium. The dominant genera of win-W1 were Sulfibacter, Flavobacterium, and Marinomonas. The distribution of planktonic bacteria in win-W2 and win-W4 were similar. The dominant genera were Lentibacter, Alcanivora, and Sulfibacter. Furthermore, the dominant genera in win-W3 were Lentibacter, Aquiiactor, and Sulfibacter.
NMDS analysis (OTU level) was carried out on the planktonic bacterial communities in the water bodies of the four sampling points (Figure 6). The similarity between the planktonic bacterial communities of the four sampling points in different periods was used to obtain the changes in the structure of the planktonic bacterial communities in the water bodies of the study area. The right side of the NMDS map shows the bacterioplankton community in summer, and the left side shows the bacterioplankton community in spring, autumn, and winter. The structure of the bacterioplankton community in autumn was similar to that in winter. The bacterioplankton community in summer was significantly different from that in other seasons. It can be seen from Figure 5 that, compared with the sampling location, the seasonal change of the bacterial community was more significant. In terms of spatial distribution, the distribution of the four points in spring is relatively scattered, and the special spr-W1 is far away from other points. The distance between the four points in summer is very close, showing a concentrated pattern. Aut-W4 is different from other points in autumn. The distance between win-W2 and win-W4 is very close, while the distance between win-W3 and win-W1 is far. Furthermore, the distance between win-W3 and win-W4 is the farthest in winter. In winter and spring, the distribution of the four points is less close than that in summer, showing a more scattered pattern.

3.5. Analysis of the Species Difference of Planktonic Bacteria in Fish Culture Areas, Shellfish Culture Areas, and Macroalgae Distribution Areas in Four Seasons

Figure 7 shows the number of common and unique planktonic bacterial species OTUs at three points representing the distribution area of macroalgae (W1), fish culture area (W2), and shellfish culture area (W3) in each quarter. It can be seen from the figure that the species diversity of planktonic bacteria at the three sites in four quarters was relatively large. The proportion of endemic species at the three sites ranged from 7.07 to 19.86%, with an average of 12.88%. The proportion of endemic species in winter was the highest (10.93–19.86%), and the lowest was in autumn (8.85–10.10%). The number of common species at the three sites in four seasons was 711 (autumn), 465 (summer), 282 (winter), and 191 (spring). The proportion of common species of planktonic bacteria at the three sites in autumn and summer was relatively high, at 46.62% and 42.70%, respectively. In contrast, the proportion of common species in winter and spring was lower, at 22.49% and 26.09%, respectively. The OTUs of the top three dominant species of endemic species in the fish culture area, shellfish culture area, and macroalgae distribution area is presented in Table 4, with an average proportion of 10.24%. Flavobacterales (OTU1941) accounted for 66.41% of the aut-W3 endemic species.

3.6. Environmental Factors and Their Correlation with Microorganisms

Variance inflation factor (VIF) analysis was used to screen environmental factors and retain ecological factors with small collinearity, including chl-a, COD, DO, TN, TP, SiO32−, NH4+, and DIP. The distance-based redundancy analysis (db RDA) in Figure 8 shows the relationship between environmental factors and the planktonic bacterial community. The interpretation degree of the CAP1 axis and CAP2 axis of db RDA to the planktonic bacterial community in water was 38.04%. The red arrow represented by COD was the longest in the db-RDA diagram, indicating that COD significantly affected the planktonic bacterial community overall, especially OTU297. In addition, the bacterioplankton community in spring was primarily affected by chl-a and DO, and the bacterioplankton community in autumn was negatively correlated with chl-a.
The heat map shows the relationship between the different types of planktonic bacteria and environmental factors (Figure 9). Flavobacterium and Aquiibacter were not related to the selected environmental factors, but their abundance was affected by other factors. The species with a higher abundance in the spring group were mainly positively related to chl-a, including Ruegeria, Psychrobacter, and Planococcus. The highest abundance of Ascidiaceihabitans in the summer group was positively correlated with COD and NH4+- N. The species with a higher abundance in the winter group were mainly negatively correlated with COD and positively correlated with DO and S, including Lentibaster and Sulfitoactor.

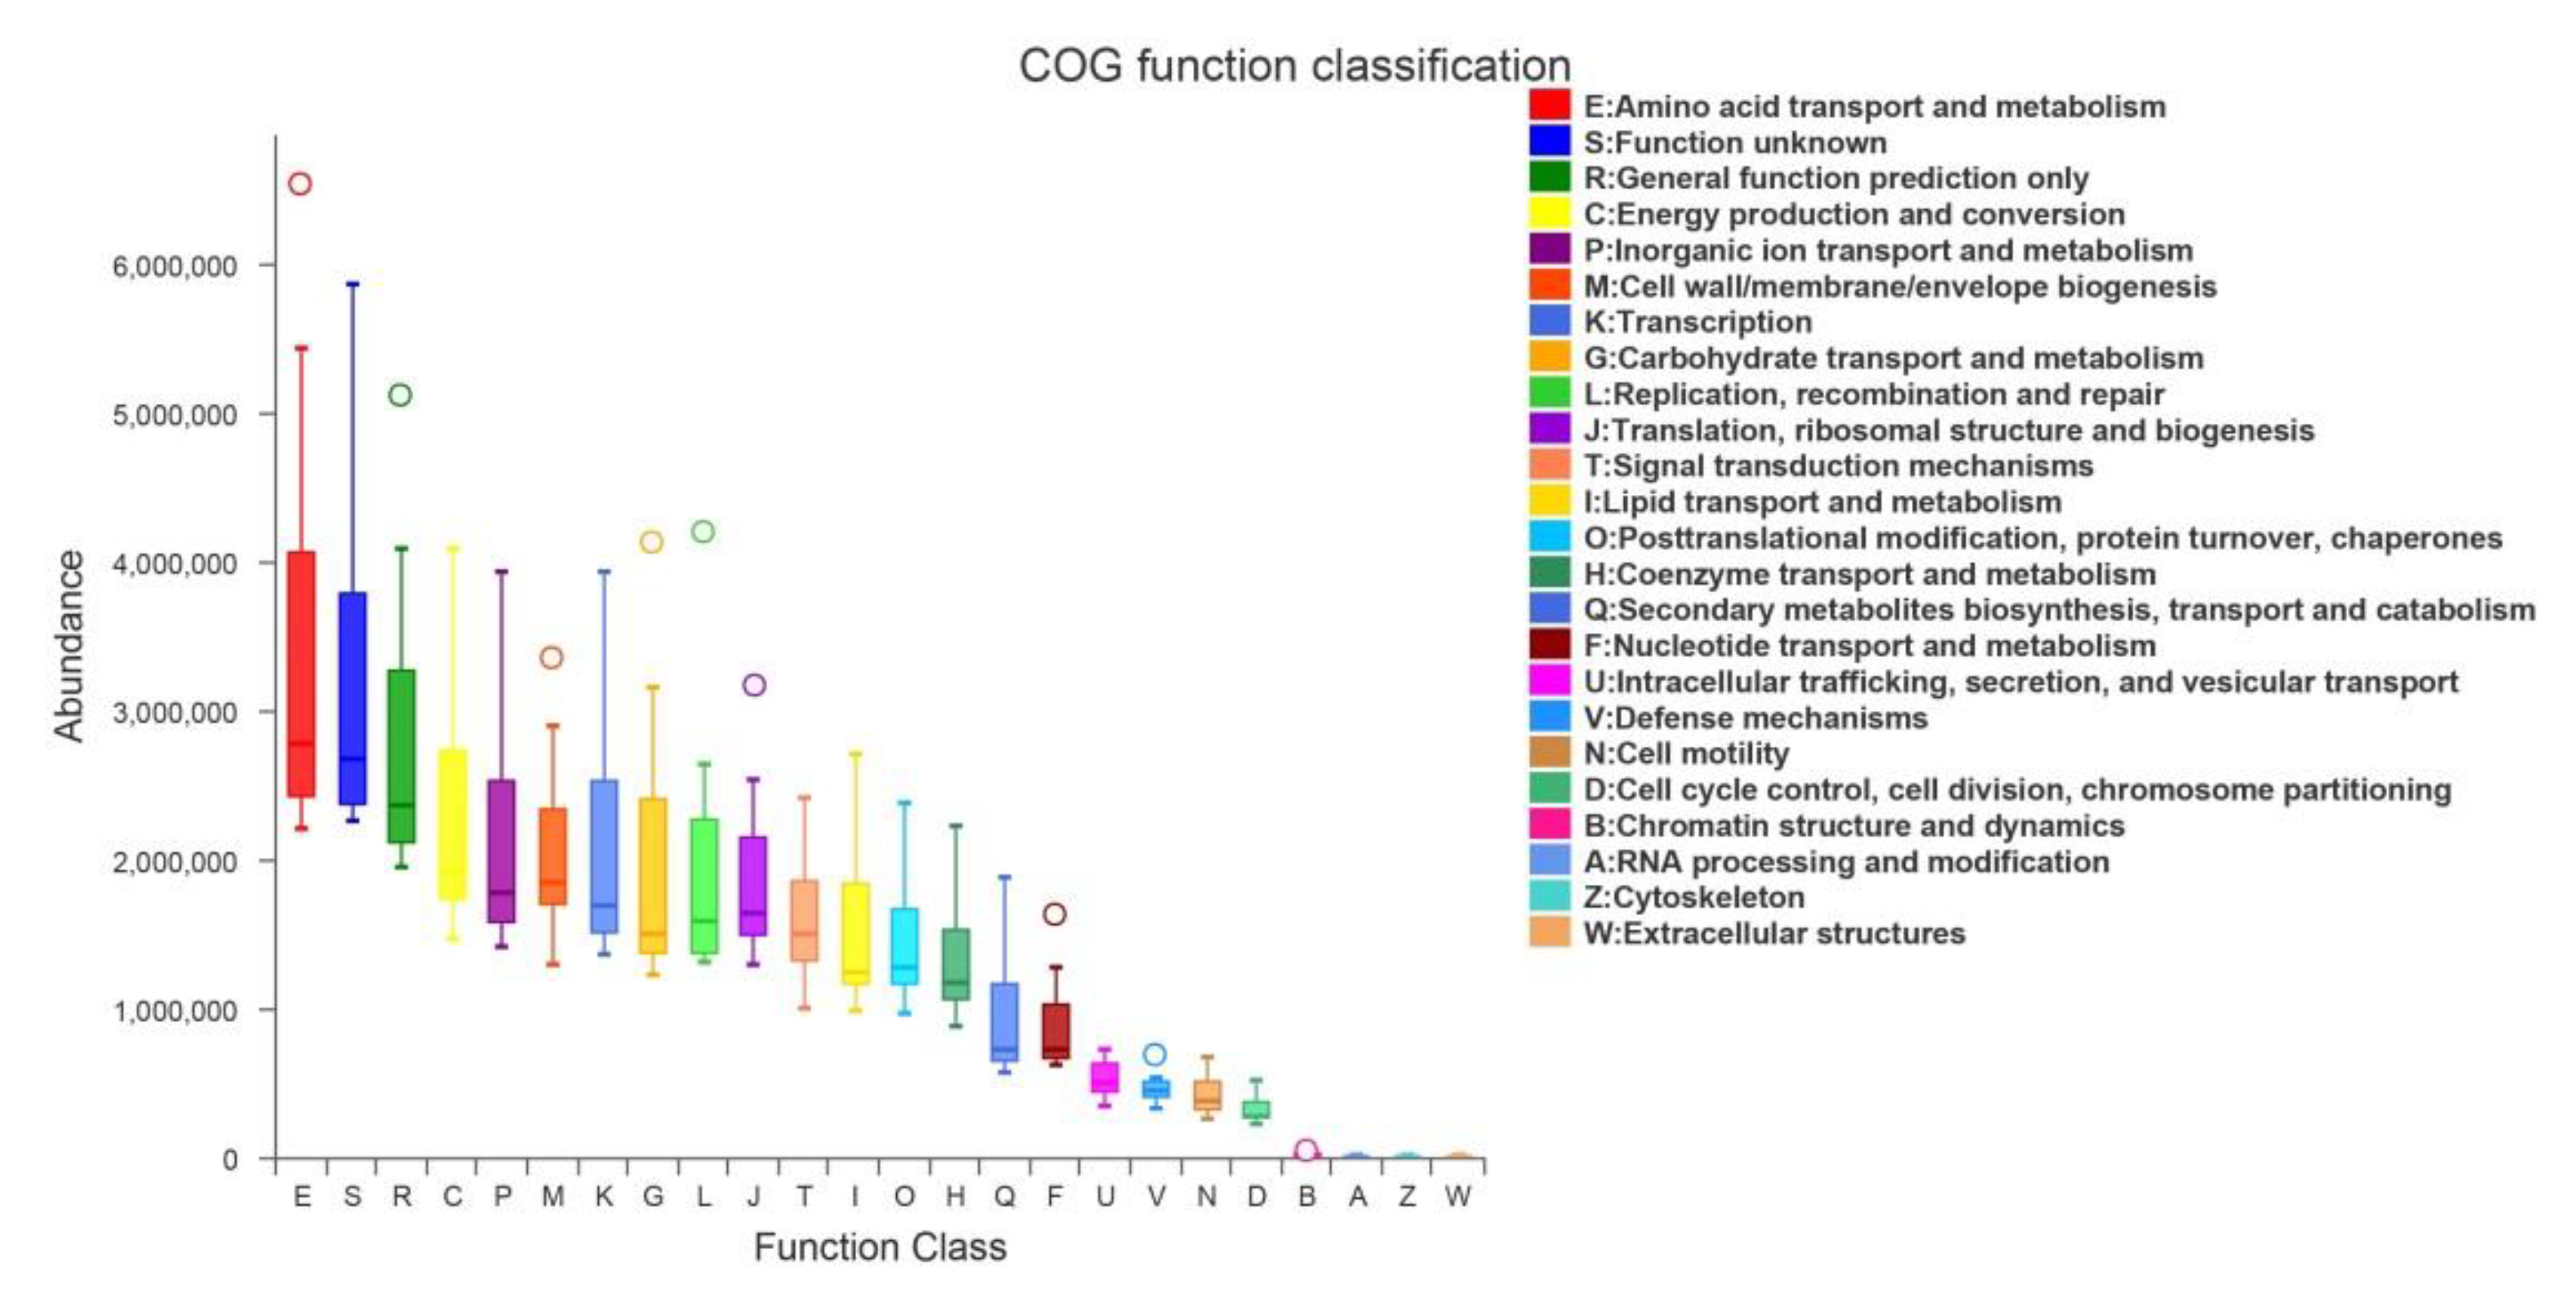
3.7. Function Statistics of the Microbial Community

A PICRUSt1 analysis was used to predict the potential functional role of planktonic bacterial communities (Figure 10). Based on the 16S rRNA gene sequence, 24 orthologous (COG) clusters were found in the samples. COG E (amino acid transport and metabolism), COG S, COG R (general function prediction only), COG C (energy production and conversion), and COG M (cell wall/membrane/envelope biology) were abundant in the samples. COG S was the main COG in the different samples, but its function is unknown. The median line of COG E was the highest and lower than the square, indicating that abnormal values increased the average value.

4. Discussion

4.1. Planktonic Bacterial Community Analysis of α-Diversity and Stability

Some studies have found that the abundance of bacteria in eutrophic sea areas was high, and the number of species and diversity declined [22]. Moreover, an investigation further showed that maintaining the diversity of planktonic bacteria in aquaculture water can enhance the stability of biological community ecosystems in aquaculture environments [3]. The current study demonstrates that in the phytoplankton bacterial communities in the four sampling sites in the sea area of Xiasanhengshan Island, there was no significant difference between α-diversity and the total number of species (i.e., the ACE index). A possible reason for this is the low degree of pollution in the cage culture area in the simple IMTA system in this sea area and the small impact on the diversity of planktonic bacteria, and the mixing effect of water flow with high velocity, which makes the surface water more uniform.
In terms of the four seasons, the diversity index of autumn was significantly higher than that of the other three seasons, while the diversity index of the other three seasons exhibited no significant difference. The ACE index of the four seasons had no significant difference between summer and winter. However, it exhibited a significant difference between the other seasons, and the difference between spring and summer and spring and autumn was highly significant. Many studies have shown that this seasonal change of surface bacterial community was widespread [13,15,23,24].

4.2. Community Composition and Community Function Analysis of Planktonic Bacteria

The main planktonic bacteria in the sea area of Xiasanhengshan Island were Proteobacteria, Chlamydomonas, Bacteroides, Cyanobacteria, and Actinomycetes. Proteobacteria [25] accounted for 62.5% of the average abundance of each site, and was the first-dominant phylum in aquaculture and non-aquaculture areas. Lu et al. [24] found that Proteus was the dominant class in a diversity study of marine culturable planktonic bacteria in the East China Sea, mainly comprising Alphaproteobacteria and Gammaproteobacteria. Liu [26] reported that the abundance of Proteus was 49.08% when investigating planktonic bacteria in Zhoushan offshore waters, which was the first-dominant bacteria in the sea area. Bao [27] also found that the first-dominant phylum in the sea area was Proteobacteria during a survey of Xiasanhengshan Island in 2019, and Alphaproteobacteria constituted the highest proportion. Research showed that in the sea area with high organic particulate matter due to the impact of human production activities, the abundance of Alphaproteobacteria was high, which is in accordance with the results of this study. Alphaproteobacteria was the most abundant flora at each site in the sea area in summer, which may be due to the high temperature in summer and the release of a large amount of particulate organic matter into the environment during feeding and breeding. Alphaproteobacteria provided an energy source, leading Alphaproteobacteria to multiply. Gammaproteobacteria mainly dominated in sediments, but it was found in this investigation that Gammaproteobacteria was the main dominant flora of the planktonic bacterial community. This result is consistent with that of Bao, who found during the survey in the sea area of Xiasanhengshan Island in 2019 that Gammaproteobacteria was the most abundant flora in the sea area [27].
Bacteroides, Cyanobacteria, and Actinomycetes were also the central bacterial communities in the sea area of Xiasanhengshan Island. Bacteroides are heterotrophic bacteria that can promote the global carbon cycle through aerobic respiration or anaerobic fermentation [28]. Bacterobacteria plays a specific role in degrading high-molecular-weight substances in the sea into dissolved organic substances [29], and Bacteroides serve an essential function in material energy conversion and environmental governance. Most of the Bacteroides are composed of flavobacterium [30]. Research has shown that Flavobacterium can convert macromolecular substances into small molecular substances, and uses complex organic components to complete its growth. Flavobacterium usually has a high bacterial abundance at the stage of algal bloom decline [31,32]. In the present study, the abundance of Bacteroides exhibited spatiotemporal differences, and whether or not its abundance change is related to aquaculture activities requires further investigation.

4.3. Correlation Analysis between Planktonic Bacteria and Environmental Factors

The structure of the bacterial community and the composition of dominant groups will change with the change in environmental factors [33]. The fluctuation of DO, temperature, nutrients, and organic matter in the water body may cause alterations in the structure of the phytoplankton bacterial community water bodies [34,35]. Summer and autumn were the main prosperous periods of cage fish farming in the sea. After New Year’s Day, commercial fish in cages were sold gradually. After the middle of May, young fish were purchased in succession to start feeding and breeding. Therefore, the cages were empty mainly in spring and winter, and thus there were almost no feeding fish farming activities. There was a positive correlation between the phytoplankton community and COD in summer, but the opposite was the case in winter. COD is the organic pollution index of water, which showed that the microbial community plays a vital role in the degradation of organic matter [36]. Temperature is widely considered to be an essential factor affecting the phytoplankton community [37]. Investigations found that the water temperature was highly correlated with the abundance of the microbial community [38], and the structure of the phytoplankton community in different periods was affected by the water temperature [39]. However, temperature was not the main factor affecting the bacterial community in the current study, and only some bacterial species were affected by temperature. Li et al. reported that when the water temperature was higher than 14 °C, the regulatory effect of temperature on planktonic bacteria gradually decreased, and the supply of substrate and nutrient salts became essential factors affecting the distribution of planktonic bacteria [40]. The results of this study are consistent with these findings.
Nitrogen and phosphorus are essential nutrient sources of heterotrophic bacteria and critical environmental factors that affect the bacterial community of plankton [41,42]. DIN is also the primary regulatory factor of phytoplankton and bacterial biomass [43]. Marine heterotrophic bacteria primarily rely on the dissolution of phytoplankton and organic matter dissolved during the predation of zooplankton as carbon sources for growth and proliferation [44,45]. Phytoplankton regulates the number of planktonic bacteria and the community structure of planktonic bacteria [46]. Sufficient dissolved oxygen is a prerequisite for the growth and reproduction of marine organisms. The low oxygen content in seawater will threaten the survival of organisms [47]. This study found that Bacteroides were closely related to dissolved oxygen. According to the correlation heatmap, there was no significant impact between some bacteria and environmental factors, which may be because the non-biological factors involved in the sampling of this study were not sufficiently comprehensive, and certain factors, such as hydrodynamics, should be considered in addition to nutrients [48].

Author Contributions

M.Z. and R.J.: methodology, investigation, software, writing—original draft. M.Z., R.J., J.Z. (Jianlin Zhang), K.L., J.Z. (Jianheng Zhang), L.S., W.H. and P.H.: writing—review and editing. M.Z., R.J., K.L., J.Z. (Jianheng Zhang), L.S. and W.H.: formal analysis. J.Z. (Jianlin Zhang) and P.H.: project administration, funding acquisition, supervision. All authors have read and agreed to the published version of the manuscript.

Funding

This work was supported by the National Sci-Tech Support Plan of China (2012BAC07B03), the Natural Science Foundation of Shanghai (21ZR1427400), the Evaluation of the Carbon Sink in the Coastal Sea of Shanghai (11N5500808182022401), the Shanghai Science and Technology Development Fund (20DZ2250700), Shanghai, China, and the Technology Innovation Center for Land Spatial Eco-restoration in Metropolitan Area, MNR (CXZX202006).

Institutional Review Board Statement

Not applicable.

Informed Consent Statement

Not applicable.

Data Availability Statement

The datasets generated and/or analyzed during the current study are available from the corresponding author upon reasonable request.

Conflicts of Interest

The authors declare no conflict of interest.

References

  1. Shao, K.T. Marine Biodiversity and Fishery Sustainability. Asia Pac. J. Clin. Nutr. 2009, 18, 527–531. [Google Scholar] [PubMed]
  2. Ding, D.W.; He, P.M.; Ye, S.F.; Chen, B.; Huang, L.F.; Yang, J.L.; He, W.H. Coastal Marine Ecology in China: Research and Management; Science Press: Beijing, China, 2022; ISBN 9787030705594. [Google Scholar]
  3. Campbell, B.; Pauly, D. Mariculture: A Global Analysis of Production Trends Since 1950. Mar. Policy 2013, 39, 94–100. [Google Scholar] [CrossRef]
  4. Wu, R.S.S. The Environmental Impact of Marine Fish Culture: Towards a Sustainable Future. Mar. Pollut. Bull. 1995, 31, 159–166. [Google Scholar] [CrossRef]
  5. He, P.M.; Xu, S.N.; Zhang, H.Y.; Wen, S.S.; Dai, Y.J.; Lin, S.J.; Yarish, C. Bioremediation Efficiency in the Removal of Dissolved Inorganic Nutrients by the Red Seaweed, Porphyra yezoensis, Cultivated in the Open Sea. Water Res. 2008, 42, 1281–1289. [Google Scholar] [CrossRef]
  6. Chopin, T.; Buschmann, A.H.; Halling, C.; Troell, M.; Kautsky, N.; Neori, A.; Kraemer, G.P.; Zertuche-González, J.A.; Yarish, C.; Neefus, C. Integrating Seaweeds into Marine Aquaculture Systems: A Key toward Sustainability. J. Phycol. 2001, 37, 975–986. [Google Scholar] [CrossRef]
  7. He, P.M.; Duan, Y.L.; Liu, Q.; Liu, J.L.; Liu, W.; Zhang, J.H.; Fang, J.G.; Jiang, Z.J.; Wu, H.L.; Li, X.S.; et al. Strategy of Macroalgae Eco-Remediation with Cases in Nearshore China. J. Appl. Oceanogr. 2021, 40, 557–563. [Google Scholar]
  8. Tang, Q.S.; Fang, J.G.; Zhang, J.H.; Jiang, Z.J.; Liu, H.M. Impacts of Multiple Stressors on Coastal Ocean Ecosystems and Integrated Multi-Trophic Aquaculture. Prog. Fish. Sci. 2013, 34, 1–11. [Google Scholar]
  9. Wei, Z.L.; Huo, Y.Z.; Liu, Q.; Yang, F.F.; Long, L.J.; Bi, H.S.; Fan, C.L.; He, P.M. A Field Scale Evaluation of Gracilaria Lemaneiformis Co-Cultured with Crassostrea gigas as a Nutrient Bioextraction Strategy in Yantian Bay, China. Algal Res. 2019, 38, 101407. [Google Scholar] [CrossRef]
  10. Bao, Y.L.; Huo, Y.Z.; Duan, Y.L.; He, P.M.; Wu, M.Q.; Yang, N.; Sun, B. Growth and Nutrient Uptake of Myriophyllum spicatum under Different Nutrient Conditions and Its Potential Ecosystem Services in an Enclosed Sea Area in the East China Sea. Mar. Pollut. Bull. 2020, 151, 110801. [Google Scholar] [CrossRef]
  11. Edwards, P.; Pullin, R.S.V.; Gartner, J.A. Research and Education for the Development of Integrated Crop-Livestock-Fish Farming Systems in the Tropics. Agric. Syst. 1988, 32, 293–294. [Google Scholar]
  12. Paerl, H.W.; Dyble, J.; Twomey, L.; Pinckney, J.L.; Nelson, J.; Kerkhof, L. Characterizing Man-Made and Natural Modifications of Microbial Diversity and Activity in Coastal Ecosystems. Antonie Leeuwenhoek 2002, 81, 487–507. [Google Scholar] [CrossRef]
  13. Bao, Y.L.; He, W.H.; Zhao, S.; Liu, Q.; Li, K.; He, P.M.; Li, K.J. Planktonic and Sediment Bacterial Communities in an Integrated Mariculture System. Lett. Appl. Microbiol. 2021, 72, 341–350. [Google Scholar] [CrossRef]
  14. An, X.L.; Zhou, Q.X.; Xing, G.M. A Review: Application of Marine Microorganisms in Marine-Pollution Treatment. Fish. Sci. 2006, 25, 97–100. [Google Scholar]
  15. Salazar, G.; Sunagawa, S. Marine Microbial Diversity. Curr. Biol. 2017, 27, R489–R494. [Google Scholar] [CrossRef] [Green Version]
  16. Zhang, D.M.; Wang, X.; Xiong, J.B.; Zhu, J.L.; Wang, Y.N.; Zhao, Q.F.; Chen, H.P.; Guo, A.N.; Wu, J.F.; Dai, H.P. Bacterioplankton Assemblages as Biological Indicators of Shrimp Health Status. Ecol. Indic. 2014, 38, 218–224. [Google Scholar] [CrossRef]
  17. Humayoun, S.B.; Bano, N.; Hollibaugh, J.T. Depth Distribution of Microbial Diversity in Mono Lake, a meromictic soda lake in California. Appl. Environ. Microbiol. 2003, 69, 1030–1042. [Google Scholar] [CrossRef] [Green Version]
  18. Yan, Q.Y.; Yu, Y.H.; Feng, W.S.; Yu, Z.G.; Chen, H.T. Plankton Community Composition in the Three Gorges Reservoir Region revealed by PCR-DGGE and its relationships with environmental factors. J. Environ. Sci. 2008, 20, 732–738. [Google Scholar] [CrossRef]
  19. Zeng, Y.H.; Ma, Y.; Wei, C.L.; Jiao, N.Z.; Tang, K.X.; Wu, Z.H.; Jian, J.C. Bacterial Diversity in Various Coastal Mariculture Ponds in Southeast China and in Diseased Eels as Revealed by Culture and Culture-Independent Molecular Techniques. Aquacult. Res. 2010, 41, e172–e186. [Google Scholar] [CrossRef]
  20. Chen, M. Chemical Oceanography; Science Press: Beijing, China, 2009; ISBN 9787502775346. [Google Scholar]
  21. Hu, C.J.; Xiong, J.B.; Chen, H.P.; Wang, K.; Ye, R.; Cui, Y.P.; Zhu, J.L.; Zhang, D.M. Distribution of Bacterioplankton Communities in Cage Culture and Noncultured Areas of Xiangshan Bay, Ningbo, China. Acta Ecol. Sin. 2015, 35, 8053–8061. [Google Scholar]
  22. Xu, Z.H.; Guo, Z.R.; Xu, X.; Huang, D.J.; Sun, X.X.; Jiang, L.M.; Yang, J.F. The Impact of Nutrient Enrichment on the Phytoplankton and Bacterioplankton Community during a Mesocosm Experiment in Nan’ao of Daya Bay. Mar. Biol. Res. 2014, 10, 374–382. [Google Scholar] [CrossRef]
  23. Mezhoud, N.; Temimi, M.; Zhao, J.; Al Shehhi, M.R.; Ghedira, H. Analysis of the Spatio-Temporal Variability of Seawater Quality in the Southeastern Arabian Gulf. Mar. Pollut. Bull. 2016, 106, 127–138. [Google Scholar] [CrossRef]
  24. Liu, Q.; Liu, M.M.; Zhang, Q.; Bao, Y.L.; Yang, N.; Huo, Y.Z.; He, P.M. Epiphytic Bacterial Community Composition on the Surface of the Submerged Macrophyte in a Low-Salinity Sea Area of Hangzhou Bay. Oceanol. Hydrobiol. Stud. 2019, 48, 43–55. [Google Scholar] [CrossRef]
  25. Lu, J.W.; Zhang, X.Q.; Du, L.L.; Yang, Z.J.; Wu, M.; Lu, L.P. Bacterial Isolation and Diversity Analysis of Four Seawater Sampling Sites of the East China Sea and the South China Sea. J. Zhejiang Univ. 2012, 39, 443–449. [Google Scholar]
  26. Liu, Q. Community Structure of Picoplankton in the Coastal Waters of Zhoushan and Correlation with Environmental Parameters. Master’s Thesis, Zhejiang Ocean University, Zhoushan, China, 2018. [Google Scholar]
  27. Bao, Y.L. The Construction of the Island Reef Fish-shell IMTA Model and Its Impact on Theecological Environment of the Nearby Sea. J. Shanghai Oc. Univ. 2020, 598, 97–108. [Google Scholar]
  28. Wu, W.J. Enrichment Culture of Bacteria from Coastal Sediment off Weihai and Polyphasic Taxonomy Analysis of Three Novel Bacteroidetes Strains. Master’s Thesis, Shandong University, Jinan, China, 2016. [Google Scholar]
  29. Cottrell, M.T.; Kirchman, D.L. Natural Assemblages of Marine Proteobacteria and Members of the Cytophaga-Flavobacter Cluster Consuming Low-and High-Molecular-Weight Dissolved Organic Matter. Appl. Environ. Microbiol. 2000, 66, 1692–1697. [Google Scholar] [CrossRef] [Green Version]
  30. Cottrell, M.T.; Kirchman, D.L. Community Composition of Marine Bacterioplankton Determined by 16S Rrna Gene Clone Libraries and Fluorescence in Situ Hybridization. Appl. Environ. Microbiol. 2000, 66, 5116–5122. [Google Scholar] [CrossRef] [Green Version]
  31. Rinta-Kanto, J.M.; Sun, S.; Sharma, S.; Kiene, R.P.; Moran, M.A. Bacterial Community Transcription Patterns During a Marine Phytoplankton Bloom. Environ. Microbiol. 2012, 14, 228–239. [Google Scholar] [CrossRef]
  32. Teeling, H.; Fuchs, B.M.; Becher, D.; Klockow, C.; Gardebrecht, A.; Bennke, C.M.; Kassabgy, M.; Huang, S.; Mann, A.J.; Waldmann, J. Substrate-Controlled Succession of Marine Bacterioplankton Populations Induced by a Phytoplankton Bloom. Science 2012, 336, 608–611. [Google Scholar] [CrossRef]
  33. Li, W.; Yang, C.Y.; Zheng, T.L. Bacterial Survival Modes and Community Characteristics in Natural Environment. Chin. J. App. Environ. Biol. 2013, 19, 553–560. [Google Scholar] [CrossRef]
  34. Ghiglione, J.F.; Murray, A.E. Pronounced Summer to Winter Differencesand Higher Wintertime Richness in Coastal Antarctic Marine Bacterioplankton. Environ. Microbiol. 2012, 14, 617–629. [Google Scholar] [CrossRef]
  35. Taniguchi, A.; Tada, Y.; Hamasaki, K. Seasonal Variations in the Community Structure of Actively Growing Bacteria in Neritic Waters of Hiroshima bay, Western Japan. Jap. Soc. Microb. Eco. 2011, 26, 339–346. [Google Scholar] [CrossRef] [Green Version]
  36. Shao, K.Q.; Yao, X.; Wu, Z.S.; Jiang, X.Y.; Hu, Y.; Tang, X.M.; Xu, Q.J.; Gao, G. The Bacterial Community Composition and Its Environmental Drivers in the Rivers around Eutrophic Chaohu Lake, China. BMC Microbiol. 2021, 21, 1–11. [Google Scholar] [CrossRef]
  37. Gilbert, J.A.; Steele, J.A.; Caporaso, J.G.; Steinbrueck, L.; Reeder, J.; Temperton, B.; Huse, S.; McHardy, A.C.; Knight, R.; Joint, I.; et al. Defining Seasonal Marine Microbial Community Dynamics. ISME J. 2012, 6, 298–308. [Google Scholar] [CrossRef] [Green Version]
  38. Thompson, L.R.; Sanders, J.G.; McDonald, D.; Amir, A.; Ladau, J.; Locey, K.J.; Prill, R.J.; Tripathi, A.; Gibbons, S.M.; Ackermann, G. A Communal Catalogue Reveals Earth’s Multiscale Microbial Diversity. Nature 2017, 551, 457–463. [Google Scholar] [CrossRef] [Green Version]
  39. Fang, G.J.; Yu, H.L.; Sheng, H.X.; Tang, Y.L.; Liang, Z.L. Comparative Analysis of Microbial Communities Between Water and Sediment in Laoshan Bay Marine Ranching with Varied Aquaculture Activities. Mar. Pollut. Bull. 2021, 173, 112990. [Google Scholar] [CrossRef]
  40. Li, W.K.W. Annual Average Abundance of Heterotrophic Bacteria and Synechococcus in Surface Ocean Waters. Limnol. Oceanogr. 1998, 43, 1746–1753. [Google Scholar] [CrossRef]
  41. Sun, Y.; Li, X.; Liu, J.J.; Yao, Q.; Jin, J.; Liu, X.B.; Wang, G.H. Comparative Analysis of Bacterial Community Compositions Between Sediment and Water in Different Types of Wetlands of Northeast China. J. Soils. Sediments. 2019, 19, 3083–3097. [Google Scholar] [CrossRef]
  42. Wu, S.K.; Xie, P.; Ni, L.Y. Cyanobacteria Genus and Its Relationship with Nitrogen and Phosphorus Concentration in Lakes along the Middle and Lower Reaches of the Yangtze River. J. Hydrol. 2014, 35, 19–25. [Google Scholar]
  43. Zhou, W.H.; Li, T.; Cai, C.H.; Huang, L.M.; Wang, H.K.; Xu, J.R.; Dong, J.D.; Zhang, S. Spatial and Temporal Dynamics of Phytoplankton and Bacterioplankton Biomass in Sanya Bay, Northern South China Sea. J. Environ. Sci. 2009, 21, 595–603. [Google Scholar] [CrossRef]
  44. Hagstrom, A.; Larsson, U.; Horstedt, P.; Normark, S. Frequency of Dividing Cells, a New Approach to the Determination of Bacterial Growth Rates in Aquatic Environments. Appl. Environ. Microbiol. 1979, 37, 805–812. [Google Scholar] [CrossRef] [Green Version]
  45. Fuhrman, J.A.; Azam, F. Bacterioplankton Secondary Production Estimates for Coastal Waters of British Columbia, Antarctica, and California. Appl. Environ. Microbiol. 1980, 39, 1085–1095. [Google Scholar] [CrossRef] [PubMed] [Green Version]
  46. Casotti, R.; Brunet, C.; Aronne, B.; d’Alcala, M.R. Mesoscale Features of Phytoplankton and Planktonic Bacteria in a Coastal Area as Induced by External Water Masses. Mar. Ecol. Prog. Ser. 2000, 195, 15–27. [Google Scholar] [CrossRef] [Green Version]
  47. Chen, C.H.; Wang, C.S.; Xu, X.W.; Liu, Z.Y. Advances in Studies on Biological Effect of Estuary Hypoxia. Acta Ecol. Sin. 2009, 29, 2595–2602. [Google Scholar]
  48. Santos, L.; Santos, A.L.; Coelho, F.J.R.C.; Gomes, N.C.M.; Dias, J.M.; Cunha, A.; Almeida, A. Heterotrophic Activities of Neustonic and Planktonic Bacterial Communities in an Estuarine Environment (Ria de Aveiro). J. Plankton. Res. 2014, 36, 230–242. [Google Scholar] [CrossRef] [Green Version]
Figure 1. Aerial photograph of the fish–shellfish culture system in Xiasanhengshan Island.
Jmse 11 00476 g001
Figure 2. Schematic diagram of fish culture, shellfish culture, macroalgae distribution area, and sampling sites in Xiasanhengshan Island.
Jmse 11 00476 g002
Figure 3. Distribution of planktonic bacteria at the phylum level.
Jmse 11 00476 g003
Figure 4. The distribution of planktonic bacteria at the class level.
Jmse 11 00476 g004
Figure 5. Distribution of planktonic bacteria at the genus level.
Jmse 11 00476 g005
Figure 6. NMDS analysis at the OTU level.
Jmse 11 00476 g006
Figure 7. Venn diagram of species in four seasons.
Jmse 11 00476 g007
Figure 8. db-RDA of the bacterioplankton community and environmental factors.
Jmse 11 00476 g008
Figure 9. Heatmap of correlations between planktonic bacteria and environmental factors in the study area. * 0.01 ≤ p ≤ 0.05, ** 0.001 ≤ p ≤ 0.01, *** p ≤ 0.001, “blank” p > 0.05.
Jmse 11 00476 g009
Figure 10. Statistics on the functional classification of bacterioplankton communities in the study area.
Jmse 11 00476 g010
Table 1. Primer design.
Sequencing AreaPrimer NamePrimer Sequence
Bacteria338F_806R338FACCGATAGCAAACAAGTA
806RTCCTTGGTCCGTGTTTCA
Table 2. Water quality data of microbial samples in Xiasanhengshan Island.
SitesChl-aTpHSDOCODTNTPSiO32−NH4+NO2NO3DIP
spr-W11.112 19.88 8.47 30.01 11.54 0.594 0.380 0.008 0.775 0.000 0.011 0.129 0.003
spr-W21.124 19.73 8.53 29.99 11.25 0.812 0.385 0.015 0.690 0.001 0.011 0.212 0.003
spr-W31.285 19.62 8.54 30.00 15.56 0.505 0.390 0.022 0.889 0.006 0.009 0.181 0.009
spr-W41.378 19.78 8.25 29.99 11.41 0.601 0.390 0.019 0.818 0.008 0.008 0.236 0.009
sum-W10.411 25.00 8.03 29.01 9.36 3.701 0.490 0.024 1.591 0.014 0.005 0.661 0.005
sum-W20.511 25.01 8.01 28.95 8.65 4.087 0.866 0.022 1.329 0.019 0.006 0.655 0.009
sum-W31.087 24.76 8.02 29.01 9.00 3.120 1.015 0.024 1.587 0.011 0.007 0.761 0.012
sum-W40.358 24.72 8.11 29.02 8.62 3.897 0.562 0.026 1.396 0.016 0.006 0.393 0.007
aut-W10.519 15.72 7.90 29.05 10.75 0.642 0.813 0.010 2.024 0.010 0.002 0.592 0.010
aut-W20.333 15.62 7.89 29.23 10.20 1.212 0.279 0.016 2.024 0.006 0.003 0.591 0.009
aut-W30.294 15.72 7.93 31.12 10.53 0.451 0.402 0.014 1.981 0.020 0.003 0.665 0.006
aut-W40.209 15.71 7.96 31.05 11.14 0.798 0.258 0.007 1.677 0.020 0.002 0.397 0.012
win-W10.126 9.62 8.07 35.12 15.34 0.320 0.109 0.017 0.818 0.013 0.001 0.238 0.021
win-W20.117 9.71 8.03 35.00 11.83 0.482 0.461 0.024 0.846 0.010 0.003 0.214 0.012
win-W30.145 9.87 8.04 34.99 11.88 0.258 0.913 0.026 0.701 0.006 0.003 0.239 0.017
win-W40.198 10.02 8.25 35.01 11.42 0.301 0.959 0.034 0.694 0.013 0.001 0.136 0.005
Table 3. Alpha diversity of planktonic bacteria.
SamplesShannonShannon EvenACECoverage
spr_W12.90360.5103388.84480.9973
spr_W23.83650.6154675.44570.995
spr_W33.65820.5826704.77290.9946
spr_W43.4210.5673558.23430.9958
sum_W13.84930.57981016.35620.9924
sum_W23.80990.56891134.57970.9911
sum_W33.44720.5261961.21390.9926
sum_W43.4680.5353847.45710.9935
aut_W15.24530.74781414.37030.9899
aut_W25.11130.72801426.1550.99
aut_W35.04320.71981385.5130.9905
aut_W45.11810.71121838.24380.9858
win_W14.33270.64791099.15910.9916
win_W24.28820.63591155.4740.9911
win_W32.7490.4401707.53910.9945
win_W44.1210.61361088.61950.9919
Table 4. Species classification of the top three unique species at each site.
SeasonSampleOTU IDContribution PercentageTaxonomic Status
sprW1OTU612.62%g__Sulfitobacter
OTU19112.30%g__Aquibacter
OTU5247.51%g__Psychrobacter
sprW2OTU1035.45%g__Croceitalea
OTU1395.45%f__Hyphomonadaceae
OTU1513.47%f__Rhodobacteraceae
sprW3OTU14934.26%g__Oleispira
OTU1142.71%f__Cryomorphaceae
OTU9952.71%g__Seonamhaeicola
sumW1OTU3579.95%f__Comamonadaceae
OTU13513.32%g__Nevskia
OTU3262.37%f__Methylacidiphilaceae
sumW2OTU4854.12%c__Sericytochromatia
OTU4723.75%g__Oleiphilus
OTU1202.25%g__Pleurocapsa
sumW3OTU19675.71%s__Salinicoccus_roseus
OTU6603.81%f__Thiotrichaceae
OTU17762.86%s__Micrococcus_luteus
autW1OTU8928.87%f__Legionellaceae
OTU9476.28%f__Arcobacteraceae
OTU9364.98%g__Oceanococcus
autW2OTU122015.87%g__Lachnoclostridium
OTU122111.25%g__Flavonifractor
OTU108010.62%s__Enterococcus faecalis
autW3OTU149166.41%o__Flavobacteriales
OTU13741.91%f__Bacteriovoracaceae
OTU2021.91%f__Micavibrionaceae
winW1OTU11816.19%g__Exiguobacterium
OTU18948.38%g__Parvibaculum
OTU19316.89%f__Bdellovibrionaceae
winW2OTU122935.14%o__Parvibaculales
OTU203422.44%f__Parvibaculaceae
OTU20794.71%g__Alcanivorax
winW3OTU86125.43%g__Oceanococcus
OTU211817.37%f__Criblamydiaceae
OTU21159.48%o__Bradymonadales
Note: Contribution percentage represents the percentage of the OTU in the unique species; taxonomic status indicates the most detailed classification status that the OTU can determine. The preceding letter indicates the corresponding classification unit: ‘c’ represents class; ‘o’ represents order; ‘f’ represents family; ‘g’ represents genus; and ‘s’ represents specifications.
Disclaimer/Publisher’s Note: The statements, opinions and data contained in all publications are solely those of the individual author(s) and contributor(s) and not of MDPI and/or the editor(s). MDPI and/or the editor(s) disclaim responsibility for any injury to people or property resulting from any ideas, methods, instructions or products referred to in the content.

