Review

Reporting Climate Change Impacts on Coastal Ports (NW Iberian Peninsula): A Review of Flooding Extent

by
Américo Soares Ribeiro
1,
Carina Lurdes Lopes
1,
Magda Catarina Sousa
1,
Moncho Gómez-Gesteira
2,
Nuno Vaz
1 and
João Miguel Dias
1,*
1
Centre for Environmental and Marine Studies (CESAM), Physics Department, University of Aveiro, 3810-193 Aveiro, Portugal
2
Environmental Physics Laboratory (EphysLab), CIM-UVIGO, University of Vigo, Campus da Auga Building, 32004 Ourense, Spain
*
Author to whom correspondence should be addressed.
J. Mar. Sci. Eng. 2023, 11(3), 477; https://doi.org/10.3390/jmse11030477
Submission received: 29 December 2022 / Revised: 14 February 2023 / Accepted: 18 February 2023 / Published: 23 February 2023
(This article belongs to the Section Physical Oceanography)

Abstract

:
Ports significantly impact the economic activity in coastal areas. Future climate change projections indicate that the frequency and intensity of extreme sea levels (ESL) will increase, putting several port facilities at risk of flooding with impacts on the port’s reliability and operability. The northwest Iberian Peninsula (NWIP) coast is crossed by one of the most important and busiest shipping lanes in the Atlantic Ocean and features several ports that provide an essential gateway to Europe. In this context, the main aim of this study is to present a review of the extent of flooding under future climatic scenarios in selected NWIP ports, considered representative of the diversity of the coastal areas in this region. The ports of Aveiro (lagoon), Lisbon (estuary), Vigo (Ria) and A Coruña Outer Port (marine) are considered in this study due to their location in different coastal environments, which brings distinct challenges related to climate change local impact. For each port area, the risk of flooding was assessed under climate change scenarios using CMIP5 RCP8.5 for the climate periods between 1979–2005, 2026–2045 and 2081–2099, considering the return periods of 10, 25 and 100 years for storm surges, riverine input and wave regime. The flood pattern varies significantly according to the location of the ports. The ports in lagoons and estuaries are more prone to floods by ESL due to their location in low and flat topography regions. Rias, with a funnel-shaped valley and irregular topography, make the ports in this environment resilient to a sea level rise. Marine environments are exposed to harsh oceanic drivers, however, the ports in these areas are usually built to withstand significant wave conditions with return periods of a hundred years, making them resilient to climate change impacts.

1. Introduction

Maritime transport is essential to the world economy as over 90% of the world’s trade is carried by sea, being the most cost-effective way to move bulk goods and materials worldwide [1]. Transportation relies on ports to supply services to freight and ships, which cover a range of functions that involve port operability. Demand for a port is strongly correlated to climatic conditions, and it can also be affected by the vulnerability of its facilities to disruption from extreme weather events, affecting the port’s reliability and operability, which may lead to a shift to alternative ports [2]. Directive 2009/18/EC of the European Parliament and the Council recognises the importance of reducing the risk of future marine casualties caused by heavy weather damage. Recent hazardous weather created favourable conditions for floods in coastal areas, testing the resilience of the present port infrastructures, where climate change can diminish their ability to cope with future challenging weather and environmental conditions.
Climate change is underway and will likely intensify over the following decades, affecting extended lifetime infrastructures, such as ports designed to withstand extreme weather events that occur at least every 50 years [3]. In addition, by virtue of the port locations in marine environments (estuaries, lagoons, rias and coastal zones) they are exposed to a range of climate drivers that determine extreme sea levels, including mean sea levels, astronomical tides, storm surges, waves and river discharge. Climate change causes modifications in the frequency and intensity of extreme sea levels [4,5,6,7,8], and the intensification of severe storm surges and changes in wave patterns [9,10,11] that will modify the impacts of extreme weather events [5,12,13,14,15,16,17] and hydrodynamic circulation in the vicinity of and inside ports [18,19,20,21,22]. These impacts will affect maritime traffic, berthing [23,24,25], infrastructure, equipment, port operations [23] and consequently, will threaten economic growth [26,27]. For instance, some ports are located in low-lying areas, being affected by rising sea levels and storm surges, while others are situated in marine areas, subjected to extreme weather events such as storms and waves, which could intensify under climate change. Therefore, improving the knowledge about port structure resilience is crucial to understanding how climate change will affect a given port, through an accurate assessment based on analysis of the port’s particular climatic vulnerabilities.
Coastal flooding is linked to storm surge events that generate an abnormal sea level rise above the predicted astronomical tide. When storm surges and high tides coincide, it can cause extreme flooding in these regions [28,29]. Climate change can amplify the impacts of these events due to the predicted mean sea level rise in the upcoming years [5,30,31,32,33]. By following this line of reasoning, the extreme sea level (ESL) has been used in several studies [19,28,29,30,34,35,36,37,38] to assess coastal flooding and its impacts on structures and land use. The flood hazard is correlated to the intensity and periodicity of the drivers (relative sea level, storm surge, riverine flows, and wave-induced sea level), showing higher risk when the combination of several drivers reaches their highest values. The flood hazard assessment is commonly estimated by the probability that a flood of a particular intensity occurs over an extended period, and this relationship between the probability and intensity gives rise to the concept of a return period, which represents the probability of a flood intensity being exceeded in a given year.
The northwest Iberian Peninsula (NWIP) coast is crossed by one of the most important and busiest shipping lanes in the Atlantic Ocean. Due to the intensive maritime traffic, this area has vital sea lanes and traffic separation schemes [39] in the exclusive economic zone of Portugal [40] and Spain [41]. This fact confers great responsibility on maritime security, assuring navigation in the respective coastal waters and aiding vessels in avoiding accidents like the well-known Prestige oil spill [
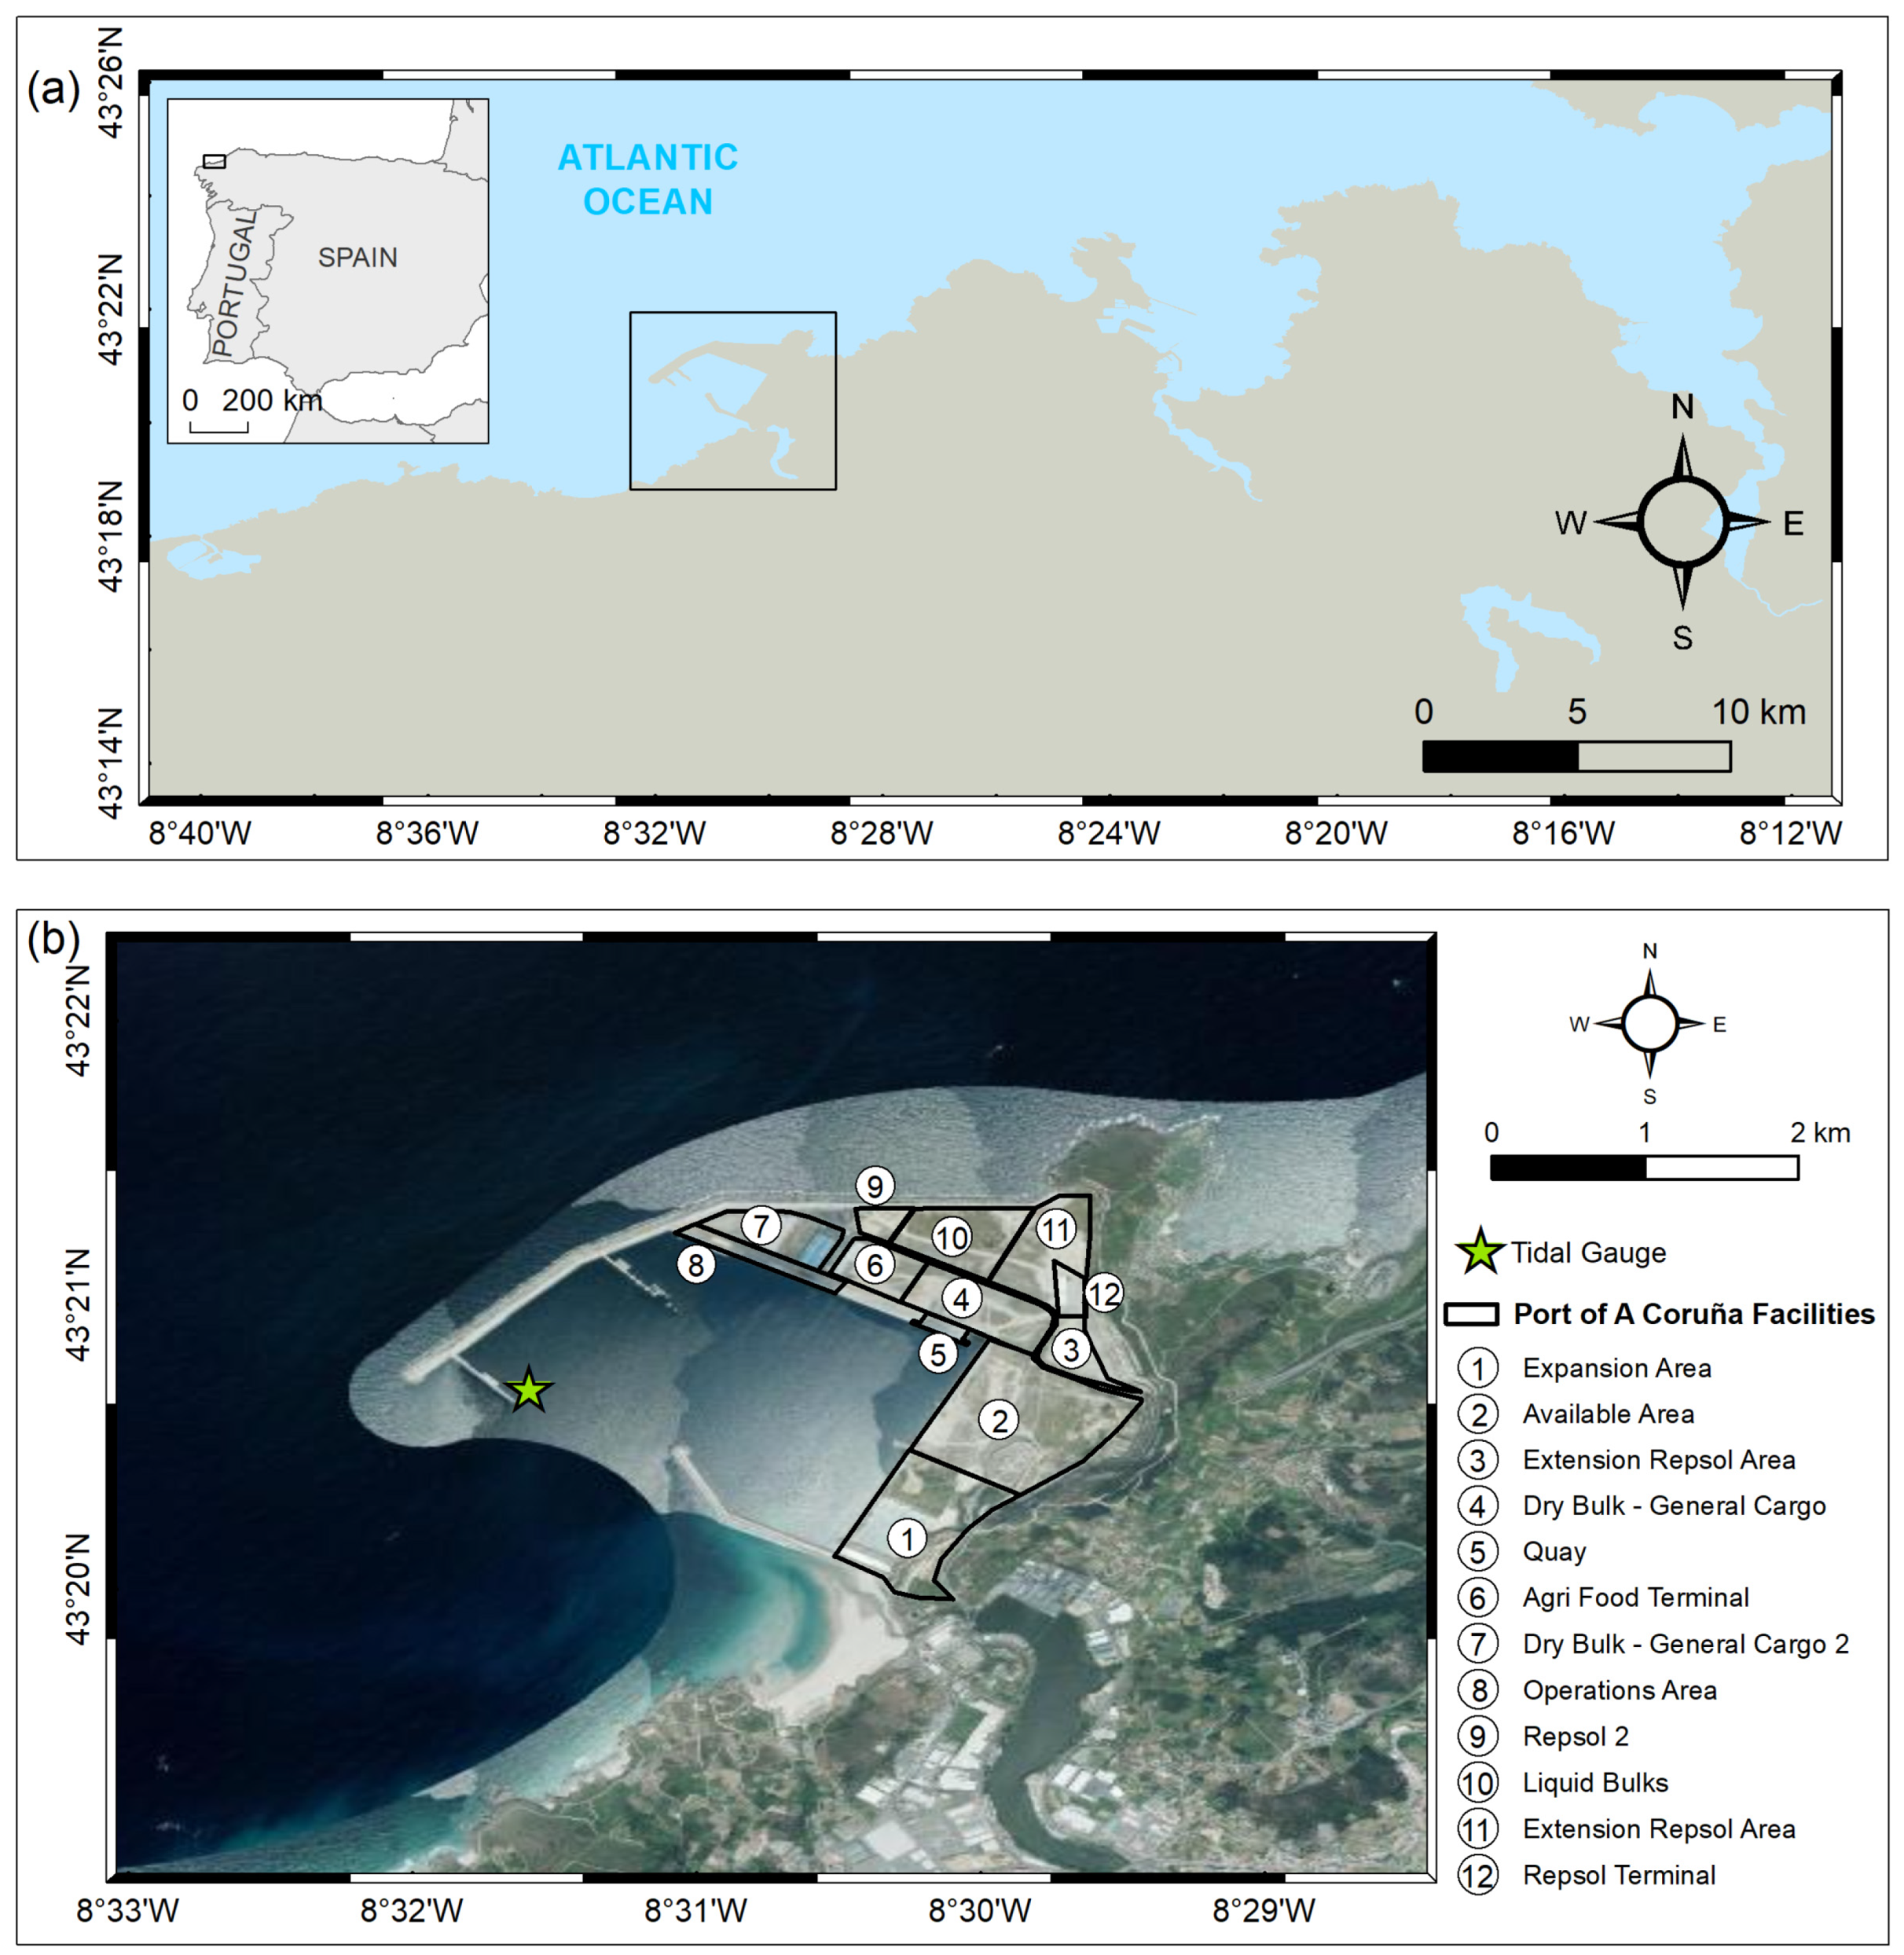
42]. This coast is characterised by highly variable coastal systems (estuaries, rias and lagoons), namely the Rias Altas and Baixas (Galicia, Spain), and the Aveiro lagoon and Tagus estuary (Portugal). These systems have the characteristics of natural harbours and led to the establishment of the ports of Vigo (Rias Baixas), Aveiro (Aveiro lagoon), Lisbon (Tagus estuary) and more recently, the A Coruña Outer Port (northern coast of Galicia) (Figure 1).
Drawing on the above, this paper compiles the knowledge of peer review literature on flood modelling in selected ports of the NWIP coast, based on the different geomorphological environments that characterise the NWIP coast, which present them with distinct challenges related to climate change impacts. The paper is structured as follows: Section 2 provides a description of the studied coastal environments and inherent ports; Section 3 characterises the climate drivers; Section 4 provides the port flood assessment procedures; Section 5 provides the flood assessment; and in Section 6 the conclusion and implications are listed by identifying the most vulnerable ports to climate change according to their location. It is noteworthy that this review focuses on the most pessimistic RCP8.5 scenario of the IPCC for three climate periods, between 1979–2005, 2026–2045 and 2081–2099, corresponding to the historical, near future and far future periods. These periods were chosen considering previous works on coastal hazard assessments [43,44,45,46]. Additionally, a no-flood condition is compared with the flood extent under the climate change scenarios for 10-, 25- and 100-year return periods for storm surges, riverine input and wave regime (hereupon referred to as Tr10, Tr25 and Tr100, respectively), identifying the port terminals susceptible to floods.

2. Coastal Environments and Representative Ports

2.1. Marine: A Coruña Outer Port

The A Coruña Outer Port is located on the northwest coast of the Iberian Peninsula (Figure 2a) and is one of Galicia’s most significant construction projects. The wind–wave climate in this region is highly seasonal and strongly influenced by the North Atlantic Oscillation, being the greatest source of inter-annual variability [47,48] in the wave climate [49], making it one of the most energetic areas in Europe [50,51]. As a consequence, periodic storms occur during the winter months causing energetic waves [52,53,54] for long periods and significant waves (Hs) exceeding 7.2 m and prevailing incoming NW waves [54]. The wave climate is a key factor for the new port’s built-in marine environments, such as the Outer Port. The conditions tend to be severe, exhibiting higher wave heights, currents and winds. For this reason, robust breakwaters were designed by the Port Authority of A Coruña to withstand the hazardous weather and serve as an artificial harbour for large ships. The port facilities (Figure 2b) involved the construction of a 3360 m long breakwater with three alignments and the creation of a dock basin with 230 ha of sheltered waters, with capacity for nine berths for oil tankers up to 300 m and 200,000 tons. The port aims to handle break-bulk, dry bulk and liquid bulk cargoes. For detailed port information, the reader is referred to the port administration website (puertocoruna.com).

2.2. Ria: Vigo Port

Vigo port is located in the Ria de Vigo, the widest of the four V-shaped drowned river valleys caused by a rise in sea level with SSE–NNW orientation, in the Rias Baixas, between 42° N and 43° N (Figure 3). According to the hydrodynamic characteristics, Rias de Vigo is divided into inner, middle and outer sectors. The outer section is protected by the Cíes Islands, providing a natural harbour with around 14.000 hectares of sheltered water protected from the direct influence of the ocean. The middle sector is the central part of the ria, where the port is located. The inner sector covers the shallow head of the ria, where the Oitavén-Verdugo river flows, with a mean annual discharge of 13 m3s−1, characterised by high seasonal variability, ranging from 120 m3s−1 to 1 m3s−1 in winter and summer, respectively [55]. The mesotidal tide [56] also contributes to the ria circulation, characterised by a semi-diurnal pattern.
The Azores anticyclone influences the weather and climate observed in the Rias Baixas region, where the winds are predominant from NNE in the winter and from northeast to the northwest in the summer [56,57]. This seasonal pattern is also observed in the wave regime, with great inter-annual variability, where the swell component is predominant most of the year [47]. In the winter, the significant wave height usually ranges between 1–3 m, reaching up to 10 m during storms, and presenting a northwest dominant wave direction [58].
The Ria de Vigo (Figure 3a) supports important touristic and industrial activities [59], being a major shipyard centre and constituting Europe’s principal landing point for fishing [60]. The Vigo port jurisdiction area (Figure 3b) comprises the whole Ria de Vigo region, limited in the south by the Punta Lameda, in the north by Cape Home, and in the west by the Cíes Islands [61]. These features allow the port to operate 365 days a year. Most of the infrastructures in Vigo port are for freight, passenger and fishing vessels, being located on the southern margin of the Ria de Vigo. For detailed port information, the reader is referred to the port administration website (apvigo.es).

2.3. Lagoon: Aveiro Port

Aveiro port is located in an inland lagoon (Figure 1), characterised by a low topography. The lagoon extends up to 10 km onshore and is 45 km long, with various channels where five major rivers flow into the system (Vouga, Antuã, Ribeira dos Moinhos, Cáster and Boco) [28,29], with the Vouga river being the main contributor reaching a mean discharge of 80 m3s−1 [63]. The lagoon is protected from hazardous waves by sandy barriers extending along the shore, which offers protection from the wave action even during winter storms [30,34,64]. The tide is characterised by a semi-diurnal regime, reaching average tidal amplitudes of 0.46 m at the neap tide and 3.52 m at the spring tide. During winter storms, waves can reach up to 8 m during 5-day storm events [65], and the occurrence of storm surges can contribute to over elevations from 0.3 to 1.1 m [66]. The contribution of meteo-ocean drivers to the lagoon flood risk has been studied for historic [29,67,68,69] and future periods [28,30,34,70], highlighting work focused on the port flood risk which identified the most hazard areas of the port [34].
The port structure lies inside the Ria de Aveiro (Figure 4), contiguous to the lagoon entrance, which serves as a single navigation channel and is protected by two breakwaters that extend seaward north with an extension of 1200 m and south for 700 m, with a wide channel to the port facilities. These features allow the required channel depth and stability to secure passage for large ships during rough winters. The port is composed of several terminals divided into sectors, where the lagoon entrance is 2.4 km from the north sector (north terminal, container and roll-on/roll-off terminal, solid bulk cargo and liquid bulk cargo terminal) and 7.2 km from the south sector (south terminal, high sea fishing port and specialised fisheries terminal). For detailed port information, the reader is referred to the port administration website (portodeaveiro.pt).

2.4. Estuary: Lisbon Port

The Lisbon port is located in the Tagus estuary (Figure 5). The Tagus estuary is one of the largest estuaries on the west coast of Europe and the largest of the Iberian Peninsula, having an EW direction, with a total area of 320 km2 [71]. The estuary is composed of a deep, narrow inlet channel and a shallow inner bay. The inlet channel is 15 km long, 2 km wide and reaches depths of 40 m, constituting the deepest part of the estuary [72]. The inner bay is about 25 km long and 15 km wide, being the shallowest part, and has complex bottom topography with narrow channels, tidal flat areas and small islands on the innermost part of the estuary [73,74]. These features provide protection from the ENE and WSW directions of the predominant winds and from waves during the winter. However, the circulation at the estuary’s mouth is affected by the wave regime, being often exposed to the predominant swells from various incident directions [75].
The estuary hydrography is mainly controlled by the tidal propagation and fluvial discharge from several major rivers (Tagus, Sorraia, Trancão and Vale Michões) [76], which can cause seasonal variability due to the influence of the discharge from the rivers [77,78]. However, during storms, wind, atmospheric pressure and surface waves may also influence the estuarine circulation [79]. The tides are semi-diurnal, and the M2 harmonic constituent is dominant with amplitudes of 1 m [73], with tidal ranges varying from 0.75 m in neap tides in Cascais to 4.3 m in spring tides in the upper estuary [72,80].
Historically, these hydrodynamic drivers and morphological settings promote the flooding of estuarine margins [73,81,82,83]. In fact, the conjugation of the extreme astronomic tidal levels and storm surge conditions has led to flood events in the past [79,84] that significantly impacted flood-prone areas, affecting several residential and economic activities. The anthropogenic pressure on the estuary has been increasing in the margins, with the integration of several uses and activities for urban, industrial and agricultural purposes [84]. The estuary is surrounded by Lisbon, the most populated city in Portugal, featuring different land cover types along its margins [85], which include salt marshes, anthropogenic structures and beaches. This inundation risk is expected to increase in severity due to climate change effects [86].
Lisbon port’s location (Figure 5a) and structure were established during the first decades of the 20th century, boosted by the local industry and maritime traffic. Since then, the expansion of the port towards the inner regions of the estuary has taken place, with the settlement of new terminals. The port activities (Figure 5b) range from handling of containerised cargo, roll-on/roll-off, break-bulk cargo (located on the north bank of the port) and liquid and solid bulk cargo (south bank of the port). For detailed port information, the reader is referred to the port administration website (portodelisboa.pt).

3. Climate Drivers

3.1. Mean Sea Level

The global mean sea level has risen about 21 cm since 1900 and is expected to rise from 0.63 to 1.02 m under the high emissions scenario by 2100 [88,89], whose effects will particularly be felt in coastal areas where the exposure and vulnerability are high [12,87]. The rate of the increase in relative sea level shows sizeable differences between coastal regions across the planet. On the one hand, changes in ocean dynamics caused by climate variability modify ocean currents and consequently, cause the redistribution of mass, heat, and salt, which may result in considerable sea level variability [90]. On the other hand, the melting of glaciers formed during the last ice age is modifying the Earth’s gravity field and deforming the solid Earth (glacial isostatic adjustment (GIA)) [91,92]. The analysis of long-term tidal gauge records provides evidence that the mean sea level is rising at the NWIP coast [93,94], and projection models further evidence an impactful rise in the upcoming decades. Indeed, based on the analysis of Cascais tidal gauge records, Antunes and Taborda [93] found that the mean sea level increased at a rate of 1.9 mm/year from 1920 to 2008, and more recently, Antunes [94], observed an acceleration in mean sea level rise of 3.3 mm/year for the period 1992–2016. For Cascais, the later study further verified that the effect of GIA is negligible (−0.01 mm/year) when compared to the local mean sea level rise. There is broad consensus that the mean sea level will continue to rise in the future in response to climate change. The RCP8.5 sea level variations for 2026–2045 and 2081–2099 [29] indicate a similar rate along the NWIP coast (Table 1). This MSL data corresponds to an ensemble mean of 21 CMIP5 AOGCMs (atmosphere–ocean general circulation models) that support the global estimates of the fifth IPCC report. The most recent IPCC AR6 is a refinement of the AR5 scenarios by considering new processes, however, the MSL predicted for the study region is similar to the one assessed under the AR5 [87,88,89].

3.2. Extreme Sea Level

The ESL can be obtained by considering the observed sea surface elevation (SSE) recorded at the nearest oceanic tidal gauge of each domain, which is decomposed into astronomic and residual series and analysed independently to determine the probability of tidal and storm surge levels [28,29]. The tidal signal can be determined by the astronomic constituents, which are used to obtain the residuals by subtracting the tide from the recorded SSE. The occurrence probability of tidal levels is determined through the analysis of a reconstructed tidal signal of 18.6 years, which corresponds to the fifth component of the lunar nodal cycle [95], considering the constituents obtained by the most uninterrupted time series of SSE. According to [95], the ESL occurs when the tidal level is higher than the mean high water springs (MHWS) at the present mean sea level. However, the MHWS vary geographically, presenting different values at each tidal gauge. Thus, the ports analysed show different MHWS and, consequently, different return periods for the storm surge (Table 2).
The residuals filtered from the SSE are used to determine the probability of the occurrence of storm surge height by analysing the peaks over a threshold value [29]. The empirical cumulative distribution function (CDF) can be computed by following [96], and the parameters of the most probable generalised Pareto distribution (GPD) are computed considering the lower and upper limits at a confidence level of 95% to investigate the adjustment between empirical and GPD distribution [29].
Under climate change scenarios, the ESL can be determined considering that the mean sea level rise dominates the increase in floods, whereas changes in storm surge heights and tides are expected to be minimal in the future [97,98,99] (Table 3). The values for near future and far future horizons consider the MSL rise for the RCP8.5 of 0.19 m and 0.68 m, respectively.

3.3. Waves

Ocean waves are generated by the wind stress effect on the interface between the ocean and the atmosphere [97,98,99]. The wind–wave interaction is an important contributor to coastal flooding, with significant impacts on low topography areas and marine activities such as shipping and port structures. Flooding due to wave overtopping from harbour resonance can pose a threat to berthing operations, especially for harbours with entrances exposed to shallow foreshores [100,101,102,103]. Wave heights and energy have been increasing in recent decades [50,51,99,104], showing higher increases in extreme values compared to the mean conditions [99,105,106]. Previous studies have assessed significant wave height, peak period and wave power under the RCP 8.5 [50,51,107,108], showing changes in the projected global mean wave climate for the mid- and late-21st century. Significant changes in the Hs and Tm are expected in the Atlantic Ocean during the winter months (December, January and February), where the mean annual Hs and Tm trends slowly decrease towards the end of the century [108]. However, sea surface wind speeds have been increasing globally, and the increases are stronger during the winter [109], which may lead to higher energetic waves [110] and present a noticeable seasonal difference [109,111,112].
Previous research [34] identified the best climate models to reproduce the winter climate, where the BCC-CSM1.1 global climate model (GCM) was found to be the best model to characterise the wave climate in the Atlantic region around the Iberian Peninsula. These results show that the model’s performance can be seasonally specific as [51,113] found that the MIROC5 GCM was the best model to reproduce the area’s annual mean wave conditions. This wave climate under climate change scenarios can cause damage to coastal defences and infrastructure, contributing to increasing flood levels through wave setup. Moreover, climate change can alter waves through changes to the water depth at the coast through sea level rises.

3.4. River Streamflow

Climate change is expected to influence the global and regional hydrological cycles [114,115,116]. The global river runoff can increase significantly by 4% based on an increase of 1°C in global temperature [117], which can be linked to a combination of natural and anthropogenic factors because the dynamic properties of the hydrological cycle depend on climatic, physiological and structural factors [118,119]. The runoff features a distinct seasonality in some regions [120], which increases/decreases the tendency for high and low flows. However, due to the alteration in seasonal weather, the annual streamflow volume can be concentrated in certain months in certain basins [120], leading to extreme hydrologic and weather patterns such as floods under climate change drivers [121,122,123] and contributing to the local sea level change [124,125,126,127,128,129,130,131,132,133,134,135,136]. The NWIP coast rivers’ streamflow can be obtained from the Hydrological Predictions for the Environment (E-hype) model online database (https://hypeweb.smhi.se/explore-water/historical-data/europe-time-series/ (accessed on 1 November 2022)), presenting a predicted decrease of 25% under the high emission scenario (Table 4) (https://hypeweb.smhi.se/explore-water/climate-impacts/europe-climate-impacts/ (accessed on 1 December 2022)), which is in accordance with the precipitation reduction expected to occur in these regions [127], but also with an increase in extreme events [128,129].

4. Port Flood Assessment Procedures under Future Conditions

Ocean circulation is a crucial climate regulator through complex and diverse mechanisms that interact to produce this circulation. Wind-driven combined with density-driven circulation defines ocean circulation from a global to a regional scale. This circulation is still poorly understood due to its volatility to climate drivers and their spatial variability, which are predicted to change during the following decades [130,131].
The flood assessment of port facilities under future conditions requires the simulation of the flow and short wave propagation at a local scale. As the mean sea level rises and storms become more intense, the prediction of these drivers becomes essential to address the climate change impacts on ports, which are susceptible to being flooded due to their location. This assessment is only viable through numerical modelling due to the large spatial and temporal scales involved. Several numerical models are suitable for modelling the hydrodynamics in deep, coastal and shallow waters. The model selection should consider the knowledge of the model’s limitations, the processes under study and the available data.
Considering these criteria, assessing future flood impacts is not straightforward, it requires data collection regarding meteo-ocean drivers and the statistical analysis best suited to identify the most accurate and reliable drivers to be used as forcing conditions in the numerical models. The meteo-ocean drivers are available in numerous databases, with the principal resource for future climate data being the global climate models (GCMs) from the different phases of the coupled model intercomparison project (CMIP). The most extensive databases are related to phase 5 of the CMIP (https://www.wcrp-climate.org/wgcm-cmip/wgcm-cmip5 (accessed on 1 December 2022)), while the newest phase 6 is being published (https://www.wcrp-climate.org/wgcm-cmip/wgcm-cmip6 (accessed on 1 December 2022)).
However, the CMIP6 GCMs have a coarse resolution, whereas CMIP5 GCMs have been used and applied to several regions by using a downscale of the GCMs and obtaining higher resolution regional climate models (RCMs). These RCMs can be found in other online databases where future wind and wave fields are available (Copernicus, the World Meteorological Organization’s Catalogue for Climate Data, the Commonwealth Scientific and Industrial Research Organisation (CSIRO), among others). These fields can be used in third-generation spectral wind–wave models (e.g., Delft3D though the wave module [132], WAVEWATCH III [133], SWAN [134], among others) in order to downscale the global results at refined resolutions. The results from wave models can be used to determine the currents in the hydrodynamic model by using an offline or a two-way wave–current interaction, which is limited to the features of the hydrodynamic model and the type of data. A summary of the procedure followed in this study to assess the flood risk under the future winter climate is shown in Figure 6.

4.1. Wave GCM Statistical Analysis

As mentioned before, it is essential to identify the best GCMs that characterise the wave climate of the study area. For this purpose, historical and future Hs and Tp data can be obtained from the simulations available in the online databases as a starting point. The skill of the CMIP5 GCMs available from the CSIRO database [46] was evaluated in previous studies [50,51,113] for the Atlantic Arc and the NWIP coast. This performance metric of GCMs has been applied [135,136,137,138,139,140] to explore the frequency and severity of climate extremes. Other indicators, such as root mean square error (RMSE) and bias were also used to assess the performance of various climate parameters [141,142,143,144,145,146] and the best GCM to characterise the winter wave climate in the study area [34]. The authors applied the RMSE and the bias for the winter months in the NWIP coast (December, January and February) [147] for the return periods of Tr10, Tr25 and Tr100 and found that the BCC-CSM1.1 GCM represents the best climate model to reproduce the NWIP coast extreme wave climate.

4.2. Wave Dynamical Downscaling

The coarse resolution of the GCMs is not suitable to be used at a regional scale, which makes necessary dynamical downscaling to propagate the wave to a finer resolution at the port entrance. The third-generation spectral wave models can be used to perform the downscaling of the selected GCM. The downscaling can be conducted by implementing the model in a nested approach, where the domain resolution increases towards the study area. An example of a nested domain comprising three sets of domains with different resolutions is shown in Figure 7.
The larger domain (L1) extends from 34.54° N and 14.54° W to 45.54° N and 5.54° W, followed by the second domain (L2) from 37.54° N and 12.54° W to 44.54° N and 6.88° W, and the third set of domains (Punta Langosteira (L3), Vigo (L4), Aveiro (L5) and Tagus (L6)) which correspond to the local ports domains. The resolution applied to each domain was the ratio of 1/3 from the previous domain, creating a resolution of 1/3°, 1/9° and 1/27° for domains L1, L2 and L3-L6, respectively. The numerical bathymetry was built based on the General Bathymetric Chart of the Oceans (GEBCO) (www.gebco.net (accessed on 1 November 2022)), the European Marine Observation and Data Network (EMODnet) (emodnet.ec.europa.eu/en/bathymetry (accessed on 1 November 2022)) and the International Hydrographic Organization Data Centre for Digital Bathymetry (IHO DCDB) (www.ncei.noaa.gov/maps/iho_dcdb (accessed on 1 November 2022)) database. Regarding the coastal and port regions, the use of high-resolution bathymetry is required, which was obtained from the port’s administration.
The wave field (Section 4.1) is imposed at the open boundaries as a time- and space-varying data with the highest temporal resolution available for high accuracy results, which is 6 h for the BCC-CSM1.1 GCM. A wave spectrum of 25 frequencies (0.0418–1 Hz) and 36 directional bands can be applied using the SWAN numerical model [34,51,113]. The model must also be forced with the wind GCM or RCM (if available) corresponding to the wave GCM/RCM used. For this region, only the BCC-CSM1.1 GCM r1i1p1 is available, which can be obtained through the CEDA archive (https://archive.ceda.ac.uk/ (accessed on 1 November 2022)), the Coordinated Regional Climate Downscaling Experiment (CORDEX) (https://cordex.org/ (accessed on 1 November 2022)) or the European Centre for Medium-Range Weather Forecasts (ECMWF) (https://www.ecmwf.int/ (accessed on 1 November 2022)). This GCM is characterised by a horizontal resolution of 1.125° × 1.125° with a 3-hourly temporal resolution.
The wave model’s physical parameters included a stage 1 IEC model [34,50] and triads, bottom friction, depth-induced breaking and quadruplets [51,113,148]. The simulations were run for the climate periods between 1979–2005, 2026–2045 and 2081–2099, corresponding to the historical, near future and far future periods.

4.3. Wave Parameters Characterisation

The Hs, Tp and Dm (mean wave direction) parameters are often used to study extreme waves, including runup, erosion, and wave-driven longshore transport, which can change coastal processes during these extreme events [144,149]. Also, coastal flooding highly depends on Hs and Tp combined with high tides and storm surges [150]. The wave parameters are obtained by the model used to downscale the GCM wave fields, which can be analysed to calculate the return periods for the wave parameters. The hourly values obtained over 1979–2005 were used to determine the maximum Hs and Tp and fitted to statistical distributions to estimate Tr10, Tr25, and Tr100. The Dm can be estimated by the wave arrival predominance. Similar to [34], the mean wave direction was obtained for Lisbon, Vigo and A Coruña Outer Port (Figure 8).
The historical (1979–2005), near future (2026–2045) and far future (2081–2100) return periods of Dm, Hs and Tp can be observed in Table 5.

4.4. Hydrodynamic Model

The Delft3D suite was used to simulate the Aveiro lagoon and Tagus estuarine hydrodynamics [34,62,68,87,151], as well as the hydrodynamics of the Ria de Vigo and the coastal region around the A Coruña Outer Port [60,62]. The Delft3D-FLOW module [152] was selected to simulate the tide, freshwater discharge and wind-driven flows, as well as the wave-driven currents with accurate results. The model implementations developed used local domains [34,68,87,151] and regional domains [60,62], focusing on hydrodynamic simulation. The numerical bathymetry used a combination of detailed topographic data from LIDAR surveys provided by the Portuguese General Direction of the Territory and bathymetry provided by the different port administrations under analysis. For detailed model implementation, the reader is referred to [34,62,87]. The various model calibration was performed for different periods, showing high agreement between the modelled and observational data with high skill and low RMSE, where the best results were found in the vicinity of the interface between the coastal systems and the ocean, where the ports are located.

4.5. Flood Assessment Scenarios Design

A key challenge is to choose an appropriate method to predict floods under climate change scenarios. Several authors have obtained the return period of climate drivers and assessed the flood impact on coastal regions [28,29,34]. A similar approach to [34] was applied using the Delft3D FLOW and WAVE modules to propagate the wave parameters across the region (Section 4.3) and simultaneously simulate the hydrodynamic conditions for each climate and return period. The hydrodynamic model uses the ESL, taking into account the mean sea level, storm surge height and astronomic tide, the riverine discharges and the wave parameters. The hydrodynamic implementation simulated the historical, near future and far future periods for the Tr10, Tr25 and Tr100. A reference scenario representing the present extreme climate level was also determined (Table 6).
These scenarios were imposed at the open ocean boundary of each model with the time series of the ESL, with nine days as the initial spin-up, and with a tide considering the reference value [34]. After, the following two days considered the storm surge, tide and extreme river discharge, with the matching between their peaks representing the ESL for each climate period and return period (Figure 9).

5. Flood Assessment

Flood extent maps and flooded areas of the port’s terminals are shown similarly to [34]. The flood assessment considers the reference level as a starting point where no flood occurs in the terminals. The reference scenario considers the tide with the historical MSL and average riverine discharges. A comparison between the reference and the Tr10, Tr25, and Tr100 of the ESL, storm surges, waves and riverine discharge scenarios is performed, indicating the port terminals susceptible to floods and the corresponding flooded area (Table 7).
Previous works have shown that climate change is expected to increase Ria de Aveiro’s flood risk [28,30,34,70] due to increased oceanic and fluvial drivers, posing higher impacts at the end of the century [19]. Most of the Aveiro port terminals lie near the lagoon entrance in a low-lying area exposed to oceanic drivers, such as storm surges. Ribeiro et al. [34] observed that under the historical period (Figure 10a), the flooded areas are located in the central lagoon region for a Tr10 and will increase slightly with higher return periods. These flooded areas are expanded for higher return periods during the near future (Figure 10b), but the flood risk will increase significantly (>60%) under the Tr100 climate drivers at the end of the century (Figure 10c). The authors also assessed which climate driver contributed most to the flood risk, observing that waves have a residual impact due to the lagoon geometry and the natural protection from the sea waves. The river discharges affect mostly the upstream terminals, whereas the MLS rise is an important driver of the flood risk due to its contribution to the total water level, which can be intensified under storm surge events, the most prevalent climate driver, which contributes to large flood extensions [34].
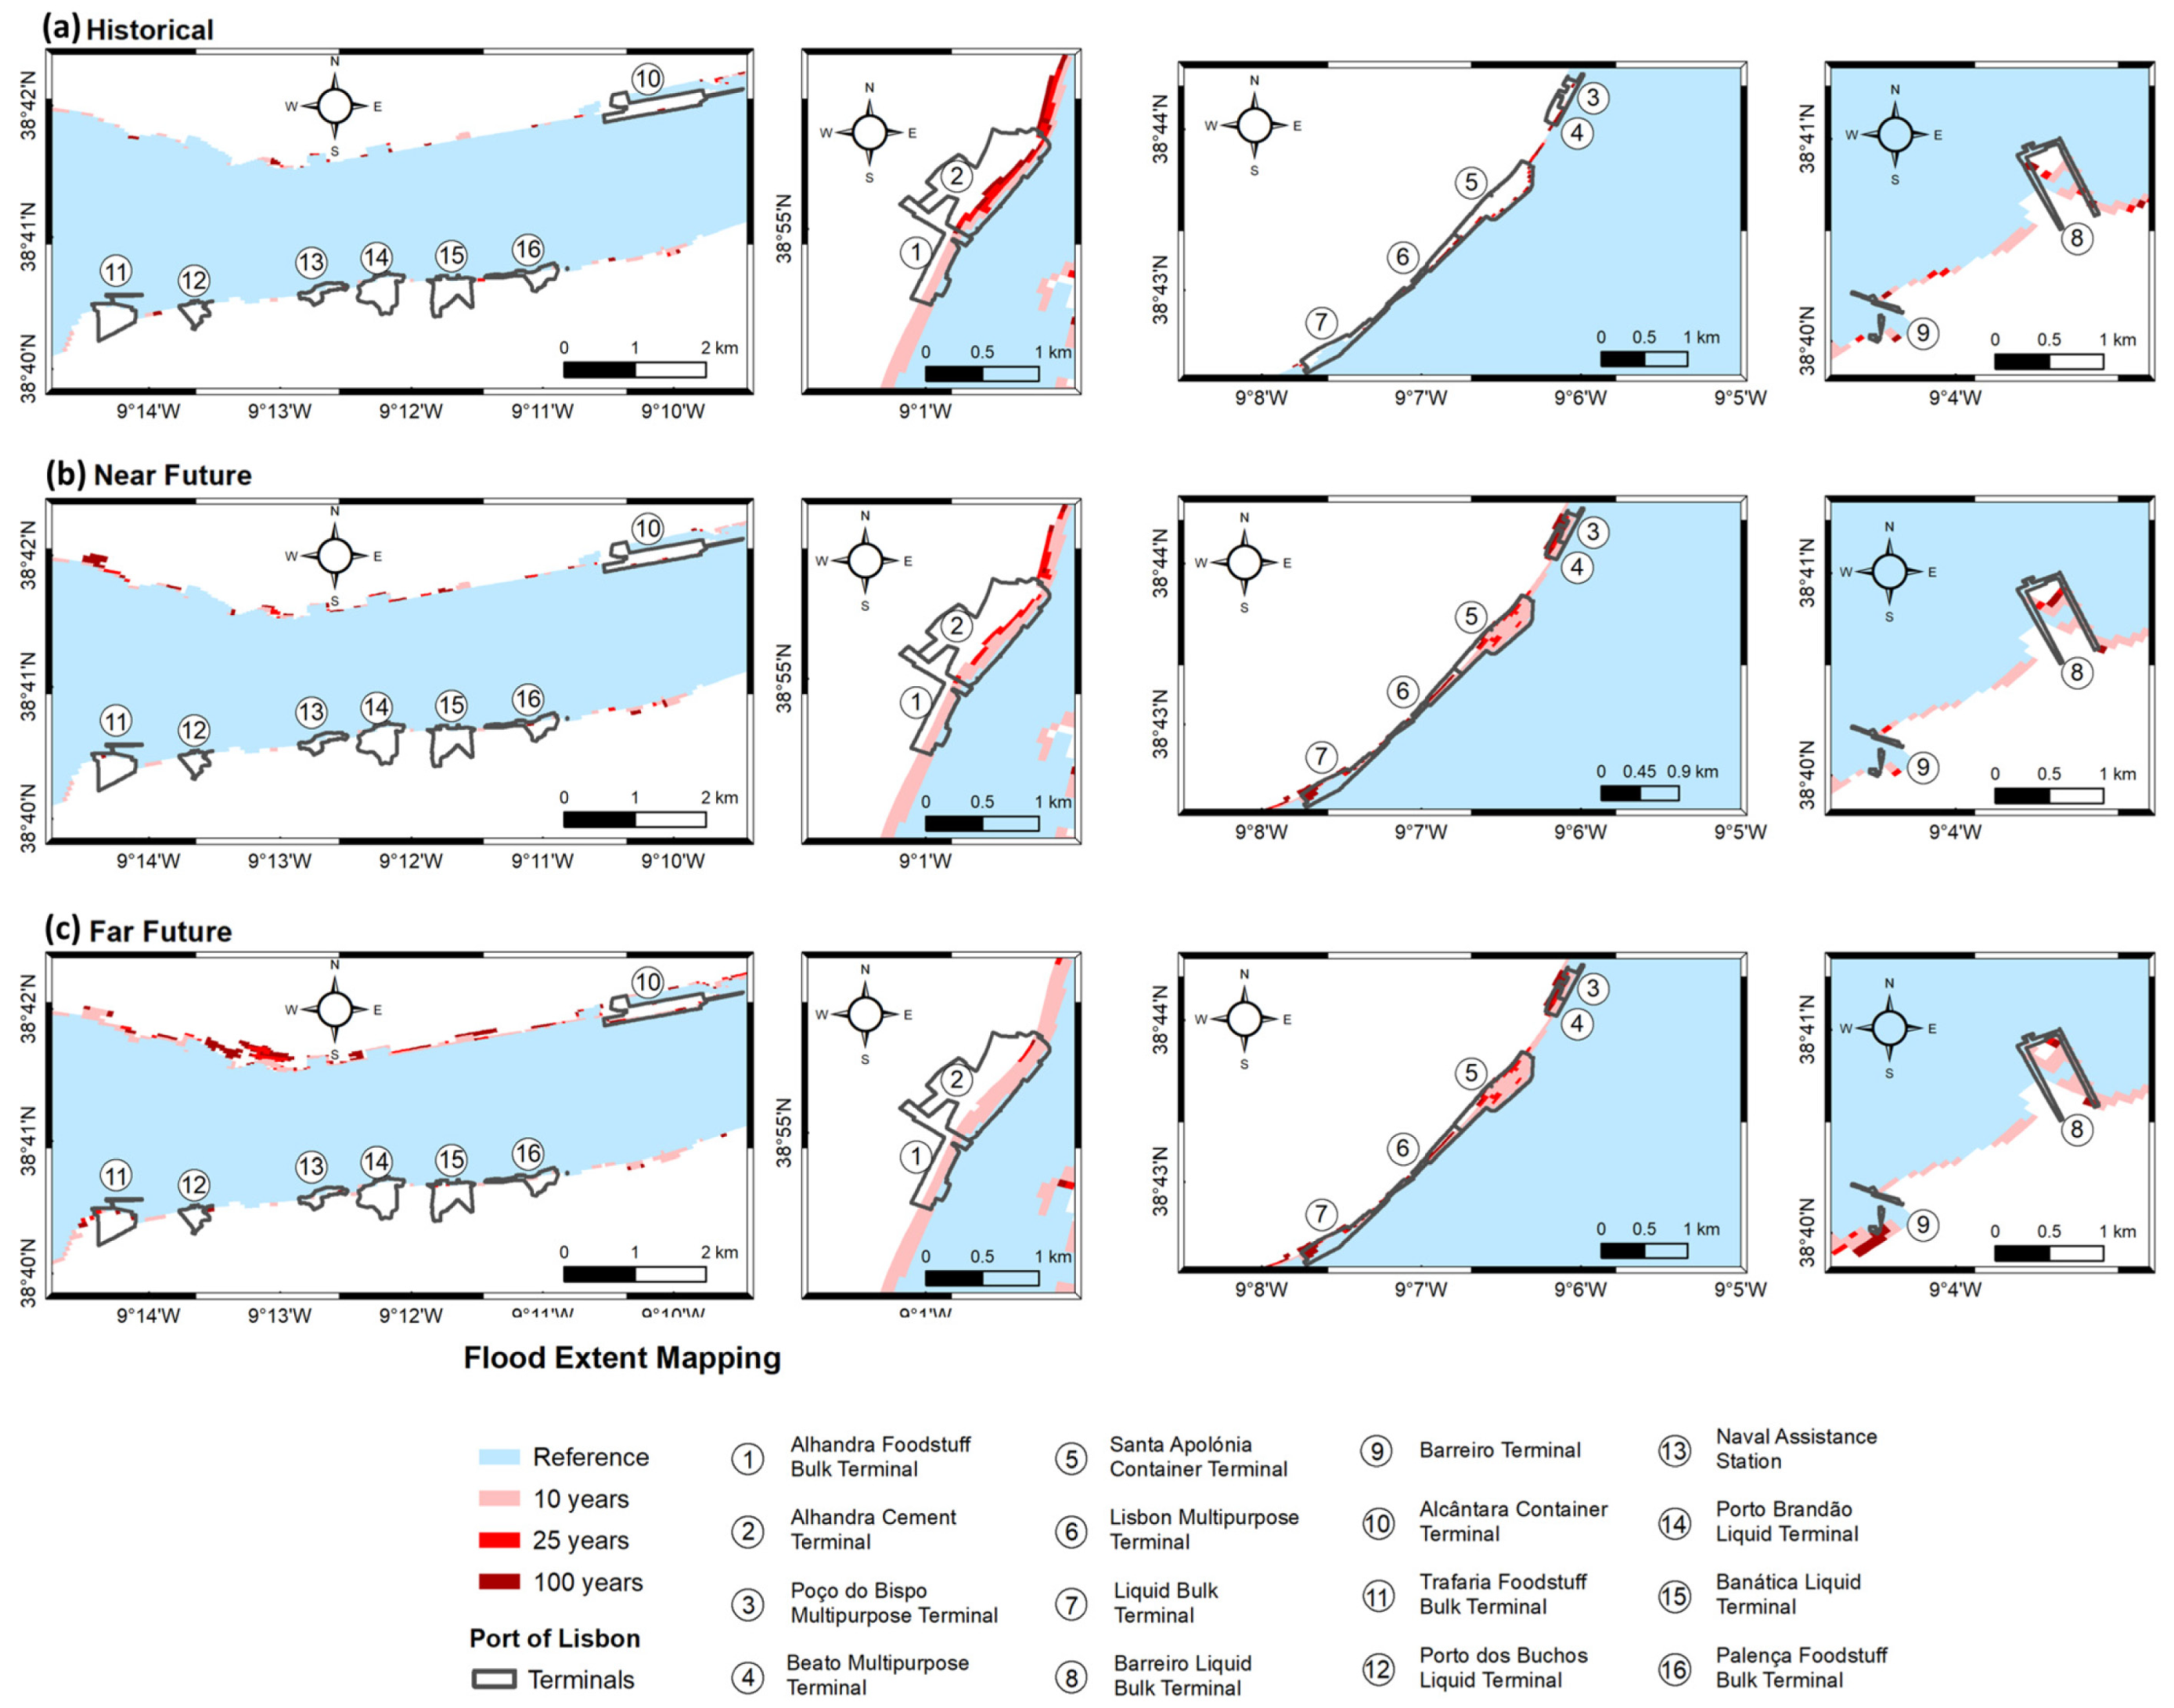
Similar to the Aveiro port, the Lisbon port benefits from natural shelter, whereby its entrance orientation protects it from the most NNW energetic waves during winter. However, the low-lying margins of the estuary compromise the port’s resilience to rising sea levels caused by the climate drivers MSL, ESL and riverine discharges. As a result of these drivers, most of the Lisbon port terminals are threatened by floods (Figure 11), with emphasis on the terminals located in the inner estuary for the historical period (Figure 11a), as previously observed by [83]. These terminals show significant sections of their area flooded under the Tr10 scenario due to low-lying margins. The flood extent intensifies with higher return periods, being more notorious under the Tr100, where most of the terminals in the inner estuary are exposed to intense floods. The flood extent for the historical period shows that Lisbon port’s resilience to floods is high for the terminals located at the entrance channel (10–16), while the terminals located inside the estuary are highly vulnerable to floods under the Tr100 scenario.
The flood hazard increases for higher return periods with the increase of the ESL, whereas for future periods (Figure 11b,c), the climate drivers, such as the MSL, promote large floods along the estuary margins [86]. The terminals located in the entrance channel of the estuary face marginal inundations under the Tr10 scenario, which increases significantly under the Tr25 and Tr100 scenarios. Lisbon port’s risk to floods is high with the far future climate drivers under Tr10, Tr25 and Tr100 scenarios.
These floods are observed at present under dangerous meteorological conditions, and the increase in MSL is expected to enhance its extent and impact. Thus, the risk will increase significantly in some terminals under climate change scenarios, where large port sections may be flooded.
The Vigo port has high resilience to the climate drivers in the historical period, as only some marginal areas of the port terminals are inundated (Figure 12a). The ports resilience is also observed for the near future climate drivers (Figure 12b), where the flood extent impact slightly increases compared to the historical period. These floods occur at the margins of the terminals, where the slipways are located, which will not restrain the activities. The flooded area is considerably expanded for the far future climate drivers (Figure 12c), representing some challenges regarding long-term climate change readiness for the uses and activities management and operability that lies at the estuary margins. During this period, the flooding of some port areas is quite significant, compromising the port activities in these sectors, particularly the central section of the port (4, 5 and 6). These flood patterns suggest that the climatic drivers considered are quite relevant for determining future flooding at this port, which could result in damage and interruptions to terminals in the distant future [19,153].
In contrast with the previous case studies analysed, the A Coruña Outer Port is located in a marine system influenced only by oceanic drivers. In addition, the port is relatively recent, and therefore climate change impacts were considered during its design and recent adaptations. Based on this, it is expected that climate drivers do not contribute to the flooding of the port terminals, as shown in Figure 13. Note that terminal 1, an expansion terminal, is not in use and is intended to be flooded during high tides at the date of this assessment. Thus, the port shows high resilience to flooding, even under Tr100 of the ESL. This resilience is also observed for future periods (Figure 13b,c), where no flood is observed in the port terminals.

6. Conclusions and Implications

Climate change is expected to profoundly affect the facilities of the ports exposed to sea level rise and extreme weather events. The impacts can vary according to the geographic location and the surrounding pressure, from anthropogenic sources to morphological features, which can be identified as the significant interventions to the construction, operation and maintenance of the facilities that can result from the vulnerability to the various stresses along their life span. This issue is fundamental considering the exposition of some ports to climate drivers, whereas natural harbours shelter some ports, others rely on artificial structures that protect against high waves and strong currents.
The A Coruña Outer Port, Vigo, Aveiro and Lisbon ports were selected considering their locations, coastal, rias, lagoon and estuary environments, which may face different challenges under climate change. The flood risk of the ports was assessed under the historical and future climates. This assessment was conducted under extreme weather events during the winter season by considering climate change scenarios for 10-, 25- and 100-year return periods relating to storm surges, riverine input and wave regime. This analysis showed that the flood risk varies significantly according to the location of the ports, where some environments are more exposed to particular climate drivers than others, threatening the port’s performance.
Following the identification of the significant threats to each port, the flood risk due to the climate drivers was assessed, which can be summarised as:
  • Aveiro port, located in an inland lagoon system with a single connection to the ocean, serves as a natural shelter from hazardous weather and waves. This environment is characterised by low and flat topography making it susceptible to floods when sea levels or river discharges are high. The combination of these drivers increases the flood hazard drastically, which was observed in the Aveiro port under the Tr100 scenarios with several terminals subject to significant inundation. The flood extent increases significantly at most of the terminals under future drivers, highlighting the flood risk resulting from the mean sea level rise and storm surges, which can be enhanced by coincident river discharges;
  • Lisbon port is located in the Tagus estuary. The hydrodynamic drivers are directly influenced by the geomorphology of the estuary, with a deep inlet channel and a broad and shallow inner domain. These characteristics constrain ocean waves’ propagation and limit the influence of river discharges in the estuary. However, the estuary geomorphology, hydrodynamic conditions, and territory occupation promote large floods observed under the Tr100 scenarios for all climate periods. The flood risk in these scenarios is higher in the inner domain, where several terminals may be completely flooded because of the end of century climate drivers. This highlights the need to increase the port’s resilience to future ESL;
  • Vigo port is situated in the Ria de Vigo. The ria is characterised by a wide mouth and a funnel shape, and it is sheltered by the Cíes Islands, which grants protection from extreme waves. The port terminals face partial inundations under far future scenarios, with increased flood risk in the Tr100 scenarios for some terminals. The flood patterns show that Vigo port is susceptible to flooding from the combination of sea level rise and storm surges under climate change drivers;
  • A Coruña Outer Port is different from the other ports, being the most recent and located in a coastal environment, which is exposed to Atlantic storms. This port relies on an artificial shelter from hazardous weather provided by breakwaters. The port’s high resilience to climate change protects the port from floods driven by the ESL and storm surges.
From a holistic standpoint, a port’s flood risk under the future climate will increase significantly due to winter storms if climate change drivers accelerate as predicted. Port infrastructure needs to be strengthened to protect them from sea level rises, which brings local problems in terms of application and planning. There can be no single general solution at a port or national scale because the infrastructure and risk vary in this space. The combination of MSL rise and storm surges are the main causes of floods, but the effects of river discharge and waves cannot be excluded, as they can contribute significantly to the ESL in lagoons and coastal environments, respectively. Waves mainly affect the ports located outside of natural harbours, which can cause flood overtopping in these locations. In addition, a sea level rise is projected to double the frequency of coastal flooding at most locations [21,22], enhancing overtopping by energetic waves during hazardous weather.
Coastal flooding is the dynamic interaction of various oceanographic drivers [154,155,156], which may exhibit high interannual variability, such as the North Atlantic Oscillation (NAO) [157,158,159,160]. Future model developments should consider other processes responsible for port flooding (e.g., harbour oscillations and NAO) and validate the flood extent using satellite-derived data. However, this task can be challenging due to the lack of good satellite coverage acquisition during storm conditions. Moreover, the flood assessments analysed have large time gaps and do not include the energetic winter storms that occurred after 2005 [161,162,163,164,165,166,167]. Flood hazard studies should also consider the non-linear interaction between the climate drivers and their contribution to water level variability. Previous works [168,169,170,171] suggest that climate driver interactions cannot be neglected, which can occur when assuming the linear addition of sea level rise (among other climate drivers). These non-linear interactions can represent a significant part of the water level changes. Arns et al. (2015) [172] assessed the impact of sea level rise on storm surge water levels and observed a slight increase in return water levels when considering the interactions between mean sea level, tide and storm surge (12 cm in a 50-year return) compared to those who neglect these interactions.
In the present form, the flood assessment may be underestimated and future studies should consider the most recent data. Other anthropogenic factors such as dredging, the expansion or construction of new ports, flood barriers, and other structures could modify the flood extent. Thus, future research should consider present and projected anthropogenic activities and uses when assessing the flood extent.
The definition of adaptation or mitigation countermeasures against flooding is not straightforward due to the high uncertainty of projections related to climate change’s multiple spatial and time scales. Climate projections rely on probabilities of specific processes occurring, and ports tend to focus on the observed general conditions and act accordingly by adapting or building new structures to reduce the impacts. A port’s planning horizons are also around 5 to 10 years [173] and are subject to the volatility of changing business circumstances. These timescales are much shorter than existing infrastructures and typical climate change timescales, which are on the scale of thirty to hundreds of years, making it challenging to implement efficient long-term measures. For this reason, a port’s resilience and adaptation planning requires a risk assessment to design the adaptation planning, which could include the construction of seawalls, dikes or marine ecosystems, and relocation or elevation to compensate for a sea level rise [19,174].
Drawing on the above, planning responses must be applied to the resilience of the infrastructures and operational measures, like relocating the terminals and zones according to the commercial value of the services and goods. However, continuous observation and flood assessment must be performed uninterrupted due to the development of new climate models, which will result in more reliable and accurate climate change predictions and serve as a support toolkit to assist in the definition of adaptation, management, and resilience measures for future challenges.

Author Contributions

Conceptualisation, A.S.R., C.L.L. and J.M.D.; methodology, A.S.R., C.L.L. and M.G.-G.; software, A.S.R., C.L.L., M.C.S. and M.G.-G.; validation, M.C.S., M.G.-G., N.V. and J.M.D.; investigation, A.S.R. and C.L.L.; writing original draft preparation, A.S.R.; writing review and editing, A.S.R., C.L.L., M.C.S., M.G.-G., N.V. and J.M.D.; visualisation, M.C.S., M.G.-G. and J.M.D.; supervision, J.M.D. and M.G.-G.; funding acquisition, J.M.D. and M.G.-G. All authors have read and agreed to the published version of the manuscript.

Funding

The first author of this work has been supported by the Portuguese Science Foundation (FCT) through a doctoral grant (SFRH/BD/114919/2016). The second author is funded by national funds through the Portuguese Science Foundation (FCT) under the project CEECIND/00459/2018. Thanks are due to FCT/MCTES for the financial support to CESAM (UIDB/50017/2020+UIDP/50017/2020+LA/P/0094/2020) through national funds. The present study is also part of the project “WECAnet: A pan-European network for Marine Renewable Energy” (CA17105), which received funding from the HORIZON2020 Framework Programme by COST (European Cooperation in Science and Technology), a funding agency for research and innovation networks.

Institutional Review Board Statement

Not applicable.

Informed Consent Statement

Not applicable.

Data Availability Statement

Data available on request due to funding restrictions. The data presented in this study are available on request from the corresponding author. The data are not publicly available due to funding restrictions.

Acknowledgments

The authors acknowledge the regional sea level data from IPCC AR5 distributed in netCDF format by the Integrated Climate Data Center (ICDC, icdc.cen.uni-hamburg.de), University of Hamburg, Hamburg, Germany. The authors also acknowledge the topography data provided by the Aveiro Port Administration, Aveiro, Portugal.

Conflicts of Interest

The authors declare no conflict of interest. The funders had no role in the design of the study; in the collection, analyses, or interpretation of data; in the writing of the manuscript; or in the decision to publish the results.

References

  1. IMO. IMO’s Contribution to Sustainable Maritime Development. In Capacity-Building for Safe, Secure and Efficient Shipping on Clean Oceans through the Integrated Technical Co-Operation Programme; International Maritime Organization—United Nations: London, UK, 1999; 12p. [Google Scholar]
  2. Grenzeback, L.R.; Lukmann, A.T. Case Study of the Transportation Sector’s Response to and Recovery from Hurricanes Katrina and Rita; Cambridge Systematics, Inc.: San Francisco, CA, USA, 2007; pp. 1–44. [Google Scholar]
  3. Rodrigue, J.-P.; Comtois, C.; Slack, B. The Geography of Transport Systems, 4th ed.; Routledge: London, UK, 2016; ISBN 9781315618159. [Google Scholar]
  4. Strauss, B.H.; Orton, P.M.; Bittermann, K.; Buchanan, M.K.; Gilford, D.M.; Kopp, R.E.; Kulp, S.; Massey, C.; de Moel, H.; Vinogradov, S. Economic Damages from Hurricane Sandy Attributable to Sea Level Rise Caused by Anthropogenic Climate Change. Nat. Commun. 2021, 12, 2720. [Google Scholar] [CrossRef]
  5. Almar, R.; Ranasinghe, R.; Bergsma, E.W.J.; Diaz, H.; Melet, A.; Papa, F.; Vousdoukas, M.; Athanasiou, P.; Dada, O.; Almeida, L.P.; et al. A Global Analysis of Extreme Coastal Water Levels with Implications for Potential Coastal Overtopping. Nat. Commun. 2021, 12, 3775. [Google Scholar] [CrossRef]
  6. Dangendorf, S.; Hay, C.; Calafat, F.M.; Marcos, M.; Piecuch, C.G.; Berk, K.; Jensen, J. Persistent Acceleration in Global Sea-Level Rise since the 1960s. Nat. Clim. Chang. 2019, 9, 705–710. [Google Scholar] [CrossRef] [Green Version]
  7. Grinsted, A.; Christensen, J.H. The Transient Sensitivity of Sea Level Rise. Ocean. Sci. 2021, 17, 181–186. [Google Scholar] [CrossRef]
  8. Bamber, J.L.; Oppenheimer, M.; Kopp, R.E.; Aspinall, W.P.; Cooke, R.M. Ice Sheet Contributions to Future Sea-Level Rise from Structured Expert Judgment. Proc. Natl. Acad. Sci. USA 2019, 116, 11195–11200. [Google Scholar] [CrossRef] [Green Version]
  9. Harrison, G.P.; Wallace, A.R. Sensitivity of Wave Energy to Climate Change. IEEE Trans. Energy Convers. 2005, 20, 870–877. [Google Scholar] [CrossRef] [Green Version]
  10. Coumou, D.; Di Capua, G.; Vavrus, S.; Wang, L.; Wang, S. The Influence of Arctic Amplification on Mid-Latitude Summer Circulation. Nat. Commun. 2018, 9, 2959. [Google Scholar] [CrossRef] [Green Version]
  11. Fraile-Jurado, P.; Guisado-Pintado, E.; Álvarez-Francoso, J.I.; Díaz-Cuevas, P.; Ojeda-Zújar, J. Wave Energy Patterns under Different Sea Level Rise (SLR) Probabilities in the Andalusian Atlantic Coast. J. Coast. Res. 2020, 95, 1088. [Google Scholar] [CrossRef]
  12. Core Writing Team; Pachauri, R.; Meyer, L. (Eds.) IPCC Climate Change 2014: Synthesis Report. In Contribution of Working Groups I, II and III to the Fifth Assessment Report of the Intergovernmental Panel on Climate Change; IPCC: Geneva, Switzerland, 2014; ISBN 9789291691432. [Google Scholar]
  13. Swain, D.L.; Singh, D.; Touma, D.; Diffenbaugh, N.S. Attributing Extreme Events to Climate Change: A New Frontier in a Warming World. One Earth 2020, 2, 522–527. [Google Scholar] [CrossRef]
  14. Diffenbaugh, N.S.; Singh, D.; Mankin, J.S.; Horton, D.E.; Swain, D.L.; Touma, D.; Charland, A.; Liu, Y.; Haugen, M.; Tsiang, M.; et al. Quantifying the Influence of Global Warming on Unprecedented Extreme Climate Events. Proc. Natl. Acad. Sci. USA 2017, 114, 4881–4886. [Google Scholar] [CrossRef] [Green Version]
  15. Wunderling, N.; Donges, J.F.; Kurths, J.; Winkelmann, R. Interacting Tipping Elements Increase Risk of Climate Domino Effects under Global Warming. Earth Syst. Dyn. 2021, 12, 601–619. [Google Scholar] [CrossRef]
  16. Cid, A.; Menéndez, M.; Castanedo, S.; Abascal, A.J.; Méndez, F.J.; Medina, R. Long-Term Changes in the Frequency, Intensity and Duration of Extreme Storm Surge Events in Southern Europe. Clim. Dyn. 2016, 46, 1503–1516. [Google Scholar] [CrossRef]
  17. Flor-Blanco, G.; Alcántara-Carrió, J.; Jackson, D.W.T.; Flor, G.; Flores-Soriano, C. Coastal Erosion in NW Spain: Recent Patterns under Extreme Storm Wave Events. Geomorphology 2021, 387, 107767. [Google Scholar] [CrossRef]
  18. Bruneau, N.; Fortunato, A.B.; Dodet, G.; Freire, P.; Oliveira, A.; Bertin, X. Future Evolution of a Tidal Inlet Due to Changes in Wave Climate, Sea Level and Lagoon Morphology (Óbidos Lagoon, Portugal). Cont. Shelf Res. 2011, 31, 1915–1930. [Google Scholar] [CrossRef]
  19. Christodoulou, A.; Christidis, P.; Demirel, H. Sea-Level Rise in Ports: A Wider Focus on Impacts. Marit. Econ. Logist. 2019, 21, 482–496. [Google Scholar] [CrossRef]
  20. Vitousek, S.; Barnard, P.L.; Fletcher, C.H.; Frazer, N.; Erikson, L.; Storlazzi, C.D. Doubling of Coastal Flooding Frequency within Decades Due to Sea-Level Rise. Sci. Rep. 2017, 7, 1399. [Google Scholar] [CrossRef] [Green Version]
  21. Vousdoukas, M.I.; Mentaschi, L.; Voukouvalas, E.; Verlaan, M.; Jevrejeva, S.; Jackson, L.P.; Feyen, L. Global Probabilistic Projections of Extreme Sea Levels Show Intensification of Coastal Flood Hazard. Nat. Commun. 2018, 9, 2360. [Google Scholar] [CrossRef] [Green Version]
  22. Lambert, E.; Rohmer, J.; Le Cozannet, G.; van de Wal, R.S.W. Adaptation Time to Magnified Flood Hazards Underestimated When Derived from Tide Gauge Records. Environ. Res. Lett. 2020, 15, 074015. [Google Scholar] [CrossRef]
  23. USCCSP. Impacts of Climate Change and Variability on Transportation Systems and Infrastructure: Gulf Coast Study, Phase I. A Report by the U.S.; Systematics; Climate Change Science Program and the Subcommittee on Global Change Research: Washington, DC, USA, 2008; 445p. [Google Scholar]
  24. Gaythwaite, J.W. Design of Marine Facilities for the Berthing, Mooring, and Repair of Vessels; American Society of Civil Engineers: Reston, VA, USA, 2004; ISBN 978-0-7844-0726-4. [Google Scholar]
  25. Stenek, V.; Amado, J.; Connell, R.; Palin, O.; Wright, S.; Pope, B.; Hunter, J.; Mcgregor, J.; Morgan, W.; Stanley, B.; et al. Climate Risks and Business Ports: Terminal Marítimo Muelles El Bosque (Cartagena, Colombia); International Finance Corporation: Washington DC, USA, 2011; 190p. [Google Scholar]
  26. Nicholls, R.J.; Hanson, S.; Herweijer, C.; Patmore, N.; Hallegatte, S.; Corfee-Morlot, J.; Château, J.; Muir-Wood, R. Ranking Port Cities With High Exposure and Vulnerability to Climate Extremes: Exposure Estimates; Environment Working Papers No. 1; Organisation for Economic Co-Operation and Development: Paris, France, 2008; 61p. [Google Scholar]
  27. Hennessy, K.; Bathols, C.P.J.; Mcinnes, K.; Pittock, B.; Suppiah, R.; Walsh, K.; Hennessy, K. Climate Change in the Northern Territory. In Consultancy report for the Northern Territory Department of Infrastructure, Planning and Environment; CSIRO (Commomwealth Scientific and Industrial Research Organisation): Canberra, Australia, 2004; Volume 64, pp. 1–64. [Google Scholar]
  28. Lopes, C.L.; Alves, F.L.; Dias, J.M. Flood Risk Assessment in a Coastal Lagoon under Present and Future Scenarios: Ria de Aveiro Case Study. Nat. Hazards 2017, 89, 1307–1325. [Google Scholar] [CrossRef]
  29. Lopes, C.L.; Dias, J.M. Assessment of Flood Hazard during Extreme Sea Levels in a Tidally Dominated Lagoon. Nat. Hazards 2015, 77, 1345–1364. [Google Scholar] [CrossRef]
  30. Lopes, C.L.; Silva, P.A.; Dias, J.M.; Rocha, A.; Picado, A.; Plecha, S.; Fortunato, A.B. Local Sea Level Change Scenarios for the End of the 21st Century and Potential Physical Impacts in the Lower Ria de Aveiro (Portugal). Cont. Shelf Res. 2011, 31, 1515–1526. [Google Scholar] [CrossRef]
  31. Kirezci, E.; Young, I.R.; Ranasinghe, R.; Muis, S.; Nicholls, R.J.; Lincke, D.; Hinkel, J. Projections of Global-Scale Extreme Sea Levels and Resulting Episodic Coastal Flooding over the 21st Century. Sci. Rep. 2020, 10, 11629. [Google Scholar] [CrossRef]
  32. Kulp, S.A.; Strauss, B.H. New Elevation Data Triple Estimates of Global Vulnerability to Sea-Level Rise and Coastal Flooding. Nat. Commun. 2019, 10, 4844. [Google Scholar] [CrossRef] [Green Version]
  33. Vousdoukas, M.I.; Mentaschi, L.; Voukouvalas, E.; Verlaan, M.; Feyen, L. Extreme Sea Levels on the Rise along Europe’s Coasts. Earths Future 2017, 5, 304–323. [Google Scholar] [CrossRef]
  34. Ribeiro, A.S.; Lopes, C.L.; Sousa, M.C.; Gomez-Gesteira, M.; Dias, J.M. Flooding Conditions at Aveiro Port (Portugal) within the Framework of Projected Climate Change. J. Mar. Sci. Eng. 2021, 9, 595. [Google Scholar] [CrossRef]
  35. Tawn, J.A. Estimating Probabilities of Extreme Sea-Levels. Appl. Stat. 1992, 41, 77. [Google Scholar] [CrossRef]
  36. Caruso, M.F.; Marani, M. Extreme-Coastal-Water-Level Estimation and Projection: A Comparison of Statistical Methods. Nat. Hazards Earth Syst. Sci. 2022, 22, 1109–1128. [Google Scholar] [CrossRef]
  37. ben Daoued, A.; Hamdi, Y.; Mouhous-Voyneau, N.; Sergent, P. Modeling Dependence and Coincidence of Storm Surges and High Tide: Methodology, Discussion and Recommendations Based on a Simplified Case Study in Le Havre (France). Nat. Hazards Earth Syst. Sci. 2020, 20, 3387–3398. [Google Scholar] [CrossRef]
  38. Haigh, I.D.; Nicholls, R.; Wells, N. A Comparison of the Main Methods for Estimating Probabilities of Extreme Still Water Levels. Coast. Eng. 2010, 57, 838–849. [Google Scholar] [CrossRef]
  39. UNCLOS. United Nations Convention on the Law of the Sea Act 1996. Int. J. Mar. Coast. Law 1997, 12, 202. [Google Scholar] [CrossRef]
  40. MSP-Portugal Country Report: Portugal. Study on the Economic Effects of Maritime Spatial Planning. Case Studies: Portugal; European Comission-DG Maritime Affairs: Brussels, Belgium, 2010; 51p.
  41. MSP-Spain Country Report: Spain. Study on the Economic Effects of Maritime Spatial Planning. Case Studies: Spain; European Comission-DG Maritime Affairs: Brussels, Belgium, 2011; 18p.
  42. Otero, P.; Ruiz-Villarreal, M.; Allen-Perkins, S.; Vila, B.; Cabanas, J.M. Coastal Exposure to Oil Spill Impacts from the Finisterre Traffic Separation Scheme. Mar. Pollut. Bull. 2014, 85, 67–77. [Google Scholar] [CrossRef]
  43. Trenham, C.E.; Hemer, M.A.; Durrant, T.H.; Greenslade, D.J.M. PACCSAP Wind-Wave Climate: High Resolution Wind-Wave Climate and Projections of Change in the Pacific Region for Coastal Hazard Assessments; CAWCR Technical Report; CSIRO: Melbourne, Australia, 2013. [Google Scholar]
  44. Durrant, T.; Hemer, M.; Trenham, C.; Greenslade, D. CAWCR Wave Hindcast 1979–2010. V8; Data Collection; CSIRO: Canberra, Australia, 2012. [Google Scholar]
  45. Hemer, M.A.; Katzfey, J.; Trenham, C.E. Global Dynamical Projections of Surface Ocean Wave Climate for a Future High Greenhouse Gas Emission Scenario. Ocean Model. (Oxf.) 2013, 70, 221–245. [Google Scholar] [CrossRef]
  46. Hemer, M.; Trenham, C.; Durrant, T.; Greenslade, D. CAWCR Global Wind-Wave 21st Century Climate Projections. v2; Service Collection; CSIRO: Canberra, Australia, 2015. [Google Scholar]
  47. Woolf, D.K. Variability and Predictability of the North Atlantic Wave Climate. J. Geophys. Res. 2002, 107, 3145. [Google Scholar] [CrossRef]
  48. Martínez-Asensio, A.; Tsimplis, M.N.; Marcos, M.; Feng, X.; Gomis, D.; Jordà, G.; Josey, S.A. Response of the North Atlantic Wave Climate to Atmospheric Modes of Variability. Int. J. Climatol. 2016, 36, 1210–1225. [Google Scholar] [CrossRef]
  49. Chen, G.; Chapron, B.; Ezraty, R.; Vandemark, D. A Global View of Swell and Wind Sea Climate in the Ocean by Satellite Altimeter and Scatterometer. J. Atmos. Ocean. Technol. 2002, 19, 1849–1859. [Google Scholar] [CrossRef]
  50. Ribeiro, A.S.; DeCastro, M.; Costoya, X.; Rusu, L.; Dias, J.M.; Gomez-Gesteira, M. A Delphi Method to Classify Wave Energy Resource for the 21st Century: Application to the NW Iberian Peninsula. Energy 2021, 235, 121396. [Google Scholar] [CrossRef]
  51. Ribeiro, A.; Costoya, X.; de Castro, M.; Carvalho, D.; Dias, J.M.; Rocha, A.; Gomez-Gesteira, M. Assessment of Hybrid Wind-Wave Energy Resource for the NW Coast of Iberian Peninsula in a Climate Change Context. Appl. Sci. 2020, 10, 7395. [Google Scholar] [CrossRef]
  52. Uzaki, K.; Matsunaga, N.; Nishii, Y.; Ikehata, Y. Cause and Countermeasure of Long-Period Oscillations of Moored Ships and the Quantification of Surge and Heave Amplitudes. Ocean. Eng. 2010, 37, 155–163. [Google Scholar] [CrossRef]
  53. Iglesias, G.; López, M.; Carballo, R.; Castro, A.; Fraguela, J.A.; Frigaard, P. Wave Energy Potential in Galicia (NW Spain). Renew Energy 2009, 34, 2323–2333. [Google Scholar] [CrossRef]
  54. Lorente, P.; Sotillo, M.; Aouf, L.; Amo-Baladrón, A.; Barrera, E.; Dalphinet, A.; Toledano, C.; Rainaud, R.; De Alfonso, M.; Piedracoba, S.; et al. Extreme Wave Height Events in NW Spain: A Combined Multi-Sensor and Model Approach. Remote Sens. 2017, 10, 1. [Google Scholar] [CrossRef] [Green Version]
  55. Ríos, A.F.; Pérez, F.F.; Fraga, F. Water Masses in the Upper and Middle North Atlantic Ocean East of the Azores. Deep Sea Res. Part A. Oceanogr. Res. Pap. 1992, 39, 645–658. [Google Scholar] [CrossRef] [Green Version]
  56. Alvarez, I. Inter- and Intra-Annual Analysis of the Salinity and Temperature Evolution in the Galician Rías Baixas–Ocean Boundary (Northwest Spain). J. Geophys. Res. 2005, 110, C04008. [Google Scholar] [CrossRef] [Green Version]
  57. deCastro, M.; Gómez-Gesteira, M.; Prego, R.; Taboada, J.J.; Montero, P.; Herbello, P.; Pérez-Villar, V. Wind and Tidal Influence on Water Circulation in a Galician Ria (NW Spain). Estuar. Coast. Shelf Sci. 2000, 51, 161–176. [Google Scholar] [CrossRef]
  58. Oberle, F.K.J.; Storlazzi, C.D.; Hanebuth, T.J.J. Wave-Driven Sediment Mobilization on a Storm-Controlled Continental Shelf (Northwest Iberia). J. Mar. Syst. 2014, 139, 362–372. [Google Scholar] [CrossRef]
  59. Pérez-Fernández, B.; Viñas, L.; Besada, V. Concentrations of Organic and Inorganic Pollutants in Four Iberian Estuaries, North Eastern Atlantic. Study of Benchmark Values Estimation. Mar. Chem. 2020, 224, 103828. [Google Scholar] [CrossRef]
  60. Sousa, M.C.; DeCastro, M.; Gago, J.; Ribeiro, A.S.; Des, M.; Gómez-Gesteira, J.L.; Dias, J.M.; Gomez-Gesteira, M. Modelling the Distribution of Microplastics Released by Wastewater Treatment Plants in Ria de Vigo (NW Iberian Peninsula). Mar. Pollut. Bull. 2021, 166, 112227. [Google Scholar] [CrossRef] [PubMed]
  61. Autoridad Portuaria de Vigo. Strategic Plan, 2018–2028; Autoridad Portuaria de Vigo: Vigo, Spain, 2019. [Google Scholar]
  62. Sousa, M.C.; Ribeiro, A.S.; Des, M.; Mendes, R.; Alvarez, I.; Gomez-Gesteira, M.; Dias, J.M. Integrated High-Resolution Numerical Model for the NW Iberian Peninsula Coast and Main Estuarine Systems. J. Coast. Res. 2018, 85, 66–70. [Google Scholar] [CrossRef]
  63. Moreira, M.H.; Queiroga, H.; Machado, M.M.; Cunha, M.R. Environmental Gradients in a Southern Europe Estuarine System: Ria de Aveiro, Portugal Implications for Soft Bottom Macrofauna Colonization. Neth. J. Aquat. Ecol. 1993, 27, 465–482. [Google Scholar] [CrossRef]
  64. Plecha, S.; Silva, P.A.; Vaz, N.; Bertin, X.; Oliveira, A.; Fortunato, A.B.; Dias, J.M. Sensitivity Analysis of a Morphodynamic Modelling System Applied to a Coastal Lagoon Inlet. Ocean Dyn. 2010, 60, 275–284. [Google Scholar] [CrossRef]
  65. Pereira, C.; Coelho, C. Mapping Erosion Risk under Different Scenarios of Climate Change for Aveiro Coast, Portugal. Nat. Hazards 2013, 69, 1033–1050. [Google Scholar] [CrossRef]
  66. Picado, A.; Lopes, C.L.; Mendes, R.; Vaz, N.; Dias, J.M. Storm Surge Impact in the Hydrodynamics of a Tidal Lagoon: The Case of Ria de Aveiro. J. Coast. Res. 2013, 65, 796–801. [Google Scholar] [CrossRef]
  67. Fortunato, A.B.; Rodrigues, M.; Dias, J.M.; Lopes, C.; Oliveira, A. Generating Inundation Maps for a Coastal Lagoon: A Case Study in the Ria de Aveiro (Portugal). Ocean. Eng. 2013, 64, 60–71. [Google Scholar] [CrossRef]
  68. Pinheiro, J.P.; Lopes, C.L.; Ribeiro, A.S.; Sousa, M.C.; Dias, J.M. Tide-Surge Interaction in Ria de Aveiro Lagoon and Its Influence in Local Inundation Patterns. Cont. Shelf Res. 2020, 200, 104132. [Google Scholar] [CrossRef]
  69. Lopes, C.L.; Plecha, S.; Silva, P.A.; Dias, J.M. Influence of Morphological Changes in a Lagoon Flooding Extension: Case Study of Ria de Aveiro (Portugal). J. Coast. Res. 2013, 165, 1158–1163. [Google Scholar] [CrossRef]
  70. Lopes, C.L.; Azevedo, A.; Dias, J.M. Flooding Assessment under Sea Level Rise Scenarios: Ria de Aveiro Case Study. J. Coast. Res. 2013, 65, 766–771. [Google Scholar] [CrossRef]
  71. Valente, A.S.; da Silva, J.C.B. On the Observability of the Fortnightly Cycle of the Tagus Estuary Turbid Plume Using MODIS Ocean Colour Images. J. Mar. Syst. 2009, 75, 131–137. [Google Scholar] [CrossRef]
  72. Fortunato, A.B.; Baptista, A.M.; Luettich, R.A. A Three-Dimensional Model of Tidal Currents in the Mouth of the Tagus Estuary. Cont. Shelf Res. 1997, 17, 1689–1714. [Google Scholar] [CrossRef]
  73. Fortunato, A.B.; Oliveira, A.; Baptista, A.M. On the Effect of Tidal Flats on the Hydrodynamics of the Tagus Estuary. Oceanol. Acta 1999, 22, 31–44. [Google Scholar] [CrossRef] [Green Version]
  74. Fortunato, A.B.; Oliveira, A. Influence of Intertidal Flats on Tidal Asymmetry. J. Coast. Res. 2005, 215, 1062–1067. [Google Scholar] [CrossRef]
  75. Rusu, L.; Bernardino, M.; Soares, C.G. Influence of Wind Resolution on the Prediction of Waves Generated in an Estuary. J. Coast. Res. 2009, 56, 1419–1423. [Google Scholar]
  76. Vaz, N.; Fernandes, L.; Leitão, P.C.; Dias, J.M.; Neves, R. The Tagus Estuarine Plume Induced by Wind and River Runoff: Winter 2007 Case Study. J. Coast. Res. 2009, II, 1090–1094. [Google Scholar]
  77. Neves, F.J. Dynamics and Hydrology of the Tagus Estuary: Results from In Situ Observations. Ph.D. Thesis, University of Lisbon, Lisboa, Portugal, 2010. [Google Scholar]
  78. Martins, M.; Calvão, T.; Figueiredo, H. Estudo Ambiental Do Estuário Do Tagus, Estudo de Qualidade de Água. Resultados Referentes a Observações Sinópticas Em 1982, CAN/Tagus 30-REL 27; Ministério Da Qualidade de Vida: Lisboa, Portugal, 1983. [Google Scholar]
  79. Fortunato, A.B.; Freire, P.; Bertin, X.; Rodrigues, M.; Ferreira, J.; Liberato, M.L.R. A Numerical Study of the February 15, 1941 Storm in the Tagus Estuary. Cont. Shelf Res. 2017, 144, 50–64. [Google Scholar] [CrossRef]
  80. Portela, L.I.; Neves, R. Numerical Modelling of Suspended Sediment Transport in Tidal Estuaries: A Comparison between the Tagus (Portugal) and the Scheldt (Belgium-the Netherlands). Neth. J. Aquat. Ecol. 1994, 28, 329–335. [Google Scholar] [CrossRef]
  81. Rilo, A.; Freire, P.; Guerreiro, M.; Fortunato, A.B.; Taborda, R. Estuarine Margins Vulnerability to Floods for Different Sea Level Rise and Human Occupation Scenarios. J. Coast. Res. 2013, 65, 820–825. [Google Scholar] [CrossRef]
  82. Guerreiro, M.; Fortunato, A.B.; Freire, P.; Rilo, A.; Taborda, R.; Freitas, M.C.; Andrade, C.; Silva, T.; Rodrigues, M.; Bertin, X.; et al. Evolution of the Hydrodynamics of the Tagus Estuary (Portugal) in the 21st Century. Rev. Gestão Costeira Integr. 2015, 15, 65–80. [Google Scholar] [CrossRef]
  83. Rilo, A.; Freire, P.; Santos, P.; Tavares, A.; Sá, L. Historical Flood Events in the Tagus Estuary: Contribution to Risk Assessment and Management Tools. In Safety and Reliability of Complex Engineered Systems; CRC Press: Boca Raton, FL, USA, 2015; pp. 4281–4286. [Google Scholar]
  84. Tavares, A.O.; dos Santos, P.P.; Freire, P.; Fortunato, A.B.; Rilo, A.; Sá, L. Flooding Hazard in the Tagus Estuarine Area: The Challenge of Scale in Vulnerability Assessments. Environ. Sci. Policy 2015, 51, 238–255. [Google Scholar] [CrossRef]
  85. Rilo, A.; Freire, P.; Ceia, R.; Mendes, R.N.; Catalão, J.; Taborda, R. Human Effects on Estuarine Shoreline Decadal Evolution. In Proceedings of the EGU General Assembly Conference Abstracts, Vienna, Austria, 22–27 April 2012; p. 10863. [Google Scholar]
  86. Antunes, C.; Rocha, C.; Catita, C. Coastal Flood Assessment Due to Sea Level Rise and Extreme Storm Events: A Case Study of the Atlantic Coast of Portugal’s Mainland. Geosciences 2019, 9, 239. [Google Scholar] [CrossRef] [Green Version]
  87. Lopes, C.L.; Sousa, M.C.; Ribeiro, A.; Pereira, H.; Pinheiro, J.P.; Vaz, L.; Dias, J.M. Evaluation of Future Estuarine Floods in a Sea Level Rise Context. Sci. Rep. 2022, 12, 8083. [Google Scholar] [CrossRef]
  88. Palmer, M.D.; Domingues, C.M.; Slangen, A.B.A.; Boeira Dias, F. An Ensemble Approach to Quantify Global Mean Sea-Level Rise over the 20th Century from Tide Gauge Reconstructions. Environ. Res. Lett. 2021, 16, 044043. [Google Scholar] [CrossRef]
  89. Masson-Delmotte, V.; Zhai, P.; Pirani, A.; Connors, S.; Péan, C.; Berger, S.; Caud, N.; Chen, Y. (Eds.) IPCC Climate Change 2021: The Physical Science Basis. In Contribution of Working Group I to the Sixth Assessment Report of the Intergovernmental Panel on Climate Change; Cambridge University Press: Cambridge, UK; New York, NY, USA, 2021. [Google Scholar]
  90. Stammer, D.; Cazenave, A.; Ponte, R.M.; Tamisiea, M.E. Causes for Contemporary Regional Sea Level Changes. Ann. Rev. Mar. Sci. 2013, 5, 21–46. [Google Scholar] [CrossRef] [Green Version]
  91. Peltier, W.R.; Argus, D.F.; Drummond, R. Space Geodesy Constrains Ice Age Terminal Deglaciation: The Global ICE-6G_C (VM5a) Model. J. Geophys. Res. Solid Earth 2015, 120, 450–487. [Google Scholar] [CrossRef] [Green Version]
  92. Whitehouse, P.L. Glacial Isostatic Adjustment Modelling: Historical Perspectives, Recent Advances, and Future Directions. Earth Surf. Dyn. 2018, 6, 401–429. [Google Scholar] [CrossRef] [Green Version]
  93. Antunes, C.; Taborda, R. Sea Level at Cascais Tide Gauge: Data, Analysis and Results. J. Coast. Res. 2009, I, 218–222. [Google Scholar]
  94. Antunes, C. Assessment of Sea Level Rise at West Coast of Portugal Mainland and Its Projection for the 21st Century. J. Mar. Sci. Eng. 2019, 7, 61. [Google Scholar] [CrossRef] [Green Version]
  95. Pugh, D.T. Tides, Surges and Mean Sea-Level (Reprinted with Corrections); John Wiley & Sons Ltd.: Chichester, UK, 1996; 486p. [Google Scholar]
  96. Kaplan, E.L.; Meier, P. Nonparametric Estimation from Incomplete Observations. J. Am. Stat. Assoc. 1958, 53, 457–481. [Google Scholar] [CrossRef]
  97. Wang, X.L.; Swail, V.R.; Zwiers, F.W.; Zhang, X.; Feng, Y. Detection of External Influence on Trends of Atmospheric Storminess and Northern Oceans Wave Heights. Clim. Dyn. 2009, 32, 189–203. [Google Scholar] [CrossRef]
  98. Fan, Y.; Held, I.M.; Lin, S.-J.; Wang, X.L. Ocean Warming Effect on Surface Gravity Wave Climate Change for the End of the Twenty-First Century. J. Clim. 2013, 26, 6046–6066. [Google Scholar] [CrossRef]
  99. Wang, X.L.; Swail, V.R. Climate Change Signal and Uncertainty in Projections of Ocean Wave Heights. Clim. Dyn. 2006, 26, 109–126. [Google Scholar] [CrossRef]
  100. Gao, J.; Ma, X.; Dong, G.; Chen, H.; Liu, Q.; Zang, J. Investigation on the Effects of Bragg Reflection on Harbor Oscillations. Coast. Eng. 2021, 170, 103977. [Google Scholar] [CrossRef]
  101. Gao, J.; Ma, X.; Zang, J.; Dong, G.; Ma, X.; Zhu, Y.; Zhou, L. Numerical Investigation of Harbor Oscillations Induced by Focused Transient Wave Groups. Coast. Eng. 2020, 158, 103670. [Google Scholar] [CrossRef]
  102. López, M.; Iglesias, G. Long Wave Effects on a Vessel at Berth. Appl. Ocean. Res. 2014, 47, 63–72. [Google Scholar] [CrossRef]
  103. Maravelakis, N.; Kalligeris, N.; Lynett, P.J.; Skanavis, V.L.; Synolakis, C.E. Wave Overtopping Due to Harbour Resonance. Coast. Eng. 2021, 169, 103973. [Google Scholar] [CrossRef]
  104. Reguero, B.G.; Losada, I.J.; Méndez, F.J. A Recent Increase in Global Wave Power as a Consequence of Oceanic Warming. Nat. Commun. 2019, 10, 205. [Google Scholar] [CrossRef] [PubMed] [Green Version]
  105. Young, I.R.; Zieger, S.; Babanin, A.V. Global Trends in Wind Speed and Wave Height. Science 2011, 332, 451–455. [Google Scholar] [CrossRef] [PubMed]
  106. Wang, X.L.; Swail, V.R. Trends of Atlantic Wave Extremes as Simulated in a 40-Yr Wave Hindcast Using Kinematically Reanalyzed Wind Fields. J. Clim. 2002, 15, 1020–1035. [Google Scholar] [CrossRef]
  107. Wang, X.L.; Swail, V.R. Changes of Extreme Wave Heights in Northern Hemisphere Oceans and Related Atmospheric Circulation Regimes. J. Clim. 2001, 14, 2204–2221. [Google Scholar] [CrossRef]
  108. Rusu, L. Evaluation of the near Future Wave Energy Resources in the Black Sea under Two Climate Scenarios. Renew Energy 2019, 142, 137–146. [Google Scholar] [CrossRef]
  109. Lemos, G.; Semedo, A.; Dobrynin, M.; Behrens, A.; Staneva, J.; Bidlot, J.-R.; Miranda, P.M.A. Mid-Twenty-First Century Global Wave Climate Projections: Results from a Dynamic CMIP5 Based Ensemble. Glob. Planet. Chang. 2019, 172, 69–87. [Google Scholar] [CrossRef]
  110. Zheng, C.W.; Pan, J.; Li, C.Y. Global Oceanic Wind Speed Trends. Ocean Coast. Manag. 2016, 129, 15–24. [Google Scholar] [CrossRef]
  111. Morim, J.; Hemer, M.; Wang, X.L.; Cartwright, N.; Trenham, C.; Semedo, A.; Young, I.; Bricheno, L.; Camus, P.; Casas-Prat, M.; et al. Robustness and Uncertainties in Global Multivariate Wind-Wave Climate Projections. Nat. Clim. Chang. 2019, 9, 711–718. [Google Scholar] [CrossRef] [Green Version]
  112. Dodet, G.; Bertin, X.; Taborda, R. Wave Climate Variability in the North-East Atlantic Ocean over the Last Six Decades. Ocean Model. (Oxf.) 2010, 31, 120–131. [Google Scholar] [CrossRef]
  113. Ribeiro, A.S.; DeCastro, M.; Rusu, L.; Bernardino, M.; Dias, J.M.; Gomez-Gesteira, M. Evaluating the Future Efficiency of Wave Energy Converters along the NW Coast of the Iberian Peninsula. Energies 2020, 13, 3563. [Google Scholar] [CrossRef]
  114. Shi, X.; Qin, T.; Nie, H.; Weng, B.; He, S. Changes in Major Global River Discharges Directed into the Ocean. Int. J. Environ. Res. Public Health 2019, 16, 1469. [Google Scholar] [CrossRef] [PubMed] [Green Version]
  115. van Vliet, M.T.H.; Franssen, W.H.P.; Yearsley, J.R.; Ludwig, F.; Haddeland, I.; Lettenmaier, D.P.; Kabat, P. Global River Discharge and Water Temperature under Climate Change. Glob. Environ. Chang. 2013, 23, 450–464. [Google Scholar] [CrossRef]
  116. Sperna Weiland, F.C.; van Beek, L.P.H.; Kwadijk, J.C.J.; Bierkens, M.F.P. Global Patterns of Change in Discharge Regimes for 2100. Hydrol. Earth Syst. Sci. 2012, 16, 1047–1062. [Google Scholar] [CrossRef] [Green Version]
  117. Wei, X.; Cai, S.; Ni, P.; Zhan, W. Impacts of Climate Change and Human Activities on the Water Discharge and Sediment Load of the Pearl River, Southern China. Sci. Rep. 2020, 10, 16743. [Google Scholar] [CrossRef]
  118. Piao, S.; Friedlingstein, P.; Ciais, P.; de Noblet-Ducoudré, N.; Labat, D.; Zaehle, S. Changes in Climate and Land Use Have a Larger Direct Impact than Rising CO2 on Global River Runoff Trends. Proc. Natl. Acad. Sci. USA 2007, 104, 15242–15247. [Google Scholar] [CrossRef] [Green Version]
  119. Labat, D.; Goddéris, Y.; Probst, J.L.; Guyot, J.L. Evidence for Global Runoff Increase Related to Climate Warming. Adv. Water. Resour. 2004, 27, 631–642. [Google Scholar] [CrossRef]
  120. Eisner, S.; Flörke, M.; Chamorro, A.; Daggupati, P.; Donnelly, C.; Huang, J.; Hundecha, Y.; Koch, H.; Kalugin, A.; Krylenko, I.; et al. An Ensemble Analysis of Climate Change Impacts on Streamflow Seasonality across 11 Large River Basins. Clim. Chang. 2017, 141, 401–417. [Google Scholar] [CrossRef]
  121. Scussolini, P.; Eilander, D.; Sutanudjaja, E.H.; Ikeuchi, H.; Hoch, J.M.; Ward, P.J.; Bakker, P.; Otto-Bliesner, B.L.; Guo, C.; Stepanek, C.; et al. Global River Discharge and Floods in the Warmer Climate of the Last Interglacial. Geophys. Res. Lett. 2020, 47, e2020GL089375. [Google Scholar] [CrossRef]
  122. Hirabayashi, Y.; Alifu, H.; Yamazaki, D.; Imada, Y.; Shiogama, H.; Kimura, Y. Anthropogenic Climate Change Has Changed Frequency of Past Flood during 2010–2013. Prog. Earth Planet. Sci. 2021, 8, 36. [Google Scholar] [CrossRef]
  123. Sauer, I.J.; Reese, R.; Otto, C.; Geiger, T.; Willner, S.N.; Guillod, B.P.; Bresch, D.N.; Frieler, K. Climate Signals in River Flood Damages Emerge under Sound Regional Disaggregation. Nat. Commun. 2021, 12, 2128. [Google Scholar] [CrossRef] [PubMed]
  124. Xiao, Z.; Yang, Z.; Wang, T.; Sun, N.; Wigmosta, M.; Judi, D. Characterizing the Non-Linear Interactions Between Tide, Storm Surge, and River Flow in the Delaware Bay Estuary, United States. Front. Mar. Sci. 2021, 8, 715557. [Google Scholar] [CrossRef]
  125. Spicer, P.; Huguenard, K.; Ross, L.; Rickard, L.N. High-Frequency Tide-Surge-River Interaction in Estuaries: Causes and Implications for Coastal Flooding. J. Geophys. Res. Oceans 2019, 124, 9517–9530. [Google Scholar] [CrossRef] [Green Version]
  126. Kuang, C.; Chen, W.; Gu, J.; Su, T.-C.; Song, H.; Ma, Y.; Dong, Z. River Discharge Contribution to Sea-Level Rise in the Yangtze River Estuary, China. Cont. Shelf Res. 2017, 134, 63–75. [Google Scholar] [CrossRef]
  127. Cardoso Pereira, S.; Marta-Almeida, M.; Carvalho, A.C.; Rocha, A. Extreme Precipitation Events under Climate Change in the Iberian Peninsula. Int. J. Climatol. 2020, 40, 1255–1278. [Google Scholar] [CrossRef]
  128. Casanueva, A.; Rodríguez-Puebla, C.; Frías, M.D.; González-Reviriego, N. Variability of Extreme Precipitation over Europe and Its Relationships with Teleconnection Patterns. Hydrol. Earth Syst. Sci. 2014, 18, 709–725. [Google Scholar] [CrossRef] [Green Version]
  129. Soares, P.M.M.; Cardoso, R.M.; Lima, D.C.A.; Miranda, P.M.A. Future Precipitation in Portugal: High-Resolution Projections Using WRF Model and EURO-CORDEX Multi-Model Ensembles. Clim. Dyn. 2017, 49, 2503–2530. [Google Scholar] [CrossRef]
  130. Saba, V.S.; Griffies, S.M.; Anderson, W.G.; Winton, M.; Alexander, M.A.; Delworth, T.L.; Hare, J.A.; Harrison, M.J.; Rosati, A.; Vecchi, G.A.; et al. Enhanced Warming of the Northwest Atlantic Ocean under Climate Change. J. Geophys. Res. Oceans 2016, 121, 118–132. [Google Scholar] [CrossRef] [Green Version]
  131. Toggweiler, J.R.; Russell, J. Ocean Circulation in a Warming Climate. Nature 2008, 451, 286–288. [Google Scholar] [CrossRef] [Green Version]
  132. Deltares Delft3D-WAVE. Simulation of Short-Crested Waves with SWAN. User Manual. Version: 3.05. 2020. Available online: https://content.oss.deltares.nl/delft3d4/Delft3D-WAVE_User_Manual.pdf (accessed on 1 December 2022).
  133. Tolman, H.L.; Group, W.D. User Manual and System Documentation of WAVEWATCH III Version 4.18. NOAA/NWS/NCEP/MMAB Technical Note; 2014. Available online: https://polar.ncep.noaa.gov/waves/wavewatch/manual.v4.18.pdf (accessed on 1 December 2022).
  134. SWAN. SWAN User Manual Version 41.31; Delft University of Technology, Environmental Fluid Mechanics Section: Delft, The Netherlands, 2019; 143p, Available online: https://swanmodel.sourceforge.io/download/zip/swanuse.pdf (accessed on 1 December 2022).
  135. Fu, G.; Liu, Z.; Charles, S.P.; Xu, Z.; Yao, Z. A Score-Based Method for Assessing the Performance of GCMs: A Case Study of Southeastern Australia. J. Geophys. Res. Atmos. 2013, 118, 4154–4167. [Google Scholar] [CrossRef]
  136. Perkins, S.E.; Pitman, A.J.; Holbrook, N.J.; McAneney, J. Evaluation of the AR4 Climate Models’ Simulated Daily Maximum Temperature, Minimum Temperature, and Precipitation over Australia Using Probability Density Functions. J. Clim. 2007, 20, 4356–4376. [Google Scholar] [CrossRef]
  137. Perkins, S.E.; Pitman, A.J.; Sisson, S.A. Smaller Projected Increases in 20-Year Temperature Returns over Australia in Skill-Selected Climate Models. Geophys. Res. Lett. 2009, 36, L06710. [Google Scholar] [CrossRef]
  138. Perkins, S.E.; Pitman, A.J.; Sisson, S.A. Systematic Differences in Future 20 Year Temperature Extremes in AR4 Model Projections over Australia as a Function of Model Skill. Int. J. Climatol. 2013, 33, 1153–1167. [Google Scholar] [CrossRef] [Green Version]
  139. Sun, Q.; Miao, C.; Duan, Q. Comparative Analysis of CMIP3 and CMIP5 Global Climate Models for Simulating the Daily Mean, Maximum, and Minimum Temperatures and Daily Precipitation over China. J. Geophys. Res. Atmos. 2015, 120, 4806–4824. [Google Scholar] [CrossRef]
  140. Maxino, C.C.; McAvaney, B.J.; Pitman, A.J.; Perkins, S.E. Ranking the AR4 Climate Models over the Murray-Darling Basin Using Simulated Maximum Temperature, Minimum Temperature and Precipitation. Int. J. Climatol. 2008, 28, 1097–1112. [Google Scholar] [CrossRef]
  141. Errasti, I.; Ezcurra, A.; Sáenz, J.; Ibarra-Berastegi, G. Validation of IPCC AR4 Models over the Iberian Peninsula. Theor. Appl. Climatol. 2011, 103, 61–79. [Google Scholar] [CrossRef]
  142. Krishnan, A.; Bhaskaran, P.K. Skill Assessment of Global Climate Model Wind Speed from CMIP5 and CMIP6 and Evaluation of Projections for the Bay of Bengal. Clim. Dyn. 2020, 55, 2667–2687. [Google Scholar] [CrossRef]
  143. Hemer, M.A.; Trenham, C.E. Evaluation of a CMIP5 Derived Dynamical Global Wind Wave Climate Model Ensemble. Ocean Model. 2016, 103, 190–203. [Google Scholar] [CrossRef] [Green Version]
  144. Erikson, L.H.; Hegermiller, C.A.; Barnard, P.L.; Ruggiero, P.; van Ormondt, M. Projected Wave Conditions in the Eastern North Pacific under the Influence of Two CMIP5 Climate Scenarios. Ocean Model. 2015, 96, 171–185. [Google Scholar] [CrossRef]
  145. Camus, P.; Losada, I.J.; Izaguirre, C.; Espejo, A.; Menéndez, M.; Pérez, J. Statistical Wave Climate Projections for Coastal Impact Assessments. Earths Future 2017, 5, 918–933. [Google Scholar] [CrossRef]
  146. Shimura, T.; Mori, N.; Hemer, M.A. Variability and Future Decreases in Winter Wave Heights in the Western North Pacific. Geophys. Res. Lett. 2016, 43, 2716–2722. [Google Scholar] [CrossRef] [Green Version]
  147. Izaguirre, C.; Mendez, F.J.; Menendez, M.; Luceño, A.; Losada, I.J. Extreme Wave Climate Variability in Southern Europe Using Satellite Data. J. Geophys. Res. 2010, 115, C04009. [Google Scholar] [CrossRef]
  148. IEC TS 62600-101. Marine Energy–Wave, Tidal and Other Water Current Converters—Part 100: Electricity Producing Wave Energy Converters—Power Performance Assessment. International Electrotechnical Commission: Geneva, Switzerland, 2015; ISBN 9782832227244. [Google Scholar]
  149. Splinter, K.D.; Davidson, M.A.; Golshani, A.; Tomlinson, R. Climate Controls on Longshore Sediment Transport. Cont. Shelf Res. 2012, 48, 146–156. [Google Scholar] [CrossRef] [Green Version]
  150. Bromirski, P.D.; Cayan, D.R.; Helly, J.; Wittmann, P. Wave Power Variability and Trends across the North Pacific. J. Geophys. Res. Oceans 2013, 118, 6329–6348. [Google Scholar] [CrossRef] [Green Version]
  151. Ribeiro, A.S.; Sousa, M.C.; Lencart, J.D.; Dias, J.M. David and Goliath Revisited: Joint Modelling of the Tagus and Sado Estuaries. J. Coast. Res. 2016, 75, 123–127. [Google Scholar] [CrossRef]
  152. Deltares Delft3D-FLOW. Simulation of Multi-Dimensional Hydrodynamic Flows and Transport Phenomena, Including Sediments. User Manual. Version: 3.15. 2020. Available online: https://content.oss.deltares.nl/delft3d4/Delft3D-FLOW_User_Manual.pdf (accessed on 1 December 2022).
  153. Aris, C.; Hande, D. Impacts of Climate Change on Transport: A Focus on Airports, Seaports and Inland Waterways; Publications Office of the European Union: Brussels, Belgium, 2018. [Google Scholar]
  154. Rueda, A.; Vitousek, S.; Camus, P.; Tomás, A.; Espejo, A.; Losada, I.J.; Barnard, P.L.; Erikson, L.H.; Ruggiero, P.; Reguero, B.G.; et al. A Global Classification of Coastal Flood Hazard Climates Associated with Large-Scale Oceanographic Forcing. Sci. Rep. 2017, 7, 5038. [Google Scholar] [CrossRef] [PubMed]
  155. Menéndez, M.; Woodworth, P.L. Changes in Extreme High Water Levels Based on a Quasi-global Tide-gauge Data Set. J. Geophys. Res. Oceans 2010, 115, 2009JC005997. [Google Scholar] [CrossRef] [Green Version]
  156. Merrifield, M.A.; Genz, A.S.; Kontoes, C.P.; Marra, J.J. Annual Maximum Water Levels from Tide Gauges: Contributing Factors and Geographic Patterns. J. Geophys. Res. Oceans 2013, 118, 2535–2546. [Google Scholar] [CrossRef]
  157. Phillips, M.R.; Crisp, S. Sea Level Trends and NAO Influences: The Bristol Channel/Severn Estuary. Glob. Planet. Chang. 2010, 73, 211–218. [Google Scholar] [CrossRef]
  158. Roustan, J.-B.; Pineau-Guillou, L.; Chapron, B.; Raillard, N.; Reinert, M. Shift of the Storm Surge Season in Europe Due to Climate Variability. Sci. Rep. 2022, 12, 8210. [Google Scholar] [CrossRef] [PubMed]
  159. Tsimplis, M.N.; Shaw, A.G.P.; Flather, R.A.; Woolf, D.K. The Influence of the North Atlantic Oscillation on the Sea-Level around the Northern European Coasts Reconsidered: The Thermosteric Effects. Philos. Trans. R. Soc. A Math. Phys. Eng. Sci. 2006, 364, 845–856. [Google Scholar] [CrossRef] [PubMed]
  160. Ezer, T.; Atkinson, L.P. Accelerated Flooding along the U.S. East Coast: On the Impact of Sea-level Rise, Tides, Storms, the Gulf Stream, and the North Atlantic Oscillations. Earths Future 2014, 2, 362–382. [Google Scholar] [CrossRef]
  161. Masselink, G.; Scott, T.; Poate, T.; Russell, P.; Davidson, M.; Conley, D. The Extreme 2013/2014 Winter Storms: Hydrodynamic Forcing and Coastal Response along the Southwest Coast of England. Earth Surf. Process. Landf. 2016, 41, 378–391. [Google Scholar] [CrossRef] [Green Version]
  162. Wadey, M.P.; Haigh, I.D.; Brown, J.M. A Century of Sea Level Data and the UK’s 2013/14 Storm Surges: An Assessment of Extremes and Clustering Using the Newlyn Tide Gauge Record. Ocean. Sci. 2014, 10, 1031–1045. [Google Scholar] [CrossRef] [Green Version]
  163. Chadenas, C.; Creach, A.; Mercier, D. The Impact of Storm Xynthia in 2010 on Coastal Flood Prevention Policy in France. J. Coast. Conserv. 2014, 18, 529–538. [Google Scholar] [CrossRef]
  164. Kolen, B.; Slomp, R.; Jonkman, S.N. The Impacts of Storm Xynthia February 27-28, 2010 in France: Lessons for Flood Risk Management. J. Flood Risk Manag. 2013, 6, 261–278. [Google Scholar] [CrossRef]
  165. Huntingford, C.; Marsh, T.; Scaife, A.A.; Kendon, E.J.; Hannaford, J.; Kay, A.L.; Lockwood, M.; Prudhomme, C.; Reynard, N.S.; Parry, S.; et al. Potential Influences on the United Kingdom’s Floods of Winter 2013/14. Nat. Clim. Chang. 2014, 4, 769–777. [Google Scholar] [CrossRef]
  166. Guisado-Pintado, E.; Jackson, D.W.T. Multi-Scale Variability of Storm Ophelia 2017: The Importance of Synchronised Environmental Variables in Coastal Impact. Sci. Total Environ. 2018, 630, 287–301. [Google Scholar] [CrossRef] [PubMed]
  167. Rivas, V.; Garmendia, C.; Rasilla, D. Analysis of Ocean Parameters as Sources of Coastal Storm Damage: Regional Empirical Thresholds in Northern Spain. Climate 2022, 10, 88. [Google Scholar] [CrossRef]
  168. Bernier, N.B.; Thompson, K.R. Tide-Surge Interaction off the East Coast of Canada and Northeastern United States. J. Geophys. Res. 2007, 112, C06008. [Google Scholar] [CrossRef] [Green Version]
  169. Fernández-Montblanc, T.; Vousdoukas, M.I.; Ciavola, P.; Voukouvalas, E.; Mentaschi, L.; Breyiannis, G.; Feyen, L.; Salamon, P. Towards Robust Pan-European Storm Surge Forecasting. Ocean Model. 2019, 133, 129–144. [Google Scholar] [CrossRef]
  170. Idier, D.; Bertin, X.; Thompson, P.; Pickering, M.D. Interactions Between Mean Sea Level, Tide, Surge, Waves and Flooding: Mechanisms and Contributions to Sea Level Variations at the Coast. Surv. Geophys. 2019, 40, 1603–1630. [Google Scholar] [CrossRef] [Green Version]
  171. Arns, A.; Wahl, T.; Wolff, C.; Vafeidis, A.T.; Haigh, I.D.; Woodworth, P.; Niehüser, S.; Jensen, J. Non-Linear Interaction Modulates Global Extreme Sea Levels, Coastal Flood Exposure, and Impacts. Nat. Commun. 2020, 11, 1918. [Google Scholar] [CrossRef] [PubMed] [Green Version]
  172. Arns, A.; Wahl, T.; Dangendorf, S.; Jensen, J. The Impact of Sea Level Rise on Storm Surge Water Levels in the Northern Part of the German Bight. Coast. Eng. 2015, 96, 118–131. [Google Scholar] [CrossRef]
  173. Transportation Research Board and National Research Council. Potential Impacts of Climate Change on U.S. Transportation: Special Report 290; Transportation Research Board: Washington, DC, USA, 2008; ISBN 978-0-309-11306-9. [Google Scholar]
  174. Becker, A.; Ng, A.K.Y.; McEvoy, D.; Mullett, J. Implications of Climate Change for Shipping: Ports and Supply Chains. WIREs Clim. Chang. 2018, 9, e508. [Google Scholar] [CrossRef] [Green Version]
Figure 1. NW Iberian Peninsula. White circles are the locations of the ports considered for this study. (A) A Coruña Outer Port (43.35° N, 8.51° W), (B) Vigo (42.23° N, 8.74° W), (C) Aveiro (40.64° N, 8.75° W), and (D) Lisbon (38.70° N, 9.17° W).
Jmse 11 00477 g001
Figure 2. Study area and location of the A Coruña Outer Port (a) and the business areas (b).
Jmse 11 00477 g002
Figure 3. Study area with the in-situ stations (a) used to validate the hydrodynamic model (data retrieved from [62]). Location of the Vigo port and the business areas in the port administration jurisdiction (b).
Jmse 11 00477 g003
Figure 4. Location of the Aveiro port (a) and the business areas in the port administration jurisdiction (b) [34].
Jmse 11 00477 g004
Figure 5. Study area with the in-situ stations (a) used to validate the hydrodynamic model (data retrieved from [87]). Location of the Lisbon port and the business areas in the port administration jurisdiction (b).
Jmse 11 00477 g005
Figure 6. Methodological scheme of the procedure to assess the flood risk in ports under future conditions.
Jmse 11 00477 g006
Figure 7. Numerical domains and bathymetry used for SWAN implementations, the downscale of the BCC-CSM1.1 GCM using a nested approach for the domains: L1 (1/3° × 1/3°), L2 (1/9° × 1/9°), L3, L4, L5 and L6 (1/27° × 1/27°).
Jmse 11 00477 g007
Figure 8. Mean wave direction for the control points located close to the ports for the far future period (2081–2099) for the (a) Aveiro lagoon, (b) Tagus estuary, (c) Ria de Vigo, and (d) the NWIP coast near A Coruña Outer Port.
Jmse 11 00477 g008
Figure 9. Example of the simulation setup for the Tagus domain showing the historical period under the 100-year return period. Continuous lines represent the reference conditions, while the dashed line considers the 100-year return period conditions for riverine discharge and extreme sea level.
Jmse 11 00477 g009
Figure 10. Flood extent mapping of the Aveiro port’s terminals (numbers 1–12) located along the lagoon margins. Reference scenario under present climate and 10-, 25- and 100-year return periods are determined for the (a) historical (1979–2005), (b) near future (2026–2045) and (c) far future (2081–2100) climate periods. The data was retrieved from [34].
Jmse 11 00477 g010
Figure 11. Flood extent mapping of Lisbon port’s terminals (numbers 1–16) located along the estuary margins. Reference scenario under the present climate and 10-, 25- and 100-year return periods are determined for the (a) historical (1979–2005), (b) near future (2026–2045) and (c) far future (2081–2100) climate periods.
Jmse 11 00477 g011
Figure 12. Flood extent mapping of the Vigo port’s terminals (numbers 1–9) located along the Ria de Vigo margins. Reference scenario under the present climate and 10-, 25- and 100-year return periods are determined for the (a) historical (1979–2005), (b) near future (2026–2045) and (c) far future (2081–2100) climate periods.
Jmse 11 00477 g012
Figure 13. Flood extent mapping of the A Coruña Outer Port terminals (numbers 1–12). Reference scenario under the present climate and 10-, 25- and 100-year return periods are determined for the (a) historical (1979–2005), (b) near future (2026–2045) and (c) far future (2081–2100) climate periods.
Jmse 11 00477 g013
Table 1. The additional rise in mean sea level for historical (data retrieved from [12]), near future and far future periods (data retrieved from [87]).
PeriodMean Sea Level Rise (m)
Historical1986–2005 0
Near Future2026–20450.19
Far Future2081–2099 0.68
Table 2. Mean high water springs (MHWS) and storm surge for each return period referred to the mean sea level at each tide gauge.
Tide GaugeMHWS (m)Storm Surge (m)
Tr10Tr25Tr100
Barra (Aveiro)3.300.951.081.25
Cascais (Tagus)3.300.921.021.15
Vigo3.790.680.780.88
Punta Langosteira (A Coruña Outer Port)4.490.720.810.89
Table 3. Extreme sea level (ESL, in meters) for historical, near future and far future, considering a simultaneous high tide and storm surge, with return periods (Tr) of 10, 25 and 100 years.
DomainDomainHistoricalNear FutureFar Future
Tr10Aveiro4.254.444.93
Tagus4.224.414.90
Vigo4.474.665.15
A Coruña Outer Port5.215.405.89
Tr25Aveiro4.384.575.06
Tagus4.324.515.00
Vigo4.574.765.25
A Coruña Outer Port5.305.495.98
Tr100Aveiro4.554.745.23
Tagus4.454.645.13
Vigo4.674.865.35
A Coruña Outer Port5.385.576.06
Table 4. Historical average winter river discharge and predictions (%) for the study regions for the middle and end of the century.
DomainTributariesDischarge (m3s−1)2026–20452081–2100
AveiroVouga136−11−21
Antuã11−11−21
Cáster12−11−21
Boco4−11−21
Ribeira dos Moínhos13−11−21
TagusTagus994−8−23
Sorraia85−8−23
Trancão12−12−26
Vale Michões3−8−23
VigoOitavén-Verdugo61−10−17
Table 5. Wave height (Hs), peak period (Tp), and mean wave direction (Dm) for each region contiguous to the ports under study, climate period and return period.
PeriodHs (m)Tp (s)Dm (°)
Tr10Tr25Tr100Tr10Tr25Tr100-
AveiroHistorical9.410.512.120.321.322.7355
Near Future8.69.510.620.721.923.6345
Far Future9.410.311.620.721.823.3345
TagusHistorical8.59.611.220.120.922.3355
Near Future8.79.711.320.521.522.9355
Far Future8.18.89.820.221.122.4355
VigoHistorical9.210.011.220.521.623.3355
Near Future8.99.710.820.721.823.5355
Far Future9.410.111.220.621.522.9355
A Coruña Outer PortHistorical11.512.814.819.920.822.2345
Near Future10.111.012.220.020.922.3345
Far Future10.511.412.820.621.623.1345
Table 6. Scenario definition: extreme sea levels (ESL in meters, evaluated in Section 3.2) for the 10-, 25- and 100-year return periods (Tr) for the reference scenario (referred to present climate), and the river discharge (rd) for the historical (1979–2005), near future (2026–2045) and far future (2081–2099) periods for each domain.
Tr10Tr25Tr100Reference
ESLrdESLrdESLrdESLrd
AveiroHistorical4.2513024.3815594.5519433.30136.16
Near Future4.4411594.5713884.741756
Far Future4.9310295.0612325.231535
TagusHistorical4.2253184.3269064.4592563.30994
Near Future4.4148924.5163544.648515
Far Future4.9040955.0053185.137127
VigoHistorical4.4713024.5715594.6719433.79136.16
Near Future4.6611594.7613884.861756
Far Future5.1510295.2512325.351535
A Coruña Outer PortHistorical5.21 5.30 5.38 4.49
Near Future5.40 5.49 5.57
Far Future5.89 5.98 6.06
Table 7. Flooded areas of the terminals at the ports are shown in percentage (%) relative to the total area of each terminal for the historical (H), near future (NF) and far future (FF) periods, and for the 10-, 25-, and 100-year return periods.
PortsTotal (m2)Tr10Tr25Tr100
HNFFFHNFFFHNFFF
Aveiro4,592,45422.924.025.924.125.527.928.151.261.7
Lisbon2,048,41622.625.936.424.928.639.228.029.843.4
Vigo357,4859.810.514.310.110.916.210.611.419.7
A Coruña Outer Port96,200.1000000000
Disclaimer/Publisher’s Note: The statements, opinions and data contained in all publications are solely those of the individual author(s) and contributor(s) and not of MDPI and/or the editor(s). MDPI and/or the editor(s) disclaim responsibility for any injury to people or property resulting from any ideas, methods, instructions or products referred to in the content.

