Article

Optimal Assimilation Number of Phytoplankton in the Siberian Seas: Spatiotemporal Variability, Environmental Control and Estimation Using a Region-Specific Model

by
Andrey B. Demidov
1,*,
Tatiana A. Belevich
2 and
Sergey V. Sheberstov
1
1
Shirshov Institute of Oceanology, Russian Academy of Sciences, Moscow 117218, Russia
2
Department of Biology, Lomonosov Moscow State University, Moscow 119991, Russia
*
Author to whom correspondence should be addressed.
J. Mar. Sci. Eng. 2023, 11(3), 522; https://doi.org/10.3390/jmse11030522
Submission received: 16 January 2023 / Revised: 20 February 2023 / Accepted: 24 February 2023 / Published: 27 February 2023

Abstract

:
The maximal value of the chlorophyll-specific carbon fixation rate in the water column or the optimal assimilation number (Pbopt) is an important parameter used to estimate water column integrated primary production (IPP) using models and satellite-derived data. The spatiotemporal variability in the Pbopt of the total and size-fractionated phytoplankton in the Siberian Seas (SSs) and its links with environmental factors were studied based on long-term (1993–2020) field and satellite-derived (MODIS-Aqua) observations. The average value of Pbopt in the SSs was equal to 1.38 ± 0.76 mgC (mg Chl a)–1 h–1. The monthly average values of Pbopt decreased during the growing season from 1.95 mgC (mg Chl a)–1 h–1 in July to 0.64 mgC (mg Chl a)–1 h–1 in October. The average value of Pbopt for small (<3 μm) phytoplankton 1.6-fold exceeded that for large (>3 μm) phytoplankton. The values of Pbopt depend mainly on incident photosynthetically available radiation (PAR). Based on the relationship between Pbopt and PAR, the empirical region-specific algorithm (E0reg) was developed. The E0reg algorithm performed better than commonly used temperature-based models. The application of E0reg for the calculation of Pbopt will make it possible to more precisely estimate IPP in the SSs.

1. Introduction

The primary production (PP) of oceanic phytoplankton amounts to approximately half of the net autotrophic production of the Earth [1]. PP is an important factor in CO2 exchange between the atmosphere and ocean, which is one of the factors that determine global climate change [2,3,4,5,6,7]. Therefore, the estimation of the long-term variability in PP under climate trends is one of the main tasks of the biogeochemistry of the World Ocean [8]. Currently, this estimation is carried out using production and biogeochemical models with satellite-derived data as input variables.
Parametrisation is one of the main problems in PP modelling and one of the main factors determining the model performance. Chlorophyll a (Chl a)-normalised PP (chlorophyll-specific carbon fixation rate or assimilation number; Pb = PP/Chl a) is the most important parameter characterising the photoadaptive processes of phytoplankton, used to develop primary production algorithms and estimate the spatiotemporal variations in PP. There are two approaches to Pb determination. One of them is P-I experiments, which establish the relationship between the rate of carbon assimilation and the intensity of artificial light during short (≤4 h) expositions described using the models fitted to the photosynthesis vs. irradiance curves [9,10]. Such experiments are carried out in photosynthetrons where irradiance saturating of photosynthesis is achieved. The value of the chlorophyll-specific carbon fixation rate at saturating light intensity is defined as the maximal assimilation number (Pbmax). With a different approach, Pb is estimated during measurements of integral PP in the water column (IPP) under natural illumination [11,12]. Therein, the maximal Pb is determined at the depth with optimal irradiance for photosynthesis and defined as the optimal assimilation number (Pbopt). It should be noted that under natural conditions, the maximal values of carbon assimilation can be achieved at a light intensity less than that which saturates photosynthesis. Therefore, the parameters of Pbmax and Pbopt are not equivalent [13].
The present paper studies the spatiotemporal variations in Pbopt and its links with environmental variables. This parameter is widely used in so-called chlorophyll-based PP models [13,14]. The comparison of the predictive skill of these algorithms with other models was repeatedly carried out previously [15,16,17,18,19,20,21,22,23,24].
The development and validation of PP models for the assessment of IPP in the Arctic Ocean is a complicated problem. The Arctic Ocean is an under-sampled region in terms of in situ PP measurements, which is one of the components of this problem. Therefore, prominent evaluations of the Arctic Ocean IPP were performed using the models, which were originally developed for other parts of the World Ocean [21]. This approach decreases the accuracy of IPP estimation in the Arctic Ocean. Meanwhile, it is known that using regional-specific algorithms increases the efficiency of IPP assessment [18,21,25,26,27].
The Siberian Seas (SSs), which include the Kara, Laptev, and East Siberian Seas, are the least studied among all areas of the Arctic Ocean in terms of PP processes [28,29,30]. Thus, little is known about the values of Pbopt in the SSs, its relationships with environmental factors, and the magnitude of Pbopt of size-fractionated phytoplankton [31,32,33]. Meanwhile, it is known that size composition is an important abiotic factor affecting the Pbopt value of phytoplankton [34].
Determination of the range in variability and the average value of Pbopt in the SSs is critically important for the investigation of PP features in this region. These features are linked with the particularity of the phytoplankton biotope that functions on the broad continental shelf under the influence of intense river runoff [35,36,37,38,39]. Freshwater discharge into the Siberian shelf leads to low salinity in the subsurface layer, sharp stratification [40,41,42,43], and high particulate (POM) and coloured dissolved (CDOM) organic matter, as well as the concentration of terrigenous mineral suspension [35,44,45,46]. Consequently, the Kara Sea waters are characterised by high turbidity, low transparency (average Secchi disk depth of 8 m), and a small photosynthetic layer (22 m on average) [47]. Therefore, it seems relevant to develop the region-specific algorithm of Pbopt for the SSs as one of the main parameters of PP models.
There are two approaches to the application of Pbopt in PP models. According to one of them, Pbopt is used as the average value for a particular biogeochemical province [48,49]. The second approach assumes the calculation of Pbopt by its relationship with a value of an environmental factor that is determined with remote sensing from space. The second one is recommended to be used in areas of the World Ocean with a high spatiotemporal variability in biogeochemical parameters [50]. The intense river runoff is the reason for sharp spatial gradients of hydrophysical, hydrochemical, and biological parameters in the SSs. Therefore, the application of the second approach to Pbopt modelling can improve the model performance. To implement this method, it is necessary to establish the relationships between Pbopt and the environmental factors: photosynthetically available radiation (PAR), nutrient concentration, water temperature, salinity, and Chl a concentration.
Thus, for region-specific modelling, it is relevant to develop an empirical algorithm describing the relationships between Pbopt and environmental factors. The main abiotic variable that determines Pbopt values and that is easily assessed using remote sensing is sea surface temperature (T0). Meanwhile, it is known that other environmental factors limiting the rate of photosynthesis such as PAR and nutrients constrain IPP and Pbopt at high latitudes [51,52,53,54,55]. Here, it is postulated that the PAR-based Pbopt algorithm is more effective in the SSs than the T-based models. The development of a sufficiently effective region-specific model of Pbopt will make it possible in the future to obtain new estimates of the annual values of IPP in the SSs using satellite-derived data.
Thus, the aims of the present article were: (1) to establish the ranges in variability and the average values of Pbopt in the SSs; (2) to evaluate the influence of the environmental factors on Pbopt; and (3) to develop an empirical region-specific model and apply it to describe the spatial distribution in Pbopt in the SSs using satellite-derived data.

2. Materials and Methods

2.1. Data Sources and Sampling

The field data were obtained in boreal summer (July, August) and autumn (September, October) during 11 cruises in the Siberian Seas (SSs) in 1993, 2007, 2011, and 2013–2020 (Table 1). The sampling sites where the measurements of primary production (PP), chlorophyll a concentration (Chl a) of total and size-fractionated phytoplankton, and environmental parameters were performed are shown in Figure 1. At these sites, the calculations of the optimal assimilation number (Pbopt) were performed. The values of the measured variables are shown in the Supplementary Materials (Table S1).
The sampling depths were defined after a preliminary sounding of temperature, conductivity, and chlorophyll fluorescence using a CTD probe SBE-19 and SBE-32 (Seabird Electronics Inc., Bellevue, WA, USA). Niskin bottles were deployed at the stations to obtain water samples from discrete depths within the upper 100 m layer. Trace metal cleaning procedures (e.g., Teflon-coated covers and springs for the Niskin bottles) [63] were used during all the cruises.

2.2. The Field Data

The methods for determining PP and Chl a are described in detail in previous studies [47,57]. PP was estimated on board using a radiocarbon technique [64] according to simulated in situ approach. Acid-cleaned 160 mL bottles with water samples after the addition of sodium bicarbonate (NaH14CO3, 0.05 μCi per 1 mL of sample) were placed under neutral lighting filters and exposed for half of a light day in a deck incubator with the seawater temperature maintained at the in situ conditions. The transparency of neutral lighting filters was chosen based on the light exposure conditions at the sampling depths after the sounding of underwater photosynthetically available radiation (PAR). After exposure, the samples were filtered onto a 0.45 μm nitrocellulose membrane “Vladipore” (Vladipore, Vladimir, Russia). After filtration, the samples were treated with 0.1 N HCl and filtered seawater, dried overnight, and placed in a scintillation vial with 10 mL of the scintillation cocktail “Optiphase HiSafe III” (PerkinElmer, Waltham, MA, USA). The radioactivity in the samples was determined after 24 h using a liquid scintillation counter “Triathler” (Hidex, Turku, Finland).
The Chl a concentration was determined using a spectrophotometric method [65,66] or fluorometrically [67,68]. Previous comparisons have shown good agreement between various methods of Chl a determination [69,70]. The PP and Chl a data that were obtained with these methods were used for Pbopt calculations. The Pbopt value was determined as the maximal value of the PP to Chl a ratio in the water column.
The intensity of the incident surface irradiance was measured with an LI-190SA (LI-COR) sensor [58,59,60,61,62]. The daily PAR was obtained from integration in the LI-1400 module for five-minute intervals (mol quanta m−2) and saved in the internal memory. Underwater irradiance was measured in the following mode. The LI-192SA underwater light sensor, mounted vertically on a cable and in the sounding mode, was moved down to a depth of ∼60–80 m and, at shallow stations, down to the bottom.
Concentrations of silicates (Si(OH)4), phosphates (PO4), nitrites (NO2), nitrates (NO3), and ammonium (NH4) were measured using the methods described previously [71,72]. Colourimetric determinations were performed with HACH Lange DR 2800 and LEKI SS2107UV spectrophotometers. Determination of the total alkalinity (Alk) was carried out using the direct titration technique. Calculations of the dissolved CO2 and concentrations of various forms of dissolved inorganic carbon were performed with the pH-Alk method using thermodynamic equations for the carbon balance with constants for carbonic acid dissociation [72,73].
The values of environmental variables at the depth with Pbopt were used for statistical analysis. It should be noted that the Pbopt values were predominantly observed within the upper 0–2 m layer (Table S1).
To determine Chl a and PP of large phytoplankton (>3 μm), samples were successively filtered through a Nucleopore filter with a 3 μm pore size (Reatrack, Obninsk, Russia). Small (<3 μm) Chl a and PP values were obtained by subtracting the large phytoplankton from the total Chl a and PP values [33].
The spatial variability in PP characteristics in the Siberian Seas (SSs) depends mainly on the distribution of river runoff [58,59,60,61,62]. Therefore, it can be assumed that the values of Pbopt in the areas under the influence of riverine waters and the areas without such impact can be different. Sea surface salinity (S0) is the indicator of these types of waters (S0 < 25 and >25, respectively). Thus, the average values of Pbopt for the regions with S0 < 25 and >25 were calculated separately. According to [74], the annual average isohaline 25 separates brackish waters and waters with salinity close to oceanic. Water salinity was measured using the Practical Salinity Scale.

2.3. Statistical Analysis

Before calculations, data were log-transformed to achieve normal distribution and for use in the parametrical statistic methods. Then, data were checked for normality using the Kolmogorov–Smirnov test (Figure S1).
The relationships between parameters were tested using linear regression and principal component analysis (PCA). Correspondences between log-transformed variables were estimated using Pearson’s coefficient of correlation (R). A difference between sample means was assessed using Student’s t-test. The null hypothesis was rejected at p < 0.01. Statistical calculations were performed using the Statistica 6.0 software (StatSoft Inc., Tulsa, OK, USA).

2.4. Development and Verification of Pbopt Models

The entire dataset was randomly divided into two parts. Two-thirds and one-third were used for model development and validation, respectively. The relationships between the measured and modelled Pbopt estimates were tested using linear regression. The variance in the dependent values was defined by the coefficient of determination (R2). The slope and intercept of the linear regression determined the fitted line according to a 1:1 agreement.
The root-mean-square difference (RMSD) was used to assess the model performance. The RMSD revealed differences between the log-transformed measured and modelled values and comprised both bias (systematic error) and variability (σ—random error) [75,76]. The log-normalised RMSD was used to assess the overall model performance in Primary Productivity Algorithm Round Robins (PPARR) studies [15,17,18,19,21]. The models with lower RMSD have higher skill and vice versa. An RMSD value close to 0.3 indicates model over- or underestimation by a factor of 2. In addition, the mean bias (B) of each model was calculated to assess over- or underestimated Pbopt.

2.5. Satellite-Derived Data of Photosynthetically Available Radiation (PAR)

Moderate Resolution Imaging Spectroradiometer (MODIS-Aqua) Level 2 data on PAR with 9 × 9 km resolution were obtained from NASA’s Goddard Space Flight Centre (NASA GSFC) (www.oceancolor.gsfc.nasa.gov/ (accessed on 22 August 2022)). Data on PAR were used as a standard product of the MODIS-Aqua scanner [77]. The time period of the satellite data coincided with in situ observations (2007–2020). In situ and satellite data are considered to be matched up on the same day. All the satellite-derived data products were calculated as average values over acceptable nine pixels around a given point (in situ and satellite match-up sites, N = 373 for Pbopt and N = 322 for PAR). A pixel was considered acceptable if it was without flags of cloudiness or land. The lists of matched-up in situ and satellite data are represented in Tables S2 and S3.

3. Results

3.1. Values and Spatiotemporal Variability in Optimal Assimilation Number (Pbopt) in the Siberian Seas (SSs) Using Field Observations

The total values of Pbopt in the SSs changed from 0.11 to 4.67 mgC (mg Chl a)–1 h–1. The average values varied from 1.27 ± 0.58 mgC (mg Chl a)–1 h–1 in the Laptev Sea to 1.77 ± 0.70 mgC (mg Chl a)–1 h–1 in the East Siberian Sea. The average value of Pbopt in the SSs was 1.38 ± 0.76 mgC (mg Chl a)–1 h–1 (Table 2).
The range of Pbopt variability in large phytoplankton (>3 μm) (Pbopt L) was 0.23–3.54 mgC (mg Chl a)–1 h–1. The average values of Pbopt L varied insignificantly from 1.02 ± 0.55 mgC (mg Chl a)–1 h–1 in the Laptev Sea to 1.21 ± 0.68 mgC (mg Chl a)–1 h–1 in the East Siberian Sea (Table 2). The total values of Pbopt for small phytoplankton (<3 μm) (Pbopt S) were more variable than Pbopt L and changed from 0.03 to 6.38 mgC (mg Chl a)–1 h–1. The average value of Pbopt S was the highest in the Kara Sea (1.78 ± 1.29 mgC (mg Chl a)–1 h–1), and it was the lowest in the Laptev Sea (1.30 ± 0.76 mgC (mg Chl a)–1 h–1). The average value of Pbopt S in the SSs was 1.6-fold higher than Pbopt L (Table 2). The difference between the average values of Pbopt S and Pbopt L was statistically significant (Student’s t-test, p < 0.01).
The difference between the average values of Pbopt, Pbopt L, and Pbopt S in the river runoff regions with surface salinity (S0) < 25 and in the areas out of the river’s influence (S0 > 25) was statistically insignificant. In addition, the seasonal average values of Pbopt, Pbopt L, and Pbopt S in these regions differentiated slightly (Table 3).
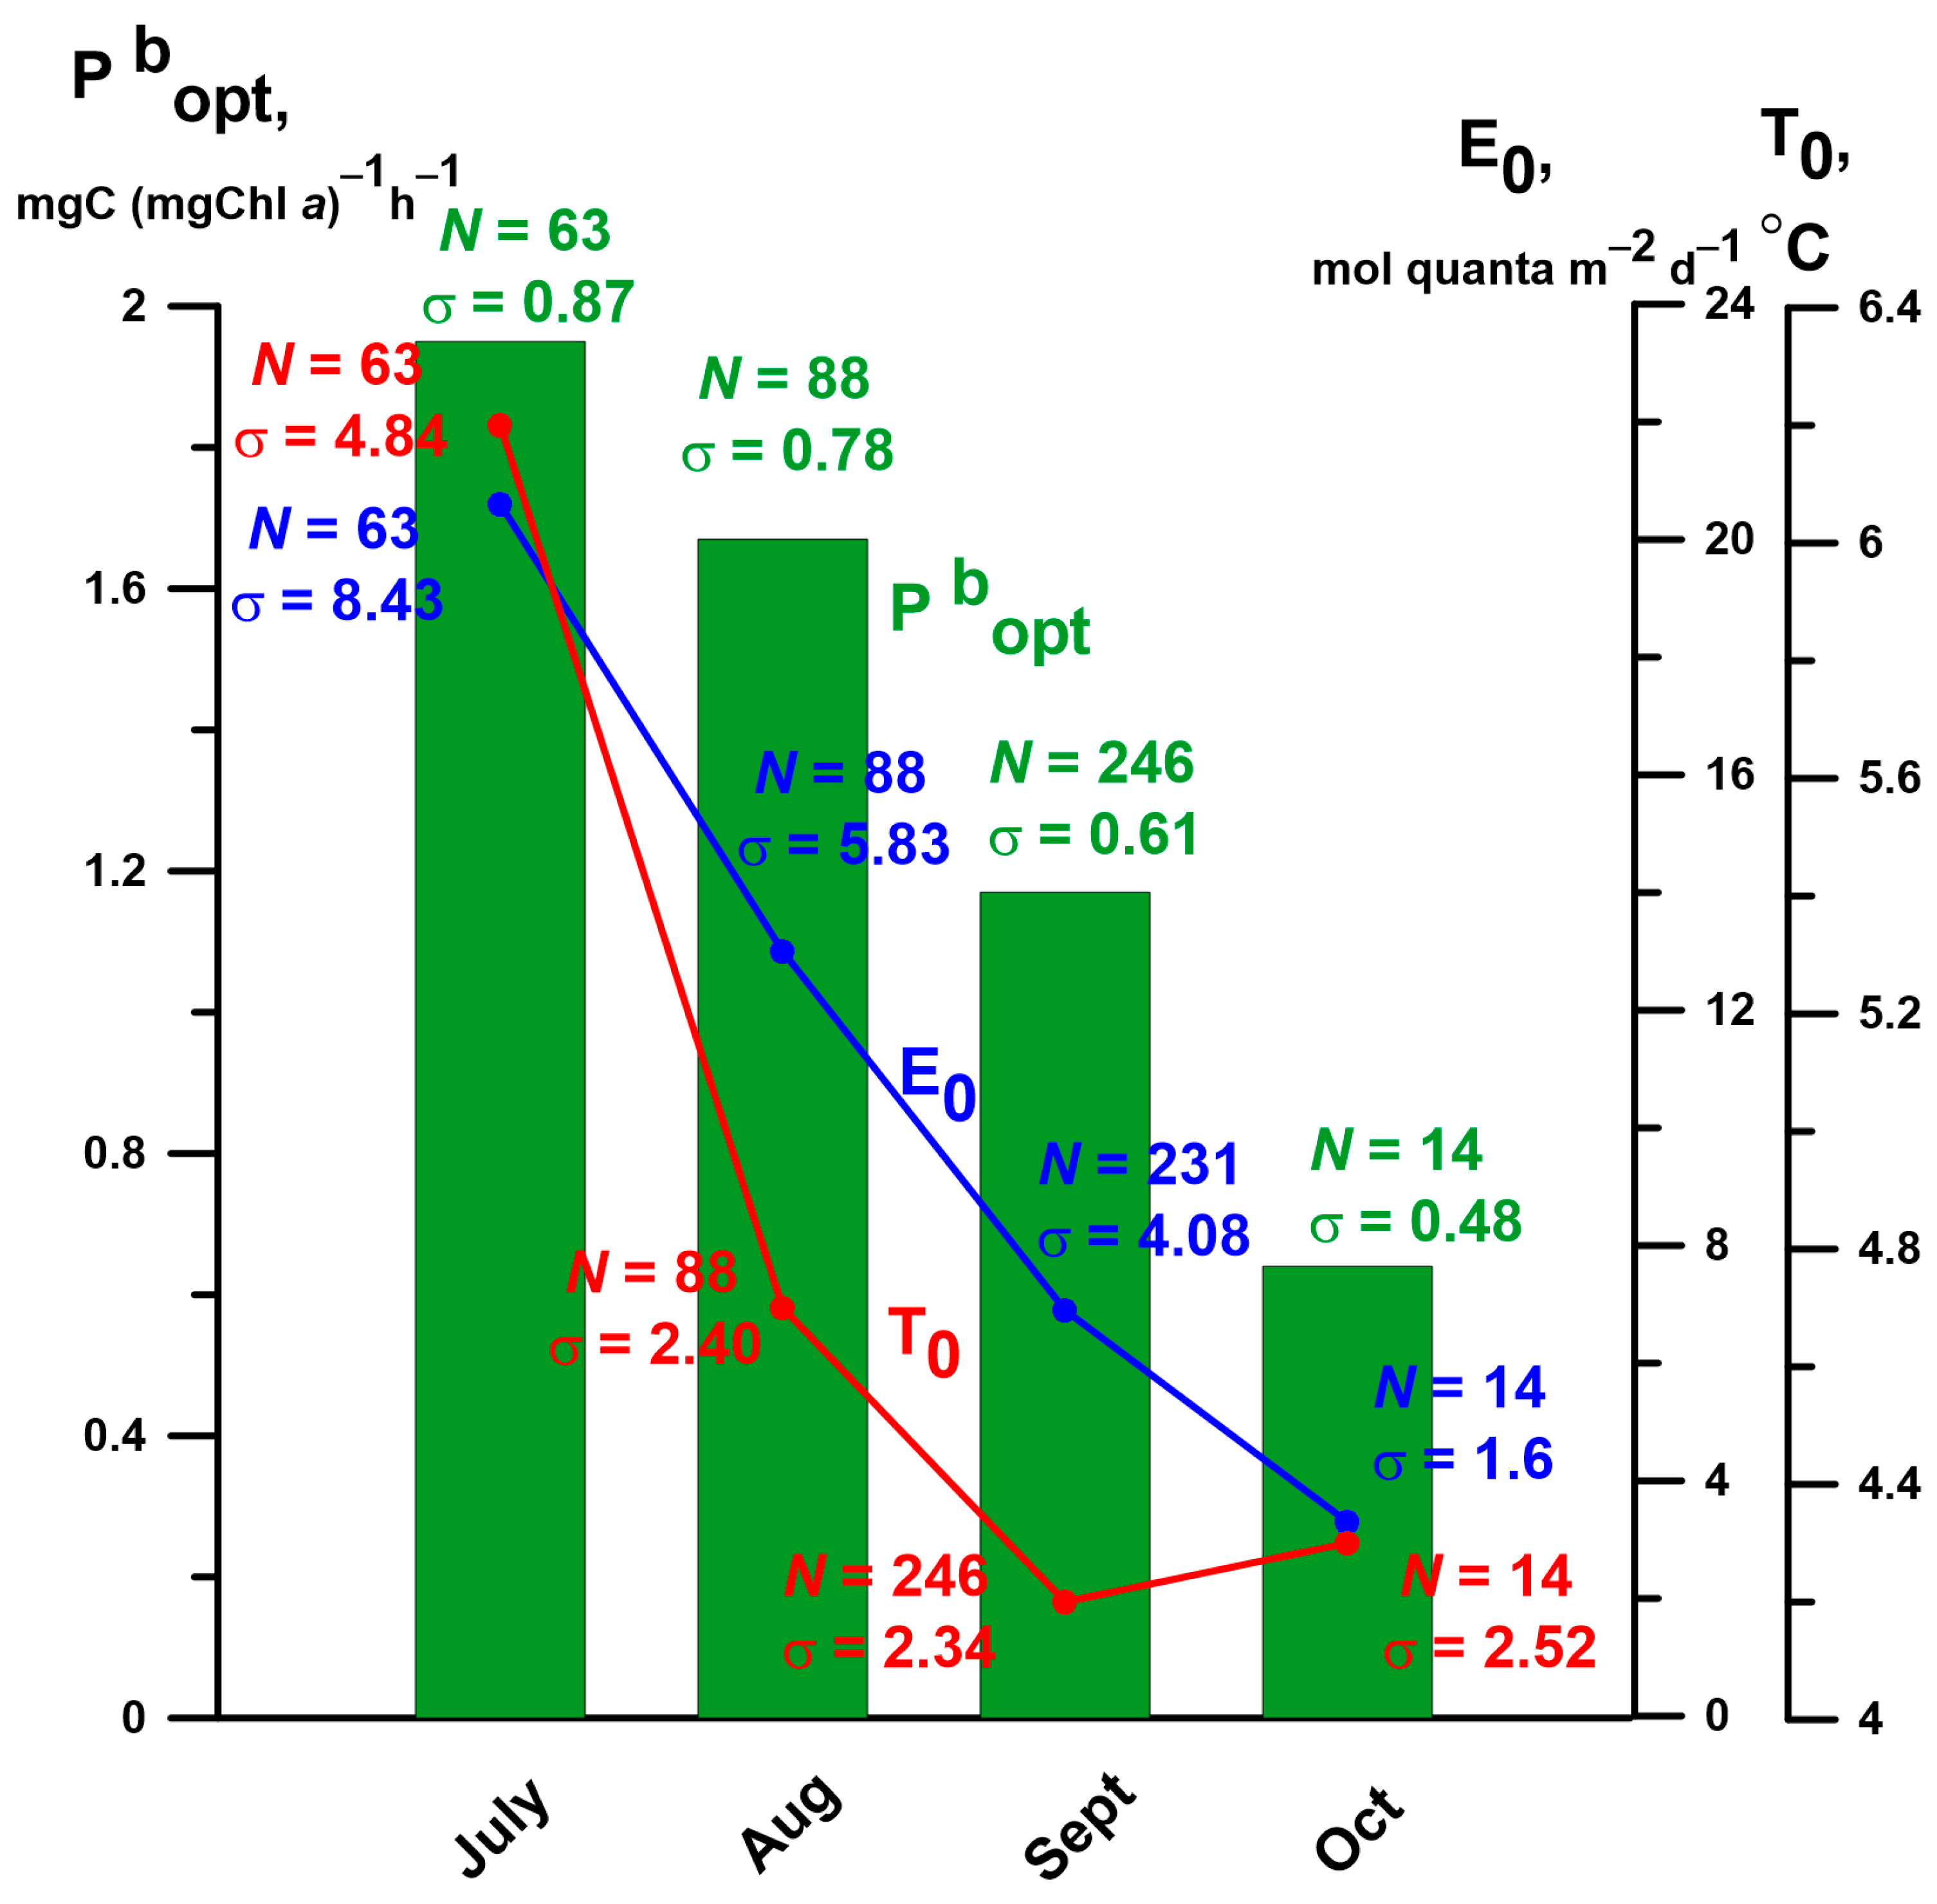
In the summer, the average values of Pbopt exceeded those in the autumn over the regions with S0 < 25 and S0 > 25 by factors of 1.4 and 1.7, respectively. These differences were statistically significant (Student’s t-test, p < 0.01). In the summer, the average values of Pbopt for different size fractions of phytoplankton were higher than in the autumn both in the brackish and in the oceanic waters (Table 3). It should be noted that the difference was statistically significant only for Pbopt S at S0 > 25. The monthly average values of Pbopt decreased during the growing season from 1.95 mgC (mg Chl a)–1 h–1 in July to 0.64 mgC (mg Chl a)–1 h–1 in October following the monthly average values of subsurface photosynthetically available radiation (PAR) (E0) and sea surface temperature (T0) (Figure 2).

3.2. The Relationships between Pbopt and Environmental Factors

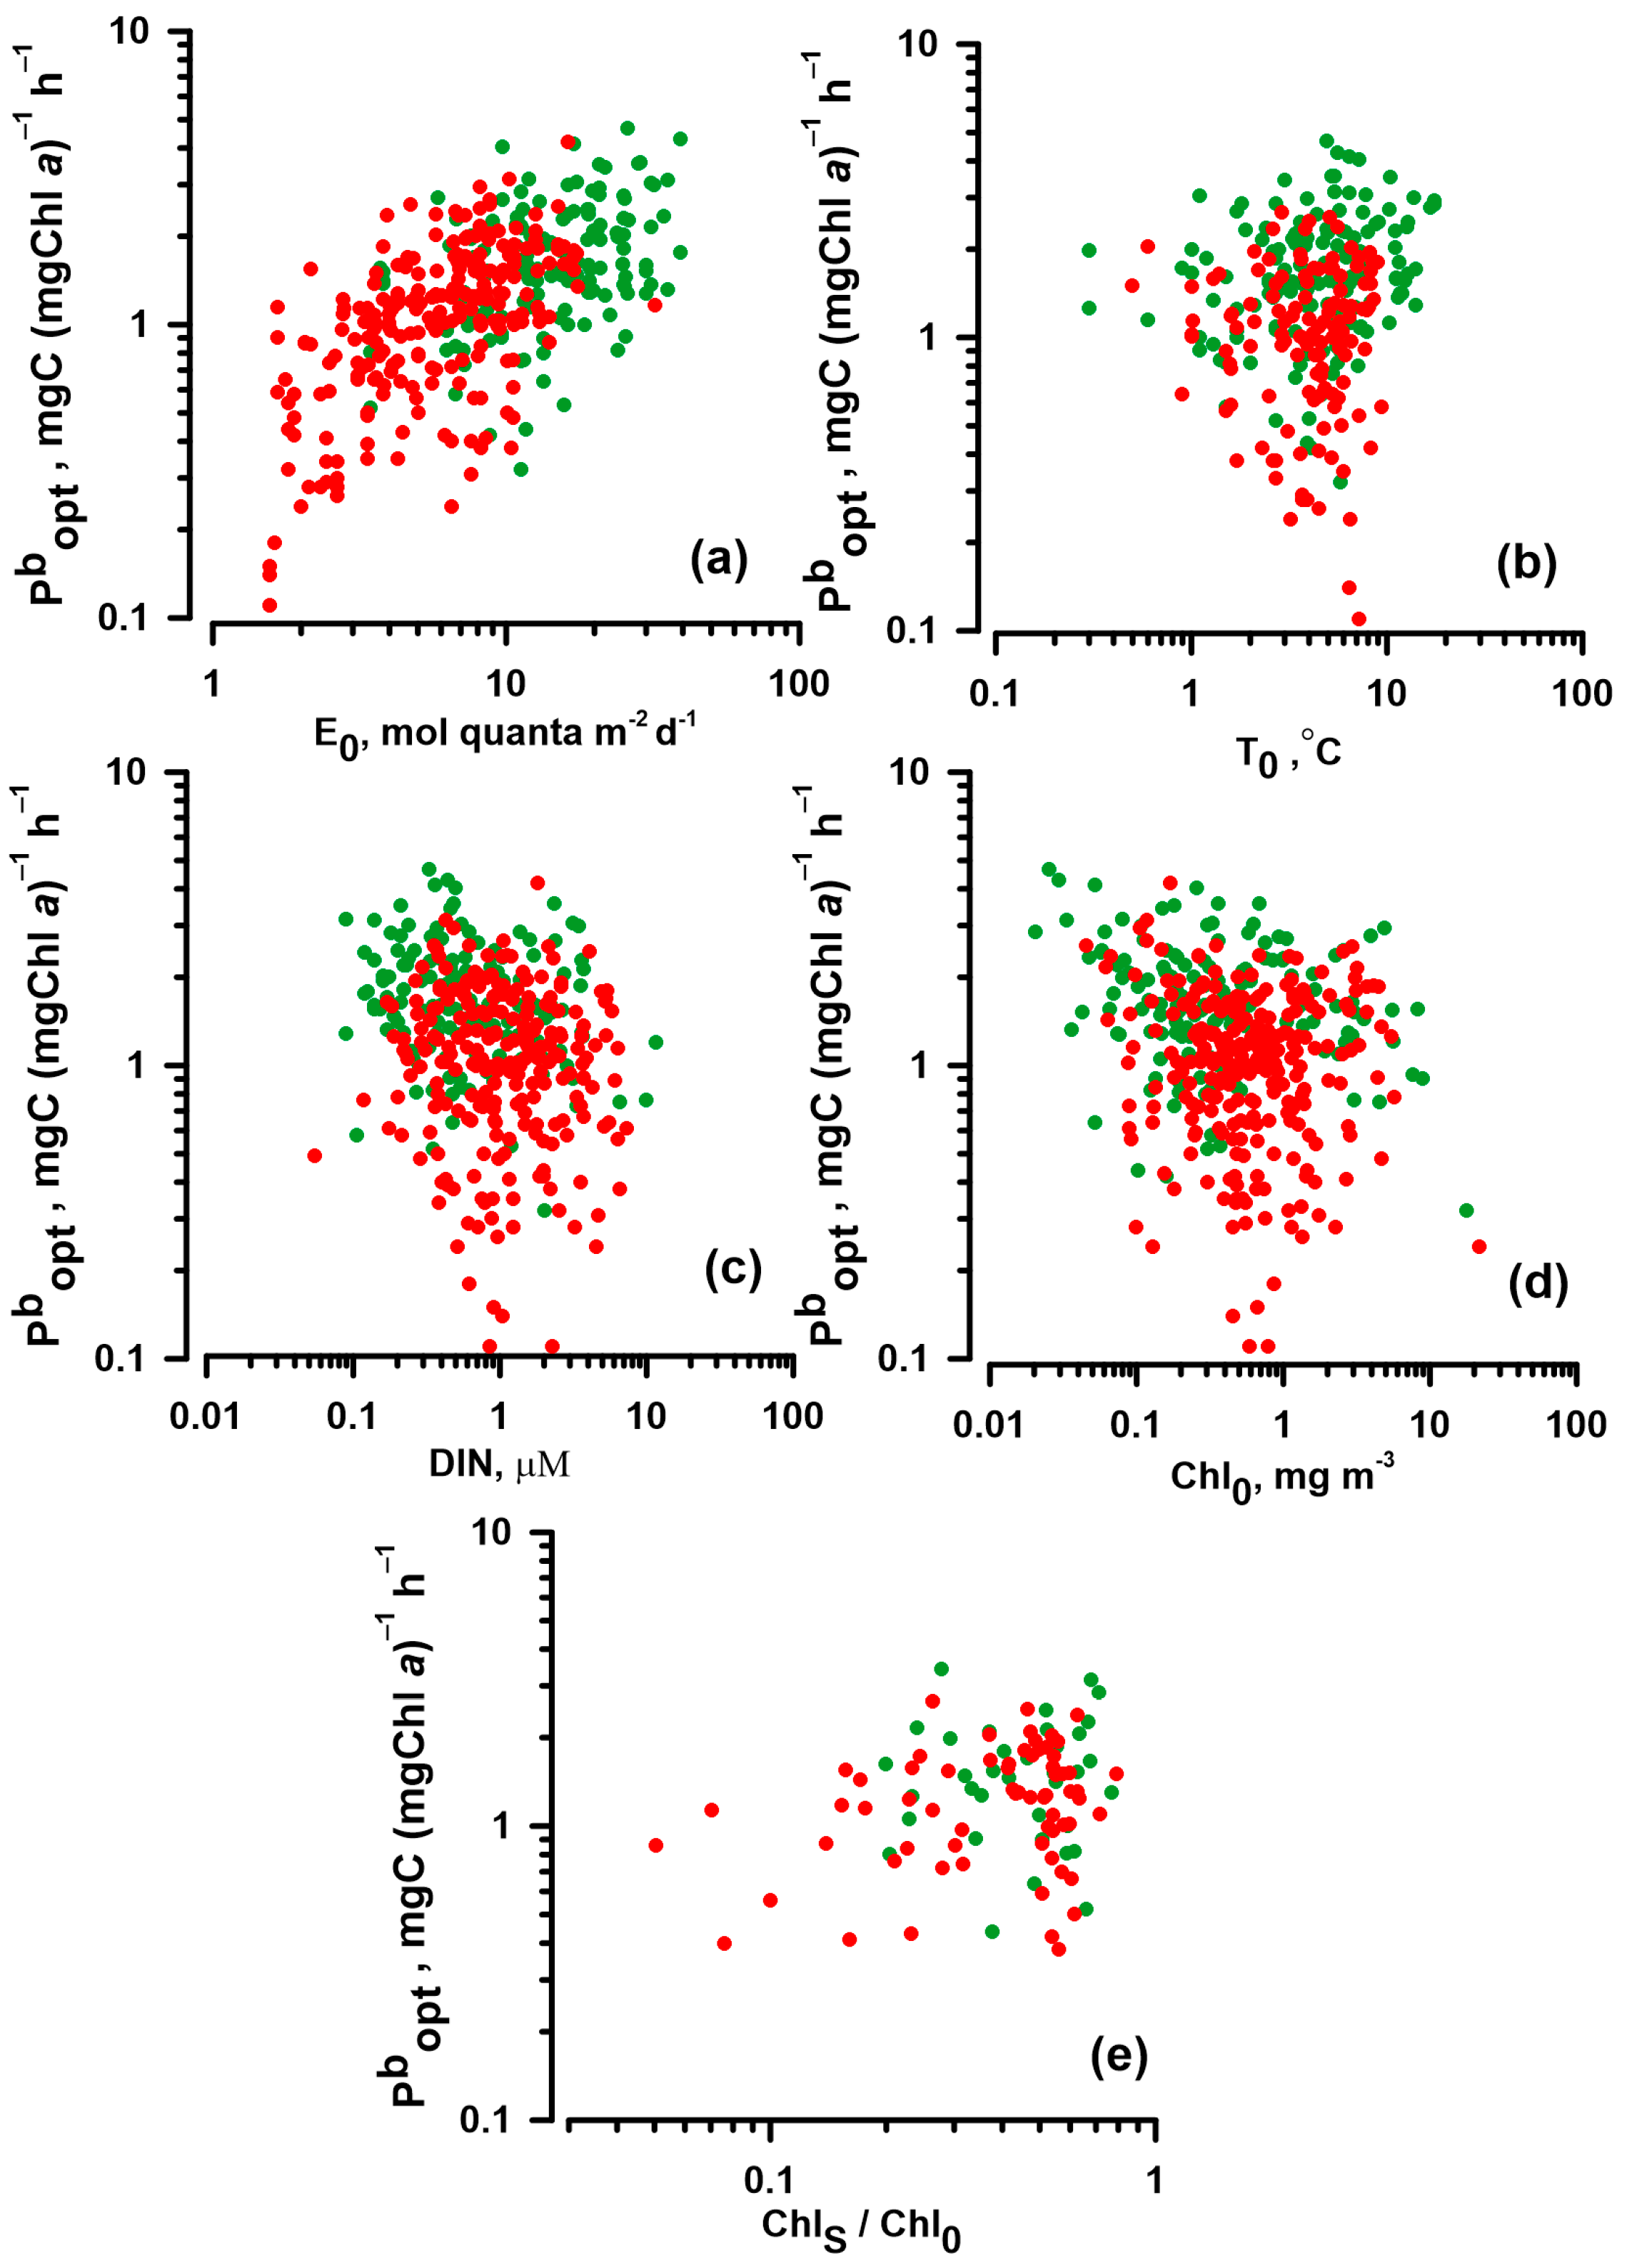
The relationships between Pbopt and environmental factors in different seasons are shown in Figure 3. The results of the correlation analysis are represented in Table 4. The statistically significant positive link with a high coefficient of correlation (R = 0.61) was established between Pbopt and E0. There were weak links between Pbopt and the other environmental variables (Table 4).
The relationships between different abiotic factors are characterised by multicollinearity (Table 5), which leads to uncertainty in the estimations of its influence on Pbopt. Principal component analysis (PCA) allows a reduction in the multicollinearity effect. PCA also generates an ordination diagram that illustrates links between Pbopt and environmental factors.
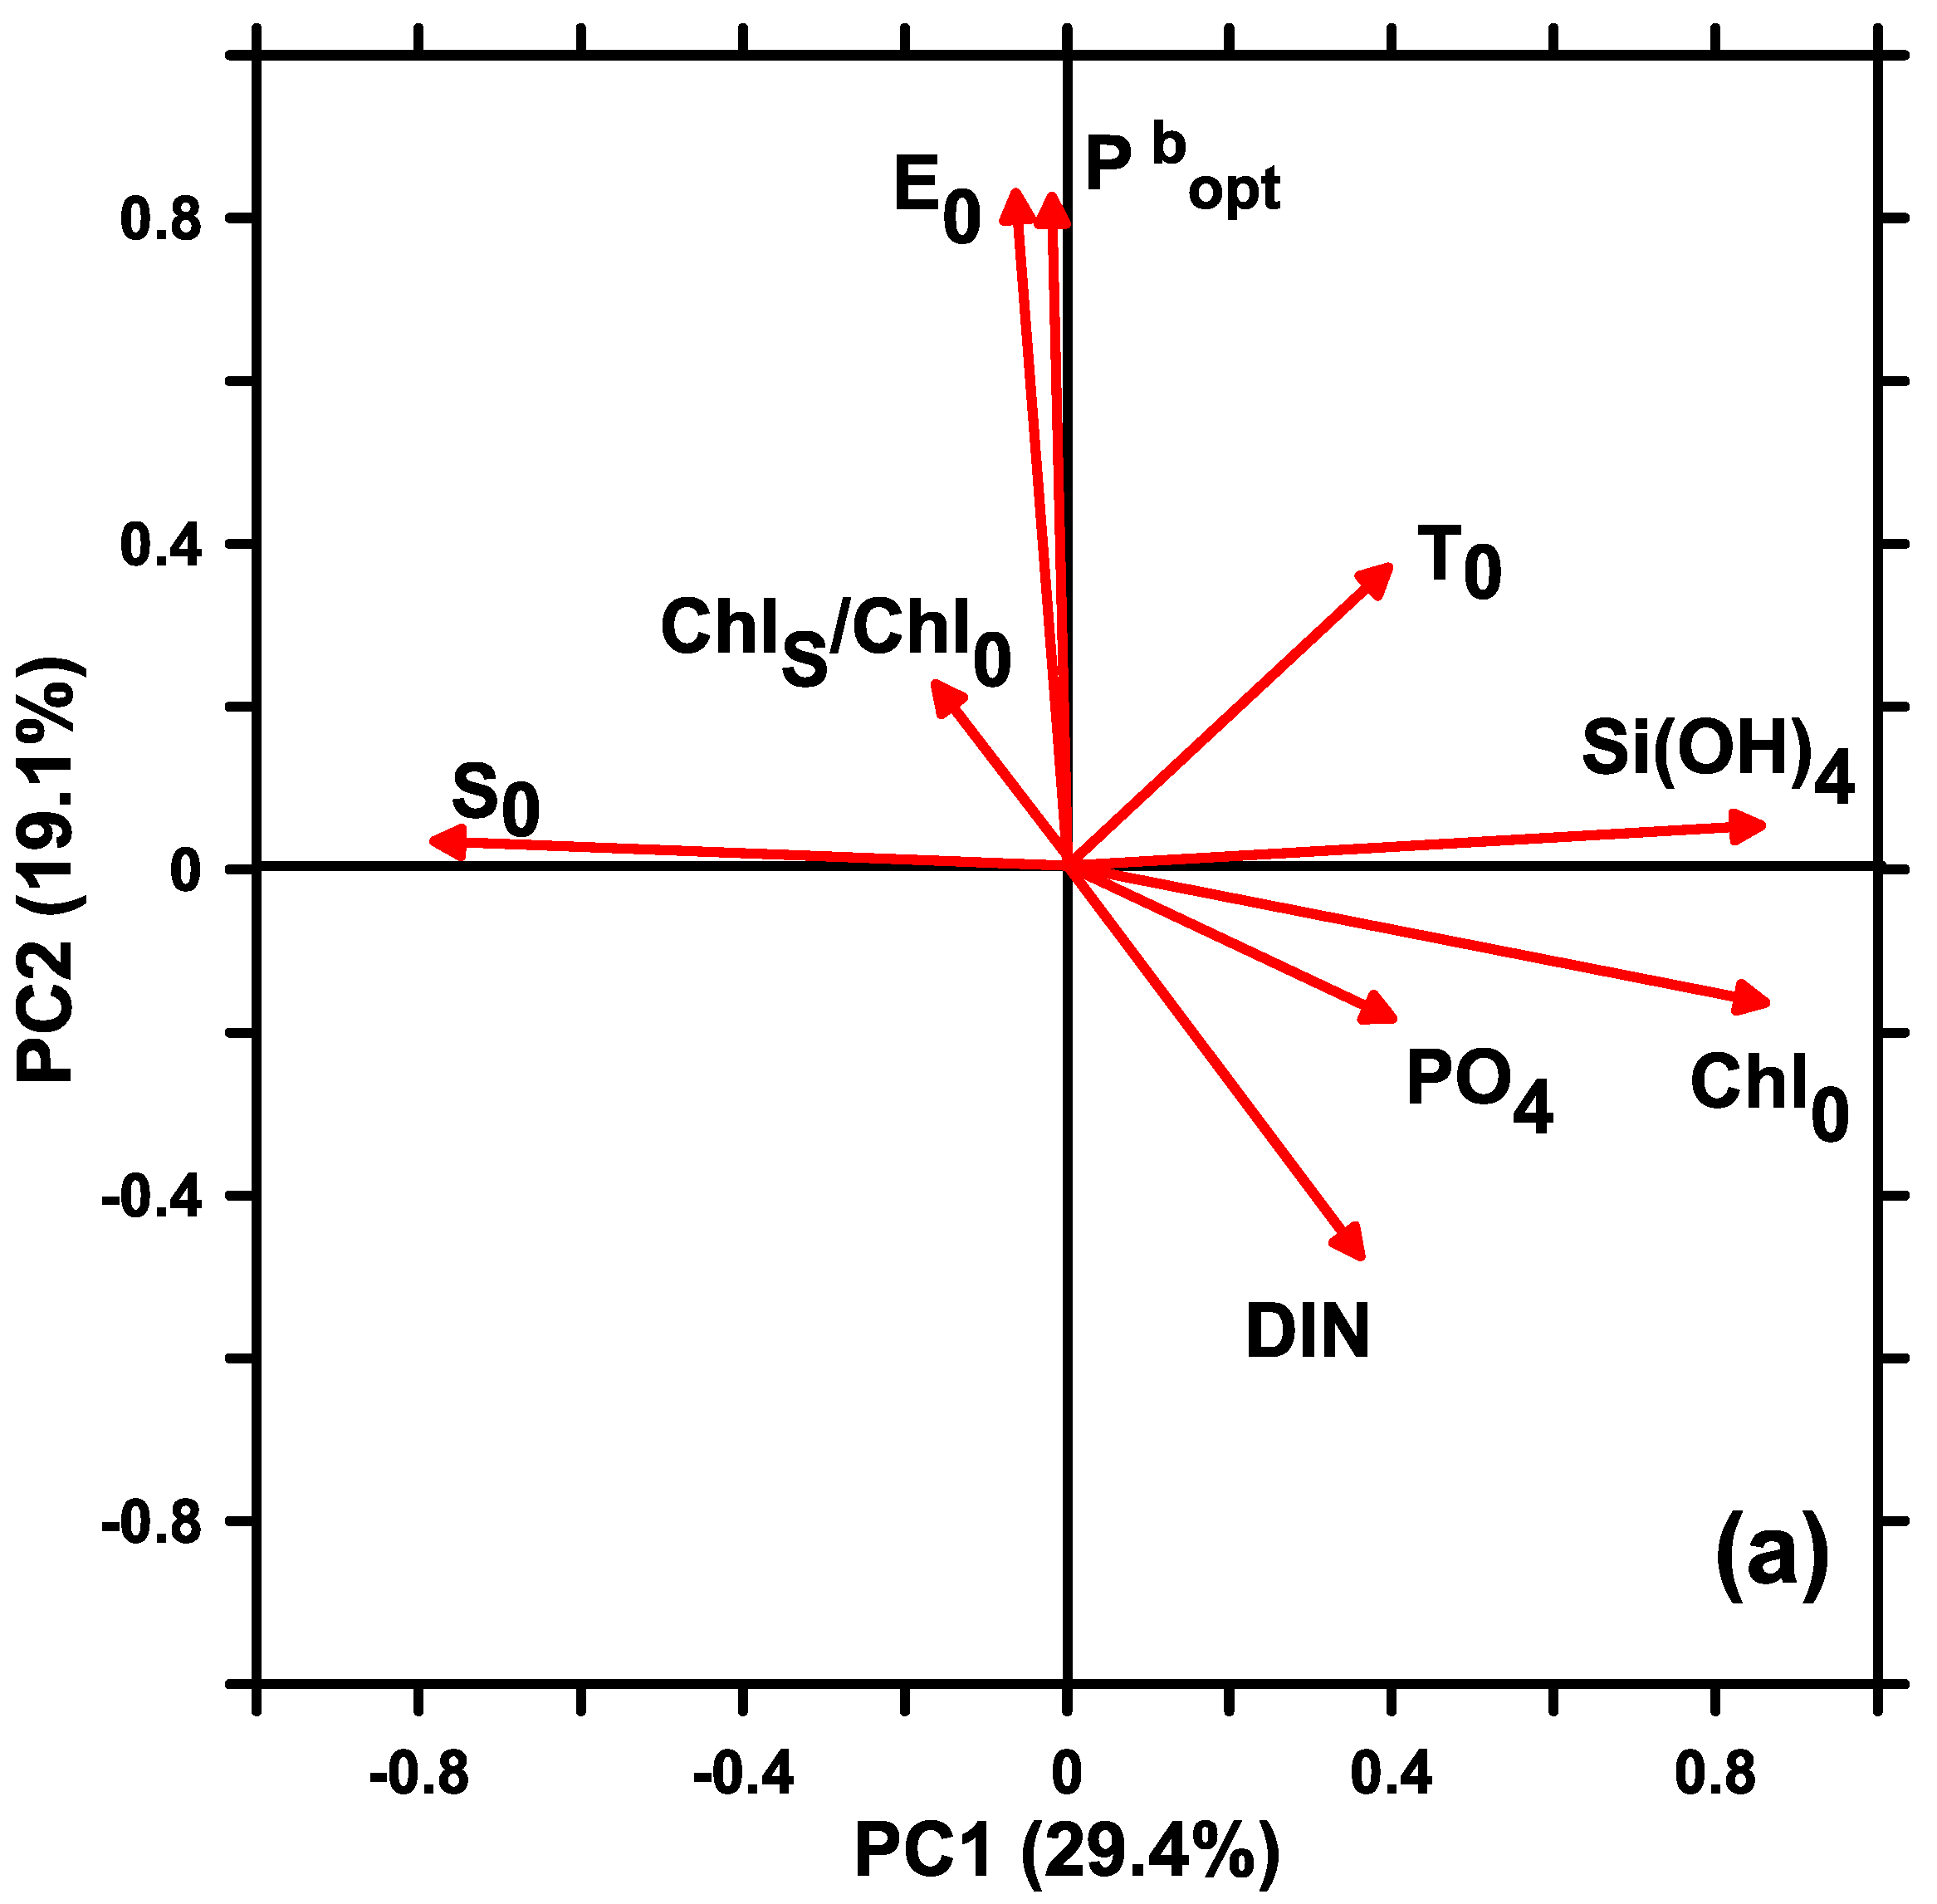
The results of PCA, which are presented in Figure 4, suggest that the main variables that contribute to the first principal component (PC1) are the abiotic factors S0, Si(OH)4, and Chl0. PC1 describes 29.4% of the total variance. The second principal component (PC2) includes the main variables of Pbopt and E0 and describes 21.8% of the total variance (Figure 4a).
The PCA analysis illustrates the well-pronounced positive relation between Pbopt and E0 that is indicated by the same direction of their vectors on the factorial plane. Similar to the correlation analysis, the results of the PCA show that Pbopt is weakly linked with salinity and Si(OH)4 as indicators of riverine waters. This is indicated by their orthogonality on the PCA map. Furthermore, the weak relationships between Pbopt and surface temperature and nutrients were shown by the PCA results (Figure 4a).
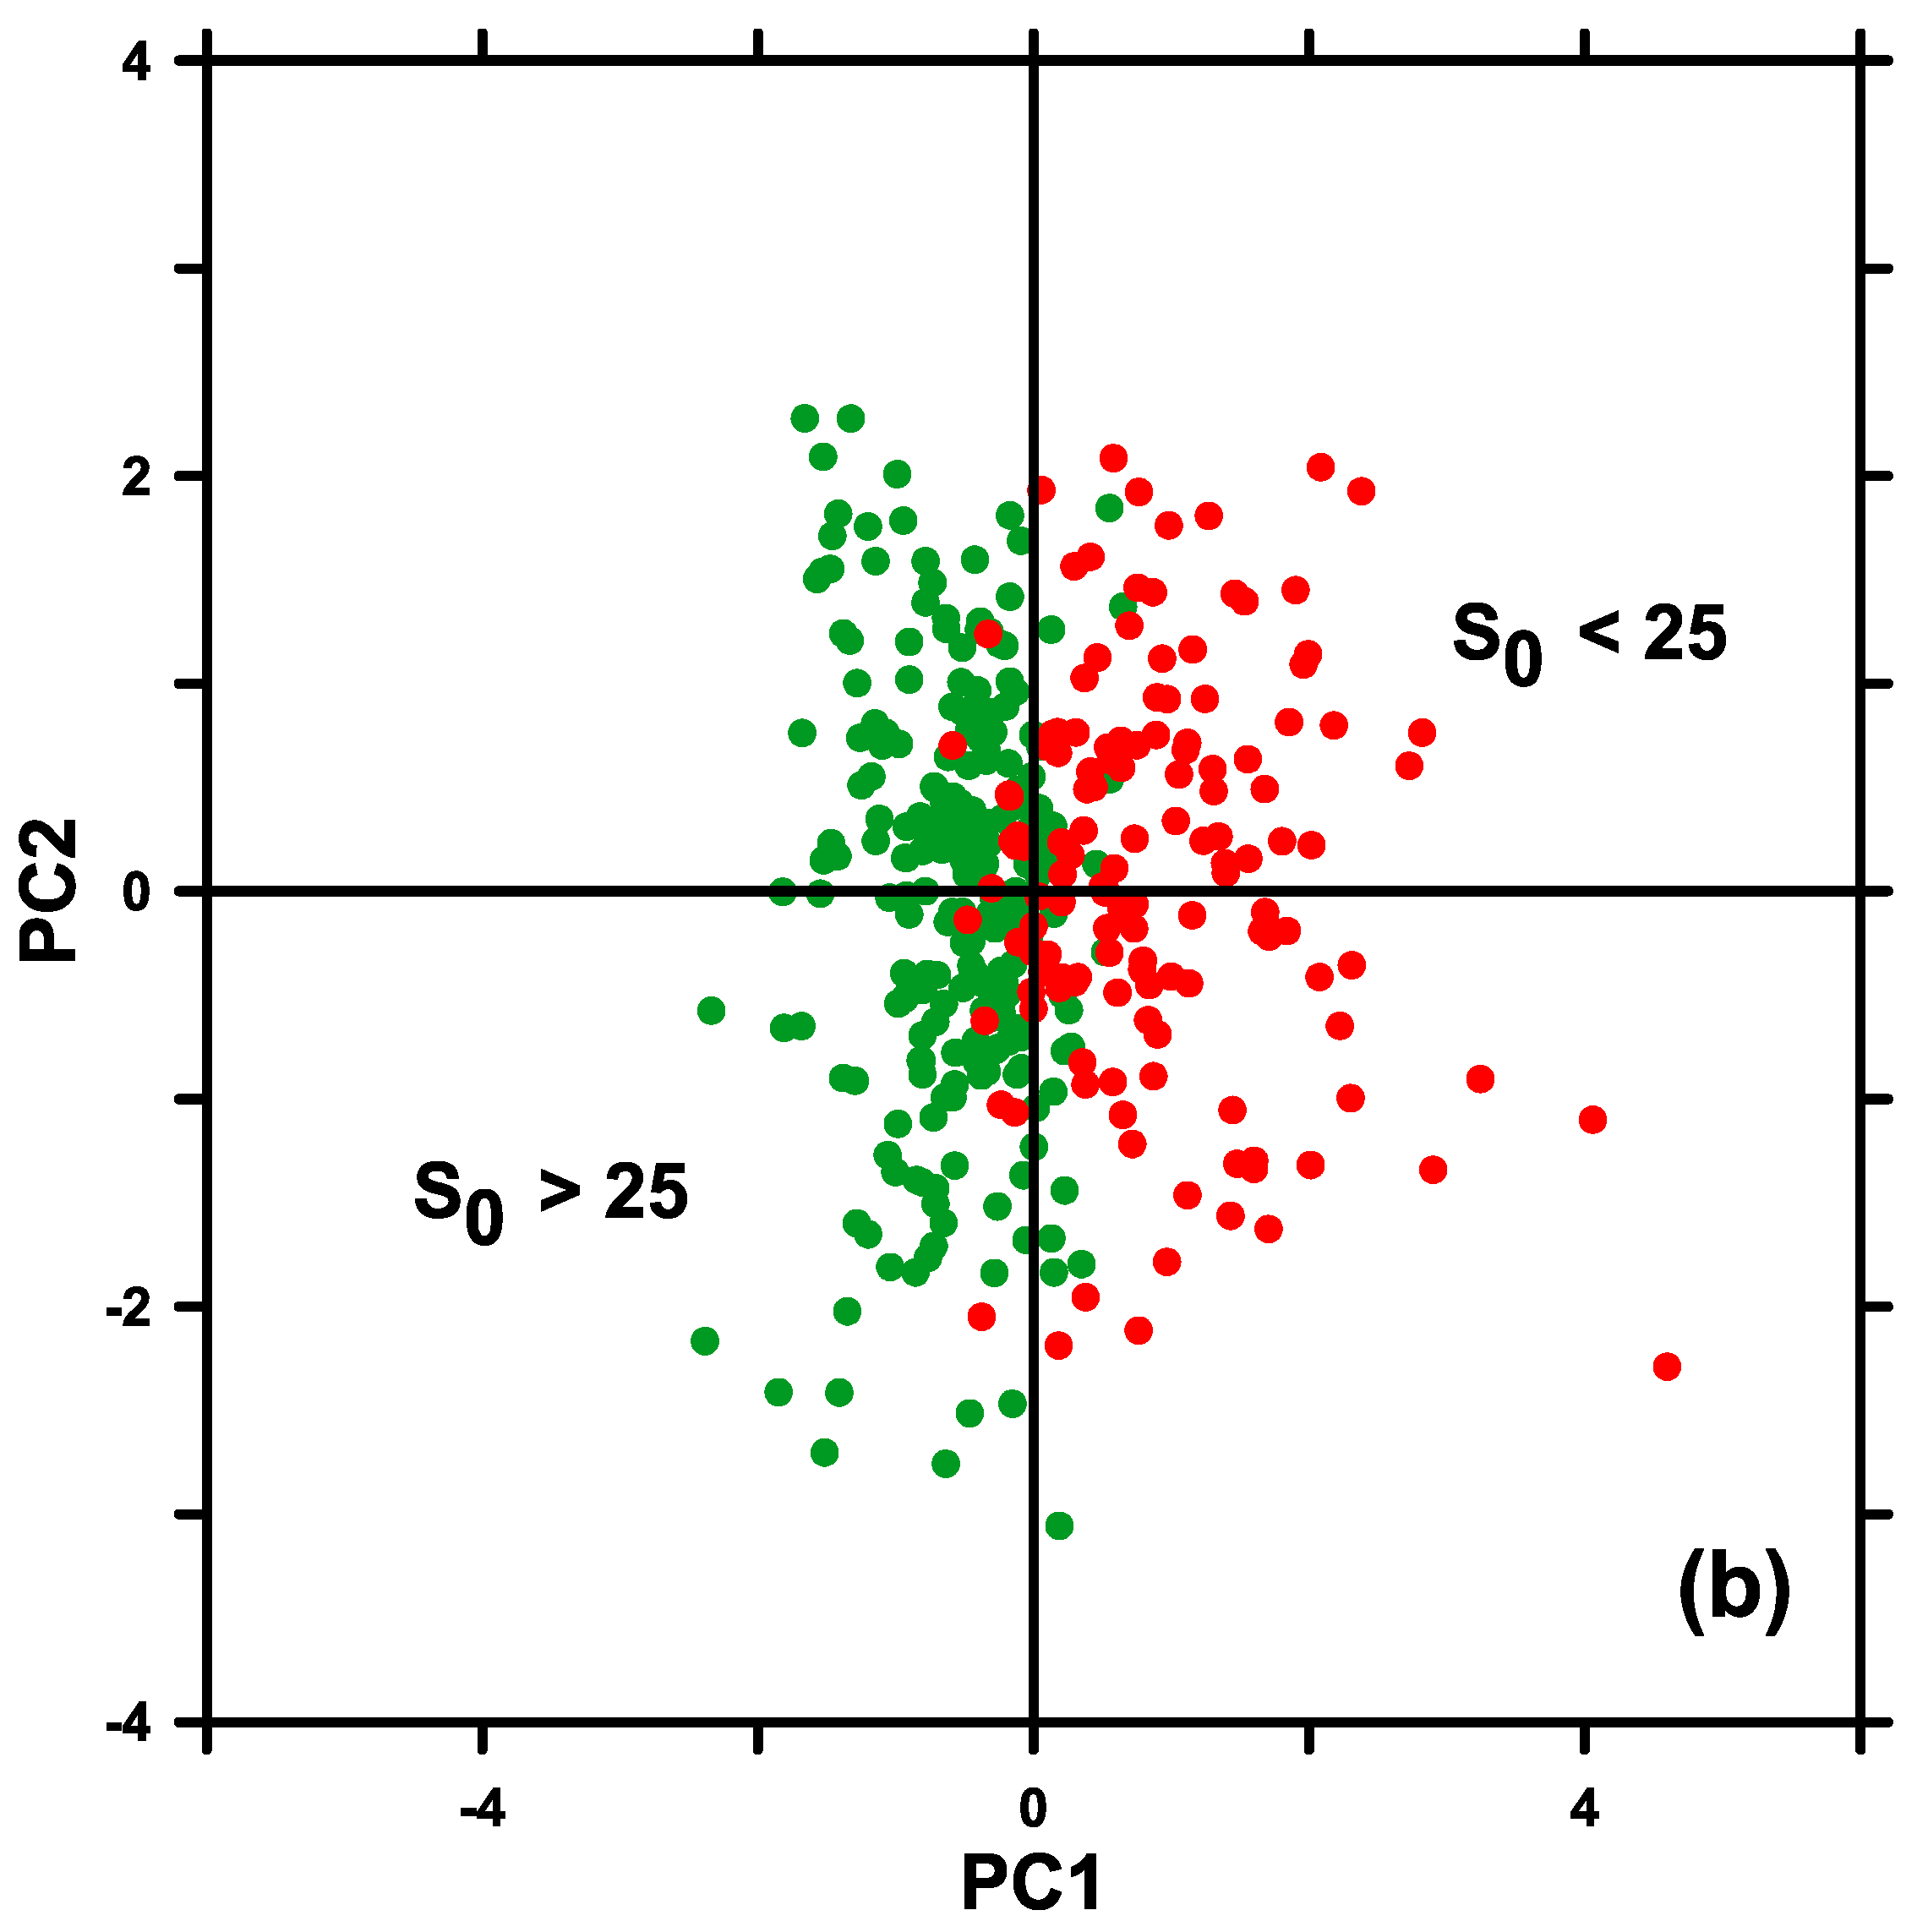
The contribution of PC1 and PC2 to the individual samples is shown on the factorial plane (Figure 4b). For visibility, all samples were divided according to the range in salinity. Figure 4b shows that the individual samples collected at different salinity were strongly divided. Samples at S0 < 25 and S0 > 25 were, respectively, positively and negatively influenced by PC1, while the influence of PC2 was rather equal. This finding suggests that there are no differences between the links of Pbopt with E0 across the salinity gradient.

3.3. Pbopt Model Developed with E0, Its Efficiency, and a Comparison with T-Based Models

It was mentioned above that a strong correlation was obtained between Pbopt and E0 (Table 4). There was no other abiotic parameter that was related to Pbopt so closely. Thus, it is reasonable to use E0 as the only abiotic factor in the Pbopt region-specific regression model (E0reg). To develop this model, we used two-thirds of the dataset as mentioned in [50]. The equation of liner regression relating log-transformed values of Pbopt and E0 is
log10 Pbopt = 0.537 log10 E0 − 0.399 (R = 0.62, N = 266)
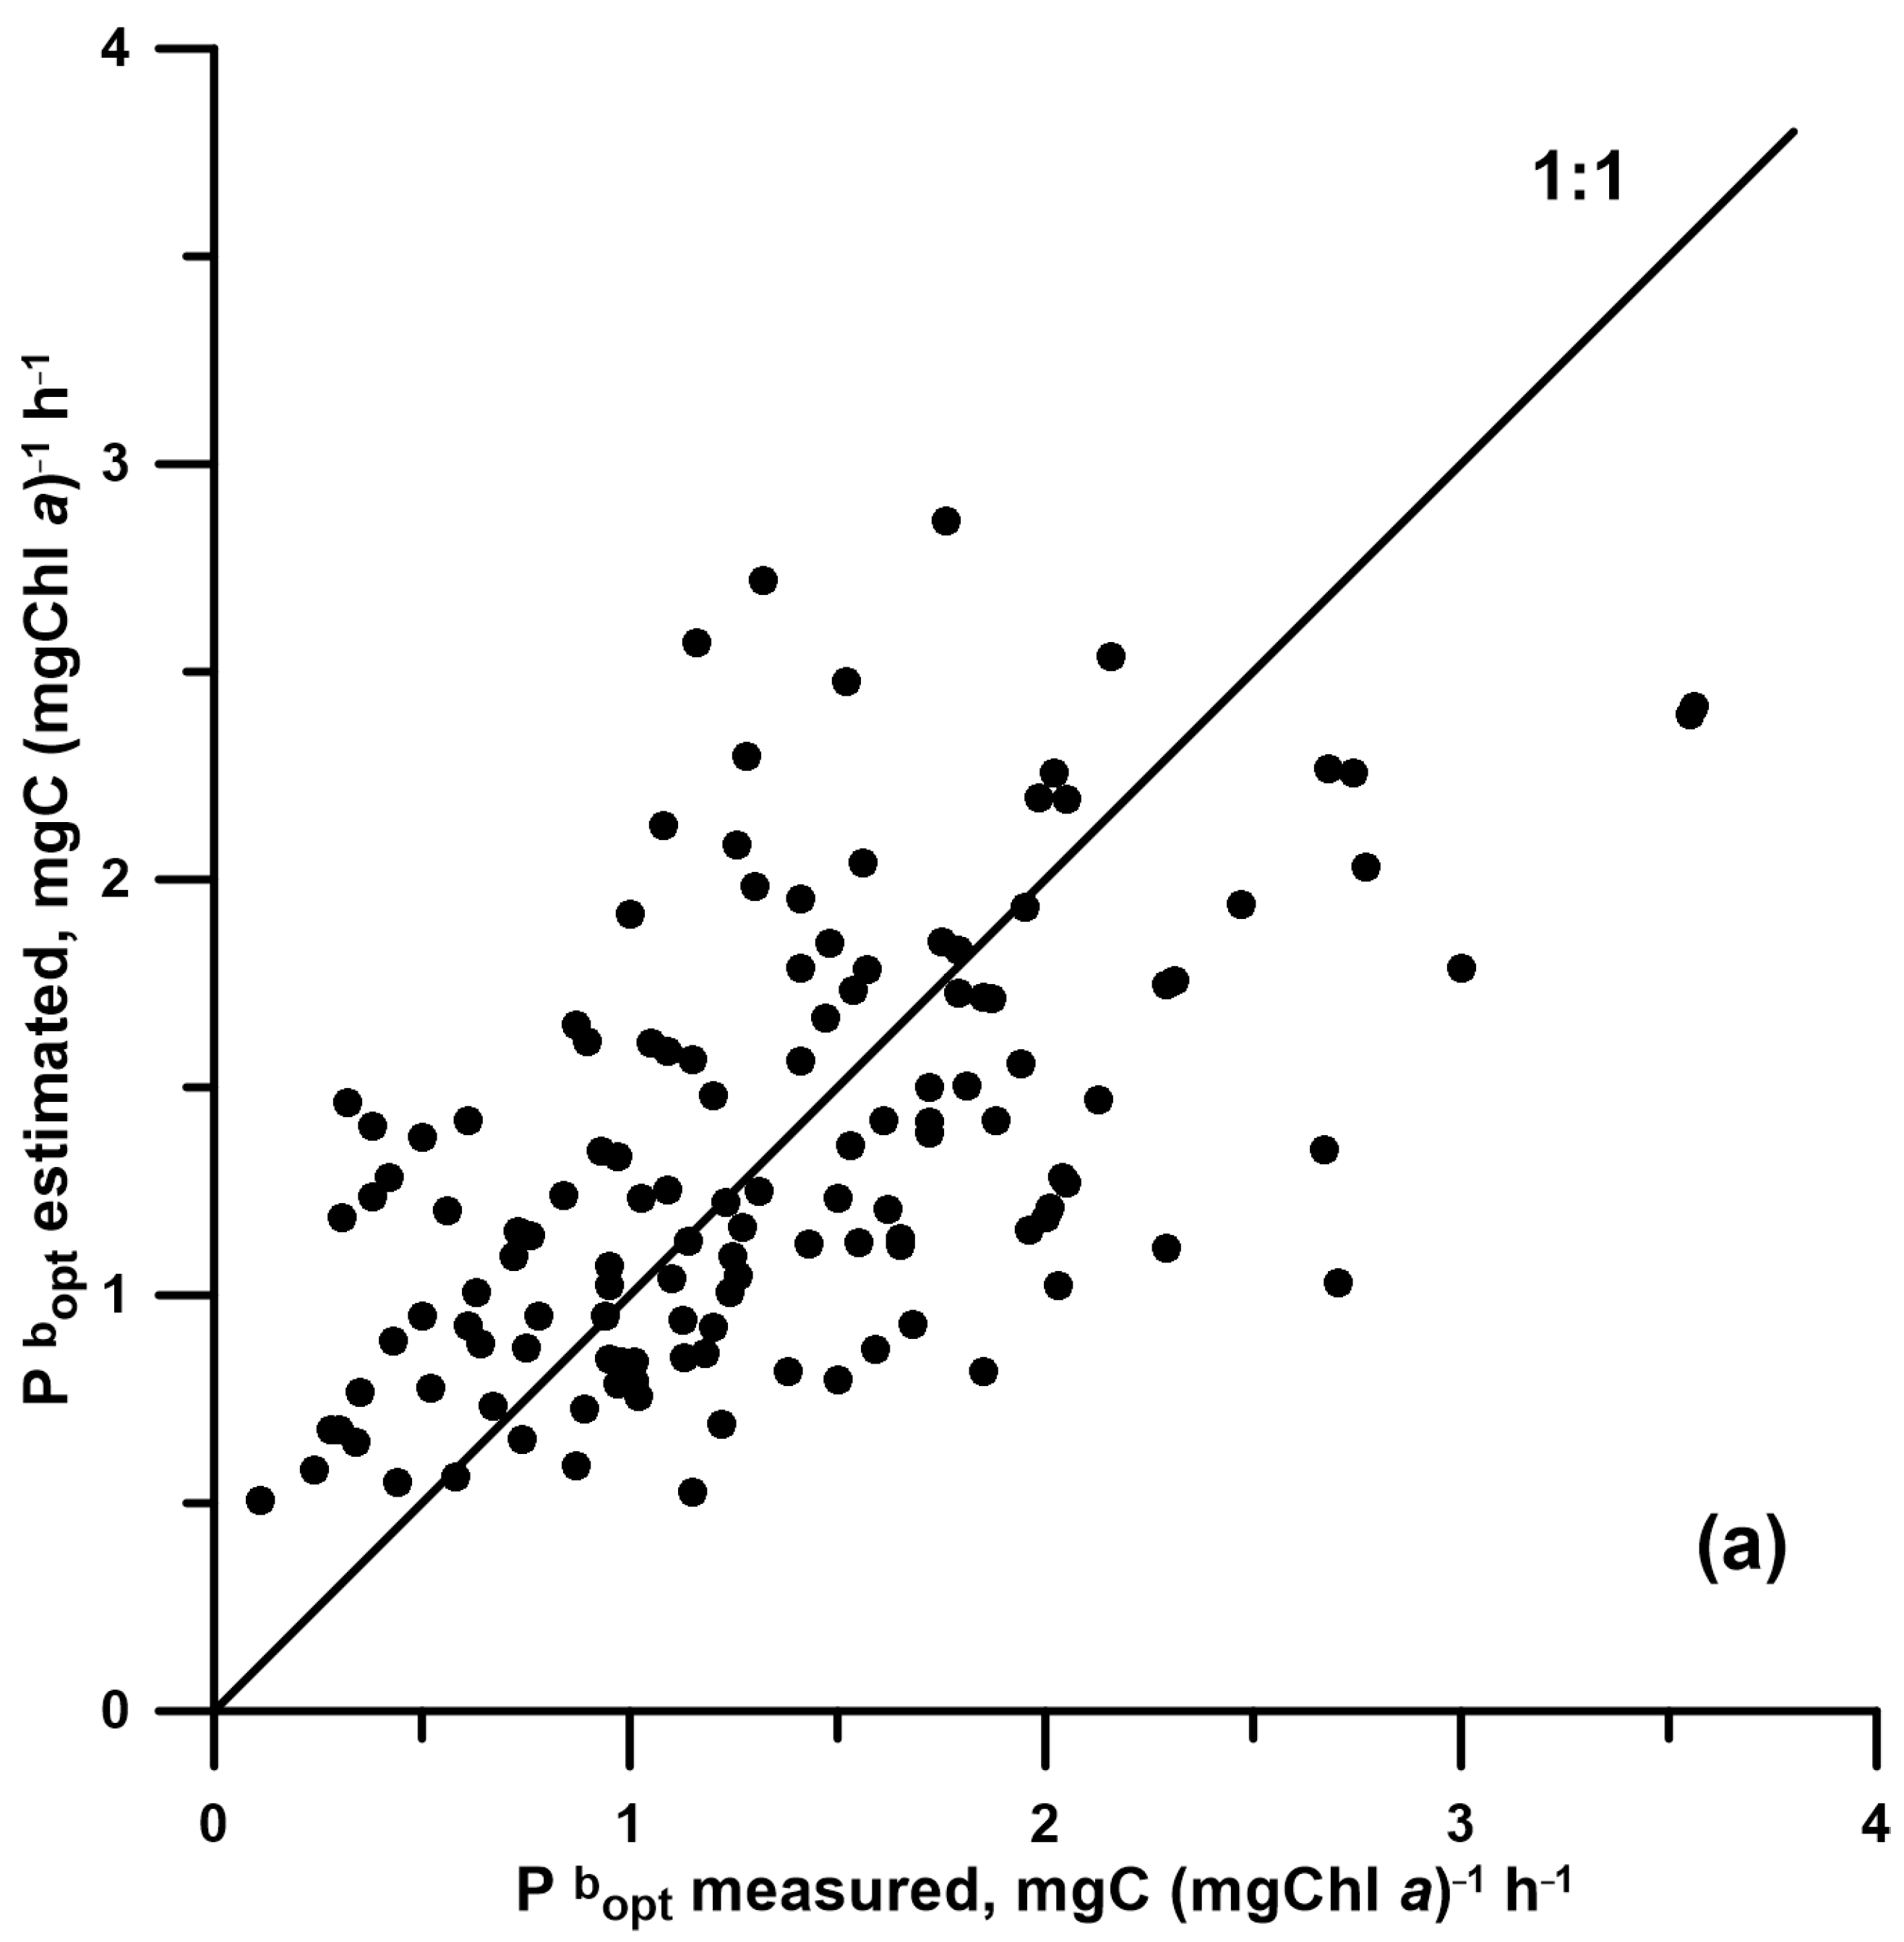
The results of E0reg verification using field observations are represented in Table 6 and Figure 5a. The comparison of the measured and modelled values of Pbopt suggests that E0reg overestimates the field data on average (the average absolute error (B) is equal to 0.040). The root-mean-square difference (RMSD) value implies that the calculated values of Pbopt were 1.7-fold higher than the field data on average.
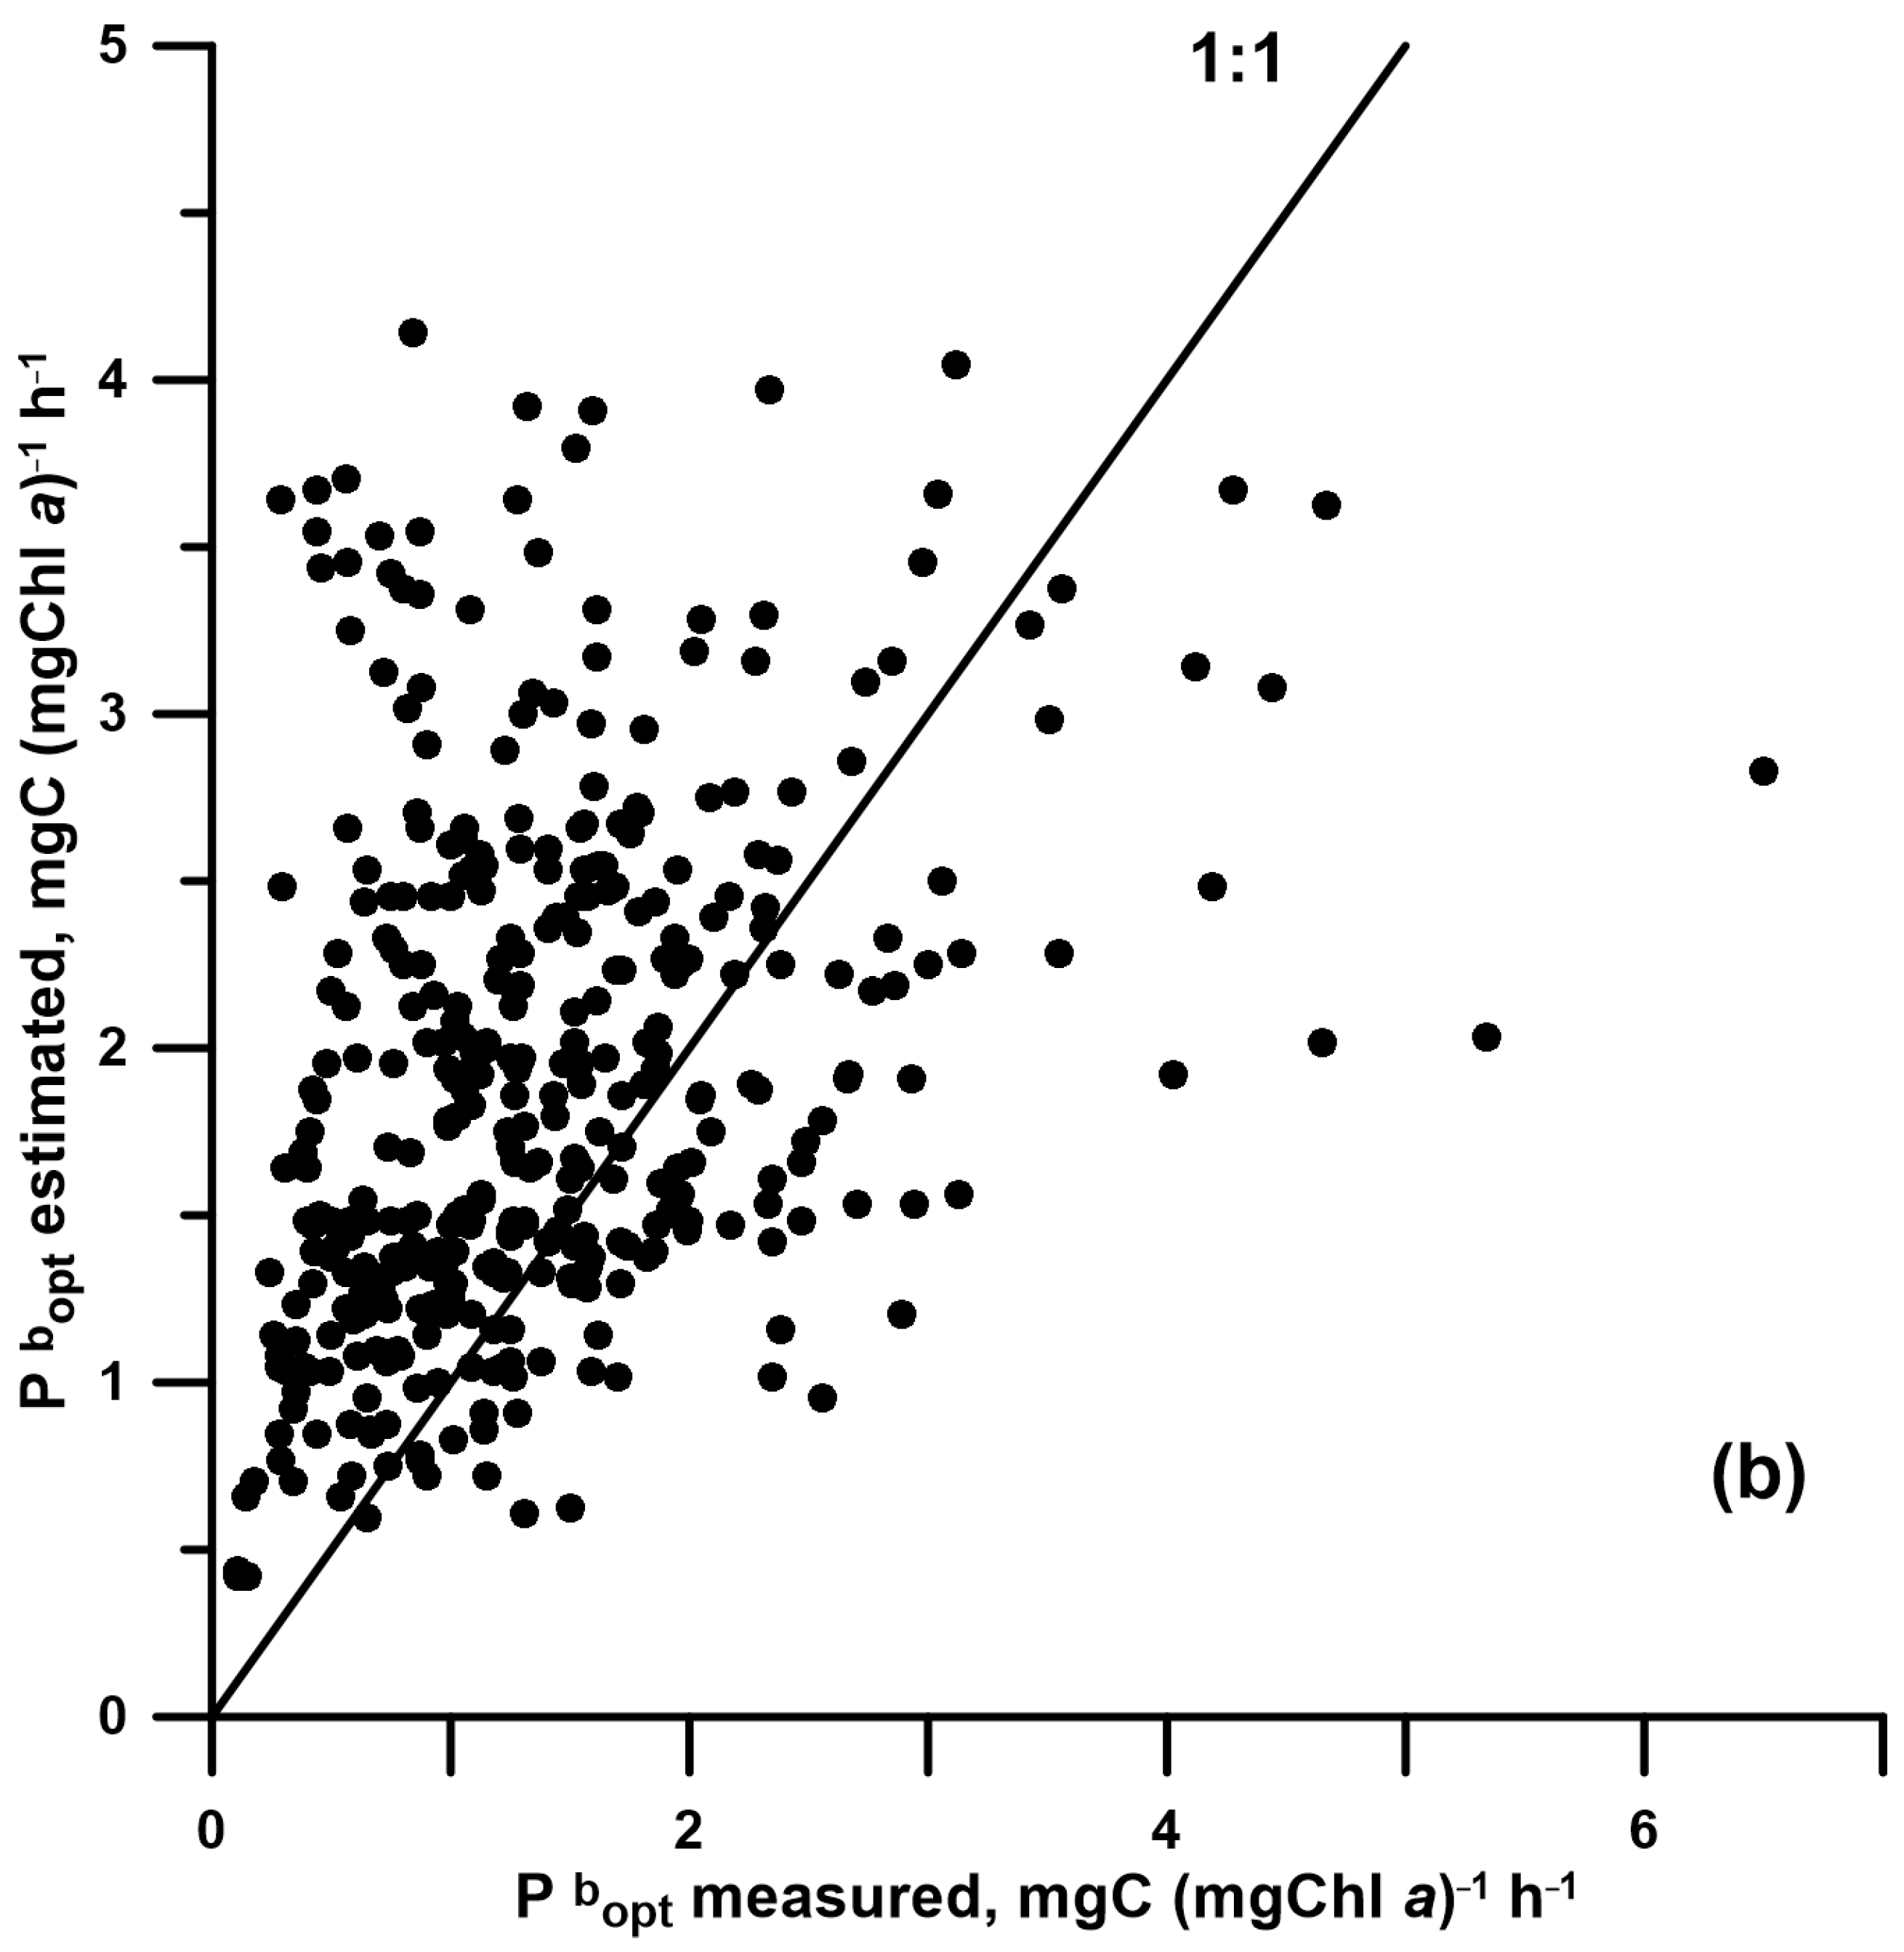
The application of the developed algorithm to study the spatiotemporal variations in Pbopt and for water column primary production (IPP) estimations assumes the introduction of satellite-derived PAR (Esat) into Equation (1). Therefore, it is appropriate to validate the E0reg model using satellite-derived data. The results represented in Table 6 and Figure 5b suggest that the application of Esat decreases the model performance by a factor of 1.4 according to the RMSD value. The correlation between the measured and modelled values of Pbopt decreased by a factor of 1.8 in comparison with the data of verification using field observations (R2 = 0.19 and 0.35, respectively) (Table 6). Furthermore, the introduction of Esat into Equation (1) enhanced B by a factor of 4.6.
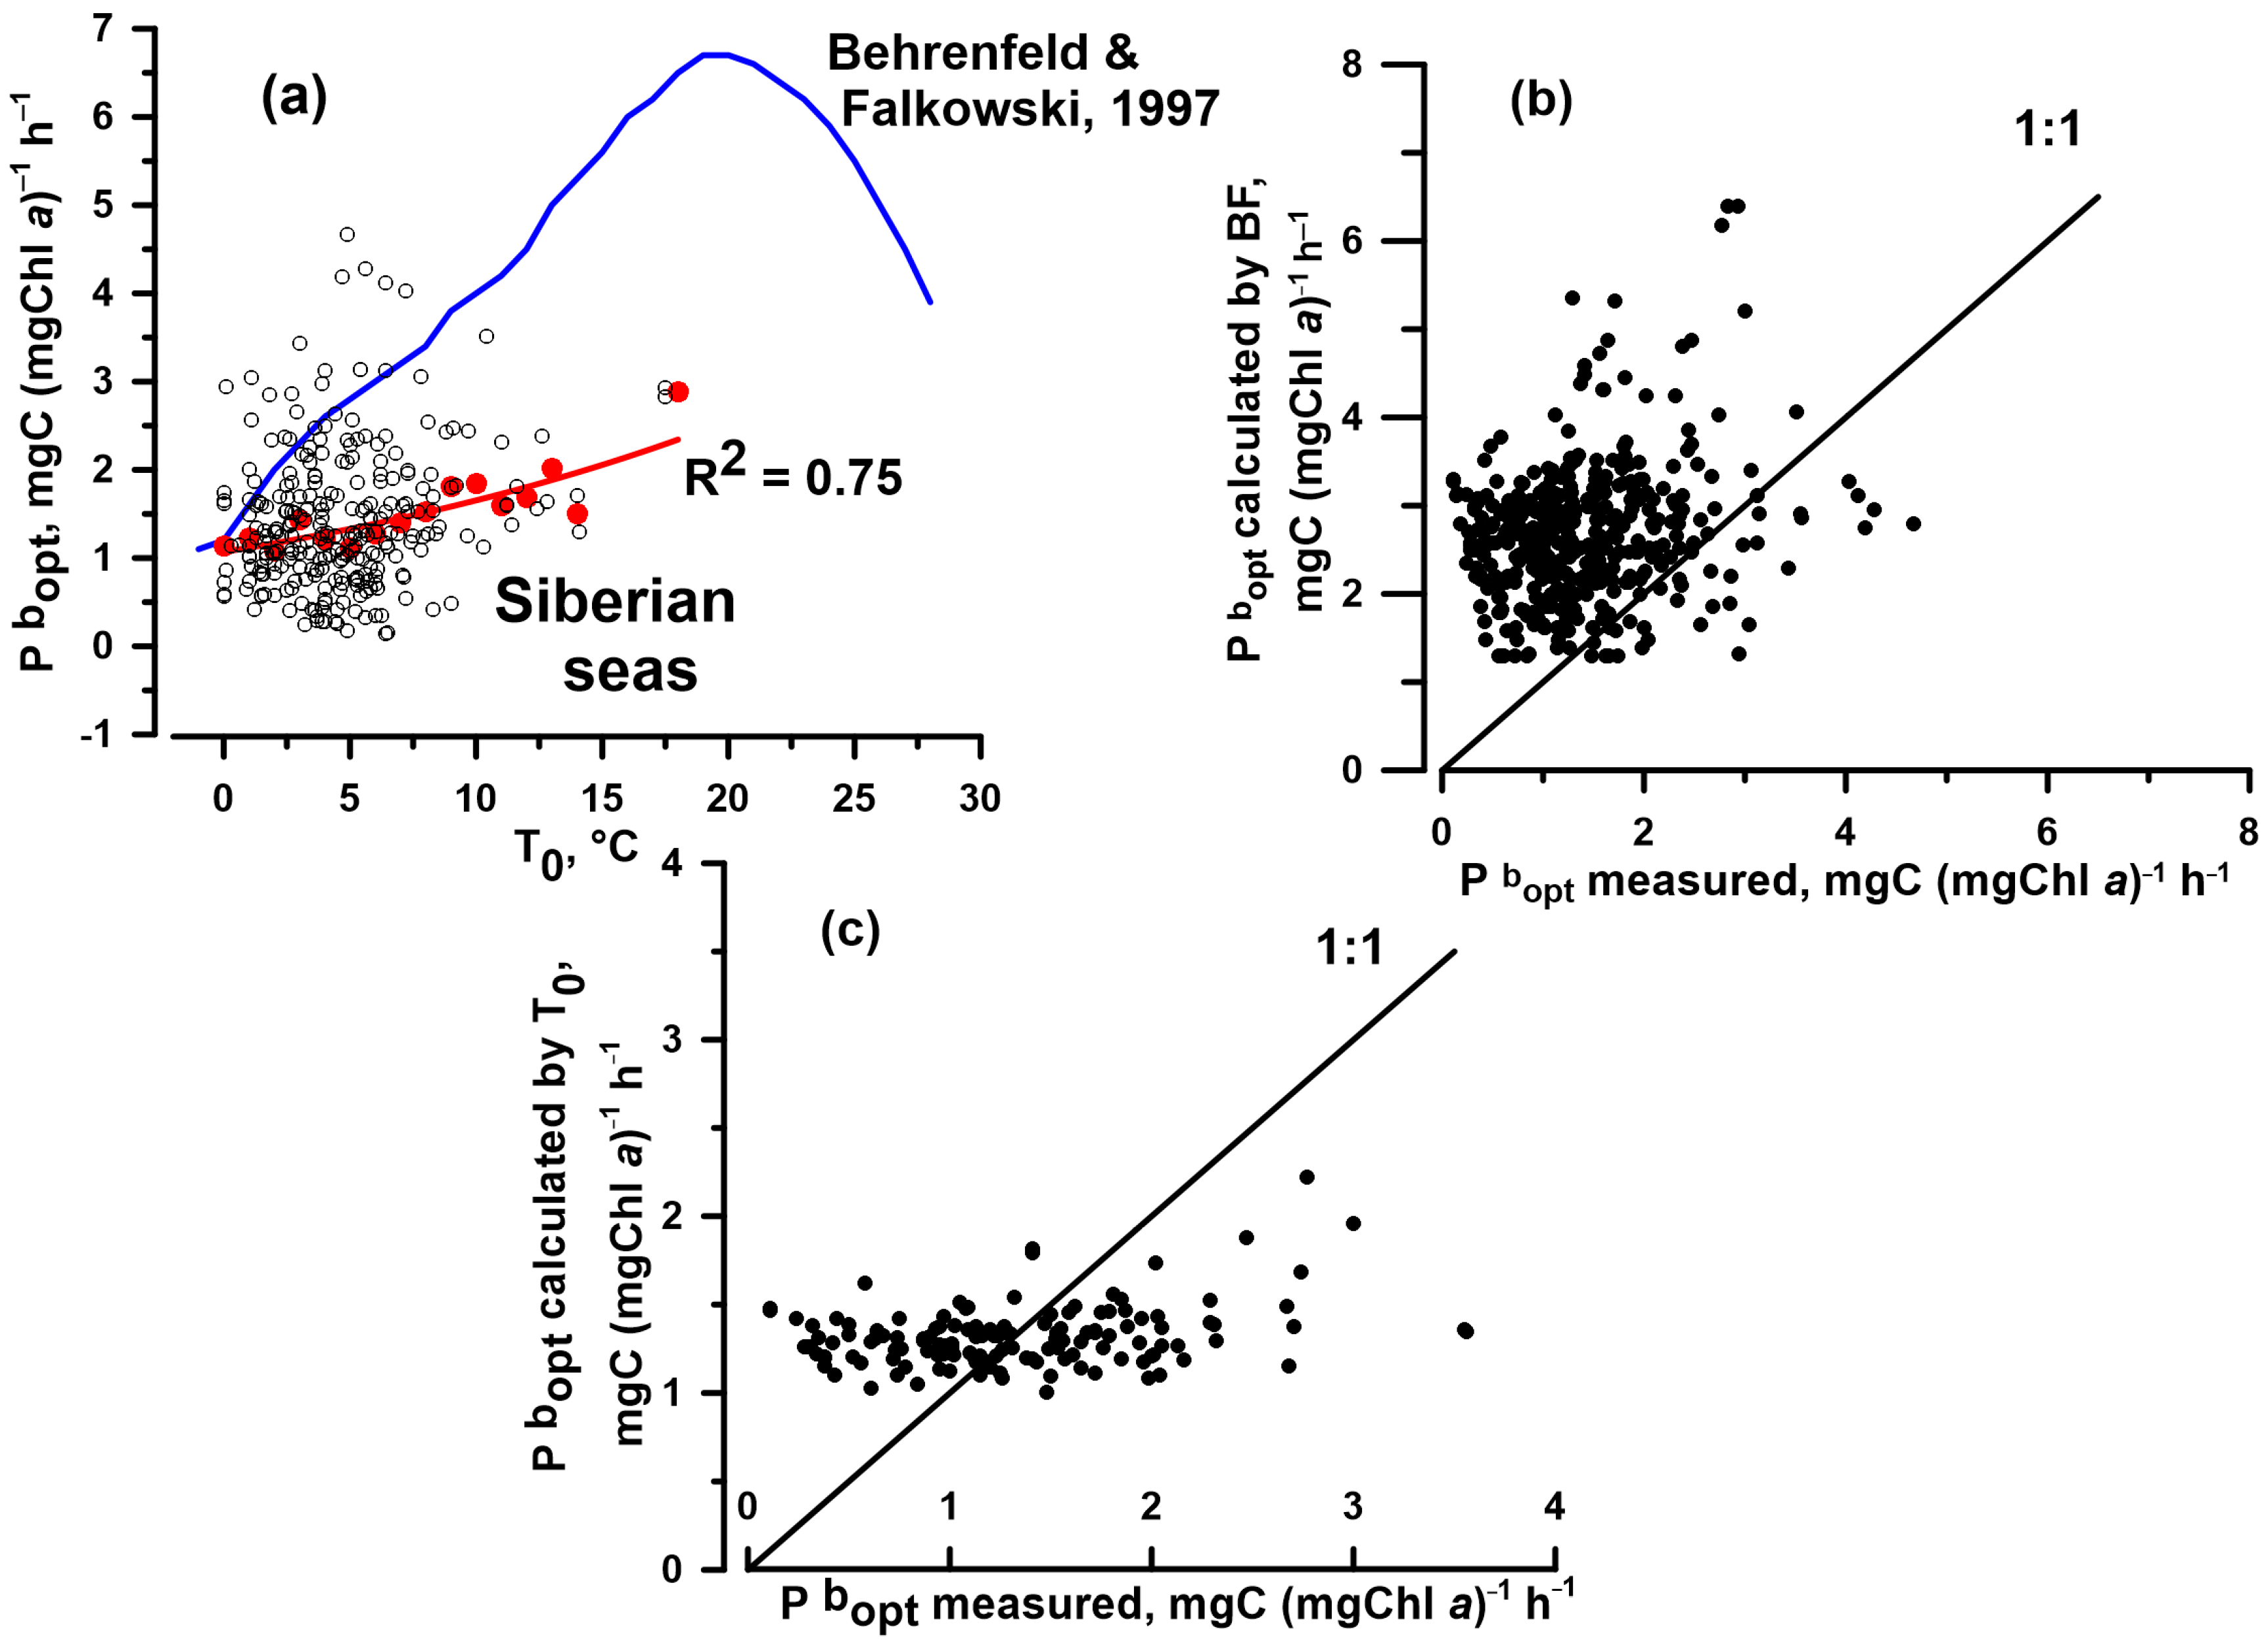
In the models used for IPP estimation using satellite-derived data, often Pbopt is retrieved with the polynomial function derived using the worldwide dataset (Equation (11) in [13], the BF model in further) or with the regional-adopted relationships between Pbopt and T0 [25,78,79]. In that regard, it is useful to compare the model performances of the BF model and E0reg for the estimation of their skill in the SSs. Figure 6a presents the distribution of the Pbopt dataset related to T0 and the curve of the polynomial function that links Pbopt and T0 from [13]. The result presented in Figure 6a implies that the BF model will dramatically overestimate Pbopt in the SSs. This conclusion is confirmed with the results of the verification of the BF model using the T0 dataset collected in the SSs (Table 6, Figure 6b). The value of B characterising the error in the BF model is equal to 0.343, which is 9.5-fold higher than that of E0reg. The coefficient of determination (R2) of the BF model is 17-fold lower than that of E0reg (0.35 and 0.02, respectively). The value of RMSD of the BF model is 1.9-fold higher than that of E0reg (Table 6). The index of efficiency of the BF model (RMSD = 0.444) suggests that Pbopt values calculated using this algorithm can over- or underestimate the measured ones by a factor of 2.8, which is 1.6-fold higher than in the case of E0reg application.
To illustrate the problems connected with the estimation of Pbopt in the SSs using T0 solely, the authors developed the region-specific empirical algorithm based on the relationship between Pbopt and T0 established using the SSs dataset (N = 266) (T_reg). In the development of this model, the authors followed the approach described in [13]. The median values of Pbopt were calculated for each 1 °C temperature span in the range from 0 to 18 °C. The relationship between the median values of Pbopt and T0 was described using the exponential function (Figure 6a):
Pbopt = 1.07 e 0.044 T0.
This model was validated with the independent dataset (data that were not used for model development). The results of this verification are presented in Table 6 and Figure 6c. As in the case of applying the BF model, weak links between the measured and modelled values of Pbopt (R2 = 0.03) were observed. The value of RMSD that was equal to 0.279 suggests that the modelled values of Pbopt can 1.9-fold over- or underestimate the measured ones. The average absolute error of T_reg was equal to 0.066, which was 1.8-fold higher than in the case of E0reg application. Thus, it can be concluded that the T_reg algorithm is not applicable for Pbopt estimation in the SSs.

3.4. The Spatial Distribution in Pbopt Assessed Using Satellite-Derived Data

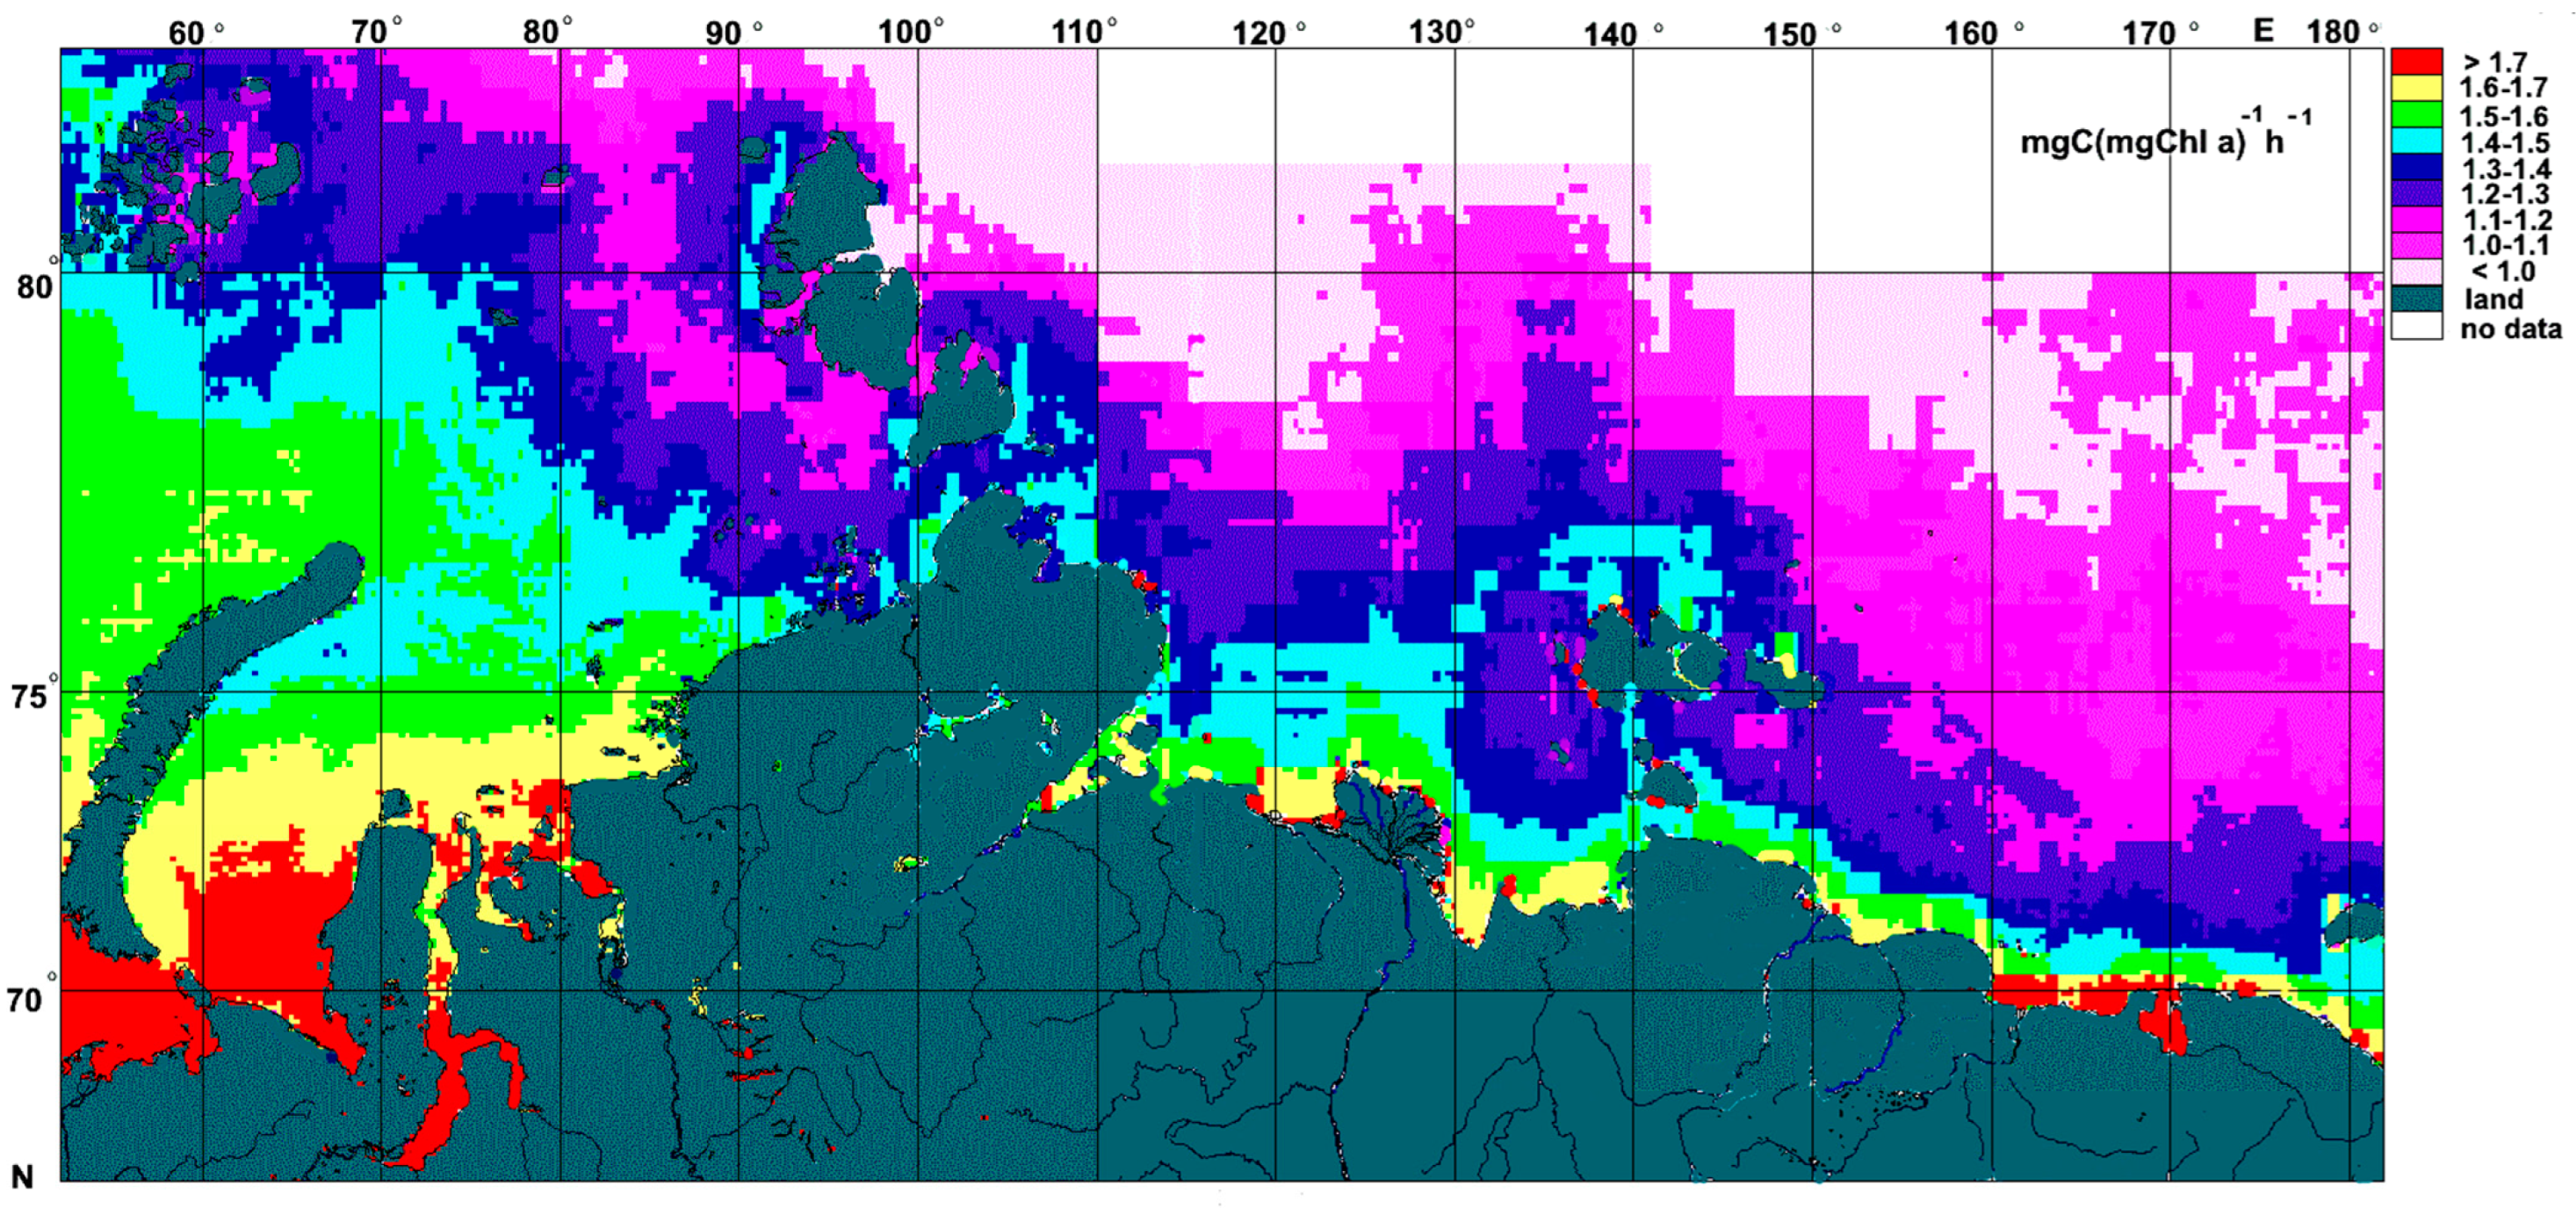
The introduction of Esat data into Equation (1) allows retrieving the pattern of the spatial distribution in Pbopt over the entire area of the SSs. In Figure 7, satellite climatologies (2007–2020) of Pbopt from July to October are presented. It should be noted that for averaging, the years were chosen that coincided with the field observations (Table 1). As expected, the spatial distribution of Pbopt was quasi-latitudinal and follows by the spatial distribution in PAR. The values of Pbopt basically decreased northward (Figure 7).

4. Discussion

4.1. The Average Values and Spatiotemporal Variations in the Optimal Assimilation Number (Pbopt) in the Siberian Seas (SSs)

The average value of Pbopt in the SSs (1.38 mgC (mg Chl a–1 h–1) was in the range of variability observed in the north of Baffin Bay (0.3–4.1 mgC (mg Chl a–1 h–1) [80]. In addition, it was close to the values measured in the Chukchi and Beaufort Seas (from 0.6 to 1 mgC (mg Chl a–1 h–1, on average) [81], and it was higher than historical (1956, 1961–1963) values observed in the Canadian Arctic (0.2–0.4 mgC (mg Chl a–1 h–1) [82]. It is known that an accurate as possible calculation of the average value of Pbopt within a particular biogeochemical province [48] is critically important for the estimation of water column primary production (IPP) [21].
The average values of Pbopt for small (<3 μm) phytoplankton were higher than those for large (>3 μm) phytoplankton in the entire SS (Table 2). This finding is consistent with the investigations that established that the chlorophyll-specific carbon fixation rate declined with a decrease in cell sizes [83,84,85,86,87]. Theoretically, the specific photosynthetic rate of small phytoplankton must be higher than that of the large fraction because of the high size-to-volume ratio that allow it to be more effective at absorbing light and nutrients. As a result, small cells have advantages in conditions of low nutrients and irradiance [34,88,89]. This assumption is confirmed with the analysis of extensive field and laboratory data [90].
The river runoff on the Siberian shelf controversially influences primary production (PP) characteristics. On the one hand, a large amount of dissolved (DOM) and particulate (POM) organic matter of river genesis limits the photosynthetic rate in the water column by decreasing water transparency and euphotic depth as a consequence [47]. On the other hand, large rivers enrich the coastal areas of the SSs with nutrients [37,38], increasing the photosynthetic capacity of phytoplankton. Thus, it can be assumed the differences in the values of Pbopt between the river runoff regions and those where the influence of rivers is insignificant. Nevertheless, there were no statistically significant differences between the average values of Pbopt in brackish, with surface salinity (S0) < 25, and oceanic waters (S0 > 25). Thus, it can be concluded that Pbopt in the SSs is influenced by river runoff to a small extent.
To evaluate the relationships between Pbopt and environmental factors in waters with different salinity, the dataset was differentiated according to the S0 values (Table 7). The results of the correlation analysis suggest that the links between Pbopt and E0 were not significantly different in brackish and oceanic waters (R = 0.59 and 0.63, respectively). Thus, these findings suggest that the developed Pbopt algorithm can be used as universal both in the river runoff regions of the SSs and in the areas out of such influence.
A decrease in Pbopt from July to October is explained by a decline in the values of the main environmental factors, generally subsurface photosynthetically available radiation (PAR) (Figure 2). Similarly, the tendency toward a decrease in Pbopt at the end of the growing season was noted in other regions of the Arctic Ocean [80].

4.2. Influence of Environmental Factors on Pbopt

In theory, the relationships between Pbopt, as well as the maximal assimilation number (Pbmax), and the main environmental factors must be the same. Therefore, in this section, it is meaningful to discuss the relationships between environmental factors and both Pbopt and Pbmax due to the most representation of the latter.

4.2.1. Influence of PAR on Pbopt

The results obtained in this study allow us to characterise the SSs phytoplankton, on the one hand, as highly photoadaptive and, on the other hand, as light-limited. The strong correlation between Pbopt and PAR is evidence that day-to-day variations in incident radiation have a fast influence on changes in carbon fixation rate. Thus, the SS phytoplankton is capable of fast photoadaptation. In earlier studies, it was shown that in the Arctic Ocean, the assimilation number (Pb) linearly and positively depended on PAR [47,53,91,92]. The absence of a “plateau” on the curves of the relationships between Pb and PAR implies that arctic phytoplankton is light-limited. For that reason, the values of Pbopt are usually registered under saturated irradiance.
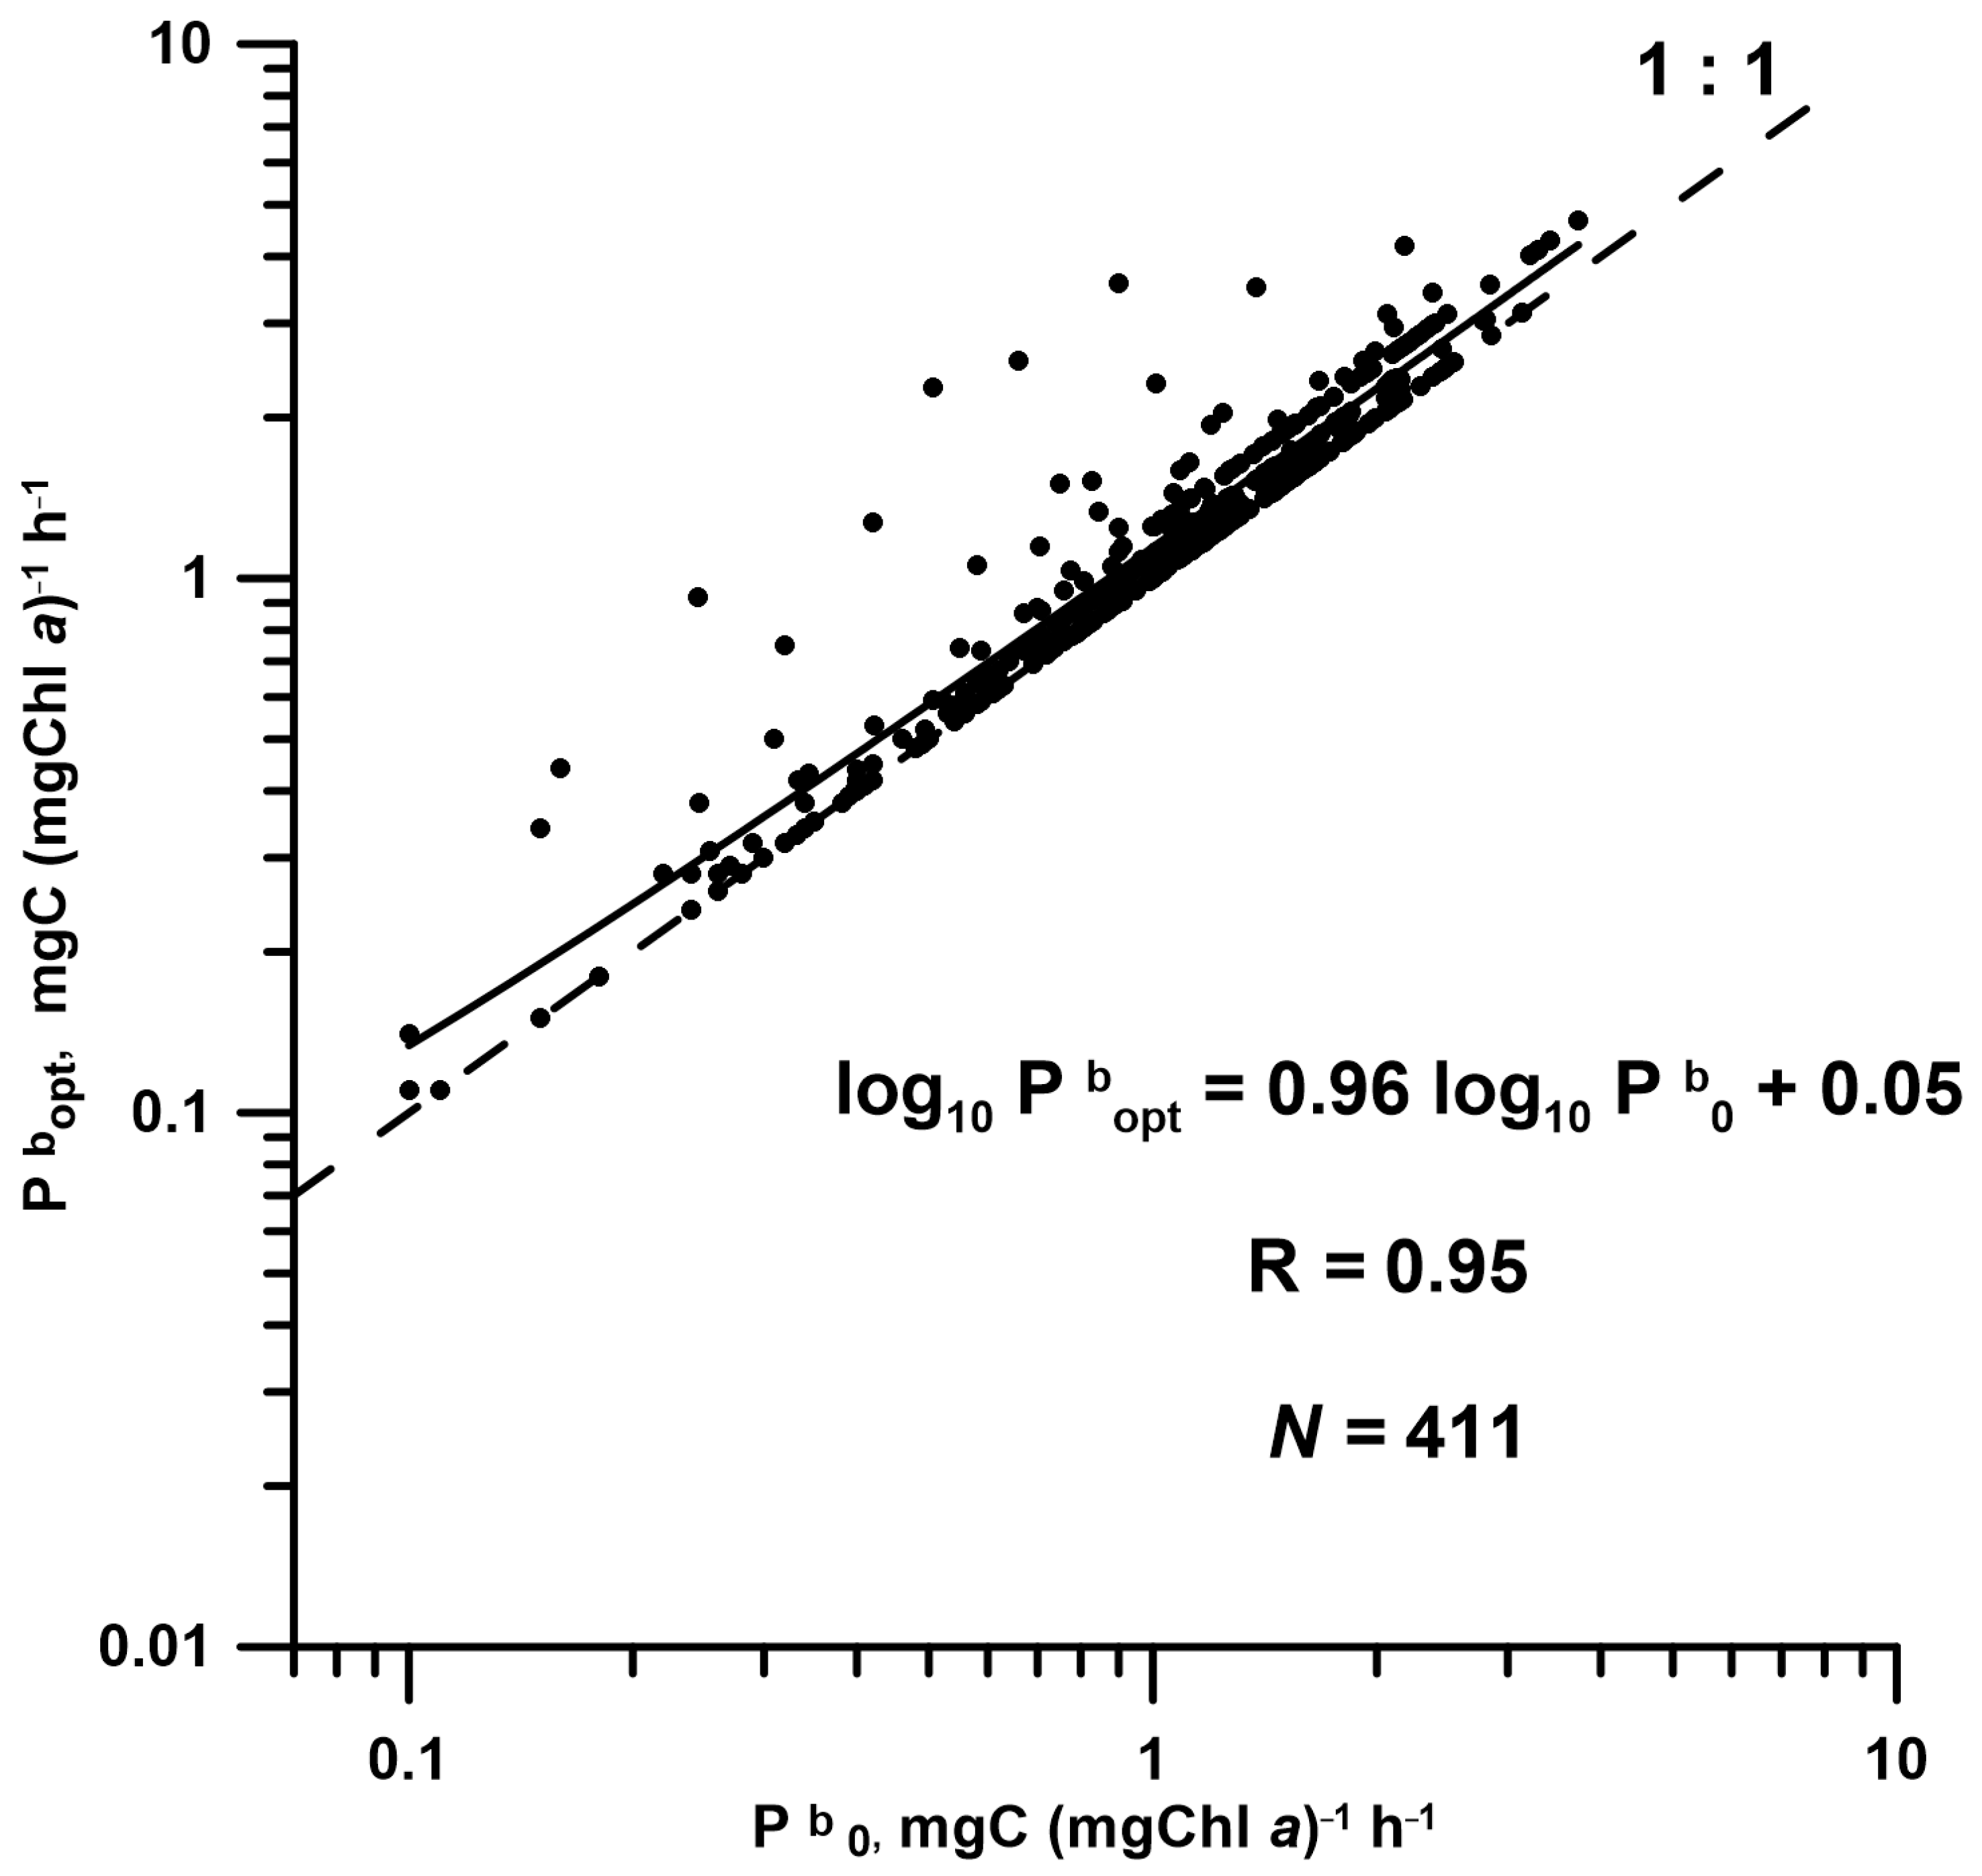
Often, the values of Pbopt are observed within the upper mixed layer (UML). Therefore, some authors considered the links of Pbopt with the average values of PAR in the UML (EUML) [50]. The findings of the present study suggest that in the SSs, Pbopt was better correlated with subsurface PAR (E0) (R = 0.61, p < 0.01, N = 397) than with EUML (R = 0.54, p < 0.01, N = 397). This result can be explained by the fact that in 97% of cases, the highest values of Pbopt were observed in the subsurface layer of 0–2 m (Pb0), and a strong positive correlation was established between the log-transformed values of Pbopt and Pb0 (Figure 8). Observation of Pbopt predominantly in the subsurface layer suggests a more pronounced light limitation of the photosynthetic rate in the SSs in comparison with other regions of the Arctic Ocean where Pbopt can be registered at the depths of the deep maxima of chlorophyll and PP [81]. This phenomenon is linked with the optically complex type of waters in the SSs [93] enriched by DOM and POM of river genesis [37,94,95,96].

4.2.2. Influence of Temperature and Nutrients on Pbopt

Generally, a weak correlation has been noted in the Arctic Ocean between Pb and temperature [97,98,99,100]. Furthermore, it was established by [101] that the photosynthetic parameters in the Arctic Ocean were not influenced by temperature over the range from −2 to 8 °C. In the dataset used in the presented study, 90% of the values of T0 fit in this diapason (Table S1). Thus, our findings are consistent with the outcomes of the previous studies.
The absence of a close relationship between Pbopt and T0 was explained simultaneously by a negative correlation between T0 and nutrients and a positive correlation between T0 and E0 [83,102]. In accordance with those findings, the authors registered in the SSs significant, but weak, relationships between T0 and the concentration of dissolved inorganic nitrogen (DIN) and between T0 and E0 (Table 5). This result can be explained by a mismatch of seasonal maxima in T0, DIN, and E0 in the SSs. High values of T0 and E0 are observed in July and August when nutrients are exhausted [103].
The role of nutrients in PP in the Arctic Ocean is well known [51,52,104]. On the other hand, it is difficult to establish close links between PP characteristics and nutrient concentration [32,47,98,105]. There are many reasons for that. A low nutrient concentration very often is not evidence of a low increment in phytoplankton biomass due to grazing by zooplankton, as well as cell death and sedimentation [106]. Moreover, the enrichment in UML by nutrients during the winter convection usually does not coincide with the high values of Pb registered during the phytoplankton bloom in spring. Furthermore, in conditions of high nutrients, the photosynthetic rate can decrease because of energetic competition between the DIN assimilation process and the Calvin cycle [107]. On the other hand, during the limitation of nutrients, phytoplankton can use dissolved organic nitrogen for growth and photosynthesis [108,109] and keep a relatively high photosynthetic rate.
All the reasons listed above can lead to unpredictable, positive or negative, relationships between productivity parameters and nutrients. In the present study, a statistically significant but weak correlation was found only between Pbopt and DIN (Table 4). The negative relationship between Pbopt and DIN is determined by the spatial distribution in surface nutrients in the SSs. Thus, the main source of nutrients in the inner shelf of the SSs is the river discharge [37,38]. In these areas, an increase in nutrient concentration is accompanied by a high Chl a content. In turn, the negative correlation between Pbopt and Chl a (R = –0.21, p < 10–3, N = 411) (Table 4) to a high extent determines the opposite link between Pbopt and DIN.

4.2.3. Modelling of Pbopt and Its Application for Remote Sensing

The results of the correlation analysis and PCA suggest that light is the main environmental factor that constrains the assimilation activity of phytoplankton in the SSs (Figure 4, Table 4). The variability in E0 explained 37% of Pbopt variations (R2 = 0.37). Therefore, it can be assumed that E0 can be used as a single input variable to the empirical model of Pbopt.
A weak correlation between Pbopt and T0 does not allow for using the latter parameter as a predictor of the assimilation activity of phytoplankton in the SSs. In the present article, it was revealed that the application of the dependence between Pbopt and T0 for the World Ocean [13] led to a significant error in the calculations of Pbopt in the SSs (Table 6). Using the region-specific relationship between Pbopt and T0 did not improve the predictive capacity of the temperature-based model. Thus, according to the authors’ dataset, the empirical formula (1) is the best approximation of Pbopt, and it can be used for the calculation of this parameter using satellite-derived E0 (Esat).
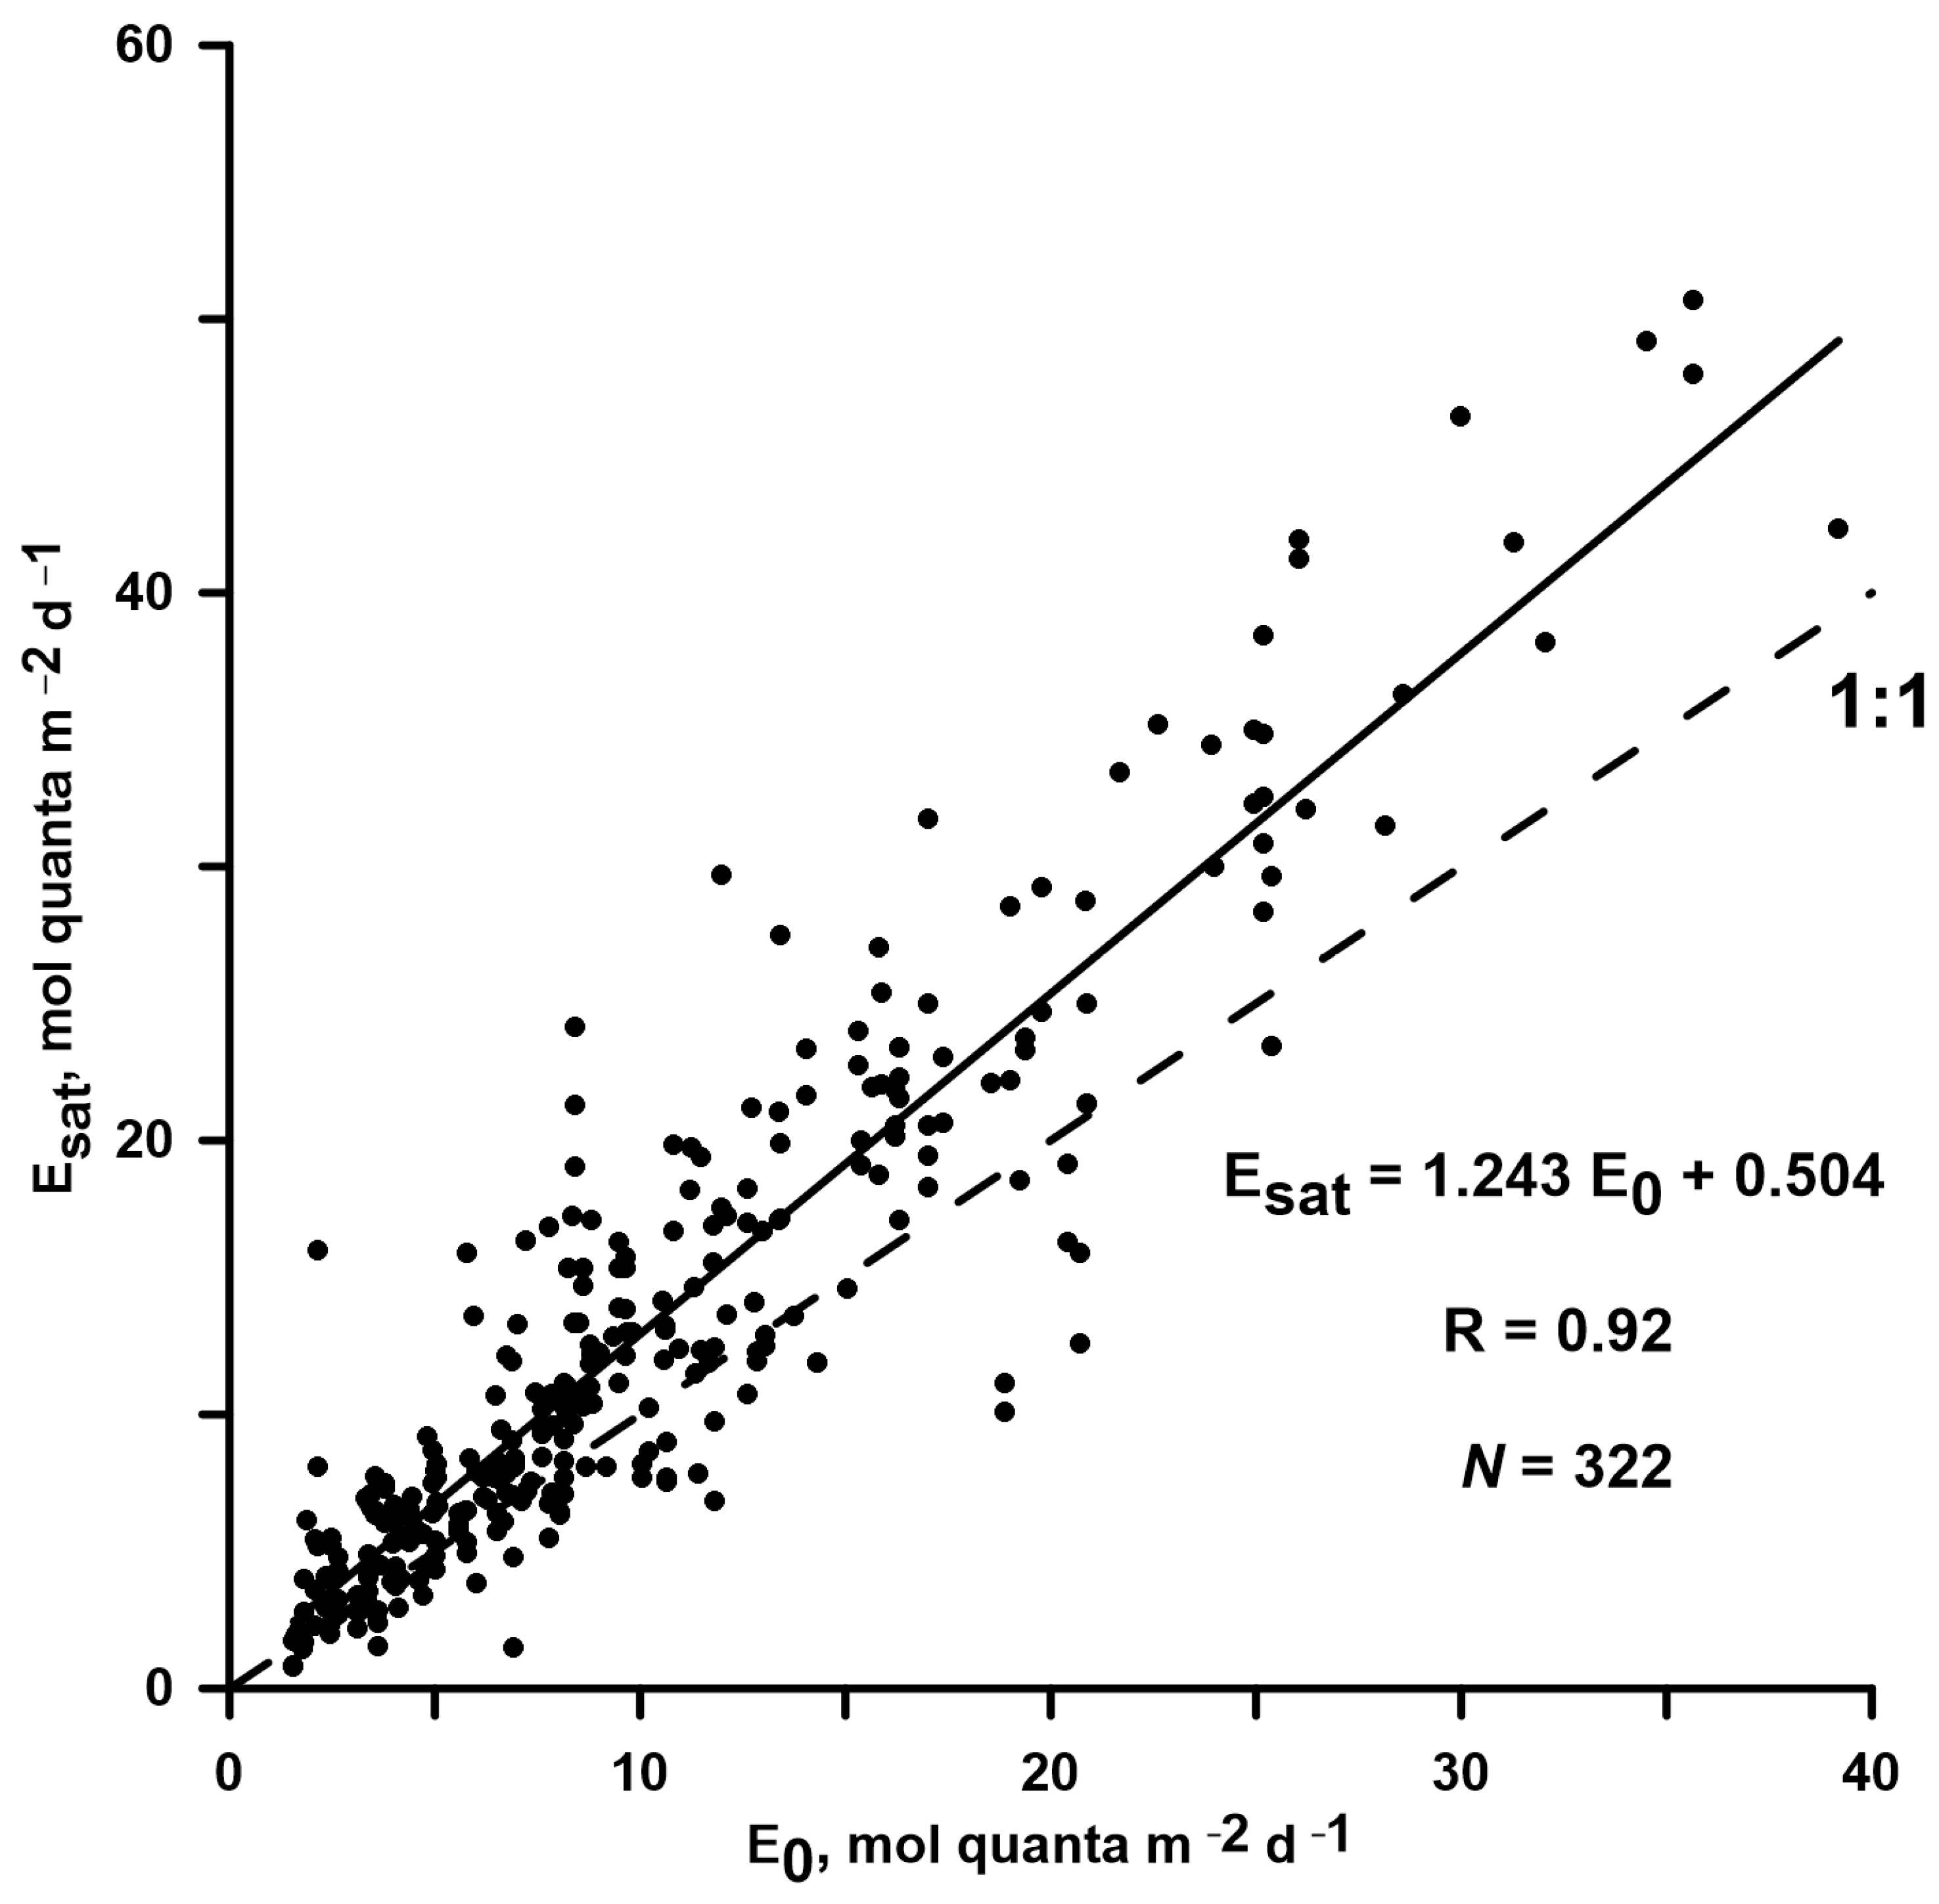
As was mentioned above, using Esat as an input variable decreased the efficiency of the developed model (1). This result was connected with the errors in Esat determination [77,110]. To estimate this error, a comparison of the field data of E0 with matched-up in space and time values of Esat obtained by a MODIS-Aqua scanner was carried out. The results of this comparison suggest that the values of Esat overestimate the field observations (Figure 9). As a consequence, the calculations of Pbopt using Esat also were overestimated in comparison with the field data as evidenced by the positive bias of linear regression (Table 6).
Another approach to the estimation of Pbopt is the application of T0 and Chl0, also registered using a satellite scanner, as additional input variables in the model [50]. To verify whether model predictive capacity improves after using T0 and Chl0 together with E0, the equation of multiple regression linking the log-transformed values of these variables with Pbopt was obtained as:
log10 Pbopt = 0.512 log10 E0 + 0.015 log10 T0 − 0.070 log10 Chl0 − 0.408 (R = 0.64, N = 266).
The verification of the developed model (3) suggests that the input of T0 and Chl0 to the calculations does not improve the model skill in comparison with E0reg (Table 6). The main parameters of model efficiency were as follows: R2 = 0.34, RMSD = 0.228. Thus, according to the authors’ findings, it is sufficient to use only E0 in the Pbopt model as the most relevant abiotic parameter.
The tendency of the latitudinal distribution in Pbopt in the SSs obtained using the Equation (1) with Esat as an input variable (Figure 7) was consistent with the global distribution in Pbm according to [50]. In that study, where the spatial distribution in the assimilation number was assessed using PAR, temperature, and chlorophyll a concentration, the values of Pbm also decreased poleward (Figure 8 in [50]).

5. Conclusions

One objective of the present study was to develop a simple algorithm for Pbopt estimation that would be useful to evaluate in future IPP in the Siberian Seas (SSs) using chlorophyll-based models and satellite observations. For this purpose, it was needed to choose an environmental parameter that would be most closely linked with Pbopt and easily detected from space. The analysis of the dataset used in this article suggests that incident PAR is the required variable because its role in the variability in Pbopt is dominant.
In the present article, it is shown that the commonly used algorithm for the calculation of the optimal assimilation number (Pbopt) based on sea surface temperature (T0) registered using a satellite is badly applicable for phytoplankton of high latitudes, in particular, in the SSs. As a consequence, the application of the dependence linking Pbopt with T0 must lead to errors in the estimation of the annual value of water column primary production (IPP) using chlorophyll-based models and satellite-derived data. The findings of this study suggest that the application of photosynthetically available radiation can be sufficient for the adequate estimation of Pbopt in light-limited regions. The main practical result of this study is the developed empirical region-specific algorithm of Pbopt, which can be used in the future for IPP estimation in the Arctic Ocean.

Supplementary Materials

The following supporting information can be downloaded at: https://www.mdpi.com/article/10.3390/jmse11030522/s1, Table S1: Phytoplankton productivity parameters and environmental variables in the Kara Sea from 1993 to 2020; Table S2: Matched-up points of in situ and satellite-derived assimilation numbers; Table S3. Matched-up points of in situ and satellite-derived subsurface PAR; Figure S1. Frequency distribution of log-transformed values of biotic and abiotic variables. (a)–optimal assimilation number (Pbopt); (b)–surface chlorophyll a concentration (Chl0); (c)–subsurface photosynthetically available radiation (PAR) (E0); (d)–sea surface temperature (T0); (e)–sea surface salinity (S0); (f)–concentration of dissolved inorganic nitrogen (DIN); (g)–concentration of phosphates (PO4); (h) –concentration of dissolved silicon (Si(OH)4); (i)–the ratio of chlorophyll a concentration of small (<3 μm) to total surface phytoplankton (Chls/Chl0); Kα–value of Kolmogorov-Smirnov test; p value–statistical reliability; N–number of data. Solid line is the curve of expected normal distribution.

Author Contributions

A.B.D. is the author who was responsible for the conception of this article and the main contributor to the text. T.A.B. and S.V.S. contributed to the collection and treatment of the data. All authors have read and agreed to the published version of the manuscript.

Funding

This study was supported by the Russian Science Foundation (project No. 23-27-00061, the scientific direction is “Phytoplankton size structure of the Kara Sea: environmental control of ecophysiological parameters and significance in estimation of primary production”).

Institutional Review Board Statement

Not applicable.

Informed Consent Statement

Not applicable.

Data Availability Statement

Raw field data are appended in the Supplementary Materials. MODIS-Aqua data used were obtained from the NASA website (http://oceancolor.gsfc.nasa.gov (accessed on 22 August 2022) the Goddard Distributed Active Archive Center under the auspices of the National Aeronautics and Space Administration.

Acknowledgments

We are grateful to Polukhin A.A. for kindly providing of hydrochemical data and to Gagarin V.I. (Shirshov Institute of Oceanology, Russian Academy of Sciences) for help in the treatment of satellite data.

Conflicts of Interest

The authors declare no conflict of interest.

References

  1. Field, C.B.; Behrenfeld, M.J.; Randerson, J.T.; Falkowski, P. Primary production of the Biosphere: Integrating terrestrial and oceanic components. Science 1998, 281, 237–240. [Google Scholar] [CrossRef]
  2. Behrenfeld, M.J.; O’Malley, R.O.; Siegel, D.A.; McClain, C.R.; Sarmiento, J.L.; Feldman, G.C.; Milligan, A.J.; Falkowski, P.G.; Letelier, R.M.; Boss, E.S. Climate-driven trends in contemporary ocean productivity. Nature 2006, 444, 752–755. [Google Scholar] [CrossRef] [PubMed]
  3. Bopp, L.; Monfray, P.; Aumont, O.; Dufresne, J.-L.; Treut, H.L.; Madec, G.; Terray, L.; Orr, J.C. Potential impact of climate change on marine export primary production. Glob. Biogeochem. Cycles 2001, 15, 81–99. [Google Scholar] [CrossRef]
  4. Chavez, F.P.; Messié, M.; Pennington, J.T. Marine primary production in relation to climate variability and change. Annu. Rev. Mar. Sci. 2011, 3, 227–260. [Google Scholar] [CrossRef]
  5. Gregg, W.W.; Conkright, M.E.; Ginoux, P.; O’Reilly, J.E.; Casey, N.W. Ocean primary production and climate: Global decadal changes. Geophys. Res. Lett. 2003, 30, 1809. [Google Scholar] [CrossRef]
  6. Sarmiento, J.L.; Slater, R.; Barber, R.; Bopp, R.L.; Doney, S.C.; Hirst, A.C.; Kleypas, J.; Matear, R.; Mikolajewicz, U.; Monfray, P.; et al. Response of ocean ecosystems to climate warming. Glob. Biogeochem. Cycles 2004, 18, GB3003. [Google Scholar] [CrossRef]
  7. Taucher, J.; Oschlies, A. Can we predict the direction of marine primary production change under global warming? Geophys. Res. Lett. 2011, 38, L02603. [Google Scholar] [CrossRef]
  8. Kulk, G.; Platt, T.; Dingle, J.; Jackson, T.; Jönsson, B.F.; Bouman, H.A.; Babin, M.; Brewin, R.J.W.; Doblin, M.; Estrada, M.; et al. Primary production, an index of climate change in the ocean: Satellite-based estimates over two decades. Remote Sens. 2020, 12, 826. [Google Scholar] [CrossRef]
  9. Jassby, A.D.; Platt, T. Mathematical formulation of the relationship between photosynthesis and light for phytoplankton. Limnol. Oceanogr. 1976, 21, 540–547. [Google Scholar] [CrossRef]
  10. Platt, T.; Gallegos, C.L.; Harrison, W.G. Photoinhibition of photosynthesis in natural assemblages of marine phytoplankton. J. Mar. Res. 1980, 38, 103–111. [Google Scholar]
  11. Steemann Nielsen, E. Experimental methods for measuring organic production in the sea. Rapp. P.-v. Réun. Cons. Perm. Int. Explor. Mer. 1958, 144, 38–46. [Google Scholar]
  12. Lohrenz, S.E. Estimation of primary production by the simulated in situ method. ICES Mar. Sci. Symp. 1993, 197, 159–171. [Google Scholar]
  13. Behrenfeld, M.J.; Falkowski, P.G. Photosynthetic rates derived from satellite-based chlorophyll concentrations. Limnol. Oceanogr. 1997, 42, 1–20. [Google Scholar] [CrossRef]
  14. Banse, K.; Yong, M. Sources of variability in satellite-derived estimates of phytoplankton production in the eastern tropical Pacific. J. Geophys. Res. 1990, 95, 7201–7215. [Google Scholar] [CrossRef]
  15. Campbell, J.; Antoine, D.; Armstrong, R.; Arrigo, K.; Balch, W.; Barber, R.; Behrenfeld, M.; Bidigare, R.; Bishop, J.; Carr, M.-E.; et al. Comparison of algorithms for estimating ocean primary production from surface chlorophyll, temperature, and irradiance. Glob. Biogeochem. Cycles 2002, 16, 9-1–9-15. [Google Scholar] [CrossRef]
  16. Carr, M.-E.; Friedrichs, M.A.M.; Schmeltz, M.; Aita, M.N.; Antoine, D.; Arrigo, K.R.; Asanuma, I.; Aumont, O.; Barber, R.; Behrenfeld, M.; et al. A comparison of global estimates of marine primary production from ocean color. Deep-Sea Res. Part II 2006, 53, 741–770. [Google Scholar] [CrossRef]
  17. Friedrichs, M.A.M.; Carr, M.-E.; Barber, R.; Scardi, M.; Antoine, D.; Armstrong, R.; Asanuma, I.; Behrenfeld, M.; Buitenhuis, E.; Chai, F.; et al. Assessing the uncertainties of model estimates of primary productivity in the tropical Pacific Ocean. J. Mar. Syst. 2009, 76, 113–133. [Google Scholar] [CrossRef]
  18. Saba, V.; Marjorie, S.; Friedrichs, M.A.M.; Carr, M.-E.; Antoine, D.; Armstrong, R.A.; Asanuma, I.; Aumont, O.; Bates, N.R.; Behrenfeld, M.J.; et al. Challenges of modeling depth-integrated marine primary productivity over multiple decades: A case study at BATS and HOT. Glob. Biogeochem. Cycles 2010, 24, GB3020. [Google Scholar] [CrossRef]
  19. Saba, V.S.; Friedrichs, M.A.M.; Antoine, D.; Armstrong, R.A.; Asanuma, I.; Behrenfeld, M.J.; Ciotti, A.M.; Dowell, M.; Hoepffner, N.; Hyde, K.J.W.; et al. An evaluation of ocean color model estimates of marine primary productivity in coastal and pelagic regions across the globe. Biogeosciences. 2011, 8, 489–503. [Google Scholar] [CrossRef]
  20. Petrenko, D.; Pozdnyakov, D.; Johannessen, J.; Counillon, F.; Sychov, V. Satellite-derived multiyear trend in primary production in the Arctic Ocean. Int. J. Remote Sens. 2013, 34, 3903–3937. [Google Scholar] [CrossRef]
  21. Lee, Y.J.; Matrai, P.A.; Friedrichs, M.A.M.; Saba, V.S.; Antoine, D.; Ardyna, M.; Asanuma, I.; Babin, M.; Bélanger, S.; Benoît-Gagne, M.; et al. An assessment of phytoplankton primary productivity in the Arctic Ocean from satellite ocean color/in situ chlorophyll-a based models. J. Geophys. Res. 2015, 120. [Google Scholar] [CrossRef]
  22. Babin, M.; Bélanger, S.; Ellingsen, I.; Forest, A.; Le Fouest, V.; Lacour, T.; Ardyna, M.; Slagstad, D. Estimation of primary production in the Arctic Ocean using ocean colour remote sensing and coupled physical–biological models: Strengths, limitations and how they compare. Prog. Oceanogr. 2015, 139, 197–220. [Google Scholar] [CrossRef]
  23. Lobanova, P.; Tilstone, G.H.; Bashmachnikov, I.; Brotas, V. Accuracy Assessment of Primary Production Models with and without Photoinhibition Using Ocean-Colour Climate Change Initiative Data in the North East Atlantic Ocean. Remote Sens. 2018, 10, 1116. [Google Scholar] [CrossRef]
  24. Regaudie-de-Giouxa, A.; Huete-Ortega, M.; Sobrino, C.; López-Sandoval, D.C.; González, N.; Fernández-Carrera, A.; Vidal, M.; Marañón, E.; Cermeño, P.; Latasa, M.; et al. Multi-model remote sensing assessment of primary production in the subtropical gyres. J. Mar. Syst. 2019, 196, 97–106. [Google Scholar] [CrossRef]
  25. Ishizaka, J.; Siswanto, E.; Itoh, T.; Murakami, H.; Yamaguchi, Y.; Horimoto, N.; Ishimaru, T.; Hashimoto, S.; Saino, T. Verification of Vertically Generalized Production Model and estimation of primary production in Sagami Bay, Japan. J. Oceanogr. 2007, 63, 517–524. [Google Scholar] [CrossRef]
  26. Lee, Z.; Marra, J.; Perry, M.J.; Kahru, M. Estimating oceanic primary productivity from ocean color remote sensing: A strategic assessment. J. Mar. Syst. 2015, 149, 50–59. [Google Scholar] [CrossRef]
  27. Siegel, D.A.; Westberry, T.K.; O’Brien, M.C.; Nelson, N.B.; Michaels, A.F.; Morrison, J.R.; Scott, A.; Caporelli, E.A.; Sorensen, J.C.; Maritorena, S.; et al. Bio-optical modeling of primary production on regional scales: The Bermuda BioOptics project. Deep-Sea Res. Part II 2001, 48, 1865–1896. [Google Scholar] [CrossRef]
  28. Arrigo, K.R.; van Dijken, G.L. Secular trends in Arctic Ocean net primary production. J. Geophys. Res. 2011, 116, C09011. [Google Scholar] [CrossRef]
  29. Matrai, P.A.; Olson, E.; Suttles, S.; Hill, V.; Codispoti, L.A.; Light, B.; Steele, M. Synthesis of primary production in the Arctic Ocean: I. Surface waters, 1954–2007. Prog. Oceanogr. 2013, 110, 93–106. [Google Scholar] [CrossRef]
  30. Hill, V.J.; Matrai, P.A.; Olson, E.; Suttles, S.; Steele, M.; Codispoti, L.A.; Zimmerman, R.C. Synthesis of integrated primary production in the Arctic Ocean: II. In situ and remotely sensed estimates. Prog. Oceanogr. 2013, 110, 107–125. [Google Scholar] [CrossRef]
  31. Subba Rao, D.V.; Platt, T. Primary production of Arctic waters. Pol. Biol. 1984, 3, 191–201. [Google Scholar] [CrossRef]
  32. Harrison, W.G.; Cota, G.F. Primary production in polar waters: Relation to nutrient availability. Pol. Res. 1991, 10, 87–104. [Google Scholar] [CrossRef]
  33. Demidov, A.; Sukhanova, I.; Belevich, T.; Flint, M.; Gagarin, V.; Sergeeva, V.; Eremeeva, E.; Fedorov, A. Size-fractionated surface phytoplankton in the Kara and Laptev seas: Environmental control and spatial variability. Mar. Ecol. Prog. Ser. 2021, 664, 59–77. [Google Scholar] [CrossRef]
  34. Finkel, Z.V.; Beardall, J.; Flynn, K.J.; Quigg, A.; Rees, T.A.V.; Raven, J.A. Phytoplankton in a changing world: Cell size and elemental stoichiometry. J. Plankton Res. 2010, 32, 119–137. [Google Scholar] [CrossRef]
  35. Dittmar, T.; Kattner, G. The biogeochemistry of the river and shelf system of the Arctic Ocean: A review. Mar. Chem. 2003, 83, 103–120. [Google Scholar] [CrossRef]
  36. Hanzlick, D.; Aagaard, K. Freshwater and Atlantic water in the Kara Sea. J. Geophys. Res. 1980, 85, 4937–4942. [Google Scholar] [CrossRef]
  37. Holmes, R.M.; McClelland, J.W.; Peterson, B.J.; Tank, S.E.; Bulygina, E.; Eglinton, T.I.; Gordeev, V.V.; Gurtovaya, T.Y.; Raymond, P.A.; Repeta, D.J.; et al. Seasonal and annual fluxes of nutrients and organic matter from large rivers to the Arctic Ocean and surrounding seas. Estuaries Coasts. 2012, 35, 369–382. [Google Scholar] [CrossRef]
  38. Le Fouest, V.; Babin, M.; Ttemblay, J.-É. The fate of riverine nutrients on Arctic shelves. Biogeosciences 2013, 10, 3661–3677. [Google Scholar] [CrossRef]
  39. Stein, R. Circum Arctic river discharge and its geological record. Int. J Earth Sci. 2000, 89, 447–449. [Google Scholar] [CrossRef]
  40. Kubryakov, A.; Stanichny, S.; Zatsepin, A. River plume dynamics in the Kara Sea from altimetry-based lagrangian model, satellite salinity and chlorophyll data. Remote Sens. Environ. 2016, 176, 177–187. [Google Scholar] [CrossRef]
  41. Osadchiev, A.A.; Frey, D.I.; Shchuka, S.A.; Tilinina, N.D.; Morozov, E.G.; Zavialov, P.O. Structure of the freshened surface layer in the Kara Sea during ice-free periods. J. Geophys. Res. 2021, 126, e2020JC016486. [Google Scholar] [CrossRef]
  42. Zatsepin, A.G.; Zavialov, P.O.; Kremenetskiy, V.V.; Poyarkov, S.G.; Soloviev, D.M. The upper desalinated layer in the Kara Sea. Oceanology 2010, 50, 658–668. [Google Scholar] [CrossRef]
  43. Glukhovets, D.I.; Goldin, Y.A. Surface desalinated layer distribution in the Kara Sea determined by shipboard and satellite data. Oceanologia 2020, 62, 364–373. [Google Scholar] [CrossRef]
  44. Amon, R.M.W. The role of dissolved organic matter for the organic carbon cycle in the Arctic Ocean. In The Organic Carbon Cycle in the Arctic Ocean; Stein, R., Macdonald, R.W., Eds.; Springer: Berlin, Germany, 2004; pp. 83–100. [Google Scholar]
  45. Rachold, V.; Eicken, H.; Gordeev, V.V.; Grigoriev, M.N.; Hubberten, H.-W.; Lisitzin, A.P.; Shevchenko, V.P.; Schirrmeister, L. Modern terrigenous organic carbon input to the Arctic ocean. In The Organic Carbon Cycle in the Arctic Ocean; Stein, R., Macdonald, R.W., Eds.; Springer: Berlin, Germany, 2004; pp. 33–56. [Google Scholar]
  46. Vetrov, A.A.; Romankevich, E.A. Carbon Cycle in the Russian Arctic Seas; Springer: Berlin, Germany, 2004; p. 331. [Google Scholar]
  47. Demidov, A.B.; Mosharov, S.A.; Makkaveev, P.N. Patterns of the Kara Sea primary production in autumn: Biotic and abiotic forcing of subsurface layer. J. Mar. Syst. 2014, 132, 130–149. [Google Scholar] [CrossRef]
  48. Longhurst, A.R.; Sathyendranath, S.; Platt, T.; Caverhill, C. An estimate of global primary production in the ocean from satellite radiometer data. J. Plankton Res. 1995, 17, 1245–1271. [Google Scholar] [CrossRef]
  49. Platt, T.; Sathyendranath, S. Spatial structure of pelagic ecosystem processes in the global ocean. Ecosystems 1999, 2, 384–394. [Google Scholar] [CrossRef]
  50. Saux Picart, S.; Sathyendranath, S.; Dowell, M.; Moore, T.; Platt, T. Remote sensing of assimilation number for marine phytoplankton. Rem. Sens. Environ. 2014, 146, 87–96. [Google Scholar] [CrossRef]
  51. Carmack, E.C.; Macdonald, R.W.; Jasper, S. Phytoplankton productivity on the Canadian Shelf of the Beaufort Sea. Mar. Ecol. Prog. Ser. 2004, 277, 37–50. [Google Scholar] [CrossRef]
  52. Tremblay, J.E.; Gagnon, J. The effect of irradiance and nutrient supply on the productivity of Arctic waters: A perspective on climate change. In Influence of Climate Change on the Changing Arctic and Sub-Arctic Condition; Nihpul, J.C.J., Kostianoy, A.G., Eds.; Springer: New York, NY, USA, 2009; pp. 73–94. [Google Scholar]
  53. Platt, T.; Harrison, W.G.; Horne, E.P.W.; Irwin, B. Carbon fixation and oxygen evolution by phytoplankton in the Canadian High Arctic. Pol. Biol. 1987, 8, 103–113. [Google Scholar] [CrossRef]
  54. Bélanger, S.; Babin, M.; Tremblay, J.E. Increasing cloudiness in the Arctic damps the increase in phytoplankton primary production due to sea ice receding. Biogeosciences Discussions. 2012, 9, 13987–14012. [Google Scholar] [CrossRef]
  55. Yun, M.S.; Chung, K.H.; Zimmerman, S.; Zhao, J.; Joo, H.M.; Lee, S.H. Phytoplankton productivity and its response to higher light levels in the Canada Basin. Pol. Biol. 2012, 35, 257–268. [Google Scholar] [CrossRef]
  56. Vedernikov, V.I.; Demidov, A.B.; Sud’bin, A.I. Primary production and chlorophyll in the Kara Sea in September 1993. Oceanology 1995, 34, 630–640. [Google Scholar]
  57. Mosharov, S.A. Distribution of the primary production and chlorophyll a in the Kara Sea in September of 2007. Oceanology 2010, 50, 885–893. [Google Scholar] [CrossRef]
  58. Mosharov, S.A.; Demidov, A.B.; Simakova, U.V. Peculiarities of the primary production process in the Kara Sea at the end of the vegetation season. Oceanology 2016, 56, 84–94. [Google Scholar] [CrossRef]
  59. Demidov, A.B.; Kopelevich, O.V.; Mosharov, S.A.; Sheberstov, S.V.; Vazyulya, S.V. Modelling Kara Sea phytoplankton primary production: Development and skill assessment of regional algorithms. J. Sea Res. 2017, 125, 1–17. [Google Scholar] [CrossRef]
  60. Demidov, A.B.; Gagarin, V.I.; Arashkevich, E.G.; Makkaveev, P.N.; Konyukhov, I.V.; Vorobieva, O.V.; Fedorov, A.V. Spatial Variability of Primary Production and Chlorophyll in the Laptev Sea in August–September. Oceanology 2019, 59, 678–691. [Google Scholar] [CrossRef]
  61. Demidov, A.B.; Gagarin, V.I.; Vorobieva, O.V.; Makkaveev, P.N.; Artemiev, V.A.; Khrapko, A.N.; Grigoriev, A.V.; Sheberstov, S.V. Spatial and vertical variability of primary production in the Kara Sea in July and August 2016: The influence of the river plume and subsurface chlorophyll maxima. Pol. Biol. 2018, 41, 563–578. [Google Scholar] [CrossRef]
  62. Demidov, A.B.; Gagarin, V.I. Primary Production and Associated Environmental Conditions in the East Siberian Sea in Autumn. Dokl. Earth Sci. 2019, 487, 1006–1011. [Google Scholar] [CrossRef]
  63. Fitzwater, S.E.; Knauer, G.A.; Martin, J.H. Metal contamination and its effect on primary production measurements. Limnol. Oceanogr. 1982, 27, 544–551. [Google Scholar] [CrossRef]
  64. Steemann Nielsen, E. The use of radioactive carbon (C14) for measuring organic production in the sea. J. Cons. Perm. Int. Pour Explor. Mer. 1952, 18, 117–140. [Google Scholar] [CrossRef]
  65. Jeffrey, S.W.; Humphrey, G.F. New spectrophotometric equations for determining chlorophylls a, b, c1 and c2 in higher plants, algae and natural phytoplankton. Biochem. Physiol. Pflanzen. 1975, 167, 191–194. [Google Scholar] [CrossRef]
  66. SCOR–UNESCO. Report of SCOR–UNESCO working group 17 on determination of photosynthetic pigments in Sea Water. In Monography of Oceanography Methodology; UNESCO: Paris, France, 1966; pp. 9–18. [Google Scholar]
  67. Holm-Hansen, O.; Lorenzen, C.J.; Holmes, R.W.; Strickland, J.D.H. Fluorometric determination of chlorophyll. J. Cons. Perm. Int. Explor. Mer. 1965, 30, 3–15. [Google Scholar] [CrossRef]
  68. Holm-Hansen, O.; Riemann, B. Chlorophyll a determination: Improvements in methodology. Oikos 1978, 30, 438–447. [Google Scholar] [CrossRef]
  69. Neveux, J.; Delmas, D.; Romano, J.; Algarra, P.; Ignatiades, L.; Herbland, A.; Morand, P.; Neori, A.; Bonin, D.; Barbe, J.; et al. Comparison of chlorophyll and phaeopigments determination by spectrophotometric, fluorometric, spectrofluorometric and HPLC methods. Mar. Microb. Food Webs. 1990, 4, 217–238. [Google Scholar]
  70. Mantoura, R.F.C.; Jeffrey, S.W.; Liewellyn, C.A.; Claustre, H.; Morales, C.E. Comparison between spectrophotometric, fluorometric and HPLC methods for chlorophyll analysis. In Phytoplankton Pigments in Oceanography: Guidelines to Modern Methods; Jeffrey, S.W., Mantoura, R.F.C., Wright, S.W., Eds.; UNESCO: Paris, France, 1997; pp. 361–380. [Google Scholar]
  71. Intergovernmental Oceanographic Commission. Chemical Methods for Use in Marine Environment Monitoring; UNESCO: Paris, France, 1983; p. 53. [Google Scholar]
  72. Grasshoff, K.; Kremling, K.; Ehrhardt, M. Methods of Seawater Analysis; Wiley: New York, NY, USA, 1999; p. 600. [Google Scholar]
  73. Millero, F.J. Thermodynamics of the carbon dioxide system in oceans. Geochim. Cosmochim. Acta 1995, 59, 661–677. [Google Scholar] [CrossRef]
  74. Pivovarov, S.; Schlitzer, R.; Novikhin, A. River run-off influence on the water mass formation in the Kara Sea. In Siberian River Run-off in the Kara Sea; Stein, R., Fahl, K., Fütterer, D.K., Galimov, E.M., Stepanets, O.V., Eds.; Elsevier: Amsterdam, The Netherlands, 2003; pp. 9–25. [Google Scholar]
  75. Doney, S.C.; Lima, I.; Moore, J.K.; Lindsay, K.; Behrenfeld, M.J.; Westberry, T.K.; Mahowald, N.; Glover, D.M.; Takahashi, T. Skill metrics for confronting global upper ocean ecosystem-biogeochemistry models against field and remote sensing data. J. Mar. Syst. 2009, 76, 95–112. [Google Scholar] [CrossRef]
  76. Stow, C.A.; Jolliff, J.; McGillicuddy, D.J.; Doney, C.S.; Allen, J.I.; Friedrichs, M.A.M.; Rose, K.A.; Wallhead, P. Skill assessment for coupled biological/physical models of marine systems. J. Mar. Syst. 2009, 76, 4–15. [Google Scholar] [CrossRef]
  77. Frouin, R.; McPherson, J.; Ueyoshi, K.; Franz, B.A. A time series of photosynthetically available radiation at the ocean surface from SeaWiFS and MODIS data. Proc. SPIE 2012, 12. [Google Scholar] [CrossRef]
  78. Siswanto, E.; Ishizaka, J.; Yokouchi, K. Optimal Primary Production Model and Parameterization in the Eastern East China Sea. J. Oceanogr. 2006, 62, 361–372. [Google Scholar] [CrossRef]
  79. Hill, V.J.; Zimmerman, R.C. Estimates of primary production by remote sensing in the Arctic Ocean: Assessment of accuracy with passive and active sensors. Deep Sea Res. Part I 2010, 57, 1243–1254. [Google Scholar] [CrossRef]
  80. Mei, Z.-P.; Legendre, L.; Gratton, Y.; Tremblay, J.-É.; LeBlanc, B.; Klein, B.; Gosselin, M. Phytoplankton production in the North Water Polynya: Size-fractions and carbon fluxes, April to July 1998. Mar. Ecol. Prog. Ser. 2003, 256, 13–27. [Google Scholar] [CrossRef]
  81. Hill, V.J.; Cota, G. Spatial patterns of primary production on the shelf, slope and basin of the Western Arctic in 2002. Deep-Sea Res. Part II 2005, 52, 3344–3354. [Google Scholar] [CrossRef]
  82. Apollonio, S.; Matrai, P. Marine primary production in the Canadian Arctic, 1956, 1961–1963. Polar Biol. 2011, 34, 767–774. [Google Scholar] [CrossRef]
  83. Bouman, H.; Platt, T.; Sathyendranath, S.; Stuart, V. Dependence of light-saturated photosynthesis on temperature and community structure. Deep-Sea Res. Part I 2005, 52, 1284–1299. [Google Scholar] [CrossRef]
  84. Kameda, T.; Ishizaka, J. Size-fractionated primary production estimated by a two-phytoplankton community model applicable to ocean color remote sensing. J. Oceanogr. 2005, 61, 663–672. [Google Scholar] [CrossRef]
  85. de Madariaga, I.; Joint, I. Photosynthesis and carbon metabolism by size-fractionated phytoplankton in the southern North Sea in early summer. Cont. Shelf Res. 1994, 14, 295–311. [Google Scholar] [CrossRef]
  86. Richardson, K.; Bendtsen, J.; Kragh, T.; Mousing, E.A. Constraining the distribution of photosynthetic parameters in the global ocean. Front. Mar. Sci. 2016, 3. [Google Scholar] [CrossRef]
  87. Robinson, A.; Bouman, H.A.; Tilstone, G.H.; Sathyendranath, S. Size class dependent relationships between temperature and phytoplankton photosynthesis-irradiance parameters in the Atlantic Ocean. Front. Mar. Sci. 2017, 4. [Google Scholar] [CrossRef]
  88. Raven, J.A. Small is beautiful: The picophytoplankton. Funct. Ecol. 1998, 12, 503–513. [Google Scholar] [CrossRef]
  89. Raven, J.A.; Finkel, Z.V.; Irwin, A.J. Picophytoplankton: Bottom-up and top-down controls on ecology and evolution. Vie et Milieu. 2005, 55, 209–215. [Google Scholar]
  90. Kremer, C.T.; Thomas, M.K.; Litchman, E. Temperature- and size-scaling of phytoplankton population growth rates: Reconciling the Eppley curve and the metabolic theory of ecology. Limnol. Oceanogr. 2017, 62, 1658–1670. [Google Scholar] [CrossRef]
  91. Harrison, W.G.; Irwin, B.; Platt, T. Primary production and nutrient assimilation by natural phytoplankton populations of the eastern Canadian Arctic. Can. J. Fish. Aquat. Sci. 1982, 39, 335–345. [Google Scholar] [CrossRef]
  92. Platt, T.; Harrison, W.G. Letter to the editor. Reconciliation of carbon and oxygen fluxes in the upper ocean. Deep-Sea Res. 1986, 33, 273–276. [Google Scholar] [CrossRef]
  93. Babin, M.; Arrigo, K.; Bélanger, S.; Forget, M.-H. Ocean Colour Remote Sensing in Polar Seas. IOCCG Rep. Series 2015, 16, 130. [Google Scholar]
  94. Lobbes, J.M.; Fitznar, H.P.; Kattner, G. Biogeochemical characteristics of dissolved and particulate organic matter in Russian rivers entering the Arctic Ocean. Geochem. Cosmochim. Acta 2000, 64, 2973–2983. [Google Scholar] [CrossRef]
  95. Bröder, L.; Tesi, T.; Salvadó, J.A.; Semiletov, I.P.; Dudarev, O.V.; Gustafsson, Ö. Fate of terrigenous organic matter across the Laptev Sea from the mouth of the Lena River to the deep sea of the Arctic interior. Biogeosciences 2016, 13, 5003–5019. [Google Scholar] [CrossRef]
  96. Ahn, S.H.; Kim, K.W.; Jo, N.; Kang, J.J.; Lee, J.H.; Whitledge, T.E.; Stockwell, D.A.; Lee, H.W.; Lee, S.H. Fluvial influence on the biochemical composition of particulate organic matter in the Laptev and Western East Siberian seas during 2015. Mar. Environ. Res. 2020, 155. [Google Scholar] [CrossRef]
  97. Harrison, W.G.; Platt, T. Photosynthesis-Irradiance Relationships in Polar and Temperate Phytoplankton Populations. Pol. Biol. 1986, 5, 153–164. [Google Scholar] [CrossRef]
  98. Li, W.K.W.; Smith, J.C.; Platt, T. Temperature response of photosynthetic capacity and carboxylase activity in Arctic marine phytoplankton. Mar. Ecol. Progr. Ser. 1984, 17, 237–243. [Google Scholar] [CrossRef]
  99. Rey, F. Photosynthesis-irradiance relationships in natural phytoplankton populations of the Barents Sea. Pol. Res. 1991, 10, 105–116. [Google Scholar] [CrossRef]
  100. Palmer, M.A.; van Dijken, G.L.; Mitchell, G.; Seegers, B.J.; Lowry, K.E.; Mills, M.M.; Arrigo, K.R. Light and nutrient control of photosynthesis in natural phytoplankton populations from the Chukchi and Beaufort seas, Arctic Ocean. Limnol. Oceanogr. 2013, 58, 2185–2205. [Google Scholar] [CrossRef]
  101. Huot, Y.; Babin, M.; Bruyant, F. Photosynthetic parameters in the Beaufort Sea in relation to the phytoplankton community structure. Biogeosciences 2013, 10, 3445–3454. [Google Scholar] [CrossRef]
  102. Coello-Camba, A.; Agustí, S.; Vaqué, D.; Holding, J.; Arrieta, J.M.; Wassmann, P.; Duarte, C.M. Experimental Assessment of Temperature Thresholds for Arctic Phytoplankton Communities. Estuaries Coasts 2014, 38, 873–885. [Google Scholar] [CrossRef]
  103. Demidov, A.B.; Sheberstov, S.V.; Gagarin, V.I.; Khlebopashev, P.V. Seasonal Variation of the Satellite-Derived Phytoplankton Primary Production in the Kara Sea. Oceanology 2017, 57, 91–104. [Google Scholar] [CrossRef]
  104. Demidov, A.B.; Sheberstov, S.V.; Gagarin, V.I. Seasonal Variability and Annual Primary Production of Phytoplankton in the Laptev Sea Assessed by MODIS-Aqua Data. Izv.-Atmos. Oceanic Phys. 2020, 56, 950–962. [Google Scholar] [CrossRef]
  105. Lee, S.H.; Whitledge, T.E. Primary and new production in the deep Canada Basin during summer 2002. Pol. Biol. 2005, 28, 190–197. [Google Scholar] [CrossRef]
  106. Goldman, J.C.; McCarthy, J.J.; Peavey, D.G. Growth rate influence on the chemical composition of phytoplankton in oceanic waters. Nature 1979, 279, 210–215. [Google Scholar] [CrossRef]
  107. Falkowski, P.G.; Stone, D.P. Nitrate Uptake in Marine Phytoplankton: Energy Sources and the Interaction with Carbon Fixation. Mar. Biol. 1975, 32, 77–84. [Google Scholar] [CrossRef]
  108. Estrada, M.; Bayer-Giraldi, M.; Felipe, J.; Marrasé, C.; Sala, M.M.; Vidal, M. Light and nutrient effects on microbial communities collected during spring and summer in the Beaufort Sea. Aquat. Microb. Ecol. 2009, 54, 217–231. [Google Scholar] [CrossRef]
  109. Moschonas, G.; Gowen, R.J.; Paterson, R.F.; Mitchell, E.; Stewart, B.M.; McNeill, S.; Glibert, P.M.; Davidson, K. Nitrogen dynamics and phytoplankton community structure: The role of organic nutrients. Biogeochemistry 2017, 134, 125–145. [Google Scholar] [CrossRef]
  110. Dogliotti, A.I.; Lutz, V.A.; Segura, V. Estimation of primary production in the southern Argentine continental shelf and shelf-break regions using field and remote sensing data. Rem. Sens. Environ. 2014, 140, 497–508. [Google Scholar] [CrossRef]
Figure 1. Locations of the sampling sites in the Siberian Seas where the calculations of the optimal assimilation number (Pbopt) were performed. The red circles indicate the sites where the calculations of Pbopt of the total phytoplankton were carried out. The blue circles indicate the sites where the calculations of Pbopt of size-fractionated phytoplankton were performed.
Jmse 11 00522 g001
Figure 2. Seasonal variation in the optimal assimilation number and associated environmental factors in the Siberian Seas. Bars are the average values of the optimal assimilation number (Pbopt). The blue line is subsurface PAR (E0). The red line is sea surface temperature (T0). The vertical line segments indicate standard deviation.
Jmse 11 00522 g002
Figure 3. The relationships between the optimal assimilation number (Pbopt) and environmental factors. (a) Subsurface PAR (E0); (b) sea surface temperature (T0); (c) concentration of dissolved inorganic nitrogen (DIN); (d) surface chlorophyll a concentration (Chl0); and (e) the ratio of chlorophyll a concentration of small (<3 μm) to total surface phytoplankton (Chls/Chl0). Green and red colours indicate the measurements performed in the summer and autumn, respectively.
Jmse 11 00522 g003
Figure 4. Graphical representation of the results of the principal component analysis (PCA). (a) Correlations on the factorial plane formed with the two first principal components (PC1 and PC2). The values at the axis designate the PC1 and PC2 contribution to the total variance. The values of the optimal assimilation number (Pbopt), surface chlorophyll a concentration (Chl0), subsurface PAR (E0), surface water temperature (T0), surface salinity (S0), phosphate (PO4), dissolved silicon (Si(OH)4), dissolved inorganic nitrogen (DIN), and the ratio of chlorophyll a concentration of small (<3 μm) to total surface phytoplankton (Chls/Chl0) are presented. (b) Projection of the individual samples collected in the brackish (S0 < 25) (red colour) and oceanic (S0 > 25) (green colour) waters of the Siberian Seas on the factorial plane.
Jmse 11 00522 g004aJmse 11 00522 g004b
Figure 5. (a) A comparison of the values of the optimal assimilation number (Pbopt) measured and calculated using subsurface PAR (E0) and (b) a comparison of the values of Pbopt measured and calculated using satellite-derived PAR (Esat) (black points). The solid line indicates 1:1 correlation.
Jmse 11 00522 g005aJmse 11 00522 g005b
Figure 6. (a) the optimal assimilation number (Pbopt) vs. sea surface temperature (T0) in the Siberian Seas (SSs) (open circles) in comparison with polynomial regression obtained by Behrenfeld and Falkowski [13] (BF-model) based on the worldwide dataset (the blue line). Red colour indicates the exponential relationship between Pbopt and T0 obtained based on the SSs dataset (T_reg—algorithm). (b) A comparison of the values of Pbopt measured and calculated using the BF-model. (c) A comparison of the values of Pbopt measured and calculated using T_reg. The solid line indicates a 1:1 correlation.
Jmse 11 00522 g006
Figure 7. The representation of Siberian Seas estimates of the optimal assimilation number (Pbopt) from satellite climatologies (2007–2020) calculated using E0reg model for the period from July to October.
Jmse 11 00522 g007
Figure 8. The relationship between the optimal assimilation number (Pbopt) and surface assimilation number (Pb0) (black points) in the Siberian Seas. The solid line shows the line of regression. The dashed line indicates 1:1 correlation.
Jmse 11 00522 g008
Figure 9. The relationship between measured (E0) and satellite-derived subsurface PAR (Esat) (black points). The solid line shows the line of regression. The dashed line indicates a 1:1 correlation.
Jmse 11 00522 g009
Table 1. Sources for primary production and chlorophyll a measurements included in the dataset for analysis of the variability in the optimal assimilation number, its links with environmental factors, and model development and verification.
CruiseMonthsYearsLocationNumber of StationsPublications
49th Dmitry MendeleevAugust–September1993Kara Sea29[56]
54th Akademik Mstislav KeldyshSeptember2007Kara Sea16[57]
59th Akademik Mstislav KeldyshSeptember–October2011Kara Sea36[58]
125th Professor ShtokmanSeptember2013Kara Sea29[59]
128th Professor ShtokmanAugust–September2014Kara Sea48Unpublished data
63d Akademik Mstislav KeldyshAugust–October2015Kara and Laptev Seas56[60]
66th Akademik Mstislav KeldyshJuly–August2016Kara Sea55[61]
69th Akademik Mstislav KeldyshAugust–September2017Kara, Laptev, and East Siberian Seas53[60,62]
72nd Akademik Mstislav KeldyshAugust–September2018Kara and Laptev Seas37[60]
76th Akademik Mstislav KeldyshJuly–August2019Kara Sea32Unpublished data
81st Akademik Mstislav KeldyshAugust–September2020Kara Sea28Unpublished data
Table 2. The variability in the optimal assimilation number (mgC (mgChl a))–1 h–1 of different phytoplankton size groups in the Siberian Seas. M—mean; σ—standard deviation; N—number of data.
RegionStatistics>3 μm<3 μmTotal
Kara SeaM ± σ1.15 ± 0.591.78 ± 1.291.37 ± 0.79
N6059333
Laptev SeaM ± σ1.02 ± 0.551.30 ± 0.761.27 ± 0.58
N333359
East Siberian SeaM ± σ1.21 ± 0.681.33 ± 0.971.77 ± 0.70
N121219
Siberian SeasM ± σ1.05 ± 0.581.65 ± 1.241.38 ± 0.76
N105104411
Table 3. The optimal assimilation number (mgC (mgChl a))–1 h–1 of different phytoplankton size groups within the different salinity ranges and seasons. S0—sea surface salinity; M—mean; σ—standard deviation; N—number of data.
Range of S0SeasonStatisticsPhytoplankton Size Fractions
>3 μm<3 μmTotal
<25Summer
(July, August)
M ± σ1.26 ± 0.431.10 ± 0.522.60 ± 1.961.73 ± 1.401.72 ± 0.481.35 ± 0.64
N3341
Autumn
(September, October)
M ± σ1.07 ± 0.541.60 ± 1.321.22 ± 0.57
N2121117
>25Summer
(July, August)
M ± σ1.13 ± 0.661.04 ± 0.601.99 ± 1.421.63 ± 1.191.81 ± 0.881.40 ± 0.84
N3535110
Autumn
(September, October)
M ± σ0.97 ± 0.541.35 ± 0.901.08 ± 0.64
N4645143
Table 4. The correlation matrix between the log-transformed optimal assimilation numbers for different phytoplankton size groups and environmental variables. Pbopt—optimal assimilation number of the total phytoplankton; Pbopt L—optimal assimilation number of large phytoplankton (>3 μm); Pbopt S—optimal assimilation number of small phytoplankton (<3 μm); R—coefficient of correlation; p value—statistical significance of R; N—the number of data. T0—sea surface temperature; S0—sea surface salinity; PO4, Si(OH)4, and DIN–surface concentrations of phosphates, dissolved silicon, and dissolved inorganic nitrogen, respectively; Chl0—chlorophyll a concentration of the surface total phytoplankton; ChlS—chlorophyll a concentration of surface small (<3 μm) phytoplankton; E0—subsurface photosynthetically available radiation. The asterisks indicate significant correlations (p < 0.05).
ParameterStatisticsT0S0Chl0ChlS/Chl0E0PO4Si(OH)4DIN
PboptR0.080.08−0.21 *0.23 *0.61 *−0.020.10−0.20 *
N411408411104395404410387
p0.1090.092<10−30.020<10−20.7230.12<10−3
Pbopt LR0.20 *0.070.010.26*0.080.140.160.13
N10510510510410510410498
p0.040.4680.9470.0080.3940.1540.1060.201
Pbopt SR0.07−0.040.12−0.090.24 *−0.11−0.05−0.05
N10410410410310410310397
p0.4570.6520.2080.3790.0140.2910.5940.596
Table 5. The correlation matrix between the log-transformed values of environmental variables. R—coefficient of correlation; p value—statistical significance of R; N—the number of data. T0—surface water temperature; S0—surface salinity; PO4, Si(OH)4 and DIN—surface concentrations of phosphates, dissolved silicon, and dissolved inorganic nitrogen, respectively; Chl0—surface chlorophyll a concentration; E0—subsurface PAR. The asterisks indicate significant correlations (p < 0.05).
ParameterStatisticsT0S0Chl0E0PO4Si(OH)4DIN
TR1.00
N411
p<10−3
S0R−0.22 *1.00
N408408
p<10−3<10−3
Chl0R0.30 *−0.61 *1.00
N411408411
p<10−3<10−2<10−3
E0R0.11 *0.07−0.20 *1.00
N395392395395
p0.0360.163<10−3<10−3
PO4R−0.14 *−0.21 *0.19 *−0.061.00
N404401404388404
p0.006<10−3<10−30.232<10−3
Si(OH)4R0.21 *−0.52 *0.67 *−0.040.35 *1.00
N410407410394404410
p<10−3<10−2<10−20.473<10−3<10−3
DINR−0.11 *−0.20 *0.28 *−0.23 *0.28 *0.25 *1.00
N387384387377385387387
p0.027<10−3<10−3<10−3<10−3<10−3<10−3
Table 6. Regression statistics and performance indices for the log-transformed measured and modelled optimal assimilation number (Pbopt). Slope and intercept are parameters of the linear regressions; R2—coefficient of determination; N—number of data used for model validation; p-value indicates the significance level of each regression. Indices are the mean model bias (B), the standard deviation of the log-transformed modelled values of Pbopt (σ), and the root-mean-square difference (RMSD); E0reg—the region-specific Pbopt model developed using subsurface photosynthetically available radiation (PAR) and verified with field data. BF-model—the Pbopt model developed by Behrenfeld and Falkowski [13]. Treg—the region-specific Pbopt model developed using the relationship between Pbopt and sea surface temperature. Esat—E0reg verified with satellite-derived data of PAR.
ModelRegression StatisticsPerformance Indices
SlopeInterceptR2Np ValueBσRMSD
E0reg0.6970.8790.35131<0.050.0400.1760.227
BF-model0.0600.4050.02410<0.050.3430.4090.444
Treg0.0360.1150.03137<0.050.0660.0550.279
Esat0.2890.2260.19373<0.050.1830.1900.321
Table 7. The correlation matrix between the log-transformed optimal assimilation number and environmental variables in the areas with S0 < 25 and S0 > 25. Pbopt—optimal assimilation number of the total phytoplankton; R—coefficient of correlation; p-value—statistical significance of R; N—the number of data; T0—sea surface temperature; S0—sea surface salinity; PO4, Si(OH)4, and DIN—surface concentrations of phosphates, dissolved silicon, and dissolved inorganic nitrogen, respectively; Chl0—chlorophyll a concentration of the surface total phytoplankton; E0—subsurface photosynthetically available radiation. The asterisks indicate significant correlations (p < 0.05).
ParameterStatisticsT0S0Chl0E0PO4Si(OH)4DIN
Pbopt
S0 < 25
R0.24 *0.21 *−0.100.59 *−0.090.19 *−0.24 *
N159156159150154158147
p0.0030.0090.211<10−30.2840.0200.003
Pbopt
S0 > 25
R0.02−0.11−0.41 *0.63 *0.020.06−0.19 *
N245254254247252254242
p0.7130.075<10−3<10−20.6960.3760.002
Disclaimer/Publisher’s Note: The statements, opinions and data contained in all publications are solely those of the individual author(s) and contributor(s) and not of MDPI and/or the editor(s). MDPI and/or the editor(s) disclaim responsibility for any injury to people or property resulting from any ideas, methods, instructions or products referred to in the content.