Article

Marine Natural Gas Hydrate Self-Entry Exploitation Device: Evaluation of Production Enhancement Measures

1
School of Electric, Electrical Engineering and Physics, Fujian University of Technology, Fuzhou 350108, China
2
College of Civil Engineering, Fuzhou University, Fuzhou 350108, China
3
Institute for Ocean Engineering, Shenzhen International Graduate School, Tsinghua University, Shenzhen 518055, China
4
School of Storage, Transportation and Construction Engineering, China University of Petroleum (East China), Qingdao 266580, China
*
Author to whom correspondence should be addressed.
J. Mar. Sci. Eng. 2023, 11(3), 543; https://doi.org/10.3390/jmse11030543
Submission received: 14 February 2023 / Revised: 27 February 2023 / Accepted: 1 March 2023 / Published: 3 March 2023
(This article belongs to the Special Issue Gas Hydrate—Unconventional Geological Energy Development)

Abstract

:
Test exploitation equipment and technology have progressed considerably in marine natural gas hydrate (NGH) exploitation, but many critical technical issues still need to be resolved before commercial production. Previous studies have proposed a non-drilling exploitation device—a self-entry exploitation device (SEED)—but reaching the NGH commercial exploitation threshold in its initial state is difficult. Consequently, we verified and evaluated some production enhancement measures to improve the exploitation system of the SEED. In this study, based on the geological data from the SHSC-4 site in the Shenhu sea and the material characteristics of the SEED, we carried out four production enhancement measures by numerical simulation. The results indicate that: (i) open-hole position adjustment can expand the contact areas between the device and NGH reservoirs; (ii) the effect of inner wall heating is limited but sufficient to achieve the goal of preventing clogging; (iii) it is necessary to select a reasonable spacing according to a combination of expected production cycle time and pressure when carrying out clustered depressurization; and (vi) when performing depressurization combined with thermal stimulation exploitation, factors such as permeability and thermal conductivity play a decisive factor in gas production.

1. Introduction

Natural gas hydrate (NGH), a new type of energy with massive reserves, clean and efficient, is an ice-like, non-stoichiometric compound of water and gas molecules formed under high-pressure and low-temperature conditions [1,2]. NGHs mainly exist in marine sediments (97%), where salts and sea mud are involved, and in terrestrial permafrost zones (3%) [3,4]. According to estimates by Kvenvolden, NGH contains 1.5 × 10¹⁶ m3 of methane worldwide [2], whose organic carbon is twice as much as the total amount of fossil energy such as oil, natural gas, and coal [5], enough to supply the world’s energy demands for the next 1000 years [6]. In recent years, climate warming and energy shortage have become severe problems in human development that cannot be ignored [7]. The above challenges will be alleviated if we achieve commercial NGH exploitation successfully.
The main gas recovery methods from the NGH reservoir include depressurization, thermal stimulation, inhibitor injection, CO2 replacement, and solid-state fluidization [8,9,10,11,12], which have been applied in the Mesoyaha region in the Soviet Union [13], the Mackenzie Delta in Canada [14,15], the North Slope of Alaska in the United States [16,17], the Nankai Trough in Japan [18,19], the Qilian Mountains permafrost, and the South China Sea in China [20,21,22,23]. It is worth noting that in the marine area, the gas production rate has exceeded 28,713 m3/d in the second depressurization exploitation in the Shenhu sea of the South China Sea [22]. However, such a capacity is still far from the commercial production (5.0 × 10⁵ m3/d) estimated by Sloan [1], which is about 1/17 of the average daily capacity threshold for commercial production, and the current marine NGH capacity is still two to three orders of magnitude away from this threshold [24]. Thus, it is high time that we seek more efficient, economic, and green approaches to enhance production.
Integrating the results of field test production, numerical simulations, and experimental results, it is now generally accepted that the depressurization method, as well as its modified schemes, may be the best way to achieve commercial production in marine areas [25]. In contrast, other methods are mainly used as auxiliary production enhancement measures or stabilization approaches, designed to increase gas production by improving the in situ decomposition efficiency of NGH. Generally, NGH decomposition is an endothermic process, so it is necessary to inject additional heat to keep the decomposition rate and stability [26,27]. In other words, if the reservoir experiences significant heat loss, particularly in the later stages of depressurization-induced NGH exploitation, the excessively low reservoir temperature could cause ice generation or NGH regeneration to clog the wellbore, thereby impeding the transport of methane gas [28]. In recent studies, it has been useful to change the depressurization strategies like stepwise depressurization [29], periodic depressurization [30], and circulating depressurization [31] to indirectly elevate reservoir temperature. Alternatively, direct heating by auxiliary thermal stimulation to raise the reservoir temperature, such as electric [32], microwave [33], electromagnetic [34], solar energy [35], geotemperature [36], and self-heating substances [37], are also verified by experimental and numerical simulation. Additionally, other ways, like auxiliary replacement stimulation using CO2, N2, or chemical reagents, can be injected to promote the gas production rate under depressurization production [38,39].
Apart from that, expanding NGH decomposition areas has become a current research hotspot in recent years. Nowadays, the NGH field tests are mainly based on vertical and horizontal wells. Under vertical well conditions, well-type transformation [40], expanding the wellbore diameter [41], or borehole reaming [42] can enhance the production capacity to some extent, but not enough to make a quantitative breakthrough. Therefore, applying horizontal wells solutions that have been well used in conventional field development may be one of the effective approaches. Wu et al. analyzed potential NGH stimulation technologies and suggested that complex structure wells represented by directional wells (especially horizontal wells) and multi-branch wells will play an essential role in the future commercialization of NGH [24]. Indeed, numerous indoor experiments and numerical simulations have also shown that horizontal wells help increase continuous gas production cycles and gas recovery compared to vertical wells [43,44,45,46,47,48]. The ability of horizontal wells to significantly promote gas production is mainly attributed to their wide-area surface effect [49]. Under the depressurization production process, horizontal wells have larger contact areas between the wellbore and NGH reservoir, enlarging the NGH decomposition surface and thereby allowing the amount of NGH involved in decomposition to multiply. This technology was first applied in China’s second exploitation in 2020, but in terms of production increase results, the production capacity only expanded 5.6 times from 5151 m3/d to 28,740 m3/d compared to the first single vertical well in 2017 [21,22]. The results of this comparison show that the ratio of horizontal well to vertical well traversing the reservoir length is close to 30 times in these two tests, but the rate of increase in gas production is not proportional to its rate of increase in length (Figure 1). Other complex structure wells, mainly multi-branch and cluster wells, are still in the stage of theoretical research and experimental proof. The correlation of main parameters such as branch length, spacing, effective total length, angle, diameter, and reservoir properties to various gas production indicators have been explored in detail [7,49,50,51,52,53,54]. Nevertheless, such well types are still far from being used in the field due to the high construction difficulty.
In addition to the insufficient gas production capacity, the current marine field tests suggest these problems: (i) Drilling construction, which requires the drilling platform to maintain its position under complex deep-sea conditions and drills through soft and collapse-prone reservoirs with a kilometer-long drilling pipe system in tow, is challenging in terms of current technologies [55,56]. (ii) Long-term exploitation, which relates to the permeability of the NGH reservoir, the sand control devices in the wellbore, and the strength and stiffness of the casing as well, has been improved in the project using hydraulic fracturing, novel sand control devices, and horizontal wells. However, no revolutionary increase in production capacity has been seen, and the maximum extraction cycle lasts only 60 d [57,58,59,60]. (iii) High construction cost, caused by the prohibitive cost of deep-sea drilling platforms, and combined with the serious issues mentioned above, the cost of extraction far exceeds the value of the gas recovered [61,62,63].
Generally, the NGH reservoir is characterized by “shallow non-diagenetic sediments in deep water”. Conventional oil and gas resources are usually found in deep rock formations on land or in the ocean, where drilling is the only viable method, but the characteristics of NGH deposits in marine areas make traditional drilling methods no longer applicable. Some researchers have recently proposed non-drilling modes to optimize or replace wellbore platforms. Li et al. proposed a capping and pressure-reducing device for shallow or surface NGH exploitation [64]; Xu et al. designed the cutter-suction method, which uses a mine car to break NGH into particles by cutter-head, and then the particles are sucked into the pipe and carried to the mid-transferring barn [65]. In addition, a few studies have proposed various tools for solid-state fluidization methods, such as the umbrella-like tool, the broaching tube, and the jet-breaking tool [66,67,68,69]. Wu et al. drew on the torpedo anchor penetration principle, giving full play to its simple installation and low-cost features, and designed a novel self-entry exploitation device (SEED), which has great potential to facilitate the advancement of NGH exploitation [70]. In previous studies, Wu et al. and Ye et al. have demonstrated that the SEED can be successfully penetrated into the NGH reservoir and used for basic depressurization exploitation or as a platform for heat injection [70,71]. However, this is still some distance away from the threshold of commercialization by its initial state.
This work is a continuous study of the SEED to verify the feasibility of its production enhancement measures. We hope to further improve the SEED-based exploitation system, with a view to providing a new way of thinking for the commercial production of NGH, which is of great significance in promoting the exploitation of the NGH reservoirs in the future. Firstly, the basic principles of the SEED as well as its production enhancement measures are introduced briefly in Section 2. Then, taking the SHSC-4 site in the Shenhu sea as an example, we established the exploitation models by CMG STARS and designed 26 cases in total to analyze the production results of different production enhancement measures in Section 3 and Section 4. Finally, the paper ends with a summary and suggestions in Section 5.

2. The Self-Entry Exploitation Device

2.1. Basic Production Process

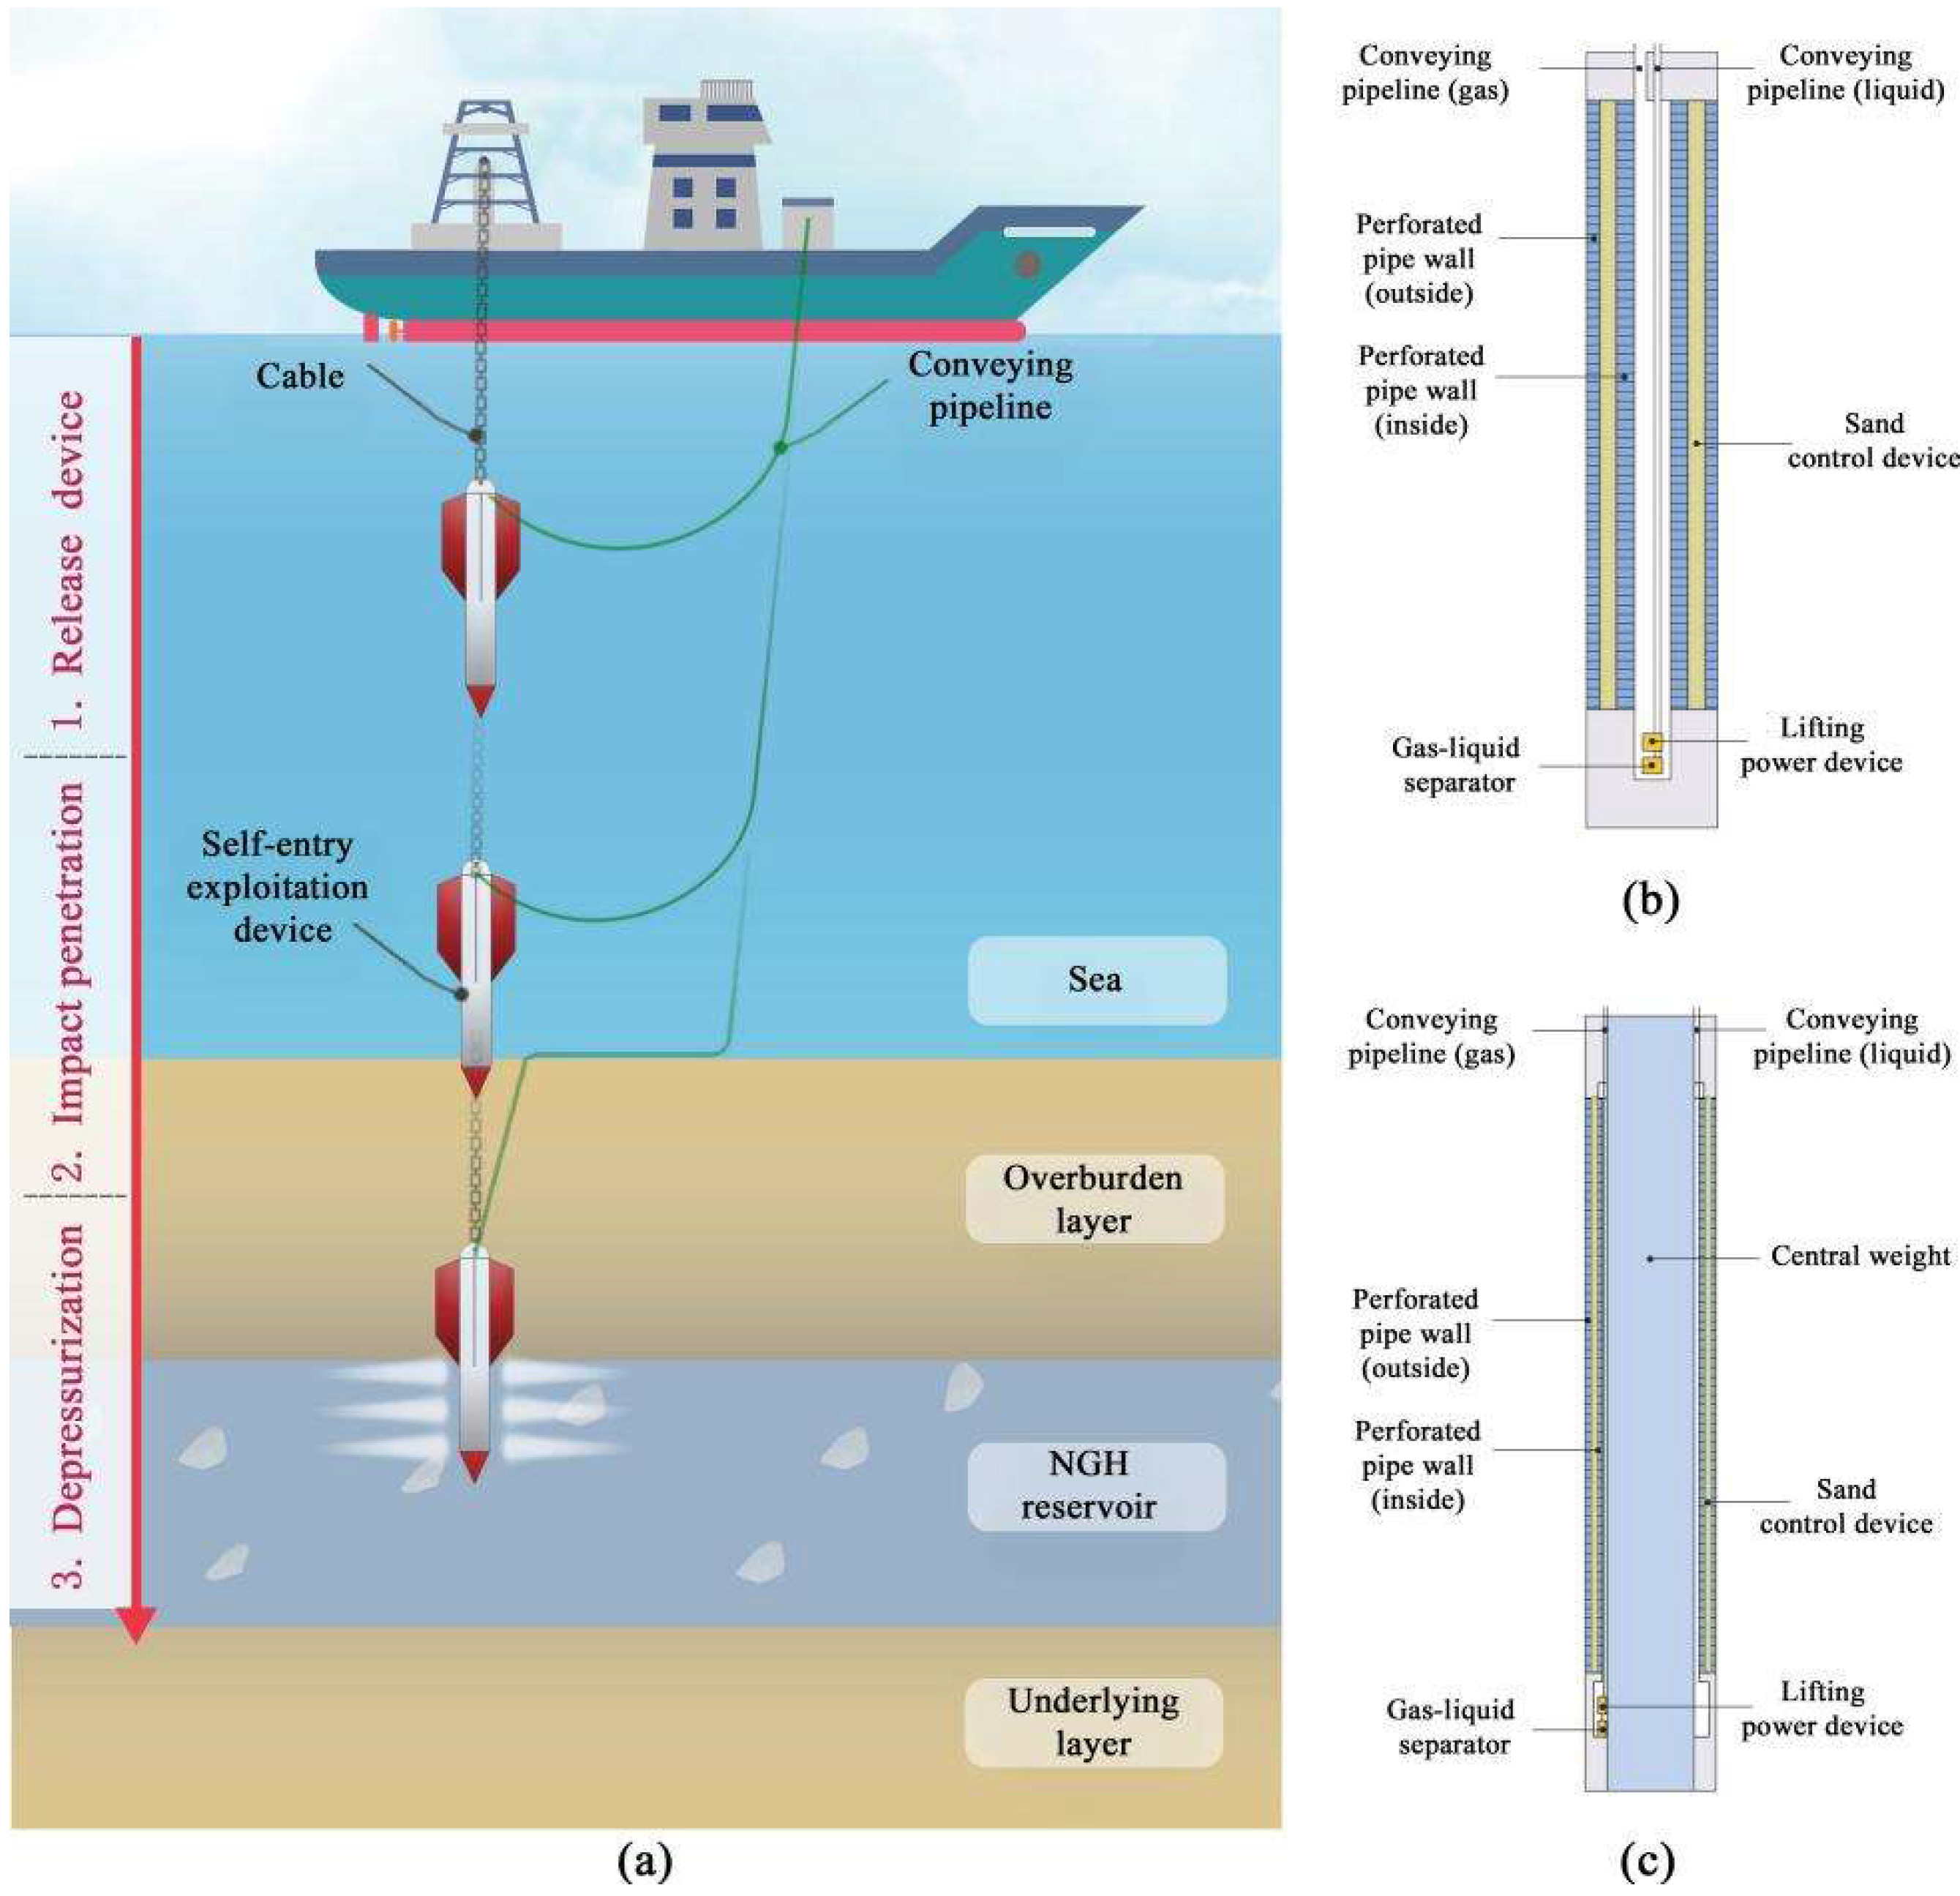
As shown in Figure 2, the SEED is released at a certain distance on the seabed, which carries the gas–liquid lifting system, sand control device, central weight, and other equipment to penetrate the NGH reservoir. The internal structure of the SEED can be divided into two modes according to various reservoirs. Among them, the geometric size of mode II is much bigger than mode I due to the central weight, which increases the overall quality of the SEED, thereby allowing it to penetrate into harder or deeper reservoirs. The main internal parts of the SEED are as follows:
  • Gas–liquid lifting system comprises conveying pipelines (gas and liquid), a lifting power device, and a gas–liquid separator. With one end attached to the cavity and the other output through the pipelines, it can elevate the liquid and gas within the cavity to lower its internal pressure, which lowers the pressure of surrounding reservoirs, thereby driving the NGH decomposition. Then, natural gas and water enter the cavity through the sand control device due to the pressure difference and lift them to offshore platforms.
  • The sand control device locates between two perforated pipe walls, which can be devised as a sand-control screen, a sand-control sieve tube, a mechanical sieve tube, a gravel sand-control layer, or a flexible fabric sand-control material layer. It can cover the inner wall of the open hole wall and filter the liquid and gas into the cavity while filtering mud and sand.
  • Central weight can greatly enhance the overall structural strength and weight of the SEED, which is chosen to use according to the actual situation.
After reaching the reservoir, the built-in equipment starts up and performs depressurization exploitation in the NGH reservoir. Finally, when the gas production efficiency decreases to a low value, the cable is able pull the SEED out to realize recovery or transfer it to a new area for further exploitation.

2.2. Feasibility Analysis

The SEED penetration method fully draws on the torpedo anchor and gravity sampler:
  • Torpedo anchors have been widely used in ocean engineering, for instance, the Marlim oilfield and the Albacora oilfield in Brazil (penetration depth is 1.5~2.4 times of anchor length) and the Gjøa oilfield in Norway (penetration depth is 1.9~2.4 times of anchor length) [72,73]. Therefore, the maximum length of the new device only needs to reach about 100 m to cover most hydrate reservoirs.
  • Gravity samplers can collect columnar samples of seabed sediments, which has been widely used in NGH investigation [74,75]. The SEED has a similar penetration principle to the gravity samplers and owns a large tonnage and a more streamlined shape, making penetrating the reservoir easier.
How does SEED promote production efficiency compared to conventional wellbores? It is based on the following two points:
  • Conventional wellbores are mostly made of plain concrete, while the SEED is composed of steel materials, allowing it to have higher strength and stiffness to withstand greater pressure reduction and promote the in situ decomposition rate of NGH.
  • The casing diameter of the conventional wellbore in the reservoir section is usually around Ø220.5 mm. In order to further expand this range, complex wellbore expansion technology is required [42]. For SEED, the larger the diameter, the heavier the weight, which means it can penetrate into the reservoir easier. In addition, whether it is wellbores or the SEED, having a larger diameter in the production section means a larger contact area with the reservoirs, which can expand the NGH dissociation area.

2.3. Previous Preliminary Findings

The SEED is proposed to be an innovation from 0 to 1, for which the authors have conducted a preliminary feasibility analysis, and some of the main findings in previous studies are as follows [41,62,70,71]:
  • Simulation by coupled Eulerian–Lagrangian method [76], the penetration process of the SEED lasts about 4 s in Shenhu reservoir, which takes a short time from impacting the seabed to reaching the NGH reservoir. In addition, the SEED is designed to penetrate the depth range of 20~370 m.
  • The SEED consists of a prefabricated steel structure with higher strength and rigidity to achieve greater pressure drop (production pressure can reach 1 MPa), which greatly increases the decomposition rate of surrounding NGH.
  • The SEED diameter in the reservoir section is larger than the conventional wellbore diameter, further expanding the NGH decomposition area. Moreover, the diameter d = 1.5 m is the most cost-effective value. As the diameter enlarges further, the benefits start to decrease. The device can also be used as a heat injection platform (heat transfer device) in conjunction with the SEED or existing wellbores for combined depressurization and thermal stimulation to achieve rapid reheat of the low-temperature zone of the reservoir.

2.4. Production Enhancement Measures

Overall, the SEED allows for greater depressurization and a larger unit diameter than conventional wellbores, which promotes the rate of in situ decomposition of NGH and expands the contact area between the SEED and the reservoir, allowing for some enhancement in production. However, this is still some distance away from the threshold of commercialization, plus the single depressurization method also faces many problems, such as an exceedingly rapid loss of reservoir temperature and secondary generation of NGH. Consequently, it is necessary to apply some production enhancement measures. Based on the large diameter of the device and the low production pressure of the depressurization model, the following content would use four measures (Figure 3) to study and prefer the best solution.

3. Exploitation Model Description

3.1. Numerical Model

In this study, CMG STARS, which can deal with the change of phase state and chemical reaction kinetics [77], was used to simulate the formation and decomposition of NGH. Many studies have certified its feasibility to describe the production behavior of NGH [16,27,49,78,79,80]. A kinetic reaction model and stress field response characteristics were used in the model operation to perform NGH formation and decomposition. Additionally, The apparent decomposition rate constant factor and decomposition activation energy were introduced based on the Kim–Bishnoi kinetic formation [81]:
d c h d t D e c a y = A exp ( E R T ) ( ϕ S w ρ w ) ( ϕ S h ρ h y i p g ) ( 1 1 K ( P , T ) )
d c h d t F o r m = B ( 1 + ϕ S h ) exp ( Δ E R T ) ( ϕ S w ρ w ) ( 1 K ( P , T ) 1 )
where Formula (1) represents the decomposition of NGH, and Formula (2) represents the formation of NGH. Where ch is NGH amount, mol; t is time, s; A and B are the kinetic rate constants of NGH decomposition and formation, respectively; E is the activation energy, J; R is the ideal gas constant; ϕ is the porosity; Sw is the water saturation; Sh is the NGH saturation; ρw is the density of water, kg/m3; ρh is the density of the NGH, kg/m3; pg is the gas pressure, KPa; yi is the partial pressure coefficient; K is a function of pressure P, and temperature T, describing NGH equilibrium state.
The model of NGH exploitation considered the following main conditions and factors:
  • Three phases (gas phase, liquid phase, and solid phase) and three components (dissociation gas component, liquid component, and NGH component) were considered, where NGH was treated as a solid phase existing in porous media in the form of spherical particles [49].
  • The reservoir was considered homogeneous, including porosity, permeability, etc. In the NGH reservoir, heat conduction, heat convection, ice generation, and endothermic NGH dissociation were considered.
  • The dissociated NGH flow is a single-phase compressible gas flow that satisfies Darcy’s law. The sediment pore capillary force was calculated using the Van Genuchten formula [82]. The relationship between effective permeability and porosity was established according to the Carmen Kozeny model (formulas are shown in Table 1) [83].

3.2. Hydrates in the Shenhu Area

The exploitation model was constructed based on the geological data from the SHSC-4 site in the Shenhu area of the South China Sea [84] (Figure 4), where the China geological survey carried out the first trial production in 2017 [21]. According to the logging interpretation and core analysis results, the NGH accumulations in this site are similar to Class 1 deposits, which comprise the NGH-bearing layer (NBL) and an underlying two-phase fluid layer, containing free gas and water [85]. The NBL is distributed between 201~236 m below the seafloor and there is associated free gas below. The mixing layer (ML), with fissures being filled with solid NHG, free gas, and liquid water, is located from 236 to 251 m. The gas mainly gathers in the free gas layer (FGL) from 251 to 278 m. The reservoir lithology is clayey silt, whereas the mean effective porosity is 35%, the mean NGH saturation is 34%, and the mean permeability is 2.9 × 10⁻³ μm2.
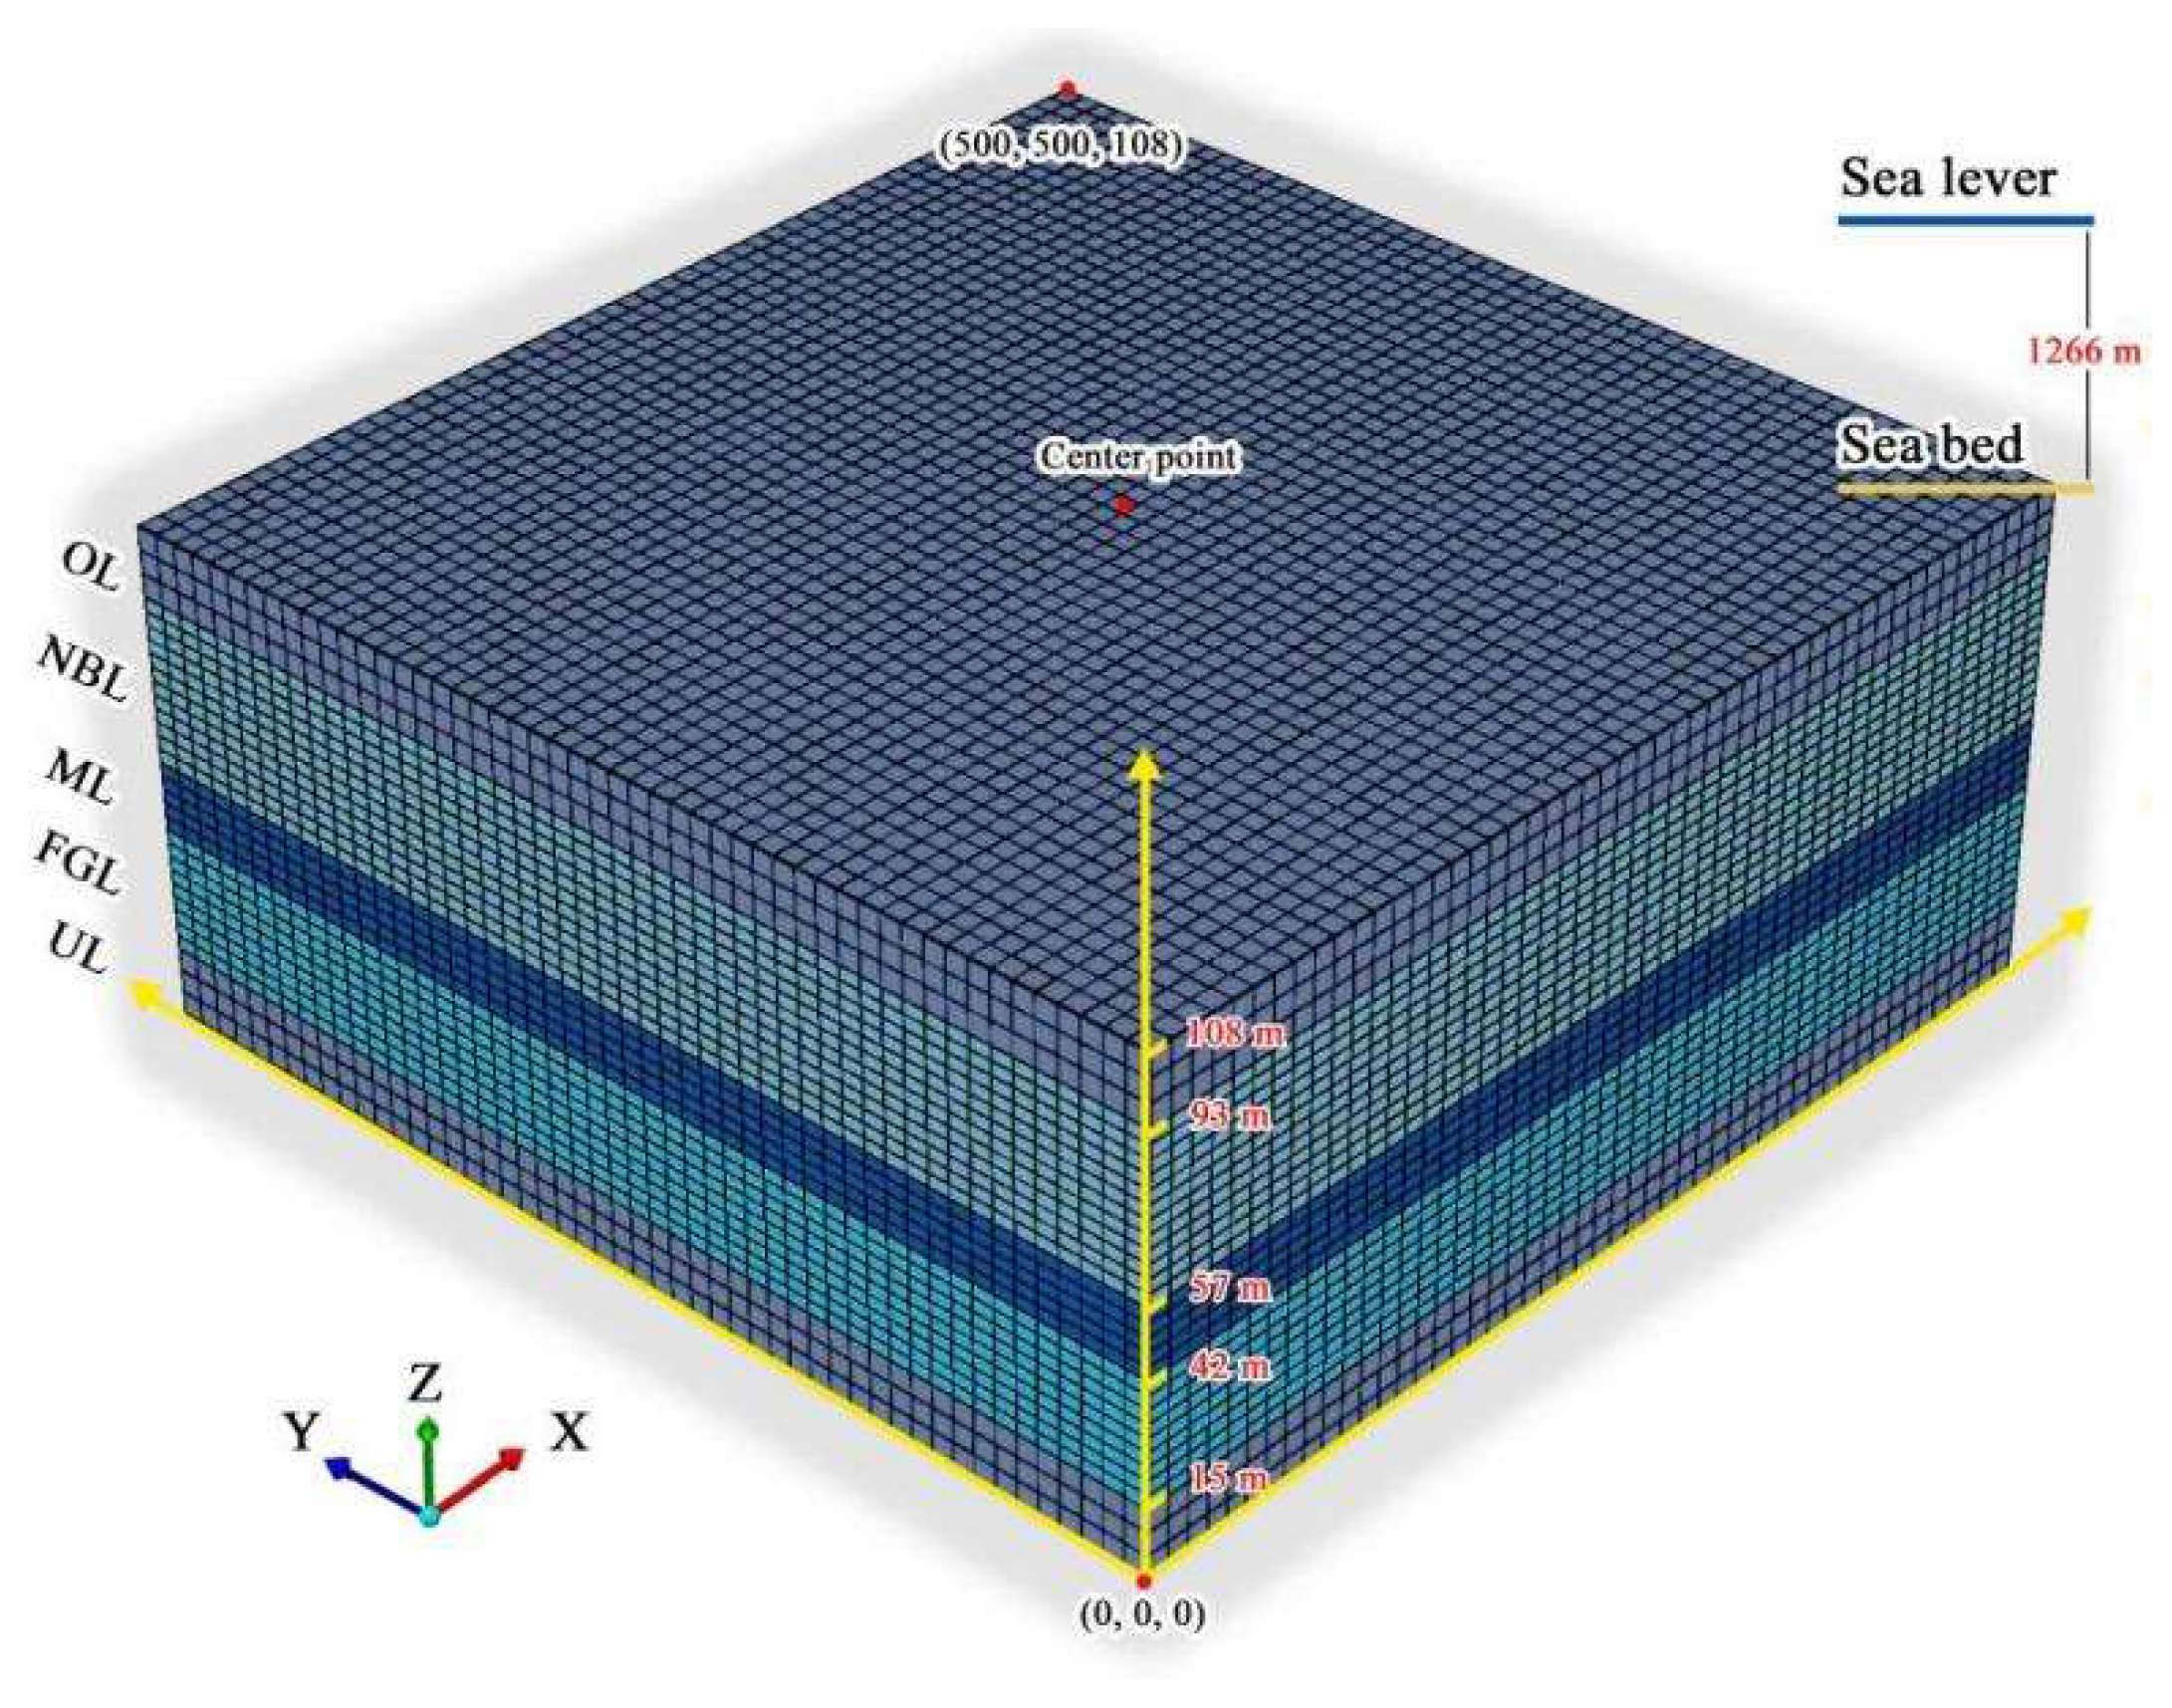
The model (Figure 5) is divided into the overburden layer (OL), NBL, MX, FGL, and underlying layer (UL) from top to bottom, corresponding to thicknesses of 15 m, 36 m, 15 m, 27 m, and 15 m, respectively. The size of the model is 500 m × 500 m × 108 m, and the specific reservoir parameters are provided in Table 1. It is worth mentioning that the feasibility of the simulation method in this area has been verified in previous studies, and better fitting results have been obtained [26]. Thus, no relevant validation is performed in this study.
Table 1. Main parameters of the reservoir model.
ParameterValueUnit
ThicknessOL and UL: 15; NBL: 36; ML: 15; FGL: 27m
PorosityOL and UL: 0.3; NBL: 0.35; ML: 0.33; FGL: 0.32/
Initial
permeability
OL and UL: kox = koy = 2, koz = 1; NBL: kox = koy = 2.9, koz = 1.45
ML: kox = koy = 1.5, koz = 0.75; FGL: kox = koy = 7.4, koz = 3.7
×10−3 μm2
Initial
saturation
OL and UL: Sh = 0, Sw = 1, Sg = 0; NBL: Sh = 0.34, Sw = 0.66, Sg = 0
ML: Sh = 0.31, Sw = 0.526, Sg = 0.164; FGL: Sh = 0, Sw = 0.922, Sg = 0.078
/
NGH molar mass0.119543kg/gmole
NGH density919.7kg/m3
Seawater density1020kg/m3
Thermal conductivityRock: 2.7; Water: 0.69; NGH: 0.5W/m/K
Formation temperatureT = 14.475 + 0.03z, z is the depth (m)°C
Formation pressureP = 1.469 + 0.01z, z is the depth (m)MPa
Phase balance relation S g + S w + S h = 1
Permeability
variation model [83]
k = k o ( ϕ ϕ o ) ε [ ( 1 ϕ o ) ( 1 ϕ ) ] 2
Porosity variation model ϕ = ϕ o ( 1 S i )
Capillary force model [82] P c = P c o [ ( S * ) 1 λ 1 ] 1 λ S * = S w S w r 1 S w r S g r
In the table, Sg, Sw, Sh, and Si are the gas, water, NGH, and ice saturation; ϕ and ϕo are the effective porosity and initial porosity; k and ko are the effective permeability and initial permeability, ×10−3 μm2; ε is the experience index; Pc is the capillary force, N; Pco is the capillary force endpoint value, N; λ is the Van Genuchten parameter; Swr and Sgr are the residual water saturation and the residual gas saturation.

4. Cases Design and Results

In the exploitation model developed, we first set up two control cases and then distinguished two production groups (single SEED and cluster SEEDs) for enhancement studies. Based on the findings of previous studies, d = 1.5 m was used as the diameter of the SEED [41]. In addition, the production pressures (P) were set at 4 MPa and 1 MPa to differentiate the application of the different schemes under high and low pressure conditions. In the single SEED group, open-hole position adjustment and inner wall heating measures were used to improve the production of a single SEED. In the cluster SEEDs groups, clustered depressurization and depressurization combined thermal stimulation were employed. The production cycle was set to 1000 d to explore long-term production results.

4.1. Control Group

Table 2 shows the parameters of a single SEED in the model as a control case. The SEED is placed in the center of the model domain, and the production section (opening position) covers all NBL. Usually, conventional wellbores are mostly composed of plain concrete, which has low strength and can hardly withstand such a large pressure difference of P = 1 MPa. The SEED, on the other hand, is expected to achieve this production pressure because of the material properties of its steel structure.
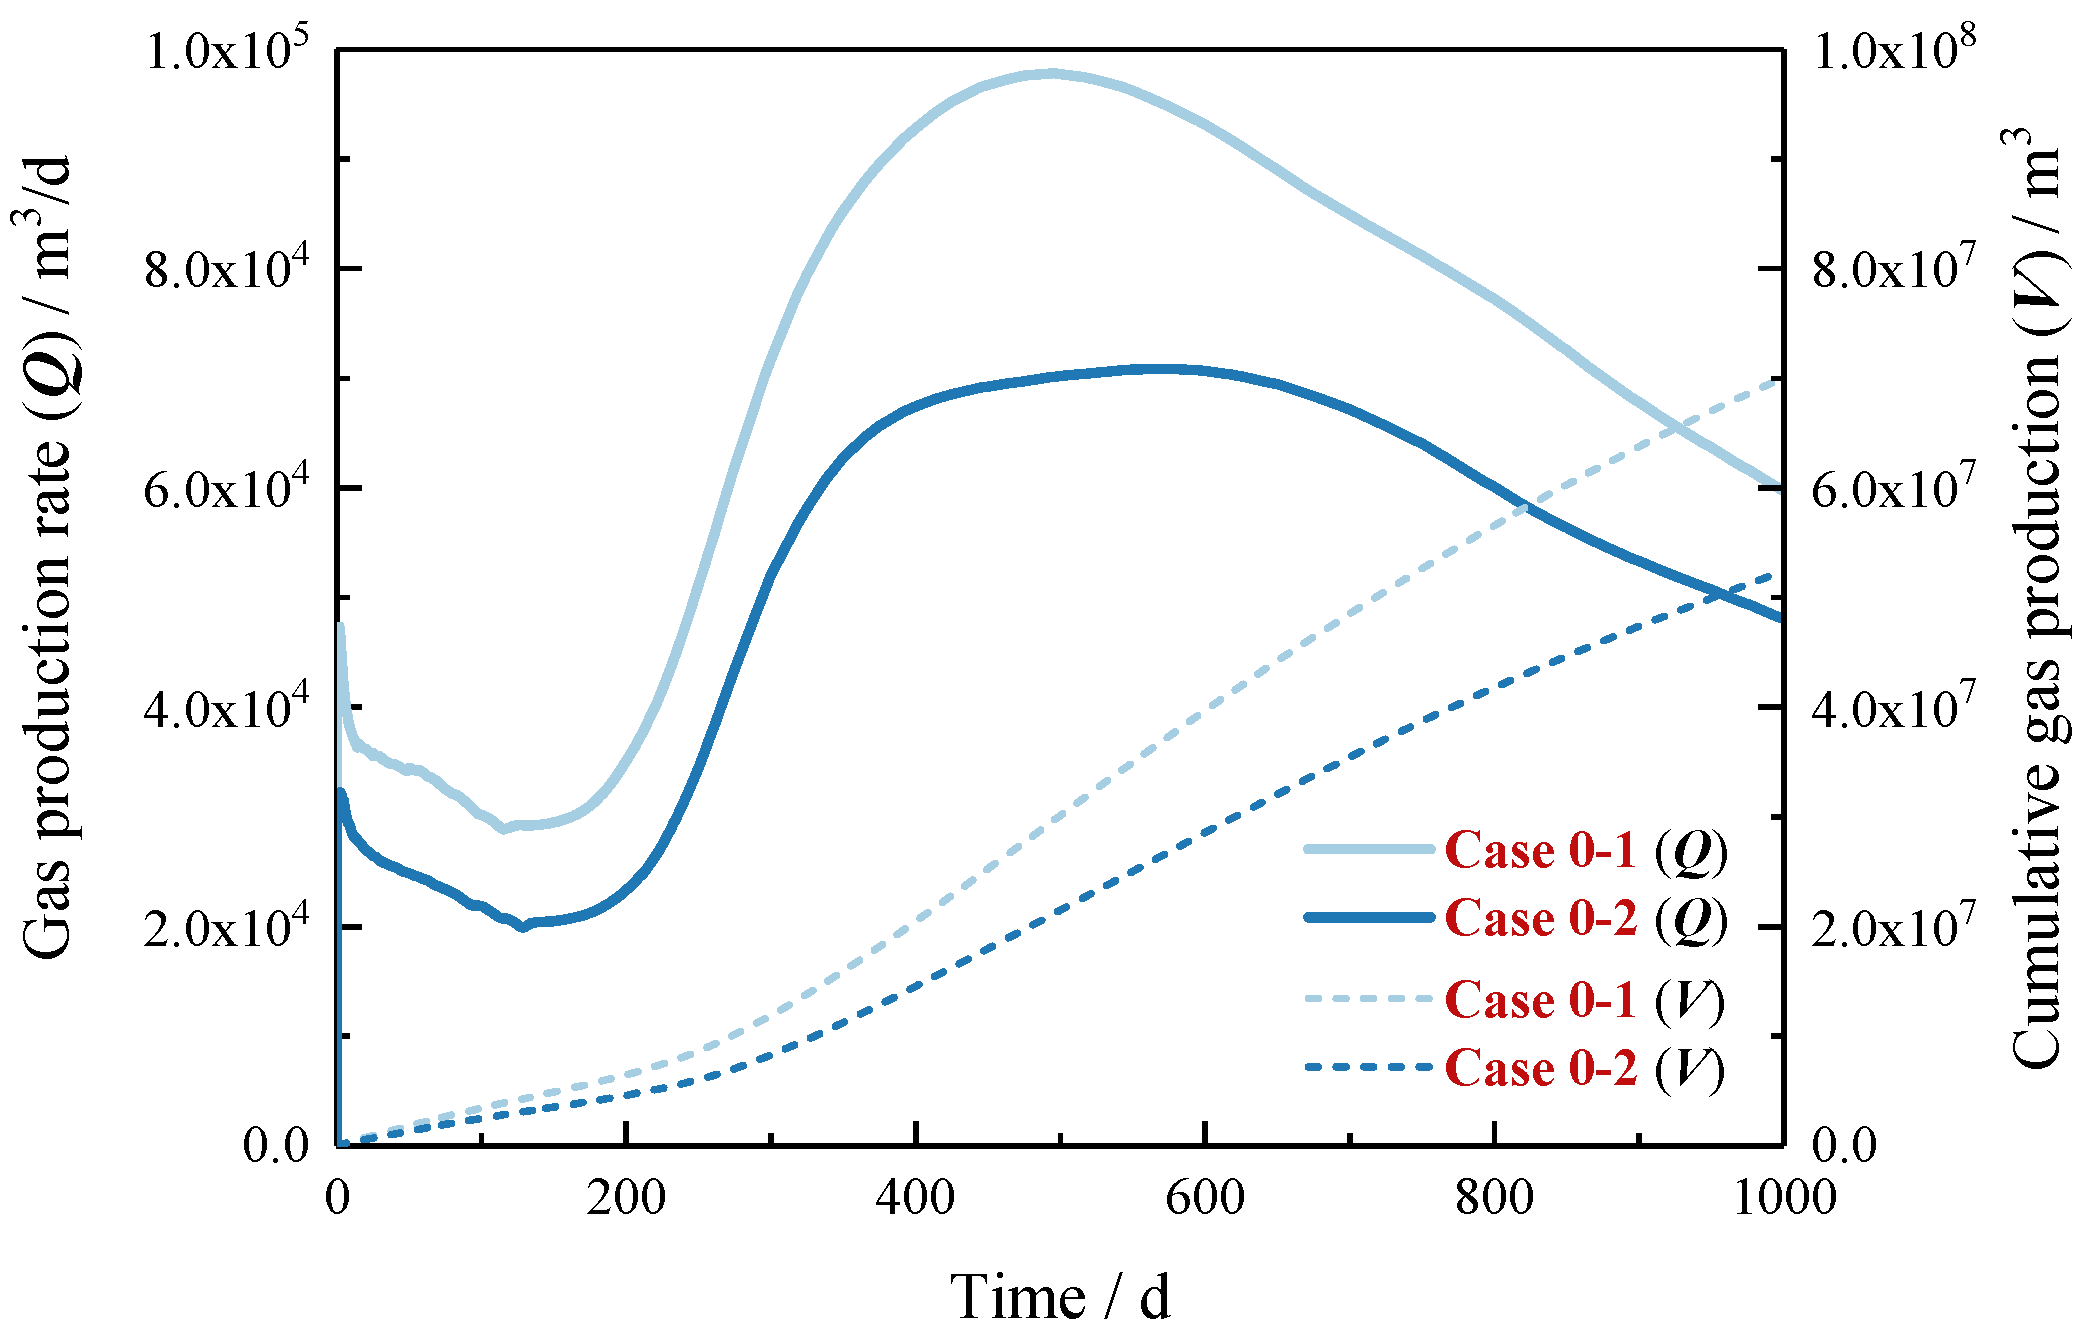
Figure 6 displays the gas production rate (Q) and cumulative gas production (V) of P = 1 MPa and P = 4 MPa. In about the first 200 days, Q gradually decreases with a slight oscillation. This is because: (i) there was a large amount of free gas in the initial state of the reservoir (ML and FGL) and the free gas near the SEED was quickly absorbed, decreasing gas production rate; thus, the primary source of gas production in this section is the free gas in the original reservoir, and (ii) the reservoir pressure around SEED decreased rapidly, resulting in the rapid decomposition and heat absorption of NGH nearby, which reduced the temperature in the decomposition front and could not be replenished in time. As a result, ice generation and NGH secondary generation occurred, resulting in curve oscillation. After that, with the production, the pressure drop began to spread in the reservoir, the Q curve began to rise, and the NGH decomposition caused by pressure drive was the primary source of gas production. Finally, the propagation range of pressure drop is limited, causing the NGH decomposition front to fail to continue forward further, and the Q curve began to decline.
Moreover, it can be clearly seen that production pressure has a significant influence on the effect of gas production. The lower the production pressure, the greater the drive for NGH decomposition. In addition, after 500 d, the rate of Q decline in Case 0–1 is greater than that in Case 0–2. This is because the heat transferred from the surrounding environment is less than the heat absorbed by the NGH decomposition, and the excessive decrease in reservoir temperature may lead to secondary NGH formation and ice generation, blocking the seepage channels of the reservoir. Thus, it is necessary to take some supplementary heat measures under low pressure conditions.

4.2. Single Exploitation Mode

4.2.1. Open-Hole Position Adjustment

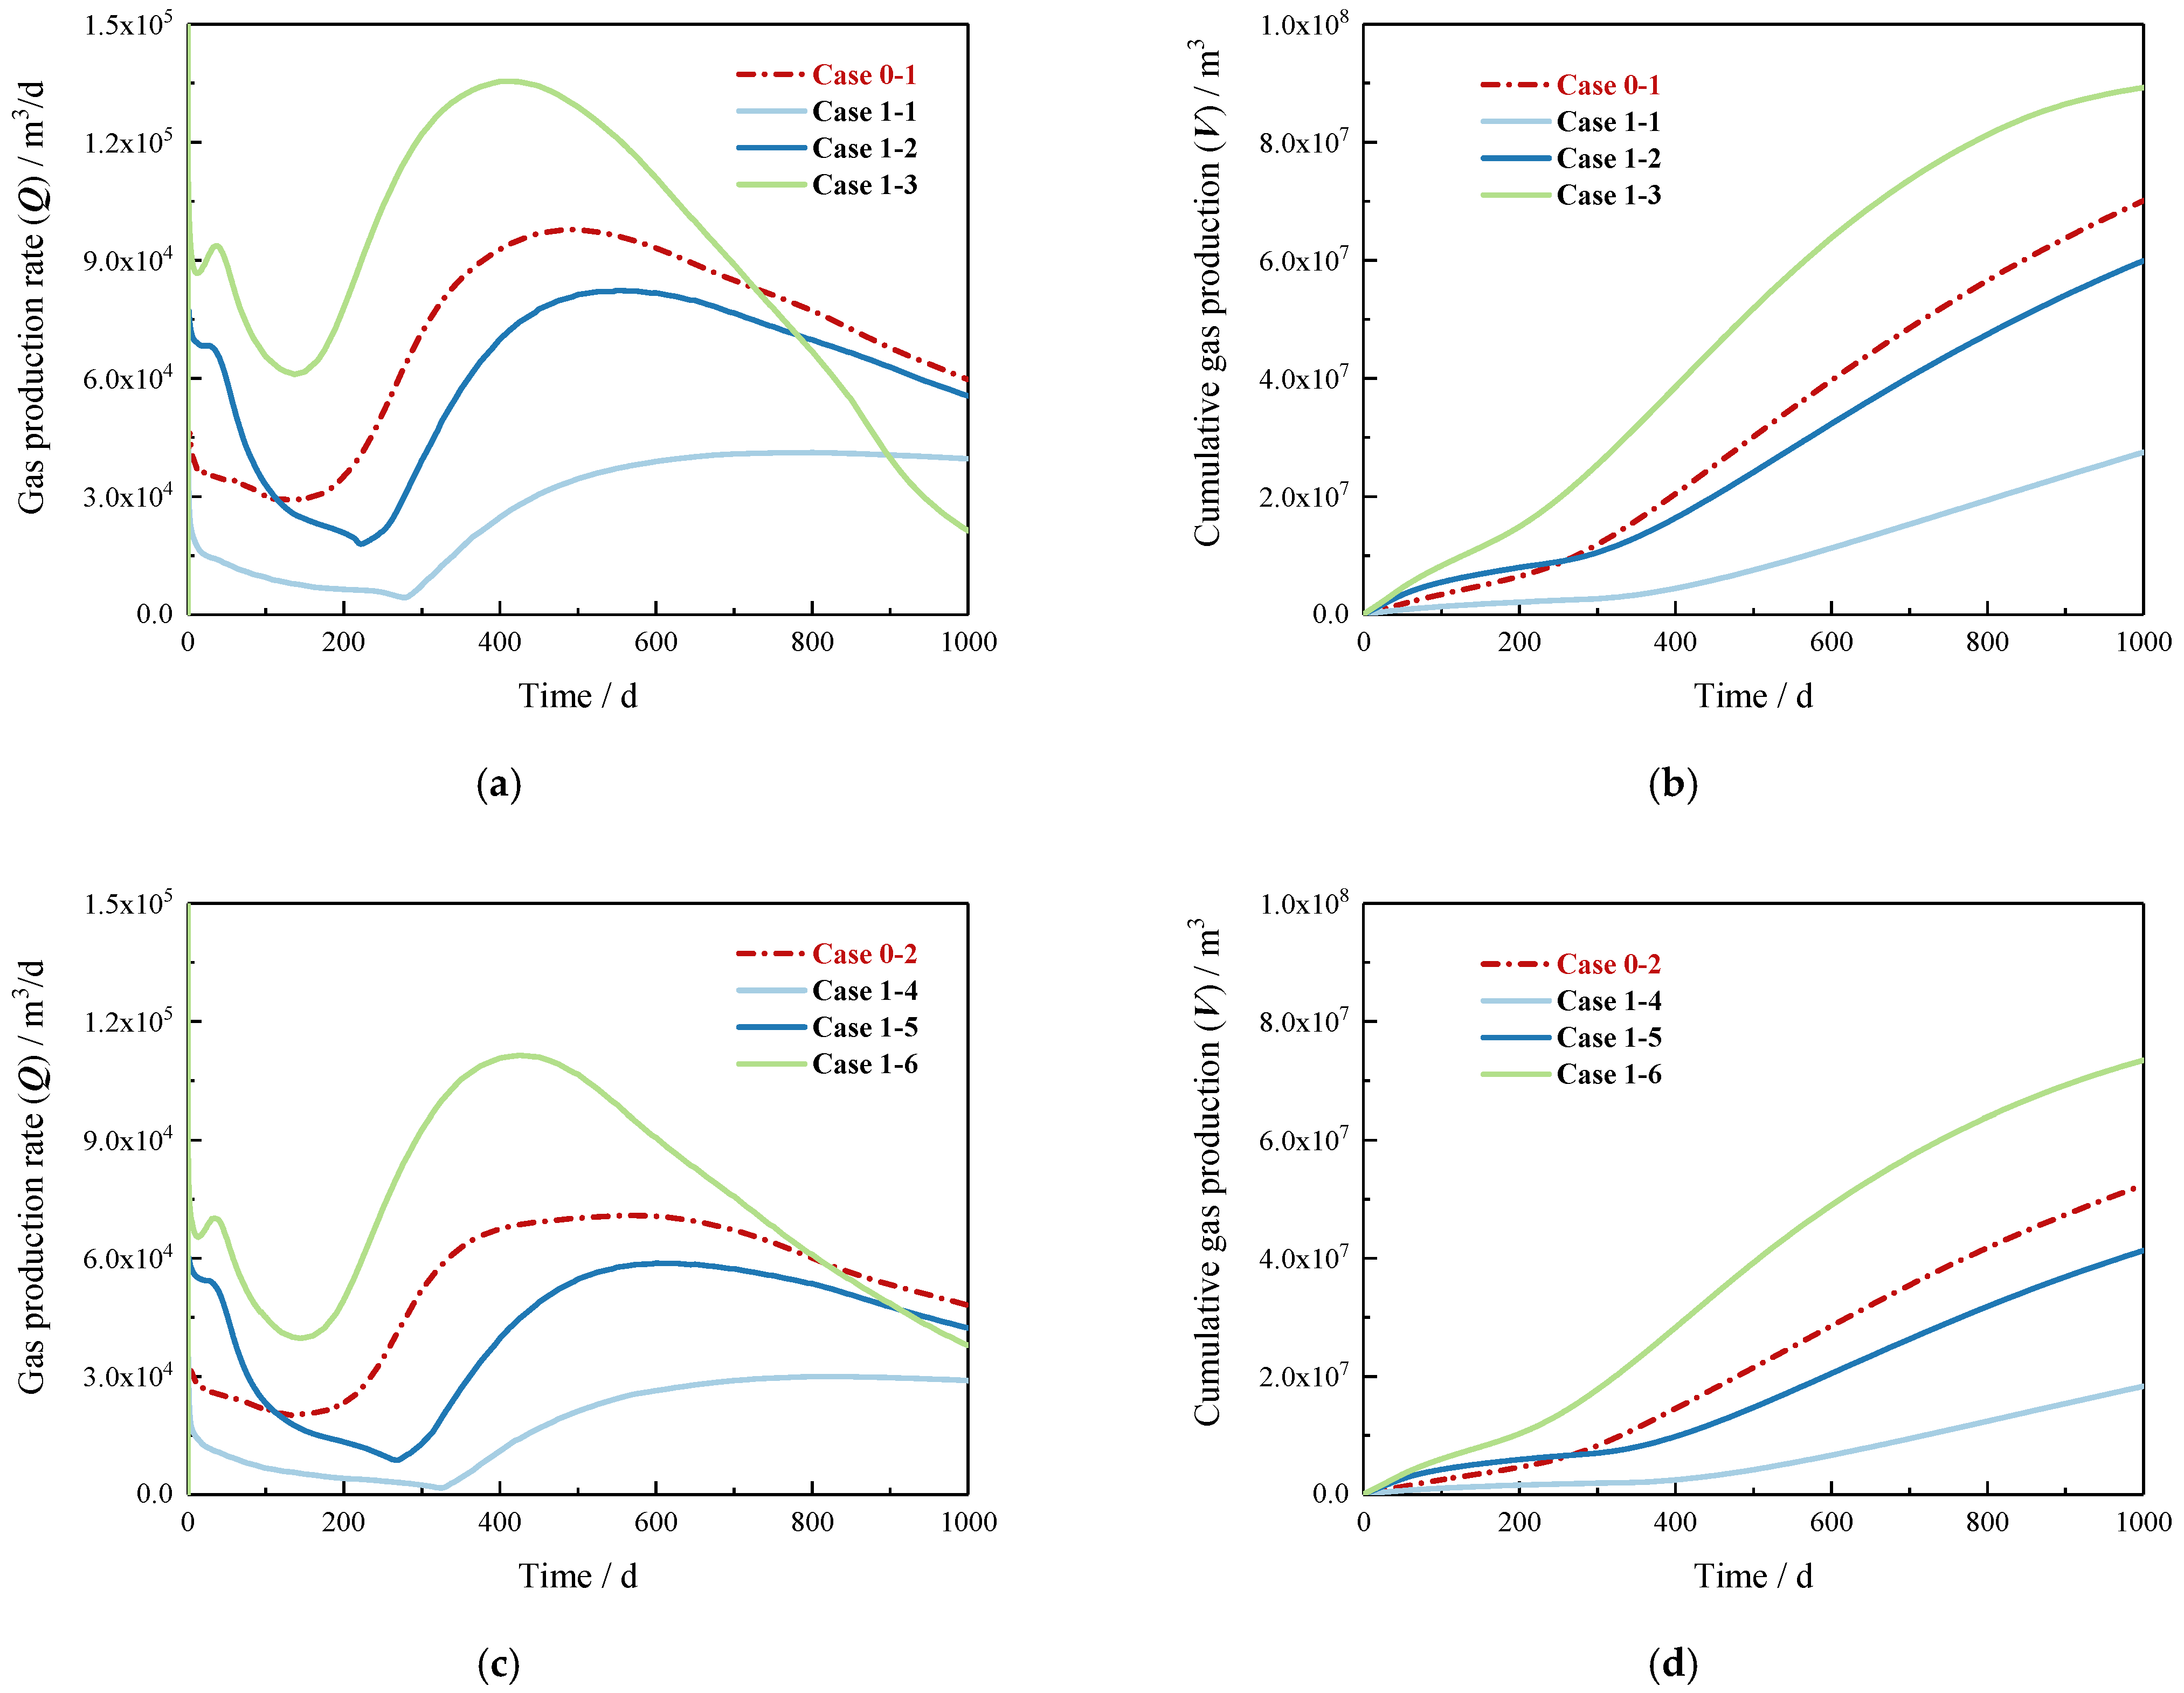
In general, reservoir characteristics near the production section, especially permeability, porosity, and NGH saturation, directly affect the transfer rate at which methane gas from distant NGH decomposition enters the device. Therefore, it is crucial to choose the right location for the open-hole position. As shown in Table 3, holes were opened in the NGH reservoir (NBL, ML, and FGL) separately as well as simultaneously for a total of eight cases.
The simulations to obtain the gas production at the location of the 1000 d exploitation are shown in Figure 7. In the early production stage, the Q of Case 1–3 and Case 1–6 are larger than the other cases, indicating that for short-term production, increasing the contact area between the unit and the reservoir can effectively expand the decomposition range of NGH. The worst results are obtained by separating the open-hole in the ML (Case 1–1 and Case 1–4), mainly due to the permeability of the ML and the low content of NGH and free gas. The Q of Case 1–2 and Case 1–5, which separate the open-hole in the FGL, perform well when production starts but fail to sustain higher Q. This is because the FGL contains a large amount of free gas and massive methane gas flows into the device without the need for NGH decomposition at the beginning. Overall, it can be seen that the V of NBL, ML, and FGL with simultaneous openings, is larger than that of single-layer openings under both high and low pressure conditions. Consequently, it is recommended that all reservoirs be open-hole exploited simultaneously for the SEED. As for the conventional wellbore, it is generally considered more cost-effective to drill into 2/3 of the NGH reservoir due to its drilling difficulty [7].

4.2.2. Inner Wall Heating

NGH dissociation is an endothermic process, so excessive gas production may induce ice formation and NGH regeneration, which block the flow paths within sediments [26]. Compared to conventional wellbores, the SEED is made of steel, which is more conducive to heat transfer as a way to mitigate related problems. The SEED arrangement in the electrically heated model is the same as the control group, with the heating site being the open-hole section. In order to study the variation of gas production under different heating power (2 kW, 4 kW, and 6 kW), eight cases were established (Table 4).
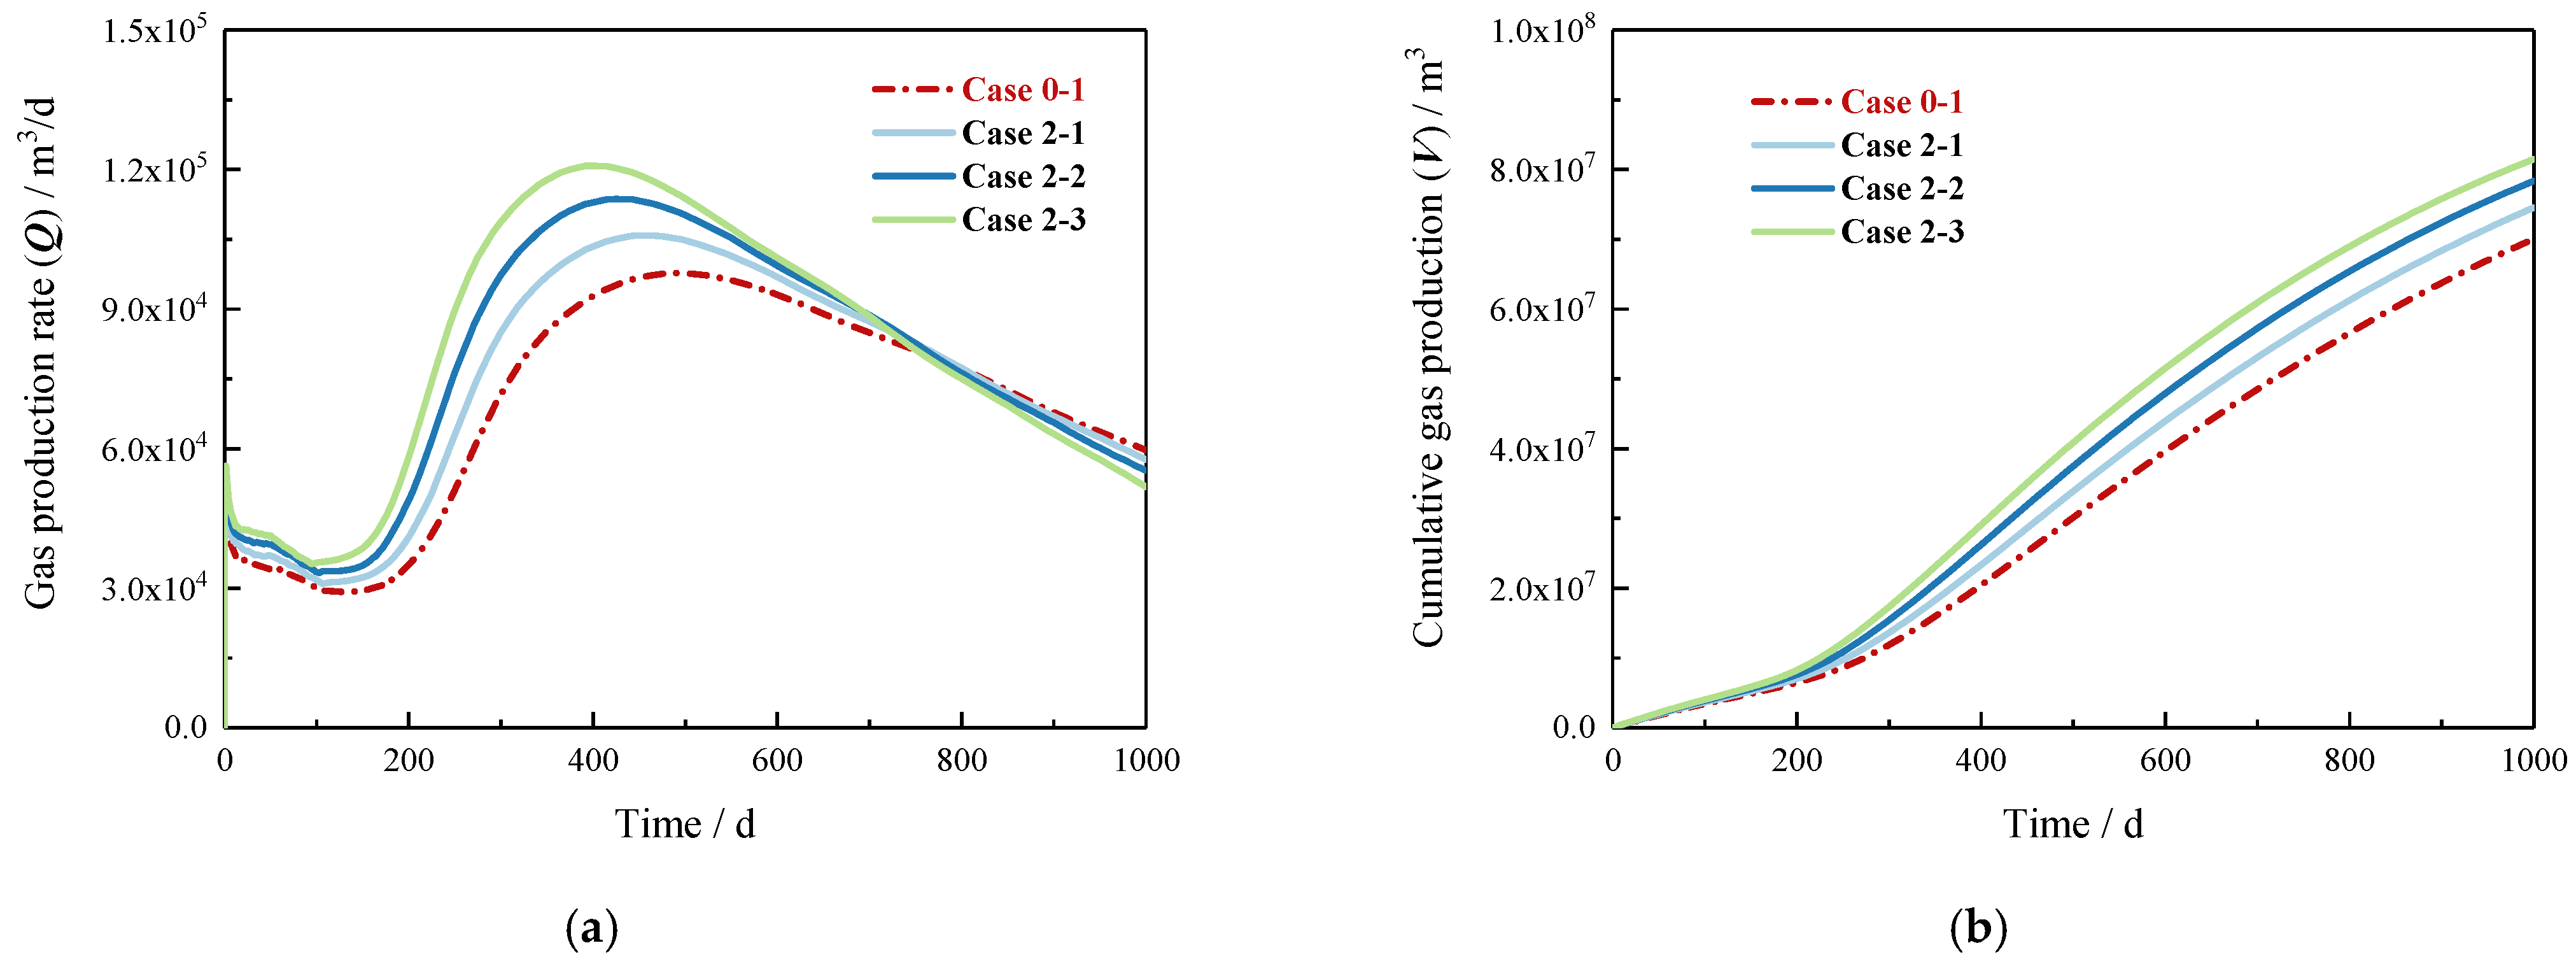
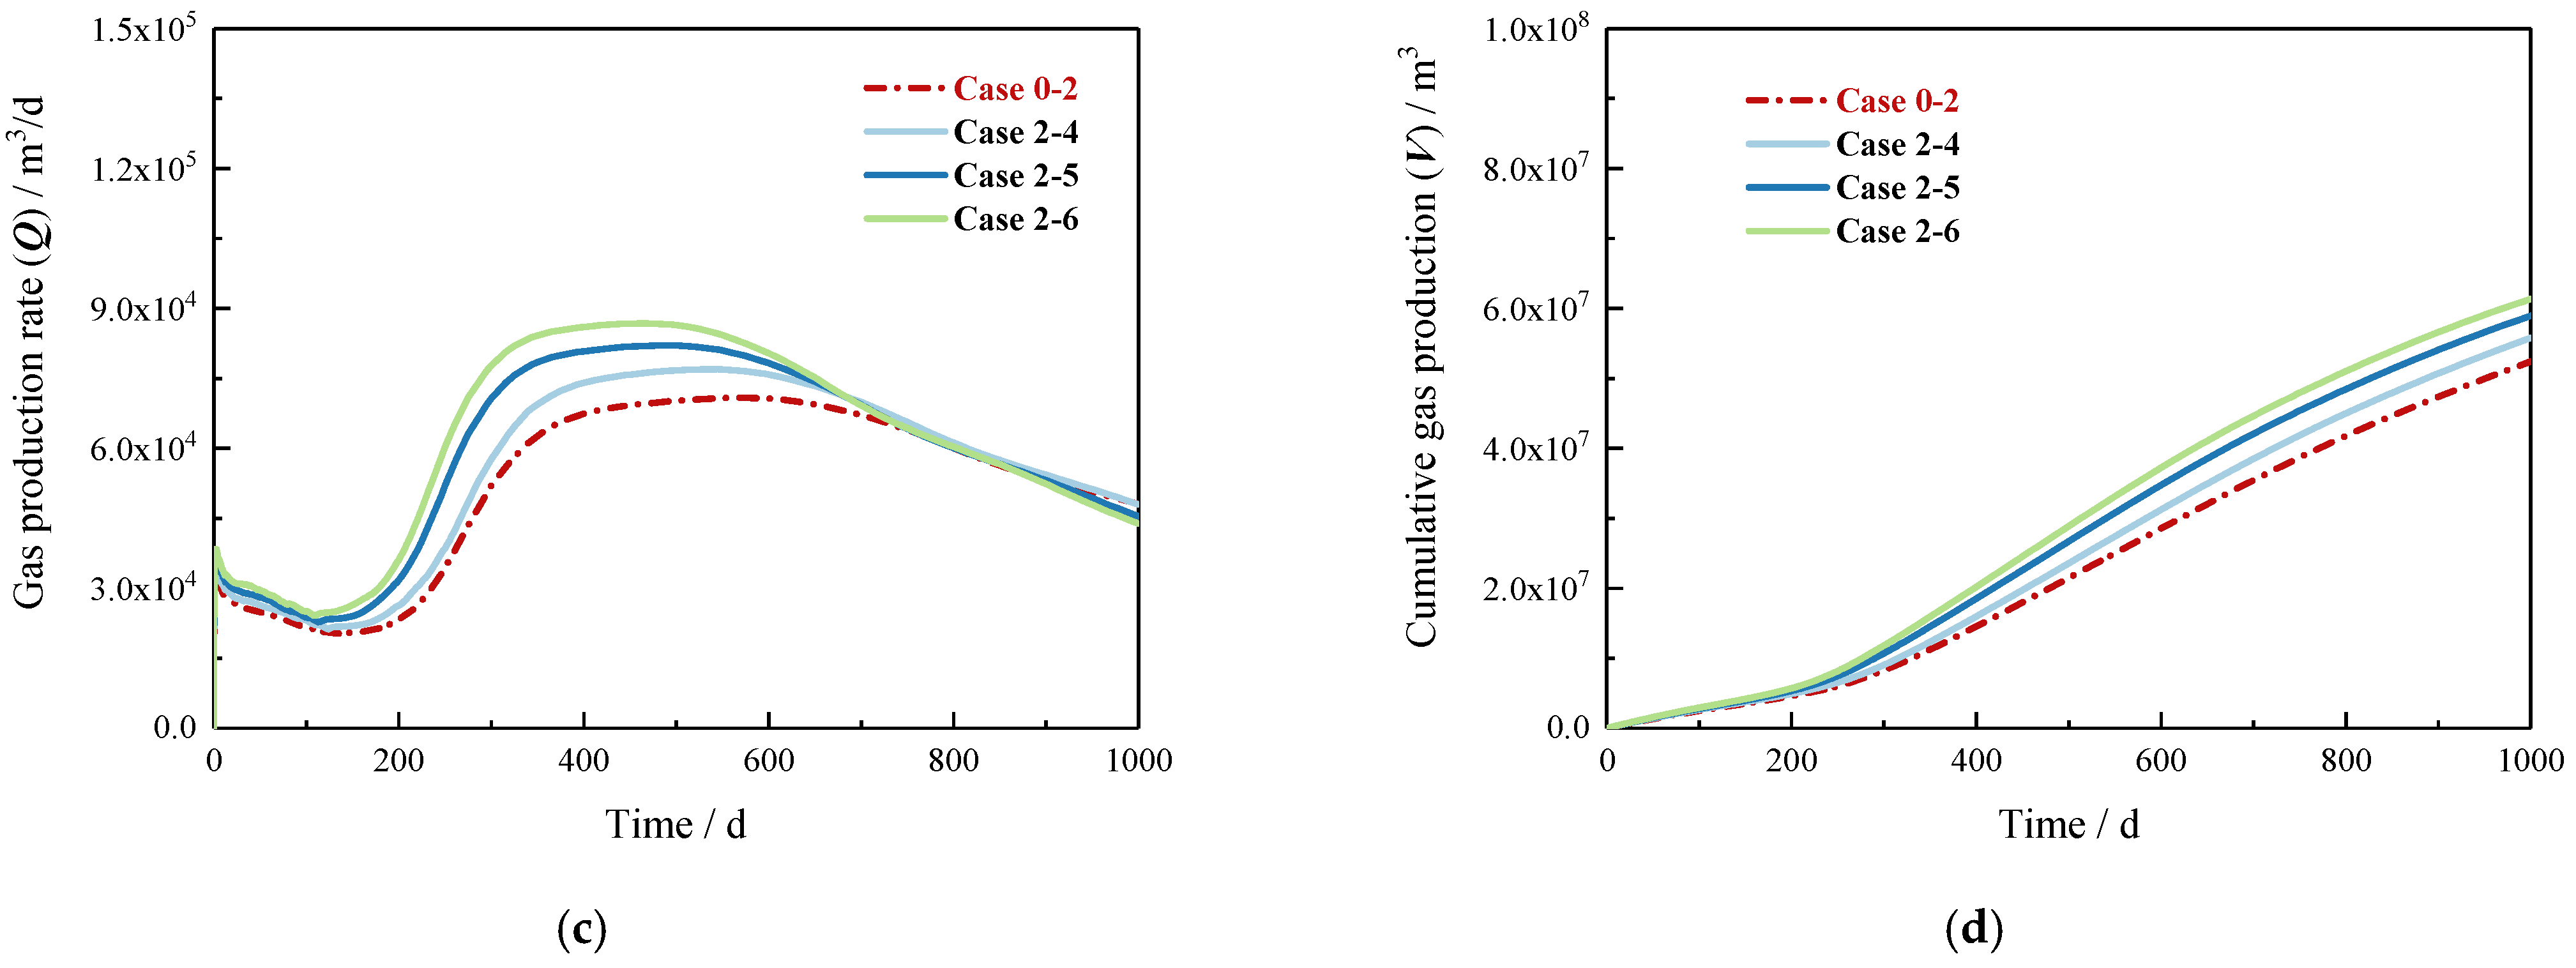
As shown in Figure 8, various heating power makes little difference in the early production stage, which is more obvious at P = 4 MPa. In the first 150 days, the curves oscillated down due to ice formulation and NGH regeneration, which indicates that the NGH decomposition at the beginning mainly relied on the depressurization drive, and inner wall heating played a relatively minor role. As production progressed, the heating effect began to make the gas production curve rise, and with the rise of heating power, the rise in the Q was more pronounced. However, In the late production period, the Q curve started to fall back and almost coincided with the control case, while at P = 1 MPa, Q was even lower than the control case. This is because the NGH near the SEED decomposed fully in this stage, but that portion of the heat generated by inner wall heating has a restricted range of influence and has little effect on the NGH decomposition farther away. In general, the variation of the Q at different inner wall temperatures is slight but sufficient to prevent clogging by ice and secondary generation NGH. Thus, for short-term and low-pressure production conditions, we recommend this measure to improve the operating environment of the SEED. For long-term and high-pressure production conditions, it is perfectly possible to wait for the natural warming of the reservoir near the open-hole.
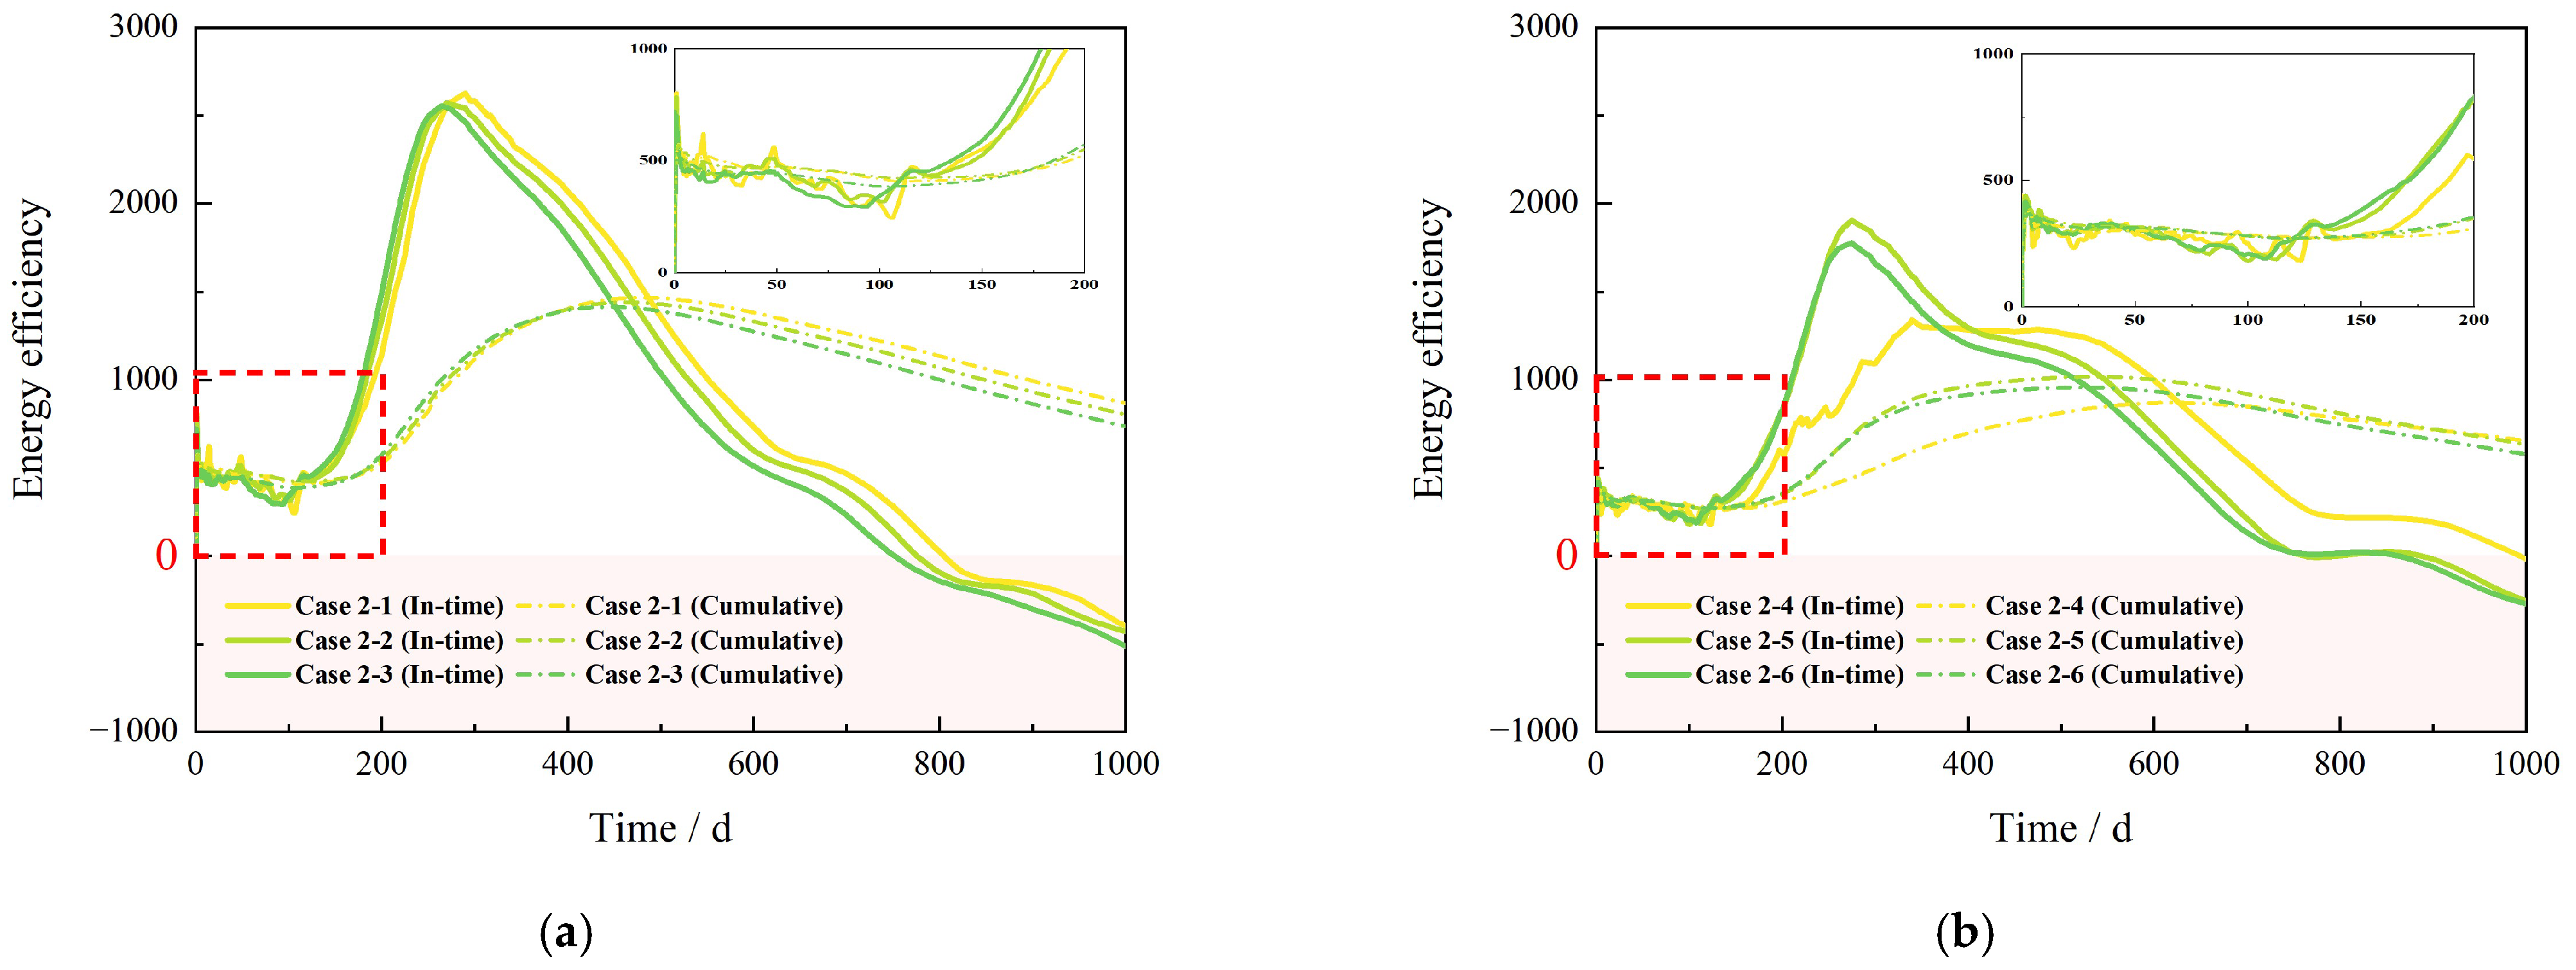
Moreover, when carrying out thermal stimulation methods that need outside energy, energy efficiency can reflect the relationship between the heat input and the resulting additional gas production. In this study, in order to better evaluate the effect of heating, we defined in-time energy efficiency and cumulative energy efficiency. The former is the ratio of the additional gas calorific value generated by heating to the input energy per unit of time, and the latter is the overall ratio in a certain period. Figure 9 shows the energy efficiency of the internal wall heating under low and high pressure production conditions, respectively. In the case of P = 1 MPa, the energy efficiencies of the three cases are basically the same, with some fluctuations in the first 150 days due to the secondary production of NGH and ice formation. The inflection point is around 300 days, before which the higher the heating power, the higher the in-time energy efficiency, but after that, the trend reverses. In the later stages of exploitation, the heating value of the produced gas is already lower than the energy input value. Therefore, a reasonable heating strategy can be considered in actual production such as high power in the early period, low power in the middle period, and stopping heating in the last period. In the case of P = 4 MPa, the early trend of the curve is similar to that of low pressure, but after 150 days, the in-time energy efficiency of Case2-4 is significantly lower than that of the other two, which shows that under the high production pressure, the effect of pressure-driven NGH decomposition is weak. If the heating power is too low, the effect of enhancing production is limited. In the middle and late stages of production, the general trend is again similar to low pressure, but there is no sizeable negative value in the later stage. Therefore, in actual production, the heating strategy of high power in the early period and low power in the middle and late periods can be considered.

4.3. Clustered Exploitation Mode

4.3.1. Clustered Depressurization

In conventional wellbore production, low reservoir permeability is the main reason for low gas production from a single well. The well patterns are beneficial to increase the total gas production, reduce the fixed investment cost, and ensuring the long-term stability of gas production [86]. The clustered exploitation mode of the SEED is similar to conventional wellbores, where the spacing between devices and the interference directly affects the production efficiency. Table 5 shows various cases about the arrangement of double SEEDs. Among them, the production parameters of a single SEED are the same as Case 0–1 and Case 0–2.
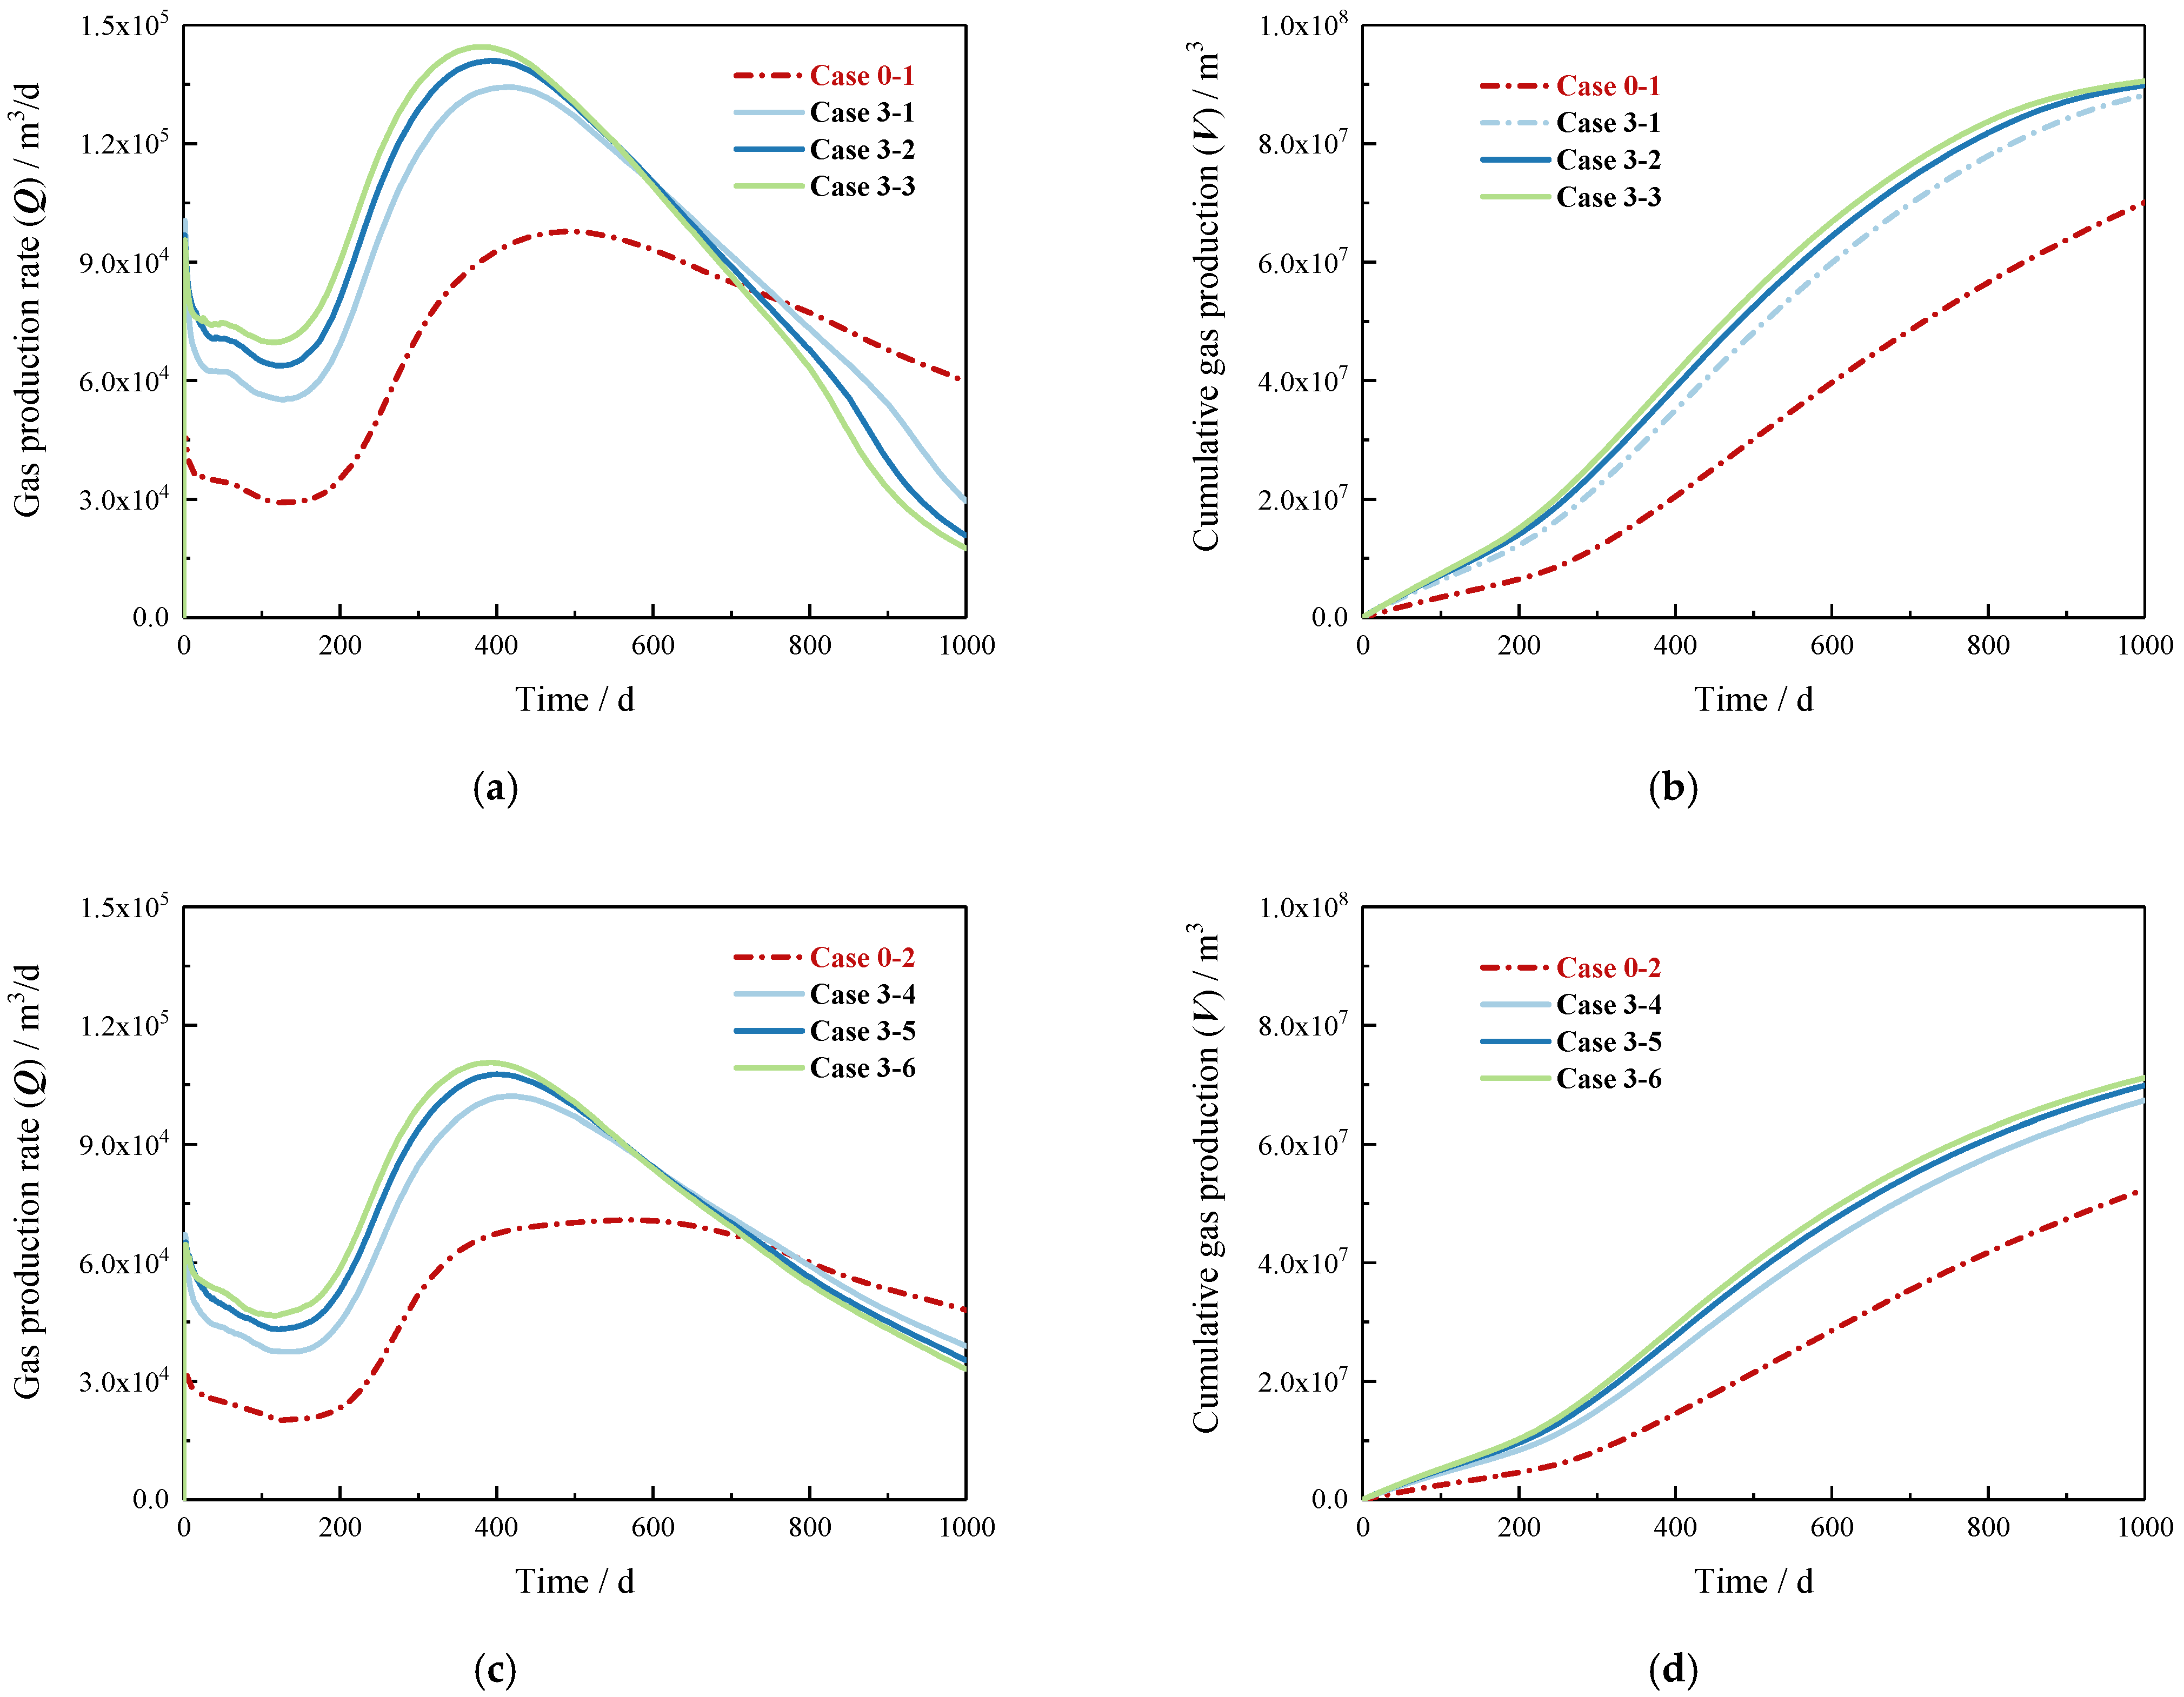
In all three arrangements, the gas production rate showed a trend of a sharp decrease, then a rapid increase, and then a rapid decrease (Figure 10). Regardless of the relative spatial location of the two SEEDs, the capacity of clustered exploitation is much greater than that of a single SEED, which is also consistent with the study by Yu et al. on dual vertical and dual horizontal wells [48,87]. Under short-term production, the spacing determines the control area and the final V of each SEED. Although the small spacing causes the pressure drop range of the two SEEDs to overlap, as well as the pressure drop driving force in the overlapping area to be larger, there is a “competition” between the two SEEDs for the decomposed gas of the overlapping part of NGH, thereby reducing the effective NGH decomposition area. The final results comparing spacing of 60 m and 100 m cases (Case 3–2, Case 3–3, Case 3–5, and Case 3–6) show that the effect of spacing is limited when the spacing is larger than the range of NGH decomposition fronts that a single SEED can drive. Therefore, a reasonable spacing needs to be determined based on a combination of expected production cycle time and pressure.

4.3.2. Depressurization Combined Thermal Stimulation

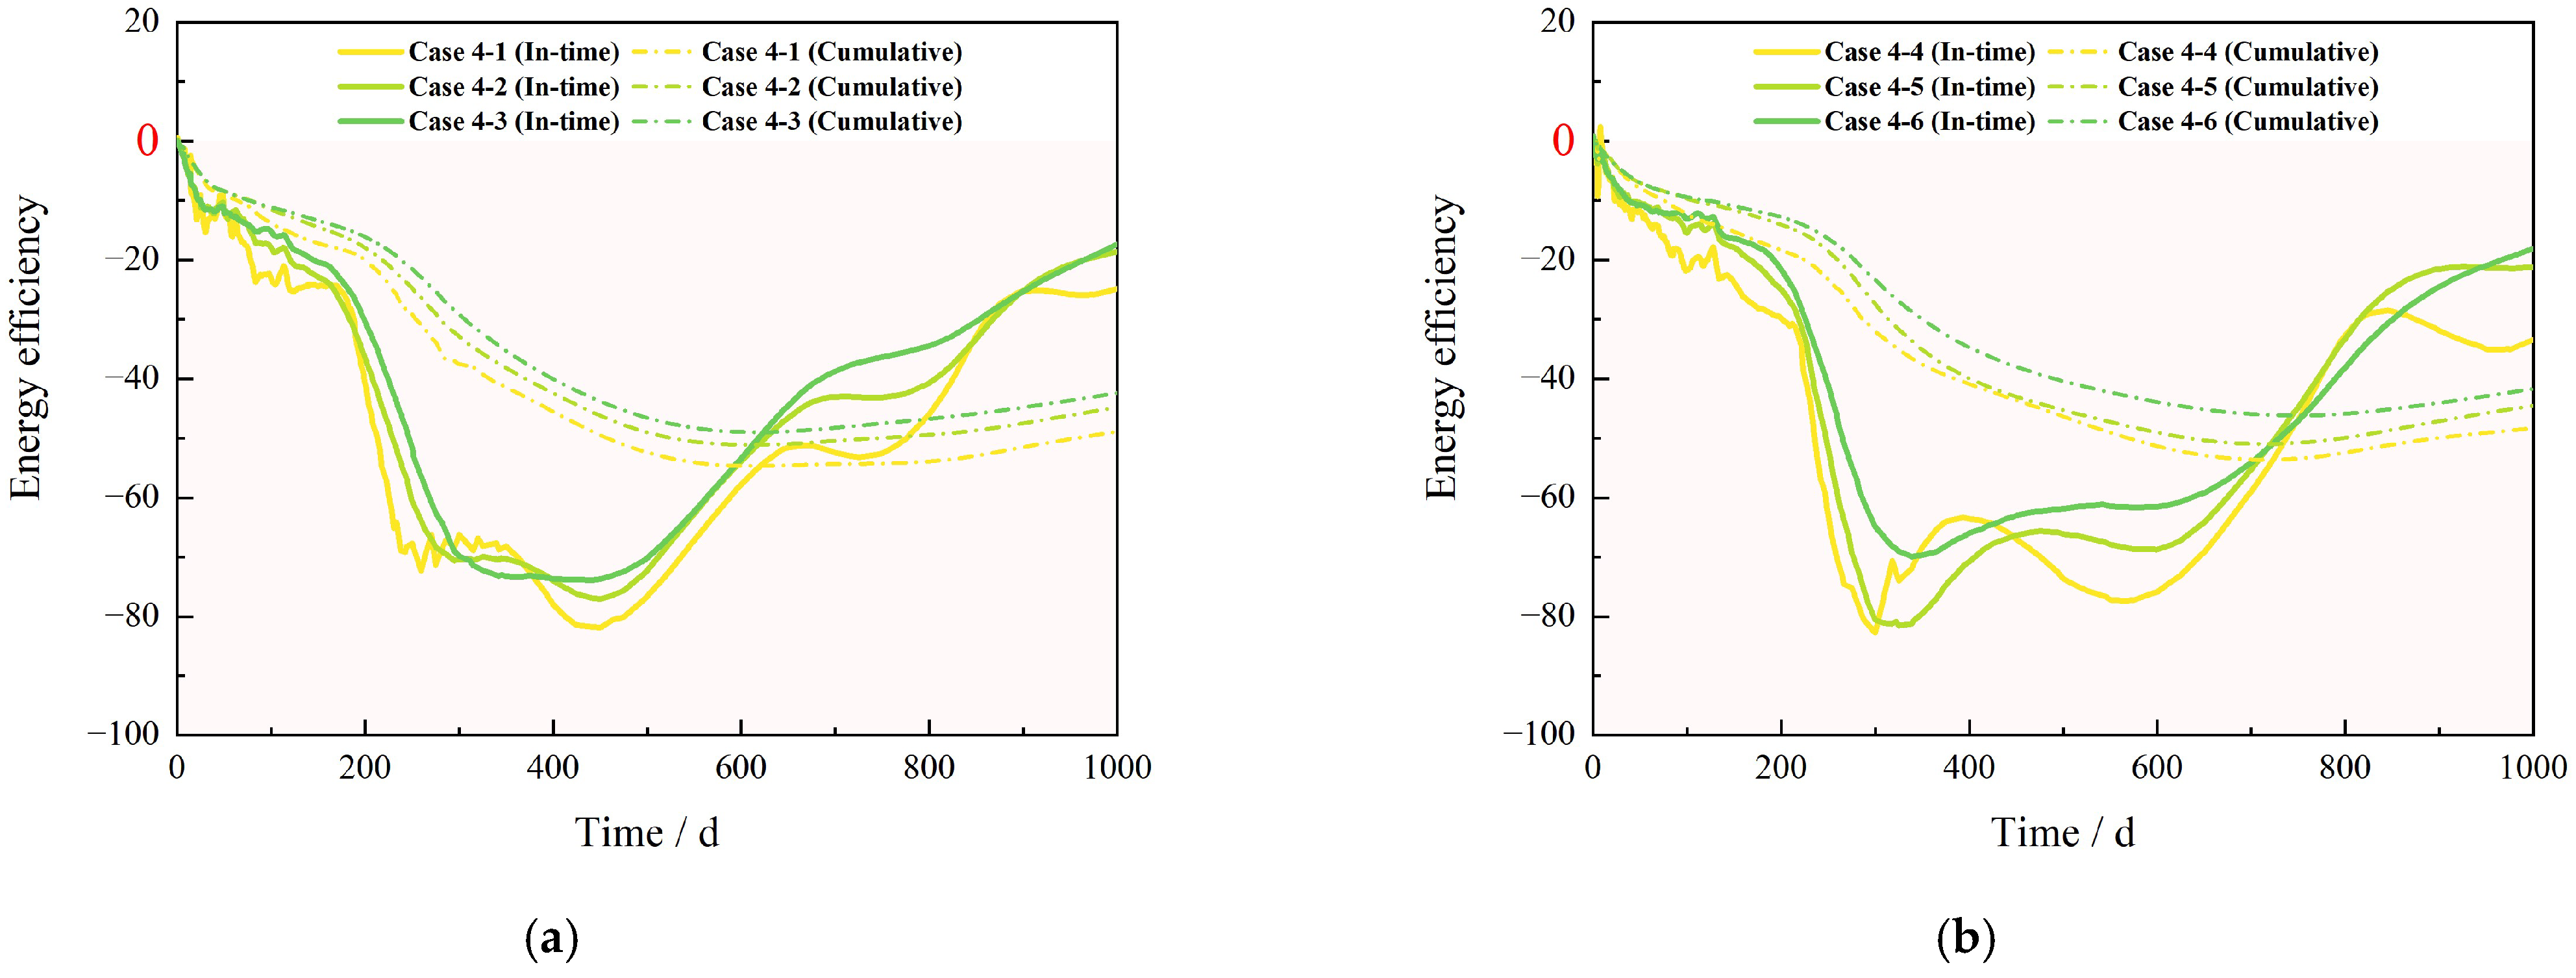
The heating of the inner/outer walls of the device is effective in preventing ice and secondary generation of NGH from clogging the open-hole. However, it has a limited effect on the temperature change of the distant reservoir. In fact, heat transfer towards the NGH decomposition front limits gas production. Therefore, the depressurization combined thermal stimulation model is beneficial in that the reservoir at the far SEED does not lose temperature too quickly. In this study, we determined 40 ℃ as the injection temperature, verified as the corresponding maximum energy efficiency in the existing study [88]. Table 6 shows various cases of the various water injection rate. Among them, the production parameters of a single SEED are the same as Case 0–1 and Case 0–2, and the spacing was set to 60 m.
As shown in Figure 11, the gas production rates of the depressurization combined thermal stimulation cases are all lower than control cases throughout the production process. Unlike the expected results, the heat injection fails to promote a sharp increase in gas production. In the early stages of production, the Q curves almost overlap because the distant hot water injection behavior has not yet affected the NGH decomposition front driven by the SEED enough. However, it was separated immediately after that. In the first 200 days, the effect of hot water injection on the increase of reservoir pressure inhibited the NGH decomposition, so the Q curves were similar to the control group but low. Overall, subsequently, the rise in reservoir temperature caused by hot water injection is not conducive to NGH decomposition. This may be due to the following factors: (i) the permeability of the NGH reservoir in the SHSC-4 site is in low value, preventing the hot water injection from spreading in time, thereby resulting in the “pressure-out zone” phenomenon [71] and (ii) the inhibitory effect of elevated reservoir pressure on NGH decomposition is greater than the benefit of elevated temperature. Figure 12 shows the energy efficiency characteristics of this measure, and the definition here is consistent with the above. There is no suspense. This measure fails to promote gas production at this site but inhibits the NGH decomposition, so the energy efficiency is negative. From the trend of the curve, the performance of energy efficiency is almost the same under the condition of P = 4 MPa or P = 1 MPa, which further shows that the suppression effect of the “pressure-out zone” caused by hot water injection has far exceeded the gain brought by the pressure difference of 3 MPa production.
Consequently, we do not recommend this measure under the low permeability, low thermal conductivity, and high initial temperature of the reservoirs. This phenomenon may not occur in other NGH reservoirs in other areas. For instance, in the Nankai Trough in Japan, the NGH reservoirs are mainly sandy with high permeability and thermal conductivity, which have verified that the combination of depressurization and thermal stimulation is more conducive to NGH decomposition [48,59,89].

5. Conclusions and Suggestions

The SEED is a non-drilling device in marine NGH exploitation, but it is difficult to reach the NGH commercial extraction threshold in its initial state. Thus, in this study, the feasibility of some production enhancement measures was verified and evaluated to improve the exploitation system of the SEED. The following suggestions were obtained:
(1)
Unlike conventional wellbores, the SEED consists of a prefabricated steel structure with higher strength and stiffness, allowing for greater depressurization and improved in situ recovery efficiency. Furthermore, the diameter into the reservoir is much larger than the wellbore diameter for casing construction, thereby expanding the NGH decomposition area.
(2)
The gas production in NBL, ML, and FGL with simultaneous openings performs well than single-layer openings, which can expand the contact areas between the device and NGH reservoirs. Thus, it is recommended that all reservoir layers be open-hole exploited by the SEED simultaneously when carrying out the open-hole position adjustment.
(3)
The effect of inner wall heating is limited but sufficient to achieve the goal of clogging prevention. In actual production, this measure is beneficial to improve gas production, especially with low production pressure and a short production cycle, which is better than the pure depressurization exploitation scenario. For long-term production, the impact of this measure is restricted under normal production pressure (P = 4 MPa).
(4)
Clustered depressurization must be able to significantly increase the capacity of NGH, which is an important measure to cross the threshold of commercial exploitation. In addition, various arrangement parameters make a difference in the production enhancement effect, especially the spacing. Indeed, we need to select a reasonable spacing according to a combination of expected production cycle time and pressure.
(5)
The SEED has the potential to adopt depressurization combined with thermal stimulation exploitation. However, it seems to have performed terribly in the Shenhu reservoir, where the reservoir character is poor (low permeability, low thermal conductivity, etc.). Therefore, it is not recommended in clayey soil reservoirs with poor permeability conditions.
(6)
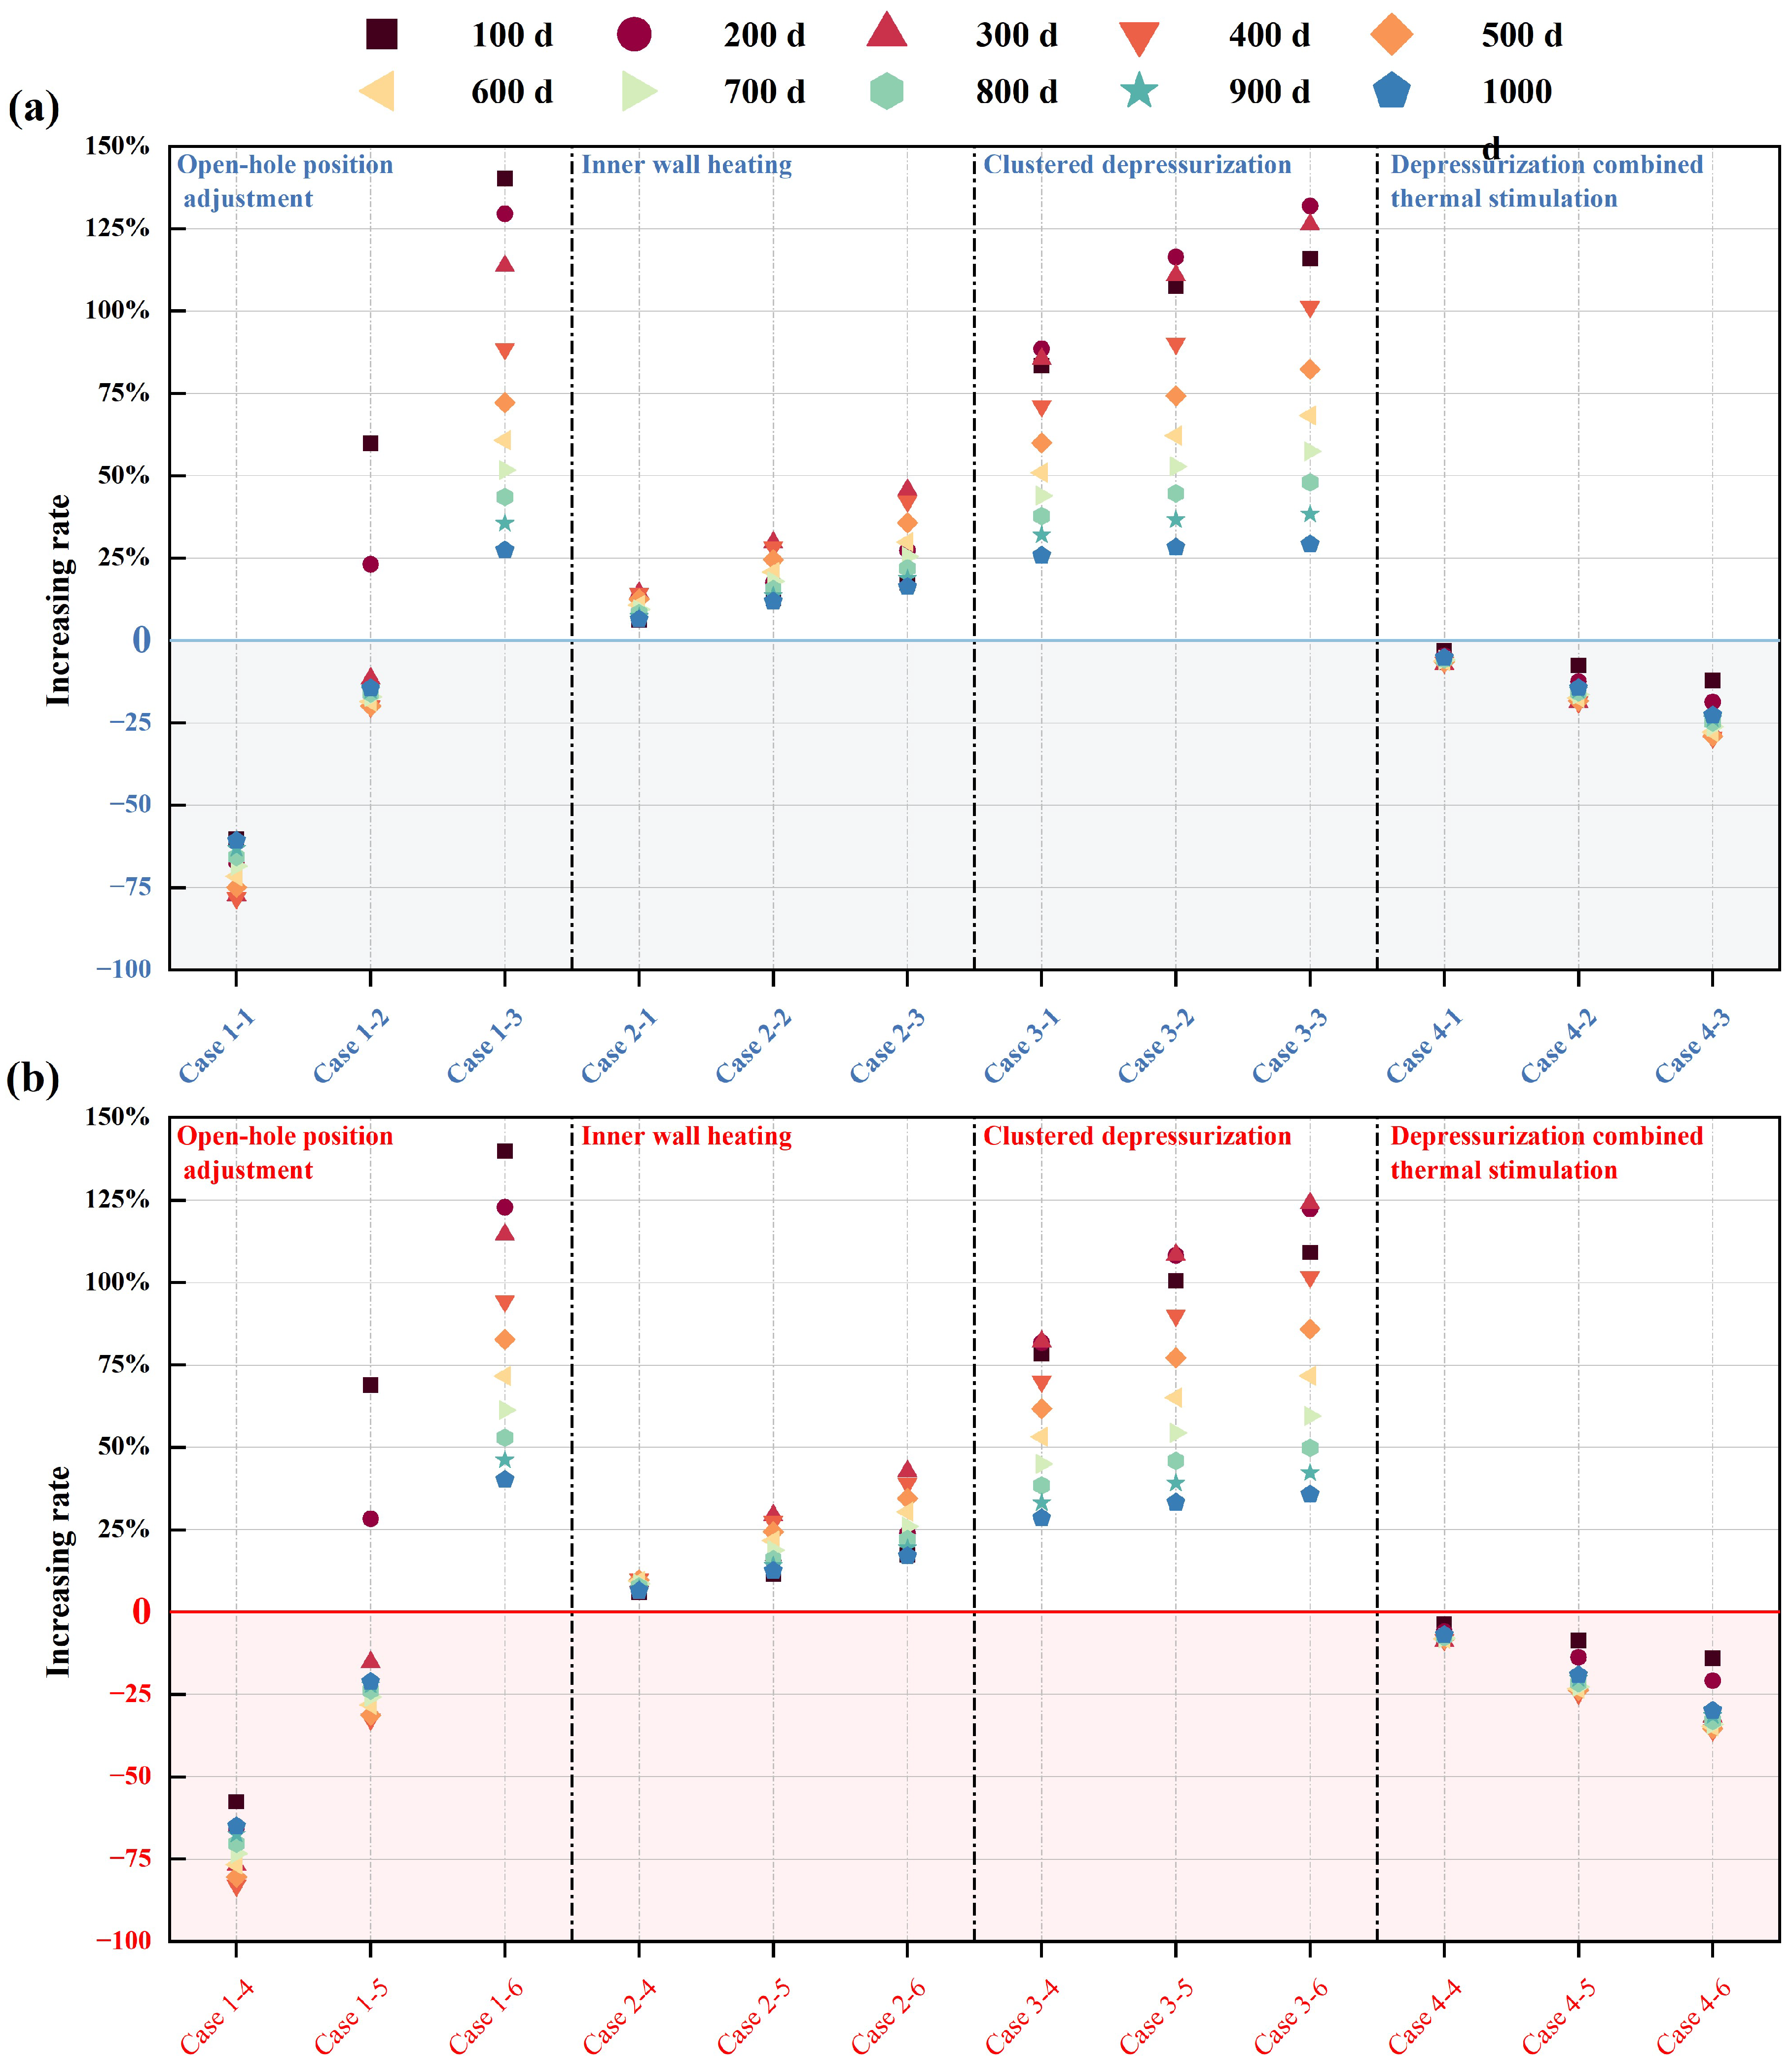
Figure 13 shows the increasing rate of gas production compared with the control group, which allows us to determine which measure to adopt according to different periods (100 d, 200 d, 300 d, …, 1000 d).
In conclusion, the SEED is proposed to enrich the new idea of NGH non-drilling exploitation, which is still in the theoretical and numerical research stage. In the next stage, we will build indoor test facilities to further explore the feasibility of its penetration and exploitation. Therefore, compared with the drilling method with a more mature system, the specific construction steps and preparation time of the SEED in field application, as well as the possible environmental problems, need further study.

Author Contributions

Conceptualization, J.W., H.Y. and X.W.; methodology, J.W.; software, D.L.; validation, J.C. and Q.H.; formal analysis, G.G.; investigation, X.H.; resources, X.W.; data curation, H.Y.; writing—original draft preparation, J.W. and H.Y.; writing—review and editing, J.W. and H.Y.; visualization, J.C. and Q.H.; supervision, M.Z.; project administration, X.W.; funding acquisition, X.W. All authors have read and agreed to the published version of the manuscript.

Funding

This study has been partially funded by the Natural Science Foundation of China (41907251, 52179098), the Natural Science Foundation of Shandong Province (ZR2019ZD14), and the Natural Science Foundation of Fujian Province (2019J05030).

Institutional Review Board Statement

Not applicable.

Informed Consent Statement

Not applicable.

Data Availability Statement

Not applicable.

Conflicts of Interest

The authors declare no conflict of interest.

References

  1. Sloan, E.D. Fundamental principles and applications of natural gas hydrates. Nature 2003, 426, 353–359. [Google Scholar] [CrossRef]
  2. Kvenvolden, K.A. Methane hydrate—A major reservoir of carbon in the shallow geosphere? Chem. Geol. 1988, 71, 41–51. [Google Scholar] [CrossRef]
  3. Zeng, H.; Zhang, Y.; Zhang, L.; Chen, Z.; Li, X. Effects of the NaCl Concentration and Montmorillonite Content on Formation Kinetics of Methane Hydrate. J. Mar. Sci. Eng. 2022, 10, 548. [Google Scholar] [CrossRef]
  4. Makogon, Y.F. Natural gas hydrates—A promising source of energy. J. Nat. Gas Sci. Eng. 2010, 2, 49–59. [Google Scholar] [CrossRef]
  5. Lu, S.M. A global survey of gas hydrate development and reserves: Specifically in the marine field. Renew. Sustain. Energy Rev. 2015, 41, 884–900. [Google Scholar] [CrossRef]
  6. Lee, S.Y.; Holder, G.D. Methane hydrates potential as a future energy source. Fuel Process. Technol. 2001, 71, 181–186. [Google Scholar] [CrossRef]
  7. Ye, H.; Wu, X.; Li, D.; Jiang, Y. Numerical simulation of productivity improvement of natural gas hydrate with various well types: Influence of branch parameters. J. Nat. Gas Sci. Eng. 2022, 103, 104630. [Google Scholar] [CrossRef]
  8. Nasir, Q.; Suleman, H.; Elsheikh, Y.A. A review on the role and impact of various additives as promoters/ inhibitors for gas hydrate formation. J. Nat. Gas Sci. Eng. 2020, 76, 103211. [Google Scholar] [CrossRef]
  9. Roostaie, M.; Leonenko, Y. Gas production from methane hydrates upon thermal stimulation; an analytical study employing radial coordinates. Energy 2020, 194, 116815. [Google Scholar] [CrossRef] [Green Version]
  10. Shi, K.; Wei, R.; Guo, X.; Li, Q.; Lv, X.; Fan, Q.; Dong, H.; Yang, L.; Zhao, J.; Song, Y. Enhancing Gas Production from Hydrate-Bearing Reservoirs through Depressurization-Based Approaches: Knowledge from Laboratory Experiments. Energy Fuels 2021, 35, 6344–6358. [Google Scholar] [CrossRef]
  11. Wei, W.N.; Li, B.; Gan, Q.; Li, Y.L. Research progress of natural gas hydrate exploitation with CO2 replacement: A review. Fuel 2022, 312, 122873. [Google Scholar] [CrossRef]
  12. Zhou, S.; Li, Q.; Lv, X.; Fu, Q.; Zhu, J. Key issues in development of offshore natural gas hydrate. Front. Energy 2020, 14, 433–442. [Google Scholar] [CrossRef]
  13. Makogon, Y.F.; Omelchenko, R.Y. Commercial gas production from Messoyakha deposit in hydrate conditions. J. Nat. Gas Sci. Eng. 2013, 11, 1–6. [Google Scholar] [CrossRef]
  14. Moridis, G.J.; Collett, T.S.; Dallimore, S.R.; Satoh, T.; Hancock, S.; Weatherill, B. Numerical studies of gas production from several CH4 hydrate zones at the Mallik site, Mackenzie Delta, Canada. J. Pet. Sci. Eng. 2004, 43, 219–238. [Google Scholar] [CrossRef] [Green Version]
  15. Collett, T.S. Gas hydrate production testing—Knowledge gained. In Proceedings of the Offshore Technology Conference, Houston, TX, USA, 6–9 May 2019; pp. 6–9. [Google Scholar] [CrossRef]
  16. Ajayi, T.; Anderson, B.J.; Seol, Y.; Boswell, R.; Myshakin, E.M. Key aspects of numerical analysis of gas hydrate reservoir performance: Alaska North Slope Prudhoe Bay Unit “L-Pad” hydrate accumulation. J. Nat. Gas Sci. Eng. 2018, 51, 37–43. [Google Scholar] [CrossRef]
  17. Collett, T.S.; Boswell, R.; Lee, M.W.; Anderson, B.J.; Rose, K.; Lewis, K.A. Evaluation of long-term gas hydrate production testing locations on the Alaska north slope. In Proceedings of the OTC Arctic Technology Conference, Houston, TX, USA, 7–9 February 2011; pp. 955–983. [Google Scholar] [CrossRef]
  18. Yamamoto, K.; Terao, Y.; Fujii, T.; Ikawa, T.; Seki, M.; Matsuzawa, M.; Kanno, T. Operational overview of the first offshore production test of methane hydrates in the Eastern Nankai Trough. In Proceedings of the Offshore Technology Conference, Houston, TX, USA, 5–8 May 2014; pp. 1802–1812. [Google Scholar] [CrossRef]
  19. Yamamoto, K.; Wang, X.X.; Tamaki, M.; Suzuki, K. The second offshore production of methane hydrate in the Nankai Trough and gas production behavior from a heterogeneous methane hydrate reservoir. RSC Adv. 2019, 9, 25987–26013. [Google Scholar] [CrossRef] [Green Version]
  20. Wang, P.; Zhu, Y.; Lu, Z.; Bai, M.; Huang, X.; Pang, S.; Zhang, S.; Liu, H.; Xiao, R. Research progress of gas hydrates in the Qilian mountain permafrost, Qinghai, northwest China: Review. Sci. Sin. Phys. Mech. Astron. 2019, 49, 034606. [Google Scholar] [CrossRef] [Green Version]
  21. Li, J.F.; Ye, J.L.; Qin, X.W.; Qiu, H.J.; Wu, N.Y.; Lu, H.L.; Xie, W.W.; Lu, J.A.; Peng, F.; Xu, Z.Q.; et al. The first offshore natural gas hydrate production test in South China Sea. China Geol. 2018, 1, 5–16. [Google Scholar] [CrossRef]
  22. Ye, J.L.; Qin, X.W.; Xie, W.W.; Lu, H.L.; Ma, B.J.; Qiu, H.J.; Liang, J.Q.; Lu, J.A.; Kuang, Z.G.; Lu, C.; et al. The second natural gas hydrate production test in the South China Sea. China Geol. 2020, 3, 197–209. [Google Scholar] [CrossRef]
  23. Mao, L.; Cai, M.; Liu, Q.; Zhang, Y. Parameter optimization for solid fluidization exploitation of natural gas hydrate in South China Sea. Eng. Comput. 2022, 39, 1051–1079. [Google Scholar] [CrossRef]
  24. Wu, N.; Li, Y.; Wan, Y.; Sun, J.; Huang, L.; Mao, P. Prospect of marine natural gas hydrate stimulation theory and technology system. Nat. Gas Ind. 2020, 40, 100–115. [Google Scholar] [CrossRef]
  25. Aghajari, H.; Moghaddam, M.H.; Zallaghi, M. Study of effective parameters for enhancement of methane gas production from natural gas hydrate reservoirs. Green Energy Environ. 2019, 4, 453–469. [Google Scholar] [CrossRef]
  26. Ye, H.; Wu, X.; Guo, G.; Li, D.; Jiang, Y. A Novel Wellbore-Wall Heating Method without External Energy Injection for Natural Gas Hydrate Production—A Heat Transfer Device. J. Mar. Sci. Eng. 2022, 10, 799. [Google Scholar] [CrossRef]
  27. Li, S.; Li, S.; Zheng, R.; Li, Q.; Pang, W. Strategies for gas production from Class 2 hydrate accumulations by depressurization. Fuel 2021, 286, 119380. [Google Scholar] [CrossRef]
  28. Li, Q.; Zhou, S.; Zhao, J.; Song, Y.; Zhu, J. Research Status and Prospects of Natural Gas Hydrate Exploitation Technology. Chin. J. Eng. Sci. 2022, 24, 214. [Google Scholar] [CrossRef]
  29. Uchida, S.; Klar, A.; Yamamoto, K. Sand production model in gas hydrate-bearing sediments. Int. J. Rock Mech. Min. Sci. 2016, 86, 303–316. [Google Scholar] [CrossRef]
  30. Yoon, H.C.; Yoon, S.; Lee, J.Y.; Kim, J. Multiple porosity model of a heterogeneous layered gas hydrate deposit in Ulleung Basin, East Sea, Korea: A study on depressurization strategies, reservoir geomechanical response, and wellbore stability. J. Nat. Gas Sci. Eng. 2021, 96, 104321. [Google Scholar] [CrossRef]
  31. Konno, Y.; Masuda, Y.; Akamine, K.; Naiki, M.; Nagao, J. Sustainable gas production from methane hydrate reservoirs by the cyclic depressurization method. Energy Convers. Manag. 2016, 108, 439–445. [Google Scholar] [CrossRef]
  32. Liang, Y.P.; Liu, S.; Wan, Q.C.; Li, B.; Liu, H.; Han, X. Comparison and optimization of methane hydrate production process using different methods in a single verticalwell. Energies 2019, 12, 124. [Google Scholar] [CrossRef] [Green Version]
  33. Li, D.L.; Liang, D.Q.; Fan, S.S.; Li, X.S.; Tang, L.G.; Huang, N.S. In situ hydrate dissociation using microwave heating: Preliminary study. Energy Convers. Manag. 2008, 49, 2207–2213. [Google Scholar] [CrossRef]
  34. Islam, M.R. A new recovery technique for gas production from Alaskan gas hydrates. J. Pet. Sci. Eng. 1994, 11, 267–281. [Google Scholar] [CrossRef]
  35. Ning, F.; Wu, N.; Jiang, G.; Zhang, L.; Guan, J.; Yu, Y.; Tang, F. A method to use solar energy for the production of gas from marine hydrate-bearing sediments: A case study on the Shenhu Area. Energies 2010, 3, 1861–1879. [Google Scholar] [CrossRef] [Green Version]
  36. Liu, Y.; Hou, J.; Zhao, H.; Liu, X.; Xia, Z. A method to recover natural gas hydrates with geothermal energy conveyed by CO2. Energy 2018, 144, 265–278. [Google Scholar] [CrossRef]
  37. Liu, S.; Zhang, Y.; Luo, Y.; Liang, Y.; Li, B. Analysis of hydrate exploitation by a new in-situ heat generation method with chemical reagents based on heat utilization. J. Clean. Prod. 2020, 249, 119399. [Google Scholar] [CrossRef]
  38. Tupsakhare, S.S.; Castaldi, M.J. Efficiency enhancements in methane recovery from natural gas hydrates using injection of CO2/N2 gas mixture simulating in-situ combustion. Appl. Energy 2019, 236, 825–836. [Google Scholar] [CrossRef]
  39. Li, S.; Xiao, L.; Sijing, W. A novel method for natural gas hydrate production:de-pressurization and backfilling with in-situ supplemental heat. J. Eng. Geol. 2020, 28, 282–293. [Google Scholar] [CrossRef]
  40. Yin, Z.; Huang, L.; Linga, P. Effect of wellbore design on the production behaviour of methane hydrate-bearing sediments induced by depressurization. Appl. Energy 2019, 254, 113635. [Google Scholar] [CrossRef]
  41. Ye, H.; Wu, X.; Li, D.; Jiang, Y. Numerical analysis of gas recovery enhancement from natural gas hydrate reservoir by using a large-diameter casing. Ocean Eng. 2022, 262, 112321. [Google Scholar] [CrossRef]
  42. Zhang, J.; Li, X.; Chen, Z.; Li, Q.; Li, G.; Lv, T. Numerical simulation of the improved gas production from low permeability hydrate reservoirs by using an enlarged highly permeable well wall. J. Pet. Sci. Eng. 2019, 183, 106404. [Google Scholar] [CrossRef]
  43. Zhuo, L.; Yu, J.; Zhang, H.; Zhou, C. Influence of horizontal well section length on the depressurization development effect of natural gas hydrate reservoirs. Nat. Gas Ind. 2021, 41, 153–160. [Google Scholar] [CrossRef]
  44. Yuan, Y.; Xu, T.; Jin, C.; Zhu, H.; Gong, Y.; Wang, F. Multiphase flow and mechanical behaviors induced by gas production from clayey-silt hydrate reservoirs using horizontal well. J. Clean. Prod. 2021, 328, 129578. [Google Scholar] [CrossRef]
  45. Chong, Z.R.; Zhao, J.; Chan, J.H.R.; Yin, Z.; Linga, P. Effect of horizontal wellbore on the production behavior from marine hydrate bearing sediment. Appl. Energy 2018, 214, 117–130. [Google Scholar] [CrossRef]
  46. Cranganu, C. In-situ thermal stimulation of gas hydrates. J. Pet. Sci. Eng. 2009, 65, 76–80. [Google Scholar] [CrossRef]
  47. Feng, Y.; Chen, L.; Suzuki, A.; Kogawa, T.; Okajima, J.; Komiya, A.; Maruyama, S. Numerical analysis of gas production from reservoir-scale methane hydrate by depressurization with a horizontal well: The effect of permeability anisotropy. Mar. Pet. Geol. 2019, 102, 817–828. [Google Scholar] [CrossRef]
  48. Yu, T.; Guan, G.; Abudula, A.; Yoshida, A.; Wang, D.; Song, Y. Application of horizontal wells to the oceanic methane hydrate production in the Nankai Trough, Japan. J. Nat. Gas Sci. Eng. 2019, 62, 113–131. [Google Scholar] [CrossRef]
  49. Ye, H.; Wu, X.; Li, D. Numerical simulation of natural gas hydrate exploitation in complex structure wells: Productivity improvement analysis. Mathematics 2021, 9, 2184. [Google Scholar] [CrossRef]
  50. Mao, P.; Wan, Y.; Sun, J.; Li, Y.; Hu, G.; Ning, F.; Wu, N. Numerical study of gas production from fine-grained hydrate reservoirs using a multilateral horizontal well system. Appl. Energy 2021, 301, 117450. [Google Scholar] [CrossRef]
  51. Li, Y.L.; Wan, Y.Z.; Chen, Q.; Sun, J.X.; Wu, N.Y.; Hu, G.W.; Ning, F.L.; Mao, P.X. Large borehole with multi-lateral branches: A novel solution for exploitation of clayey silt hydrate. China Geol. 2019, 2, 333–341. [Google Scholar] [CrossRef]
  52. Ye, H.; Wu, X.; Guo, G.; Huang, Q.; Chen, J.; Li, D. Application of the enlarged wellbore diameter to gas production enhancement from natural gas hydrates by complex structure well in the shenhu sea area. Energy 2022, 264, 126025. [Google Scholar] [CrossRef]
  53. Zhang, P.; Zhang, Y.; Zhang, W.; Tian, S. Numerical simulation of gas production from natural gas hydrate deposits with multi-branch wells: Influence of reservoir properties. Energy 2022, 238, 121738. [Google Scholar] [CrossRef]
  54. Zhang, P.; Tian, S.; Zhang, Y.; Li, G.; Zhang, W.; Khan, W.A.; Ma, L. Numerical simulation of gas recovery from natural gas hydrate using multi-branch wells: A three-dimensional model. Energy 2021, 220, 119549. [Google Scholar] [CrossRef]
  55. Wei, N.; Pei, J.; Zhao, J.; Zhang, L.; Zhou, S.; Luo, P.; Li, H.; Wu, J. A state-of-the-art review and prospect of gas hydrate reservoir drilling techniques. Front. Earth Sci. 2022, 10, 124. [Google Scholar] [CrossRef]
  56. Gao, D.; Wang, Y. Some Research Progress in Deepwater Drilling Mechanics and Control Technology; CRC Press: Boca Raton, FL, USA, 2019; Volume 40, ISBN 9780429129148. [Google Scholar]
  57. Wei, C.; Yan, R.; Tian, H.; Zhou, J.; Li, W.; Ma, T.; Chen, P. Geotechnical problems in exploitation of natural gas hydrate: Status and challenges. Nat. Gas Ind. 2020, 40, 116–132. [Google Scholar] [CrossRef]
  58. Konno, Y.; Jin, Y.; Yoneda, J.; Uchiumi, T.; Shinjou, K.; Nagao, J. Hydraulic fracturing in methane-hydrate-bearing sand. RSC Adv. 2016, 6, 73148–73155. [Google Scholar] [CrossRef] [Green Version]
  59. Konno, Y.; Fujii, T.; Sato, A.; Akamine, K.; Naiki, M.; Masuda, Y.; Yamamoto, K.; Nagao, J. Key Findings of the World’s First Offshore Methane Hydrate Production Test off the Coast of Japan: Toward Future Commercial Production. Energy Fuels 2017, 31, 2607–2616. [Google Scholar] [CrossRef]
  60. Zhu, Y.; Wang, P.; Pang, S.; Zhang, S.; Xiao, R. A Review of the Resource and Test Production of Natural Gas Hydrates in China. Energy Fuels 2021, 35, 9137–9150. [Google Scholar] [CrossRef]
  61. Cen, J.; Li, F.; Li, T.; Huang, W.; Chen, J.; Jiang, F. Experimental study of the heat-transfer performance of an extra-long gravity-assisted heat pipe aiming at geothermal heat exploitation. Sustainability 2021, 13, 12481. [Google Scholar] [CrossRef]
  62. Xuezhen, W.U.; Hongyu, Y.E.; Yujing, J.; Dayong, L.I.; Jie, J.; Gang, W.; Bin, G. Marine natural gas hydrate self-entry exploitation device and its feasibility. J. Cent. South Univ. Technol. 2022, 53, 1012–1022. [Google Scholar] [CrossRef]
  63. Xuezhen, W.U.; Hongyu, Y.E.; Dayong, L.I.; Yujing, J.; Qu, W. A novel suction cylinder-type exploitation device and approach for marine natural gas hydrate. Ocean Eng. 2022, 40, 1–10. [Google Scholar] [CrossRef]
  64. Li, W.; Chen, X.; Hu, Y.; Xia, Y.; Yang, M.; Chen, H. Research on mining mechanism of gas hydrate capping and pressure reducing device. Chin. J. Appl. Mech. 2020, 5, 2146–2152. [Google Scholar] [CrossRef]
  65. Xu, H.L.; Kong, W.Y.; Hu, W.G. Analysis of influencing factors on suction capacity in seabed natural gas hydrate by cutter-suction exploitation. J. Cent. South Univ. 2018, 25, 2883–2895. [Google Scholar] [CrossRef]
  66. Zhao, J.; Zhou, S.; Zhang, L.; Wu, K.; Guo, P.; Li, Q.; Fu, Q.; Gao, H.; Wei, N. The first global physical simulation experimental systems for the exploitation of marine natural gas hydrates through solid fluidization. Nat. Gas Ind. 2017, 37, 15–22. [Google Scholar] [CrossRef]
  67. Wang, G.; Zhong, L.; Zhou, S.; Liu, Q.; Li, Q.; Fu, Q.; Wang, L.; Huang, R.; Wang, G.; Li, X. Jet breaking tools for natural gas hydrate exploitation and their support technologies. Nat. Gas Ind. 2017, 37, 68–74. [Google Scholar] [CrossRef]
  68. Song, Z.; Sun, Y.; Li, K.; Lü, Z.; Sun, H. Research of umbrella-like tool for solid fluidization exploitation of shallow non-diagenetic gas hydrates in deep water. Nat. Gas Ind. 2019, 39, 133–139. [Google Scholar] [CrossRef]
  69. Song, Z.; Li, K.; Sun, J.; Lü, Z. New broaching exploitation method and feasibility analysis of marine gas hydrate reservoirs. Guocheng Gongcheng Xuebao/Chin. J. Process Eng. 2020, 20, 1234–1240. [Google Scholar] [CrossRef]
  70. Wu, X.; Ye, H.; Jiang, Y.; Li, D.; Wang, G. Development of a novel self-entry exploitation device for marine natural gas hydrate and the feasibility studies. Ocean Eng. 2022, 254, 111365. [Google Scholar] [CrossRef]
  71. Ye, H.; Wu, X.; Li, D.; Jiang, Y.; Gong, B. A novel thermal stimulation approach for natural gas hydrate exploitation—the application of the self-entry energy compensation device in the Shenhu sea. J. Nat. Gas Sci. Eng. 2022, 105, 104723. [Google Scholar] [CrossRef]
  72. Brandão, F.E.N.; Henriques, C.C.D.; Araújo, J.B.; Ferreira, O.C.G.; dos Santos Amaral, C. Albacora Leste Field Development- FPSO P-50 Mooring System Concept and Installation. In Proceedings of the Offshore Technology Conference, Houston, TX, USA, 1–4 May 2006. [Google Scholar]
  73. Lieng, J.T.; Tjelta, T.I.; Skaugset, K. Installation of two prototype deep penetrating anchors at the Gjøa Field in the North Sea. In Proceedings of the Offshore Technology Conference, Houston, TX, USA, 3–6 May 2010; pp. 1999–2007. [Google Scholar] [CrossRef]
  74. Obzhirov, A.I.; Emelyanova, T.A.; Telegin, Y.A.; Shakirov, R.B. Gas Flows in the Sea of Okhotsk Resulting from Cretaceous-Cenozoic Tectonomagmatic Activity. Russ. J. Pac. Geol. 2020, 14, 156–168. [Google Scholar] [CrossRef]
  75. DD 2012-08; Marine Gas Hydrate Geological Exploration Specification. Ministry of Natural Resources of the People’s Republic of China: Beijing, China, 2012. Available online: https://geocloud.cgs.gov.cn/std/?standard (accessed on 14 February 2023).
  76. Qiu, G.; Henke, S.; Grabe, J. Application of a Coupled Eulerian-Lagrangian approach on geomechanical problems involving large deformations. Comput. Geotech. 2011, 38, 30–39. [Google Scholar] [CrossRef]
  77. Swinkels, W.J.A.M.; Drenth, R.J.J. Thermal reservoir simulation model of production from naturally occuring gas hydrate accumulations. SPE Reserv. Eval. Eng. 2000, 3, 559–566. [Google Scholar] [CrossRef]
  78. Myshakin, E.M.; Gaddipati, M.; Rose, K.; Anderson, B.J. Numerical simulations of depressurization-induced gas production from gas hydrate reservoirs at the Walker Ridge 313 site, northern Gulf of Mexico. Mar. Pet. Geol. 2012, 34, 169–185. [Google Scholar] [CrossRef]
  79. Myshakin, E.M.; Ajayi, T.; Anderson, B.J.; Seol, Y.; Boswell, R. Numerical simulations of depressurization-induced gas production from gas hydrates using 3-D heterogeneous models of L-Pad, Prudhoe Bay Unit, North Slope Alaska. J. Nat. Gas Sci. Eng. 2016, 35, 1336–1352. [Google Scholar] [CrossRef]
  80. Wu, C.Y.; Chiu, Y.C.; Huang, Y.J.; Hsieh, B.Z. Effects of Geomechanical Mechanisms on Gas Production Behavior: A Simulation Study of a Class-3 Hydrate Deposit of Four-Way-Closure Ridge Offshore Southwestern Taiwan. Energy Procedia 2017, 125, 486–493. [Google Scholar] [CrossRef]
  81. Kim, H.C.; Bishnoi, P.R.; Heidemann, R.A.; Rizvi, S.S.H. Kinetics of methane hydrate decomposition. Chem. Eng. Sci. 1987, 42, 1645–1653. [Google Scholar] [CrossRef]
  82. Genuchten, M.T.V. A closed-form equation for predicting the hydraulic conductivity of unsaturated soils. Soil Sci. Soc. Am. J. 1980, 44, 892–898. [Google Scholar] [CrossRef] [Green Version]
  83. Carman, P.C. Permeability of saturated sands, soils and clays. J. Agric. Sci. 1939, 29, 262–273. [Google Scholar] [CrossRef]
  84. Zhang, R.W.; Lu, J.A.; Wen, P.F.; Kuang, Z.G.; Zhang, B.J.; Xue, H.; Xu, Y.X.; Chen, X. Distribution of gas hydrate reservoir in the first production test region of the Shenhu area, South China Sea. China Geol. 2018, 1, 493–504. [Google Scholar] [CrossRef]
  85. Moridis, G.J.; Sloan, E.D. Gas production potential of disperse low-saturation hydrate accumulations in oceanic sediments. Energy Convers. Manag. 2007, 48, 1834–1849. [Google Scholar] [CrossRef] [Green Version]
  86. Chen, Z.; You, C.; Lyu, T.; Li, X.; Zhang, Y.; Xu, L. Numerical simulation of the depressurization production of natural gas hydrate reservoirs by vertical well patterns in the northern South China Sea. Nat. Gas Ind. 2020, 40, 177–185. [Google Scholar] [CrossRef]
  87. Yu, T.; Guan, G.; Abudula, A.; Yoshida, A.; Wang, D.; Song, Y. Gas recovery enhancement from methane hydrate reservoir in the Nankai Trough using vertical wells. Energy 2019, 166, 834–844. [Google Scholar] [CrossRef]
  88. Li, S.; Zheng, R.; Xu, X.; Hou, J. Energy efficiency analysis of hydrate dissociation by thermal stimulation. J. Nat. Gas Sci. Eng. 2016, 30, 148–155. [Google Scholar] [CrossRef]
  89. Kida, M.; Suzuki, K.; Kawamura, T.; Oyama, H.; Nagao, J.; Ebinuma, T.; Narita, H.; Suzuki, H.; Sakagami, H.; Takahashi, N. Characteristics of natural gas hydrates occurring in pore-spaces of marine sediments collected from the eastern Nankai trough, off Japan. Energy Fuels 2009, 23, 5580–5586. [Google Scholar] [CrossRef]
Figure 1. Schematic diagram of marine NGH exploitation: (a) the first marine production test in China and (b) the second first marine production test in China [55].
Jmse 11 00543 g001
Figure 2. Main features of the self-entry exploitation device: (a) overall exploration schematic; (b) internal structure mode I; and (c) internal structure mode II.
Jmse 11 00543 g002
Figure 3. Production enhancement measures: (a) open-hole position adjustment; (b) inner wall heating; (c) clustered depressurization; and (d) depressurization combined thermal stimulation.
Jmse 11 00543 g003
Figure 4. Structural units in the northern SCS and the location of the NGH production test area [21].
Jmse 11 00543 g004
Figure 5. Schematic diagram of the exploitation model.
Jmse 11 00543 g005
Figure 6. Gas production characteristics for the control group.
Jmse 11 00543 g006
Figure 7. Gas production characteristics for the open-hole position adjustment: (a) gas production rate (1 MPa); (b) cumulative gas production (1 MPa); (c) gas production rate (4 MPa); and (d) cumulative gas production (4 MPa).
Jmse 11 00543 g007
Figure 8. Gas production characteristics for the inner wall heating: (a) gas production rate (1 MPa); (b) cumulative gas production (1 MPa); (c) gas production rate (4 MPa); and (d) cumulative gas production (4 MPa).
Jmse 11 00543 g008aJmse 11 00543 g008b
Figure 9. Energy efficiency characteristics for the inner wall heating: (a) P = 1 MPa; (b) P = 4 MPa.
Jmse 11 00543 g009
Figure 10. Gas production characteristics for the clustered depressurization: (a) gas production rate (1 MPa); (b) cumulative gas production (1 MPa); (c) gas production rate (4 MPa); and (d) cumulative gas production (4 MPa).
Jmse 11 00543 g010
Figure 11. Gas production characteristics for the depressurization combined thermal stimulation: (a) gas production rate (1 MPa); (b) cumulative gas production (1 MPa); (c) gas production rate (4 MPa); and (d) cumulative gas production (4 MPa).
Jmse 11 00543 g011
Figure 12. Energy efficiency characteristics for the depressurization combined thermal stimulation: (a) P = 1 MPa; (b) P = 4 MPa.
Jmse 11 00543 g012
Figure 13. Increase rate of various production enhancement measures: (a) P = 1 Mpa and (b) P = 4 Mpa.
Jmse 11 00543 g013
Table 2. Main production parameters for the control group cases.
No.Production PressureOpening Position
Case 0–11 MPaNBL
Case 0–24 MPaNBL
Table 3. Main production parameters for the open-hole position adjustment cases.
No.Production PressureOpen-Hole Position
Case 1–11 MPaML
Case 1–21 MPaFGL
Case 1–31 MPaNBL + ML + FGL
Case 1–44 MPaML
Case 1–54 MPaFGL
Case 1–64 MPaNBL + ML + FGL
Table 4. Main production parameters for the inner wall heating cases.
No.Production PressureHeating Power
Case 2–11 MPa2 kW
Case 2–21 MPa4 kW
Case 2–31 MPa6 kW
Case 2–44 MPa2 kW
Case 2–54 MPa4 kW
Case 2–64 MPa6 kW
Table 5. Main production parameters for the clustered depressurization cases.
No.Production PressureSpacing
Case 3–11 MPa20 m
Case 3–21 MPa60 m
Case 3–31 MPa100 m
Case 3–44 MPa20 m
Case 3–54 MPa60 m
Case 3–64 MPa100 m
Table 6. Main production parameters for the depressurization combined thermal stimulation cases.
No.Production PressureWater Injection Rate
Case 4–11 MPa20 m3/d
Case 4–21 MPa60 m3/d
Case 4–31 MPa100 m3/d
Case 4–44 MPa20 m3/d
Case 4–54 MPa60 m3/d
Case 4–64 MPa100 m3/d
Disclaimer/Publisher’s Note: The statements, opinions and data contained in all publications are solely those of the individual author(s) and contributor(s) and not of MDPI and/or the editor(s). MDPI and/or the editor(s) disclaim responsibility for any injury to people or property resulting from any ideas, methods, instructions or products referred to in the content.