Article

A Glider View of the Spreading and Mixing Processes of Antarctic Intermediate Water in the Northeastern Subtropical Atlantic

by
Juan Alberto Jiménez-Rincón
1,
Andrés Cianca
2,
Carmen Ferrero-Martín
1 and
Alfredo Izquierdo
1,*
1
Department of Applied Physics, Faculty of Marine and Environmental Sciences, Marine Research Institute (INMAR), International Campus of Excellence of the Sea (CEI-MAR), University of Cadiz, 11510 Cadiz, Spain
2
Plataforma Oceánica de Canarias, 35214 Telde, Spain
*
Author to whom correspondence should be addressed.
J. Mar. Sci. Eng. 2023, 11(3), 576; https://doi.org/10.3390/jmse11030576
Submission received: 26 January 2023 / Revised: 1 March 2023 / Accepted: 2 March 2023 / Published: 8 March 2023
(This article belongs to the Section Physical Oceanography)

Abstract

:
The Antarctic Intermediate Water (AAIW), one of the most important global intermediate water masses, spreads over the world ocean. Its propagation limit at the Northeast Subtropical Atlantic is characterized by its encounter with the Mediterranean Water (MW), which presents dissimilar thermohaline properties. Previous studies of the AAIW in this region have been based on traditional oceanographic cruise observations, which were later complemented by observations using autonomous systems such as ARGO floats. However, these observations present limitations for the study of processes occurring at mesoscale and smaller scales. In this study, we used high-resolution observations made by cutting edge platforms such as underwater gliders. Specifically, a meridional glider section realized in spring 2016 between the islands of Madeira and Gran Canaria has been used. The temperature, salinity and dissolved oxygen minima have allowed the detection of the AAIW signal north of the Canarian archipelago and significantly westward from its main northward propagation pathway in this region. The results of this work have shown that the encounter of AAIW and MW generates thermohaline intrusions or interleaving layers. It is suggested that double diffusion processes may play a role in the development of these structures, which may be important for water masses mixing and, therefore, in determining the northward spreading boundary of AAIW. The use of the high-resolution glider observations combined with other data products is essential for the study of water masses and dynamics when relevant processes have a wide range of scales.

1. Introduction

The eastern boundary of the North Atlantic Subtropical Gyre (NASG) is a region of particular interest in oceanographic research. This is largely due to the role played by large-scale circulation in the meridional heat transport and ocean ventilation [1,2]. This region is the meeting point of central and intermediate water masses with different properties, generating a complex thermohaline structure in the water column. Upper and mid-depth dynamics control the distribution of central and intermediate water masses (Figure 1). In the intermediate levels of the water column, two water masses with dissimilar thermohaline characteristics converge at approximately the latitudes of the Canary Islands. The Mediterranean Water (MW), relatively warm and saline flows to the southwest from the Strait of Gibraltar, competes for space with the Antarctic Intermediate Water (AAIW) that propagates northward and presents relatively low temperatures and salinities [1,3,4]. The interplay of MW and AAIW is one of the factors shaping the largest thermohaline anomaly at intermediate depths in the North Atlantic: the Mediterranean Tongue [5,6,7].
The AAIW in this region propagates northward parallel to the African coastline. It appears to be associated to temperature, salinity and dissolved oxygen (DO) minima and silicate maximum around the 27.4 kg m−3 and 27.5 kg m−3 isopycnals [8,9,10]. Upon reaching the Canary Islands latitude, the distribution of AAIW is strongly affected by the physical barrier posed by the archipelago [4,11]. Despite it, AAIW passes over the Canary Islands, eventually reaching latitudes as far north as the Gulf of Cádiz (35.5° N) [5,12]. The northern limit of AAIW distribution in the Northeast Atlantic is subject to seasonal [11,12], interannual [13] and longer timescales [14].
AAIW mainly passes the Canary archipelago through the channel formed between the easternmost Canary Islands (Fuerteventura and Lanzarote) and the African slope [11]. This flow, confined to the African slope, is favored by the dynamics of the Canary Upwelling System [15,16,17] and by a weaker presence of competing MW, which is more abundant further west in these latitudes [18].
Furthermore, AAIW is also found to the west of the archipelago [4,10] and in the channel formed between Gran Canaria and Fuerteventura-Lanzarote [16,17]. The question of the existence of alternative ways of AAIW northward penetration arises.
Some studies suggest that the existence of AAIW to the north of the archipelago and far from the African slope could be caused by advection from the main AAIW pathway, along the slope, through different mesoscale processes. Machín and Pelegrí [18] hypothesized that westward advected Mediterranean Water eddies (meddies) could trap and confine on their top overlaying AAIW, transporting their properties to the west. Pascual-Collar et al. [19] found that off Cape Ghir, due to the encounter of opposite flowing MW, AAIW and bathymetric constrains, AAIW experiences a cyclonic turn and detaches from the continental slope, travelling westward up to 16.2° W.
Thus, it is evident that, despite the large effort made in the study of the intermediate water masses in the region, some uncertainties remain to be resolved, such as the role of the mesoscale circulation in the water mass distribution and mixing processes at different spatio–temporal scales.
Technological advances have allowed a break-through in the observation temperature and salinity fields in the oceans. This was traditionally carried out in oceanographic cruises under international observational programs. Remote observation systems, such as the ARGO floats program launched nearly two decades ago [20,21], have made it possible to obtain a large number of measurements with a nearly global coverage. However, while these observations provide an unprecedented insight to large-scale variability, their use for the study of smaller-scale processes is much more limited. Underwater gliders can be a complimentary observational platform and fill this gap given that, in addition to monitoring the oceanic water column at high resolution, they can be remotely steered by programmed trajectories.
This study investigates the distribution of AAIW in the Northeastern subtropical Atlantic, where it meets at intermediate depths with the MW, using a meridional glider section between Madeira and Gran Canaria islands. The aim is to value the observations made by the gliders as they measure water mass properties at high resolution, allowing the study of mixing processes occurring at smaller scales.

2. Data and Methods

2.1. Glider Section

Ocean gliders are underwater autonomous vehicles designed specifically for remote observation of the oceans over a broad range of spatio–temporal scales. Their hydrodynamic design and ability to control their buoyancy allow these vehicles to navigate in a programmed “saw-tooth” trajectory while making high-resolution observations [22,23]. Since the slopes of isopycnals in the oceans are generally much smaller than the pitch angle of the glider (±15°–30°), dives and ascents can be considered as vertical profiles [24]. This type of technology allows ocean monitoring at a lower cost than traditional observations, such as oceanographic cruises. In addition, its remotely directed navigation capability allows observation in specific areas over a long period of time, filling gaps left by other remote observing systems such as ARGO floats.
For this study, the glider section MADEIRA2016 carried out by the Oceanic Platform of the Canary Islands (PLOCAN) has been used. This mission consisted of a meridional section (Figure 2) performed by the Slocum G2 glider. The vehicle was deployed on 11 April 2016 in the vicinity of the southern coast of Madeira Island (32.551° N, 16.904° W) and completed its journey to the north of Gran Canaria Island (28.764° N, 15.313° W) on 9 May 2016. During that mission, the glider traveled a total of 673.7 km, performing a total of 287 vertical profiles yielding a nominal horizontal resolution of 0.021° along its trajectory and a nominal vertical resolution of approximately 20 cm.
The glider was equipped with a Sea-Bird GPCTD probe for temperature, conductivity/salinity and pressure (CTD) measurements, and an Aanderaa Oxygen Optode 3835 sensor was used for dissolved oxygen (DO) measurements. The glider was also equipped with sensors for chlorophyll and turbidity measurements, but these observations were not used in this study as they did not provide relevant information.
An exhaustive quality control was applied to the observations made by the glider, allowing the detection of possible anomalous observations. In addition, the thermal lag effects of the CTD probe that may affect the salinity measurements have been corrected, following Garau et al. [25]. Of the total number of profiles, 170, covering the entire section, were used because the rest did not reach the maximum depth of 960 m that would allow an unbiased observation of the intermediate water layer. After quality control, only profiles 45 and 46 were discarded for analysis, since suspicious salinity values that were significantly different from the rest were recorded.

2.2. Crossover Analysis

In order to validate the glider data, we performed a classical secondary quality control based on the comparison with historical data in the study area in order to detect possible drifts of the sensors along each CTD – DO profile. For this purpose, we applied a statistical crossover analysis to compare the glider records with some reference [26].
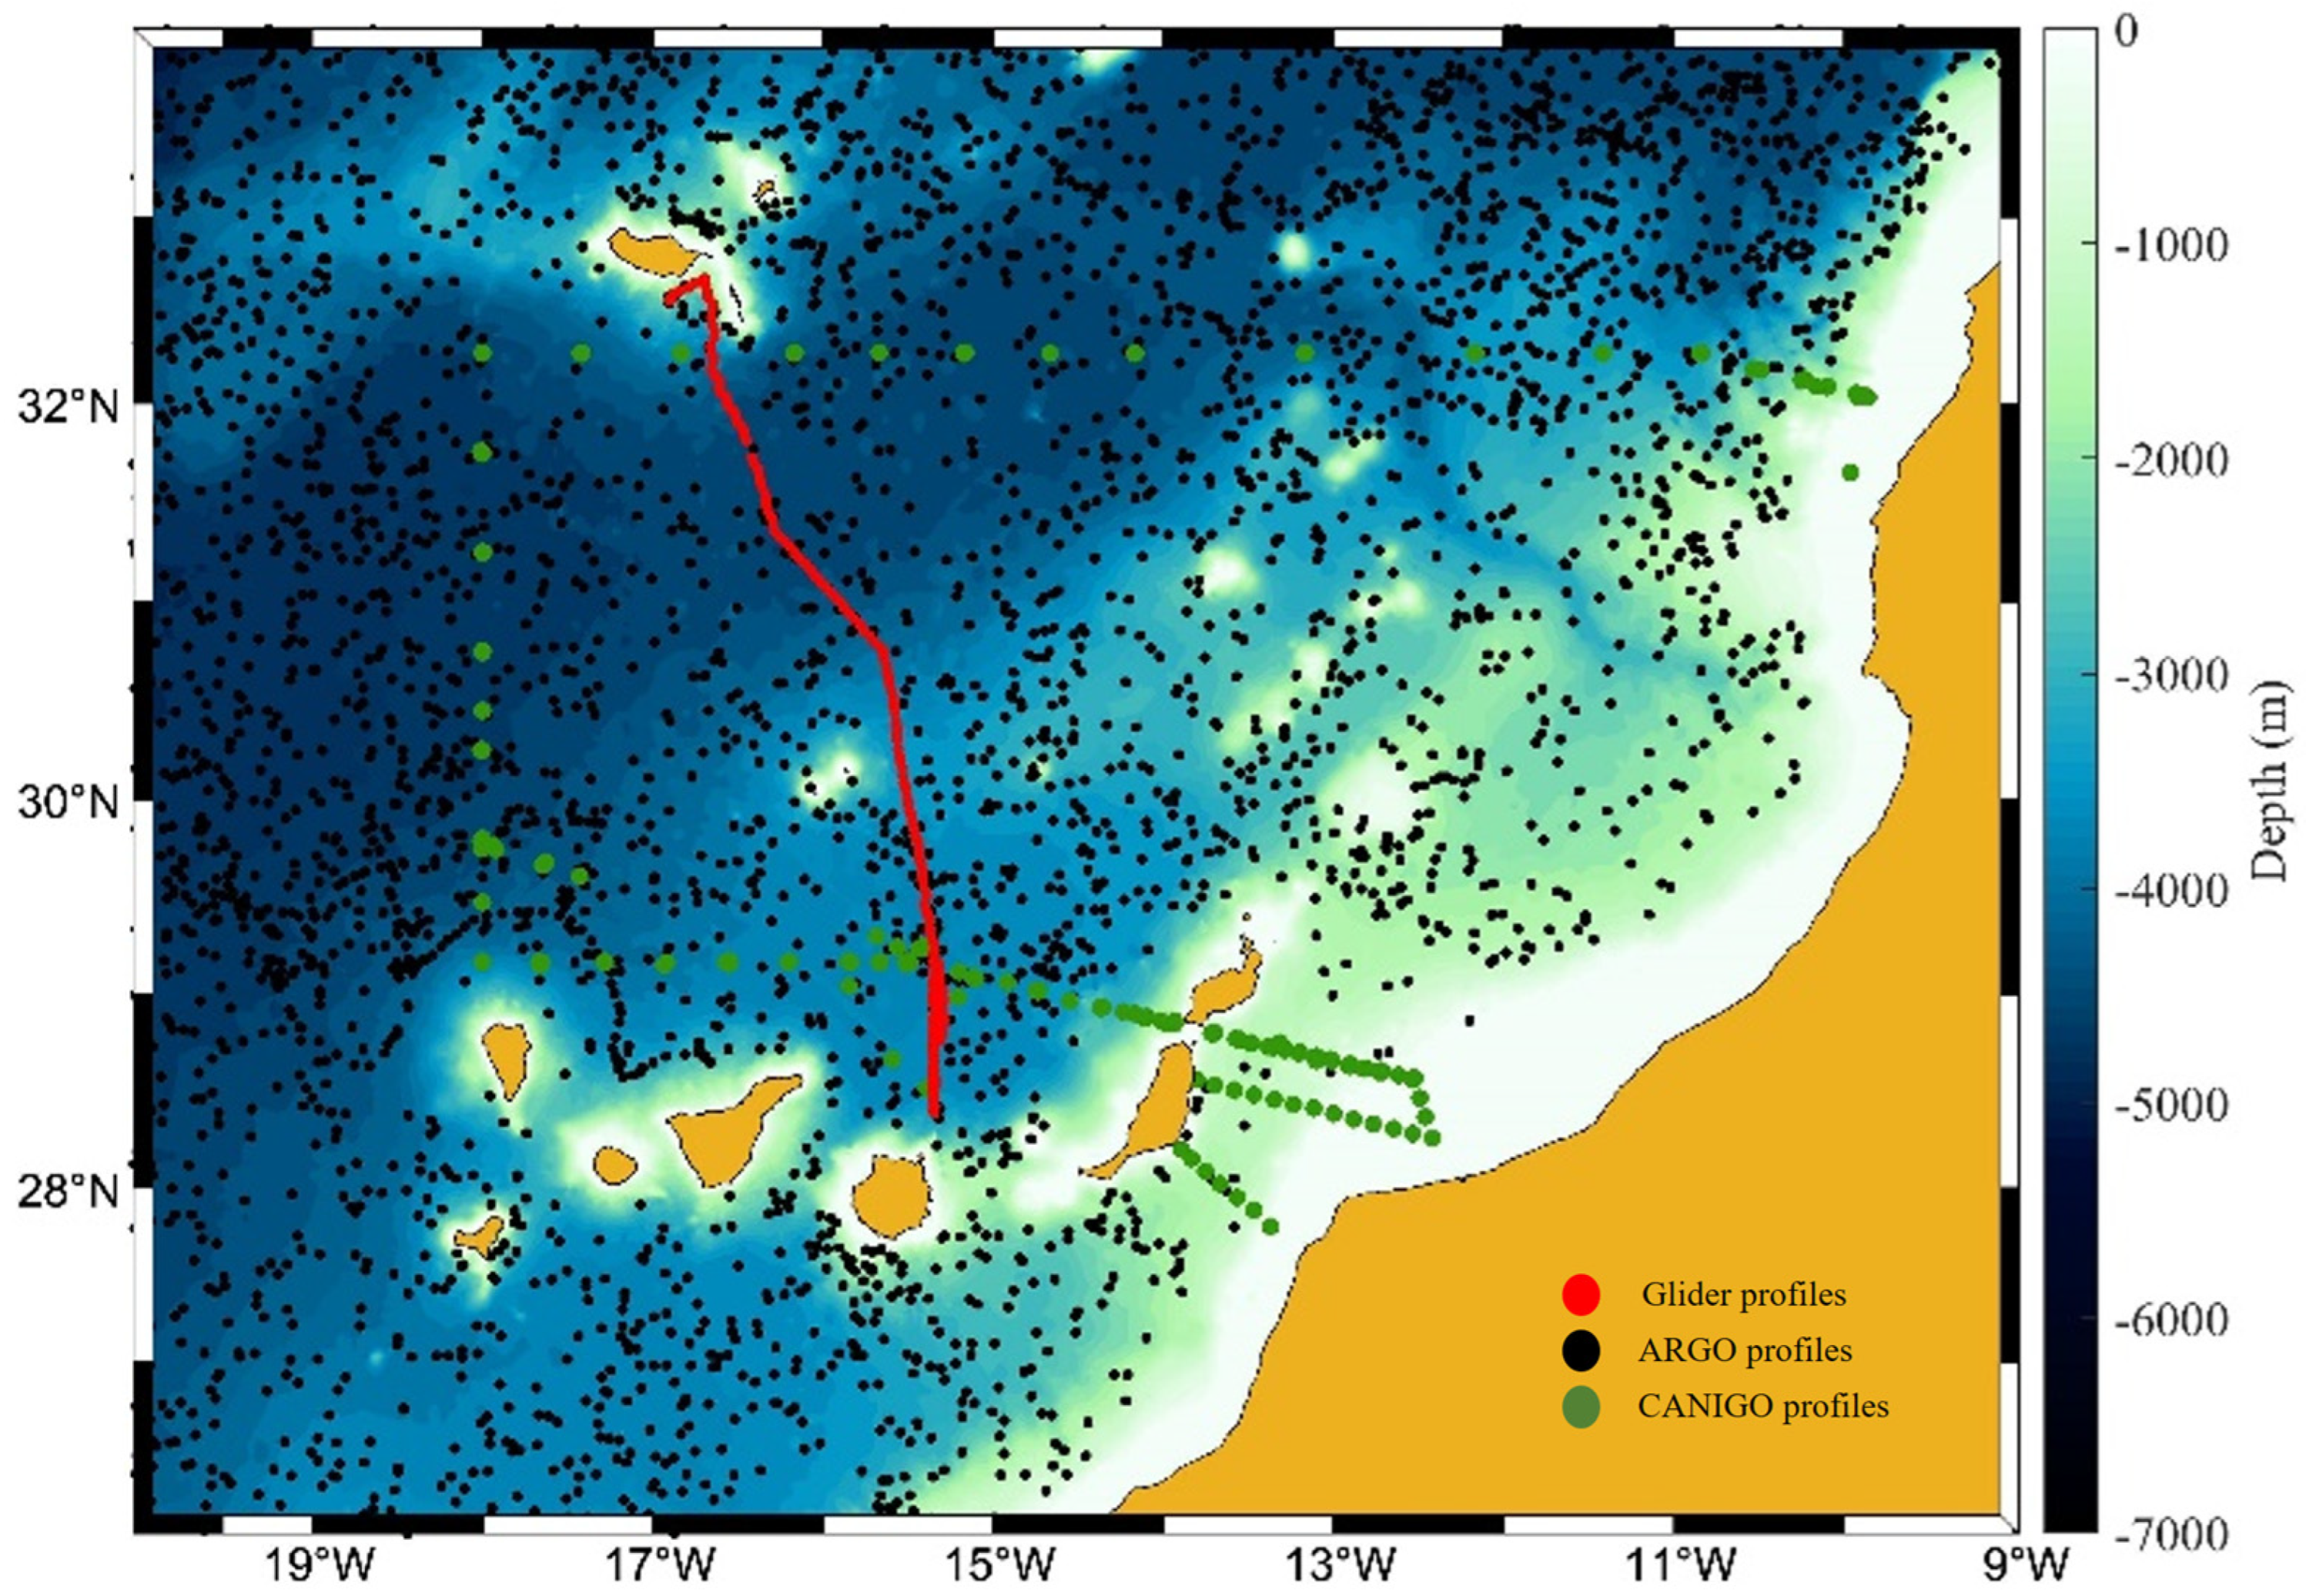
This analysis requires a hydrographic database as a reference. Therefore, we created such a database from existing standard oceanographic cruise stations and available ARGO profiles in the area of interest (Figure 3). This reference database comprises four cruises carried out during the “Canary Island-Azores-Gibraltar Observation” (CANIGO) project (1997 and 1998) [9,11,27] and all available ARGO data from 2002 to 2021 in the Canary basin region (26° N–33° N and 9° W–20° W). ARGO data are already recognized as a reliable source of information globally [28], with regional quality controls by experts [29]. The data offer a considerably larger number of profiles with which to perform a more robust comparative analysis of quality for our data set from the glider mission. In our case, we created a database of 211 oceanographic cruise profiles and 4135 ARGO profiles for the Canary basin (Figure 3). Only those closest to the glider trajectory are used in the analysis (Table 1).
The glider records were compared and contrasted with the CANIGO cruises and ARGO data by a crossover analysis. Specifically, the comparative analysis with the historical data was applied to potential temperature, salinity and dissolved oxygen records by isopycnal levels from a depth level deeper than 200 m and for profiles located in the oceanographic stations within 1° from glider observations. With this minimum distance condition (1° × 1°), the crossover analysis does not compare all the profiles in the database, but we ensure a more accurate crossover analysis.
It should be noted that for a proper crossover analysis, both observations in the deep ocean (>1500 m) should be compared assuming property invariance at these water column levels [26]. However, our glider section only explores the upper 900 m of the water column; we are unable to compare the measurements in the deep ocean. To ensure consistency in the results of the analysis, we relied on the Eastern North Atlantic Central Water (ENACW), extending from 200 to 600 m depth with a characteristic linear θ–S relationship [30]. These data are properly described in different hydrographic studies in the study region [31,32]. The property invariance is approached by the existence of a point of minimum standard deviation in the salinity of the reference data set (0.019) within the layer with potential temperature from 12 °C to 12.5 °C. This point corresponds to water type H (12.2 °C and 35.66 °C, after Harvey [31]) and is defined as the inflection point between tropical ENACW and subpolar ENACW [32].
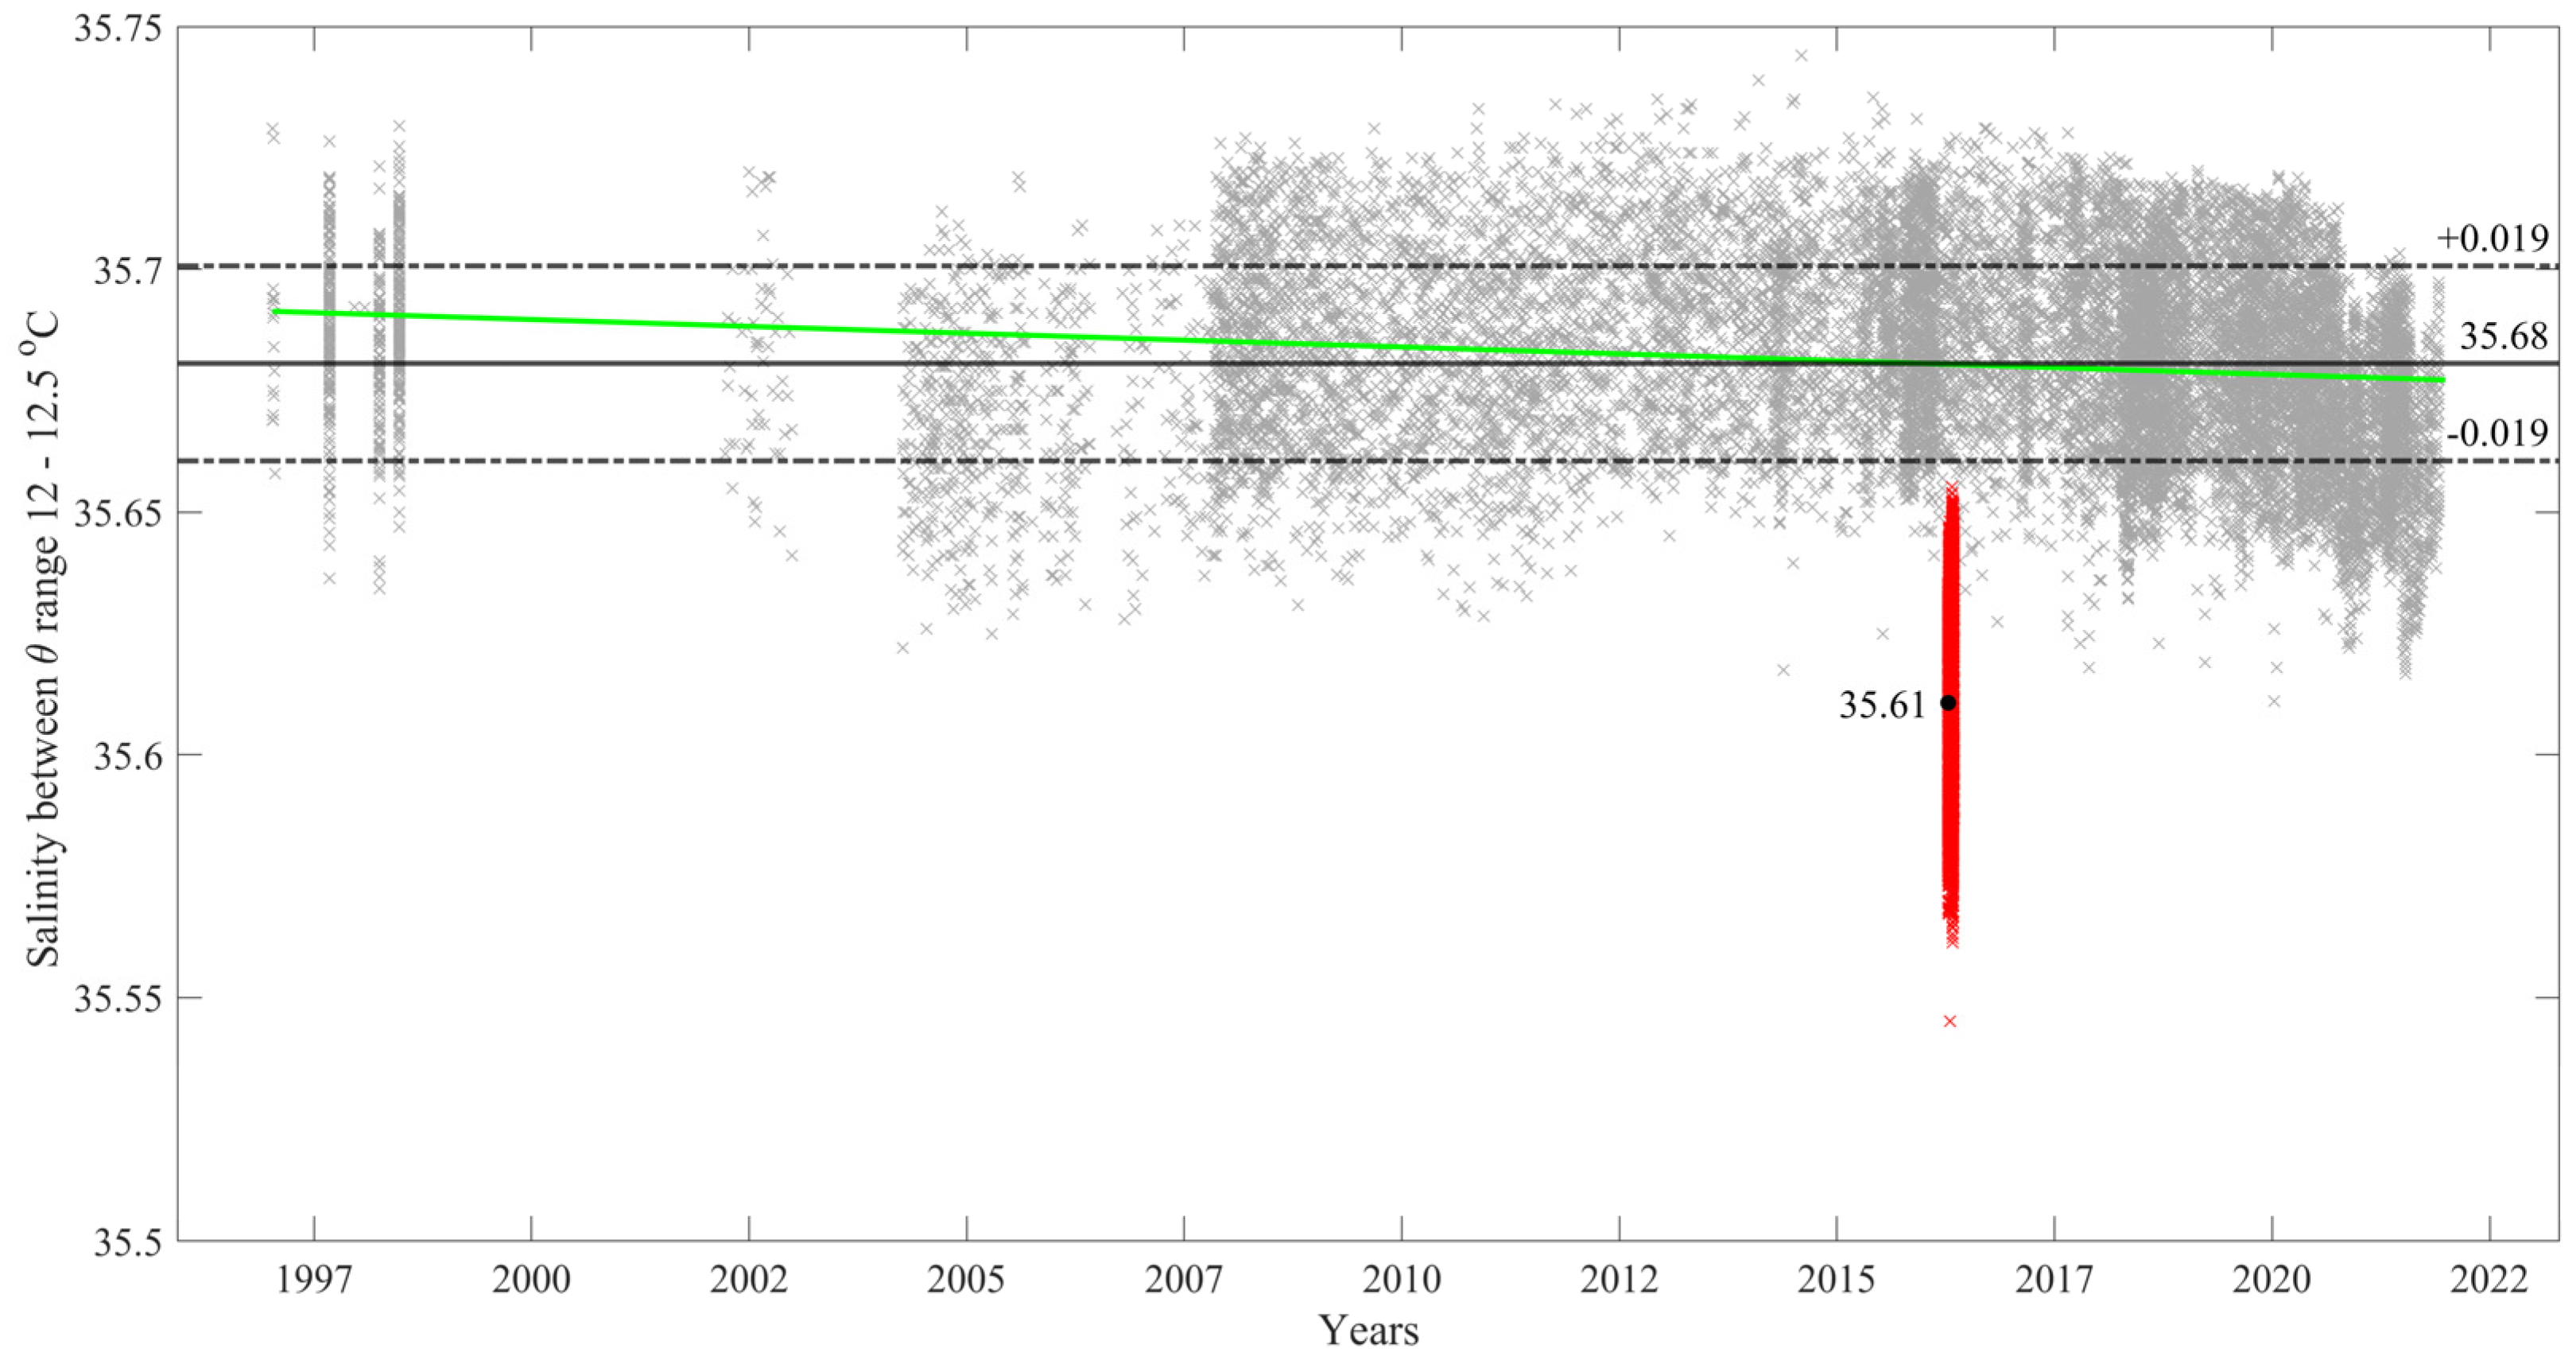
Figure 4 shows the temporal distribution of salinity from the reference database (in gray) and the distribution of the uncorrected glider salinity (in red) over the potential temperature range of minimum variance (12–12.5 °C). It is evident that glider measurements represent a separate sample, with a mean value of 35.61 ± 0.018 against 35.68 ± 0.19 for the reference database. There is indeed a small trend of 5.67 × 10⁻⁴ y−1 which amounts to a change in salinity of −0.01 during the 25 years of the database record (green line). However, this value could be also related to the interannual oscillations. These oscillations seemingly appear in the time series (Figure 4) and roughly have the same amplitude, as the length of the time series is not sufficient to filter out decadal variability. This analysis gives confidence in the use of crossover analysis for central and intermediate water layers in this region.
The results of this analysis do not show deviations in the temperature and dissolved oxygen records, but an offset was obtained in the salinity records. Figure 5 shows the results of the crossover analysis for the salinity measurements where the weighted mean offset, with error bars indicating its standard deviation, for each individual reference platform is plotted. The parts of the profiles with low variability have more weight in the calculation of an offset. Each reference platform is sorted by time on the x-axis to detect possible temporal trends. All resulting offsets were negative, with a weighted mean of −0.06 ± 0.01, larger that the calculated linear trend. This suggests that the glider salinity measurements had a negative bias. It is worth noting that this value almost exactly corresponds with the mean salinity difference between the reference data set and the glider section at the potential temperature interval corresponding to water type H (12–12.5 °C); that is more than three times larger than the salinity standard deviation for either of the data sets. Therefore, it was decided to add 0.06 to all salinity values measured by the glider.

3. Results

3.1. AAIW Distribution along the Glider Section

The AAIW is identified by salinity (<35.5) and dissolved oxygen (<140 μmol kg−1) minima in the intermediate levels [8,9,10,11]. In the glider salinity section (Figure 6A), the lower values are located at the southernmost latitudes, just north of the island of Gran Canaria and between 600 m and 960 m depth. A minimum in dissolved oxygen is found concurrent with the minimum in salinity (Figure 6B) with concentrations between 140 μmol kg−1 and 110 μmol kg−1. This confirms the presence of the AAIW, a water mass with low salinity and high dissolved oxygen at its origin, but which decreases considerably on its long path from its formation zone to the North Atlantic; its concentration in dissolved oxygen is minimal with respect to other waters around. The salinity and oxygen minima gradually disappear towards the north due to the accumulative effect of mixing with surrounding water masses saltier and richer in DO. This monotonic increase in salinity and oxygen is interrupted by the presence of mesoscale local minima between 31° N and 32° N. The distribution of temperature in the water column along the section shows a similar pattern to salinity and DO, where we find a minimum (<9 °C) in the southernmost latitudes of the section (Figure 6C).
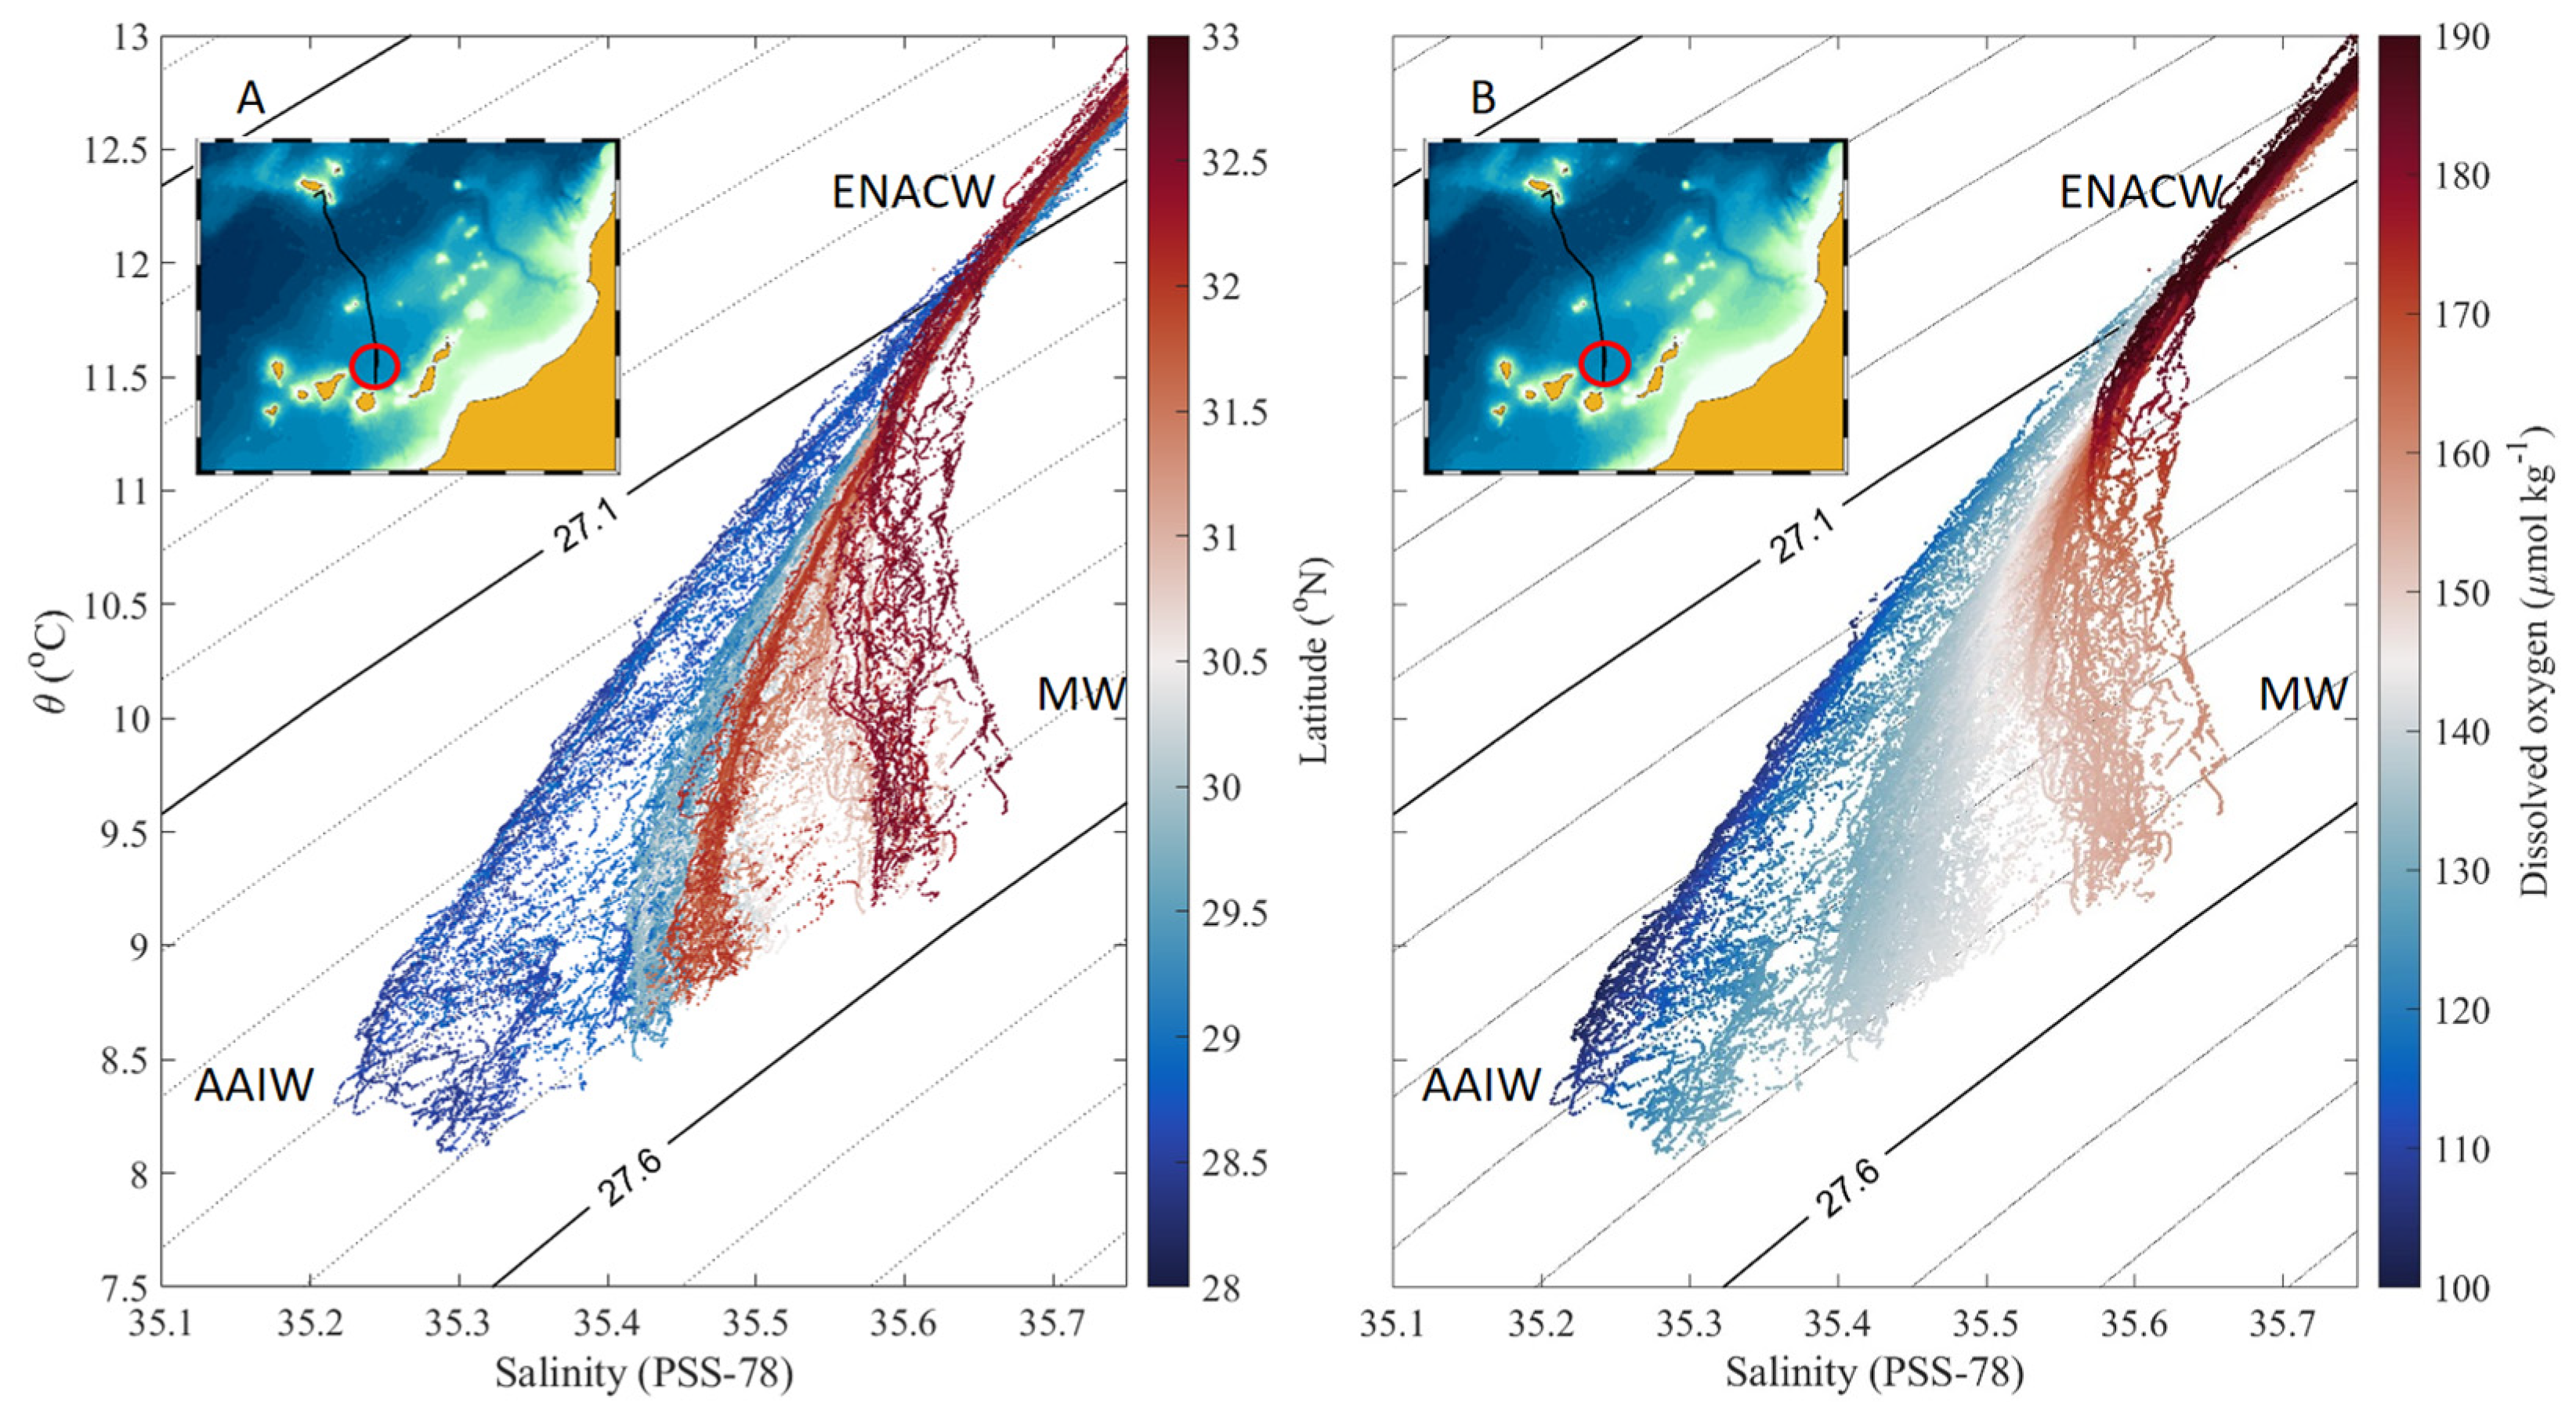
The corresponding θ–S diagram, with the color scale corresponding to latitude, clearly shows the meridional gradient of the thermohaline properties in the intermediate depths of the water column (Figure 7A). The θ–S mixing lines fan out from lower to higher salinities between the 27.1 kg m−3 and 27.6 kg m−3 isopycnals. This structure reflects the interaction between the central water masses, ENACW, and the intermediate ones, AAIW and MW, which converge in this region. These intermediate levels are dominated by the thermohaline characteristics of AAIW in the southernmost profiles (blue colors in Figure 7A), while northward, the increased salinity and temperature indicate the growing influence of MW in the mixture (red colors in Figure 7A).
The θ–S plot, using DO concentrations as the color scale (Figure 7B), shows the lowest dissolved oxygen concentrations (<140 μmol kg−1) at the θ–S values closest to AAIW thermohaline characteristics (Figure 7B). The low salinity and DO values represented by the blue colors, over the 27.4 kg m−3 and 27.5 kg m−3 isopycnals, confirm the presence of the AAIW core at those latitudes.

3.2. AAIW Thermohaline Intrusions

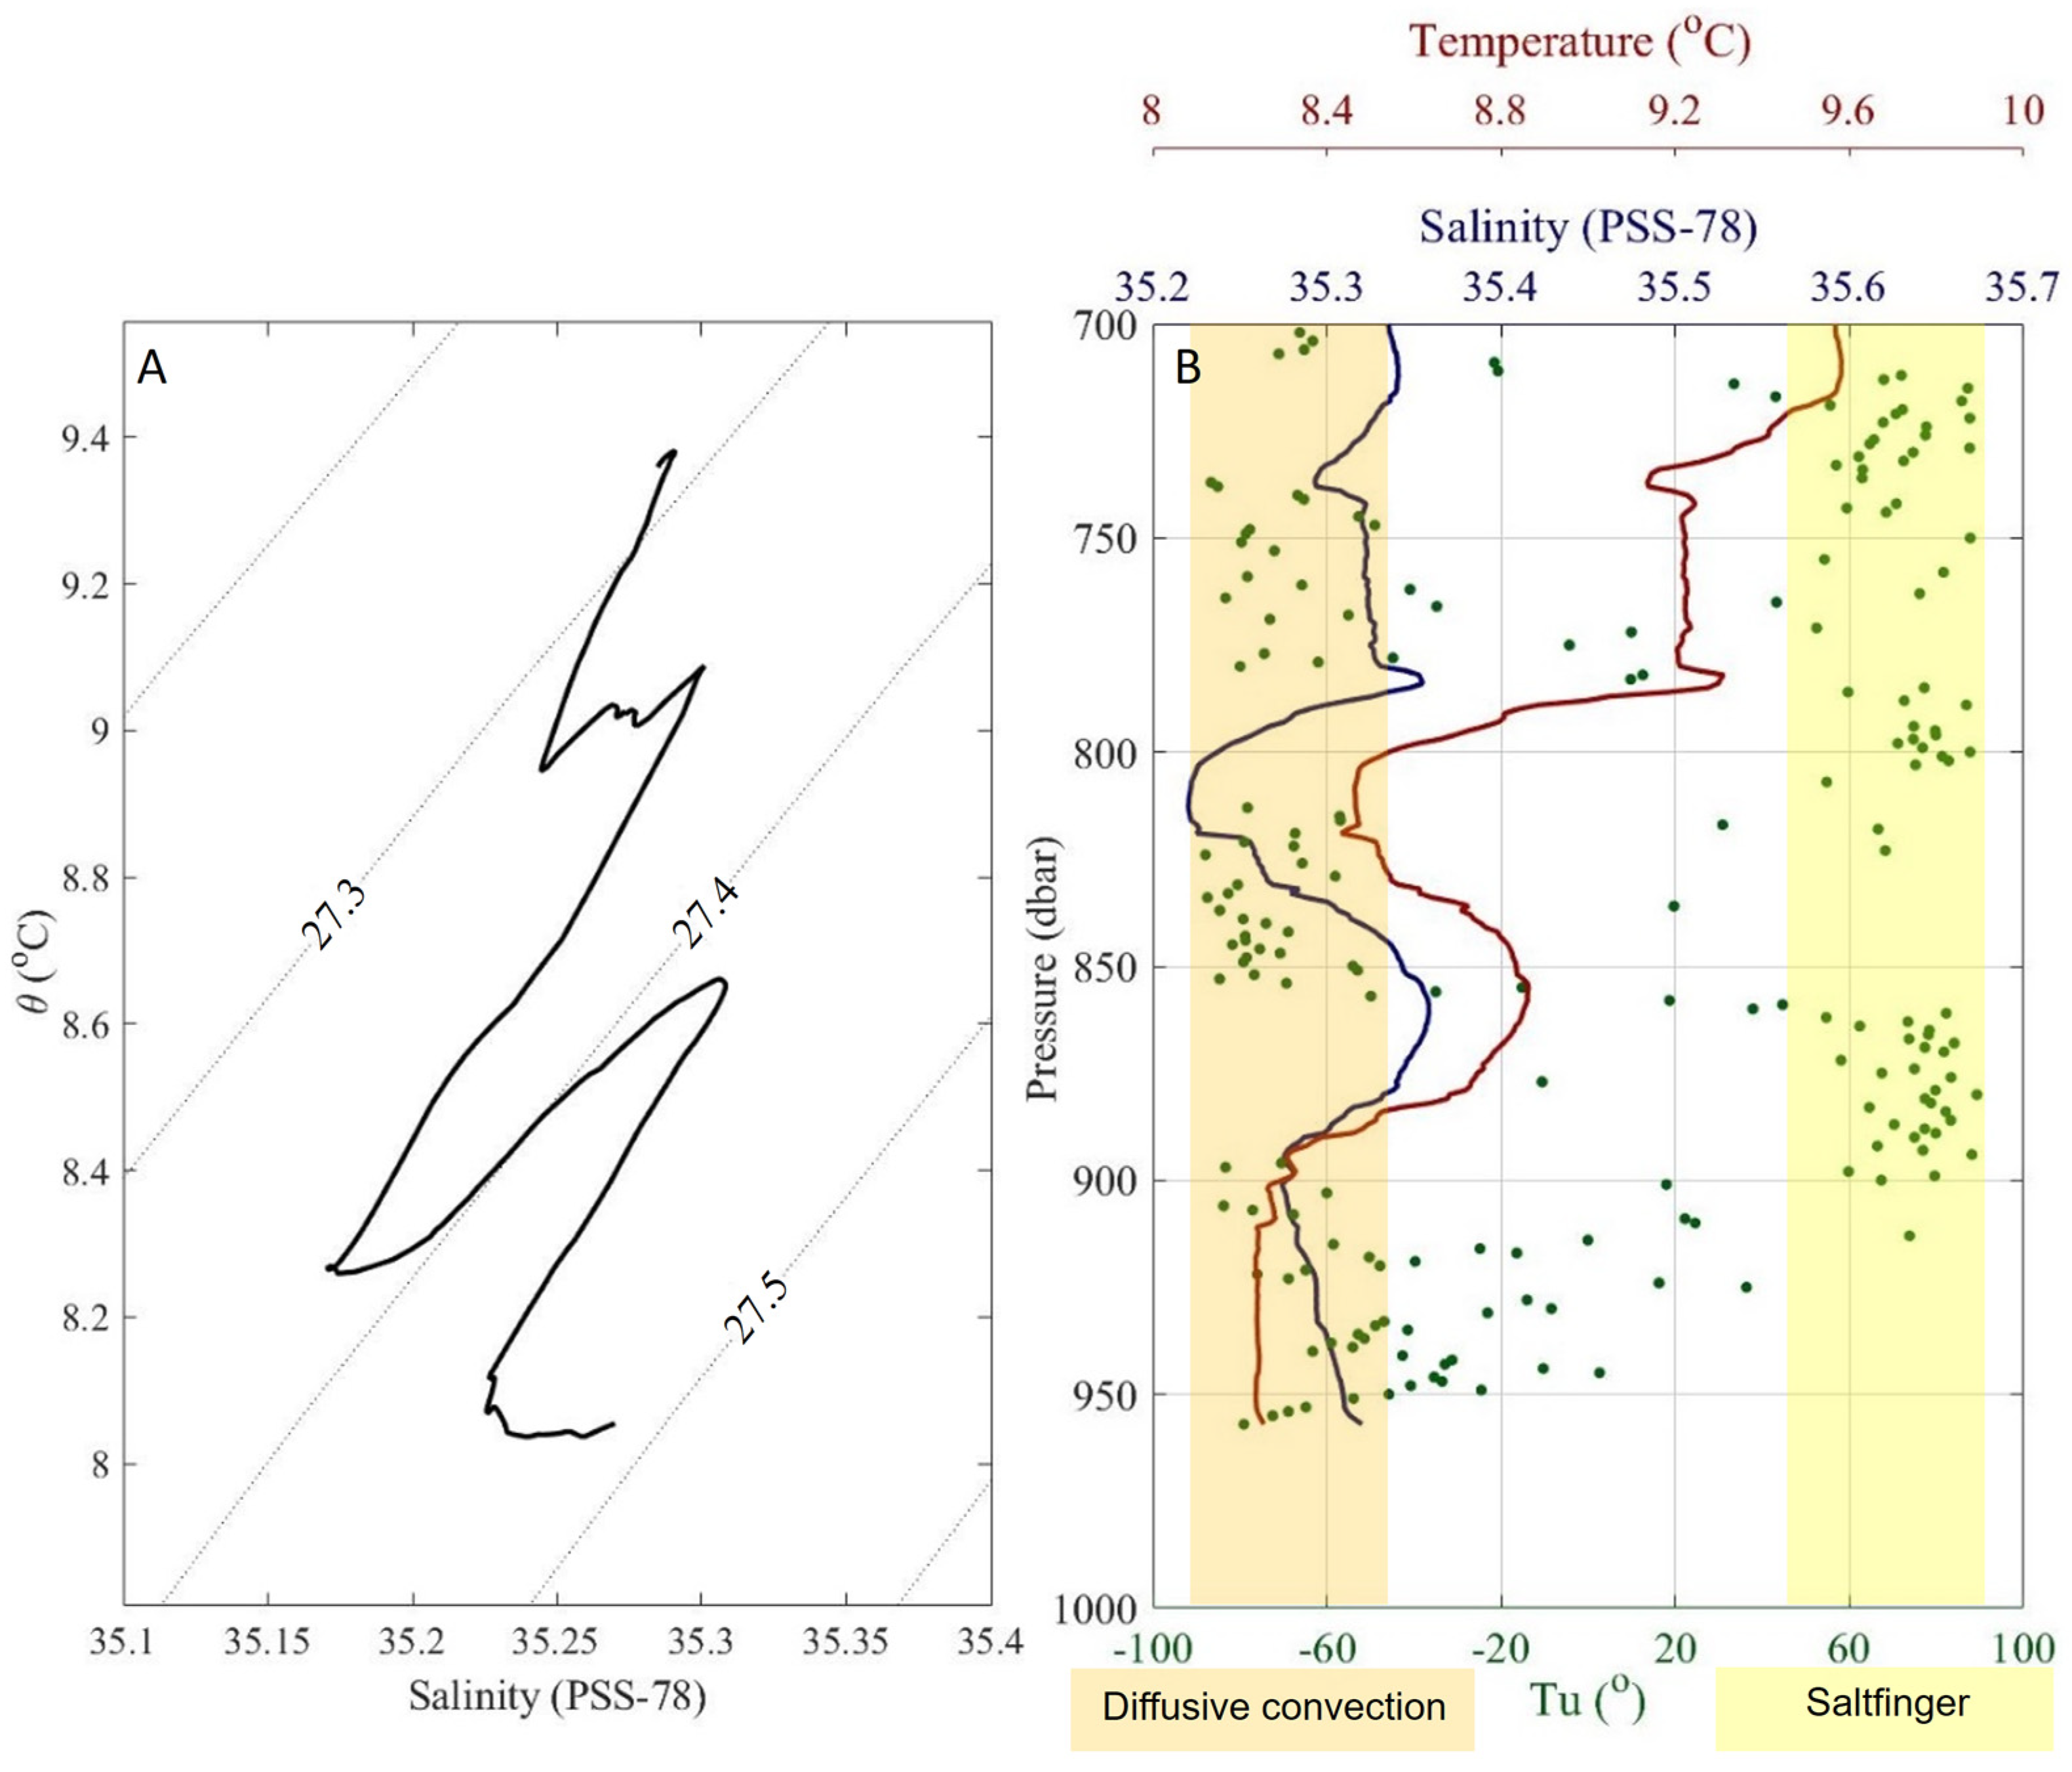
The part of the glider transects where AAIW is located with more contribution. This is located just north of the island of Gran Canaria (Figure 6 and Figure 7) and is characterized by the presence of “zigzagging” θ–S profiles. These structures show salinity and temperature inversions in the form of interleaving layers, also known as thermohaline intrusions [33,34,35,36]. The interleaving layers have been observed mainly between 28.4° N and 29.0° N, within the 700–960 m depth layer in the isopycnal range of 27.3 kg m−3 to 27.5 kg m−3. For instance, profile #154 from the glider section shows how the layers intercalate clearly (Figure 8A), with salinity and temperature jumping up to 0.15 °C and 0.8 °C, respectively. DO concentration also shows differences of approximately 30 μmol kg−1 in these structures. These interleaving layers are the result of the frontal interaction between a cold and fresh mixed water mass, with larger AAIW contribution, and another warmer and saline one, with more presence of MW and ENCAW.
At the interfaces of the observed interleaving layers, favorable conditions may exist for diapycnal mixing through double diffusion processes [37,38]. These processes occur when the potential temperature and salinity gradients have the same sign [39,40]. The occurrence of these mixing processes could be one of the main mechanisms for a stretching of these layers to occur. To evaluate that possibility, the Turner’s angle [41] has been calculated on individual profiles (Figure 8B). Turner’s angle (Tu), defined by Equation (1), is a parameter that describes the local stability of a water column as it undergoes double diffusion. This parameter allows us to differentiate the type of double diffusion (saltfingering or diffusive convection) and to evaluate their intensity in the water column as a function of its numerical value.
Tu   ( deg ) = atan ( α d θ dz β dS dz , α d θ dz + β dS dz   )
where α is the thermal expansion coefficient, β is the salt contraction coefficient and θ and S are the potential temperature and salinity, respectively. Tu values between −90° and −45° indicate that the water column is favorable for diffusive convection, while for values between 45° and 90°, vertical mixing can occur by saltfingering. Tu values between −45° and 45° represent regions with stable stratification.
The Tu values calculated for profile #154 (Figure 8B) indicate that the interleaving layers are favorable for diffusive and saltfinger interfaces to form. On the one hand, when the thermohaline gradient is negative, mixing by saltfinger predominates, whereas when the thermohaline gradient is positive, we find mixing by convective diffusion. In addition, Tu values close to 90° and −90° indicate a high intensity of vertical mixing in either case.

4. Discussion and Conclusions

The intermediate waters form the upper limb of the Meridional Overturning Circulation (MOC) [14]. In particular, the AAIW is one of the most relevant intermediate water masses because it plays an essential role in northward compensating transport in the Atlantic “cold water path” [42,43]. Variations in its northward extent in the Atlantic may reflect the strength of the AMOC [44].
The northward spreading of AAIW and its interaction with adjacent water masses at the eastern boundary of NASG have been studied using a glider hydrographic section. Based on previous studies, the AAIW has been identified by minima in salinity (<35.5) and DO (<140 μmol kg−1) in the isopycnal range from 27.3 kg m−3 to 27.6 kg m−3 [4,9,11].
The glider section shows the presence of AAIW in the profiles of the southernmost region corresponding to the north of the Gran Canaria Island. The location of the AAIW signal is significantly away from what is considered its main pathway of northward penetration, located in the channel between easternmost Canary Islands (Fuerteventura and Lanzarote) and the African slope [11]. However, there is earlier evidence of AAIW passage through the channel between Gran Canaria and Fuerteventura [16]. This pathway has recently been evaluated. It was suggested that, once past the archipelago, this branch quickly diverts to the mainland forced by interaction with seamounts [17]. In the salinity and DO glider sections (Figure 6A,B), a meridional gradient that could be interpreted as a northward propagation of the AAIW between 15° W and 17° W is observed, quite a distance away from the slope pathway.
The meridional gradients of salinity and dissolved oxygen in the intermediate levels of the water column are not constant throughout the section. The minimum values of salinity (<35.5) and DO (<140 μmol kg−1) reach up to latitudes of 30.5° N. Further north, between 31.2° N and 32.1° N, these minima recur. This could evidence the importance of mesoscale processes in the distribution of intermediate water column properties in this region. These are the latitudes at which Pascual-Collar et al. [19] found the cyclonic turning of AAIW that detaches from the continental slope and starts an advective westward flow that penetrates up to 16.2° W. It is also within the area of potential interaction with eddies that Machín and Pelegrí [18] proposed as a mechanism for westward advection of AAIW.
Mixing processes are key in the distribution of the water masses. Our θ–S plots (Figure 7) show the interaction of the three water masses present at intermediate depths in the area of interest. Pérez et al. [9] hypothesized that the diapycnal experienced by the AAIW might be stronger than the isopycnal. Subsequently, Machín and Pelegrí [11] evaluated the possibility of occurrence of double diffusion in the upper part of the AAIW, suggesting that this processing could be responsible of AAIW signal erosion. Therefore, its propagation further north is limited. Previous studies on AAIW mixing processes in the study area, including those mentioned above, have mostly been based on results obtained through oceanographic cruises. Our glider observations, with resolution enough to resolve submesoscale processes, report the existence of interleaving layers in the southernmost profiles, where higher AAIW proportion was found. An example of this is shown for profile #154 (Figure 8). To our knowledge, no evidence of this type of structure has been described in the intermediate levels of the water column in this region.
Normally, the interleaving layers remain for relatively short periods of time (days to weeks). This is even more so in regions rich in mesoscale dynamics such as the Canary basin [34,45]. The presence of these structures evidences that the salinity and DO minima found in the southernmost part of the glider section correspond to AAIW recently transported, as its characteristics have not been stirred. In addition, the predominantly northerly flow in this layer (Figure 1) could indicate that this water mass, rich in AAIW, is transported through the channel between the islands of Gran Canaria and Fuerteventura.
To evaluate the possibility of occurrence of double diffusion processes, Tu was calculated. In the case of AAIW, a less saline and cold intrusion is observed, resulting in favorable interfaces for saltfinger mixing above and diffusive convection below. Both interfaces transport heat and salt at different rates and the density of the intrusions changes [37]. This would result in buoyancy forces that can generate movements across the front from one water mass to the other. This movement, double-diffusively driven, can increase lateral mixing between the two water masses [36,37,45]. It is precisely this fact that makes the study of the interleaving structures and their evolution in time and space relevant [34,45].
The contribution of the reported thermohaline intrusions to vertical mixing is uncertain as it depends on turbulence microstructure [46]. However, it is important to remark that these mixing structures seem to be quite ubiquitous, as they have also been detected in different ARGO profiles with similar characteristics, which are not shown in this study.
This objective can only be achieved with the use of a multiplatform ocean observation approach including high-resolution and targeted glider missions. These instruments have allowed us to infer sub-mesoscale processes with a horizontal and temporal resolution that are impossible to obtain through observations made from traditional platforms such as oceanographic cruises. It would also not be possible to obtain such data using remote systems such as ARGO floats because of the larger horizontal and temporal gap between two successive profiles; they also drift with the flow and are not remotely controlled for monitoring specific areas at the required time.
The importance of understanding the role of submesoscale and mesoscale processes in large-scale ocean structure and circulation must be emphasized. Therefore, we believe that a coherent integration of information obtained through different products, such as oceanographic cruises, ARGO floats and ocean state reanalyses would give a more accurate understanding of oceanographic processes.
Such an example is the combined use of the glider data used in this work and the Copernicus Marine Environmental Monitoring Service (CMEMS) Iberian–Biscay–Ireland (IBI) ocean physics reanalysis product [47,48]. The domain covered by the IBI reanalysis is limited by the 26° and 56° N parallels and the 19° W and 5° E meridians. It provides daily averages with a horizontal resolution of 0.083° × 0.083°. We have selected this product because it offers the best available spatio–temporal resolution and it assimilates observational in situ and remote data, including ARGO profiles [19,48].
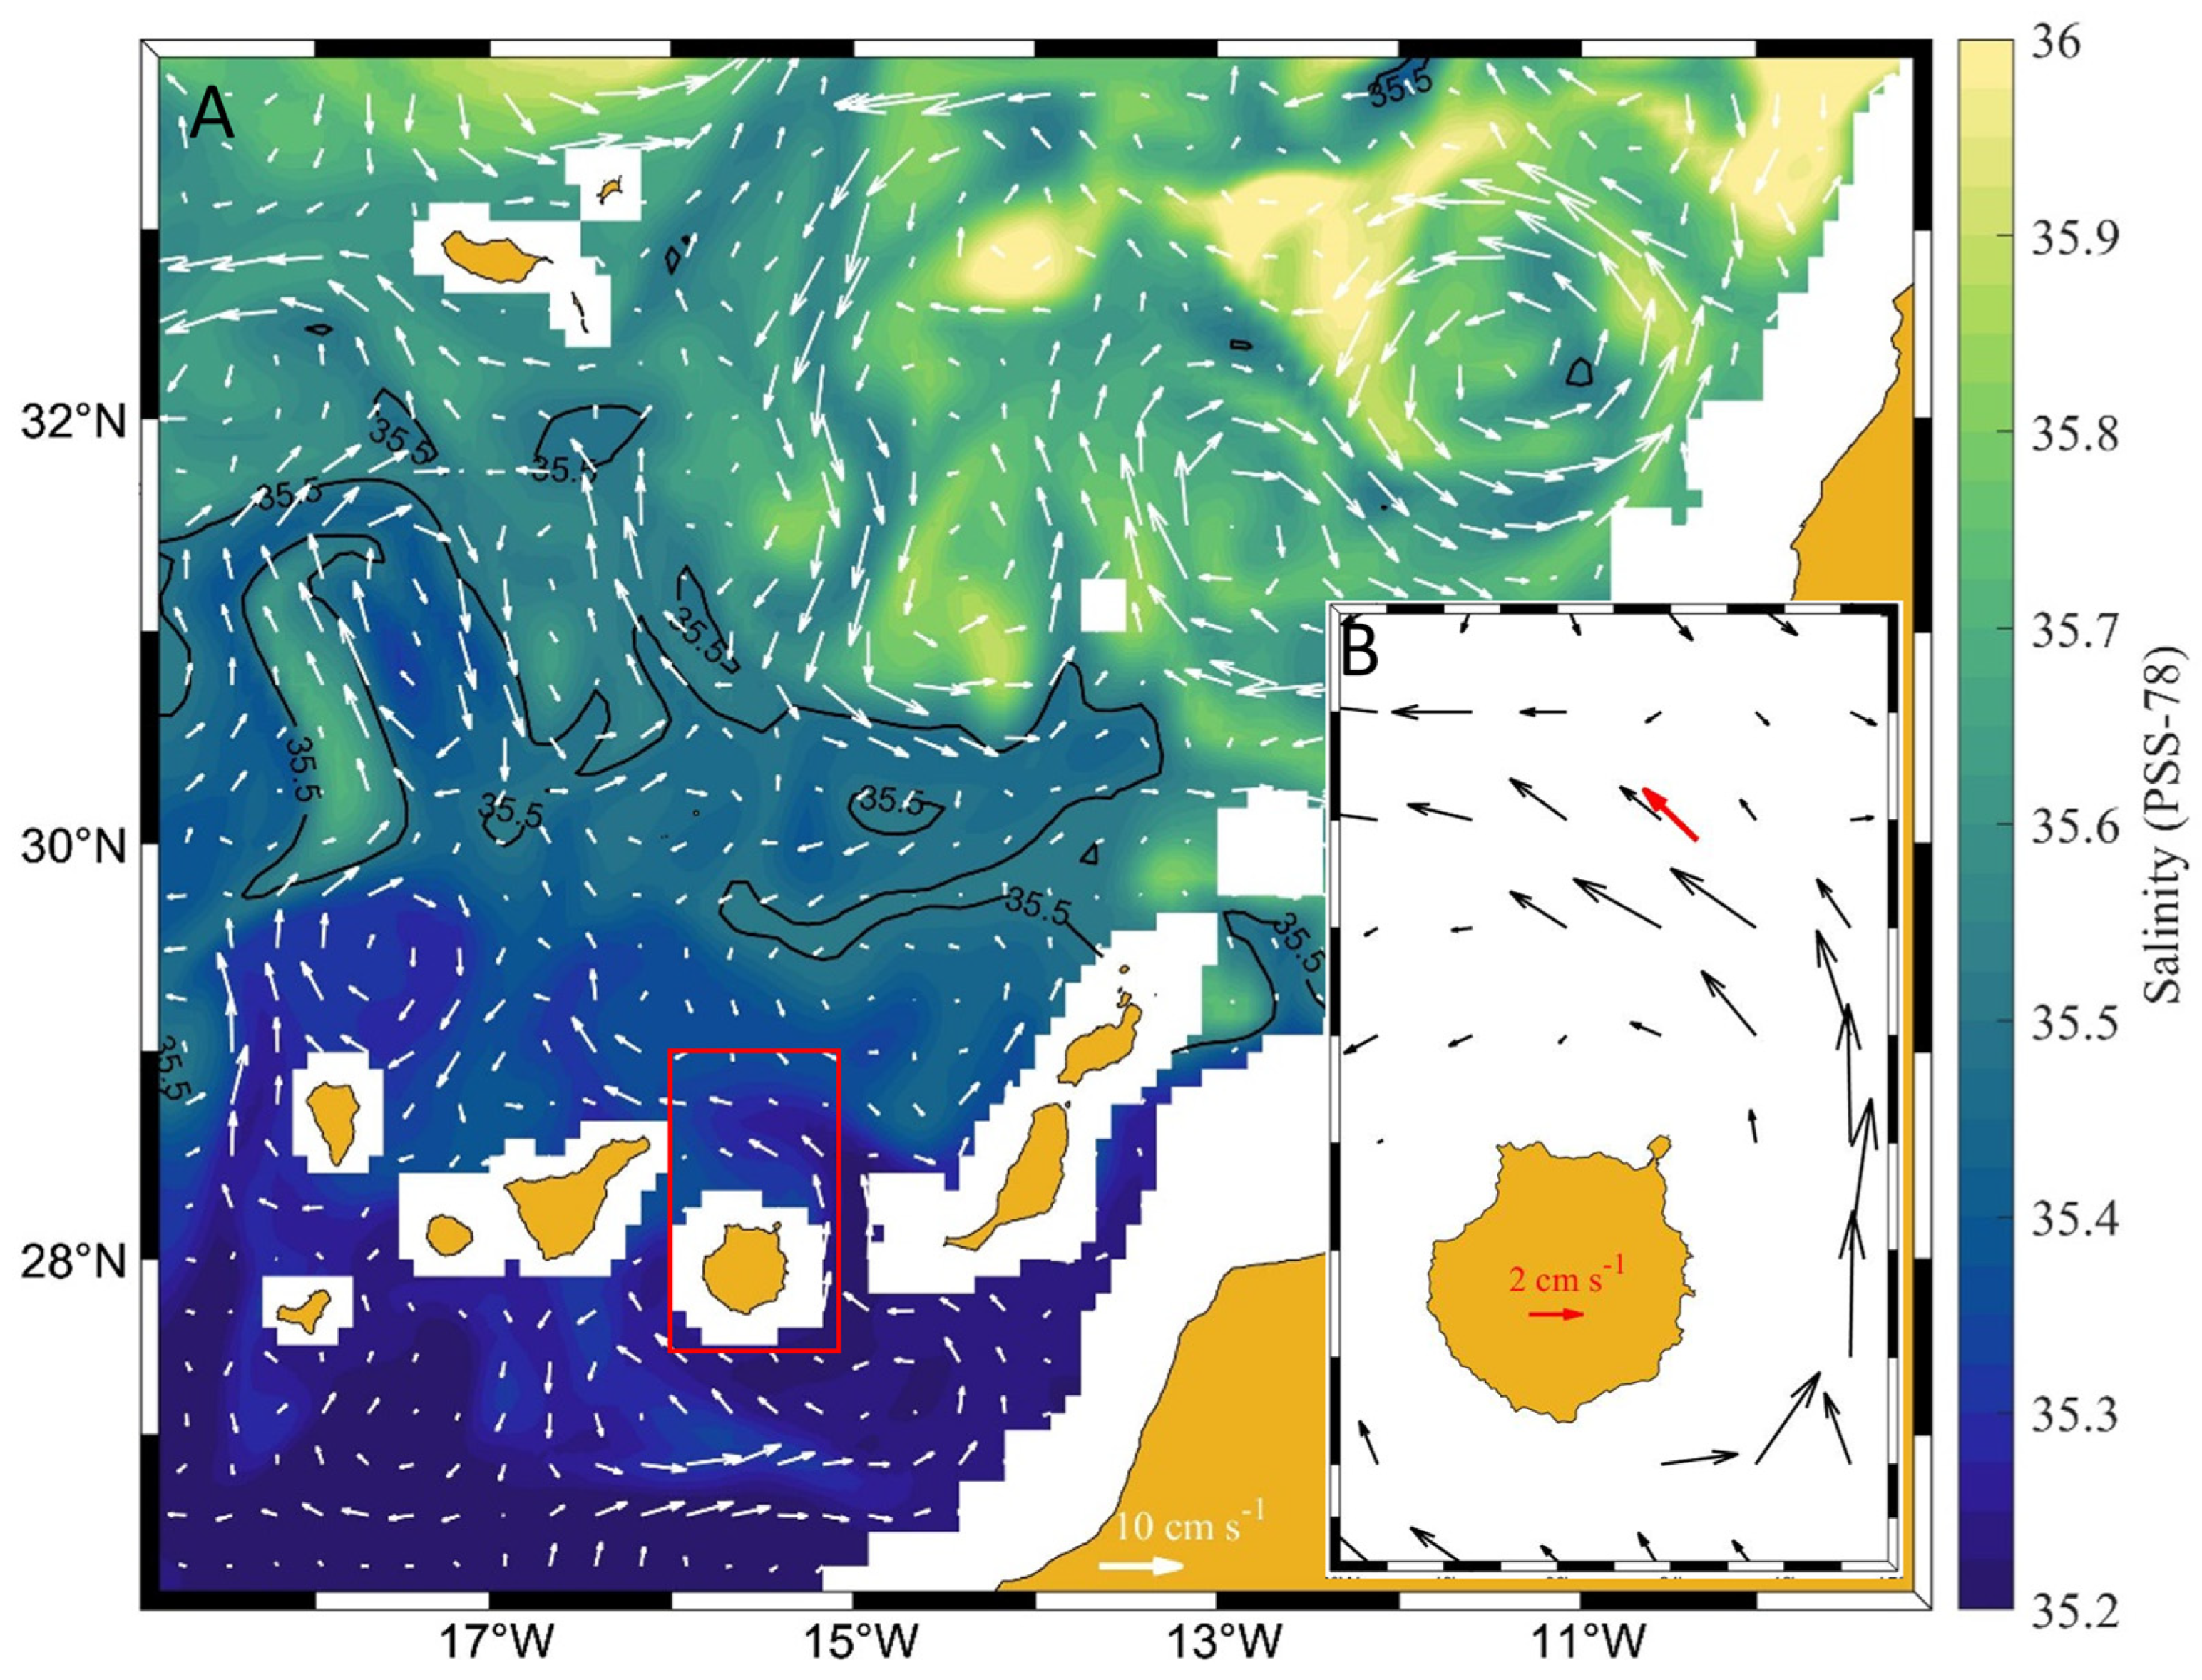
We plot the IBI salinity and current velocity at 900 m depth in the Canary basin for 30 April 2016. This particular day has been chosen since it coincides in time with the AAIW observations with the highest concentration made by the glider. The salinity field at 900 m depth, which approaches the depths where the AAIW core is located, shows a distribution reflecting the strong mesoscale dynamics of the intermediate levels of the water column (Figure 9). The lowest salinity values (<35.5), located in the southernmost regions, indicate that the AAIW spans a wide range of longitudes. The current velocity field at these depths also evidences the importance of mesoscale dynamics and provides consistent information on the intermediate circulation of the water column. The lower right inset of Figure 9 shows a zoom of the region to the north of the island of Gran Canaria where the currents were estimated from glider deviations from the planned trajectory for 30 April 2016 at approximately 900 m depth. The glider-derived currents and those provided by IBI at that location are similar in direction, giving robustness to this analysis.
Integrating the information from both products, we can deduce that the water mass with stronger AAIW signal observed by the glider to the south of the section has been advected through the channel between the islands of Gran Canaria and Fuerteventura. In addition, the generation of mixing structures such as thermohaline intrusions that are associated with the submesoscale is suspected to have a notable influence on the mesoescale circulation of the intermediate levels in this region. Some limitations of this study are the incomplete glider coverage of the intermediate water layer; the coverage only provides a time-slice of the ocean in that section, not allowing for the representation of the mean climate and the most important variabilities. However, the potential for revealing processes occurring on sub- and mesoscales which may have a large-scale impact highlights the benefit of using repeated glider sections as a complement to other existing and widely used observing platforms. This smaller scale dynamics could be one of the mechanisms limiting the spread of AAIW in the region, potentially playing a relevant role in the upper limb of MOC [45]. Additionally, a glider equipped with microstructure probes would allow for understanding of the contribution of the detected interleaving structures to mixing. These types of submesoscale and mesoscale studies in the ocean interior are essential for a better understanding of global dynamics; this is particularly true for regions where the limits of water mass propagation occur, such as the eastern edge of the Northeast Subtropical Atlantic.

Author Contributions

Conceptualization, A.I. and A.C.; methodology, J.A.J.-R. and C.F.-M.; software, J.A.J.-R. and C.F.-M.; validation, J.A.J.-R., A.I. and A.C.; formal analysis, A.I.; investigation, J.A.J.-R., A.I. and A.C.; resources, A.C.; data curation, J.A.J.-R.; writing—original draft preparation, J.A.J.-R.; writing—review and editing, J.A.J.-R., A.I. and A.C.; visualization, J.A.J.-R.; supervision, A.I. and A.C.; project administration, A.I.; funding acquisition, A.I. and A.C. All authors have read and agreed to the published version of the manuscript.

Funding

This research was funded by Optimising and Enhancing the Integrated Atlantic Ocean Observing Systems (AtlantOS) project, grant number H2020-BG-2014-2/BG-08-2014 and Vulnerability of Littoral Cultural Heritage to environmental agents: impact of Climate Change (VOLICHE) project, grant number PID2020-117812RB-I00.

Institutional Review Board Statement

Not applicable.

Informed Consent Statement

Not applicable.

Data Availability Statement

MADEIRA2016 glider data are available at http://obsplatforms.plocan.eu/vehicle/mission/5/ (accessed on 6 March 2020). ARGO data are available at https://www.ncei.noaa.gov/data/oceans/argo/gdac/ (accessed on 3 January 2022). Copernicus Marine Environmental Monitoring Service (CMEMS) Iberian–Biscay–Ireland (IBI) ocean physics reanalysis are available at https://data.marine.copernicus.eu/product/IBI_MULTIYEAR_PHY_005_002/services (accessed on 17 January 2023).

Acknowledgments

The authors would like to thank the Plataforma Oceánica de Canarias (PLOCAN), ARGO program and Copernicus Marine Environmental Monitoring Service (CMEMS) for the public access data.

Conflicts of Interest

The authors declare no conflict of interest.

References

  1. Van Aken, H.M. The hydrography of the mid-latitude Northeast Atlantic Ocean II: The intermediate water masses. Deep-Sea Res. I Oceanogr. Res. Pap. 2000, 47, 789–824. [Google Scholar] [CrossRef]
  2. Herbaut, C.; Houssais, M.N. Response of the eastern North Atlantic subpolar gyre to the North Atlantic Oscillation. Geophys. Res. Lett. 2009, 36, 17607. [Google Scholar] [CrossRef]
  3. Pastor, M.V.; Peña-Izquierdo, J.; Pelegrí, J.L.; Marrero-Díaz, A. Meridional changes in water mass distributions off NW Africa during November 2007/2008. Cienc. Mar. 2012, 38, 223–244. [Google Scholar] [CrossRef] [Green Version]
  4. Bashmachnikov, I.; Nascimento, Â.; Neves, F.; Menezes, T.; Koldunov, N.V. Distribution of intermediate water masses in the subtropical northeast Atlantic. Ocean Sci. 2015, 11, 803–827. [Google Scholar] [CrossRef] [Green Version]
  5. Louarn, E.; Morin, P. Antarctic Intermediate Water Influence on Mediterranean Sea Water Outflow. Deep-Sea Res. I Oceanogr. Res. Pap. 2011, 58, 932–942. [Google Scholar] [CrossRef]
  6. Carracedo, L.I.; Pardo, P.C.; Flecha, S.; Pérez, F.F. On the Mediterranean Water Composition. J. Phys. Oceanogr. 2015, 46, 1339–1358. [Google Scholar] [CrossRef] [Green Version]
  7. Izquierdo, A.; Mikolajewicz, U. The role of tides in the spreading of Mediterranean Outflow waters along the southwestern Iberian margin. Ocean Model. 2019, 133, 27–43. [Google Scholar] [CrossRef]
  8. Tsuchiya, M. Circulation of the Antarctic Intermediate Water in the North Atlantic Ocean. J. Mar. Res. 1989, 47, 747–755. [Google Scholar] [CrossRef]
  9. Pérez, F.F.; Mintrop, L.; Llinas, O.; Glez-Davila, M.; Castro, C.G.; Alvarez, M.; Kortzinger, A.; Santana-Casiano, M.; Rueda, M.J.; Rıos, A.F. Mixing analysis of nutrients, oxygen and inorganic carbon in the Canary Islands region. J. Mar. Syst. 2001, 28, 183–201. [Google Scholar] [CrossRef] [Green Version]
  10. Carracedo, L.I.; Pardo, P.C.; Villacieros-Robineau, N.; de la Granda, F.; Gilcoto, M.; Pérez, F.F. Temporal changes in the water mass distribution and transports along the 20° W CAIBOX section (NE Atlantic). Cienc. Mar. 2012, 38, 263–286. [Google Scholar] [CrossRef]
  11. Machín, F.; Pelegrí, J.L. Northward penetration of Antarctic intermediate water off Northwest Africa. J. Phys. Oceanogr. 2009, 39, 512–535. [Google Scholar] [CrossRef] [Green Version]
  12. Roque, D.; Parras-Berrocal, I.M.; Bruno, M.; Sánchez-Leal, R.; Hernández-Molina, F.J. Seasonal variability of intermediate water masses in the Gulf of Cádiz: Implications of the Antarctic and subarctic seesaw. Ocean Sci. 2019, 15, 1381–1397. [Google Scholar] [CrossRef] [Green Version]
  13. Fu, Y.; Wang, C.; Brandt, P.; Greatbatch, R.J. Interannual variability of Antarctic Intermediate Water in the tropical North Atlantic. J. Geophy. Res. Ocean. 2019, 124, 4044–4057. [Google Scholar] [CrossRef]
  14. Huang, K.F.; Oppo, D.W.; Curry, W.B. Decreased influence of Antarctic intermediate water in the tropical Atlantic during North Atlantic cold events. Earth Planet. Sci. Lett. 2014, 389, 200–208. [Google Scholar] [CrossRef] [Green Version]
  15. Machín, F.; Pelegrí, J.L.; Fraile-Nuez, E.; Vélez-Belchí, P.; López-Laatzen, F.; Hernández-Guerra, A. Seasonal flow reversals of intermediate waters in the canary current system east of the Canary Islands. J. Phys. Oceanogr. 2010, 40, 1902–1909. [Google Scholar] [CrossRef] [Green Version]
  16. Hernández-Guerra, A.; López-Laatzen, F.; Machín, F.; Armas, D.; Pelegrí, J.L. Water masses, circulation and transport in the Eastern Boundary Current of the North Atlantic Subtropical Gyre. Sci. Mar. 2001, 65, 177–186. [Google Scholar] [CrossRef]
  17. Vélez-Belchí, P.; Caínzos, V.; Romero, E.; Casanova-Masjoan, M.; Arumí-Planas, C.; Santana-Toscano, D.; González-Santana, A.; Pérez-Hernández, M.D.; Hernández-Guerra, A. The Canary Intermediate Poleward Undercurrent: Not Another Poleward Undercurrent in an Eastern Boundary Upwelling System. J. Phys. Oceanogr. 2021, 51, 2973–2990. [Google Scholar] [CrossRef]
  18. Machín, F.J.; Pelegrí, J.L. Interaction of Mediterranean Water Lenses with Antarctic Intermediate Water off Northwest Africa. Sci. Mar. 2016, 80, 205–214. [Google Scholar] [CrossRef] [Green Version]
  19. Pascual-Collar, A.; Sotillo, M.; Levier, B.; Aznar, R.; Lorente, P.; Amo, A.; Álvarez-Fanjul, E. Regional circulation patterns of Mediterranean Outflow Water near the Iberian and African continental slopes. Ocean Sci. 2019, 15, 565–582. [Google Scholar] [CrossRef] [Green Version]
  20. Roemmich, D.; Boebel, O.; Freeland, H.; King, B.; LeTraon, P.T.; Molinari, R.; Owens, W.B.; Riser, S.; Send, U.; Takeuchi, K.; et al. On the Design and Implementation of Argo: An Initial Plan for a Global Array of Profiling Floats; International CLIVAR Project Office Report 21, GODAE Report 5; GODAE International Project Office: Melbourne, Australia, 1998; p. 32. [Google Scholar]
  21. Wong, A.; Wijffels, E.S.; Riser, C.S.; Pouliquen, S.; Hosoda, S.; Roemmich, D.; Gilson, J.; Johnson, C.G.; Martini, K.; Murphy, J.D.; et al. Argo Data 1999–2019: Two Million Temperature-Salinity Profiles and Subsurface Velocity Observations From a Global Array of Profiling Floats. Front. Mar. Sci. 2020, 7, 700. [Google Scholar] [CrossRef]
  22. Webb, D.C.; Simonetti, P.J.; Jones, C.P. SLOCUM: An underwater glider propelled by environmental energy. IEEE J. Ocean. Eng. 2001, 26, 447–452. [Google Scholar] [CrossRef]
  23. Woithe, H.C.; Kremer, U. Using Slocum Gliders for Coordinated Spatial Sampling. In OCEANS 2011 IEEE: Spain; IEEE: Santander, Spain, 2011; pp. 1–8. [Google Scholar] [CrossRef]
  24. Bosse, A.; Testor, P.; Mortier, L.; Prieur, L.; Taillandier, V.; d’Ortenzio, F.; Coppola, L. Spreading of Levantine Intermediate Waters by submesoscale coherent vortices in the northwestern Mediterranean Sea as observed with gliders. J. Geophys. Res. Ocean. 2015, 120, 1599–1622. [Google Scholar] [CrossRef] [Green Version]
  25. Garau, B.; Ruiz, S.; Zhang, W.G.; Pascual, A.; Heslop, E.; Kerfoot, J.; Tintoré, J. Thermal lag correction on slocum CTD glider data. J. Atmos. Ocean. Technol. 2011, 28, 1065–1071. [Google Scholar] [CrossRef] [Green Version]
  26. Lauvset, S.K.; Tanhua, T. A toolbox for secondary quality control on ocean chemistry and hydrographic data. Limnol. Oceanogr. Methods 2015, 13, 601–608. [Google Scholar] [CrossRef] [Green Version]
  27. Llinás, O.; Rueda, M.J.; Pérez-Marrero, J.; Pérez-Martell, E.; Santana, R.; Villagarcía, M.G.; Cianca, A.; Godoy, J.; Maroto, L. Variability of the Antarctic intermediate waters in the northern Canary box. Deep-Sea Res. II Trop. Stud. Oceanogr. 2002, 49, 3441–3453. [Google Scholar] [CrossRef]
  28. Desbruyères, D.; McDonagh, E.L.; King, B.A.; Thierry, V. Global and Full-Depth Ocean Temperature Trends during the Early Twenty-First Century from Argo and Repeat Hydrography. J. Clim. 2017, 30, 1985–1997. [Google Scholar] [CrossRef]
  29. Wong, A.; Keeley, R.; Carval, T.; Argo Data Management Team. Argo Quality Control Manual for CTD and Trajectory Data. p. 2022. Available online: https://archimer.ifremer.fr/doc/00228/33951/32470.pdf (accessed on 10 January 2023).
  30. Liu, M.; Tanhua, T. Water masses in the Atlantic Ocean: Characteristics and distributions. Ocean Sci. 2021, 17, 463–486. [Google Scholar] [CrossRef]
  31. Harvey, J. θ-S relationship and water masses in the eastern North Atlantic. Deep-Sea Res. 1982, 29, 1021–1033. [Google Scholar] [CrossRef]
  32. Ríos, A.F.; Pérez, F.F.; Fraga, F. Water masses in the upper and middle North Atlantic Ocean east of the Azores. Deep-Sea Res. Part II 1992, 39, 645–658. [Google Scholar] [CrossRef] [Green Version]
  33. Ruddick, B.; Phillips, O.M.; Turner, J.S. A laboratory and quantitative model of finite-amplitude thermohaline intrusions. Dyn. Atmos. Ocean. 1999, 30, 71–99. [Google Scholar] [CrossRef]
  34. May, B.; Kelley, D. Growth and steady state stages of thermohaline intrusions in the Arctic Ocean. J. Geophys. Res. 2001, 106, 16783–16794. [Google Scholar] [CrossRef]
  35. Ruddick, B.; Richards, K. Oceanic thermohaline intrusions: Observations. Prog. Oceanogr. 2003, 56, 499–527. [Google Scholar] [CrossRef]
  36. Shcherbina, A.Y.; Gregg, M.C.; Alford, M.H.; Harcourt, R.R. Characterizing Thermohaline Intrusions in the North Pacific Subtropical Frontal Zone. J. Phys. Oceanogr. 2009, 39, 2735–2756. [Google Scholar] [CrossRef]
  37. Rudels, B.; Kuzmina, N.; Schauer, U.; Stipa, T.; Zhurbas, V. Double-Diffusive Convection and Interleaving in the Arctic Ocean-Distribution and Importance. Geophysica 2009, 45, 199–213. [Google Scholar]
  38. Pietri, A.; Testor, P.; Echevin, V.; Chaigneau, A.; Mortier, L.; Eldin, G.; Grados, C. Finescale Vertical Structure of the Upwelling System off Southern Peru as Observed from Glider Data. J. Phys. Oceanogr. 2013, 43, 631–646. [Google Scholar] [CrossRef]
  39. You, Y. A global ocean climatological atlas of the Turner angle: Implications for double-diffusion and water-mass structure. Deep-Sea Res. I Oceanogr. Res. Pap. 2002, 49, 2075–2093. [Google Scholar] [CrossRef]
  40. Ruddick, B.R.; Gargett, E.A. Oceanic double-infusion: Introduction. Prog. Oceanogr. 2003, 56, 381–393. [Google Scholar] [CrossRef]
  41. Ruddick, B.R. A practical indicator of the stability of the water column to double-diffusive activity. Deep-Sea Res. I Oceanogr. Res Pap. 1983, 30, 1105–1107. [Google Scholar] [CrossRef]
  42. Rintoul, R.S. South Atlantic interbasin exchange. J. Geophys. Res. 1991, 96, 2675–2692. [Google Scholar] [CrossRef]
  43. Schmitz, W.J.; McCartney, M.S. On the North Atlantic circulation. Rev. Geophys. 1993, 31, 29–49. [Google Scholar] [CrossRef]
  44. Xie, R.C.; Marcantonio, F.; Schmidt, M.W. Deglacial variability of Antarctic intermediate water penetration into the North Atlantic from authigenic neodymium isotope ratios. Paleoceanogra 2012, 27, PA3221. [Google Scholar] [CrossRef]
  45. Jan, S.; Wang, S.H.; Yang, K.C.; Yang, Y.J.; Chang, M.H. Glider observations of interleaving layers beneath the Kuroshio primary velocity core east of Taiwan and analyses of underlying dynamics. Sci. Rep. 2019, 9, 11401. [Google Scholar] [CrossRef] [PubMed] [Green Version]
  46. Smyth, W.D.; Ruddick, B. Effects of Ambient Turbulence on Interleaving at a Baroclinic Front. J. Phys. Oceanogr. 2010, 40, 685–712. [Google Scholar] [CrossRef]
  47. Gutknecht, E.; Reffray, G.; Mignot, A.; Dabrowski, T.; Sotillo, M.G. Modelling the marine ecosystem of Iberia–Biscay–Ireland (IBI) European waters for CMEMS operational applications. Ocean Sci. 2019, 15, 1489–1516. [Google Scholar] [CrossRef] [Green Version]
  48. Sotillo, M.G.; Cailleau, S.; Lorente, P.; Levier, B.; Aznar, R.; Reffray, G.; Amo-Baladrón, A.; Chanut, J.; Benkiran, M.; Álvarez-Fanjul, E. The MyOcean IBI Ocean forecast andreanalysis systems: Operational products and roadmap to the future Copernicus Service. J. Operat. Oceanogr. 2015, 8, 63–79. [Google Scholar] [CrossRef]
Figure 1. Scheme of the surface (solid red lines) and intermediate (dashed red lines) circulation in the Eastern Subtropical North Atlantic. Acronyms: Azores Current (AC), Canary Current (CC), Canary Upwelling Current (CUC), North Equatorial Current (NEC), Poleward Undercurrent (PUC), Antarctic Intermediate Water (AAIW), Mediterranean Water (MW).
Jmse 11 00576 g001
Figure 2. Meridional glider section starting in the south of Madeira Island and ending in the north of the island of Gran Canaria. The color scale shows the bathymetry of the area. The lower right box of the figure shows a map of the Northeast Subtropical Atlantic marked in red the study area corresponding to the Canary Islands basin.
Jmse 11 00576 g002
Figure 3. Map of the positions of the reference database profiles (CANIGO and ARGO) and the glider profiles used in the crossover analysis. The red dots correspond to the positions of the glider profiles. The black dots correspond to the positions of the ARGO profiles. The green dots correspond to the positions of the CANIGO stations.
Jmse 11 00576 g003
Figure 4. Temporal distribution of salinity between the potential temperature range of 12 °C and 12.5 °C for the historical database (ARGO and CANIGO) with gray dots. Green solid line represents the linear fit calculated for the temporal distribution of salinity of the historical database. The black solid line represents the mean salinity of the historical database and the black dashed lines its standard deviation. The red dots show the salinity obtained by the glider without applying any correction for the potential temperature range of 12 °C and 12.5 °C. The mean salinity of the glider observations is marked with a black dot.
Jmse 11 00576 g004
Figure 5. Salinity crossover analysis results. The data measured by the glider were compared with oceanographic cruises and historical ARGO data from the study area. The solid red line shows the weighted mean of the offsets with its standard deviation in dashed lines. The dashed gray lines show the predefined accuracy limits for this given parameter. The black dots and error bars show the weighted mean offset with respect to individual reference platform and their weighted standard deviation, respectively. The weighted mean and standard deviation of these offsets are noted as text in the figure.
Jmse 11 00576 g005
Figure 6. (A) Meridional salinity glider section. The dashed white contour represents the 35.5 isohaline. (B) Meridional glider section of dissolved oxygen. The dashed white contour represents dissolved oxygen values of 140 μmol kg−1. (C) Meridional glider section of temperature. The dashed white contour represents temperature values of 9.5 °C.
Jmse 11 00576 g006
Figure 7. (A) θ–S plot of intermediate water column levels with colour scale corresponding to latitude. (B) θ–S plot of intermediate water column levels with colour scale corresponding to dissolved oxygen. Both images show a map with the section indicating with a red circle the location of the AAIW observations. Shown schematically is also the location of AAIW, MW and ENACW in the θ–S diagram.
Jmse 11 00576 g007
Figure 8. (A) θ–S plot for profile number 154 made by the glider in depths from 700 m to 954 m. (B) Temperature, salinity and Tu profiles, shown in red, blue and green, respectively. The orange and yellow shades indicate the Tu ranges for diffusive convection and saltfingering.
Jmse 11 00576 g008
Figure 9. Salinity and currents fields at 900 m depth obtained from the IBI reanalysis for 30 April 2016. The red box area is shown in more detail at the inset, where the current derived from the glider trajectory for the same day (red arrow) is represented along with the IBI current velocity field.
Jmse 11 00576 g009
Table 1. Oceanographic cruises and ARGO data used to validate glider observations.
PlatformMissionPeriodNumber of Profiles
R/V Meteor376–22 January 199710
R/V Poseidon233/A5–21 September 199717
R/V Poseidon237/A2–17 April 199811
R/V Meteor4226 June–16 July 199837
ARGO floatsARGO program2002–2021699
Disclaimer/Publisher’s Note: The statements, opinions and data contained in all publications are solely those of the individual author(s) and contributor(s) and not of MDPI and/or the editor(s). MDPI and/or the editor(s) disclaim responsibility for any injury to people or property resulting from any ideas, methods, instructions or products referred to in the content.