Article

Study on Bearing Capacity of Reinforced Composite Pipe Pile Group in Reclaimed Stratum under Vertical Load

1
Key Laboratory for Resilient Infrastructures of Coastal Cities, MOE, College of Civil and Transportation Engineering, Shenzhen University, Shenzhen 518060, China
2
China Railway Construction Investment Group Co., Ltd., Shenzhen 518054, China
*
Author to whom correspondence should be addressed.
J. Mar. Sci. Eng. 2023, 11(3), 597; https://doi.org/10.3390/jmse11030597
Submission received: 15 February 2023 / Revised: 5 March 2023 / Accepted: 8 March 2023 / Published: 11 March 2023
(This article belongs to the Section Ocean Engineering)

Abstract

:
A new stiffened composite pipe pile was developed for improving the foundation of reclaimed ground in ocean engineering. To study the bearing capacity of the stiffened composite pipe pile group, a combination of field test and finite element method was used. Firstly, field tests were performed on the proposed single stiffened composite pipe pile. The single stiffened composite pipe pile model was verified by comparing the numerical simulation results with the field test results. The load transfer mechanism from the stiffened core to the cemented soil and the surrounding soil was clarified. Further, a 3D finite element model of the stiffened composite pipe pile group was established based on the single stiffened composite pipe pile model. Finally, the bearing capacity of the pile group and the stress distribution of each pile were analysed and the influence of the pile spacing on the pile bearing capacity was discussed. The results showed that the axial stress of both the side and corner piles decreased rapidly with an increase in the pile spacing, and the stress-bearing ratio decreased. The stress-bearing ratio of the central pile increases with an increase in pile spacing. The smaller the pile spacing, the larger the load proportion of the composite pile group and the larger the foundation settlement. The optimal design scheme was a composite pile with a 500 mm stiffened core diameter, 700 mm outer cemented soil diameter, and a spacing between piles of four times the cemented soil diameter (2.8 m) considering the group pile bearing capacity and the economic benefits of the project. These results provide a reference for the design and construction of stiffened composite piles for ground improvement projects.

1. Introduction

Stiffened composite piles have been widely used in ocean engineering as a new form of composite piles for soft ground improvement [1,2,3,4,5,6,7,8]. Composite material piles, such as fiber-reinforced plastic (FRP) and structure-reinforced plastic (SRP), are unique solutions to problems including wooden pile deterioration and steel corrosion in tradition [9]. A stiffened composite pile is a new type of composite pile with a prefabricated stiffened core embedded in cemented soil. Because of the existence of the aforementioned prefabricated stiffened core, the cross-sectional stiffness of the composite pile is improved. The load was first applied to the pile top, then transferred from the stiffened core to the cemented soil, and finally from the cemented soil to the soil around the pile. The transfer path solves the problem that cemented soil is prone to stiffened destruction, and the material performance of the lower part of the pile is fully utilized. Research shows that the vertical bearing capacity of SCP (Stiffened composite pipe) piles with a concrete core is 1.3~1.5 times that of cast-in-place concrete piles at the same cost [10].
With the wide application of SCP piles, the interface contact of SCP piles has been studied widely. At present, the shear process of the interface between cemented soil and concrete is generally divided into two stages: bond failure stage and friction slip stage [11]. Jamsawang et al. [12] studied the interface characteristics of stiffened core and cemented soil and found that the two interfaces performed best when the cement content was 15%. Relevant scholars have studied the bearing mechanism and characteristics of SCP piles under vertical [13,14,15] and lateral loads [16,17]. The load transfer mechanism of SCP piles under vertical load is studied by numerical simulation. It has been found that the load transferred to the pile end is less than 7% of the pile top load. Based on this, it is considered that SCP piles can be regarded as friction piles [18]. In addition, studies found that the settlement value of cement sand mixing piles under the ultimate load is smaller than that of cemented soil mixing piles [19], which indicates that the type of cemented soil also has an impact on settlement. Therefore, researchers studied the deformation influencing factors and failure models of SCP piles in highway engineering through numerical simulation and field tests [20,21,22]. The stiffened core is set as solid pile considering the soil plug effect in most studies. However, it cannot reflect the actual situation of the composite pile and neglects the function of cemented soil. Therefore, it is necessary to study the load transfer mechanism between the cemented soil and the soil around the pile. However, most current studies set SCP piles as solid pile, which cannot reflect the actual situation of composite pile. Moreover, there are few studies on the bearing capacity of SCP piles group.
In this study, a combination of field test and the finite element method is used to study the bearing capacity of the stiffened composite pipe pile group. The axial force of the stiffened core and cemented soil, friction resistance between the stiffened core and cemented soil, and friction resistance between the cemented soil and soil around the pile are analysed. The load transfer mode and the influence of the distance and pile diameter on pile group bearing capacity is discussed. It is emphasised that the relationship between the stiffened core diameter, pile spacing and settlement are clarified so that the optimum design scheme can be obtained to save project costs. The results can provide a reference for improving the foundation of reclaimed ground in ocean engineering.

2. Design of Field Test

Based on the project of the Mawan Cross-sea Passage, located in the Guangdong–Hong Kong–Macao Greater Bay Area, a field test of the foundation improvement using the stiffened composite pipe pile in reclaim strata was performed. The geological conditions of the strata are presented in Table 1.

2.1. Technological Process of Stiffened Composite Pipe Pile

The technological process of a composite pipe pile is shown in Figure 1. The soil is first cemented by using down-hole-impact jet grouting. Then, a submersible hole hammer and high-pressure water are used to improve the impact and damage ability of drilling in the strata. After the hole drilling is completed, the high-pressure water is switched to high-pressure cement slurry, and a high-pressure jet is used to grout the cement slurry into the surrounding soil. A rigid core pipe pile is then inserted into the cement soil. Finally, a stiffened composite pipe pile is formed.

2.2. Test Preparation

To test the bearing capacity of a single stiffened composite pipe pile, test preparations were completed as follows before the test:
(1)
The soil at the test site was cemented by the down-hole-impact jet grouting of the designed diameter and length.
(2)
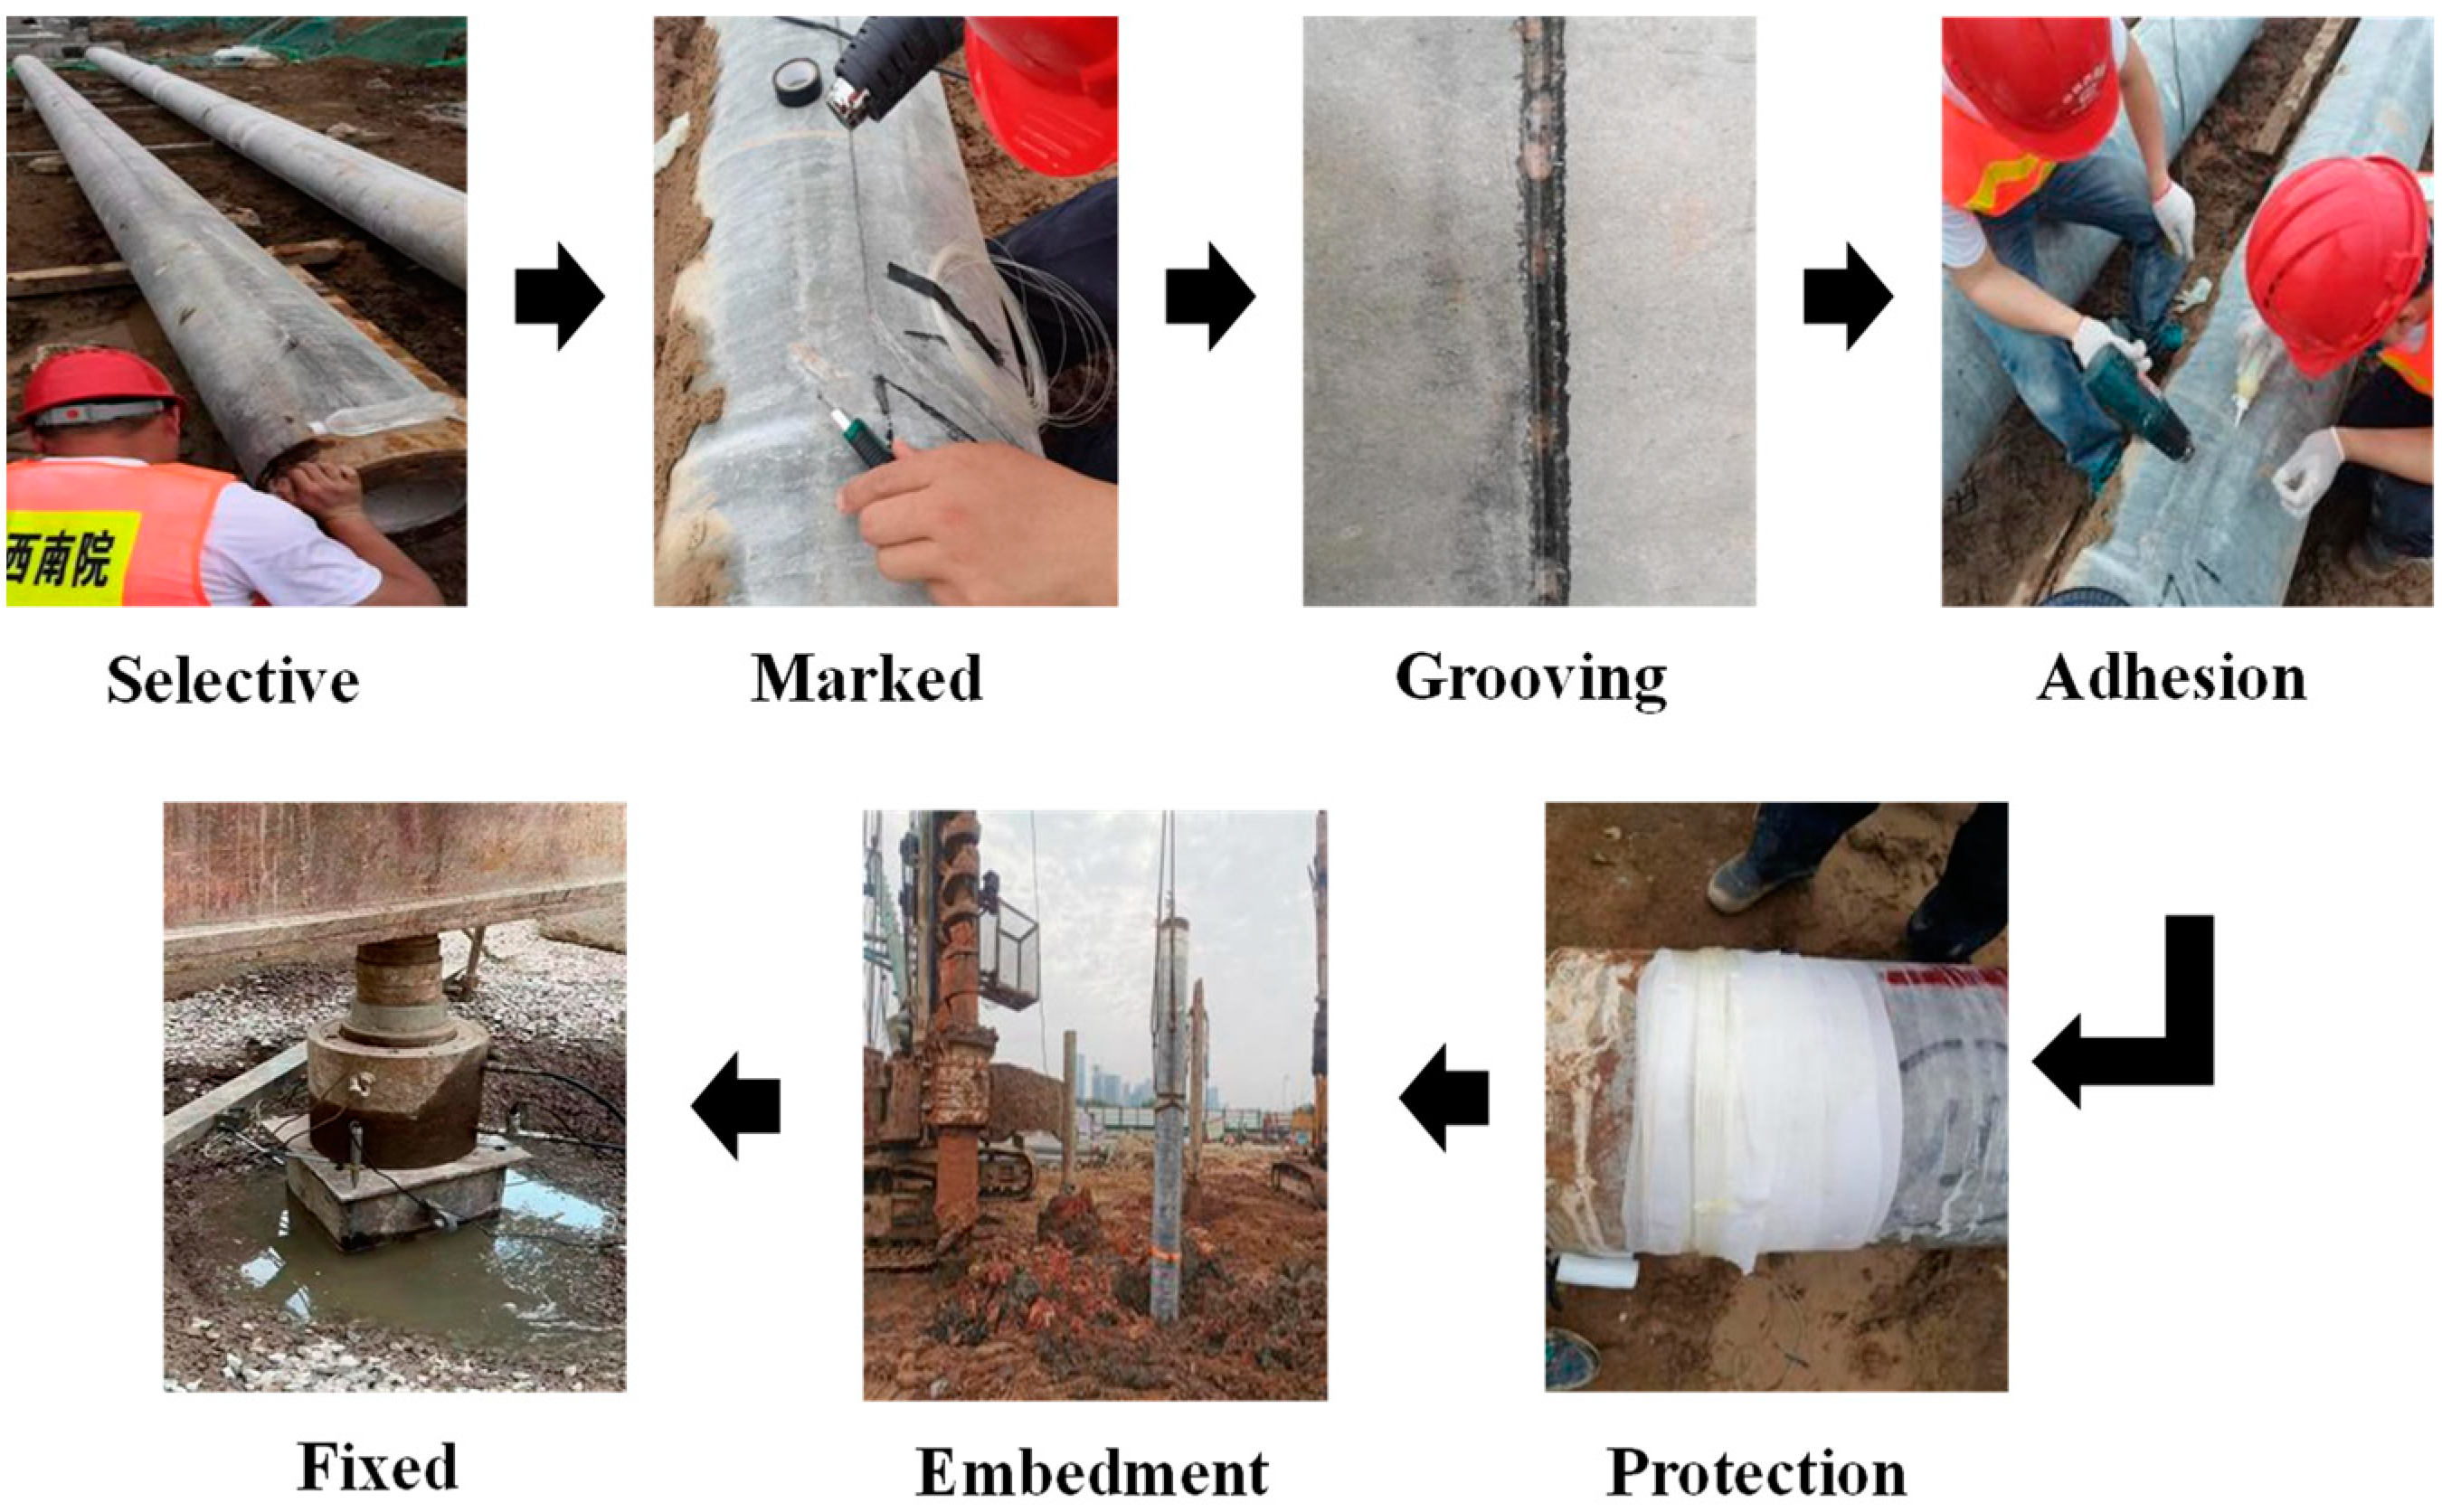
According to the site requirements, the test pile would be placed at a designated position by the crane. To ensure that the setting-out lines were reasonable and straight, the core piles were marked symmetrically on both sides. A cutting machine was then used to cut the grooves along the marked lines. After the grooves were finished, the grooves were cleaned by a blower and checked for straightness and smoothness.
(3)
The optical fibre was implanted along the grooves, and an adequate length of optical fibre was reserved at the top of the pile. The optical fibre was fixed with strong glue.
(4)
After the optical fibre was fixed, ethyl polyurethane was used as a backfill to protect the optical fibre.
(5)
After the completion of the above steps, the pile was transferred to the designed position and then planted into cemented soil to a specified depth using a machine.
The single pile test layout procedure is shown in Figure 2.

2.3. Test Loading Condition

The stiffened composite pipe pile was composed of three parts: the stiffened pipe pile, inner and outer cemented soil. The length of the test piles was 12 m. The core pile had inner and outer diameters of 210 mm and 400 mm, respectively. The corresponding diameter of the cemented soil was selected to be 700 mm. Figure 3 shows the structure of the test pile. In the test, the load was applied to the pile top step-by-step through steel plates with a jack (shown in Figure 2). The first-step load was 660 kN, and the load of each subsequent step was 330 kN higher than that of the previous step, with the last step loading up to 3300 kN. The detailed loading in each step and time interval is presented in Table 2. The bearing capacity of composite pipe piles were tested according to the procedures of China national industry standard of JGJ106-2014 (Technical code for testing of building foundation piles). The loading value of each stage was 1/10 of the maximum test load (3300 kN), which is 330 kN.

3. Analysis of Single Pile

3.1. Numerical Model

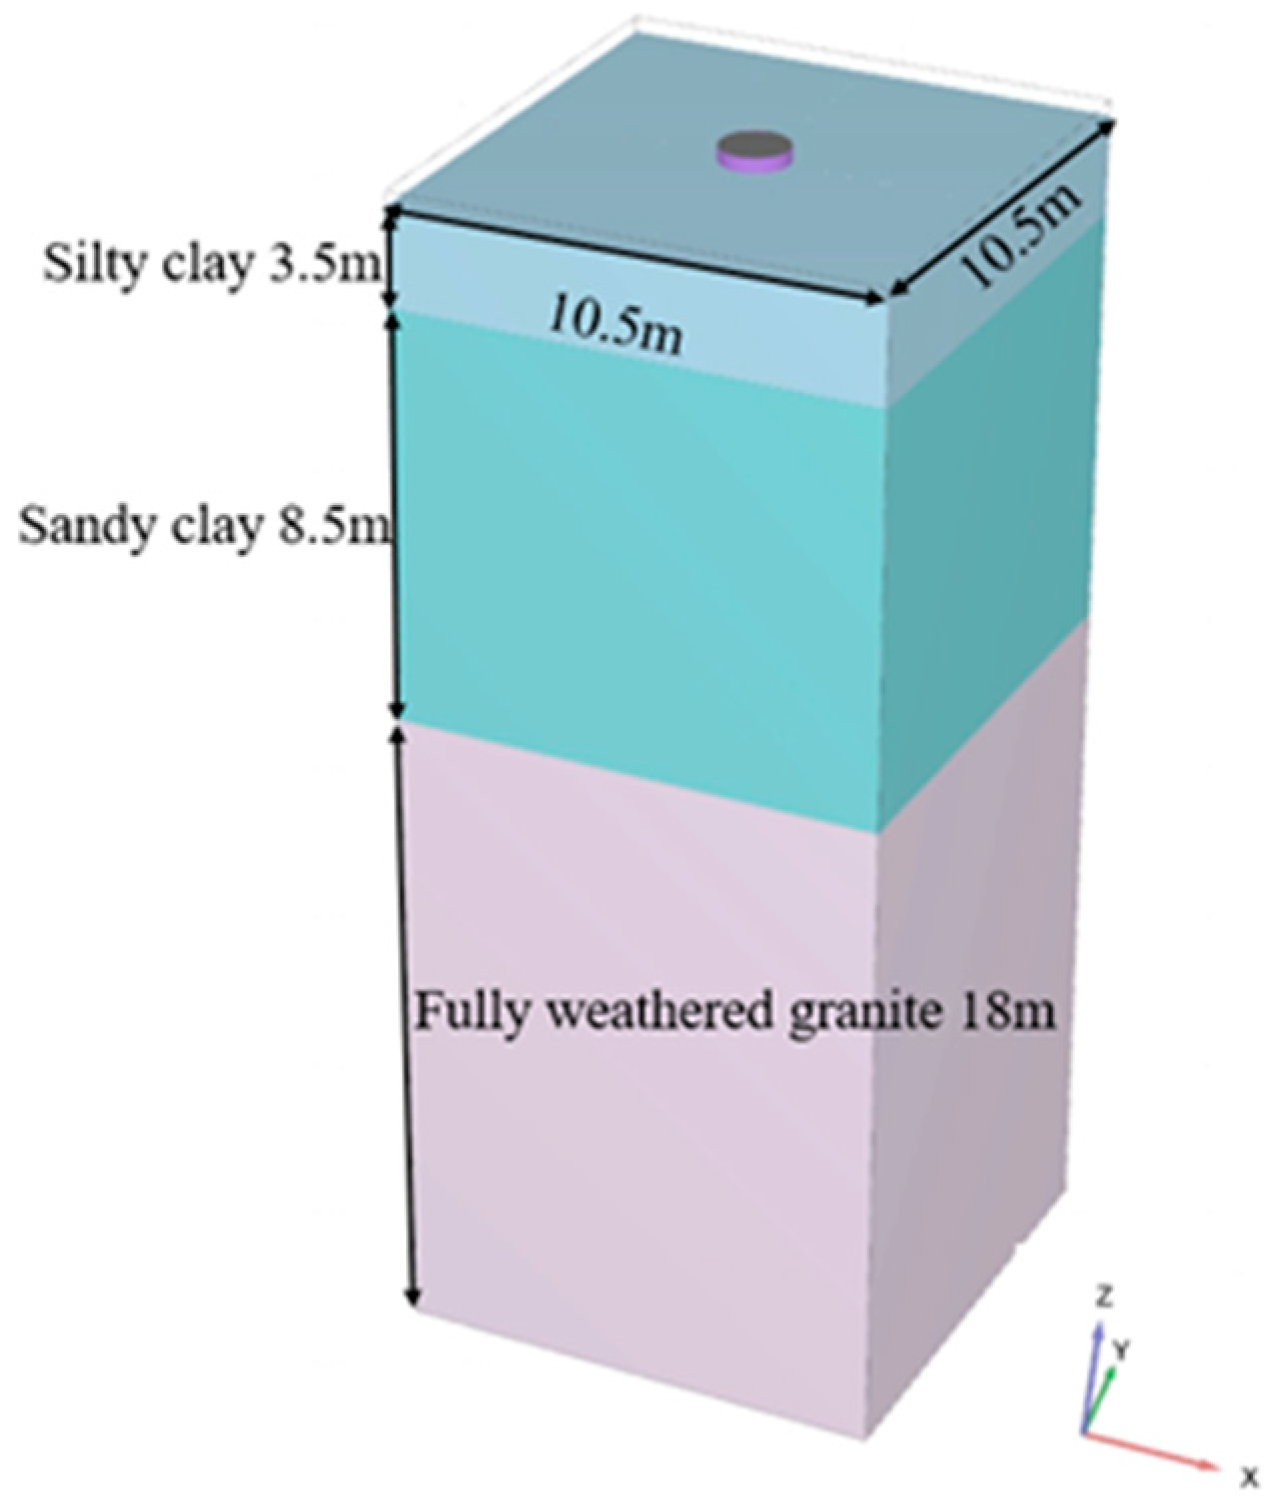
The finite element model of the single pile field test was established. The model was 15 times the outer stiffened core diameter in the horizontal direction with a length of 10.5 m. In the vertical direction, 2.5 times the pile length was taken with a depth of 30 m, as shown in Figure 4. The coarseness factor of pile and cap was 0.5, the coarseness factor of soil was 1.0, and the element was 10-node tetrahedral cell. Coarseness means the fineness of the division grid. The model had 23,326 units and 39,297 nodes.
The X and Y directions are along the width and length direction of the model, respectively; the Z direction corresponds to the depth direction of the model. The two side boundaries in the x-direction and y-direction are restrained in the horizontal direction, respectively. The bottom boundary is assumed to be fixed in the horizontal and vertical directions while the top boundary is free. Generally speaking, when the size of the model is 4–5 times the pile cap size, the influence of the model boundary on the numerical simulation results can be avoided. A large piled-raft foundation on clay soil was studied [23,24]. The model size was five times the size of the cap, and the bottom of the model kept a sufficient distance from the pile base. In this model, the size of the cap is 0.7 m, the width of the model is 10.5 m, and the bottom of the model keeps 18 m from the pile base. Based on studying the formation displacement distribution after the geostress balance, the formation displacement is very uniform, indicating that the boundary effect is very small and the model setting is reasonable. The Hardening Soil Small (HSS) constitutive model is used for the simulation of ground soil, which can comprehensively describe the important mechanical properties of the soil [25]. Simultaneously, the different friction interfaces are set in the model to reflect the interaction between the cemented soil and soil around the pile, stiffened core, and cemented soil. According to a site survey report, the stratum was simplified into three layers. Loading was applied to the top of the stiffened composite pile in steps based on the test conditions (shown in Table 2). The specific material parameters of the soil and pile used in the simulation are listed in Table 3 and Table 4, which come from the geological prospecting report.

3.2. Pile Displacement

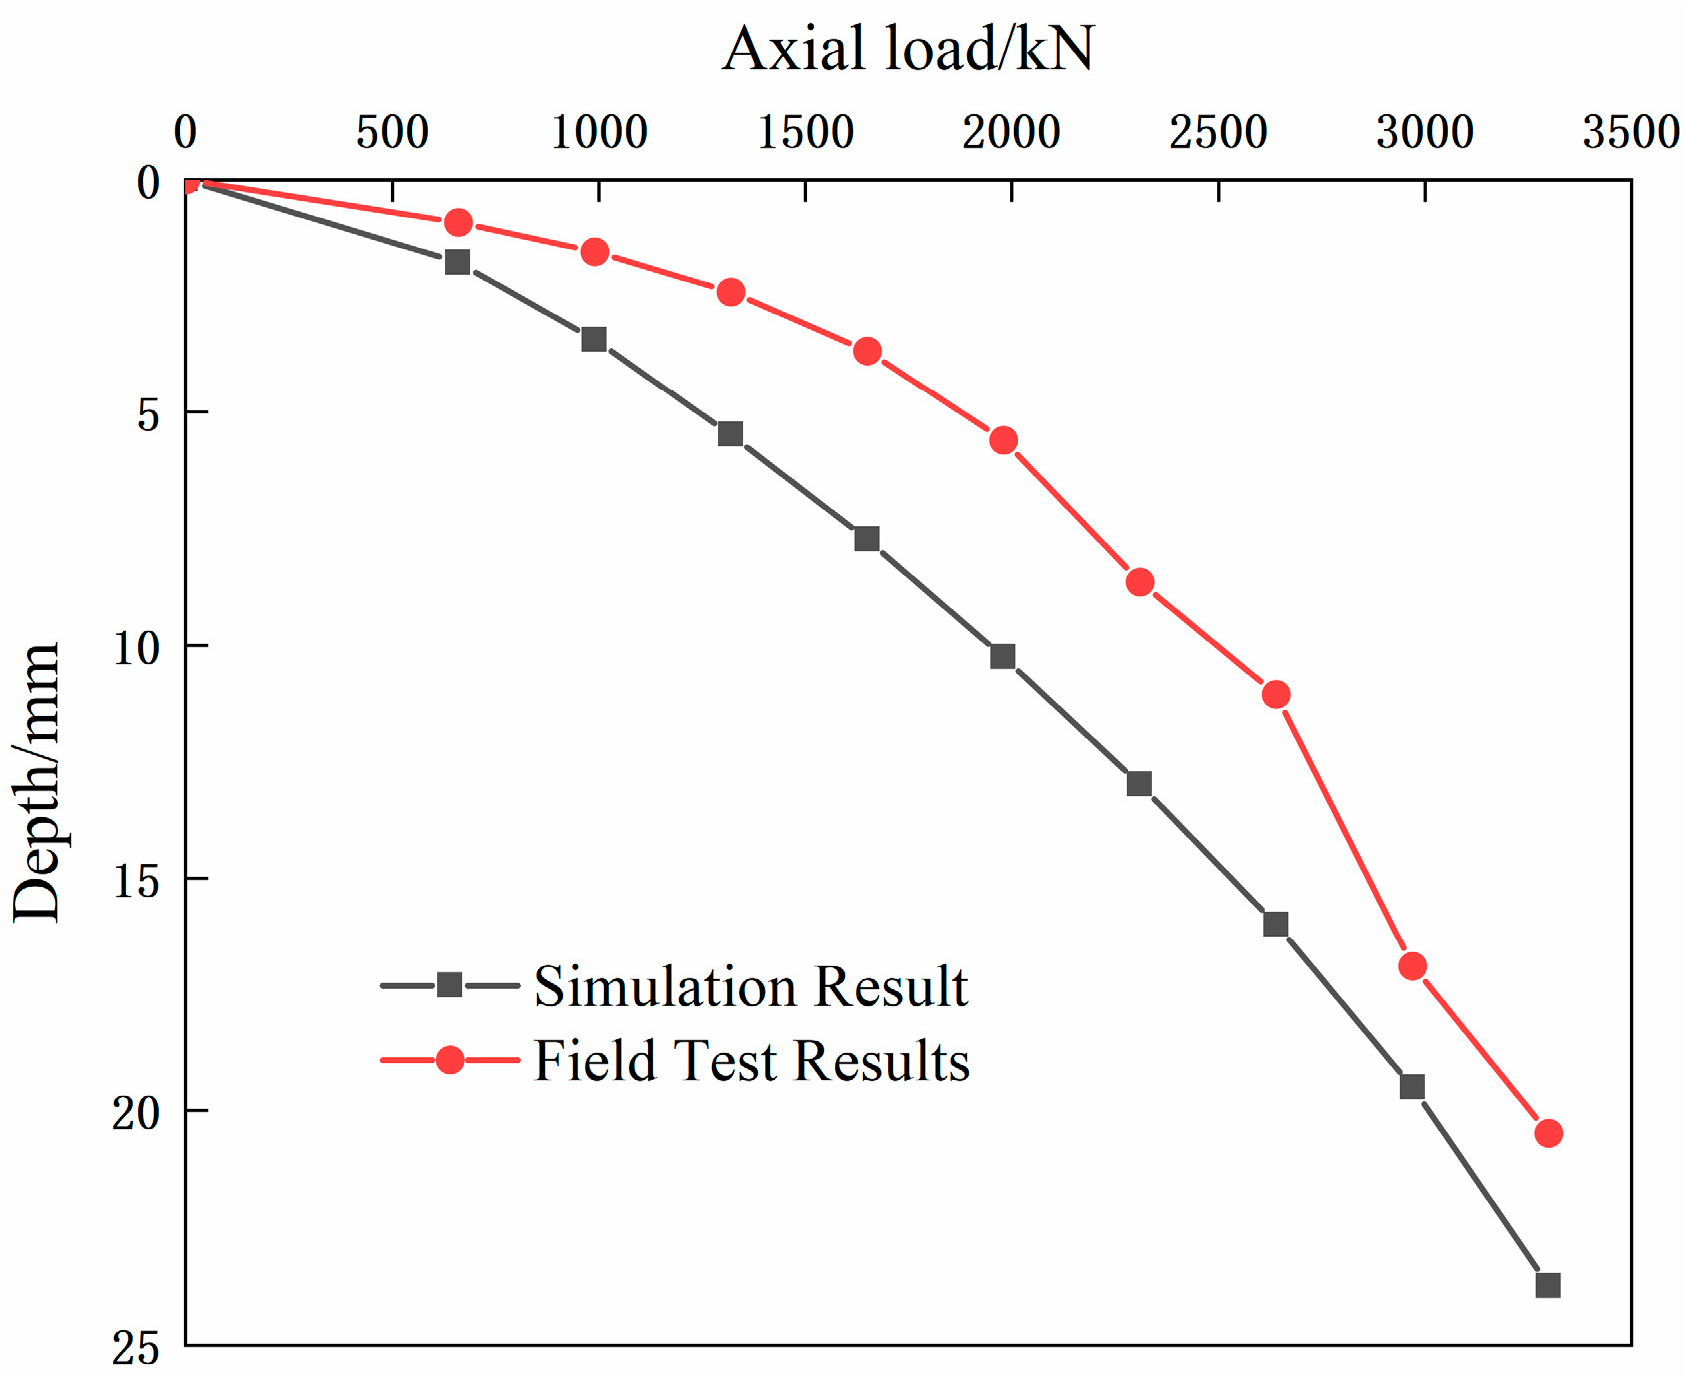
Figure 5 shows a comparison of the load-settlement curves of the numerical simulation and field test. The vertical displacement or settlement at the top of the stiffened core pile is 23.73 mm and 20.62 mm in numerical analysis and field test, respectively. The trends of the two curves are similar. The displacement of the numerical simulation result is slightly larger than that of the measured displacement. The reason for this is that the friction model selected for the contacts cannot completely reflect the properties of the actual interface because the cemented soil has a bonding effect on the concrete contact surface and the pile-surrounding soil, and the contact model in the numerical simulation is a friction model, which cannot reflect the real characteristics of the soil. The bonding effect is reflected by increasing the friction coefficient, and the analysis results are least affected. It is difficult to accurately simulate the different interface properties by only the control friction coefficient [26,27].
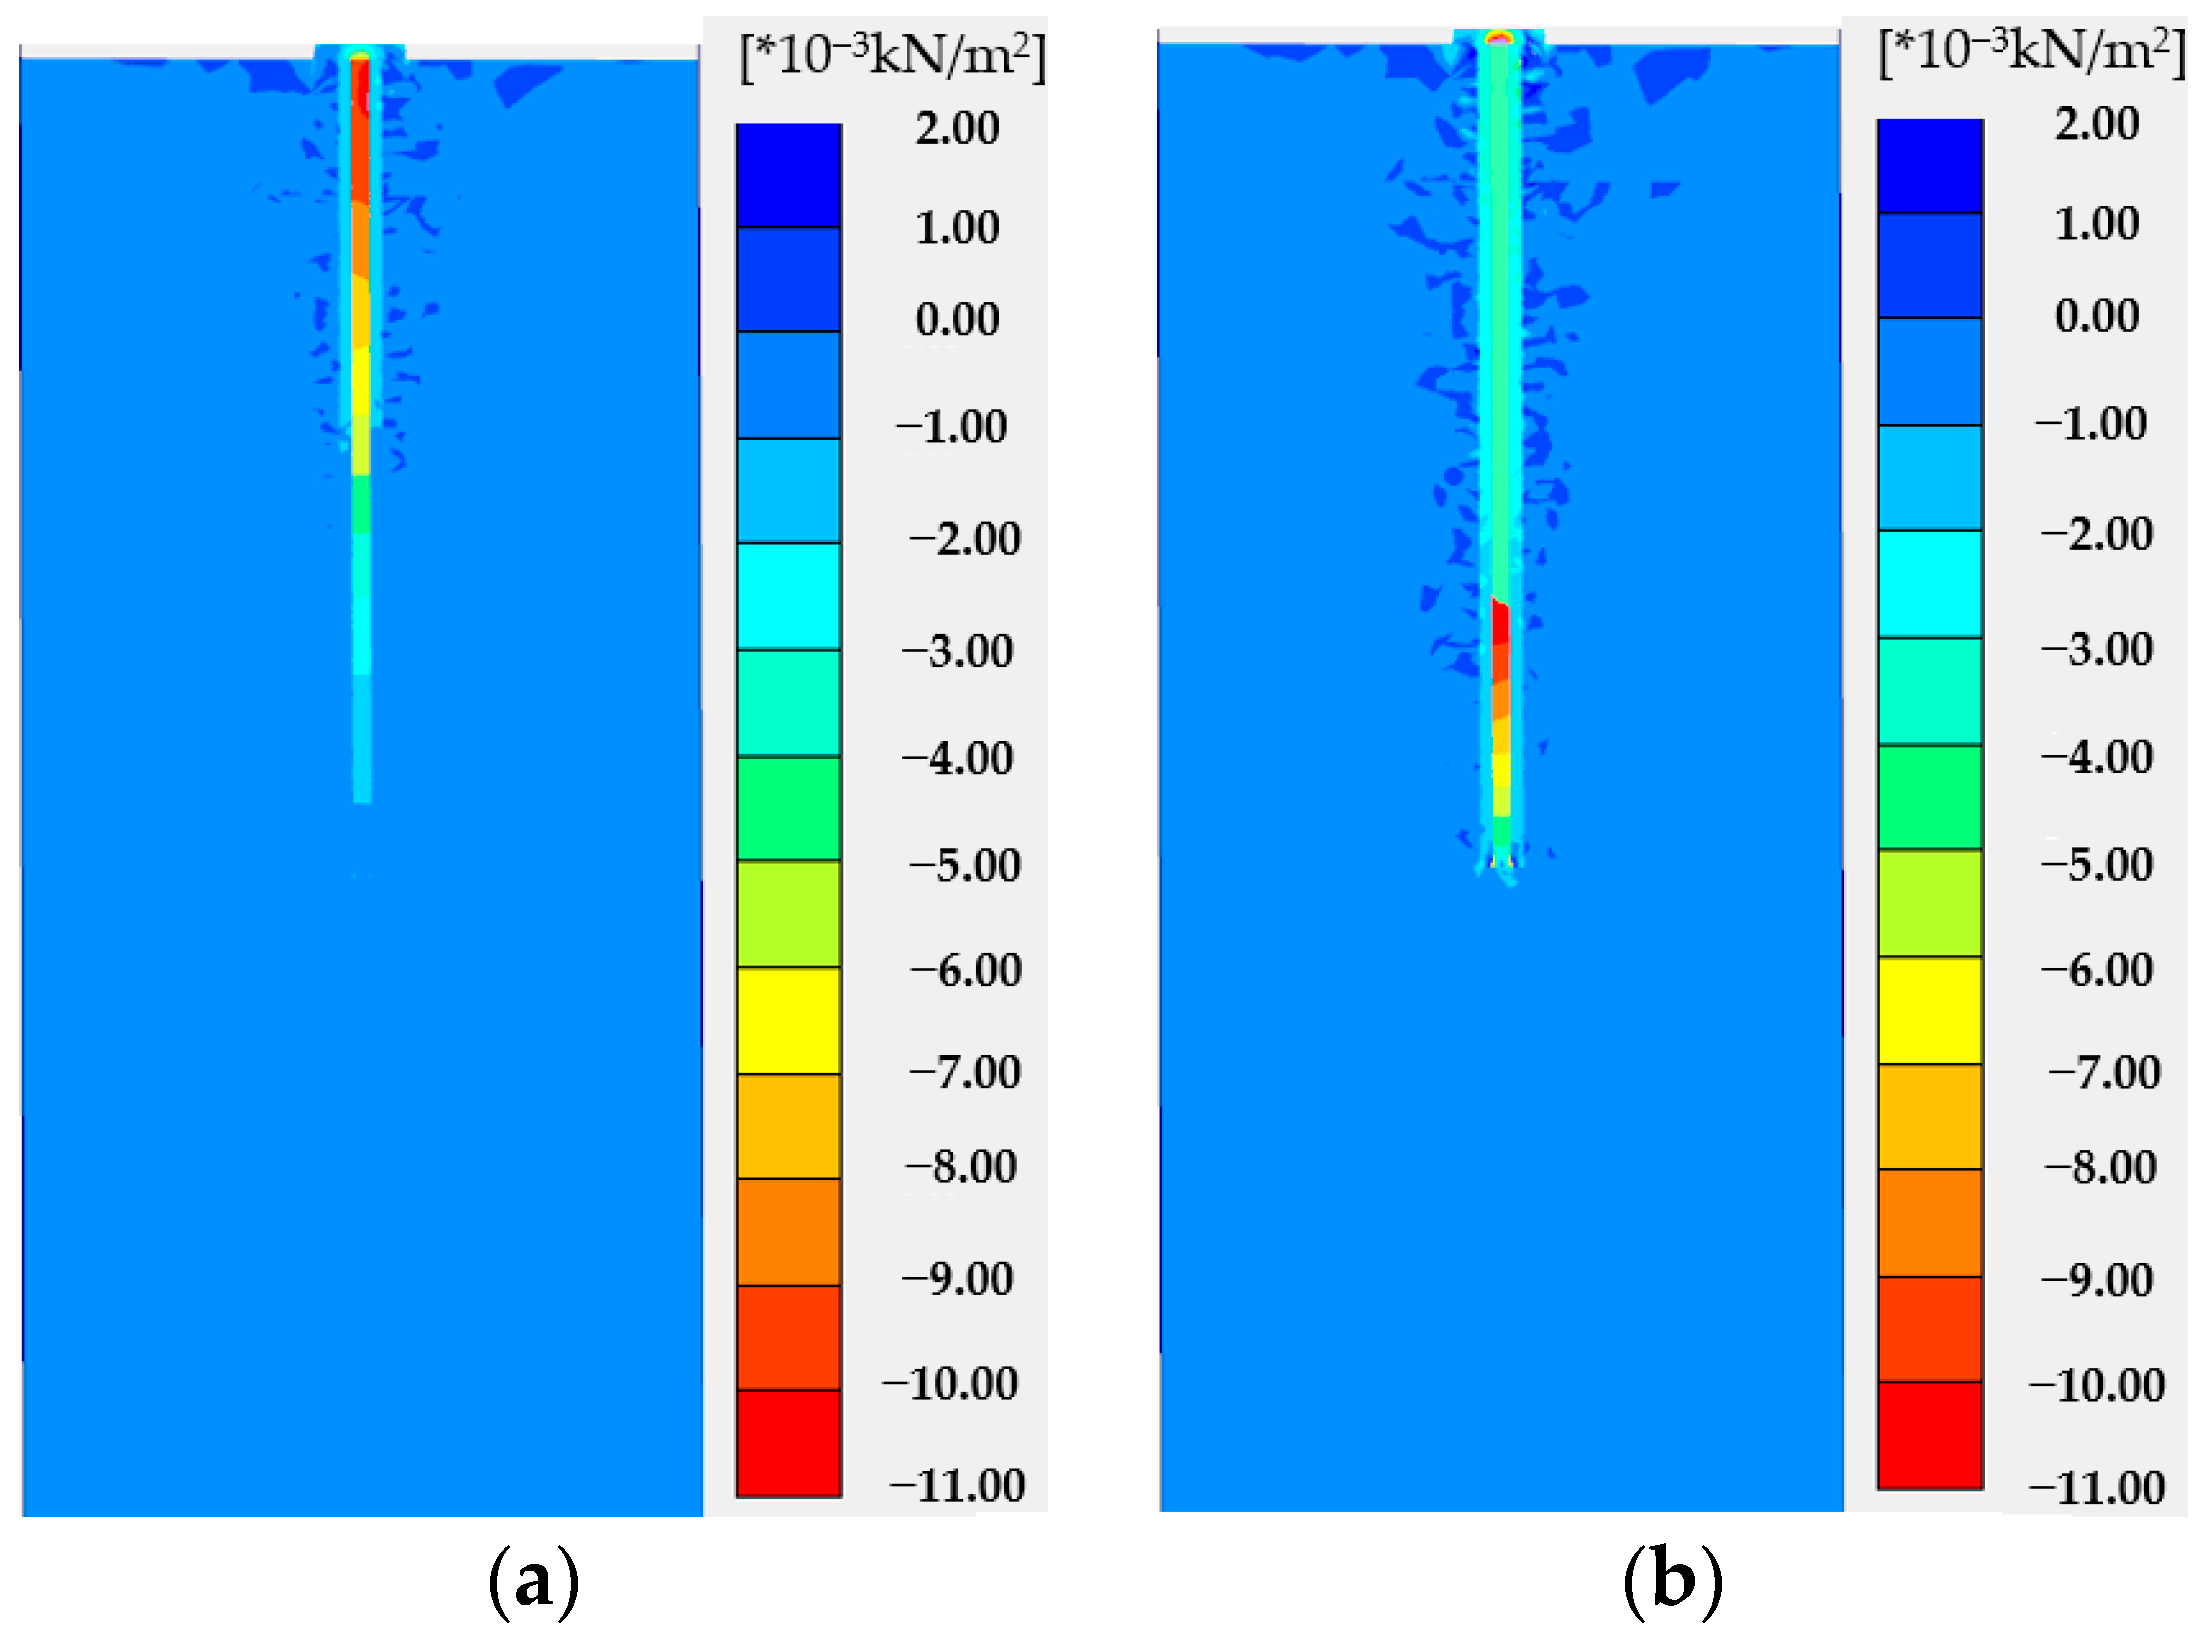
Figure 6a,b shows the strain distribution of the pile and soil in the vertical section along the depth when the final loads are 1650 kN and 3300 kN, respectively. When loading to 1650 kN, the settlement at 0–6 m of the pile body changes from 7.8 mm to 1 mm, and the settlement at 6–12 m of the pile body changes from 0.99 mm to 0.07 mm. The strain mainly occurs in the upper part of the pile, and the load is gradually transferred from the core pile to the soil through the cemented soil. When the load increases to 3300 kN, the settlement at 0–12 m of the pile body changes from 23.79 mm to 1.422 mm. The strains of both the pile and soil increase further. The plastic strain of the soil at the bottom of the core pile is produced at a final load of 3300 kN. This further increase in the deformation of the soil indicates that the stress is further transferred from the pile to the soil. As the load increases and transfers continuously, the friction resistance between the reinforced core and cemented soil and between the cemented soil and the soil around the pile continues to act, and the deformation parts gradually extend downward with the increase in depth along the pile. It can be shown that the bearing mechanism of the composite pile is the transfer of the load from the stiffened core to the soil through cemented soil.

3.3. Axial Stress of Stiffened Core

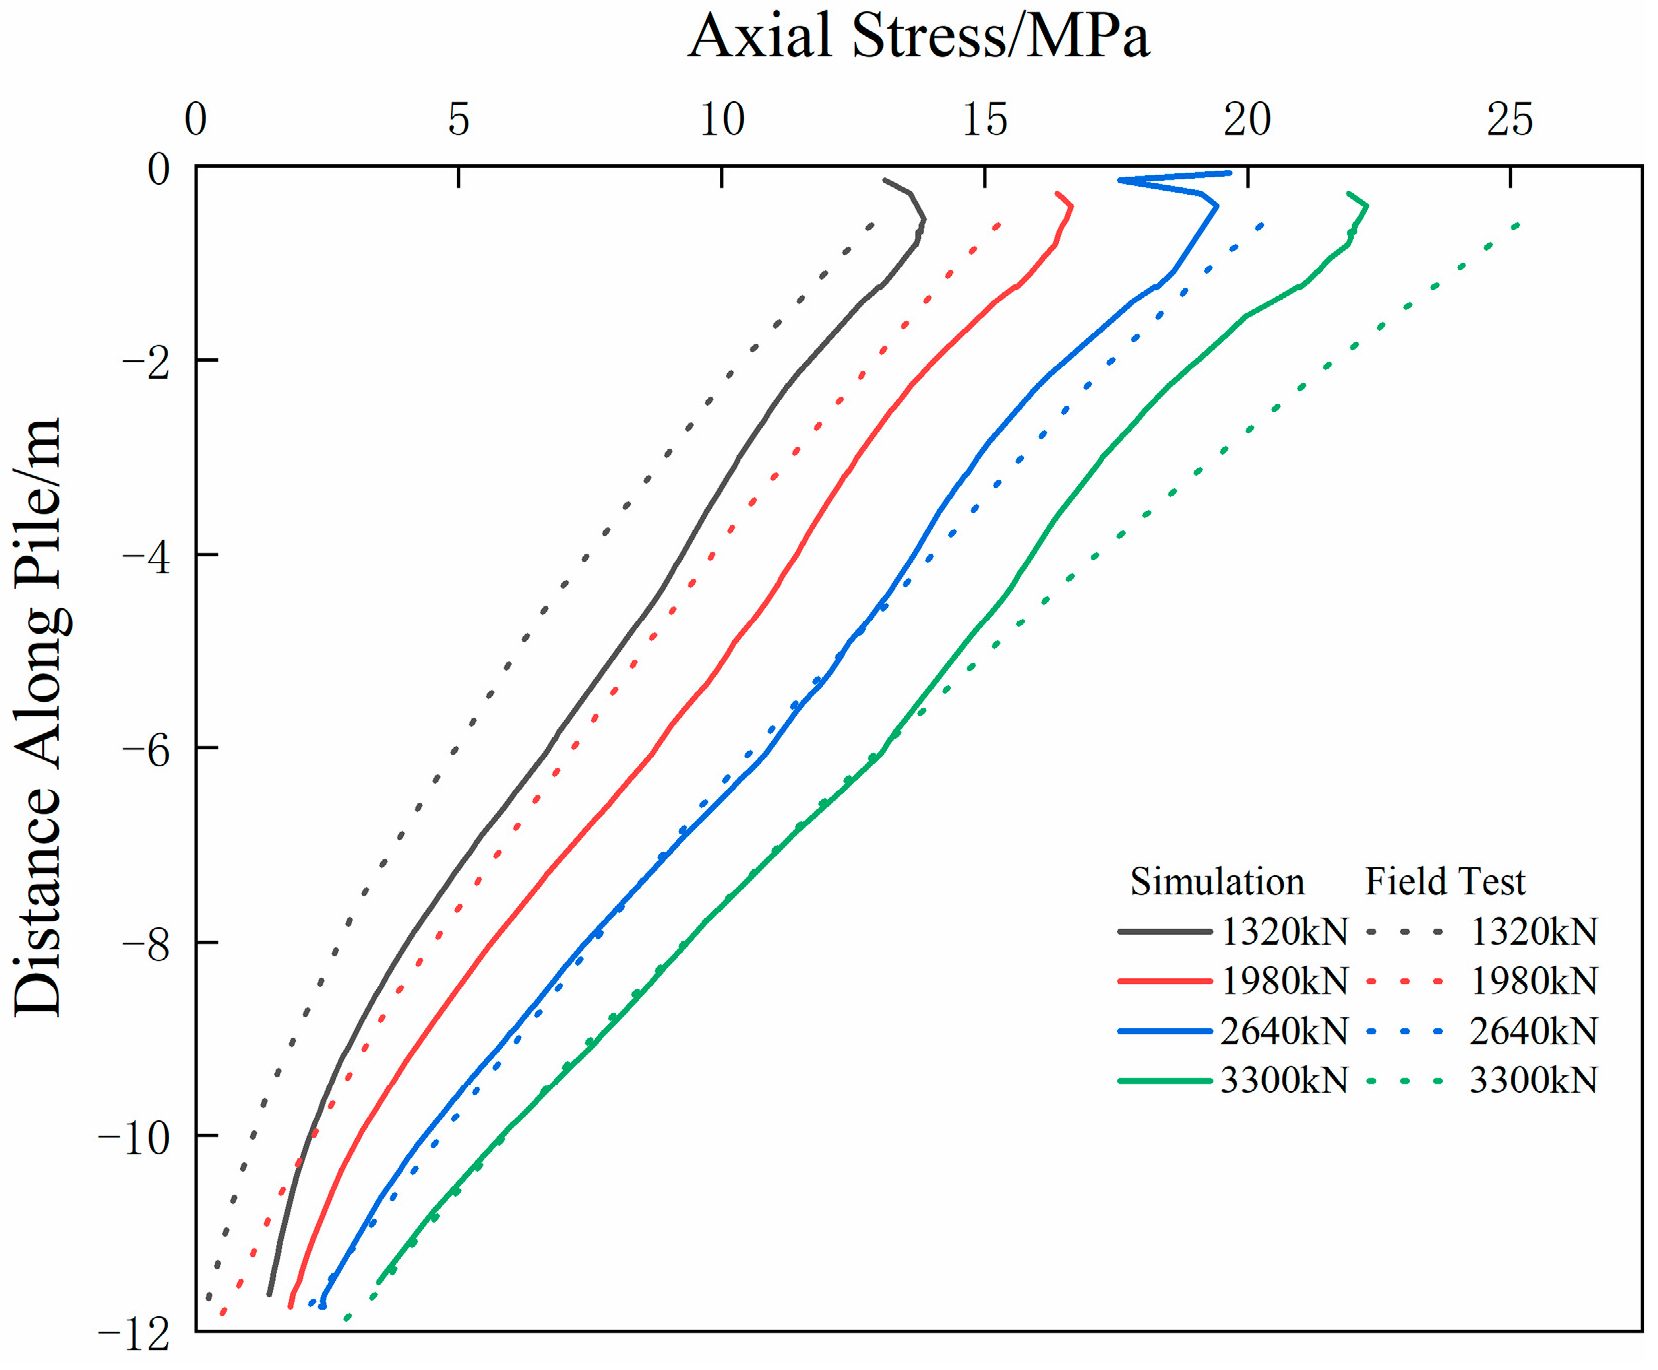
Figure 7 shows the axial stress of the stiffened core along the depth of the numerical simulation and the field test results. The axial stress of the stiffened core of the simulation and test results can be matched well, which also verifies the rationality and reliability of the numerical simulation. As the load increases, the axial stress of the stiffened core increases. The axial stress decreases with increasing depth along the pile. This is because the pile is stressed from the top, and the axial stress is transferred from the top down. The axial stress is transferred to cemented soil by friction resistance between the stiffened core and cemented soil in the process of transmission. Moreover, the contact area between the stiffened core and cemented soil gradually increases with the increase in pile depth. Therefore, the increase in friction contact surface makes the lower pile axial stress less than the upper pile axial stress. In general, the variation trend in the axial stress of a stiffened core is similar to that of a traditional pile [28].

3.4. Axial Stress of Cemented Soil

Figure 8 shows the axial stress of the cemented soil. It can be seen from Figure 8 that the axial stress of cemented soil first increases along the depth, with peak values at depth of 4.5–7.5 m, and then decreases. The stiffened core is mainly used to bear the load, and the cemented soil can effectively transfer the axial force from the stiffened core to the soil around the pile via friction resistance [29,30].
Therefore, at the initial stage of loading, the load is mainly carried by the stiffened core, and the cemented soil carries only a small part of the load. The load is transferred from the stiffened core to the cemented soil in the form of friction resistance, and the axial stress of the cemented soil increases mainly in the upper part of the pile. As the settlement of the pile increases, the interface area between the cemented soil and the soil increases. The load is gradually transferred from the cemented soil to the soil around the pile through the friction resistance. Therefore, the axial force of the cemented soil increases above 7.5 m of the depth along the pile body and then decreases.
Figure 9 shows the stress distribution in the vertical section. When the load is 1650 kN and 3300 kN, the stress at 6 m of the soil 0.15 m from the cemented soil is 24 kPa and 292 kPa, respectively; the vertical stress of the soil around the pile is small. In addition, the change in stress at the lower part of the pile is small, indicating that the load is mainly transferred from the stiffened core to the bottom of the pile. When the load is increased to 3300 kN, the stress at 12 m of the soil 0.15 m from the cemented soil is 215 kPa and 853 kPa. The vertical stress of the soil around the lower part of the pile increases gradually. This explains why the load transfer path is from the core to the cemented soil and soil.
When the load is initially loaded to the pile top, the stiffened core bears most of the load, corresponding to an axial stress of the cemented soil close to 0 kPa. As shown in Figure 10 and Figure 11, friction resistance between the stiffened core and cemented soil and friction resistance between the cemented soil and soil the pile load transfers, respectively, can be explained. With the increase in friction resistance between the stiffened core and the cemented soil, the load of the stiffened pile is gradually transferred to the cemented soil in the form of friction resistance. The friction resistance and the axial stress of the stiffened pile decrease, and the axial force of the cemented soil increase along the pile with a peak value at depth of about 6 m. In the lower part of the pile body, due to the increase in the contact surface, friction resistance gradually develops, and the axial force of the core pile decreases rapidly.

3.5. Friction Resistance between the Stiffened Core and Cemented Soil

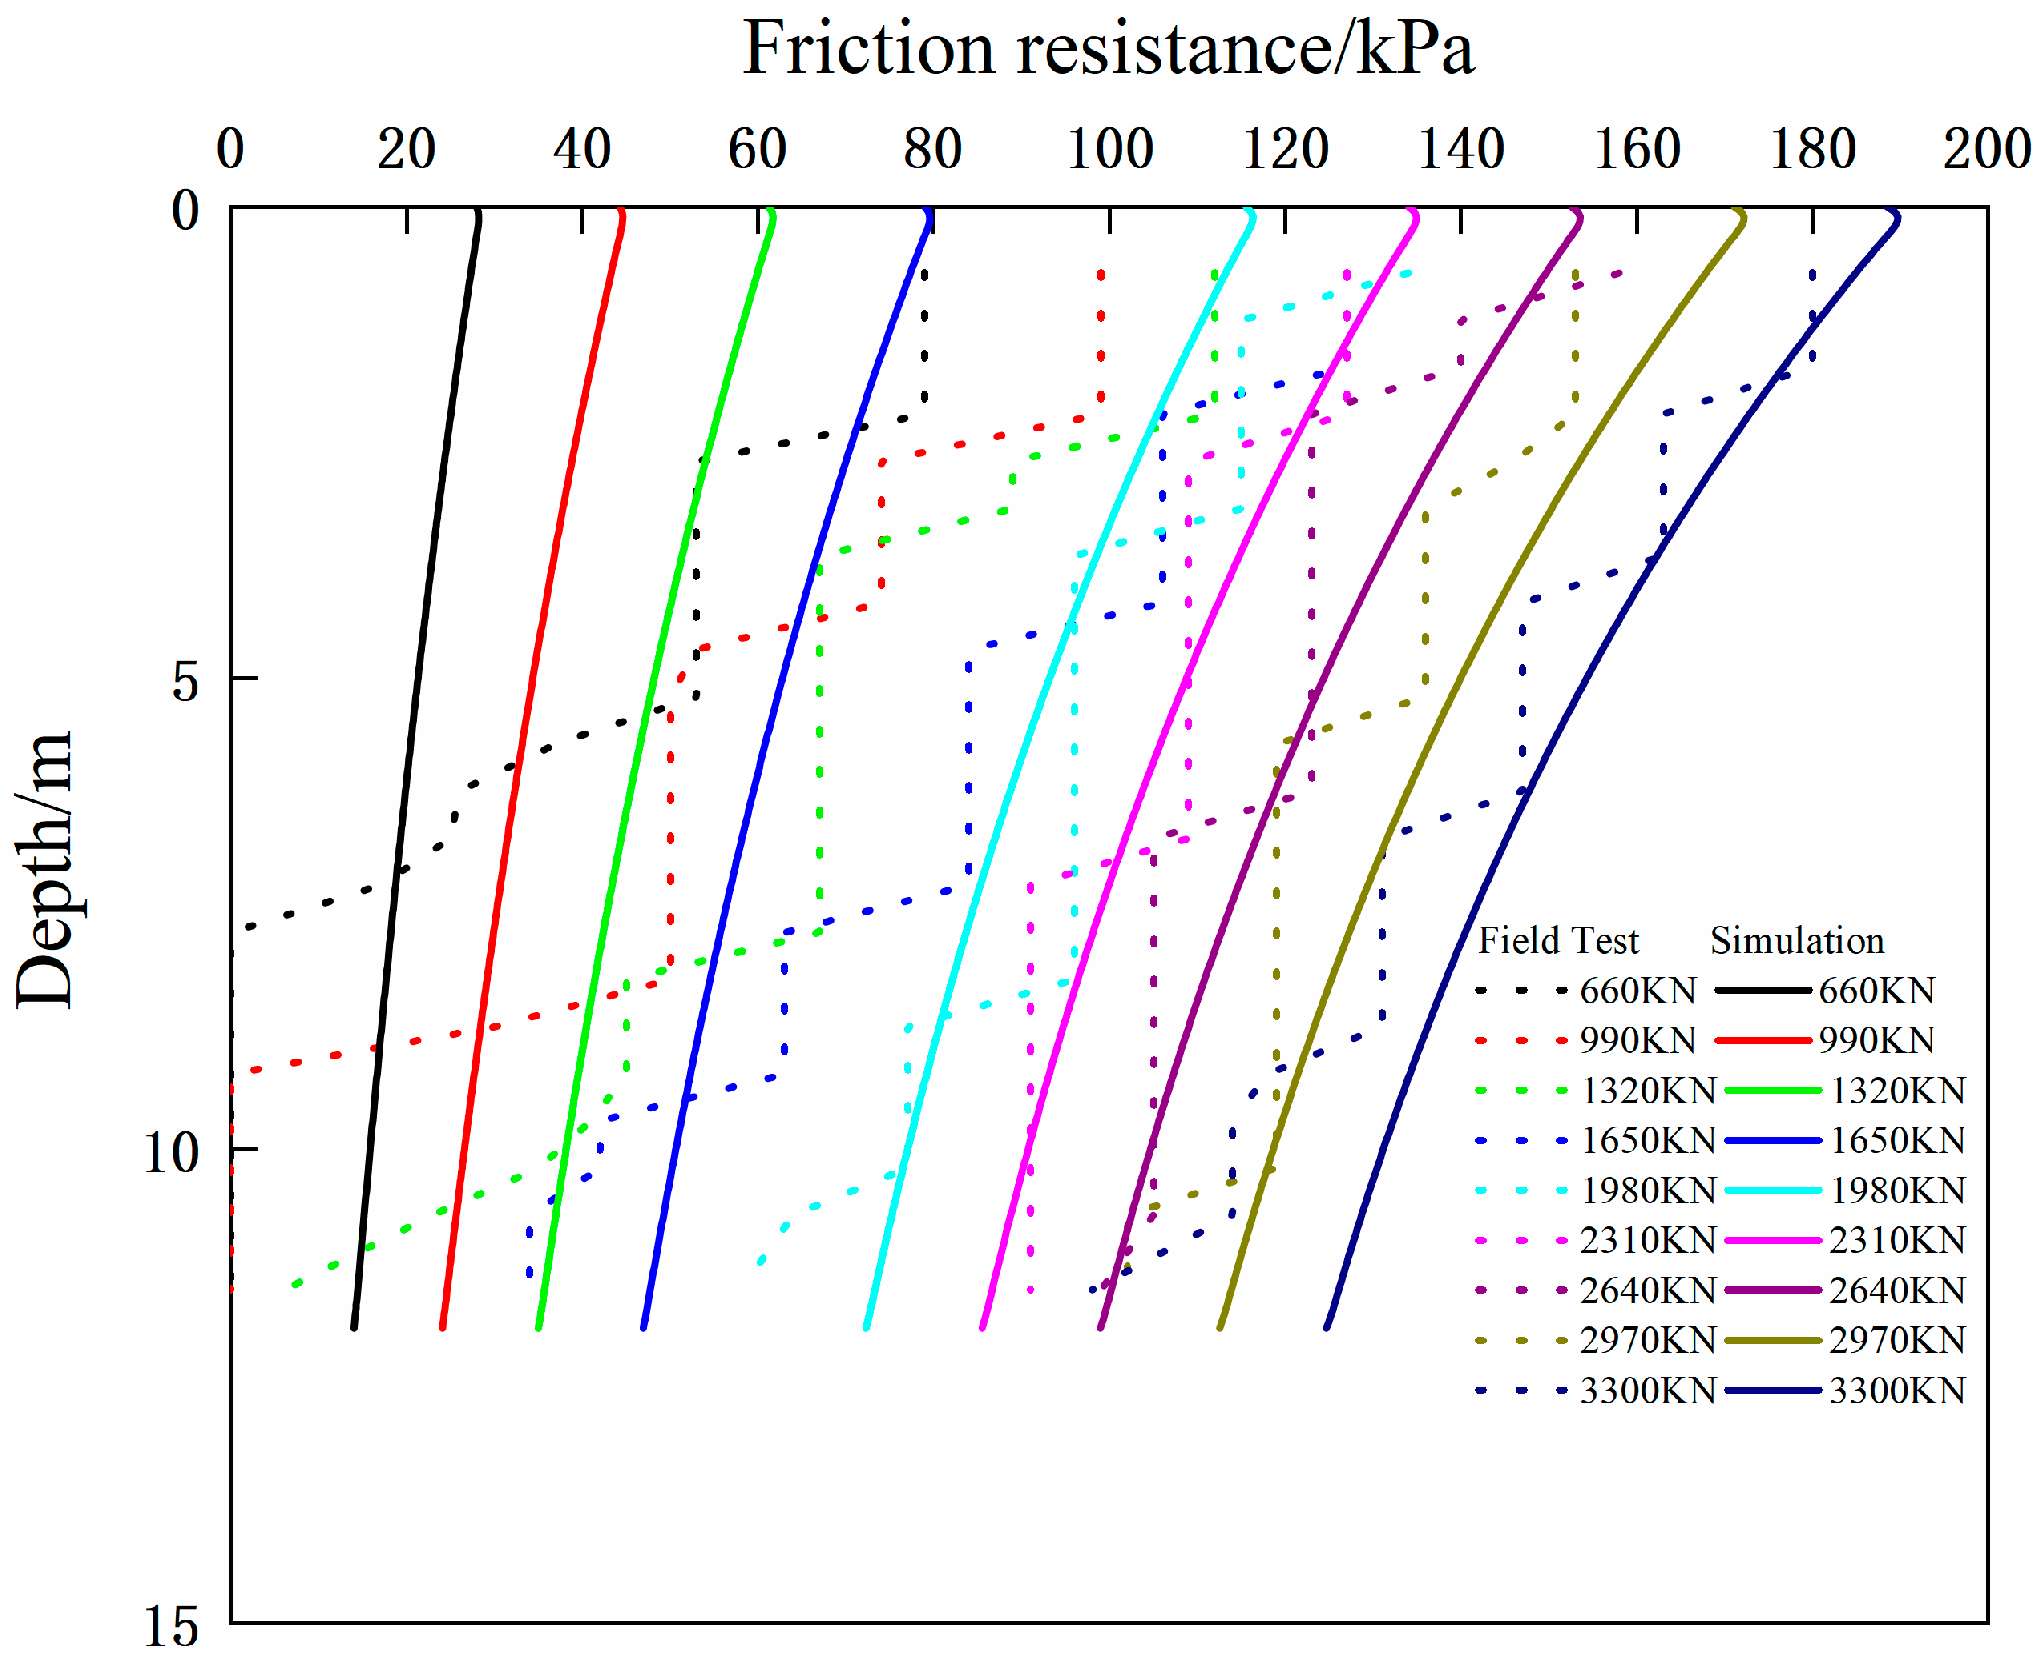
The friction resistance between the stiffened core and cement soil is shown in Figure 10. The results of the numerical simulation and field test for both exhibit the same trends. As the depth along the pile increases, the friction resistance of the stiffened core decreases. Overall, the friction resistance increases with an increase in load. When the load was relatively small, the field test results were inconsistent with the simulation results. This is because when the load is small, the error caused by the friction coefficient will be amplified. The lateral friction resistance between the stiffened core and cemented soil is not transferred to the pile end. Therefore, the measured value of the friction resistance at the pile end is 0. When the load was gradually increased to 3300 kN, the results of the simulation and test gradually coincided, confirming the correctness of the transmission path of the stiffened composite pile.

3.6. Friction Resistance between the Cemented Soil and Soil

Owing to the limitations of the field test, the lateral friction resistance between the cemented soil and soil was obtained by numerical simulation, as shown in Figure 11. The friction resistance increased with the depth along the pile and reached its maximum value at the pile end. The friction resistance of the cemented soil gradually increased with an increase in load. The end friction resistance reached 120 kPa when loading to 3300 kN. Nevertheless, the value is still less than the friction resistance between the stiffened core and cemented soil, which indicates that the stiffened core transfers most of the load and plays a regulatory role. However, it is necessary to consider the continued increase in the friction resistance between the cemented soil and soil at the pile end when the load is greater than 2970 kN.

4. Analysis of the Group Piles

4.1. Finite Element Model of Pile Group

The rationality of the model was verified by comparing the numerical simulation and test results for a single stiffened composite pile. Subsequently, a finite element model of the pile group with a stiffened composite pile was established. To easily apply the load, a large bearing platform was built on top of the pile group. The composition and parameter settings of the pile group were the same as those of the single pile. The cap–soil interface and the cap–pile interface was considered as a smooth contact with a strength reduction factor (Rinter) of 1 [24]. The Rinter indicates the strength of the interface element as a percentage of the shear strength of adjacent soil. The pile body contacted with the pile-surrounding soil and the cap base, which are connected with each other by way of friction surface contact. A finite element model of the stiffened composite pile group and ground soil is shown in Figure 12. The dimensions of the model are 20 m × 20 m × 30 m. The pile group consists of nine piles distributed by 3 × 3 piles. The bearing capacity of the stiffened composite pile group was investigated by applying a vertical load to the bearing platform. The entire vertical load was applied step-by-step from 5000 kN, with an increase of 5000 kN in each step, until it reached 25,000 kN. The pile displacement and axial stress at different load steps were extracted.

4.2. Bearing Capacity of Pile Group

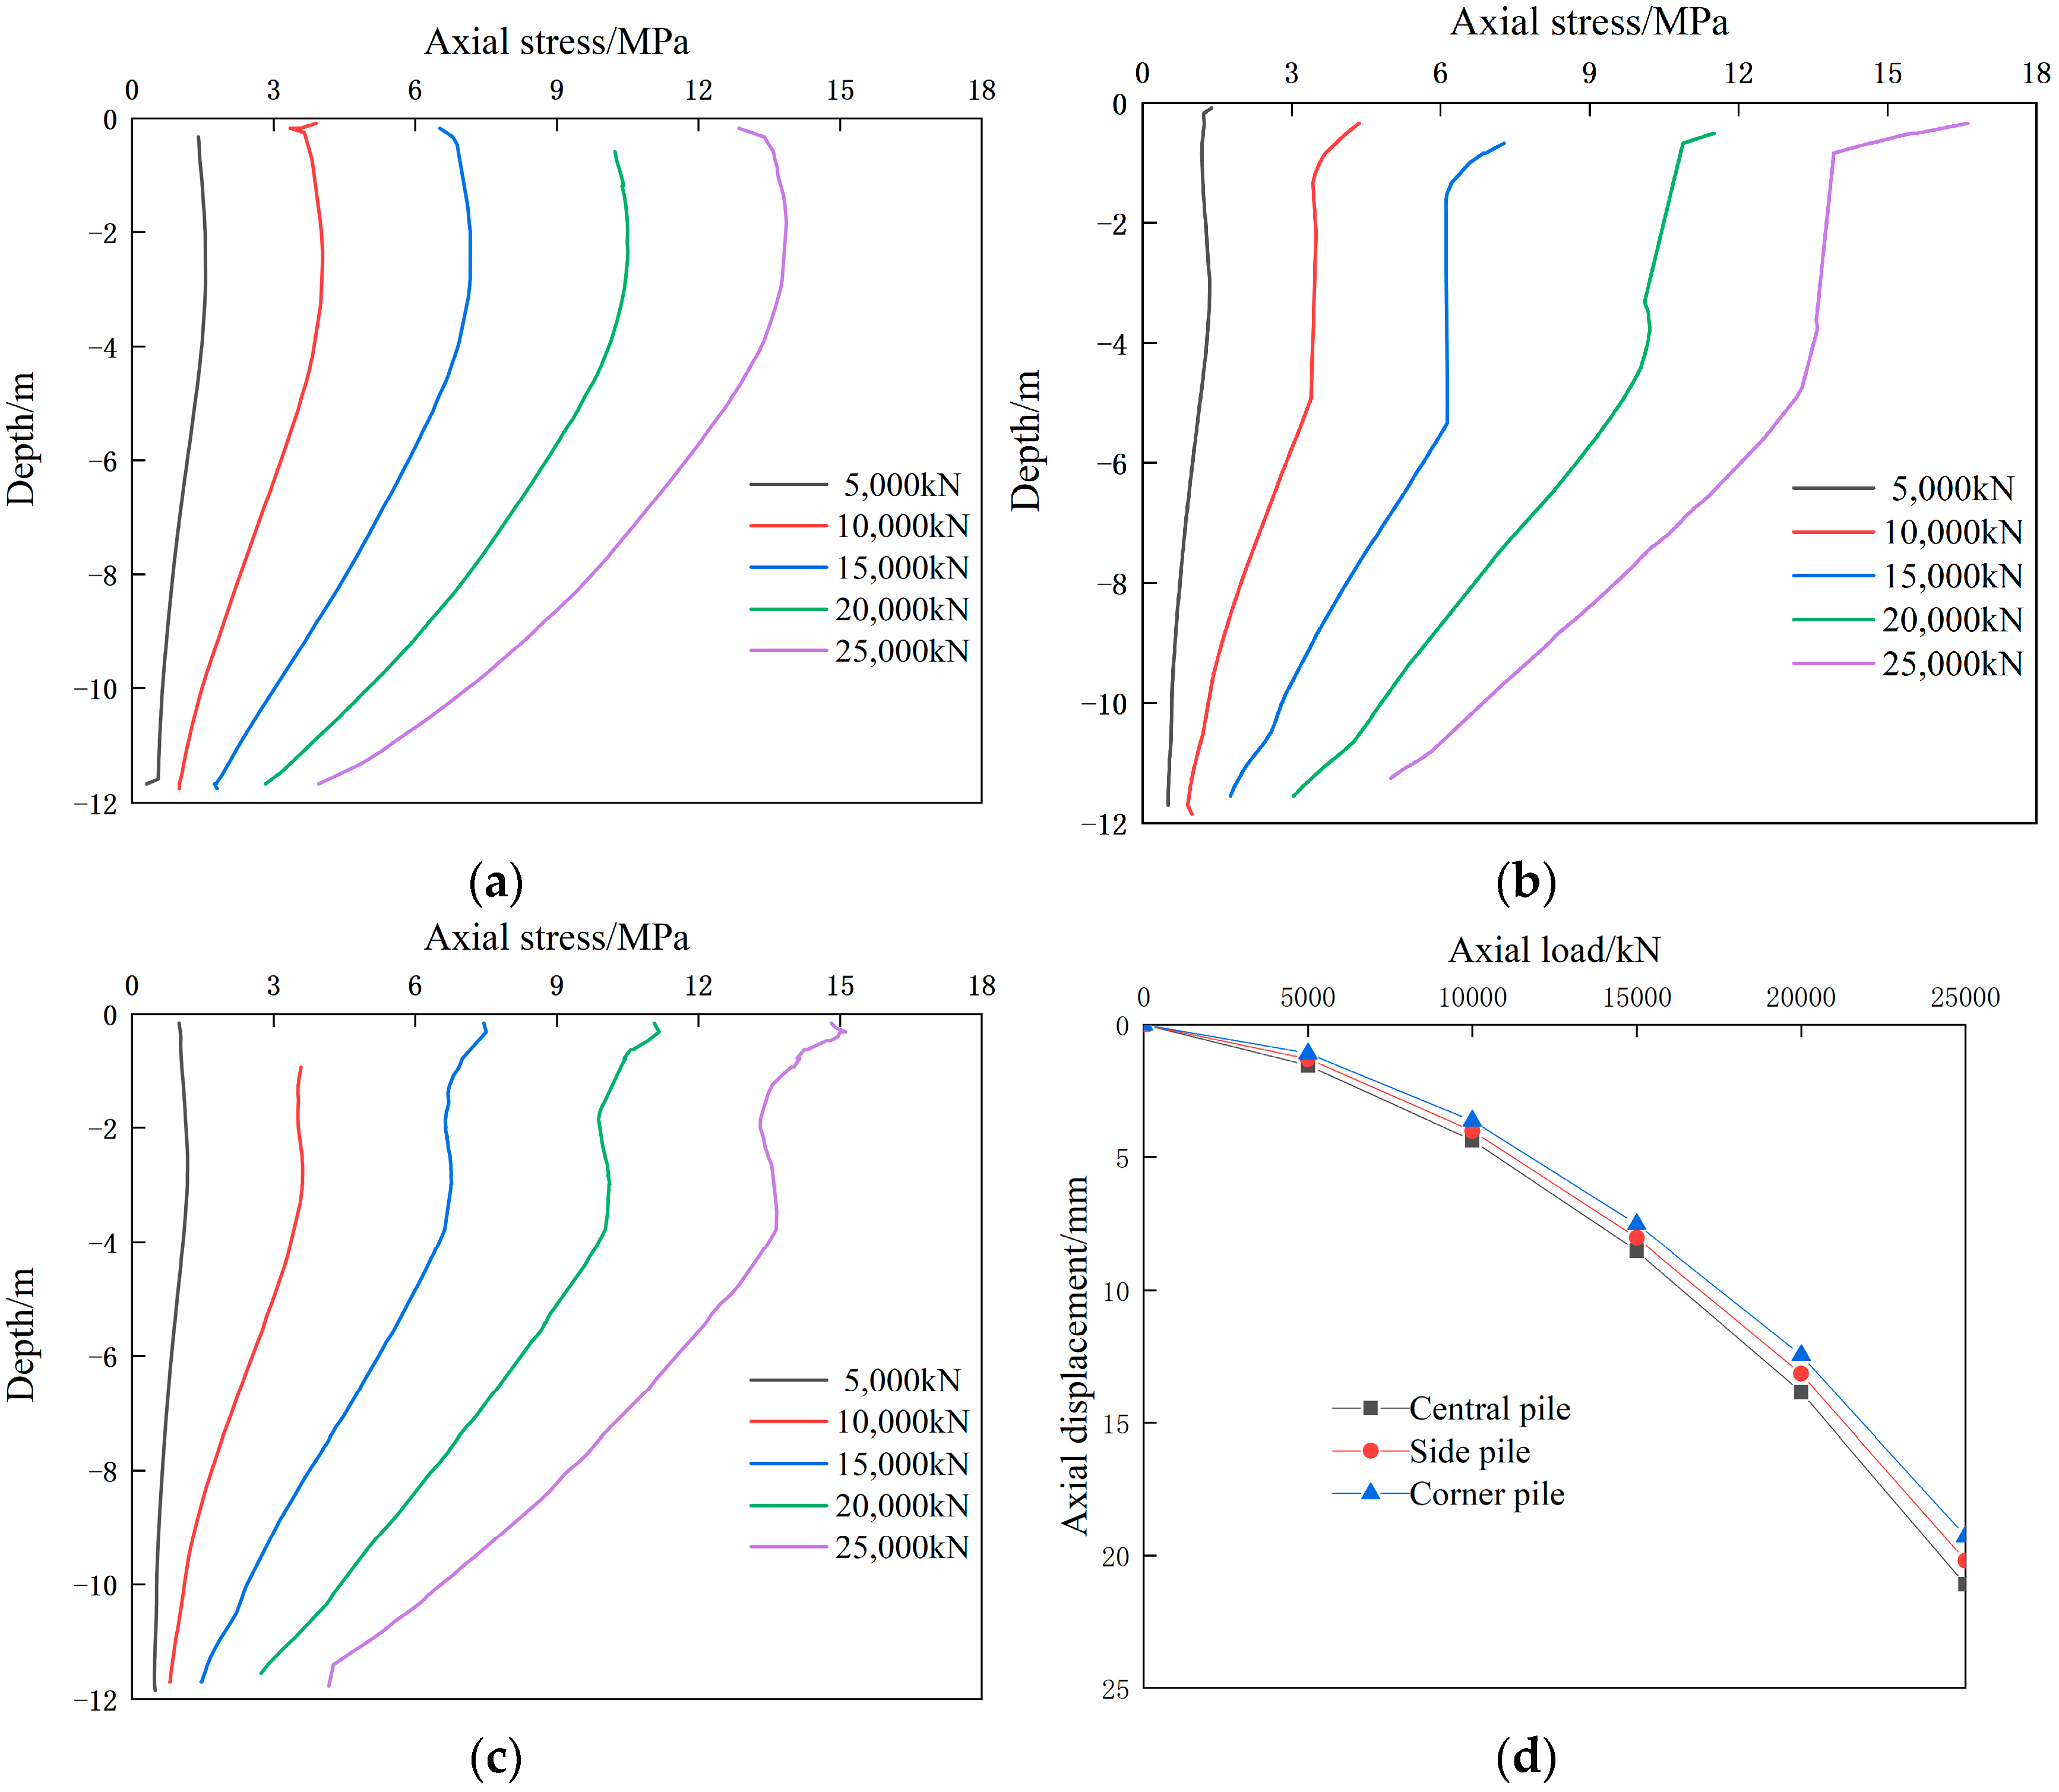
Figure 13 shows the axial stress and vertical displacement of each pile under vertical loading. It can be observed from the Figure that the change trend in the axial stress of the central, side, and corner piles is almost the same, which is similar to the case of the single stiffened composite pile. The axial stress of each pile is large at the top and small at the bottom, which indicates that the friction resistance transfers most at the upper part of the pile, and the cemented pile transmits the load. In the pile group, the axial stress of the side pile was the largest, followed by that of the corner pile, and the axial stress of the central pile was the smallest. The q–s curves of the three piles are similar, indicating that the load transfer mechanism does not change with the variation in the pile location in a group.

4.3. Influence of Pile Cap

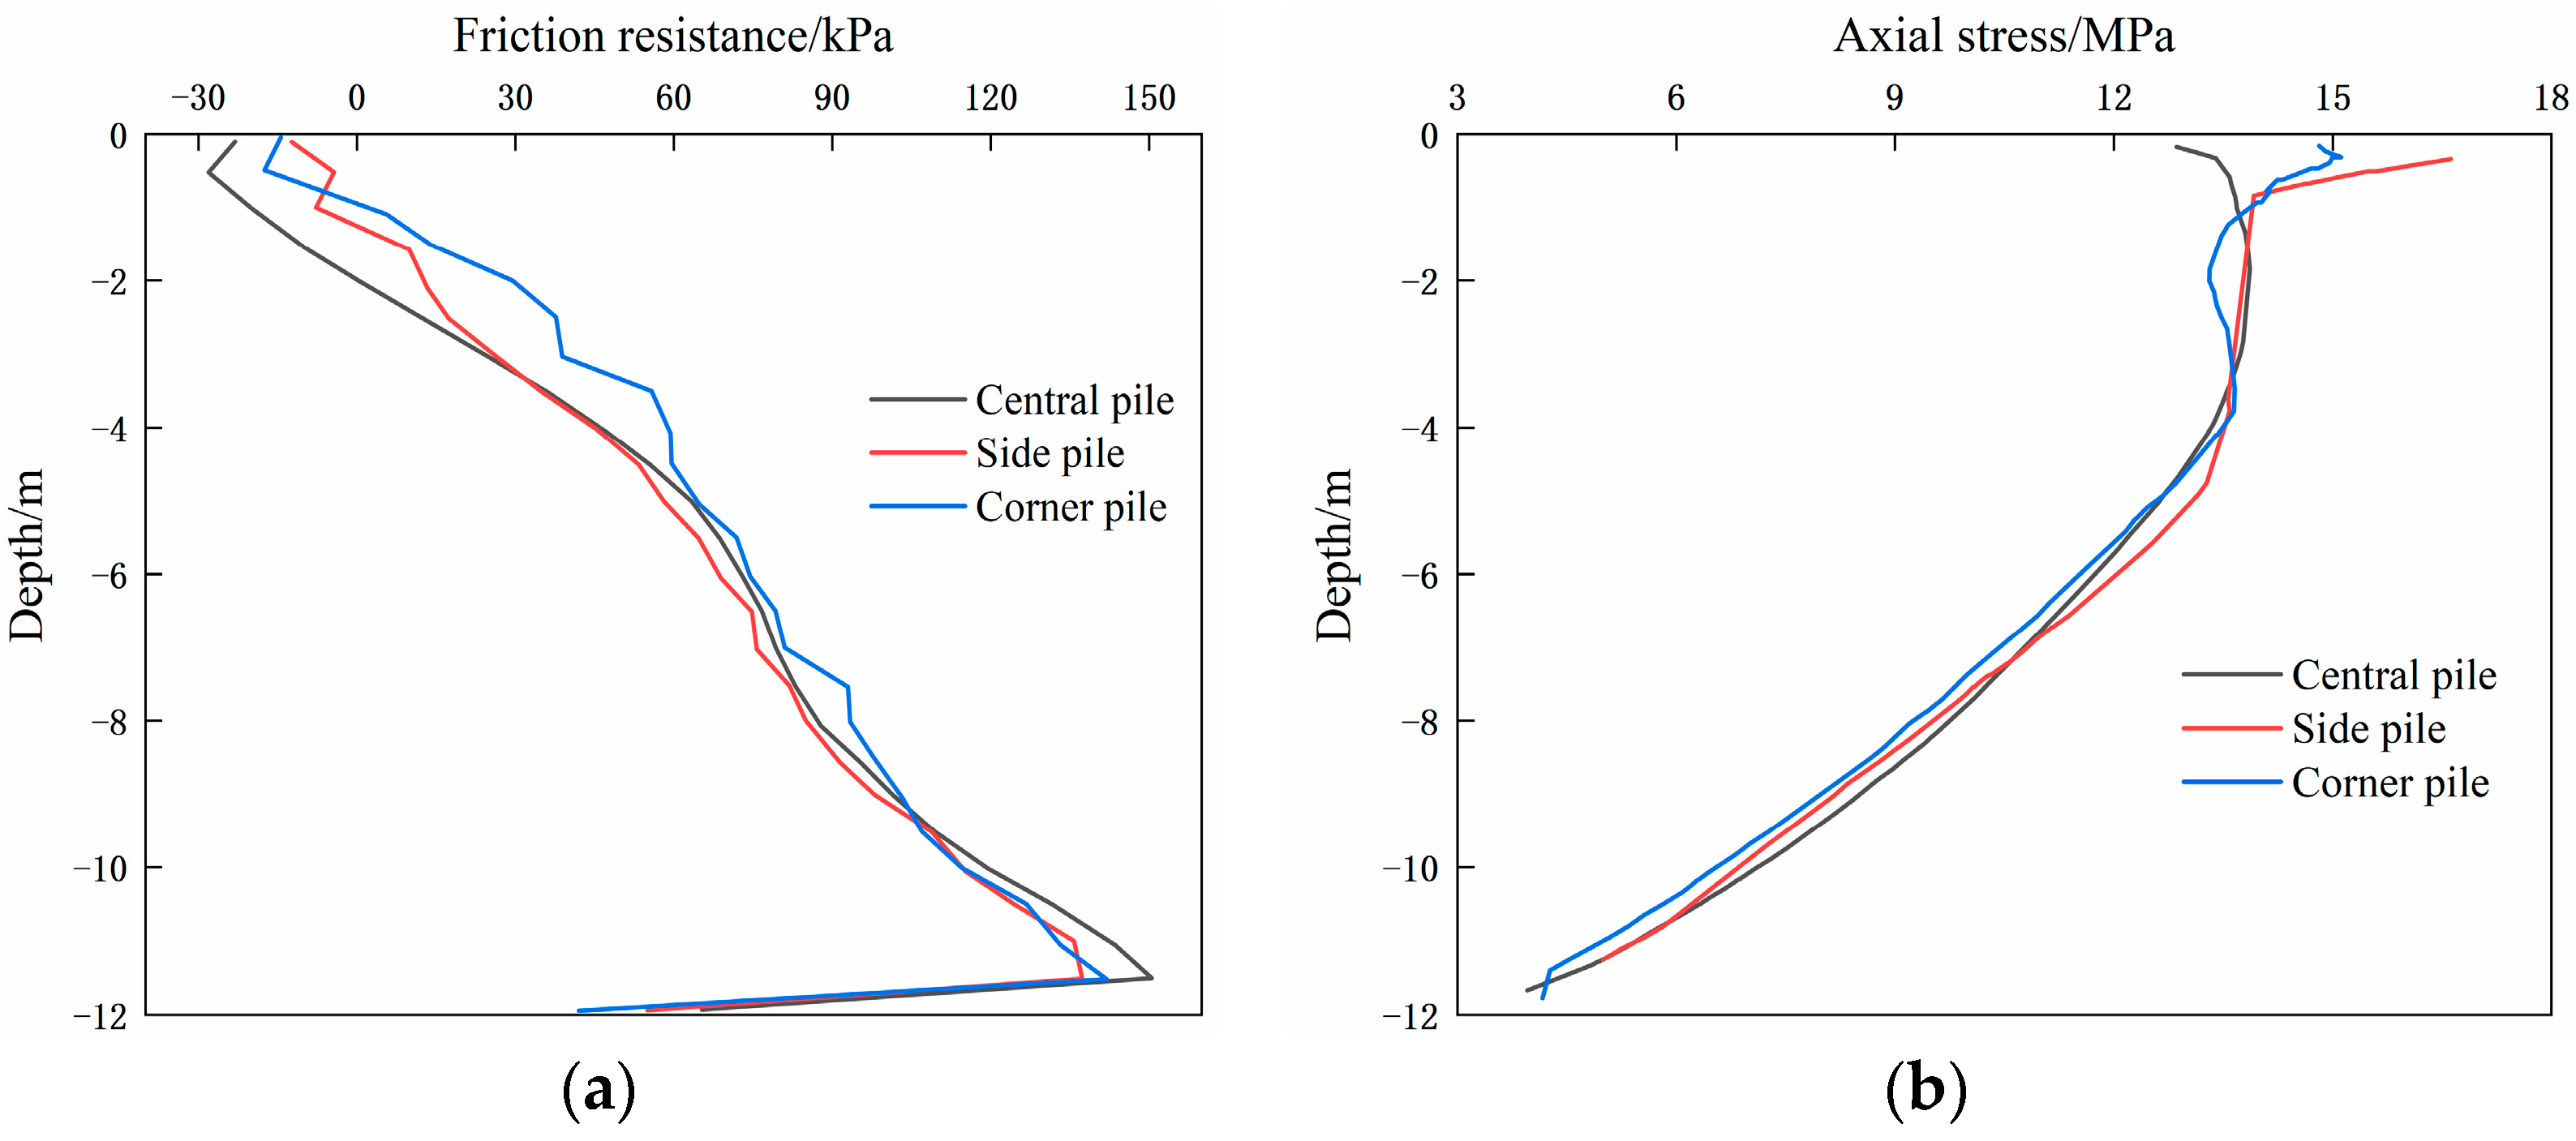
Figure 14a shows the friction resistance of the central pile, side pile, and corner pile under the load of 25,000 kN. As can be seen from the figure, the decrease rate of the friction resistance of the core pile is greater than that of the side pile, and the decrease rate of the side pile is bigger than that of the central pile. The corner pile first reaches the neutral point, the side pile is the second, and the middle pile reaches it last. This is due to the existence of the cap, which limits the relative displacement of the subsoil within 6 m in depth of the cap stage. At the same time, because the central pile is affected by the packing effect of the side pile and corner pile, the friction resistance of the central pile is difficult to play, so the position of its neutral point is lower than those of the side pile and corner pile. On the contrary, the side pile and the corner pile are close to the edge of the cap, and its lateral friction resistance develops rapidly. When the range exceeds 6 m outside the cap, the lateral friction resistance of the three piles gradually increases. Figure 14b shows the axial stress of the central pile, side pile, and corner pile under the load of 25,000 kN. The axial stress of the corner pile is greater than that of the side pile, and the axial stress of the side pile is greater than that of the corner pile. Because the displacement of the soil between piles within 6 m of the cap is limited by the pile, the friction resistance development speed is slow, which leads to the slow change in axial stress. When the range exceeds 6 m outside the cap, the change in axial stress gradually accelerates. The influence of the cap on the axial stress and the friction resistance indicates that the cap plays a weak role in the act of friction resistance within 6 m of the cap.

4.4. Influence of Pile Base Resistance

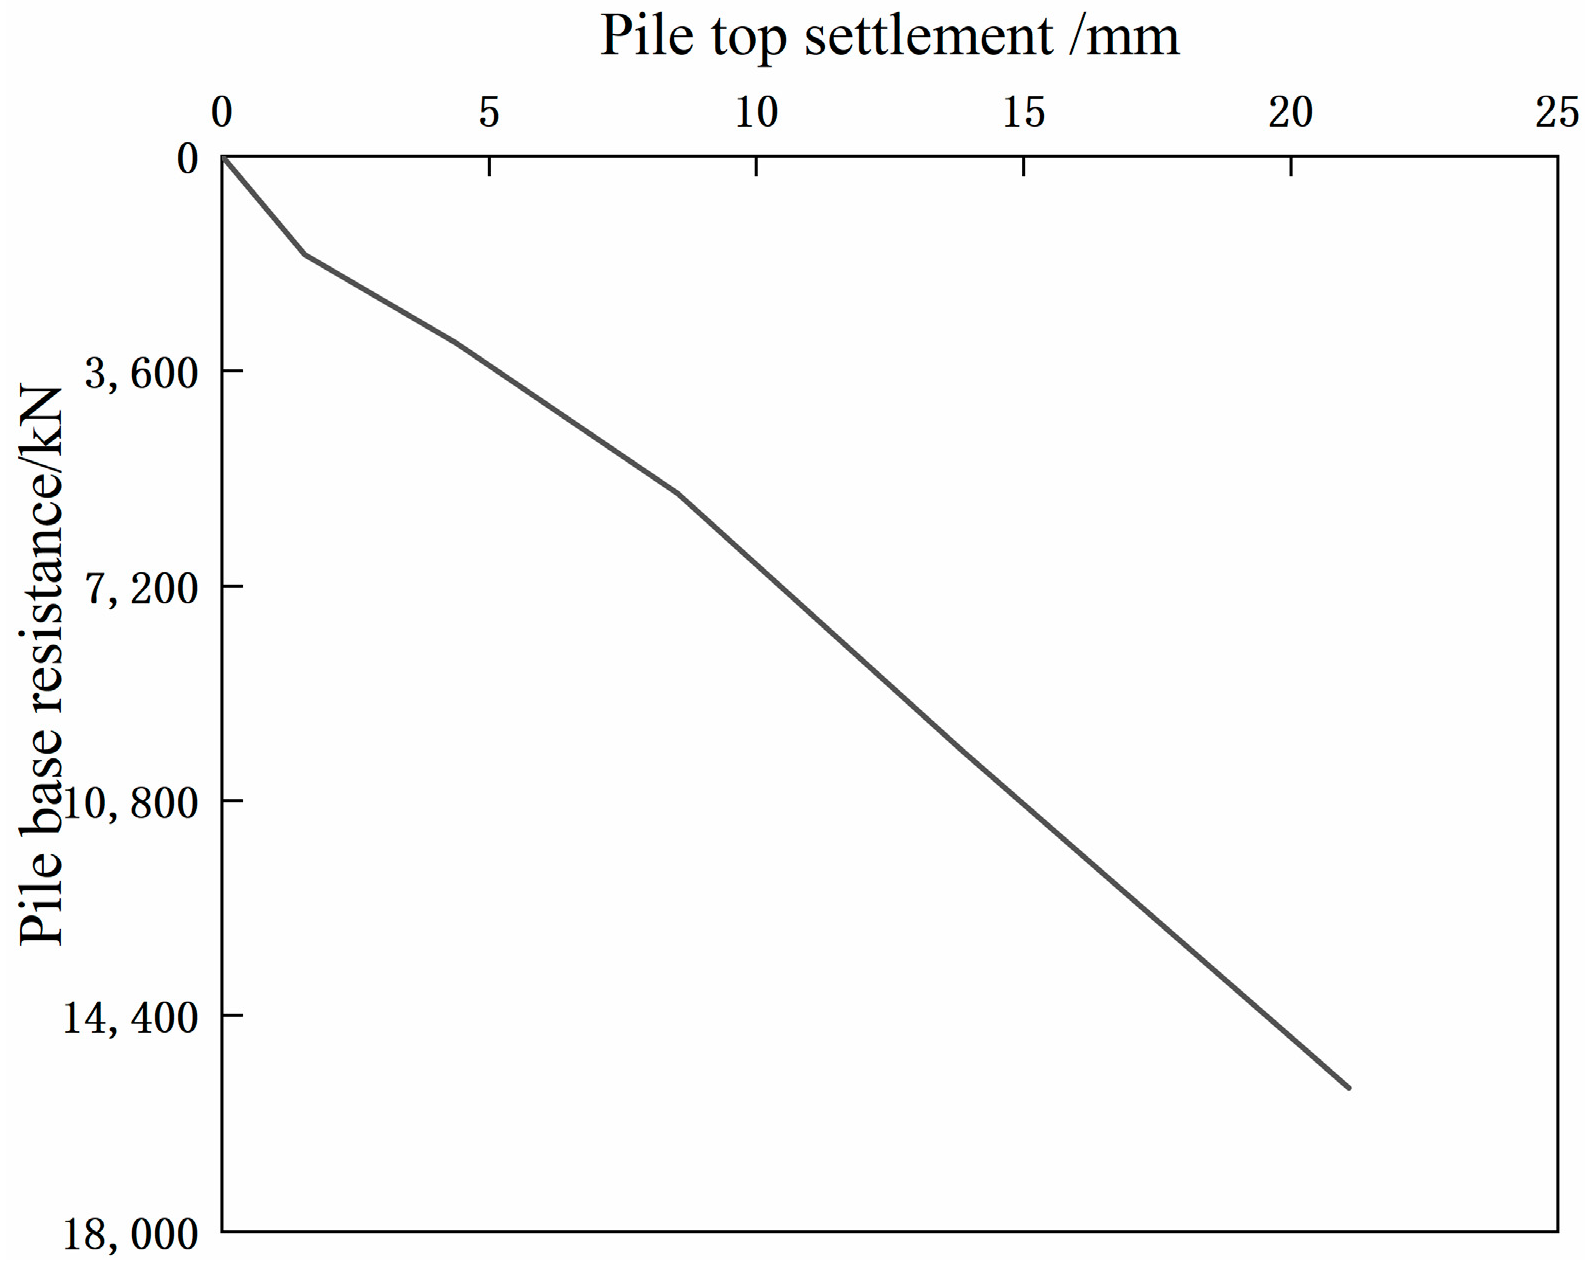
Figure 15 shows the curve of the friction resistance of the middle pile base, changing with settlement. It can be seen that when the relative displacement of the pile and soil is equal to zero, the friction resistance has not yet begun to act, and the base resistance is equal to zero. The load of the pile body is transferred to the soil around the pile through friction resistance, so that the soil at the pile base is compressed and the base resistance is gradually played.
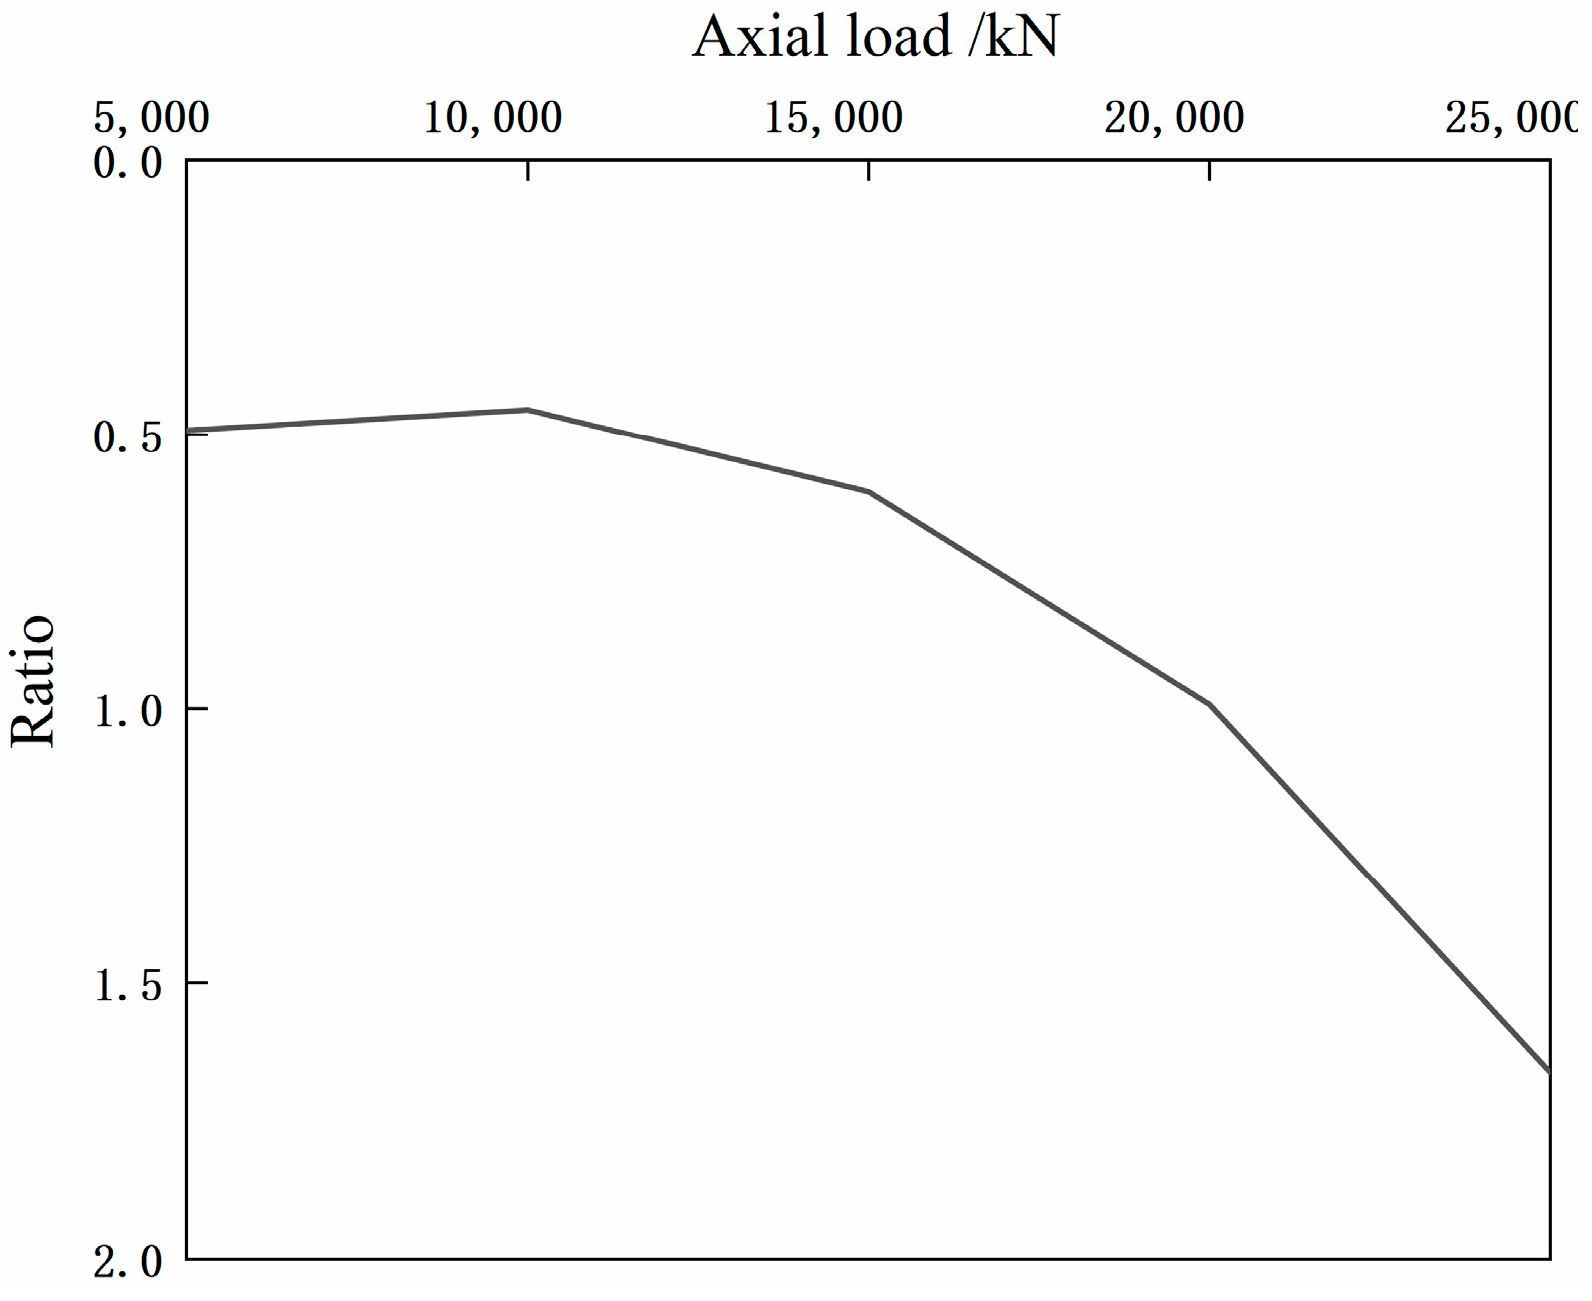
Figure 16 is the ratio curve of end resistance to average friction resistance. As can be seen from the figure, when the load is small, the load is mainly transferred by friction resistance; the end resistance value is relatively small. With the gradual increase in the load, the load is continuously transmitted downward through friction resistance, the relative displacement between the soil and the pile continues increasing, and the soil at the pile end is compressed to produce base resistance, which is manifested as increasing base resistance. This reveals that the friction resistance acts earlier than the base resistance.

4.5. Influence of Pile Spacing

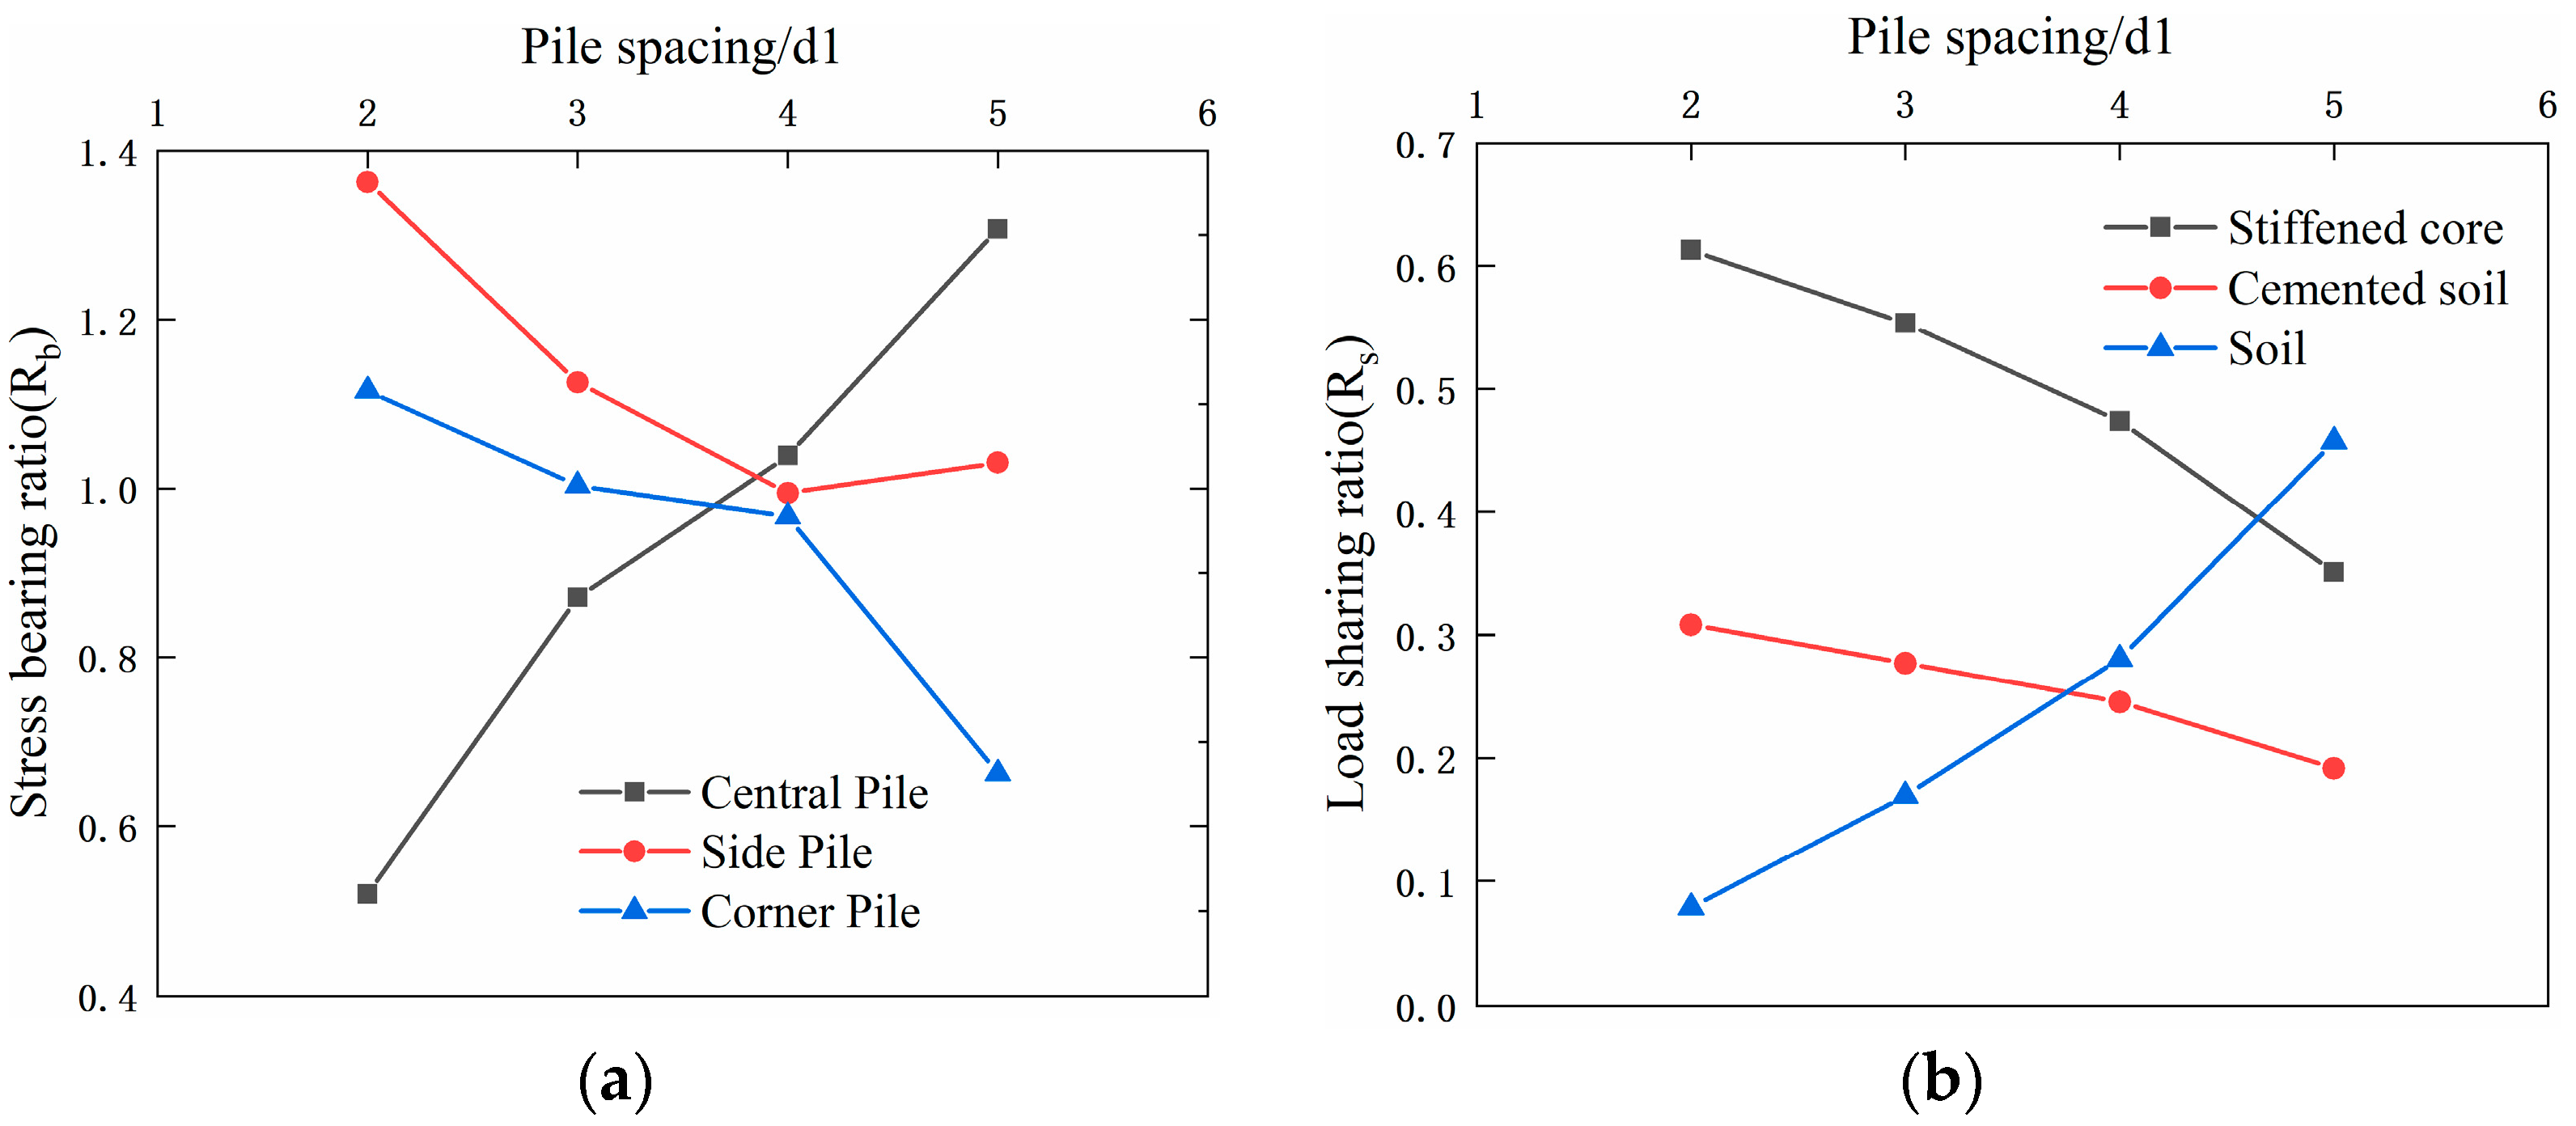
Figure 17 shows the axial stress distribution of the pile group with different pile spacing. It can be seen from the Figure that the axial stress of the side and corner piles decreases rapidly with an increase in the pile spacing. This is because the soil around the pile bears more load with an increase in the pile spacing. The axial stress of the central pile first increases with an increase in the pile spacing and then fluctuates. Generally, the greater the pile spacing, the smaller the axial stress of the pile [31]. The stress-bearing ratio (Rb) represents the ratio between the axial stress of each pile of the stiffened composite pile group and the average axial stress of the pile at the top. Figure 18a shows the change in the stress-bearing ratio of each pile with pile spacing. Figure 18a indicates that the axial stress of the side and corner piles decreases rapidly with an increase in pile spacing and that the stress-bearing ratio decreases. The stress-bearing ratio of the central pile increases with an increase in the pile spacing, indicating that the central pile bears more of the upper load when the pile spacing is larger. The side and corner piles play the main role in bearing the load when the pile spacing is small. This is because when the pile spacing increases, the pile group effect from the corner and side piles on the central pile is gradually reduced. Therefore, the central pile can bear a higher load, resulting in a gradual increase in its stress-bearing ratio. In contrast, the axial stresses of the side and corner piles decrease owing to the large bearing ratio of the central pile. Figure 18b shows the change in the pile–soil load-sharing ratio (Rs) with the change in the pile spacing of the pile group. With an increase in pile spacing, the load shared by the stiffened core and cemented soil gradually decreases, whereas the load shared by the soil around the pile gradually increases. This is because the expansion of the pile spacing leads to the expansion of the cap area, and the force of the pile group is more uniform.

4.6. Influence of Stiffened Core Diameter

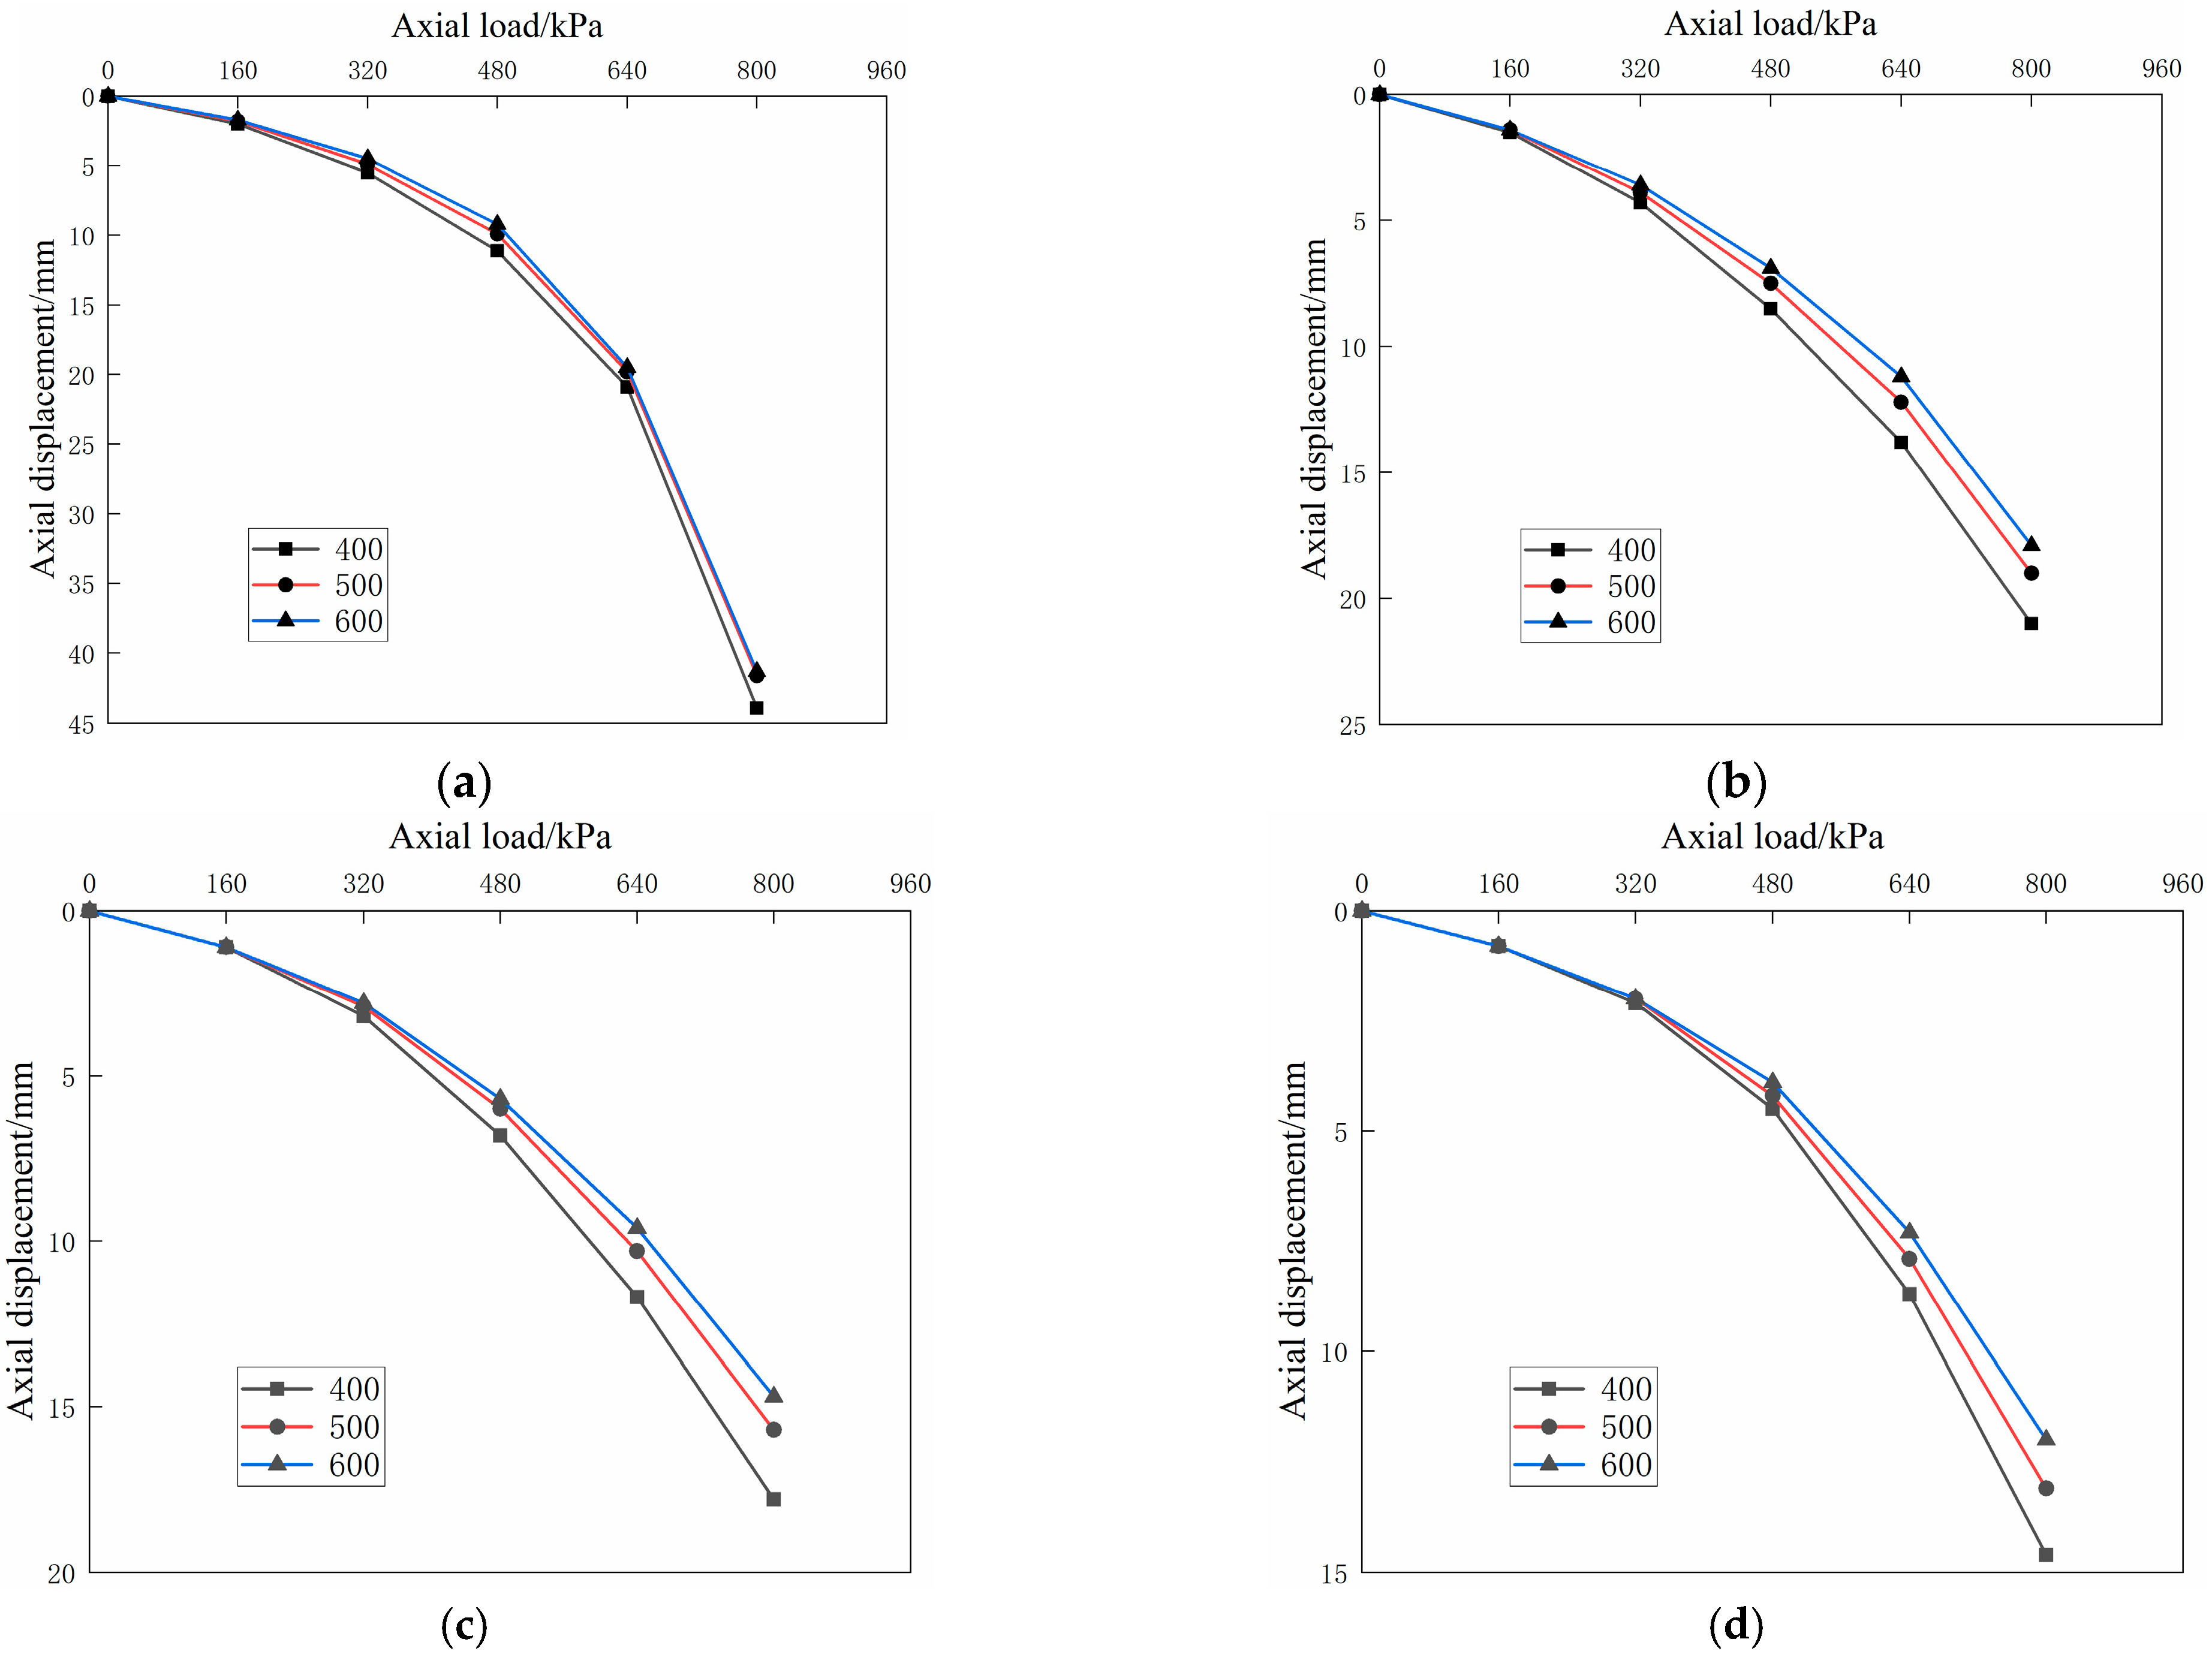
Figure 19 shows the load-displacement curves for different stiffened core diameters. Figure 19 shows that the pile top settlement decreases with the increase in the inner core pile diameter under the same pile spacing and load. This is because the elastic modulus of the stiffened core is greater than that of the outer cemented soil. When the diameter of the outer cemented soil does not change, the increase in the inner core diameter is equivalent to the increase in the elastic modulus of the stiffened composite pile section. Under the same load, the deformation of the stiffened composite pile with the larger diameter of the inner stiffened core diameter is the smaller.
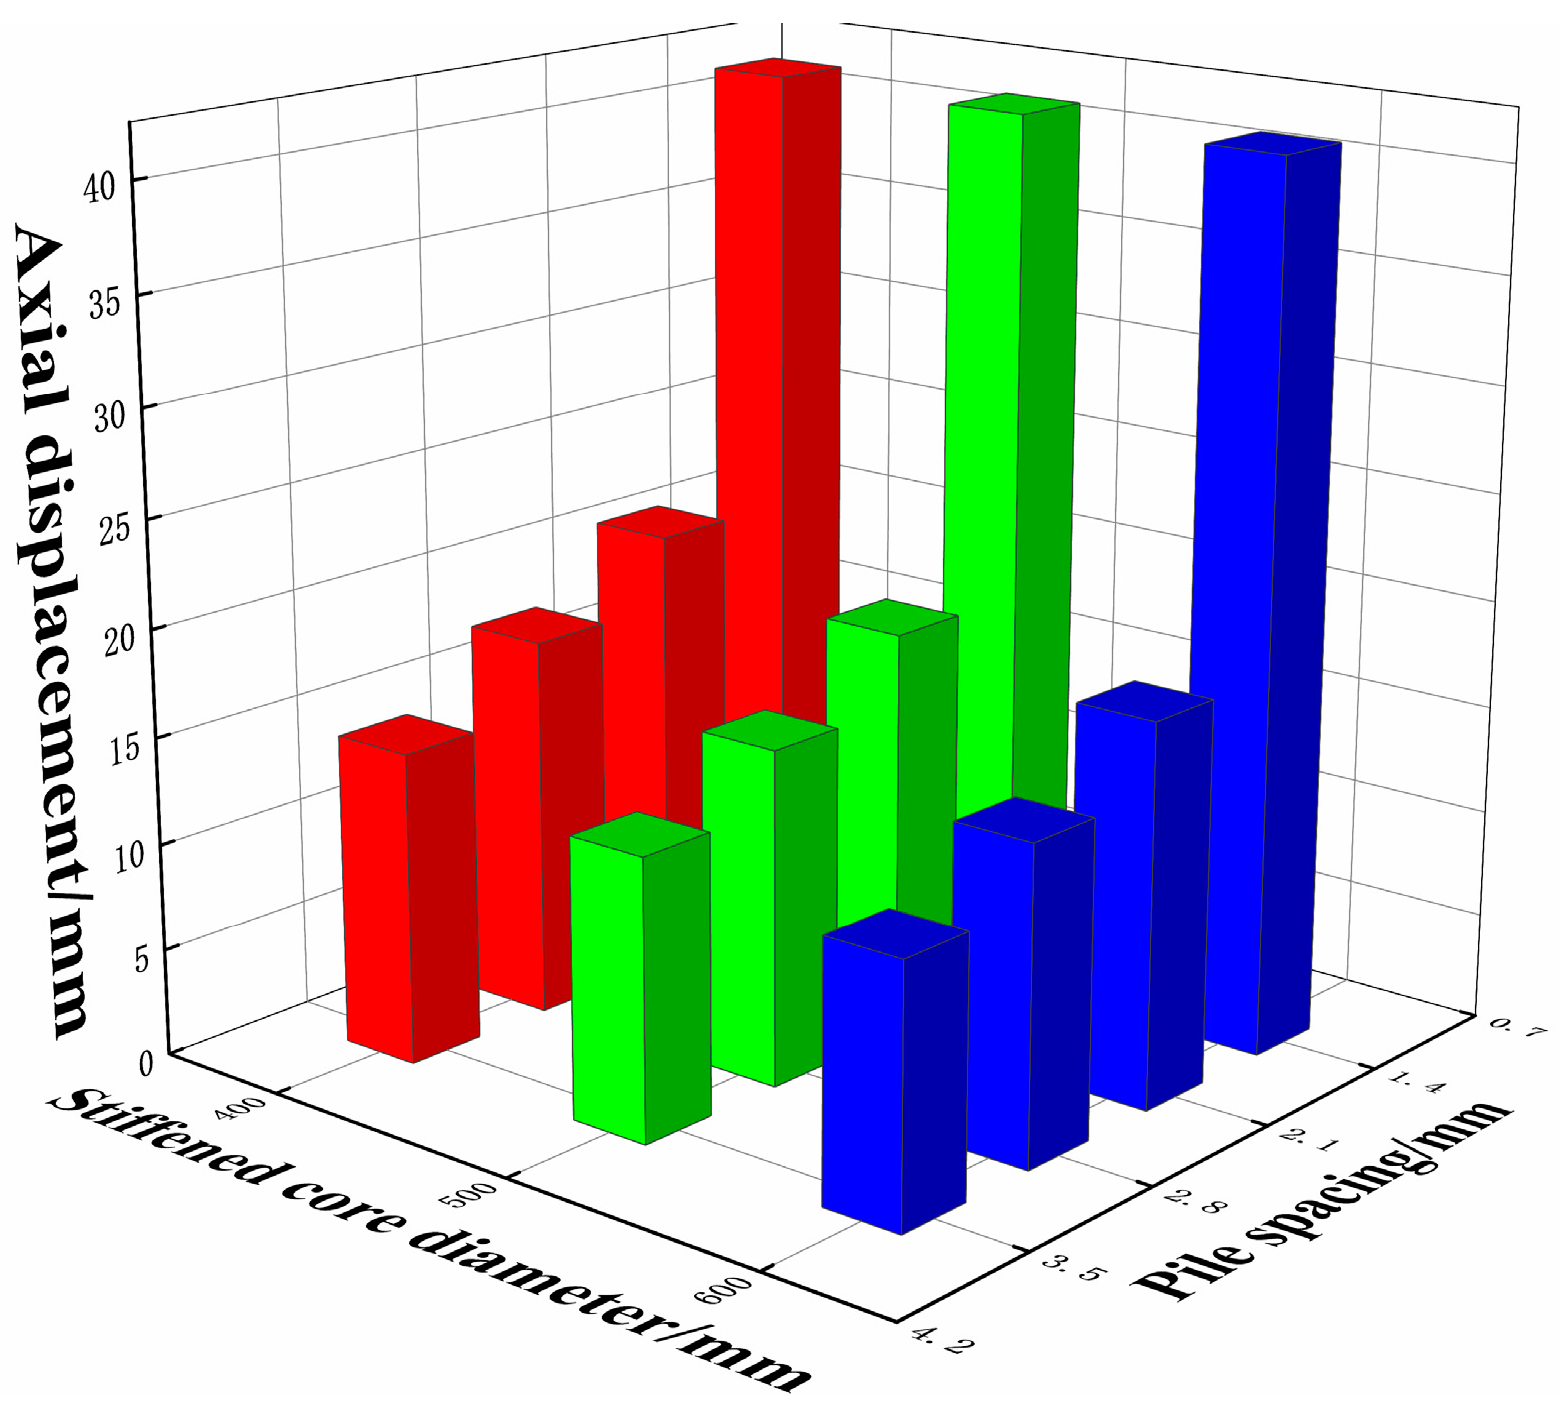
Figure 20 shows the influence of stiffened core diameter and pile spacing on the settlement of the pile group. It can be observed from the Figure that when the stiffened core diameter remains unchanged, the settlement of the pile top decreases with an increase in pile spacing. When the pile spacing remains unchanged, the settlement of the pile top can be reduced by increasing the diameter of the stiffened core. However, the pile-tip settlement does not change significantly when the pile spacing is 2d1. When the stiffened core diameter increases from 400 mm to 500 mm, the settlement change rate of the pile top is greater than that of the stiffened core diameter from 500 mm to 600 mm. It is clear that a pile with a larger core diameter uses more concrete than a pile with a smaller core diameter. In practical engineering, the cost of concrete is higher than that of cement soil. Considering the economic benefits, the pile group with a pile spacing of 2.8 m (four times the pile diameter), a stiffened core diameter of 500 mm, and a cemented soil diameter of 700 mm is the optimal scheme for this ground improvement project.

5. Conclusions

To study the bearing capacity of a stiffened composite pipe pile group, a combination of field test and the finite element method was used. A single stiffened composite pipe pile model was verified by comparing the numerical simulation results with the field test results. The model is further expanded into a pile group to analyse the bearing capacity of pile groups. The conclusions drawn are as follows.
(1)
The axial stress of the stiffened core decreased with the increasing depth along the pile. The axial stress of the cemented soil increased with an increase in the depth along the pile and reached a peak value at 4.5–7.5 m. The friction resistance between the stiffened core and cemented soil decreased gradually with an increase in the depth along the pile. The lateral friction between the cemented soil and the soil around the pile increased along the depth of the pile.
(2)
The load was transmitted downward along the stiffened core of the pile in the form of axial force. With an increase in depth along the pile, the axial stress of the core was gradually transferred to the outer cemented soil in the form of friction resistance. Part of the load was transferred to the end of the pile along the cemented soil in the form of axial stress, and the other part was transferred to the soil around the pile in the form of friction resistance.
(3)
In the square distribution pile group, the axial stress of the side pile was the largest, followed by that of the corner pile, and the axial stress of the central pile was the smallest. The q–s curves for each pile in the group were similar. The central pile was significantly affected by the group pile effect, and the bearing capacity was relatively low compared with that of the other piles.
(4)
The axial stress of the side and corner piles decreased rapidly with an increase in pile spacing, and the stress-bearing ratio decreased. The stress-bearing ratio of the central pile increased with an increase in pile spacing. The side and corner piles played the main roles in bearing the load when the pile spacing was small.
(5)
The smaller the pile spacing, the greater the proportion of the load shared by the piles and the smaller the bearing capacity of the foundation. When the pile spacing was two times the pile diameter, the q-s curve dropped sharply.
(6)
The coupling effects of different stiffened core diameters and pile spacings were compared, and the optimal parameters in this ground improvement project were se-lected as the pile group with a pile spacing of 2.8 m (four times the pile diameter), stiffened core diameter of 500 mm, and cemented soil diameter of 700 mm.

Author Contributions

Conceptualization, X.B., H.C. and X.C.; software, J.S. and Z.C.; validation, X.B., J.S. and Z.C.; investigation, X.C.; resources, X.C. and X.Z.; data curation, X.Z.; writing—original draft preparation, X.B. and J.S; writing—review and editing, X.B. and H.C. All authors have read and agreed to the published version of the manuscript.

Funding

This research was funded by the National Natural Science Foundation of China, grant number 52022060 and the Technical Innovation Foundation of Shenzhen, grant number JCYJ20190808112203700.

Institutional Review Board Statement

Not applicable.

Informed Consent Statement

Not applicable.

Data Availability Statement

Not applicable.

Conflicts of Interest

The authors declare no conflict of interest.

References

  1. Chen, Y.; Zhao, W.; Han, J.; Jia, P. A CEL study of bearing capacity and failure mechanism of strip footing resting on c-φ soils. Comput. Geotech. 2019, 111, 126–136. [Google Scholar] [CrossRef]
  2. Ding, X.; Qu, L.; Yang, J.; Wang, C. Experimental study on the pile group-soil vibration induced by railway traffic under the inclined bedrock condition. Acta Geotech. 2020, 15, 3613–3620. [Google Scholar] [CrossRef]
  3. Jia, P.; Zhao, W.; Khoshghalb, A.; Ni, P.; Jiang, B.; Chen, Y.; Li, S. A new model to predict ground surface settlement induced by jacked pipes with flanges. Tunn. Undergr. Space Tech. 2020, 98, 103330. [Google Scholar] [CrossRef]
  4. Tong, L.; Li, H.; Ha, S.; Liu, S. Lateral bearing performance and mechanism of piles in the transition zone due to pit-in-pit excavation. Acta Geotech. 2022, 17, 1935–1948. [Google Scholar] [CrossRef]
  5. Wu, L.; Xiang, Z.; Jiang, H.; Liu, M.; Ju, X.; Zhang, W. A Review of Durability Issues of Reinforced Concrete Structures Due to Coastal Soda Residue Soil in China. J. Mar. Sci. Eng. 2022, 10, 1740. [Google Scholar] [CrossRef]
  6. Li, X.; Bai, M.; Li, T.; Qiu, S.; Shi, H. Application of Carbon-Fiber Composite Material in Micropile Structure. J. Perform. Constr. Fac. 2020, 34, 4020017. [Google Scholar] [CrossRef]
  7. Wu, P.; Yin, J.; Feng, W.; Chen, W. Experimental study on geosynthetic-reinforced sand fill over marine clay with or without deep cement mixed soil columns under different loadings. Undergr. Space 2019, 4, 340–347. [Google Scholar] [CrossRef]
  8. Zhang, J.; Liu, X.; Ren, T.; Shi, Y.; Yuan, Y. Numerical analysis of tunnel segments strengthened by steel–concrete composites. Undergr. Space 2022, 7, 1115–1124. [Google Scholar] [CrossRef]
  9. Zyka, K.; Mohajerani, A. Composite piles: A review. Constr. Build. Mater. 2016, 107, 394–410. [Google Scholar] [CrossRef]
  10. Ling, G.; Xie, D.; Wang, E. Experimental Study on Concrete Core Mixing Pile. J. Build. Struct. 2001, 22, 92–96. [Google Scholar]
  11. Li, Y.H.; Sun, L.Q.; Li, X.; Huang, M.S. Experimental study on the shear mechanical properties of the cemented soil-concrete interface. Eur. J. Environ. Civ. Eng. 2022, 26, 4725–4739. [Google Scholar] [CrossRef]
  12. Jamsawang, P.; Bergado, D.T.; Bhandari, A.; Voottipruex, P. Behavior of stiffened Deep Cement Mixing pile in laboratory. Lowland Technol. Int. 2009, 11, 20–28. [Google Scholar]
  13. Voottipruex, P.; Jamsawang, P.; Sukontasukkul, P.; Jongpradist, P.; Horpibulsuk, S.; Chindaprasirt, P. Performances of SDCM and DCM walls under deep excavation in soft clay: Field tests and 3D simulations. Soils Found. 2019, 59, 1728–1739. [Google Scholar] [CrossRef]
  14. Zhu, S.; Chen, C.; Cai, H.; Mao, F. Analytical modeling for the load-transfer behavior of stiffened deep cement mixing (SDCM) pile with rigid cap in layer soils. Comput. Geotech. 2022, 144, 104618. [Google Scholar] [CrossRef]
  15. Shafaghat, A.; Khabbaz, H.; Fatahi, B. Axial and Lateral Efficiency of Tapered Pile Groups in Sand Using Mathematical and Three-Dimensional Numerical Analyses. Perform. Constr. Fac. 2022, 36, 4021108. [Google Scholar] [CrossRef]
  16. Pang, L.; Jiang, C.; Chen, L. Nonlinear Predictive Framework of the Undrained Clay Slope Effect on the Initial Stiffness of p-y Curves of Laterally Loaded Piles by FEM. J. Mar. Sci. Eng. 2022, 10, 1684. [Google Scholar] [CrossRef]
  17. Wang, A.; Zhang, D.; Liu, S.; Deng, Y. Bearing capacity behavior of strength composite pipe pile subjected to lateral loading. Zhongguo Kuangye Daxue Xuebao/J. China Univ. Min. Technol. 2018, 47, 853–861. [Google Scholar]
  18. Dong, P.; Qin, R.; Chen, Z.Z. FEM study of concrete-cored DCM pile. Rock Soil Mech. 2003, 24, 344–348. [Google Scholar]
  19. Lu, X.H.; Song, M.G.; Wang, P.F. Numerical simulation of the composite foundation of cement soil mixing piles using FLAC3D. Clust. Comput. 2019, 22, S7965–S7974. [Google Scholar] [CrossRef]
  20. Zhou, M.; Li, Z.T.; Han, Y.S.; Ni, P.P.; Wang, Y.L. Experimental Study on the Vertical Bearing Capacity of Stiffened Deep Cement Mixing Piles. Int. J. Geomech. 2022, 22, 04022043. [Google Scholar] [CrossRef]
  21. Ning, P.L.; Zhang, J.T.; Tian, Q.Y. Numerical simulation analysis of the application of cement-mixed pile curtain in an expressway extension project. Int. J. Pavement Eng. 2020, 21, 170–176. [Google Scholar] [CrossRef]
  22. Wonglert, A.; Jongpradist, P. Impact of reinforced core on performance and failure behavior of stiffened deep cement mixing piles. Comput. Geotech. 2015, 69, 93–104. [Google Scholar] [CrossRef]
  23. Nguyen, N.V.; Vinh, L.B.; Vo, T. Load-sharing mechanism of piled-raft foundation: A numerical study. Eur. J. Environ. Civ. Eng. 2022, 26, 7916–7931. [Google Scholar] [CrossRef]
  24. Mali, S.; Singh, B. Behavior of large piled-raft foundation on clay soil. Ocean Eng. 2018, 149, 205–216. [Google Scholar] [CrossRef]
  25. Zhang, J. Finite Element Analysis of Ultra-deep Foundation Pit Covered Top-Down Excavation Based on PLAXIS. IOP Conf. Ser. Earth Environ. Sci. 2019, 300, 22158. [Google Scholar] [CrossRef]
  26. Consoli, N.C.; Foppa, D.; Festugato, L.; Heineck, K.S. Key parameters for strength control of artificially cemented soils. J. Geotech. Geoenviron. 2007, 133, 197–205. [Google Scholar] [CrossRef]
  27. Consoli, N.C.; Viana Da Fonseca, A.; Cruz, R.C.; Heineck, K.S. Fundamental parameters for the stiffness and strength control of artificially cemented sand. J. Geotech. Geoenviron. 2009, 135, 1347–1353. [Google Scholar] [CrossRef] [Green Version]
  28. Zhou, J.; Gong, X.; Wang, K.; Zhang, R.; Yan, T. A Model Test on the Behavior of a Static Drill Rooted Nodular Pile Under Compression. Mar. Georesour. Geotec. 2016, 34, 293–301. [Google Scholar] [CrossRef]
  29. Jamsawang, P.; Bergado, D.; Bandari, A.; Voottipruex, P. Investigation and simulation of behavior of stiffened deep cement mixing (SDCM) piles. Int. J. Geotech. Eng. 2008, 2, 229–246. [Google Scholar] [CrossRef]
  30. Voottipruex, P.; Bergado, D.T.; Suksawat, T.; Jamsawang, P.; Cheang, W. Behavior and Simulation of Deep Cement Mixing (DCM) and Stiffened Deep Cement Mixing (SDCM) Piles Under Full Scale Loading. Soils Found. 2011, 51, 307–320. [Google Scholar] [CrossRef] [Green Version]
  31. Ying, L. Model test study on bearing capacity of different pile spacing super-long pile group. In Proceedings of the IEEE 2011 International Conference on Remote Sensing, Nanjing, China, 24–26 June 2011. [Google Scholar]
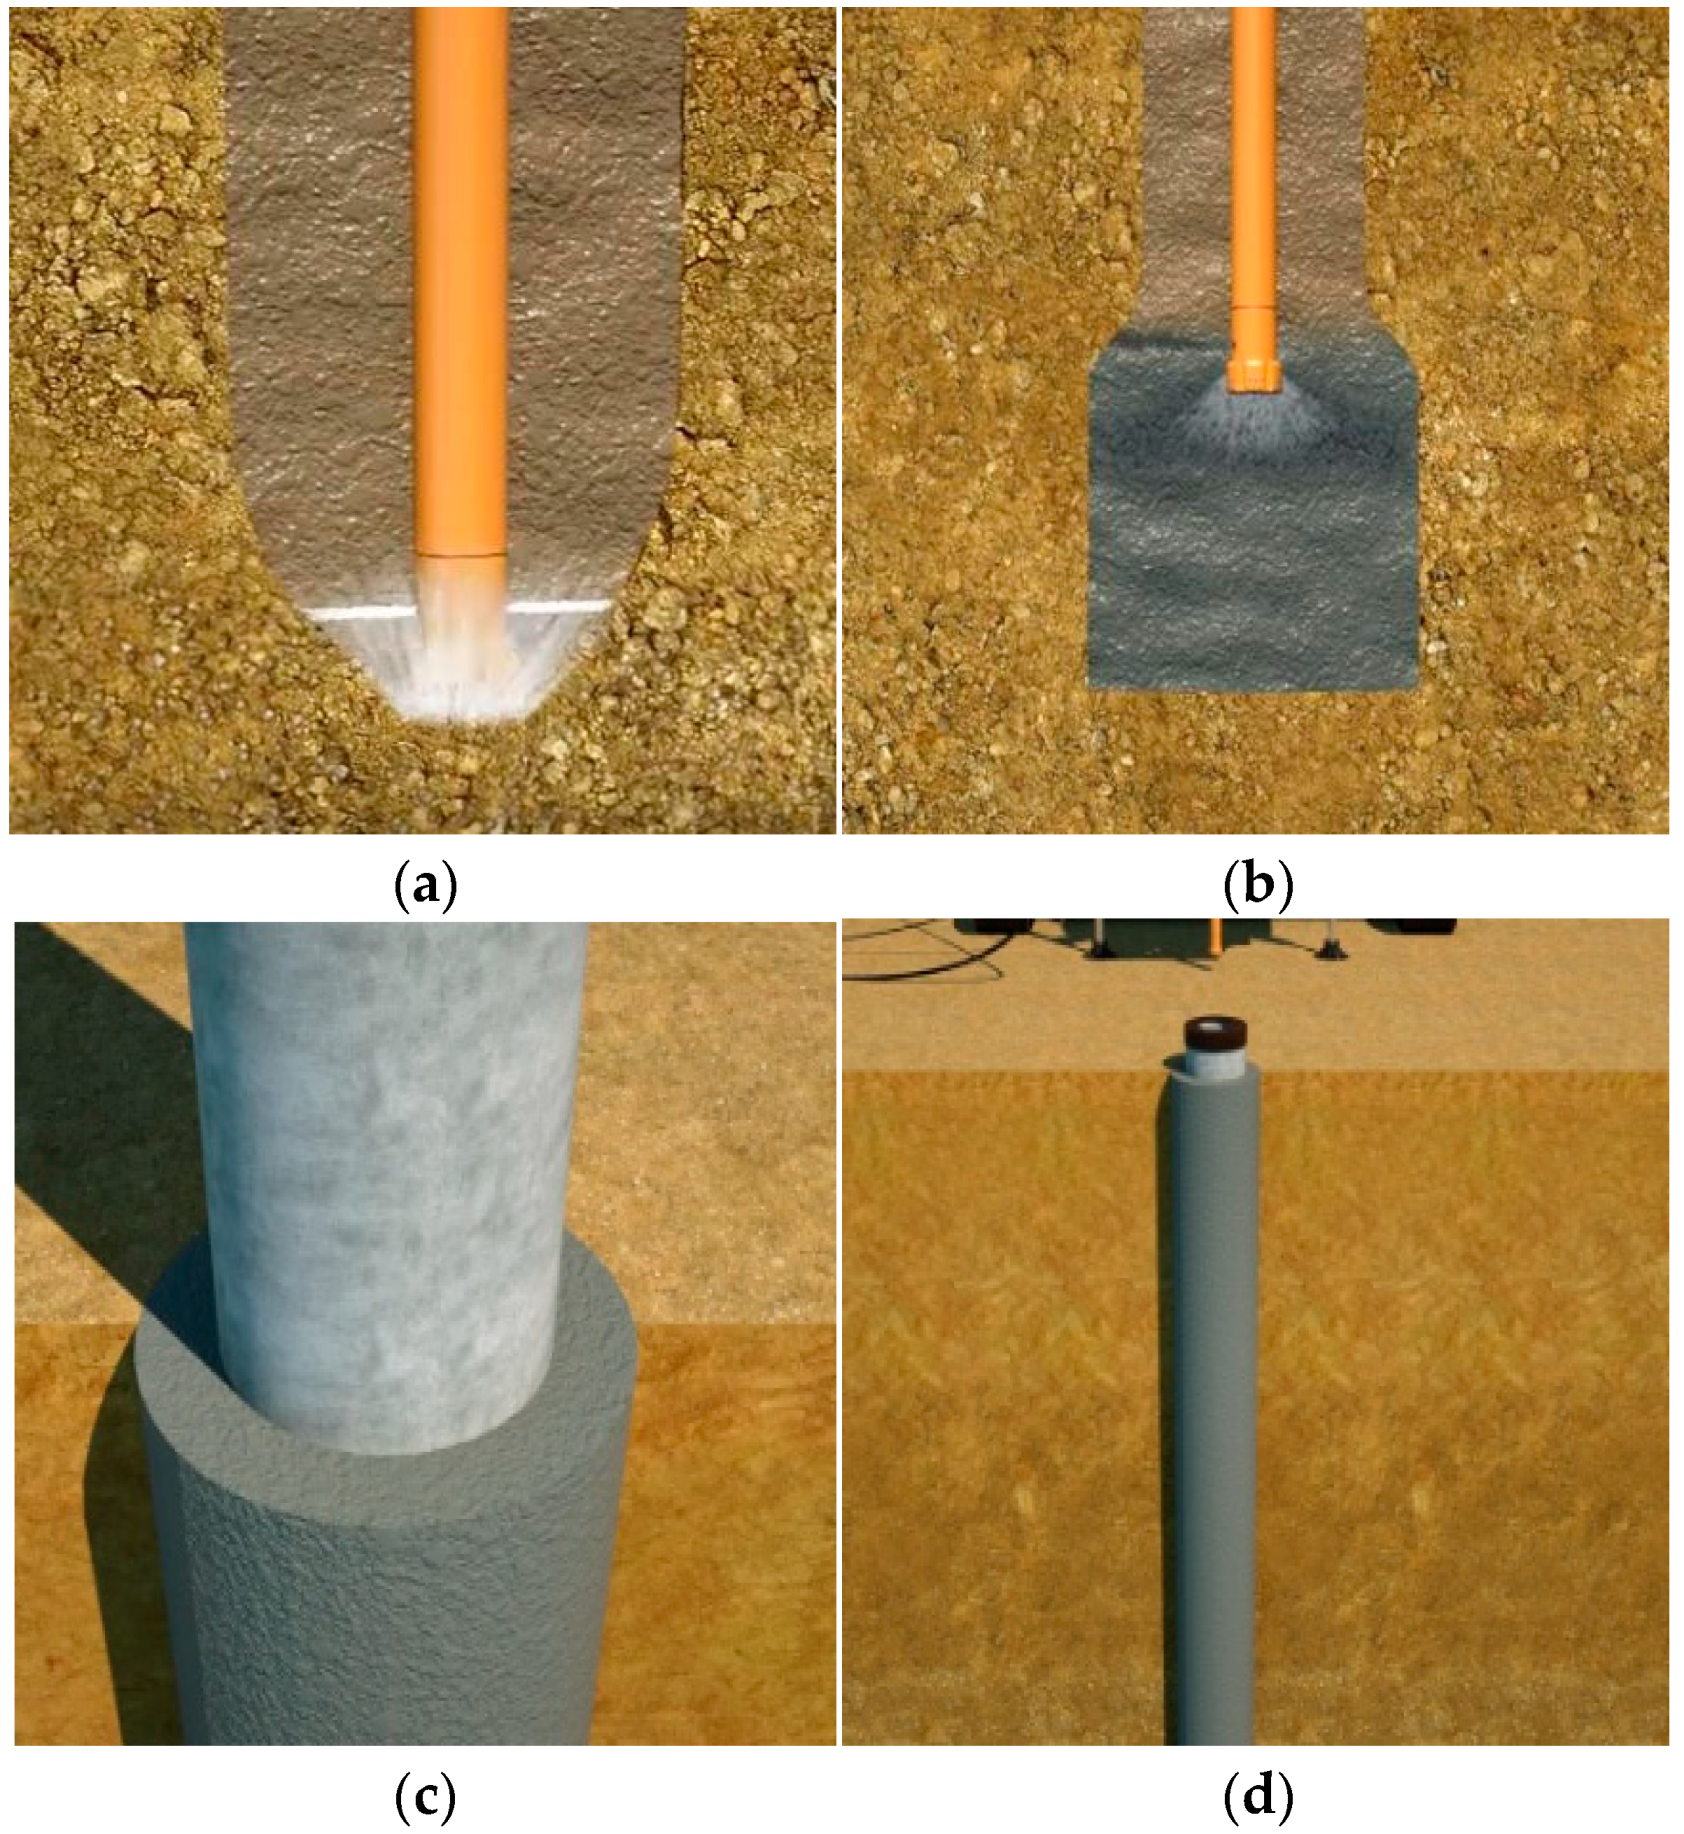
Figure 1. Technological process of the stiffened composite pipe pile: (a) drilling hole; (b) grouting for cemented soil; (c) implant stiffened core; (d) forming of the stiffened composite pipe pile.
Jmse 11 00597 g001
Figure 2. Single pile test layout procedure.
Jmse 11 00597 g002
Figure 3. Composition and size of each part of the test pile.
Jmse 11 00597 g003
Figure 4. 3D finite element model.
Jmse 11 00597 g004
Figure 5. q–s curves of the simulation and the field test results.
Jmse 11 00597 g005
Figure 6. Strain distribution of pile: (a) loading to 1650 kN; (b) loading to 3300 kN.
Jmse 11 00597 g006
Figure 7. Simulation and test results of axial stress along the stiffened core.
Jmse 11 00597 g007
Figure 8. Simulation results of axial stress of cemented soil.
Jmse 11 00597 g008
Figure 9. Stress distribution of pile: (a) loading to 1650 kN; (b) loading to 3300 kN.
Jmse 11 00597 g009
Figure 10. Friction resistance between the stiffened core and cemented soil.
Jmse 11 00597 g010
Figure 11. Friction resistance between the cemented soil and soil.
Jmse 11 00597 g011
Figure 12. Finite element model of group pile.
Jmse 11 00597 g012
Figure 13. Axial stress and vertical displacement of each pile. (a) Axial stress of central pile; (b) axial stress of side pile; (c) axial stress of corner pile; (d) q–s curve of each pile.
Jmse 11 00597 g013
Figure 14. Each pile with the pile spacing 3d1: (a) friction resistance; (b) axial stress.
Jmse 11 00597 g014
Figure 15. T-z curve of the friction resistance of the middle pile base.
Jmse 11 00597 g015
Figure 16. The ratio curve of end resistance to average friction resistance.
Jmse 11 00597 g016
Figure 17. Axial stress of each pile in a pile group with different pile spacing. (a) Axial stress distribution of the central pile; (b) axial stress of the side pile; (c) axial stress distribution of the corner pile.
Jmse 11 00597 g017
Figure 18. Each pile with different pile spacing: (a) variation of stress-bearing ratio, Rb; (b) pile-soil load-sharing ratio, Rs.
Jmse 11 00597 g018
Figure 19. Q-s curve of stiffened core: (a) pile spacing is 2d1; (b) pile spacing is 3d1; (c) pile spacing is 4d1; (d) pile spacing is 5d1.
Jmse 11 00597 g019
Figure 20. Influence of stiffened core diameter and pile spacing on settlement.
Jmse 11 00597 g020
Table 1. Geological condition of the reclaim strata.
Stratigraphic DivisionStratigraphic DivisionDepth (Elevation) (Thickness) (m)
Qm1①1plain fill2.00 (2.59) (2.00)
Qm1①6alluvium7.80 (−3.21) (5.80)
Q4m③1silt13.10 (−8.51) (7.30)
Q4a1 + p1⑤1ball clay18.50 (−13.91) (5.40)
Q2c1⑧1sand viscosity soil27.61 (−23.02) (9.11)
JX-Qby⑩1fully weathered granite35.00 (−30.41) (7.39)
Table 2. Loading condition.
StepLoad (kN)Load Time (min)
1660120
2990120
31320120
41650150
51980270
62310900
72640420
82970990
93300600
Table 3. Parameters of the soil in simulation.
Material NameThicknessγ/
kN·
m−3
E50/
MPa
Eoed/
MPa
Eur/
MPa
C/
kPa
φ/
°
Νmγ0.7G0/
MPa
Rinter
silty clay3.518.38.08.032.025.028.00.20.80.00021601.0
sandy clay 8.521.012.012.048.030.035.00.20.80.00021801.0
fully weathered granite1822.030.025.0100.035.040.00.20.50.00023601.0
Table 4. Parameters of the tested composite pipe pile.
Material NameE/GPaνRinter
Stiffened core (pipe pile)8.00.150.3
Cemented soil1.20.250.3
Steel plates on pile head300.21.0
Disclaimer/Publisher’s Note: The statements, opinions and data contained in all publications are solely those of the individual author(s) and contributor(s) and not of MDPI and/or the editor(s). MDPI and/or the editor(s) disclaim responsibility for any injury to people or property resulting from any ideas, methods, instructions or products referred to in the content.