Abstract
The soil resistances along the embedded ground chain affect the pull-out capacity of anchor as they determine the magnitude and direction of tension at the padeye. To facilitate analyses, the chain was usually simplified as a cylindrical line. The chain segment with actual geometry, buried deeply in clayey soil, is studied using a large deformation finite element approach to overcome severe distortion of soil elements around the chain. The uniaxial resistances obtained by the large deformation analyses are verified by comparison with the existing model tests and simplified solutions, followed by presentation of the yield envelope against combined loading. Both the probe test and swipe test are used to form the yield envelopes, and their results have good consistency. The influence of roughness of chain–soil interface on the soil resistances is quantified as well. It is found that the envelope of the chain segment with actual geometry is smaller than that against the simplified cylindrical shape; therefore, the most convenient design may not be the safest option.
1. Introduction
As the exploitation of offshore oil and gas and renewable energies has gradually stepped into deeper waters, anchor foundations are required to moor the floating facilities. As shown in Figure 1a, the floating facility and the anchor foundation are connected through mooring chains; the chain profile in soil is usually a reverse catenary-shaped due to chain–soil interaction under the tension load. The chain is subject to the normal and tangential resistances applied by soil, with tension at the padeye and along the chain varying by time and depth. The chain–soil interaction leads to variations in the magnitude and inclination of the tension load at the padeye, which determines the potential mobilized anchor capacity [1,2,3,4,5,6].
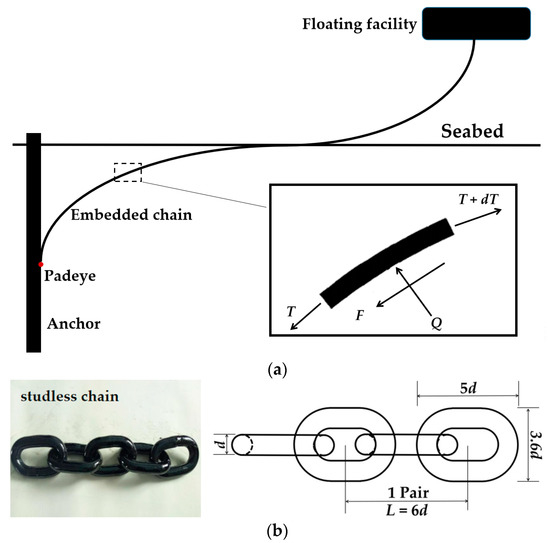
Figure 1.
Mooring system and the physical geometry of the chain: (a) mooring system; (b) chain geometry.
The analysis of the interaction between the chain and soil mainly estimates soil resistances in the normal and tangential directions of the chain segment, noted as Q and F, respectively, in Figure 1a. The mooring chains used in practical applications can be categorized as those with or without the stud. The length of each pair of stud-link chains is 8 d where d is the nominal diameter of the chain; the length of each pair of link chains without a stud is 6 d (see Figure 1b). To facilitate designs, the chain was usually simplified as a cylindrical line which was discretized with a number of curvilinear segments. For each chain segment, the tensions at both ends were in balance with the normal and tangential resistances applied by neighboring soil. By solving the equilibrium equations for these forces, the chain profile in soil can be predicted [2,7,8]. Therefore, it is vital to estimate the normal and tangential resistances appropriately.
In their previous analysis, Neubecker and Randolph assumed that the conventional friction ratio, F/Q, was constant to determine the chain friction coefficient, which was taken as 0.4–0.6 [9]. However, several recent investigations indicate great variations in friction mobilization for the chain segments [10]; therefore, the assumption of a constant friction ratio may not be on the conservative side for routine designs. An alternative option is to develop an interaction envelope to capture the friction mobilization along the chain profile. The envelopes have been employed in the designs of various offshore footings, such as spudcan footings [11,12] and suction anchors [13,14,15].
The chain was simplified as a series of cylindrical segments with an equivalent diameter derived from the effective area in bearing or in shearing in most previous analytical and numerical analyses. Therefore, the influence of the chain’s actual geometry on capacities was essentially ignored. The actual physical shape of the chain is rather complicated; the typical shape and size of the studless chain is shown in Figure 1b. The soil flow mechanism around the physical segment may be different from that caused by the motion of a cylindrical segment.
This study accounts for the actual shape of the chain and analyzes the difference from the simplified solution. The studless chain segment’s dynamics within clayey soil were simulated using a large deformation finite element approach, to obtain its uniaxial capacities and yield envelope in the Q-F load space. The results are compared to previous studies that simplified the chain segment as a cylinder, to highlight the need to also consider the chain geometry. Additionally, the influence of the chain roughness on the capacities is investigated. The yield envelope obtained is capable of predicting the magnitude and direction of tension at the padeye more accurately; energy firms can then use these data to create more economical and reasonable designs for anchoring systems.
2. Chain Geometry and Soil Model
2.1. Chain Segment Geometry and Model Mesh
The studless chain, as shown in Figure 1b, was investigated. By considering symmetric geometry of the chain, only half-chain segments along the longitudinal direction and soil were discretized to save computational cost (Figure 2). A chain segment was defined as a pair of links with a length of L = 6 d shown in Figure 1b, and a bar diameter of d = 0.1 m was adopted. There were three chain segments in the finite element model shown in Figure 2; the influence of the number of chain segments on the simulated results will be assessed in Section 2.5. The deep-embedded chain segments were simulated with an embedded depth of 2.1 L to ensure that the soil flow mechanism was localized around the segment and was not affected by the soil surface (the model mesh is shown in Figure 2a). To show the three-dimensional geometry of the chain segments, the soil above the cross section of the chain was concealed; the front and side views of the half-model are shown in Figure 2b,c, respectively.
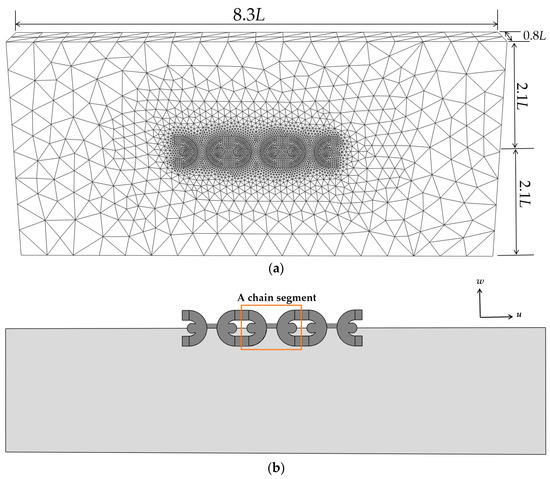
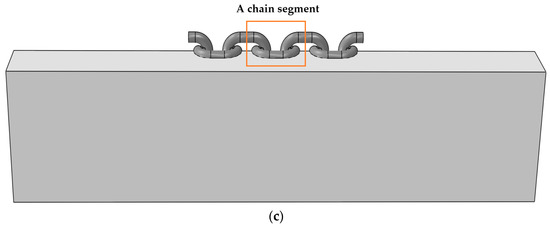
Figure 2.
The chain and soil model: (a) front view of the whole model mesh; (b) front view of the half-model to highlight the chain geometries; (c) side view of the half-model to highlight the chain geometries.
The chain segment was treated as a rigid body and a reference point was defined for each chain segment. The normal and tangential displacements, in terms of w and u, respectively, shown in Figure 2b, were applied on all reference points to specify the movements of chain segments (i.e., the load is applied in displacement-control mode). The soil domain in the finite-element model had a length of 8.3 L, width of 0.8 L and height of 4.2 L, as indicated in Figure 2a; the boundary effects were avoided as found in trial calculations.
The soil region was discretized with approximately 80,000 second-order tetrahedron elements (termed as element C3D10 in Abaqus/Standard). Finer mesh was used for soil around the chain with a typical element size of around 0.1 d; however, such small element sizes increased the risk of significant mesh distortion in finite element simulations. The element sizes in the far field were relatively large for around 3 d, to save the computational effort. The element sizes in soil around the chain and in the most distant field were specified, while element sizes in the remaining region varied gradually.
2.2. Contact Behaviour and Boundary Conditions
The three chain segments were tied to each other, and the displacements were applied simultaneously to each segment. The contact algorithm was described as “surface to surface”. The interaction between soil and the chain segments was described as “frictional contact”, using the so-called penalty option in Abaqus with an allowable shear stress of αsu, where α was the chain roughness and α ≤ 1. The lateral boundaries of soil were constrained horizontally, and the soil bottom was fixed. For the chain segment, rotation and movement perpendicular to the symmetric face (see Figure 2) were not allowed.
2.3. Soil Properties
Offshore clays are typically featured with the undrained shear strength, su, increased linearly with soil depth z.
where su0 is the undrained strength at seabed and k is the strength gradient with depth. These clays under undrained conditions were regarded as a Tresca material in the LDFE simulation. The sizes of the chain segment were limited; for example, the bar diameter was 0.1 m only. Furthermore, the chain displacements corresponding to the ultimate capacities were minimal compared to the nominal chain diameter, which will be demonstrated later. Therefore, the soil mobilized around the chain segment was constrained in a relatively small region, and it was reasonable to regard the soil as uniform to simplify our discussions. The effective weight of soil was taken as 6 kN/m3 in this study; the undrained shear strength su was thus taken as 5 kPa, unless otherwise stated. The Poisson’s ratio was 0.49 to approximate constant volume under undrained conditions, and the Young’s modulus was specified as a typical value of 500 su.
su = su0 + k·z
2.4. Finite Element Approach
The cutting through of the chain in clayey soil is a typical large deformation problem. In conventional strain finite element analyses, the chain movements may result in severe distortion of neighboring soil elements and are likely lead to computational non-convergence. Therefore, the large deformation finite element (LDFE) approach termed “remeshing and interpolation techniques with small strain” [16,17,18] were required to model the interaction between the chain segments and soil.
In the LDFE analysis, the total displacements of chain segment were divided into multiple steps; the displacements in each step were sufficiently small to avoid mesh distortion. After finite strain (Lagrangian) calculation in each step, the deformed soil was remeshed, and mapping stresses and material properties were interpolated from the old mesh to the new mesh. The sequence of Lagrangian calculation and convection was repeated until the total displacement was achieved, so that the large-amplitude motion of chain segment in soil could be reproduced. The commercial finite element package, ABAQUS/Standard, was selected to complete the Lagrangian calculation and to mesh the deformed soil geometry. Three-dimensional analyses were conducted to capture the actual shape of the chain segment.
The advantage of the LDFE analysis was demonstrated by investigating a chain segment under a normal-force loading; the load–displacement curves from the conventional small strain finite element analyses and large deformation analyses were compared in Figure 3.
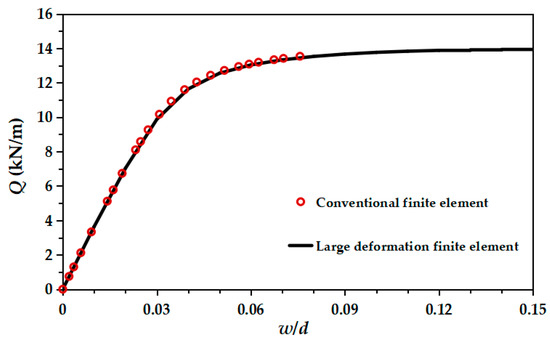
Figure 3.
Normal resistances using the conventional and large deformation finite element approaches.
The simulation of the conventional small strain finite element analysis stopped at a small normal displacement of w/d = 0.076 due to computational non-convergence caused by mesh distortion. The resulting load and displacement relationship is shown as dots in Figure 3; while the normal resistance was still increasing, the ultimate resistance was not yet reached. However, the ultimate resistance was found at the displacement around w/d = 0.1 from the LDFE results shown in Figure 3, and the results from LDFE were nearly identical to those found by the conventional small strain finite element analysis at the early stage with small displacement. These results proved the validity of employing the LDFE approach.
2.5. Verification of the Number of Chain Segments
The number of chain segments adopted in the analysis was determined first, to minimize the end effects and to optimize the computational efficiency without reducing the results’ accuracy. The LDFE analyses of chain segment numbers three, four and five were conducted, and the normal and tangential resistances obtained were shown in Figure 4. The resistances on the two-end segments were not included in the interpretation, instead, the soil resistance was taken as the average value of the middle segment(s). As shown in Figure 4a, the resulting normal resistances (Q) in relation to the normal displacement (w/d) nearly converged for analyses with different numbers of chain segments. In Figure 4b, the tangential resistance was decreased in line with the number of segments at the initial stage of loading; however, the ultimate resistances remained close to each other. As our concern is the ultimate resistances, three chain segments were then adopted in the following simulations.
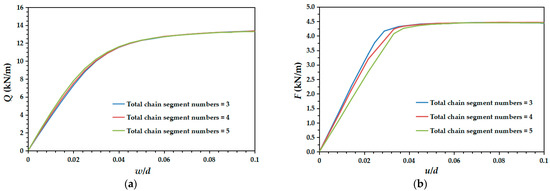
Figure 4.
Influence of the number of chain segments used: (a) normal resistance; (b) tangential resistance.
3. Uniaxial Capacities
In the existing analytical solutions, the uniaxial resistances in the normal and tangential directions, Q and F, were determined by [9]:
where bearing capacity factor Nc is suggested increasing from 5.1 at the seabed to 7.6 at a chain depth of 6 d for the plane strain failure; and En and Et are multipliers to give the effective widths in the normal and tangential directions, respectively. En and Et were suggested as 2.5 and 8.0 by Degenkamp and Dutta; their view was adopted by later studies, such as Neubecker and Randolph [9] and Li et al. [4]. Equations (2) and (3) were used in terms of cylindrical chain segments, and the actual shape of the chain was represented by the multipliers En and Et.
Q = (En·d)Nc·su
F = (Et·d)su
In the LDFE simulations, the chain segments with actual geometry are displaced in the normal and tangential directions such that the ultimate normal and frictional capacities (Q and F) could be obtained for comparison with the analytical solutions. Here, the normalized normal resistance, Nb, is defined for convenience of discussions:
where A is the projected area of the chain segment with actual geometry, and the normal capacity per unit length Q is derived from the numerical results. Nb is more suitable to express the normal capacity factor of the chain segment.
Nb = Q·L/A·su
The roughness of chain–soil interaction is accounted for by varying values of 0.3, 0.5 and 1 in the finite element model. The LDFE result of normal resistance is demonstrated in Figure 5, and more solutions of structural elements with similar geometries are plotted as well. As shown in Figure 5, the normalized normal resistance is increased rapidly with displacement at the early stage of the loading, followed by gradual enhancement until an ultimate value was reached. The ultimate values of Nb, defined as Nb,ult, were estimated as 11.8, 12.2 and 12.8 for α = 0.3, 0.5 and 1, respectively. As shown in Figure 5, the divergence of Nb,ult induced by the chain roughness is insignificant, at less than 8.5% between the cases with α = 0.3 and 1. Sun et al. simulated simplified cylinder chain segments using a LDFE approach termed “Coupled Eulerian-Lagrangian” [10]. They proposed Nb,ult = 14.0 with α = 0.5, which is 14.8% larger than our results for chain segments with actual geometry. When the chain segment moved, part of the soil embedded in the holes of the chain segment moved together with the chain; therefore, the soil flow mechanism may be similar to those of the deep foundations addressed below. Randolph and Houlsby suggested that the capacity factor of a circle pile in deep soil is ranged between 9.14 for smooth ones and 11.94 for rough ones, based on the upper-bound limit analyses [19]. The upper-bound solution by Merifield et al. indicated a capacity factor of 11.4 for an ultrathin rough strip plate buried deeply [20]. Wang et al. proposed that the rough deep rectangular plate with an aspect ratio of 2 was with Nb,ult = 13.3 [17], which is close to 12.8 for the rough chain segment in Figure 5. The soil incremental displacements around the chain segment were demonstrated in Figure 6, and the incremental displacement of the chain in each step was 0.001 m. The soil displacements above and underneath the segment are symmetric since the chain was assumed to be buried deeply. It was observed as well that the soil displacements around the left and right ends of the chain segments were relatively small. Therefore, for the chain segment subjected to normal loading, the soil flow mechanism mobilized was similar to that around a plate with the same projected plan. The projected plan of the chain segment in Figure 2 can be simplified roughly as a rectangle with length of 6 d and width of 3.6 d. That explains why the Nb,ult values of chain segment and rectangular plate are close to each other. It is worth noting again that the normal resistances discussed above are for the structural elements embedded deeply. The chain segments buried shallowly are beyond the concern of this paper.
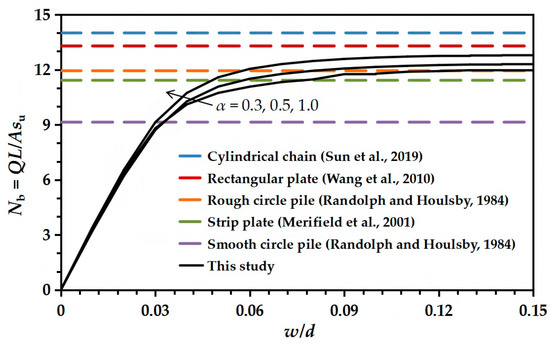
Figure 5.
Relationship between the normalized normal resistance and normal displacement. Compared with [10,17,19,20].
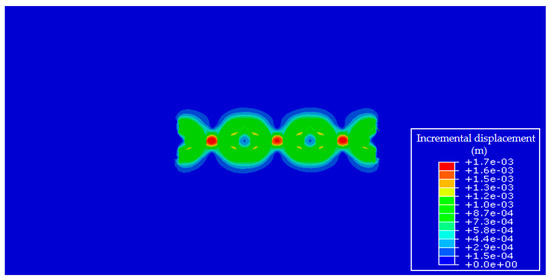
Figure 6.
Incremental displacements of soil around the chain segment (referring to Figure 2b).
Based on the values of Nb shown in Figure 5, the multiplier for the effective width in the normal direction En can be obtained by substituting Equation (4) into Equation (2). The expression becomes:
Equation (5) suggests that the chain roughness has no obvious effect on the value of En, at least for the chain simplified as cylindrical. According to Equation (5), En is function of the area per unit length and the nominal diameter of the chain segment; thus, it is a constant value for a particular geometry of the chain. It is not clear if Equation (5) is suitable for the chain segment with actual geometry, so the LDFE results of En are replotted in Figure 7a. The numerical values of En against α = 0.3, 0.5 and 1 were the same as 2.3, indicating that the influence of the chain roughness was minimal. Degenkamp and Dutta conducted several model tests for chain segments with actual geometry [21]. The undrained shear strength of clay used in their tests was measured as 4.52 kPa, with a deviation of about 0.57 kPa. They found that En was ranged between 2 and 3, and their recommended value of 2.5 is close to that indicated by the LDFE analyses.
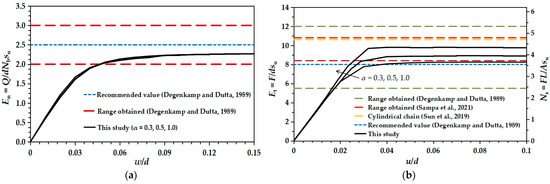
Figure 7.
Comparison with the existing data of multiplier for effective width and uniaxial resistances: (a) multiplier for effective width in the normal En; (b) multiplier for effective width in the tangential direction (Et) and normalized tangential resistance (Ns). Compared with [10,21,22].
The model tests by Degenkamp and Dutta provided a relatively large range of Et = 5.5–12.0, and Et = 8.0 was recommended [21]. Most recently, Sampa et al. measured the friction along the chain in their model tests, and suggesting a narrow range of Et = 8.4–10.8 [22]. Sampa et al. proposed that the Et value tends to decrease in tandem with an increase in the nominal diameter d. The LDFE load–displacement curves for tangential displacements of segments are demonstrated in Figure 7b. All three ultimate resistances are reached at a displacement of around 0.04 d. The Et values deduced from the LDFE analyses are 8.2, 8.9 and 9.7 as α = 0.3, 0.5 and 1.0, respectively, which are in agreement with the values recommended by Degenkamp and Dutta [21], and Sampa et al. [22]. In contrast to the phenomenon observed for En (see Figure 7a), the value of Et is enhanced with the chain roughness, with a difference of 18.3% between α = 0.3 and 1. Similar to Equation (4), the normalized tangential resistance Ns is defined as
Ns = F·L/A·su
The ultimate value of Ns is defined as Ns,ult. The Ns,ult values range between 3.6 and 4.3 in Figure 7b; these values are moderately lower than 4.7 from the numerical simulations in terms of the simplified cylindrical chain [10].
4. Yield Envelope for Chain under Combined Loading
Although the ultimate uniaxial capacities in the normal and tangential have been estimated above, the capacities of the chain segment subjected to combined loading remain unknown. The tangential resistance may be impaired by the appearance of normal loading and vice versa. A potential solution for tackling the problem of combined loading is to develop an interaction diagram of the yield envelope. The forces of components outside of the yield envelope are not represented on such a diagram.
The probe test and swipe test are the two methods most commonly used in numerical and experimental explorations to obtain the yield envelope. The envelopes established by these methods may be close for a few foundation types; however, non-negligible divergence between the envelopes may appear for a given foundation, as found in [23] and [24]. Therefore, both the swipe and probe tests are employed here, to quantify the potential error. The probe test is featured with fixed-ratios of displacement, i.e., the chain segment is loaded with the tangential and normal displacement increments, du and dw, applied proportionally. As suggested by Tan [25], the swipe test is implemented by the swipe-loading path. It consists of two steps: the chain segment is moved in the normal direction until the ultimate normal resistance is achieved, and; a tangential displacement is subsequently imposed while the normal displacement remains zero. The envelope is obtained by connecting these force components.
The LDFE curves based on the probe tests and the yield envelope established are demonstrated in Figure 8. For chain segments with roughness of 0.3, a total number of nine loading paths with different ratios of displacement are plotted in Figure 8a. At the early phase of the loading, the loading path is controlled by the elastic stiffnesses, followed by the elasto-plastic response. The final phases of the loading paths, which have a variety of du/dw values, are used to shape the envelope. For the loading paths with low du/dw values, such as du/dw ranged between 0.1 and 0.5 in Figure 8a, the curves end at the envelope. If the du/dw value range is large, such as du/dw = 2–10, the loading path reaches the yield envelope rapidly; the curve then moves along the envelope. Similar phenomena are observed in the LDFE cases with α = 0.5 and 1 in Figure 8b,c.
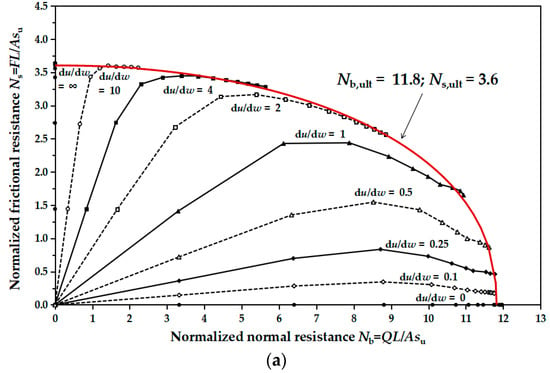
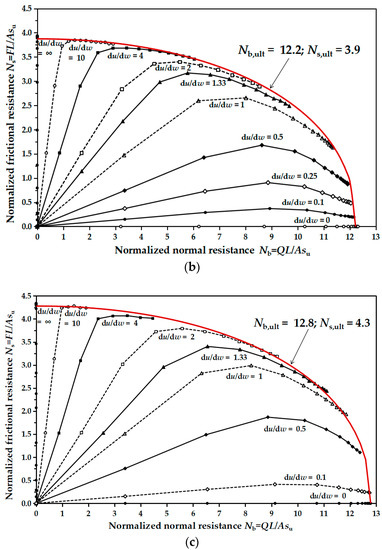
Figure 8.
Yield envelope for chain segment under combined loading: (a) α = 0.3; (b) α = 0.5; (c) α = 1.0.
The yield envelopes demonstrated in Figure 8 can be expressed in the form of an ellipse
where the exponents m and n are to denote the shape of the envelope and they are determined by fitting the LDFE results in Figure 8. The Nb,ult values of 11.8, 12.2 and 12.8 are estimated from data in Figure 5 for the chain roughness, with α = 0.3, 0.5 and 1.0, respectively, while Ns,ult = 3.6, 3.9 and 4.3, as demonstrated in Figure 7b. The exponents are selected as m = 2.1 and n = 2.3 for all chain roughness values. It indicates that the shape of the yield envelope is nearly independent of the chain roughness, although Nb,ult and Ns,ult are functions of the roughness. As shown in Figure 8, Equation (7) with the values stated above can accurately depict the final phases of the loading paths. As the normal and tangential resistances are varied along the yield envelope, the friction ratio F/Q could not be a constant value, even though the assumption of constant ratio was recognized widely in the previous studies [9].
The swipe tests are employed as well to derive the yield envelopes. The envelopes by the swipe test and probe test are compared in Figure 9, in terms of the segment with α = 0.5. The two envelopes in the F-Q plane achieve reasonable consistency. Again, the robustness and accuracy of the LDFE simulations are validated. The LDFE results based on the probe tests are chosen to establish the expression of the yield envelope (i.e., Equation (7)).
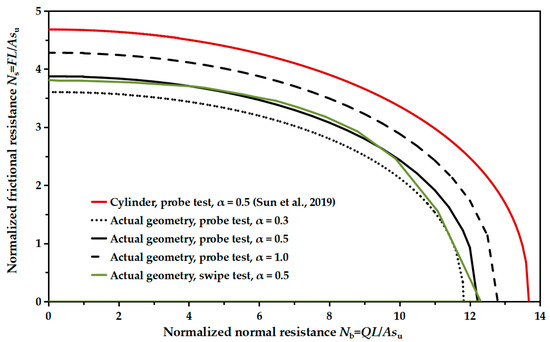
Figure 9.
Comparison of envelopes of two types of chain obtained by the swipe test and probe test. Compared with [10].
The envelopes deduced from Equation (7), with α = 0.3, 0.5 and 1, are compared with that by Sun et al. [10] in Figure 9. Sun et al. proposed an envelope with the chain segment simplified as a cylinder with α = 0.5. Their envelope is moderately larger than those with actual chain geometry. For example, as α = 0.5 and Nb = 4, Ns of the segment with actual geometry is 16% lower than that of the cylindrical segment; the difference then becomes 16.8% as Nb = 10.
5. Conclusions
This paper presents the numerical investigations of chain capacities in clayey soil using a large deformation finite element approach and the actual chain geometry. The numerical model is calibrated by investigating the uniaxial normal and tangential capacities of chain segments, followed by the yield envelope developed for the segments under combined loading.
The ultimate normalized normal resistance is in the range of 11.8–12.8, which is close to the recommendations for the deep foundation with similar projected plan, such as a rectangular plate. However, this range is considerably lower than the value based on the simplified cylindrical chain. A similar phenomenon is observed for the ultimate value of normalized tangential resistance. The resulting multipliers for effective widths, En and Et, agree with the existing model tests. The yield envelopes for the chain segments under combined loading are established using the probe and swipe tests, and both tests provide yield envelopes with similar shapes. A general form of ellipse expression is proposed to capture all the yield envelopes with different values of the chain roughness. As the chain roughness increases, the uniaxial tangential capacities and yield envelope are increased gradually. To account for the actual geometry of the chain segment, the yield envelope obtained is located against the simplified cylindrical chain.
However, this paper is mainly focused on the ultimate resistance for the chain segment under combined loading, and mobilizations of the soil resistances in normal and tangential directions. The problem of chain cutting through soil can be investigated by developing a global chain–soil interaction model based on the conclusions of this paper.
Author Contributions
Conceptualization, D.W., L.Z. and Y.Z.; methodology, Y.Z.; software, D.W. and Y.Z.; validation, D.W., L.Z. and Y.Z.; formal analysis, Y.Z.; investigation, D.W., L.Z. and Y.Z.; data curation, Y.Z.; writing—original draft preparation, Y.Z.; writing—review and editing, D.W. and L.Z.; funding acquisition, D.W. All authors have read and agreed to the published version of the manuscript.
Funding
This research was funded by National Natural Science Foundation of China, grant number No. 42025702.
Institutional Review Board Statement
Not applicable.
Informed Consent Statement
Not applicable.
Data Availability Statement
Not applicable.
Conflicts of Interest
The authors declare no conflict of interest.
References
- Neubecker, S.R.; Randolph, M.F. The performance of drag anchor and chain systems in cohesive soil. Mar. Georesour. Geotechnol. 1996, 14, 77–96. [Google Scholar] [CrossRef]
- Rocha, M.M.; Schnaid, F.; Rocha, C.C.M.; Amaral, C.S. Inverse catenary load attenuation along embedded ground chain of mooring lines. Ocean Eng. 2016, 122, 215–226. [Google Scholar] [CrossRef]
- Sun, C.; Feng, X.; Bransby, M.F.; Neubecker, S.R.; Randolph, M.F.; Gourvenec, S. Numerical investigations of the effect of strain softening on the behaviour of embedded mooring chains. Appl. Ocean Res. 2019, 92, 101944. [Google Scholar] [CrossRef]
- Li, S.; Xu, B.; Wu, Y.; Li, Z. Study on interaction between soil and anchor chain with finite element method. China Ocean Eng. 2016, 30, 942–953. [Google Scholar] [CrossRef]
- Mohiuddin, M.A.; Ullah, S.N.; Hossain, M.S.; Kim, Y.H.; Hu, Y.; Ragni, R. Soil failure mechanisms during installation and inclined pullout of stiffened suction caisson in calcareous silt. Appl. Ocean Res. 2022, 125, 103249. [Google Scholar] [CrossRef]
- Deb, P.; Debnath, B.; Reang, R.B.; Pal, S.K. Structural analysis of piled raft foundation in soft soil: An experimental simulation and parametric study with numerical method. Ocean Eng. 2022, 261, 112139. [Google Scholar] [CrossRef]
- Guo, Z.; Wang, L.; Yuan, F. Quasi-Static Analysis of the Multicomponent Mooring Line for Deeply Embedded Anchors. J. Offshore Mech. Arct. Eng. 2016, 138, 011302. [Google Scholar] [CrossRef]
- Rui, S.; Guo, Z.; Wang, L.; Liu, H.; Zhou, W. Numerical investigations on load transfer of mooring line considering chain–seabed dynamic interaction. Mar. Georesour. Geotechnol. 2020, 39, 1433–1448. [Google Scholar] [CrossRef]
- Neubecker, S.R.; Randolph, M.F. Profile and Frictional Capacity of Embedded Anchor Chains. J. Geotech. Eng. 1995, 121, 797–803. [Google Scholar] [CrossRef]
- Sun, C.; Feng, X.; Neubecker, S.R.; Randolph, M.F.; Bransby, M.F.; Gourvenec, S. Numerical Study of Mobilized Friction along Embedded Catenary Mooring Chains. J. Geotech. Geoenviron. Eng. 2019, 145, 04019081. [Google Scholar] [CrossRef]
- Martin, C.M.; Houlsby, G.T. Combined loading of spudcan foundations on clay: Numerical modelling. Geotechnique 2001, 51, 687–699. [Google Scholar] [CrossRef]
- Liu, Y.; Zheng, J.; Wang, D.; Liu, K. Capacity of spudcan foundation on dense sand overlying clay under combined loading. Ocean Eng. 2022, 266, 112980. [Google Scholar] [CrossRef]
- Saviano, A.; Pisanò, F. Effects of misalignment on the undrained HV capacity of suction anchors in clay. Ocean Eng. 2017, 133, 89–106. [Google Scholar] [CrossRef]
- Zhao, L.; Bransby, M.F.; Gaudin, C. Centrifuge observations on multidirectional loading of a suction caisson in dense sand. Acta Geotech. 2020, 15, 1439–1451. [Google Scholar] [CrossRef]
- Zhao, L.; Fraser Bransby, M.; Gaudin, C.; Cassidy, M.J. Capacity of Caissons in Dense Sand under Combined Loading. J. Geotech. Geoenviron. Eng. 2020, 146, 04020009. [Google Scholar] [CrossRef]
- Hu, Y.; Randolph, M.F. A practical numerical approach for large deformation problems in soil. Int. J. Numer. Anal. Methods Geomech. 1998, 22, 327–350. [Google Scholar] [CrossRef]
- Wang, D.; Hu, Y.; Randolph, M.F. Three-Dimensional Large Deformation Finite-Element Analysis of Plate Anchors in Uniform Clay. J. Geotech. Geoenviron. Eng. 2010, 136, 355–365. [Google Scholar] [CrossRef]
- Wang, D.; Bienen, B. Numerical investigation of penetration of a large-diameter footing into normally consolidated kaolin clay with a consolidation phase. Geotechnique 2016, 66, 947–952. [Google Scholar] [CrossRef]
- Randolph, M.F.; Houlsby, G.T. The limiting pressure on a circular pile loaded laterally in cohesive soil. Geotechnique 1984, 34, 613–623. [Google Scholar] [CrossRef]
- Merifield, R.S.; Sloan, S.W.; Yu, H.S. Stability of plate anchors in undrained clay. Geotechnique 2001, 51, 141–153. [Google Scholar] [CrossRef]
- Degenkamp, G.; Dutta, A. Soil Resistances to Embedded Anchor Chain in Soft Clay. J. Geotech. Eng. 1989, 115, 1420–1438. [Google Scholar] [CrossRef]
- Sampa, N.C.; Schnaid, F.; Rocha, M.M.; Cudmani, R.; Amaral, C.d.S. Vertical and horizontal pullout capacity of mooring lines embedded in very soft clays. Ocean Eng. 2021, 234, 109229. [Google Scholar] [CrossRef]
- Gourvenec, S.; Randolph, M. Effect of strength non-homogeneity on the shape of failure envelopes for combined loading of strip and circular foundations on clay. Geotechnique 2003, 53, 575–586. [Google Scholar] [CrossRef]
- Fu, D.; Gaudin, C.; Bienen, B.; Tian, Y.; Cassidy, M.J. Combined Load Capacity of a Preloaded Skirted Circular Foundation in Clay. J. Geotech. Geoenviron. Eng. 2018, 144, 04018084. [Google Scholar] [CrossRef]
- Tan, F.S.C. Centrifuge and Theoretical Modelling of Conical Footings on Sand. Ph.D. Thesis, University of Cambridge, London, UK, 1990. [Google Scholar]
Disclaimer/Publisher’s Note: The statements, opinions and data contained in all publications are solely those of the individual author(s) and contributor(s) and not of MDPI and/or the editor(s). MDPI and/or the editor(s) disclaim responsibility for any injury to people or property resulting from any ideas, methods, instructions or products referred to in the content. |
© 2023 by the authors. Licensee MDPI, Basel, Switzerland. This article is an open access article distributed under the terms and conditions of the Creative Commons Attribution (CC BY) license (https://creativecommons.org/licenses/by/4.0/).