Article

Improved Fatigue Reliability Analysis of Deepwater Risers Based on RSM and DBN

1
Offshore Engineering and Technology, Sun Yat-Sen University, Zhuhai 528478, China
2
Centre for Offshore Engineering and Safety Technology, China University of Petroleum, Qingdao 266580, China
*
Author to whom correspondence should be addressed.
J. Mar. Sci. Eng. 2023, 11(4), 688; https://doi.org/10.3390/jmse11040688
Submission received: 3 February 2023 / Revised: 13 March 2023 / Accepted: 13 March 2023 / Published: 24 March 2023
(This article belongs to the Special Issue Fatigue and Fracture Mechanics of Marine Structures)

Abstract

:
The fatigue reliability assessment of deepwater risers plays an important role in the safety of oil and gas development. Physical-based models are widely used in riser fatigue reliability analyses. However, these models present some disadvantages in riser fatigue reliability analyses, such as low computational efficiency and the inability to introduce inspection data. An improved fatigue reliability analysis method was proposed to conduct the fatigue reliability assessment of deepwater risers. The data-driven models were established based on response surface methods to replace the original physical-based models. They are more efficient than the physics-based model, because a large number of complex numerical and iterative solutions are avoided in fatigue reliability analysis. The annual crack growth model of the riser based on fracture mechanics was established by considering the crack inspection data as a factor, and the crack growth dynamic Bayesian network was established to evaluate and update the fatigue reliability of the riser. The performance of the proposed method was demonstrated by applying the method to a case. Results showed that the data-driven models could be used to analyze riser fatigue accurately, and the crack growth model could be performed to analyze riser fatigue reliability efficiently. The crack inspection results update the random parameters distribution and the fatigue reliability of deepwater risers by Bayesian inference. The accuracy and efficiency of fatigue analysis of deepwater risers can be improved using the proposed method.

1. Introduction

Deepwater risers are important equipment connecting the floating platform with subsea wellhead during offshore oil and gas development. Their main function is to provide fluid passage between the surface platform and subsea wellhead in drilling and production processes [1]. Deepwater risers are sensitive to dynamic loads, and fatigue damage due to ocean waves and movements of the floating platform is one of their main failure modes. The long term accumulation of fatigue damage leads to the fatigue fracture of risers and even leads to major accidents [2]. Several accidents, including oil leaks and subsea wellhead breakage, have occurred due to riser fatigue [3,4]. Consequently, studying the fatigue reliability of risers during drilling and production processes is essential.
Fatigue analyses are the basis of fatigue reliability analysis for deepwater risers. Physical-based models are widely used in riser fatigue analyses at present. The fatigue analysis schemes used by these models can be divided into frequency and time domain methods. The frequency domain method is rarely used because of possible linearization errors in the calculation. By contrast, the time domain method is often employed in riser fatigue analyses due to its high computational accuracy. In the time domain method, the dynamic response of the riser system is first analyzed using the finite element method, the finite difference method, and other approaches [5,6]. Second, the dynamic response is processed through the rain flow counting method. Lastly, fatigue damage is calculated based on the S–N curve or fracture mechanics [7,8]. The time domain fatigue of deepwater risers, including drilling, steel catenary, and flexible risers, has been widely investigated in previous studies.
Research on riser fatigue reliability has mainly focused on catenary and top-tensioned risers. The process of fatigue reliability analysis is relatively complex. Generally, the assessment of the fatigue capacity and fatigue failure of risers is conducted by applying two different methodologies, namely, crack growth rate curves using the fracture mechanics model and S–N curves using the Palmgren–Miner damage model [9,10]. During the fatigue reliability analysis of risers, the randomness of general dynamic model parameters, such as wall thickness, the additional mass coefficient, and the drag force coefficient, is often considered [11,12,13,14]. The uncertainty of the fatigue performance parameters of the S–N curve method and that of the Paris parameters of the fracture mechanics method are also considered [15,16,17,18]. In particular, the uncertainty of geotechnical model parameters and the nonlinear behavior of the pipe–seabed interaction are also considered when evaluating the fatigue reliability of catenary risers in the contact area [19,20,21]. The uncertainty of these parameters results in the uncertainty of riser fatigue. Fatigue assessment using certain parameters only cannot meet the needs of safety design and riser assessment. The fatigue reliability of risers must be assessed reasonably based on statistical theory [22]. Several practical reliability analysis approaches, including numerical simulation and analytical algorithms, have been developed for riser fatigue reliability assessment. The Monte Carlo method belongs to the former type of reliability analysis, whereas the first order and second order reliability methods belong to the latter type. The three methods are widely used, and each has its own advantages and disadvantages. The Monte Carlo method has the highest solving accuracy but the lowest solving efficiency, and the first order reliability method has a solving performance that is opposite to that of the Monte Carlo method; the second order reliability method is relatively mediocre when compared with the two other methods [23,24].
In previous research, physical-based models were widely used for fatigue and reliability analyses of risers. However, the calculation for single fatigue analysis using physical-based models is time consuming [25]. The calculation cost of fatigue reliability analysis using physical-based models increases significantly with the increase in the number of random parameters and the degree of random distribution of the parameters. These reasons account for the low efficiency of the fatigue reliability analysis of risers. Therefore, some scholars have attempted to improve the efficiency of fatigue reliability analysis by reducing the time of single fatigue analysis or the scale of fatigue analysis [26,27]. Data-driven models have been introduced as substitutes for time consuming physical-based models [25,28,29,30]. Notably, risers need to be inspected in a fixed time to guarantee their safety, and using the inspection results to update the fatigue reliability is essential to the safety of risers in the process of drilling and production. A problem at present is the difficulty of introducing inspection results into riser fatigue reliability analysis. The dynamic Bayesian network (DBN) is an optional method for solving this difficult problem. The DBN has increasingly been applied to probability analysis because of its functions of forward and backward analyses [31]. Fatigue reliability can be calculated based on the prior probabilities of root nodes in forward analysis, and the posterior reliability can be updated based on a few observations. Thus, the DBN was selected for riser fatigue reliability analysis and updating based on the inspection results in this study.
In this study, data-driven models based on the RSM were established to substitute for physical-based models in the fatigue analysis of risers. The direct mapping between riser dynamic analysis parameters and fatigue damage was established by the data-driven models, which can greatly improve the efficiency of fatigue analysis. The annual fatigue crack growth model was then established based on fracture mechanics theory and data-driven models that consider the crack inspection data as a factor. The crack growth DBN model was then established to obtain the fatigue reliability of the risers. The crack inspection data of the risers were introduced into the DBN model to update the fatigue reliability of the risers.
The rest of the paper is organized in the following manner. The riser fatigue reliability analysis methodology is introduced in Section 2. The physical-based models are introduced in Section 3. The data-driven models established by RSM are introduced in Section 4, and the fatigue reliability analysis method based on DBN is introduced in Section 5. A case is introduced for fatigue reliability analysis and updating in Section 6. The conclusions are summarized in Section 7.

2. Methodology

The methodology for the fatigue reliability analysis of risers is illustrated in Figure 1. Physical-based models were used to establish fatigue datasets of risers based on the S–N curve method. Data-driven models were established based on the fatigue datasets as a replacement for physical-based models to improve fatigue analysis efficiency. However, the fatigue response surface model based on S–N curve method was unsuitable for fatigue reliability analysis and updating of a cracked riser. The riser annual fatigue crack growth model based on fracture mechanics theory was established. Then, fatigue reliability analysis was performed by DBN method based on the fatigue crack growth model and inspection results. Bayesian forward inference was adopted for riser fatigue reliability analysis, and Bayesian backward inference was applied for fatigue reliability updating based on the inspection results. The physical-based models, data-driven models, and crack growth DBN model are introduced in detail in Section 3, Section 4 and Section 5, respectively.

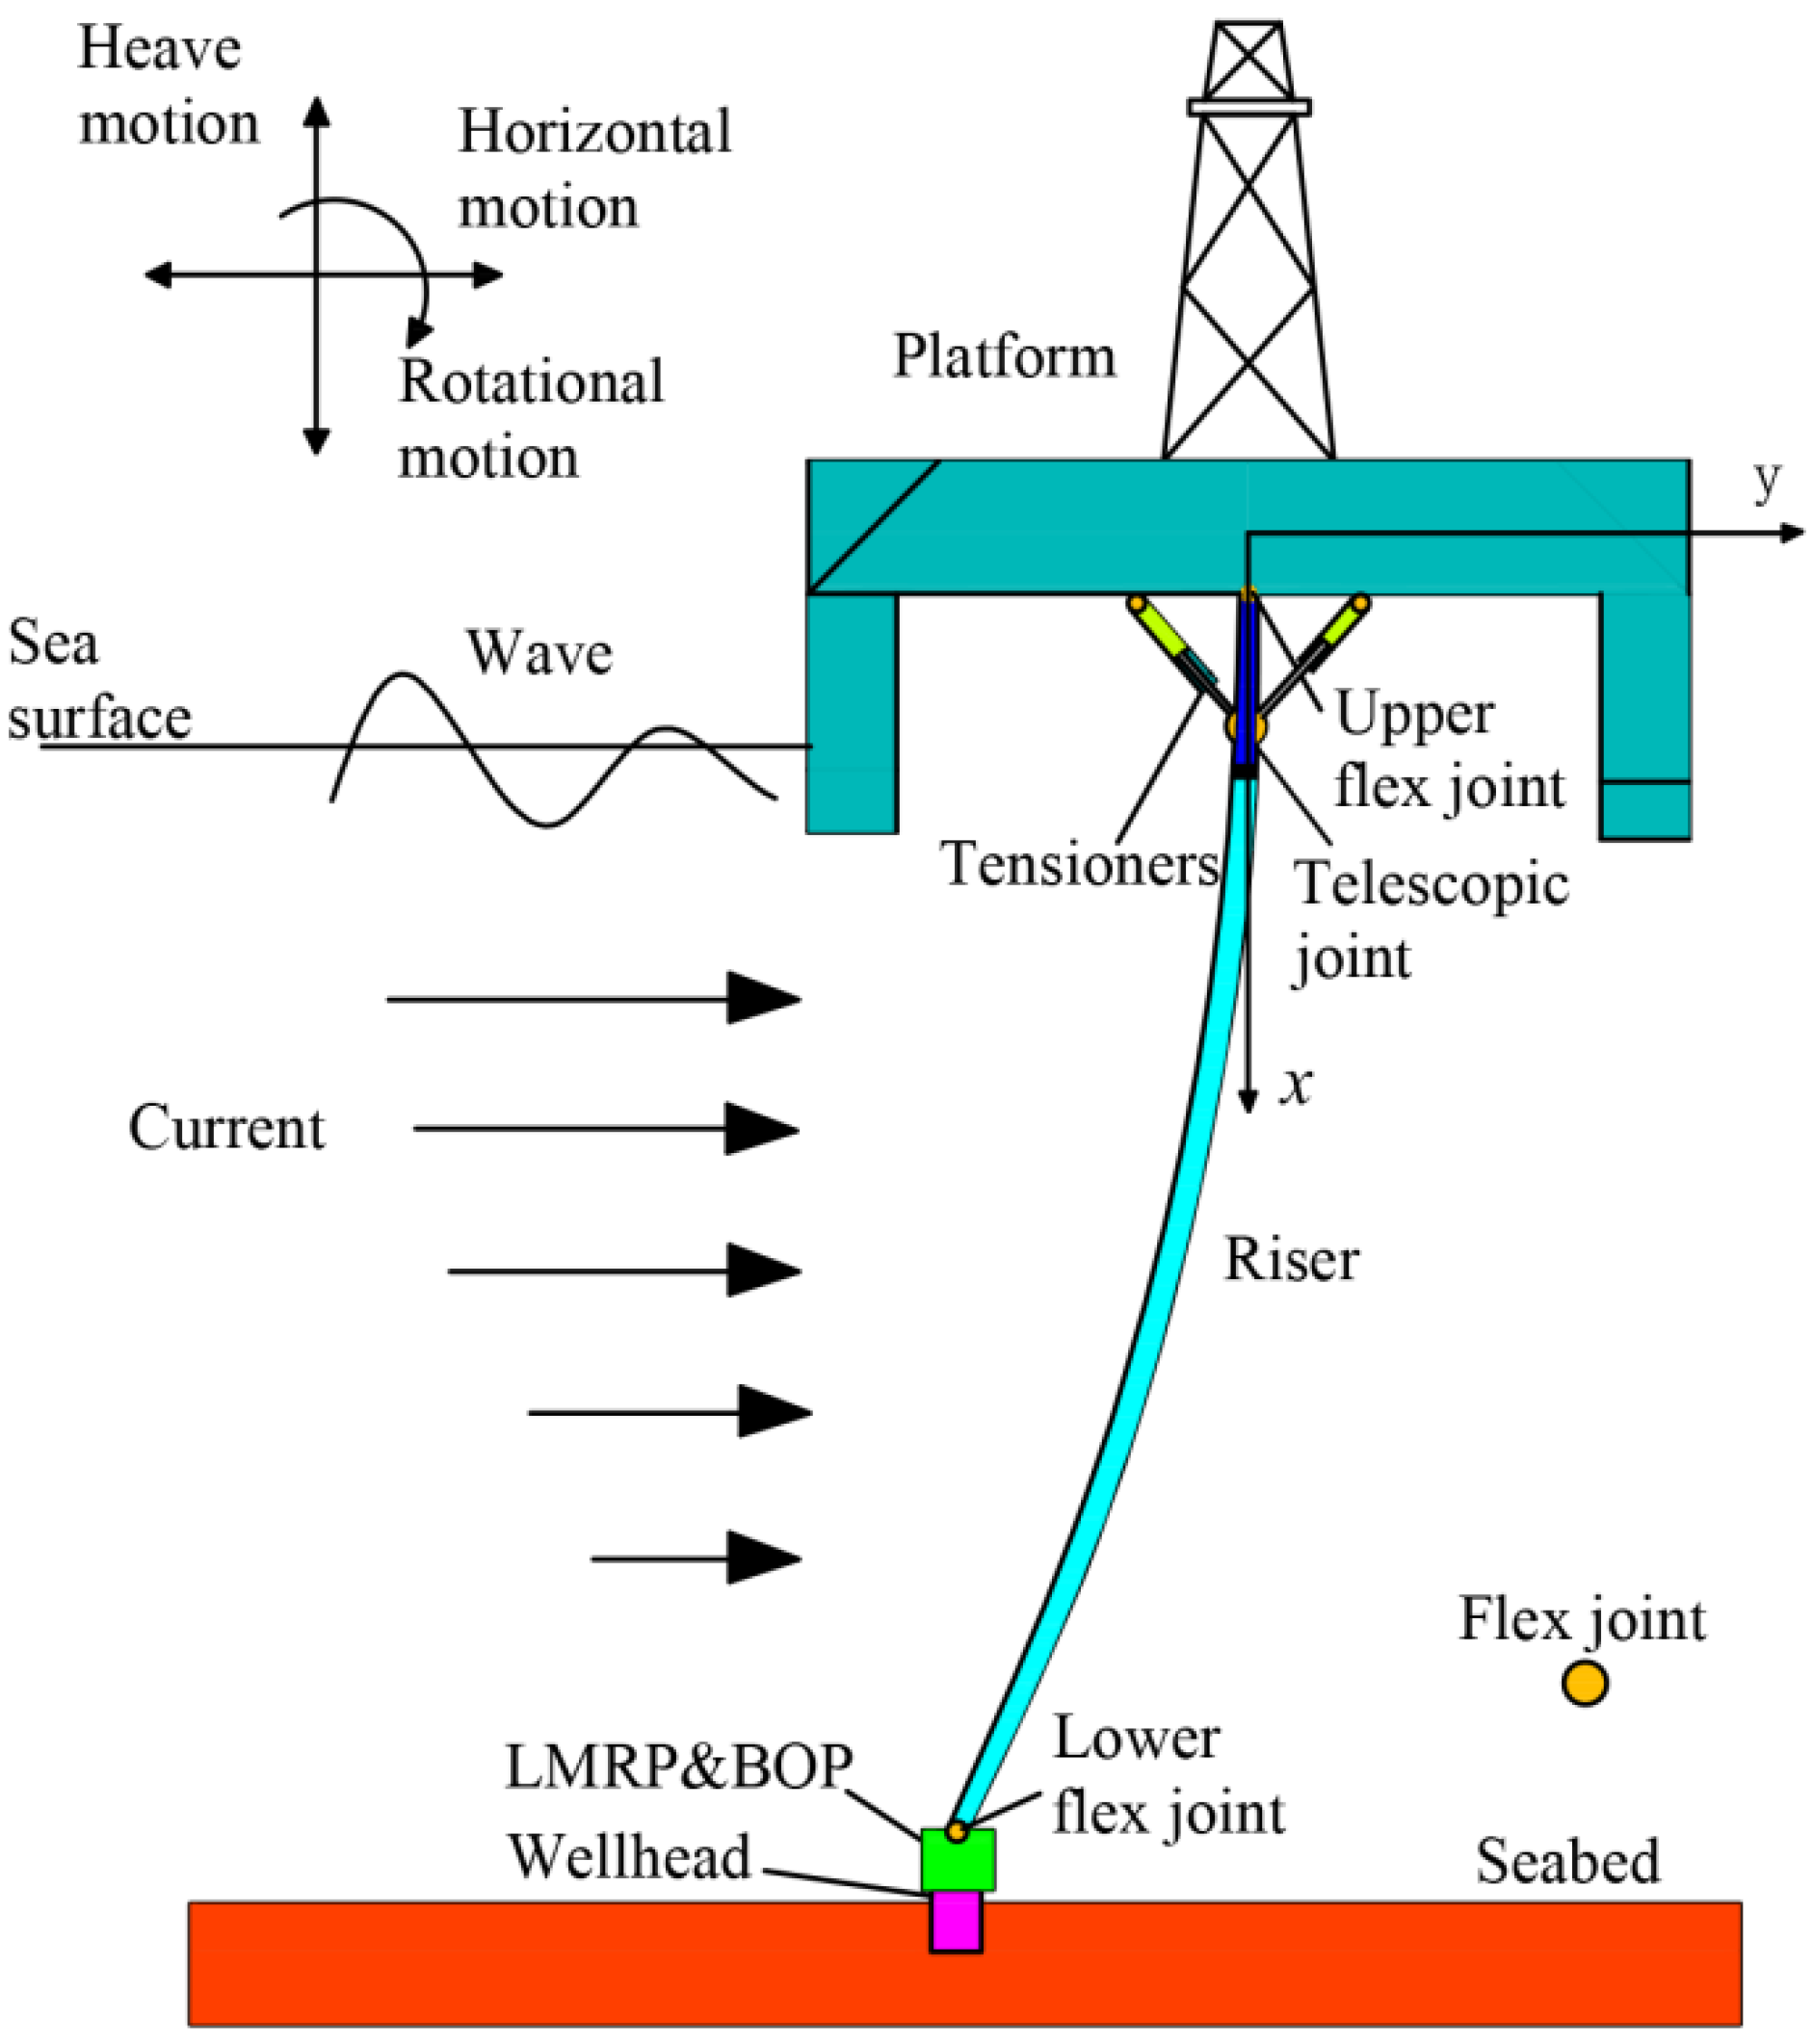
3. Physical-Based Models

Figure 2 shows a deepwater drilling platform/riser coupling system that comprises a platform, a drilling riser system, and tensioners. The top end of the riser system is hung on the drilling platform via the tensioners and upper flex joint, and the bottom end of the riser system is connected to the Blowout preventer (BOP), the subsea wellhead, and the conductor via the lower marine riser package (LMRP). The riser system vibrates transversely and axially under environment loads and platform motions.
The transverse vibration equation of the riser system can be written as [32,33]
m ( x ) 2 y t 2 + c y t + 2 x 2 ( E I ( x ) 2 y x 2 ) x ( T ( x ) y x ) = F sea ( x , t )
where m is the mass per unit length of the riser, c is the damping coefficient, E is the elastic modulus of the riser, I(x) is the second moment of area, T(x) is the effective axial tension, and Fsea(x,t) is the marine load applied per unit length of the riser.
The axial vibration equation of the riser system can be written as [32,33,34]
x ( E A ( x ) u ( x , t ) x ) d x c u ( x , t ) t m 2 u ( x , t ) t 2 = F + m g
where u(x,t) is the axial vibration, F is the axial hydrodynamic load on the riser system, and A(x) is the area of the riser cross-section.
The effective axial tension, T(x), can be expressed as
T ( x ) = T top 0 x ( F + m g ) d x
where Ttop is the tension at the top of the riser system, and L is the length of the riser system.
The marine load applied per unit length of the riser, Fsea(x,t), can be written as
F sea ( x , t ) = π 4 ρ C M D h 2 u ˙ w π 4 ρ C a D h 2 y ¨ + 1 2 ρ D h C d ( u w + u c y ˙ ) | u w + u c y ˙ |
where ρ is the density of seawater, CM is the coefficient of inertia force, Ca is the coefficient of additional mass (Ca = CM-1), Dh is the hydrodynamic outer diameter, Cd is the coefficient of drag force, uw is the water point velocity, u ˙ w is the water point acceleration, uc is the current velocity, y ˙ is the velocity of the riser, and y ¨ is the acceleration of the riser.
The top end of the risers is connected to the platform by the upper flex joint, and the bottom end is connected to the LMRP via the lower flex joint, as is shown in Figure 2. Therefore, the top and bottom boundary conditions of the riser system are expressed as [35]
{ u ( x , t ) | x = 0 = S px ( t ) y ( x , t ) | x = 0 = S py ( t ) E I ( x ) 2 y ( x , t ) x 2 | x = 0 = K u y ( x , t ) x | x = 0
{ u ( x , t ) | x = L = 0 y ( x , t ) | x = L = 0 E I ( x ) 2 y ( x , t ) x 2 | x = L = K b y ( x , t ) x | x = L
where Kb is the rotation stiffness of the lower flexible joint, Ku is the rotation stiffness of the upper flexible joint, L is the length of the risers, Spx(t) is the floating platform’s heave displacement, and Spy(t) is the floating platform’s drift distance. Spx(t) and Spy(t) can be calculated by Equation (7) [36].
S p ( t ) = n = 0 N w S n cos ( k n S p ( t ) ω n t + ϕ n + α n )
where Sn is a single wave’s amplitude, Nw is the number of random waves, kn is the number of constituent waves, ωn is the wave frequency, φn is the initial phase angle of the wave, and αn is the phase angle between the platform movement and wave.
On the basis of the motion equation of the riser system, the finite element method was used to establish the finite element analysis model of the riser system [37,38]. The whole dynamical equation of the riser system is written as
[ M ] { u ¨ } + [ C ] { u ˙ } + [ K ] { u } = { F }
where {u} is the displacement vector of the riser system; [M], [C], and [K] are the mass, damping, and stiffness matrices of the riser system, respectively; and {F} is the load vector of the riser system.
The dynamic response of the risers was obtained by solving the whole motion finite element model of the riser system. The rain flow counting method was then used to count the fatigue stress time history and obtain the stress cycle and amplitude [7,8].
D L = 1 n f = ( Δ σ i ) m f C
where DL is the long term fatigue damage, nf is the fatigue life, and C and mf are the S–N curve method parameters.

4. Data-Driven Models

4.1. RSM

The numerical simulation of the nonlinear dynamic equation of the risers in Equation (8) is complex, which is the main reason a fatigue analysis based on physical-based models is time consuming. The application of data-driven models based on the RSM in the fatigue damage calculation of risers can solve the low efficiency problem of physical-based models. In practical application, the response surface is often constructed by polynomials of different orders, which is the most common application of the RSM. Inaccurate calculations will occur if lower order polynomial functions are used to deal with complex nonlinear problems. However, the calculation efficiency will be reduced due to the need to determine multiple parameters and conduct multiple tests if a higher order response surface equation is established. Considering the above two factors, the response function of the quadratic polynomial was used to establish the riser fatigue data-driven models in this paper, because it can solve nonlinear problems and reduce the number of experiments [28]. The second order response surface model is written as
D L = β 0 + i = 1 k β i x i + i = 1 k β ii x ii 2
where β is the coefficient of the response surface, x refers to random parameters, and k is the number of parameters for response surface fitting.

4.2. Fatigue Crack Growth Modeling

The fatigue damage of risers is often calculated based on the S–N curve. However, riser inspection results are generally represented as fatigue crack size. Using the inspection results to update riser fatigue reliability is difficult when the fatigue damage is calculated based on the S–N curve. Riser fatigue damage based on the S–N curve needs to be transformed into fatigue damage based on fracture mechanics. Fracture mechanics theory is a mathematical method to study the functional relationship among crack shape, load magnitude, and number of cycles. The growth of fatigue cracks for cyclic loading is commonly described by the Paris law. The crack growth rate is defined as follows [39]
d a d N = C 0 ( Δ K ) m
where a is the crack size, N is the cycle number, C0 and m are fracture mechanics method parameters, and ΔK is the amplitude of the stress intensity factor.
The amplitude of the stress intensity factor describes the stress condition around crack tips, and it can be written as
Δ K = Y ( ζ ) Δ σ π a
where Y(ζ) is a geometric function related to crack size, and Δσ is the applied stress range.
Risers are generally subjected to a combination of axial tensile and bending loads. A riser crack is considered a type I crack, because the load direction is perpendicular to the crack surface, and the upper and lower sides of the crack open relative to each other under the combined load. The geometric function Y(ζ) is shown as [40,41]
Y ( ζ ) = 1.122 1.4 ( ζ ) + 7.33 ( ζ ) 2 13.08 ( ζ ) 3 + 14 ( ζ ) 4
where ζ is the ratio of crack depth a of the riser to wall thickness t.
The crack growth due to a single cycle load is described as
d a d N = C 0 ( Y ( ζ ) Δ σ π a ) m
The amount of crack growth in a year is written as
a yn = i = 1 k C 0 ( Y ( ξ ) Δ σ i π a y 1 ) m
where k is the cycle load number in a year.
The geometric function is assumed to be constant in one year. The crack growth in a year is then simplified as
a yn = C 0 ( Y ( ξ ) π a y 1 ) m i = 1 k ( Δ σ i ) m
On the basis of the S–N curve and the data-driven model in Equation (10), the relationship between ∆σ and the established fatigue data-driven models can be obtained by substituting Equation (10) into Equation (9) as follows:
D L = 1 n f = 1 C i = 1 k ( Δ σ i ) m f = β 0 + i = 1 k β i x i + i = 1 k β ii x ii 2
S–N curve parameter mf in Equation (9) serves as an intermediate calculation variable and has the same value as fracture mechanics parameter m. Therefore, the sum of the stress amplitude is shown as
i = 1 k ( Δ σ i ) m = C ( β 0 + i = 1 k β i x i + i = 1 k β ii x ii 2 )
The annual crack growth can be obtained by substituting Equation (18) into Equation (16) as follows:
a yn = C 0 ( Y ( ξ ) π a y 1 ) m C ( β 0 + i = 1 k β i x i + i = 1 k β ii x ii 2 )
Crack depth is the sum of all crack extension depths, and it is expressed as
a y = a y 1 + a yn
where ay is the crack depth in the current year, and ay-1 is the crack depth in the previous year.
The crack size increases with time in the process of crack growth. When crack size reaches its failure limit, riser failure occurs. The failure criterion is described as fatigue crack depth being greater than the calculated critical crack size of the risers. The corresponding fatigue crack limit state equation is shown as
Z = a c a y
where Z is the fatigue failure function, and ac is the critical size of riser fatigue crack failure.
Generally, the Level 2A critical assessment criterion in BS 7910 [42] is used to obtain the critical size ac when material information is complete, and it is expressed as
{ K r = ( 1 0.14 L r 2 ) { 0.3 + 0.7 e ( 0.65 L r 6 ) } L r L rmax K r = 0 L r > L rmax
where Kr is the fracture ratio, Lr is the ratio of applied load to yield load, and Lrmax is the permitted limit of Lr.
These parameters are defined in detail as
L rmax = σ Y + σ u 2 σ Y
where σY is the yield stress, and σu is the ultimate stress of the material.
L r = σ ref σ Y
where σref is the reference stress.
K r = K I K mat
where KI is the stress intensity factor, and Kmat is the material fracture toughness (if a valid KIc is available, Kmat should be taken as KIc).
The reference stress, σref, is defined as
σ ref = P m { π ( 1 a t ) + 2 ( a t ) sin ( c L r m ) } ( 1 a t ) { π ( c L r m ) ( a t ) } + 2 P b 3 ( 1 a ) 2
where Pm is the primary membrane stress, Pb is the primary banding stress, rm is the riser mean radius, a is the crack depth, cL is the half of crack length, and a is written as
{ a = a t { 1 + ( t c L ) } π r m c L + t a = ( a t ) ( c L π r m ) π r m < c L + t
The stress intensity factor in the Level 2 critical assessment criterion is written as
K I = { ( Y σ ) p + ( Y σ ) s } π a
where ()p and ()s represent contributions from primary and secondary stresses, respectively.
( Y σ ) p = M 1 f w [ k tm M km M m P m + k tb M kb M b { P b + ( k m 1 ) P m } ] ( Y σ ) s = M m Q m + M b Q b
where Qm is the secondary membrane stress, and Qb is the secondary bending stress. For the value of parameters M1, fw, Mm, Mb, Mkm, Mkb, ktm, ktb, and km, readers may refer to BS7910.

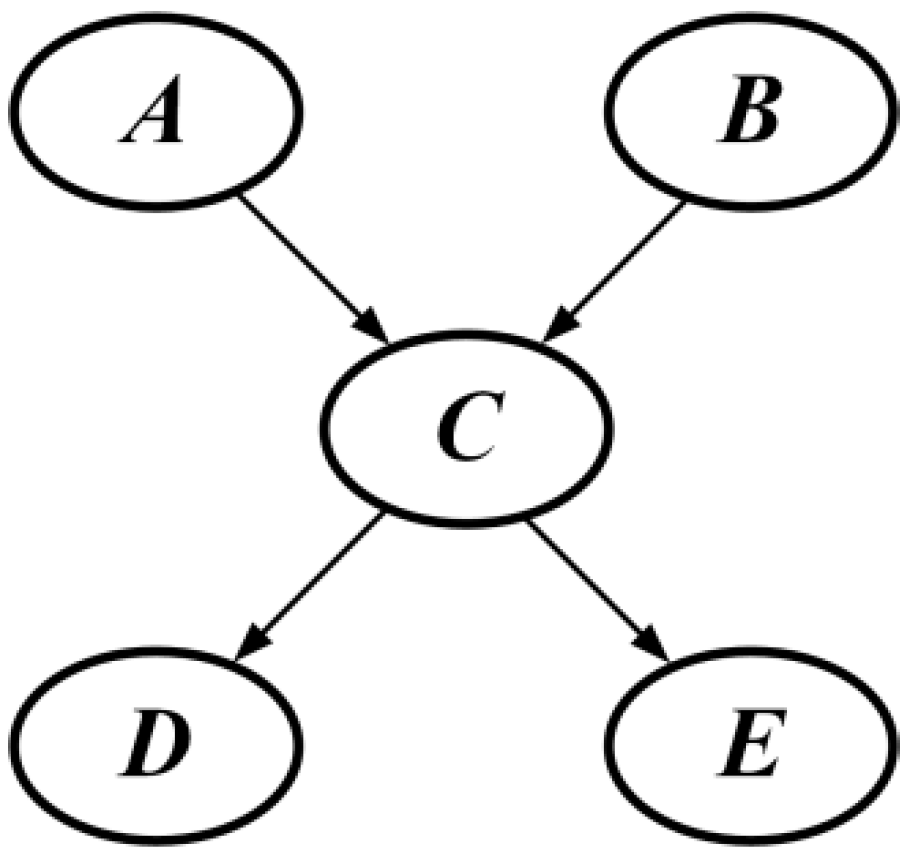
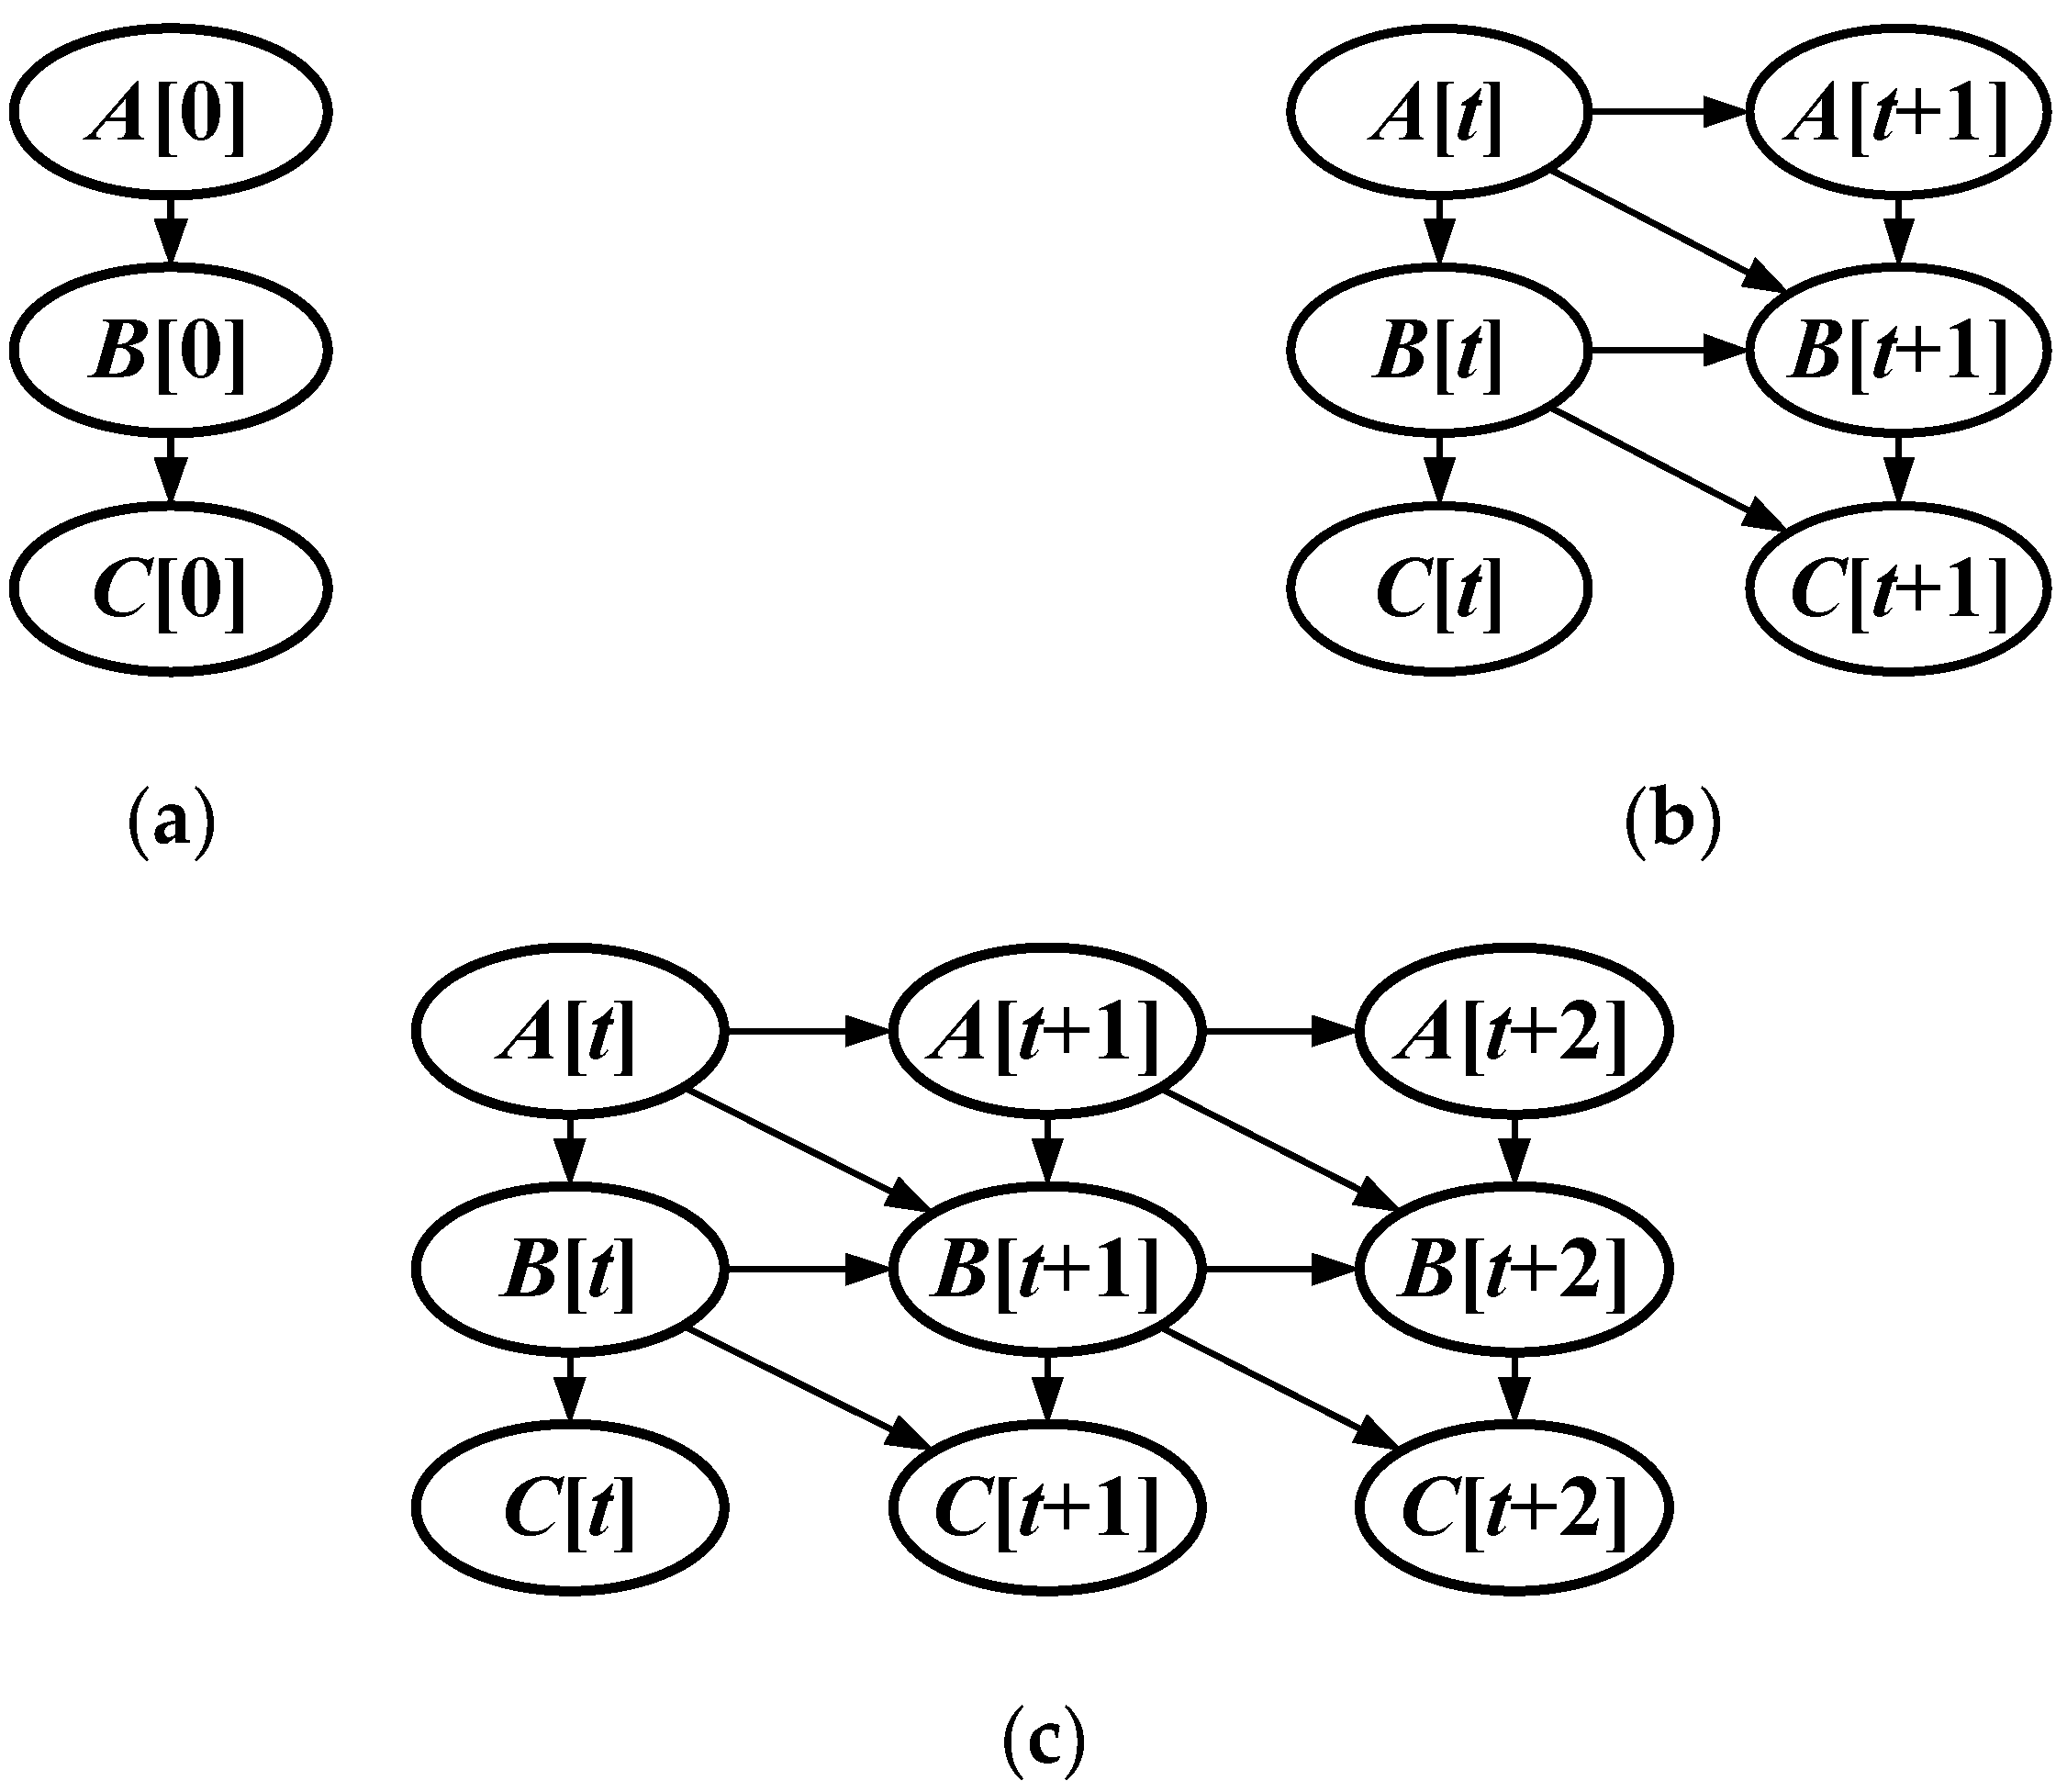
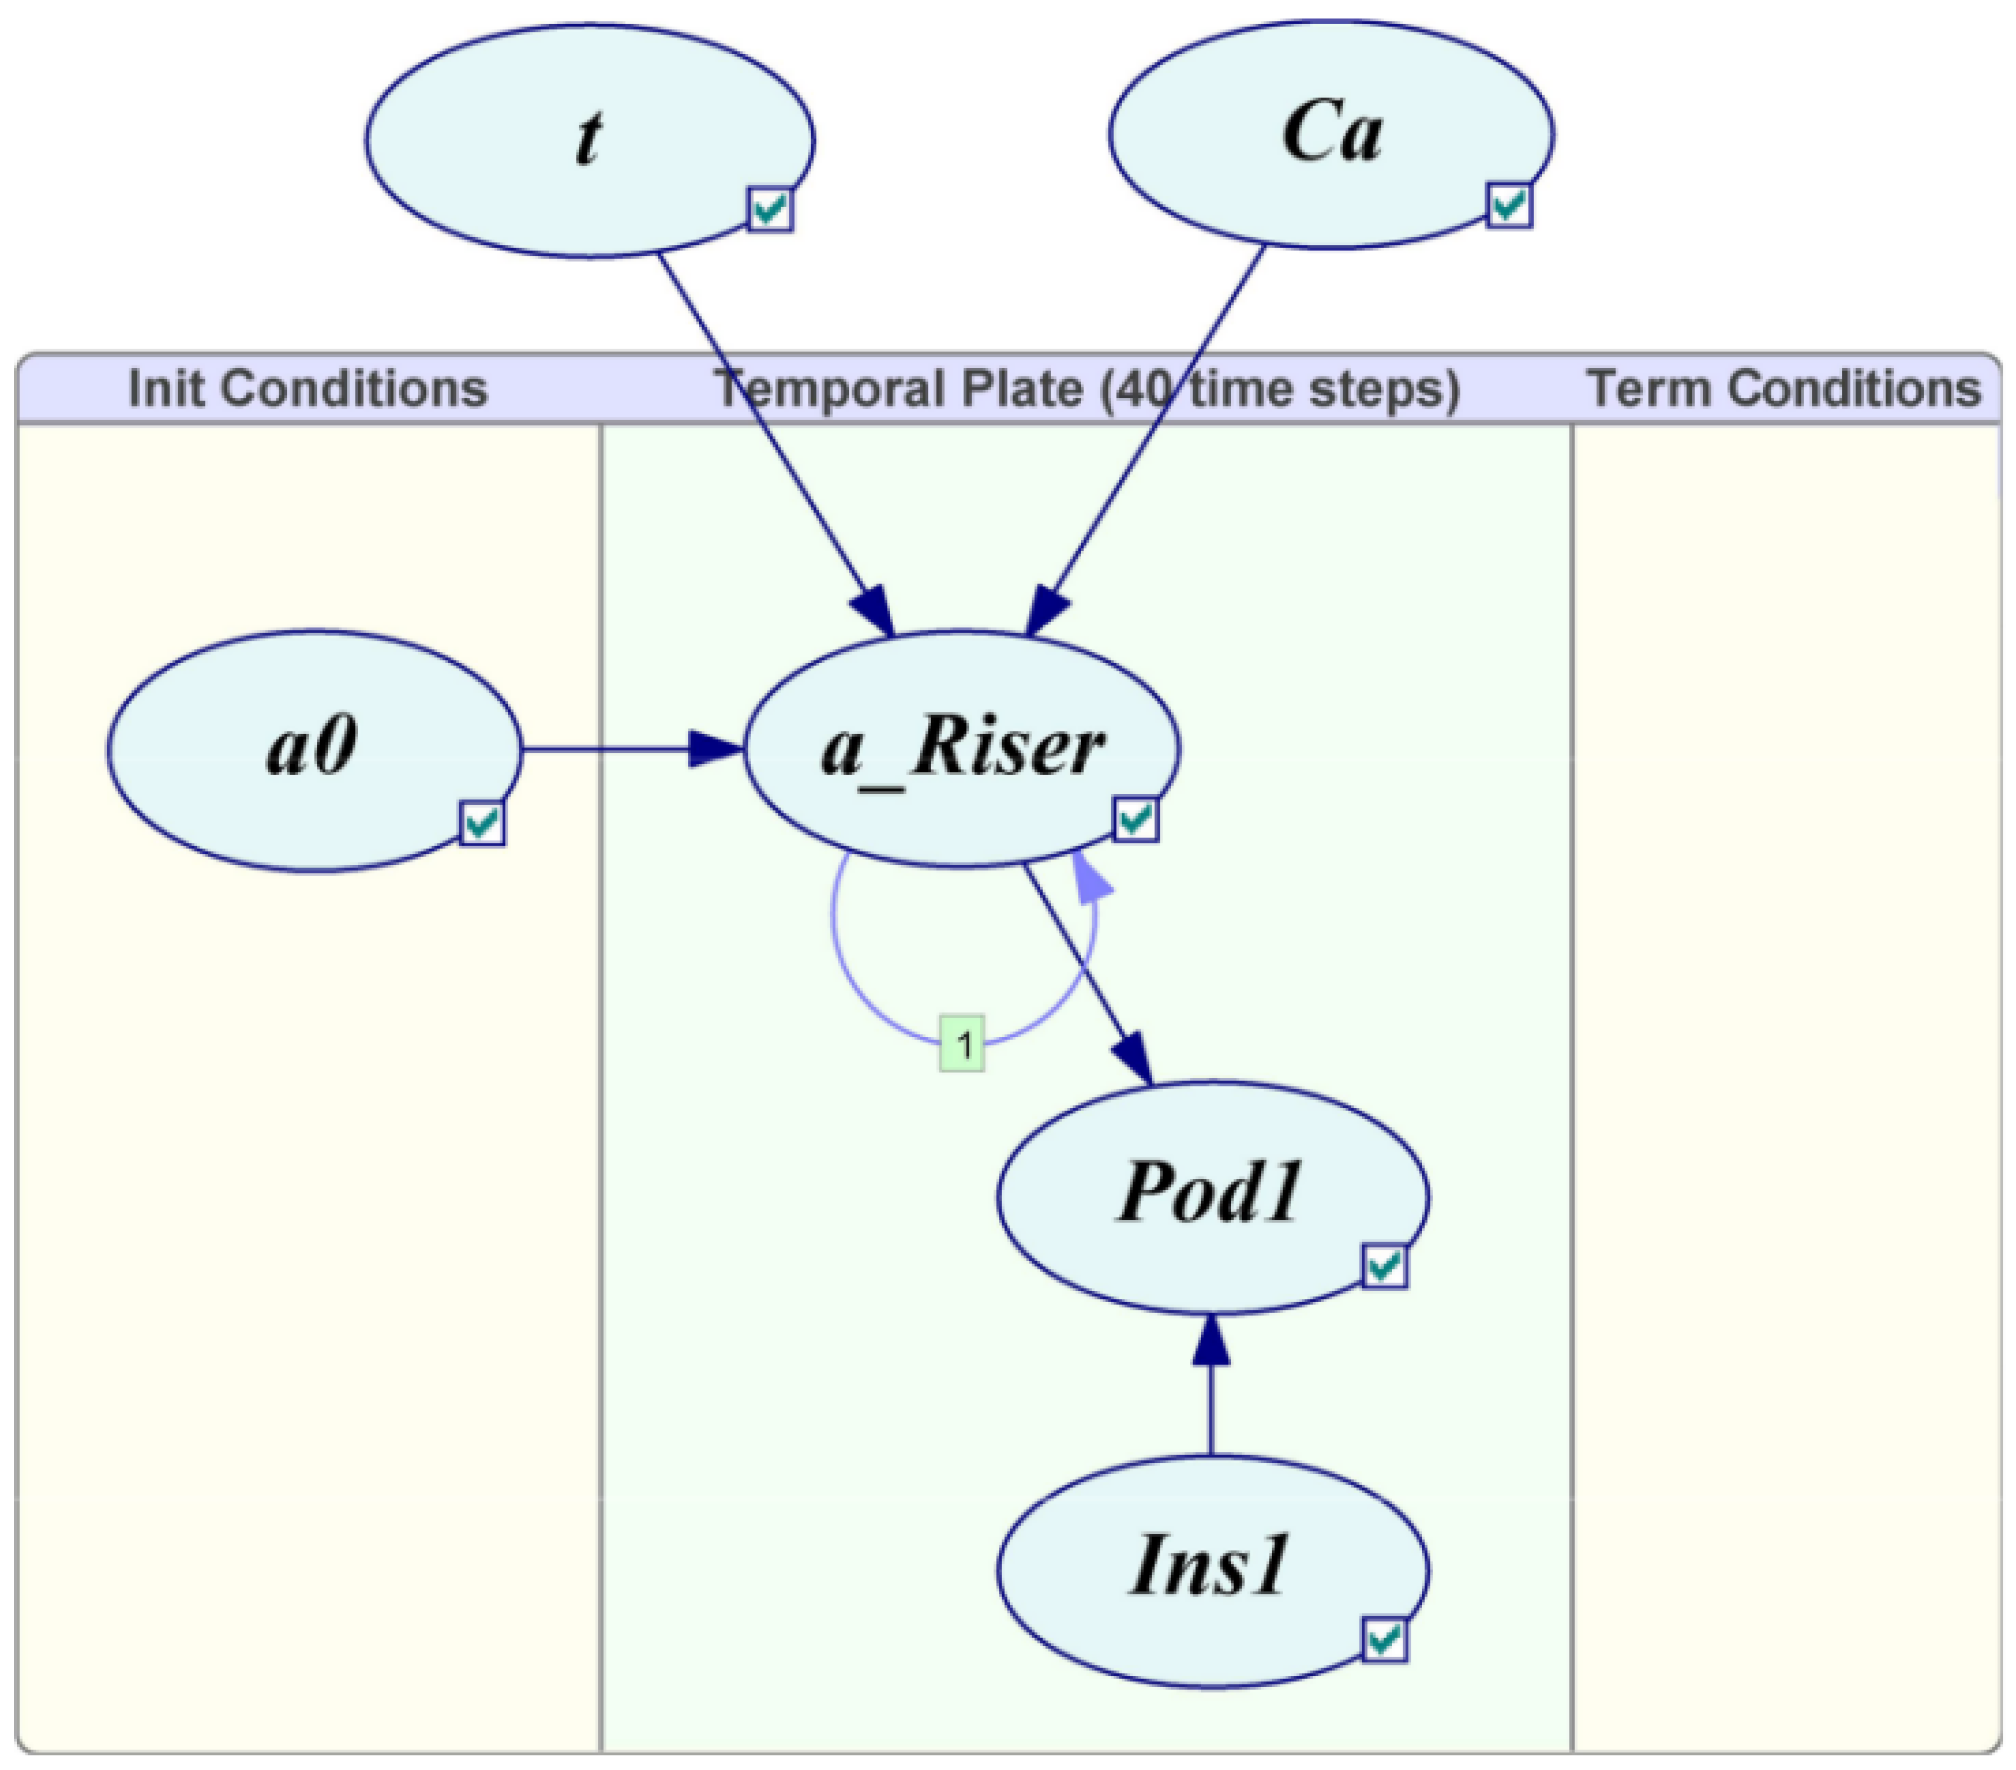
5. Dynamic Bayesian Network

The Bayesian network (BN) is utilized to analyze the fatigue reliability of risers due to its forward and backward inference capability. The BN is a combination of probability and graph theories and is widely used in data analysis [43]. The structure of a BN model is clearly represented by graph theory, and the problems to be solved are analyzed by probability theory [44,45,46]. A basic BN is shown in Figure 3.
Each node is attached to a probability distribution. Root nodes A and B are attached to their marginal probability distributions P(A) and P(B), respectively. The non-root node X (C, D, E) is attached to the conditional probability distribution P(X|pa(X)), and pa(X) is the father node of node X [47]. A logical analysis is performed by analyzing the relationship between nodes in the Bayesian model.
Prior and posterior probabilities are relative to a certain set of evidence in Bayesian theory. In the presence of two different random variables A and D, A = a is an event, and D = d is evidence. The probability estimation P(A = a) of event A = a before considering evidence is called prior probability. Conversely, the probability estimation P(A = a|D = d) of event D = d after considering evidence is called posterior probability. The relation between prior and posterior probabilities is described as
P ( A = a | D = d ) = P ( A = a ) P ( D = d | A = a ) D = d
where P (D = d A = a) is the likelihood of event A = a and can be called L (A = a| D = d). In reality, the likelihood of the event is easier to obtain than the posterior probability.
The DBN is an extension of static Bayesian network modeling in the time dimension. The state of the DBN is updated over time to analyze dynamic stochastic processes. Some assumptions need to be made before establishing a DBN model:
  • The conditional probability is uniformly stable for all variable t over a finite period of time.
  • The DBN is a Markov process. Future probabilities are determined by present probabilities and not by past probabilities, namely, P(Y[t+1]|Y[1],Y[2],…,Y[t]) = P(Y[t+1]|Y[t]).
  • The conditional probability of adjacent time slices is stable. P(Y[t+1]|Y[t]) is independent of time.
The DBN is composed of a prior network and a transfer network. The prior network is a joint probability distribution defined at the initial state. The transfer network is the conditional transition probability P(Y[t+1]|Y[t]) defined by the variables Y[t] and Y[t+1]. The DBN is shown in Figure 4.
A DBN model of riser fatigue crack was established in this study to analyze the fatigue reliability of risers, as is shown in Figure 5. The crack depth in Equation (21) is the parent node, and the other variables are the child nodes. The distribution of fatigue crack size can be calculated through forward Bayesian inference. The inspection results can also be introduced to the DBN model, and the influence of the inspection results on riser failure probability is examined using backward Bayesian inference.

6. Case Analysis

6.1. Response Surface Analysis

A riser system in the South China Sea was employed as an example for case analysis. The dynamic response analysis parameters are listed in Table 1. The wave conditions for the fatigue analysis are listed in Table 2. The response amplitude operator (RAO) was used for platform motion simulation and is shown in Figure 6.
The physical-based equations shown in Equation (8) are often solved with the generalized α method, the Newmark β method, or other numerical integral methods. Some software programs, such as Orcaflex and Deepriser, have also been developed especially for riser dynamic analysis. Orcaflex was used for the current analysis due to its ability to analyze the dynamic response and calculate the fatigue damage of risers. The fatigue damage of the deepwater riser system is shown in Figure 7.
It can be seen from Figure 7 that a large portion of the fatigue damage was concentrated at the top of the riser system. The main reason is that the top of the riser system is directly subjected to dynamic wave loads. The following fatigue sensitivity and reliability analysis was conducted at the largest fatigue point. Riser wall thickness t, additional mass coefficient Ca, S–N curve coefficient C, and drag coefficient Cd were adopted as random parameters. The distributions, mean values, and coefficients of variation (COVs) of these random parameters are listed in Table 3 [15,48].
μXi-1.5σXi and μXi+1.5σXi were adopted as critical values of each parameter Xi. One of the parameters was set to μXi±1.5σXi, and the others were set to be the mean value in one calculation round. The fatigue damage of the risers under two critical values was calculated. The other parameters were calculated in the same manner. The standard deviation of riser fatigue under each parameter is shown as follows
σ X i = ( D L x i ) 2 σ x i 2
The sensitivity of riser fatigue to each parameter is expressed as
I i = ( D L x i ) 2 σ x i 2 D L 2
The sensitivity of riser fatigue considering t, Ca, C, and Cd as random parameters and the others as the mean values, respectively, is shown in Figure 8, Figure 9, Figure 10, Figure 11 and Figure 12.
The parameter sensitivity analysis results showed that wall thickness t had the greatest influence on fatigue damage, followed by additional mass coefficient Ca, S–N curve parameter C, and drag coefficient Cd. Drag coefficient Cd and S–N curve parameter C had an almost negligible influence on the fatigue damage of risers relative to the two other parameters. Therefore, wall thickness t and additional mass coefficient Ca were employed as the parameters for establishing the response surface model of fatigue damage. The random variable μ±hσ was also chosen, with h being 1.5. The parameters are shown in Table 4 [49].
A fatigue damage data-driven model was established using the polynomial method shown in Equation (33) to determine the relationship between riser fatigue damage and random variables. Then, the riser fatigue crack growth model shown in Equation (34) was obtained with this data-driven model.
D L = 0.0495 2.0641 t + 36.4980 t 2 0.0429 C a + 0.0237 C a 2
a y = a y 1 + C 0 Y m 0 ( a ) ( π a y 1 ) m 0 C D L
Five groups of fatigue damage based on data-driven and physical-based models are listed in Table 5 and were compared with one another. The results of the two methods are essentially the same. The fatigue response surface method had high computational speed, because the response surface model had no integration or differentiation process. The established response surface model could be used for the subsequent fatigue reliability analysis due to its high calculation accuracy and efficiency.

6.2. Fatigue Reliability Analysis

In the process of critical crack assessment, initial crack depth a0 is assumed to be 1 mm, and initial crack length c0 is assumed to be 2 mm. The yield stress σY of the riser is 555 MPa, the ultimate stress of the material σu is 625 MPa, and the outer diameter is 263.5 mm. According to Equation (22) to Equation (29), the riser reaches the critical crack depth of 12.5792 mm in the 40th year. The key parameters of the data-driven models were adopted to calculate the fatigue failure probability of deepwater risers on the basis of the established response surface model. The key parameters are listed in Table 6.
Each variable was discretized, because continuously distributed variables cannot be calculated with the DBN. Variables Ca and t were normally distributed. [μ−1.5σ, μ+1.5σ] was used as the truncated boundary, and the outer part was ignored in discrete processing. The variables were divided into 10 segments. Variable a was in half of the normal distribution, and a was divided into 20 segments. The sum of all segments is equal to critical crack size ac. The segments that exceeded the critical crack size indicated riser fatigue failure. The riser fatigue crack limit state equation in Equation (21) was then transformed into the BN for fatigue reliability analysis, as indicated in Figure 13. The label of each root node represented the variables in the response surface model. The distribution of fatigue cracks could be calculated with the BN.
The BN was transformed into the DBN, because fatigue crack increases with time, as is shown in Figure 14. The total analysis time of the established DBN was set to 40 years, and the analysis time intervals were set to 1 year. The conditional probability of a was determined with Equation (34). A probability table was also established based on the corresponding distribution of discrete variables. The probability distribution of crack depth at each detection time could be calculated via Bayesian forward inference.
The fatigue failure probability was calculated efficiently by using the established DBN, as is shown in Figure 15. The riser fatigue failure probability was low and changed slightly in the initial time for the small crack size. Then, the crack size and corresponding failure probability increased gradually with service time, and, finally, the crack reached the critical crack size, and the fatigue failure of the riser occurred. The riser system should be inspected before the riser failure probability reaches the probability limit and maintained afterward to avoid major accidents.

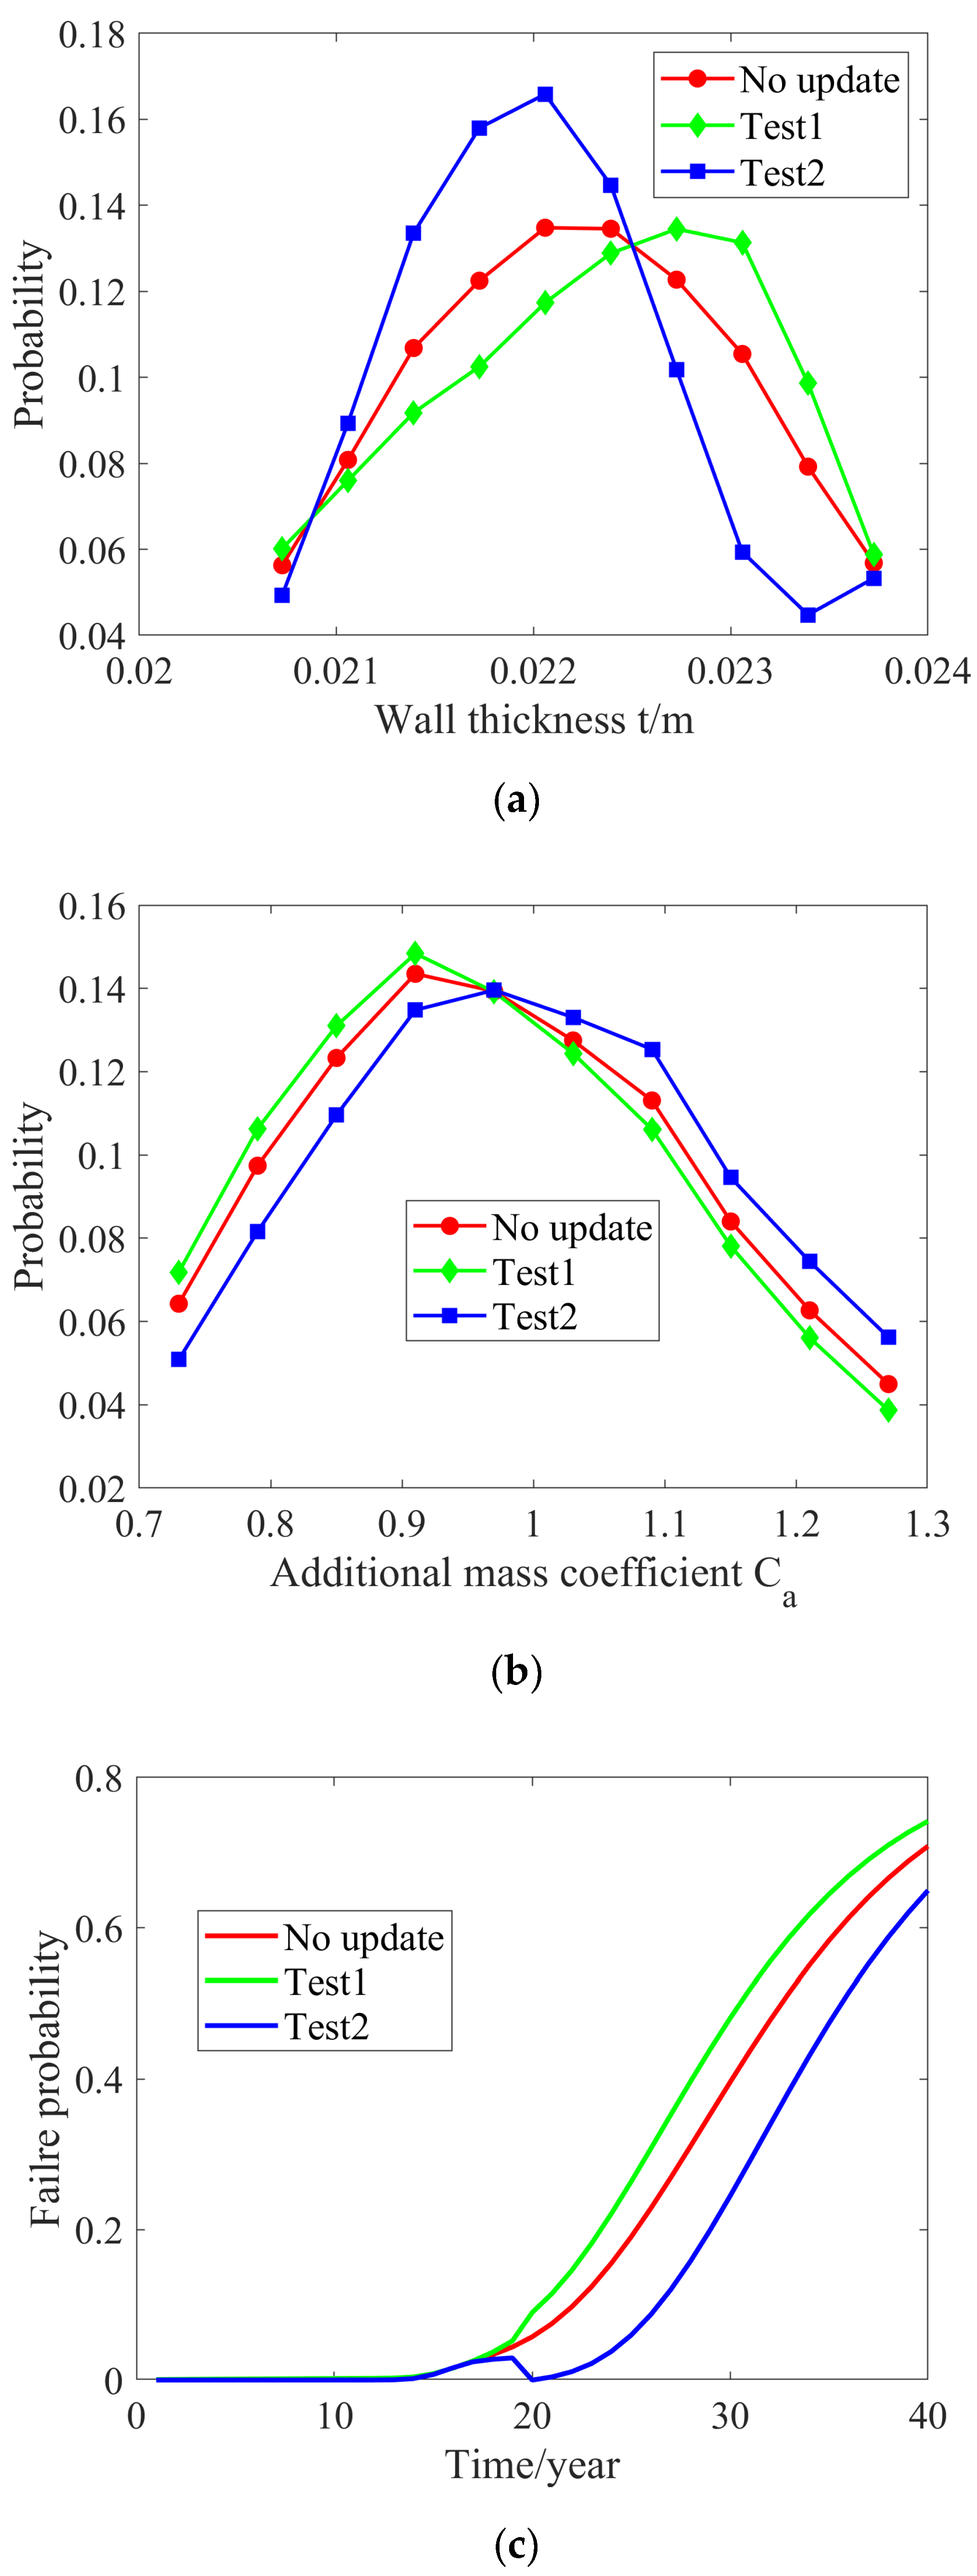
6.3. Fatigue Reliability Updating

Risers are inspected periodically in actual riser engineering to guarantee their safety. The probability of detection (POD) is often used to describe the probability of detecting the corresponding crack size with a certain detection method under a given condition. It can be regarded as a function of defect crack size and shown as
P O D ( a ) = 1 1.2 exp ( 0.3 a )
Two groups of inspection results (Test1: detection and Test2: no detection) of the riser fatigue crack were studied. Test1 means a fatigue crack is detected, and Test2 means no fatigue crack is detected. The inspection results were introduced into the fatigue crack DBN model, as is shown in Figure 16.
Parameters t and Ca and riser failure probability can be updated based on the inspection results in the backward inference of the DBN model. The inspection results were introduced for parameter updating in the 20th year, as is shown in Figure 17.
Figure 17a,b show that the introduction of inspection results exerted a great influence on parameter t. The updated parameter t could not maintain a normal distribution after the inspection results were introduced. The inspection results had little influence on parameter Ca, and updated parameter Ca almost maintained a lognormal distribution after the inspection results were introduced. Figure 17c shows that the inspection results had a great influence on the fatigue failure probability of the deepwater risers. For Test1 (detection), the updated fatigue reliability of the riser at this time was lower than the value before the inspection, and the failure probability would be higher than before the inspection, because the fatigue crack was detected. On the contrary, the updated fatigue failure probability of the risers in Test2 (no detection) was lower than the value before the update, because the fatigue crack was not detected in the defect inspection. Riser fatigue reliability can be evaluated realistically by integrating simulation models and inspection results.

7. Conclusions

This study attempts to solve a challenging problem: the fatigue reliability analysis of deepwater risers. An improved fatigue reliability analysis method based on RSM and the DBN for deepwater risers was proposed. A more efficient data-driven model was established based on RSM compared with physical-based models. A crack growth model of the riser was established by considering the crack inspection data as a factor. The crack DBN model was employed to conduct a fatigue reliability analysis and updating. The combination of data-driven models and the crack growth model could solve the problems of traditional methods in the fatigue reliability analysis of risers, such as low computational efficiency and the inability to introduce inspection data.
The whole fatigue reliability analysis process includes fatigue damage analysis, fatigue damage modeling, and fatigue reliability analysis. First, the fatigue damage of the riser system was analyzed based on physical-based models. Second, a data-driven model for riser fatigue damage was established based on the fatigue damage analysis results, and, further, a riser fatigue crack growth model was established. Lastly, a fatigue crack DBN model was established for fatigue reliability analysis based on the fatigue crack growth model, and the fatigue reliability of the riser was updated by taking the crack inspection data as evidence.
The proposed method was applied to the fatigue reliability analysis and updating of deepwater risers. The results showed that fatigue reliability could be calculated efficiently through dynamic Bayesian forward inference. Moreover, the distribution of random variables and fatigue reliability could be updated based on the inspection results via the backward inference of the DBN model. The proposed method could analyze and update the fatigue reliability of deepwater risers accurately and efficiently.

Author Contributions

Conceptualization, L.X.; methodology, X.L.; software, P.H.; validation, P.H., and Y.L.; formal analysis, N.Q.; investigation, L.X.; resources, L.X.; data curation, N.Q.; writing—original draft preparation, L.X.; writing—review and editing, P.H.; visualization, P.H.; supervision, G.C.; project administration, X.L.; funding acquisition, L.X. All authors have read and agreed to the published version of the manuscript.

Funding

This research was funded by the National Natural Science Foundation of China (Grant No: 52271300, 52071337, 51809279) and the Program for Changjiang Scholars and Innovative Research Teams at the University (Grant No. IRT14R58).

Institutional Review Board Statement

Not applicable.

Informed Consent Statement

Not applicable.

Data Availability Statement

Data associated with this research are available and can be obtained by contacting the corresponding author upon reasonable request.

Conflicts of Interest

The authors declare that they have no known competing financial interests or personal relationships that could have appeared to influence the work reported in this paper.

References

  1. ISO 13624-1; Petroleum and Natural Gas Industries—Drilling and Production Equipment—Part 1: Design and Operation of Marine Drilling Riser Equipment. International Organization for Standardization: Geneva, Switzerland, 2009.
  2. Hejazi, R.; Grime, A.; Randolph, M.; Efthymiou, M. An efficient probabilistic framework for the long-term fatigue assessment of large diameter steel risers. Appl. Ocean Res. 2021, 118, 102941. [Google Scholar] [CrossRef]
  3. Chang, Y.; Wu, X.; Zhang, C.; Chen, G.; Liu, X.; Li, J.; Cai, B.; Xu, L. Dynamic Bayesian networks based approach for risk analysis of subsea wellhead fatigue failure during service life. Reliab. Eng. Syst. Saf. 2019, 188, 454–462. [Google Scholar] [CrossRef]
  4. U.S. Department of the Interior, Minerals Management Service. Deepwater Riser Design, Fatigue Life and Standards Study Report; Doc. No. 86330-20-R-RP-005; U.S. Department of the Interior, Minerals Management Service: Washington, DC, USA, 2007.
  5. Low, Y.M.; Narakorn, S. VIV fatigue reliability analysis of marine risers with uncertainties in the wake oscillator model. Eng. Struct. 2016, 106, 96–108. [Google Scholar] [CrossRef] [Green Version]
  6. Chen, R.; Low, Y.M. Efficient long-term fatigue analysis of deepwater risers in the time domain including wave directionality. Mar. Struct. 2021, 78, 103002. [Google Scholar] [CrossRef]
  7. Cortina, J.P.R.; Fernando, J.M.; Sagrilo, V.S. Neural networks applied to the wave-Induced fatigue analysis of steel risers. Math. Probl. Eng. 2018, 2018, 2719682. [Google Scholar] [CrossRef]
  8. Zhang, S.; Liu, X.; Chang, Y. Wave-loading fatigue analysis on deep-water drilling platform/riser system. J. Ship Mech. 2019, 23, 843–850. [Google Scholar]
  9. Khan, R.A.; Ahmad, S. Dynamic response and fatigue reliability analysis of marine riser under random loads. In Proceedings of the ASME 2007 26th International Conference on Offshore Mechanics and Arctic Engineering, San Diego, CA, USA, 10–15 June 2007. [Google Scholar]
  10. Dong, Y.; Kong, X.; An, G.; Kang, J. Fatigue reliability of single-sided girth welds in offshore pipelines and risers accounting for non-destructive inspection. Mar. Struct. 2022, 86, 103268. [Google Scholar] [CrossRef]
  11. Sen, T.K. Probability of fatigue failure in steel catenary risers in deep water. J. Eng. Mech. 2006, 32, 1001–1006. [Google Scholar] [CrossRef]
  12. Akpan, U.O.; Koko, T.S.; Rushton, P.A. Probabilistic fatigue reliability of large diameter steel catenary risers (SCR) for ultra-deepwater operations. In Proceedings of the ASME 2007 26th International Conference on Offshore Mechanics and Arctic Engineering, San Diego, CA, USA, 10–15 June 2007. [Google Scholar]
  13. Morooka, C.; Stefane, W.; Matt, C.G.C. An assessment for structural reliability of offshore risers due to probability of fatigue failure. In Proceedings of the 8th International Pipeline Conference, Calgary, AB, Canada, 27 September–1 October 2010. [Google Scholar]
  14. Khan, R.A.; Ahmad, S. Probabilistic fatigue safety analysis of oil and gas risers under random loads. In Proceedings of the ASME 2010 29th International Conference on Ocean, Offshore and Arctic Engineering, Shanghai, China, 6–11 June 2010. [Google Scholar]
  15. Yang, H.; Li, H. Fatigue reliability analysis of marine risers by approximation model. In Proceedings of the Twentieth 2010 International Offshore and Polar Engineering Conference, Beijing, China, 20–25 June 2010. [Google Scholar]
  16. Singh, M.; Ahmad, S. Probabilistic analysis and risk assessment of deepwater composite production riser against fatigue limit state. In Proceedings of the ASME 2015 34th International Conference on Offshore Mechanics and Arctic Engineering, St. John’s, NL, Canada, 31 May–5 June 2015. [Google Scholar]
  17. Khan, R.A.; Ahmad, S. Nonlinear dynamic and bilinear fatigue reliability analyses of marine risers in deep offshore fields. Ship Offshore Struct. 2018, 13, 10–19. [Google Scholar] [CrossRef]
  18. Chagas, B.L.B.; Morooka, C.K. A study on the main parameters that affects the reliability of fatigue failure in marine drilling riser. In Proceedings of the ASME 2021 40th International Conference on Offshore Mechanics and Arctic Engineering, Virtual, 21–30 June 2021. [Google Scholar]
  19. Li, F.; Low, Y.M. Sensitivity study of critical parameters influencing the uncertainty of fatigue damage in steel catenary risers. In Proceedings of the ASME 2010 29th International Conference on Ocean, Offshore and Arctic Engineering, Shanghai, China, 6–11 June 2010. [Google Scholar]
  20. Li, F.; Low, Y.M. Fatigue reliability analysis of a steel catenary riser at the touchdown point incorporating soil model uncertainties. Appl. Ocean Res. 2012, 38, 100–110. [Google Scholar] [CrossRef]
  21. Elosta, H.; Huang, S.; Incecik, A. Wave loading fatigue reliability and uncertainty analyses for geotechnical pipeline models. Ship Offshore Struct. 2014, 9, 450–463. [Google Scholar] [CrossRef]
  22. Yang, P.; Li, J.; Zhang, W.; Wu, D.; Gu, X.; Ma, Q. Analysis on statistical uncertainties of wave loads and structural fatigue reliability for a semi-submersible platform. Ocean Eng. 2021, 237, 109609. [Google Scholar] [CrossRef]
  23. Xia, J.; Das, P.K. Probabilistic fatigue reliability analysis of deepwater steel catenary risers. In Proceedings of the ASME 2008 27th International Conference on Offshore Mechanics and Arctic Engineering, Estoril, Portugal, 15–20 June 2008. [Google Scholar]
  24. Lim, H.; Manuel, L.; Low, Y.M.; Srinil, N. A surrogate model for estimating uncertainty in marine riser fatigue damage resulting from vortex-induced vibration. Eng. Struct. 2022, 254, 113796. [Google Scholar] [CrossRef]
  25. Hejazi, R.; Grime, A.; Randolph, M.; Efthymiou, M. A Bayesian machine learning approach to rapidly quantifying the fatigue probability of failure for steel catenary risers. Ocean Eng. 2021, 235, 109353. [Google Scholar] [CrossRef]
  26. Nazir, M.; Khan, F.; Amyotte, P. Fatigue reliability analysis of deep water rigid marine risers associated with morison-type wave loading. Stoch. Environ. Res. Risk Assess. 2008, 22, 379–390. [Google Scholar] [CrossRef]
  27. Monsalve-Giraldo, J.S.; Videiro, P.M.; Mendes de Sousa, F.J.; dos Santos, C.M.P.M.; Sagrilo, L.V.S. Parametric interpolation method for probabilistic fatigue analysis of steel risers. Appl. Ocean Res. 2019, 90, 101838. [Google Scholar] [CrossRef]
  28. Dong, Y.; Teixeira, A.P.; Guedes Soares, C. Time-variant fatigue reliability assessment of welded joints based on the PHI2 and response surface methods. Reliab. Eng. Syst. Saf. 2018, 177, 120–130. [Google Scholar] [CrossRef]
  29. Su, Y.; Fu, G.; Wan, B.; Yu, T.; Zhou, W.; Wang, X. Fatigue reliability design for metal dual inline packages under random vibration based on response surface method. Microelectron. Reliab. 2019, 100–101, 113404. [Google Scholar] [CrossRef]
  30. Zhang, Z.; Qiu, Z. Fatigue reliability analysis for structures with hybrid uncertainties combining quadratic response surface and polynomial chaos expansion. Int. J. Fatigue 2021, 144, 106071. [Google Scholar] [CrossRef]
  31. Cai, B.; Liu, Y.; Zhang, Y.; Fan, Q.; Liu, Z.; Tian, X. A dynamic Bayesian networks modeling of human factors on offshore. J. Loss Prev. Process Ind. 2013, 26, 639–649. [Google Scholar] [CrossRef]
  32. Liu, X.; Sun, H.; Yu, M. Mechanical analysis of deepwater drilling riser system based on multibody system dynamics. Pet. Sci. 2021, 18, 603–617. [Google Scholar] [CrossRef]
  33. Xu, L.; Wang, J.; Li, Y. Development and sea trial investigation for deepwater drilling riser specialized soft hang-off system during transit. Ocean Eng. 2022, 243, 110310. [Google Scholar] [CrossRef]
  34. Liu, X.; Li, Y.; Zhang, N. Improved axial dynamic analysis of risers based on finite element method and data-driven models. Ocean Eng. 2020, 214, 107782. [Google Scholar] [CrossRef]
  35. Tian, D.; Fan, H.; Leira, B.J.; Sævik, S. Study on the static behavior of installing a deep-water drilling riser on a production platform. J. Pet. Sci. Eng. 2020, 185, 106652. [Google Scholar] [CrossRef]
  36. Sexton, R.M.; Agbezuge, L.K. Random wave and vessel motion effects on drilling riser dynamics. In Proceedings of the Offshore Technology Conference, Houston, TX, USA, 2–5 May 1976. [Google Scholar]
  37. Zhang, W.; Gao, D. Research on the dynamic behavior of riser in deepwater drilling under the condition of disconnection mode. Pet. Drill. Tech. 2010, 38, 7–9. [Google Scholar]
  38. Wang, Y.; Gao, D.; Fang, J. Axial dynamic analysis of marine riser in installation. J. Nat. Gas Sci. Eng. 2014, 21, 112–117. [Google Scholar] [CrossRef]
  39. Paris, P.; Erdogan, F. A critical analysis of crack propagation laws. J. Basic Eng. 1963, 85, 528–533. [Google Scholar] [CrossRef]
  40. Liu, W.; Chen, G. Coupling analysis for vibration and fatigue of a cracked cantilever beam. J. Vib. Shock 2011, 30, 140–144. [Google Scholar]
  41. Tada, H.; Paris, P.; Irwin, G.R. The Stress Analysis of Cracks Handbook, 3rd ed.; ASME Press: New York, NY, USA, 2000. [Google Scholar]
  42. BS 7910: 2005; Guide to Methods for Assessing the Acceptability of Flaws in Metallic Structures. British Standards Institution: Britain, UK, 2005.
  43. Chang, Y.; Chen, G.; Wu, X.; Ye, J.; Chen, B.; Xu, L. Failure probability analysis for emergency disconnect of deepwater drilling riser using Bayesian network. J. Loss Prev. Process Ind. 2018, 51, 42–53. [Google Scholar] [CrossRef]
  44. Cooper, G.F. The computational complexity of probabilistic inference using bayesian belief networks. Artif. Intell. 1990, 42, 393–405. [Google Scholar] [CrossRef]
  45. Xiao, Q.; Gao, S.; Gao, X. Learning Theory and Application of Dynamic Bayesian Network Reasoning, 1st ed.; National Defense Industry Press: Beijing, China, 2007. [Google Scholar]
  46. Wang, Y.; Liu, S.; Chen, Z.; Wang, M.; Yang, J.; Chen, X. Dynamic Bayesian networks for reliability evaluation of subsea wellhead connector during service life based on Monte Carlo method. J. Loss Prev. Process Ind. 2021, 71, 104487. [Google Scholar] [CrossRef]
  47. Liu, Z.; Liu, Y. A Bayesian network based method for reliability analysis of subsea blowout preventer control system. J. Loss Prev. Process Ind. 2019, 59, 44–53. [Google Scholar] [CrossRef]
  48. Leira, B.J.; Lgland, R.T.; Ye, N. Fatigue safety factors for the tensile and pressure armours of flexible risers. In Proceedings of the International Conference on Offshore Mechanics and Arctic Engineering, San Diego, CA, USA, 10–15 June 2007. [Google Scholar]
  49. Gui, J.; Kang, H. Response surface method for structural reliability analysis and its implementation with MATLAB. Chin. J. Comput. Mech. 2003, 21, 683–687. [Google Scholar]
Figure 1. Analysis methodology.
Jmse 11 00688 g001
Figure 2. Deepwater drilling platform/riser coupling system.
Jmse 11 00688 g002
Figure 3. Basic BN.
Figure 3. Basic BN.
Jmse 11 00688 g003
Figure 4. The DBN. (a) Prior network, (b) Transfer network, (c) DBN inference.
Jmse 11 00688 g004
Figure 5. Fatigue crack DBN model of riser.
Jmse 11 00688 g005
Figure 6. RAO.
Figure 6. RAO.
Jmse 11 00688 g006
Figure 7. Riser fatigue damage.
Jmse 11 00688 g007
Figure 8. Effect of t on fatigue damage.
Jmse 11 00688 g008
Figure 9. Effect of Ca on fatigue damage.
Jmse 11 00688 g009
Figure 10. Effect of C on fatigue damage.
Jmse 11 00688 g010
Figure 11. Effect of Cd on fatigue damage.
Jmse 11 00688 g011
Figure 12. Parameter sensitivity analysis of fatigue damage.
Jmse 11 00688 g012
Figure 13. The BN model.
Jmse 11 00688 g013
Figure 14. The DBN of fatigue failure.
Jmse 11 00688 g014
Figure 15. Riser fatigue failure probability.
Jmse 11 00688 g015
Figure 16. DBN model with inspection results.
Jmse 11 00688 g016
Figure 17. Parameter updating in the 20th year. (a) Updated t, (c) Updated failure probability, (b) Updated Ca.
Jmse 11 00688 g017
Table 1. Dynamic response analysis parameters.
ParametersValue
Length of each deepwater riser 22.86 m
Length of deepwater riser system1531.62 m
Riser outer diameter0.5334 m
Wall thickness22.225 mm
Top tension6 MN
Element number of single riser20
Time step size0.02
Table 2. Wave conditions.
Sea condition number123456
Wave height (m)1.232.583.914.955.956.53
Wave period (s)3.54.55.56.577.5
Probability of occurrence (%)3.9913.4838.3232.5610.641.01
Table 3. Random parameters distributions.
ParametersDistributionMean (μ)COV
Wall thickness tNormal22.225 mm0.05
Additional mass coefficient CaLognormal10.05
S–N curve coefficient CLognormal1.023 × 10120.05
Drag force coefficient CdNormal10.05
Table 4. Data for the response surface model of fatigue.
Variable number12345
Wall thickness t (mm)22.22520.55820.55823.89223.892
Additional mass coefficient Ca10.9251.0750.9251.075
Fatigue damage0.0024760.0030560.0038390.0016830.002266
Table 5. Verification of the data-driven model of fatigue.
Variable number12345
Wall thickness t (mm)22.22521.11421.11423.33623.336
Additional mass coefficient Ca10.951.050.951.05
Data-driven models0.0024540.0028240.0032740.0018420.002292
Physical-based models0.0024760.0027350.0032980.0019090.002363
Relative error0.1222%4.391%1.588%2.714%1.003%
Table 6. Basic parameters for fatigue reliability analysis.
VariableDistributionMeanCOV
S–N curve parameter CConstant1.023 × 1012-
Fracture mechanics parameter mConstant3-
Fracture mechanics parameter C0Constant2.3 × 10−12-
Crack depth a0Normal1 mm0.1
Additional mass coefficient CaLog-normal10.2
Wall thickness tNormal22.225 mm0.05
Disclaimer/Publisher’s Note: The statements, opinions and data contained in all publications are solely those of the individual author(s) and contributor(s) and not of MDPI and/or the editor(s). MDPI and/or the editor(s) disclaim responsibility for any injury to people or property resulting from any ideas, methods, instructions or products referred to in the content.

