Article

The Effect of the Fillets on Submarine Wake Field and Propeller Unsteady Bearing Force

1
School of Civil and Architectural Engineering, Hainan University, Haikou 570228, China
2
National Key Laboratory of Transient Physics, Nanjing University of Science and Technology, Nanjing 210094, China
*
Author to whom correspondence should be addressed.
J. Mar. Sci. Eng. 2023, 11(4), 727; https://doi.org/10.3390/jmse11040727
Submission received: 22 February 2023 / Revised: 14 March 2023 / Accepted: 25 March 2023 / Published: 27 March 2023
(This article belongs to the Special Issue Offshore Installations and Wave Power Generation)

Abstract

:
The uniformity of the wake on the submarine propeller disk is the key factor affecting the vibration and noise performance of the propeller. To study the influence of the fillets on the uniformity of submarine wake field and propeller unsteady bearing force, the submarine resistance calculation and self-propulsion calculation were carried out using the Detached-Eddy Simulation (DES) method. The characteristics of the wake field and hydrodynamic performance of the original and improved plan were compared and analyzed in detail. The fillets improve the wake distribution at the propeller disk by reducing the horseshoe vortex, and the fillets mainly affect the flow field characteristics of the inner radius area. The fillets can effectively reduce the axial velocity pulsation and improve the quality of the wake field. The frequency–domain curve shows that the bearing force and torque pulsation value of the improved plan are smaller than that in the original one, indicating that the fillets are conducive to controlling the vibration and noise performance of the submarine propeller. The results show that the fillets can effectively improve the flow field quality in the wake fields and reduce the propeller unsteady bearing force.

1. Introduction

As technology advances, submarine performances in various aspects, such as speed, diving depth, armament, and propulsion, can be improved. However, the improvement of anti-submarine technology has forced countries to accelerate the development of detecting underwater noise, and the submarine’s underwater concealment has been challenged unprecedentedly [1]. Therefore, navies and research institutions around the world are working tirelessly to promote the development of submarine quieting technology and have developed a series of noise reduction measures to improve the submarine’s stealth as much as possible. Applying “quieting” technology to submarines has become the mainstream of contemporary submarine development.
The main noise of submarines is divided into two types: radiated noise and self-noise, both of which are generated by the submarine’s noise sources and are closely related. The radiated noise of submarines mainly comes from various mechanical vibrations on the submarine body, propeller rotation, fluid slapping during submarine navigation, and air noise inside the cabin radiating out through the hull, which is detected in the water at a certain distance from the submarine’s surface. In general, mechanical vibration noise and propeller noise account for the majority of radiated noise, while hydrodynamic noise has a significant impact on the submarine’s self-noise. Propeller noise is a major noise source during submarine navigation, because the propeller rotates at high speed, which causes uneven radial loading on the blades, resulting in singing and vibration.
The propeller works at the tail of the submarine; the unevenness of the flow field will cause the propeller blade to emit discrete noise. On the basis of ensuring the maneuverability and safety of the submarine, the design of the rudder on the submarine also needs to consider the uniformity of the submarine’s tail flow field. Currently, the research on submarine rudder mainly focuses on the hydrodynamic performance of the rudder and its effect on the maneuverability of the submarine, while there is less research on the impact of the submarine rudder on the tail flow field. The existence of the rudder makes the flow field at the propeller plane have a strong radial unevenness, which will cause the propeller to oscillate during rotation, causing a loss of hydrodynamics and making the propeller noise increase [2].
When the submarine is moving underwater, vortices will be induced on the upper edge of the end surface of tail fin and on the top surface of the body due to flow separation and reattachment. Additionally, "necklace-shaped" vortices will be induced on the body’s leading edge at the location of the horseshoe vortices downstream. The generation of these vortices will certainly affect the uniformity of the flow field at the propeller plane, and when the flow field at the propeller plane is unstable, the noise of the propeller will be higher, and the propulsion efficiency of the propeller will be reduced. Since the distance between the tail control surface and the propeller is relatively close, the flow field at the propeller plane is greatly disturbed, causing the propeller to vibrate when it rotates and resulting in hydrodynamic loss and increased propeller noise [3,4,5]. Du et al. analyzed the vortex distribution in the flow field around the submarine under various conditions. The calculation results indicate that there are vortices at the rear of the four tail fins and the angle between the tail fins, the number, shape, and intensity of the vortices change with the drifting angle and the degree of uniformity of the flow field [6]. Li et al. changed the shape and arrangement of the submarine tail fins and used computational fluid dynamics (CFD) methods to simulate the tail flow of the submarine. The results show that, for the tail flow field under different layout positions of the cruciform rudder and “X” rudder, the forward movement of the rudder position improves the tail flow field, while the full-body submarine “X” rudder tail control surface reduces the unevenness of the flow field at the propeller plane [7]. Bai and Lu made significant modifications to the stabilizer wing based on the SUBOFF standard boat model and used CFD methods to conduct an analysis of the impact of the body on the submarine resistance and tail flow field. The stabilizer wing resulted in a significant increase in the submarine’s pressure drag and is also the main reason for the unevenness of the flow field at the propeller plane [8]. Zhai and Liu studied the tail flow field quality of the co-wing-type rudder and non-co-wing-type rudder under the influence of the hull. The results showed that the co-wing type rudder can significantly reduce the vortex flow at the combination of the rotating rudder and the stabilizer wing and improve the fluid velocity in the low-speed area of the tail flow behind the rudder. At the same time, if the maximum thickness of the local isogonal rudder is reduced, the tail flow field can be further improved, and the rudder force will not be damaged [9,10]. Lee et al. studied the tail flow of the cruciform rudder tail control surface and found that the cruciform rudder tail wing produced three vortex systems in the same direction, with the strongest vortex at the wing tip, followed by the leading edge of the wing and, finally, the trailing edge of the wing [11].
Some scholars have attempted to improve the tail flow field by designing vortex elimination devices or optimizing tail fins. Zhang et al. [12,13] studied the weakening of the vortex by filling the angle and found that installing a filling angle or designing a three-dimensional flowline on the vertical shell can significantly improve the flow quality in the shell region, effectively suppressing the horseshoe vortices. Liu et al. [14,15,16,17] designed a vortex elimination and straightening plate based on the characteristics of the horseshoe vortices at the main body junction. The vortex elimination and straightening plate is installed in the horseshoe vortex generation area and uses the lateral velocity component generated by the eddy on both sides of the body to produce a “secondary vortex” that is opposite to the horseshoe vortex rotation direction. These two vortices will weaken each other during their downstream development, thereby actively controlling the horseshoe vortex and improving the quality of the propeller inflow.
The sail is the largest appendage on the submarine, especially in the case of large rudder angles; the sail planes (also known as diving planes or forward fins) will have a significant impact on the tail horizontal rudder [18]. In some submarines, the resistance increment generated by the command center hull accounts for as much as 28% of the total resistance of the bare hull. The sail also affects the stability and uniformity of the submarine’s tail flow field, resulting in high low-frequency discrete noise and low-frequency broadband noise from the propeller. Liu and Huang calculated the azimuthal distribution of the axial velocity and nonuniformity coefficient for different wing types, different chord lengths, and different heights of the sail hull with the main body. Their research shows that appropriately reducing the height of the sail hull and increasing the thickness of the sail hull can make the tail flow field more uniform [19,20,21]. Gorski carried out research on the design of new style of sail hull and conducted wind tunnel tests on the flow field of newly designed sail hull [22]. Rais-Rohani and others explored the design of enclosure structures using composite materials, but research on the relationship between the tail flow field and vortex characteristics at the joint of the new enclosure has not yet been carried out [23]. Toxopeus employed CFD methods to study the structure of the typical horseshoe vortices at the connection between the sail hull and the main hull. By changing the shape of the sail hull and adding a smooth transition arc-shaped filling angle (CUFF) at the front of the connection, the formation of horseshoe vortices can be suppressed, thus reducing additional resistance and improving the quality of the tail flow field [24]. Wang et al. adopted turbulence model of SST k-ω based on Reynolds Average Navier–Stokes (RANS) method to calculate the wake field of three new types of submarine hulls and analyze the development of the junction vortex and the wake field along the hull. The results show that the sail hull with smooth transition of the leading edge changes the distribution of vorticity at the propeller surface, which effectively suppresses the occurrence of tip vortex by improve the wake structure [25]. Liu et al. and Sheng et al. took SUBOFF as a model to explore the optimization law of the line form of the sail hull. The results show that sail hulls in the shape of sand dunes and the inclined wall can reduce the amplitude of axial velocity fluctuation at the propeller disk surface and improve the uniformity of the wake field [26,27]. Zhang et al. proved that the tip leakage vortex is the cause of the pulsating pressure of the pump-jet propeller by studying the spectral characteristics of the pulsating force and pointed out that the uniformity of the flow field has a significant impact on the pulsating pressure [28]. Su et al. (2022) used the coupled finite element method (FEM) and the direct boundary element method (BEM) to calculate the vibro-acoustic response of the pump-jet shaft-underwater coupling system and studied the influence of the duct (including the distributed pressure on the duct and the vibration transmission characteristics) on the acoustic radiation [29]. Zhang et al. (2022) used the RANS method to explain the excitation force generation mechanism of submarine thrusters with uniformly spaced and nonuniformly spaced rotor blades [30]. Hou Xingyu et al. (2023) studied the effect of random turbulence on the broadband unsteady excitation force of submarine thrusters [31].
To sum up, scholars carried out plenty of detailed research on the velocity distribution and vorticity distribution of the submarine wake field. However, those studies mostly analyze the influence of the tail rudder form and vortex elimination device on the wake field from a qualitative perspective but not pay attention to the influence on propeller unsteady bearing force. In this paper, the mechanism of vortex elimination by auxiliary wing is revealed. Meanwhile, the effect of vortex elimination device on submarine propeller bearing force reduction is studied from a quantitative point of view.
In this study, the wake field and propulsion performance of the SUBOFF model equipped with DTMB4383 propeller were analyzed utilizing CFD simulations. The commercial software package STAR-CCM+ was used for grid generation and numerical simulations. This paper is organized as follows: Section 2 provides the simulation details. The mesh verification procedures are described in Section 3. The calculation results are compared and discussed in Section 4. Finally, the conclusions drawn from this study are summarized, and plans for future research are stated.

2. Simulation Details

2.1. Governing Equations

For incompressible flow, the RANS equation can be expressed as
u i x i = 0
u i t + x j u i u j = p x i + τ i j x j + S i
where ui and uj (i, j = 1, 2, 3) represent the time-averaged velocity components, p is the time-averaged pressure, and Si is the general source term of the momentum equation. The Reynolds stress tensor τij is defined as
τ i j = v t Re ( u i x j + u j x i 2 3 u i x i δ i j )
where the turbulent viscosity vt can be expressed in terms of an intermediate variable v ˜ as v t = v ˜ f v 1 χ . Here, χ = v ˜ v , and f v 1 = χ 3 χ 3 + c v 1 3 is a dumping function. The intermediate variable v ˜ can be calculated using the following dimensionless transport equation based on the Spalart–Allmaras turbulent model [32]:
v ˜ t + u j v ˜ x j = c b 1 S ˜   v ˜ + 1 Re σ x i 1 + v ˜ v ˜ x i + c b 2 ( v ˜ x i ) 2 c w 1 f w Re ( v ˜ y ) 2
where S ˜ = S + 1 R e v ˜ k 2 y 2 f v 2 and f v 2 = 1 χ 1 + χ f v 1 . The parameter f w is given by f w = g 1 + c w 3 6 g 6 + c w 3 6 1 / 6 , where g = r + c w 2 r 6 r and r = 1 R e v ˜ S ˜ k 2 y 2 . The constants used in the above equation are c v 1 = 7.1, c b 1 = 0.1355, σ = 2/3, c b 2 = 0.622, k = 0.41, c w 1 = c b 1 k 2 + 1 + c b 2 / σ , c b 2 = 0.3, and c w 2 = 2.
When employing the Spalart–Allmaras model, the production and destruction of turbulent viscosity at each point in the computational domain is determined by the distance to the nearest wall (i.e., the parameter y in Equation (4). Spalart [33] stated that the DES can be modified by replacing y with a new length scale d, defined by
d = min ( d , C DES Δ )
Based on the above equation, the length scale used for solving the near-wall field in the Spalart–Allmaras model is the new wall distance d. In this case, the model is functioning in a RANS-like mode. At locations far away from the wall, the length scale is converted to an LES-like filter width that is related to the dimension of the mesh Δ by a constant CDES. Different expressions of Δ have been proposed in the literature. In this work, the most primitive expression is adopted.
Δ = max ( Δ x , Δ y , Δ z )

2.2. Numerical Models

The siding mesh method was used to simulate propeller rotation. The three-dimensional viscous flow field is solved using the finite volume method based on the segregated flow solver in the STAR-CCM+ computational fluid dynamics code.
In DES, the coupling of the pressure and velocity is solved using the SIMPLE algorithm. Second-order upwind, center-difference, and second-order implicit time-discrete schemes are used to determine the convection, diffusion, and time terms, respectively. In addition, when performing unsteady DES, the Courant–Friedrichs–Lewy (CFL) condition is used to balance the time and spatial scales during the calculation. The CFL number is defined by
C F L = Δ t U / Δ min
where U is the magnitude of the local velocity and Δmin = min (Δx, Δy, Δz). According to the minimal spacing in the mesh, the time step used in the DES simulation must satisfy the requirement that CFL < 1.0.

2.3. Test Case

The SUBOFF model equipped with a DTMB4383 propeller is employed in this study with a scale factor of 1:24. The geometric characteristics are summarized in Table 1 and Table 2.
The calculation objects in this paper include the original model and the improved model (with fillets), as shown in Figure 1. Each model includes two calculation conditions that consist of submarine resistance calculation (without propeller) and self-propulsion calculation (with propeller), which correspond to the calculations of the wake field and the unsteady bearing force of the propeller. The calculation conditions are summarized in Table 3.
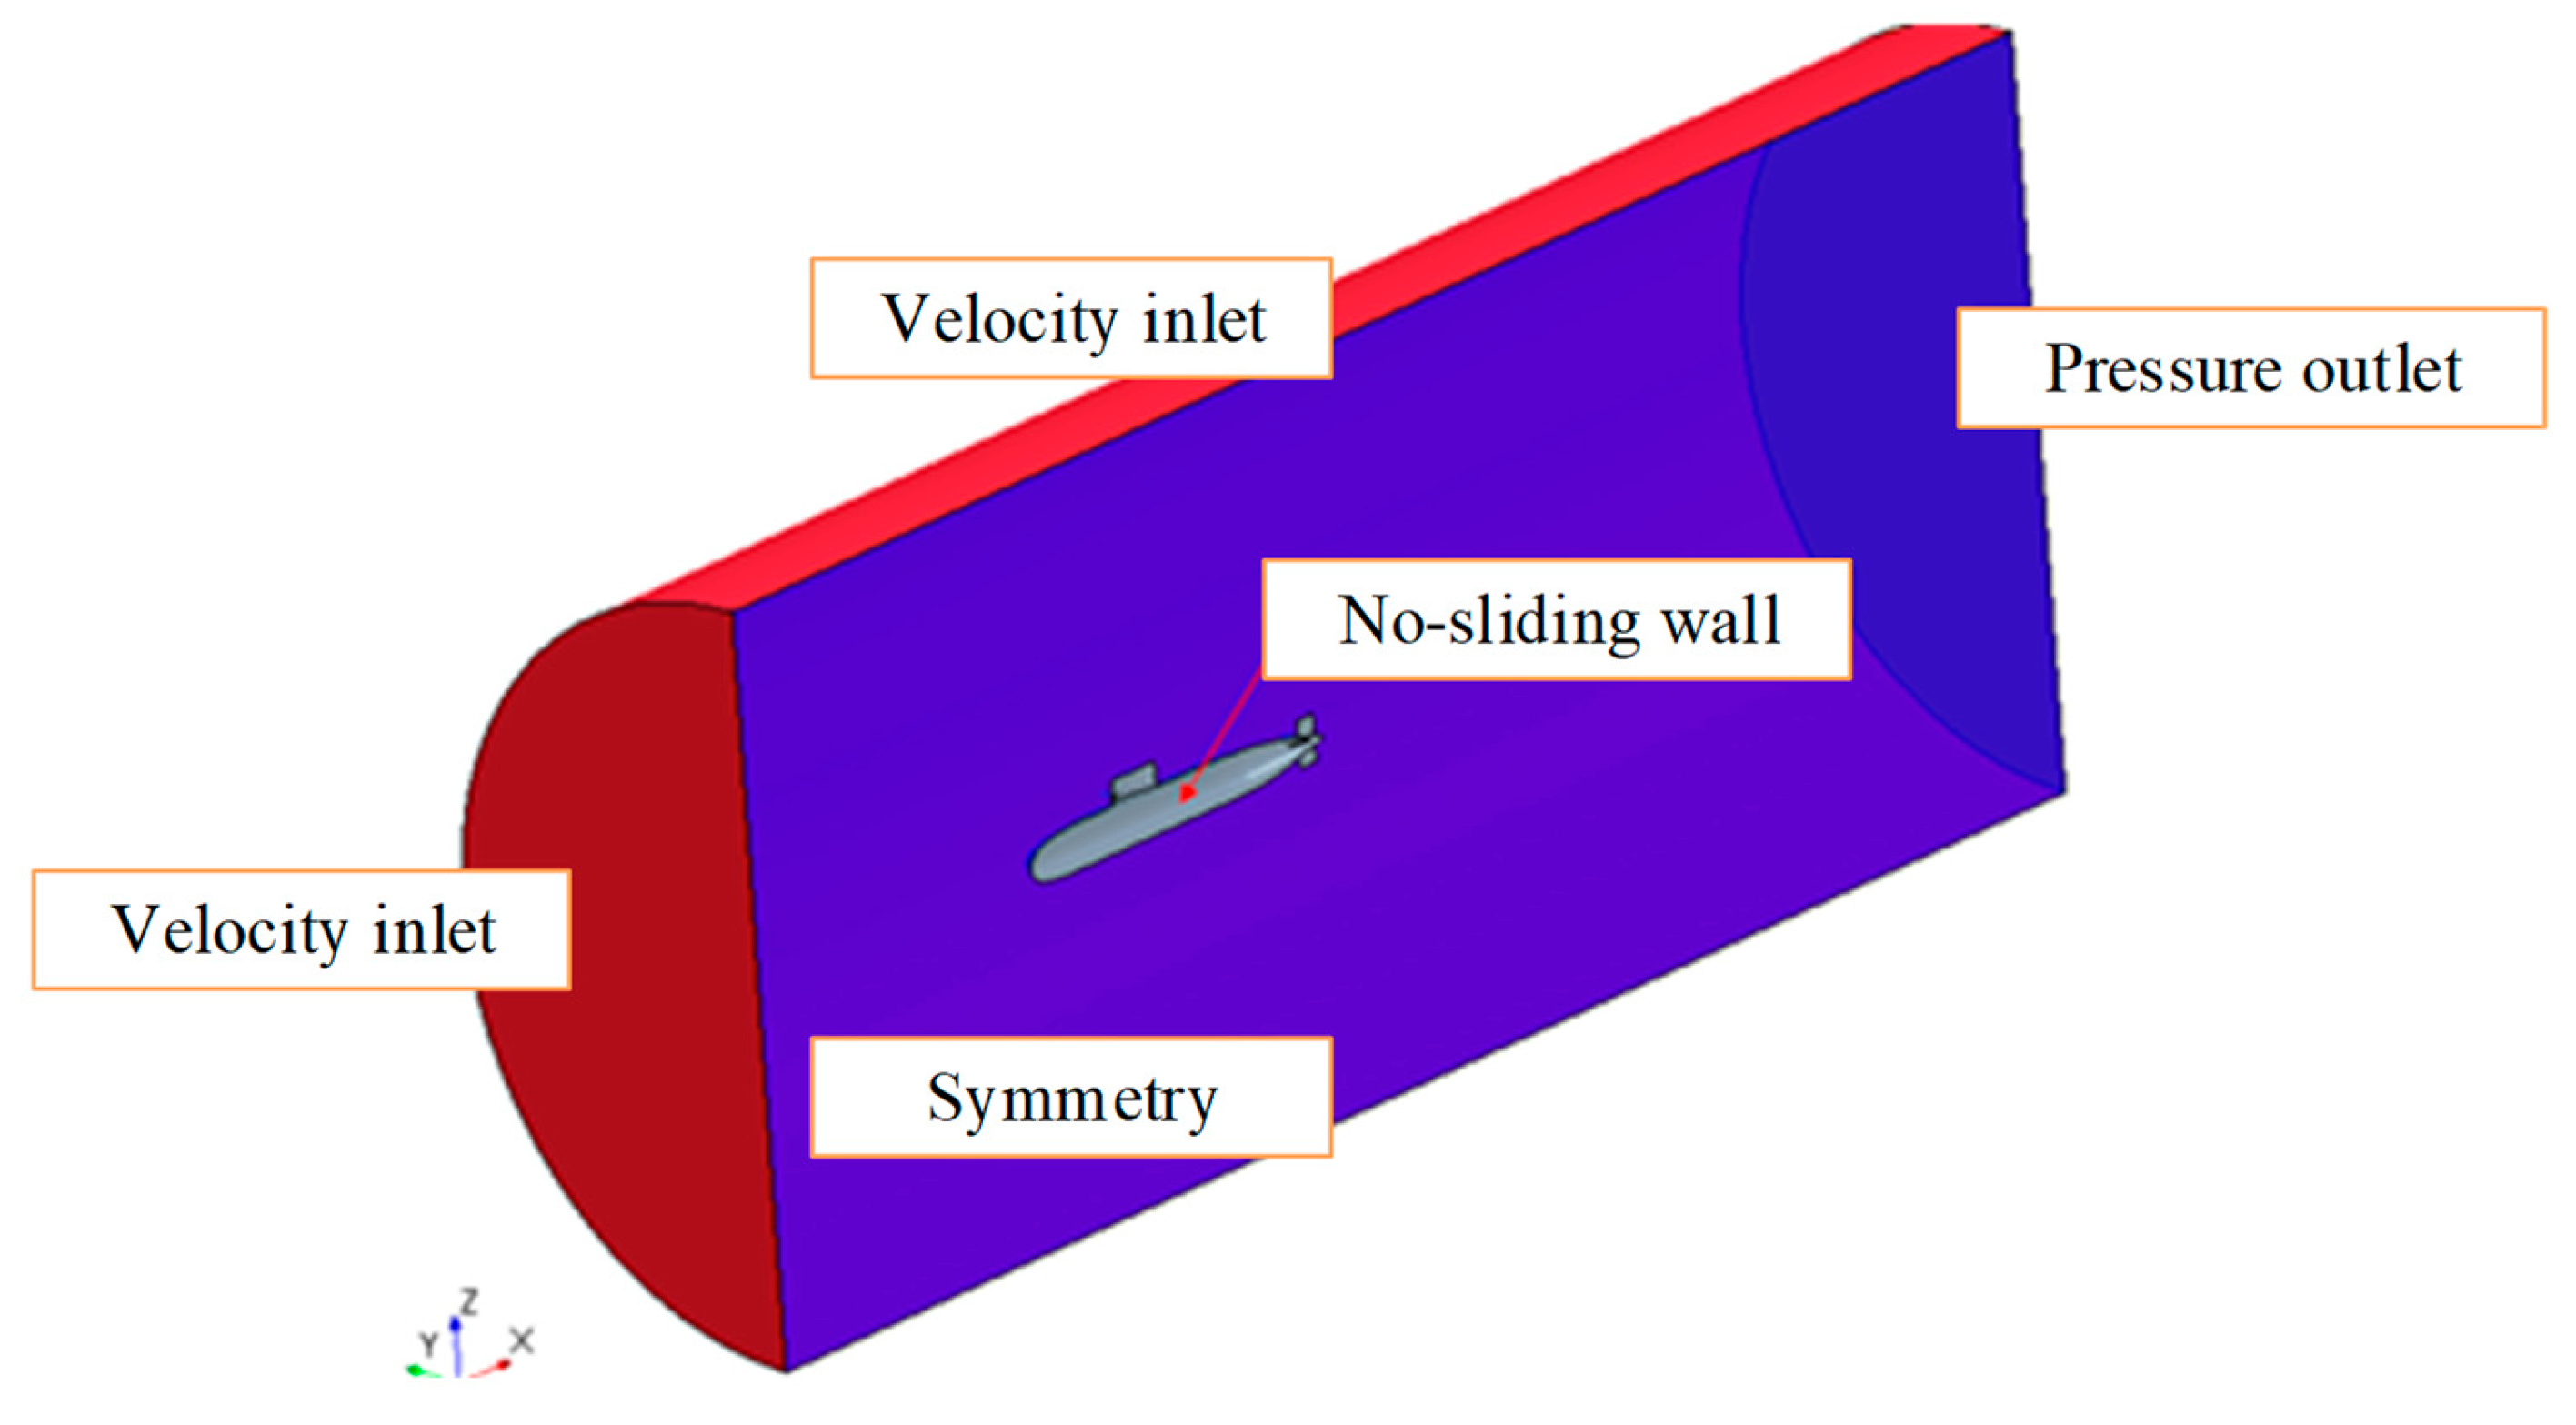
The calculation domain of the flow field is shown in Figure 2. The velocity inlet is 1 LOA (length over all) from the bow, the pressure outlet is 2.5 LOA from the stern, and the radius of the cylindrical boundary domain is 1 LOA. The velocity inlet and the pressure outlet are set as the boundary conditions. The velocity inlet is used at the far field to eliminate the influence of the boundary. A semi-computational domain of flow field and a symmetry boundary condition are used for calculations to reduce the grid size and improve the calculation efficiency. The inlet and the outlet of the computational domain are respectively set as the velocity inlet and pressure outlet. The incoming flow velocity is given as 3.05 m/s, and the circumferential boundary is set for symmetry. The semi-domain cannot be used in the calculations of the integrated submarine hull and propeller, but the full cylindrical computational flow field is employed. The sliding grid technique is used for the model of propeller rotation. The rotational speed of the propeller is 515 rpm. The SIMPLEC method is used for the pressure and velocity iterative coupling computations, in which the convection term is discretized using the second-order upwind scheme, and the dissipation term is discretized using the second-order central difference scheme.

3. Mesh Verification

3.1. Meshing

In CFD calculations, mesh discretization usually takes a lot of time and efforts. A reasonable mesh layout can improve both the convergence efficiency and the calculation accuracy. In this paper, STAR-CCM+ is used as the mesh generation tool, and the surface mesh of the hull and appendage models are reconstructed. By controlling the mesh size through basic dimensions and relative dimensions, high-quality surface meshes are generated. On this basis, unstructured meshes are generated by selecting boundary layer and cut volume mesh generators [34,35]. The reasonable distribution of the boundary layer mesh is related to the accuracy of the numerical calculation results. Volume refinements (size = 4%D and size = 2%D) are implemented in the hull surface and tails, respectively. The blade surfaces are refined along the feature lines of the leading and trailing edges (size = 1%D). The mesh size at the boundary layer can be controlled by the dimensionless quantity Y+, which is the nondimensional distance from the hull surface to the first layer of the mesh. For models with a scale similar to the hull model, it is generally considered that Y+ values between 30 and 300 are acceptable [36]. Based on the speed range studied in this paper, the Y+ value range is maintained within this range (30–150), avoiding the transition region from the laminar to the turbulent flow, corresponding to a thickness of 0.8–1 mm for the first layer on the hull surface. To better capture the wake flow details, it is necessary to appropriately densify the tail of the submarine, especially the appendages and their surrounding areas, as shown in Figure 3.

3.2. Verification of Resistance

Three sets of meshes with different numbers (fine, medium, and, coarse meshes are defined, respectively) are used for calculations. The incoming flow velocity is given for the steady calculations of the flow field. Table 4 shows the submarine resistance of the experiment results [37] and the calculation results for different meshes, where M stands for million. The CFD means the calculation results, and the EFD means the experiment results. The error means the difference between calculation results and experiment results. It shows that, as the grid size increases, the calculation error gradually decreases. When the grid size increases to 3.85 M, the error between the calculated value and the experimental value is within 5%. As the grid size further increases, the calculation results do not change too much, so it is considered that the medium grid satisfies the calculation requirements.
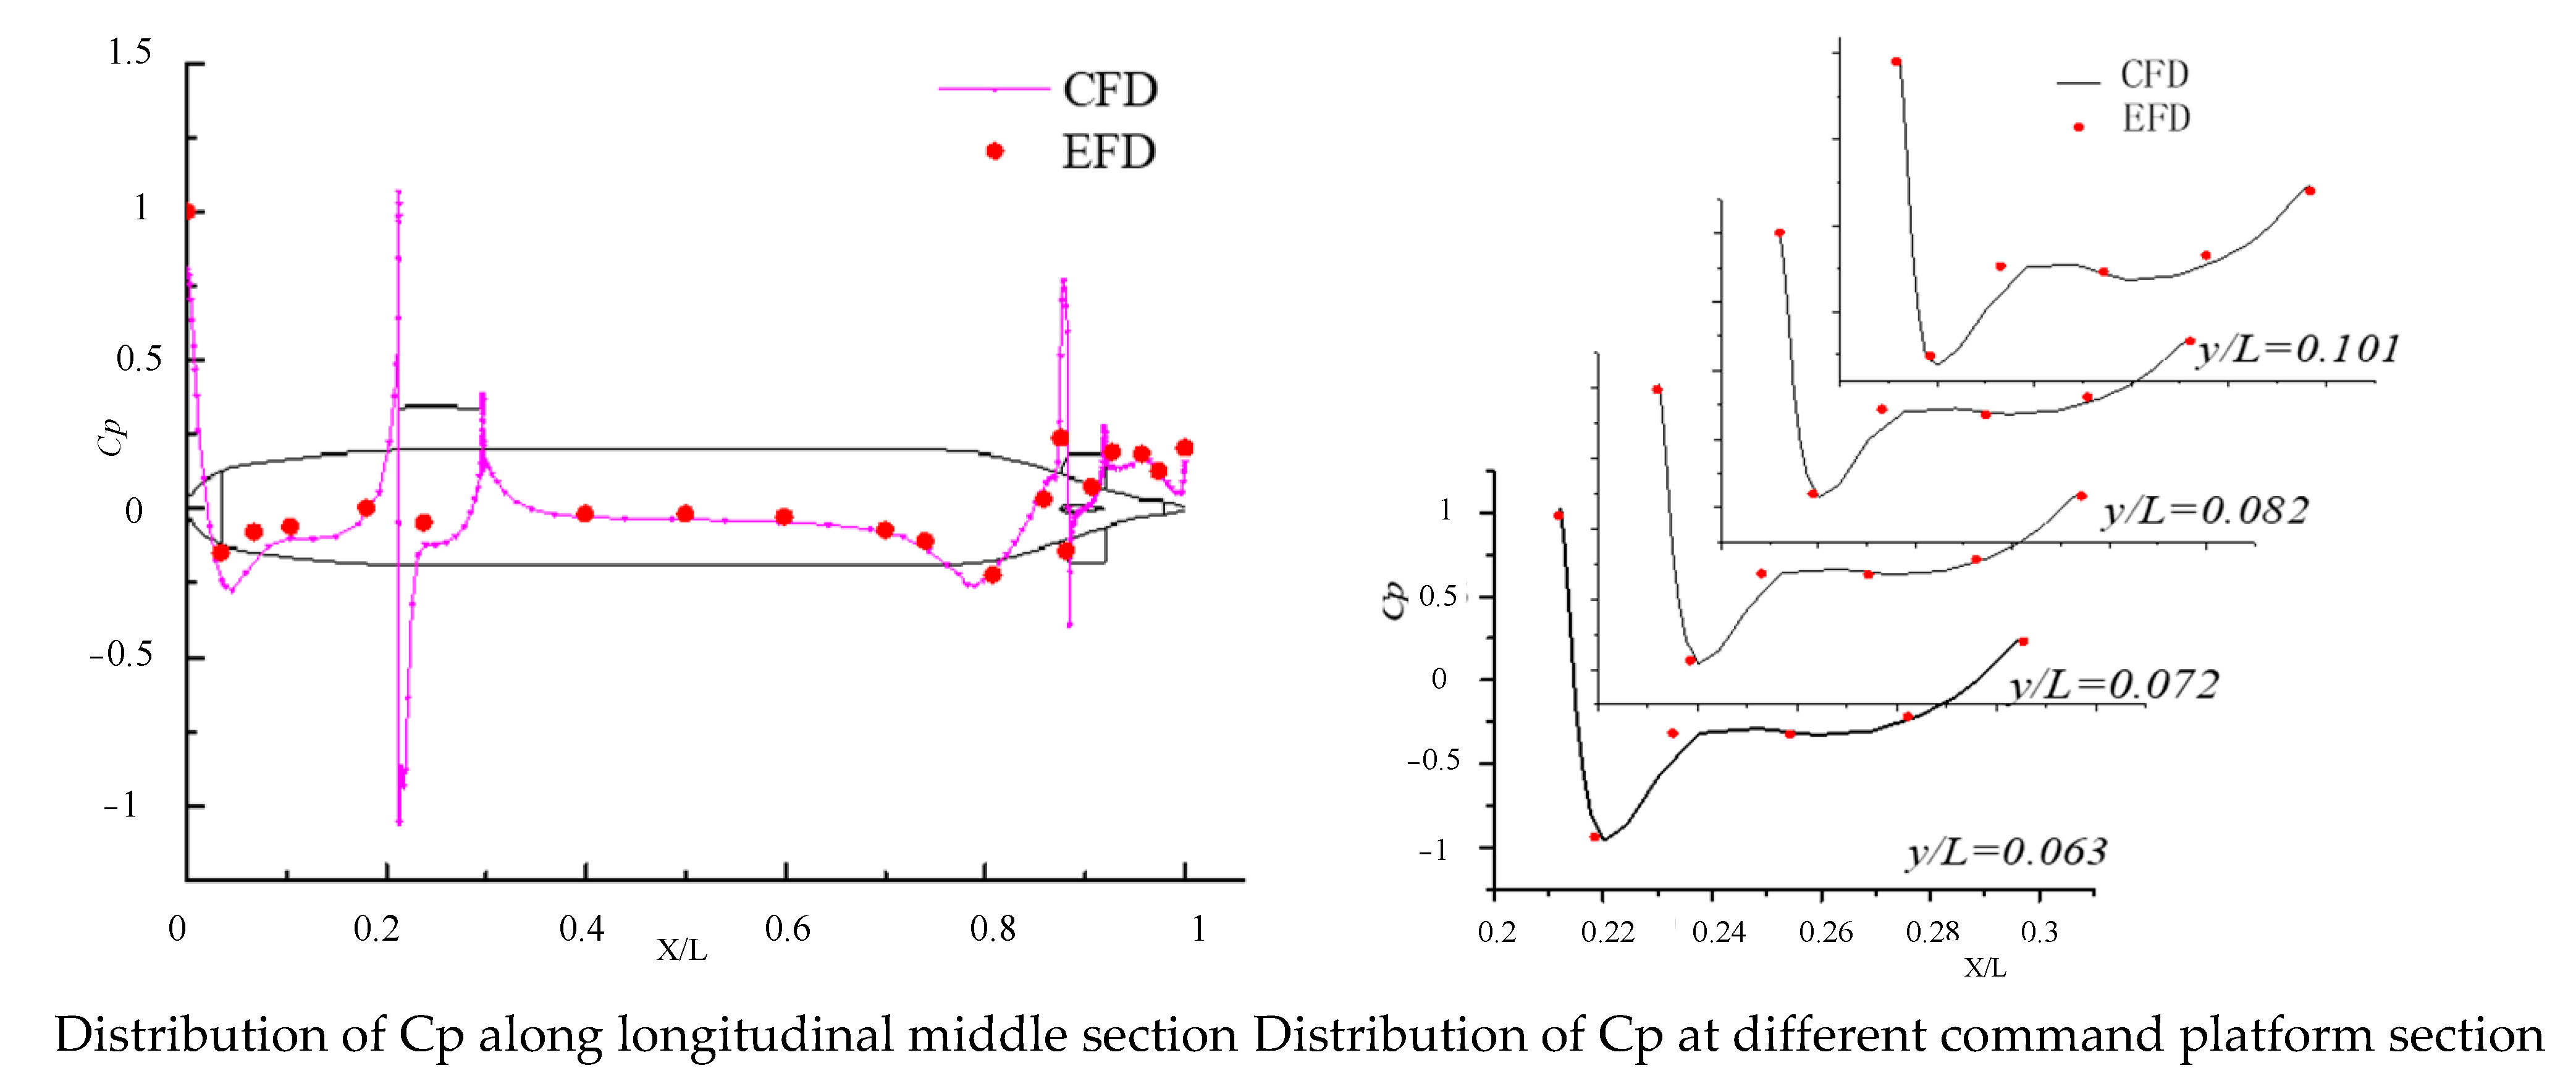
In order to further verify the accuracy of the calculation, the pressure distribution along the central longitudinal section on the upper edge of the submarine hull with whole appendages, and the sections along the waterline direction of the sail were extracted for the medium grid results. The calculated results were compared with the experimental results, as shown in Figure 4. The calculated pressure coefficient distribution on the central longitudinal section of the submarine and the pressure coefficient distribution on various sections of the sail are in good agreement with the experimental values. The high-pressure areas on the surface of the submarine are located at the bow, the front edge of the sail, and the front edge of the tail fin. This is because the fluid speed is very low in these three parts, and when the fluid flows through these parts, the speed will increase and the pressure will decrease according to the law of Bernoulli’s equation, and the curves in the figure also reflect this characteristic. Overall, the calculation accuracy of the submarine resistance and surface pressure distribution is high.

3.3. Verification of Wake Flow

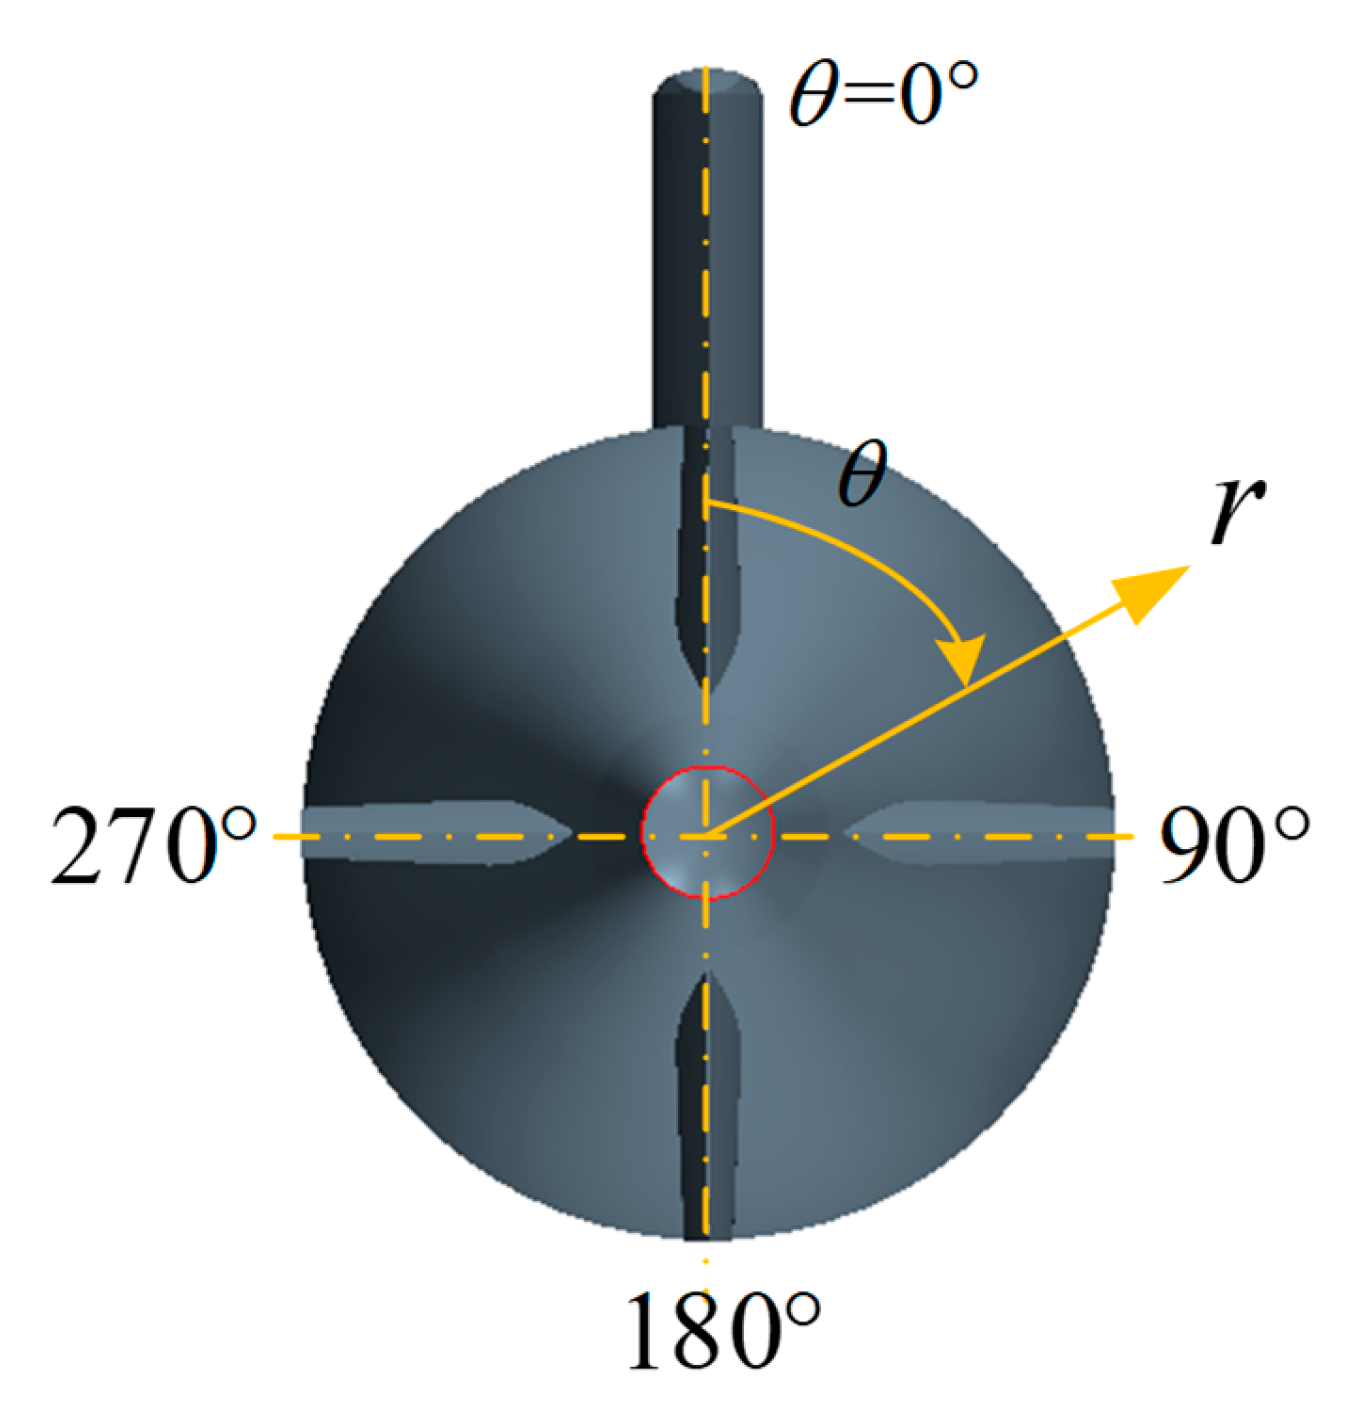
In order to verify the accuracy of the flow field calculation, the following definitions are made. U0 is the incoming flow speed, u indicates the axial velocity of the flow field, u/U0 is the dimensionless axial wake velocity, θ = 0° is the position at the top of the midline of the longitudinal section, and θ = 180° is the position at the bottom of the section, as shown in Figure 5.
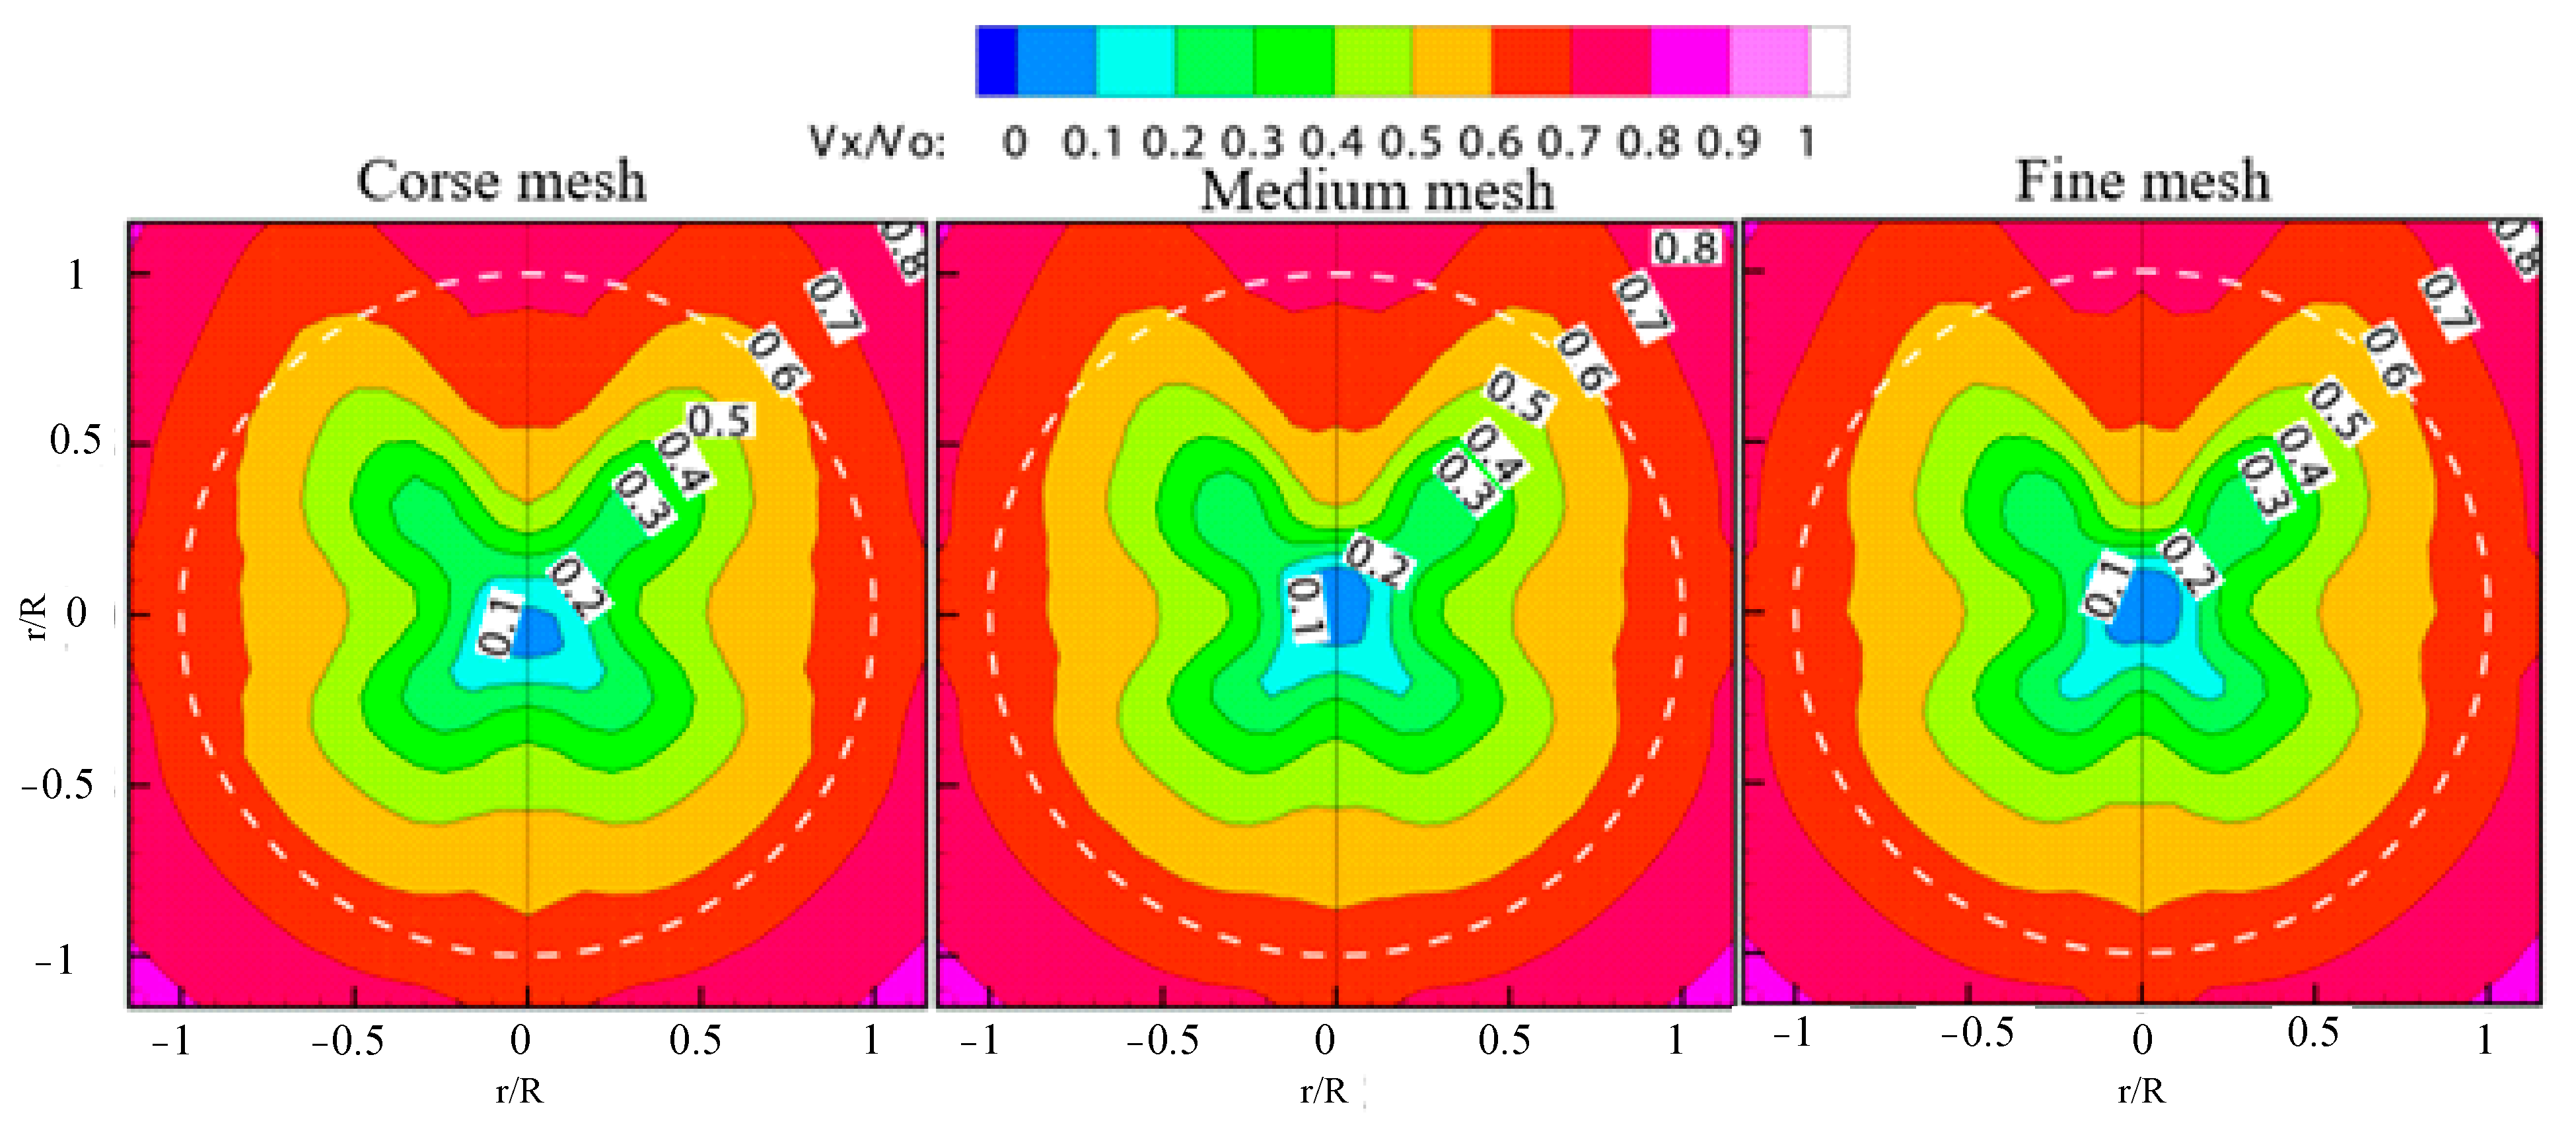
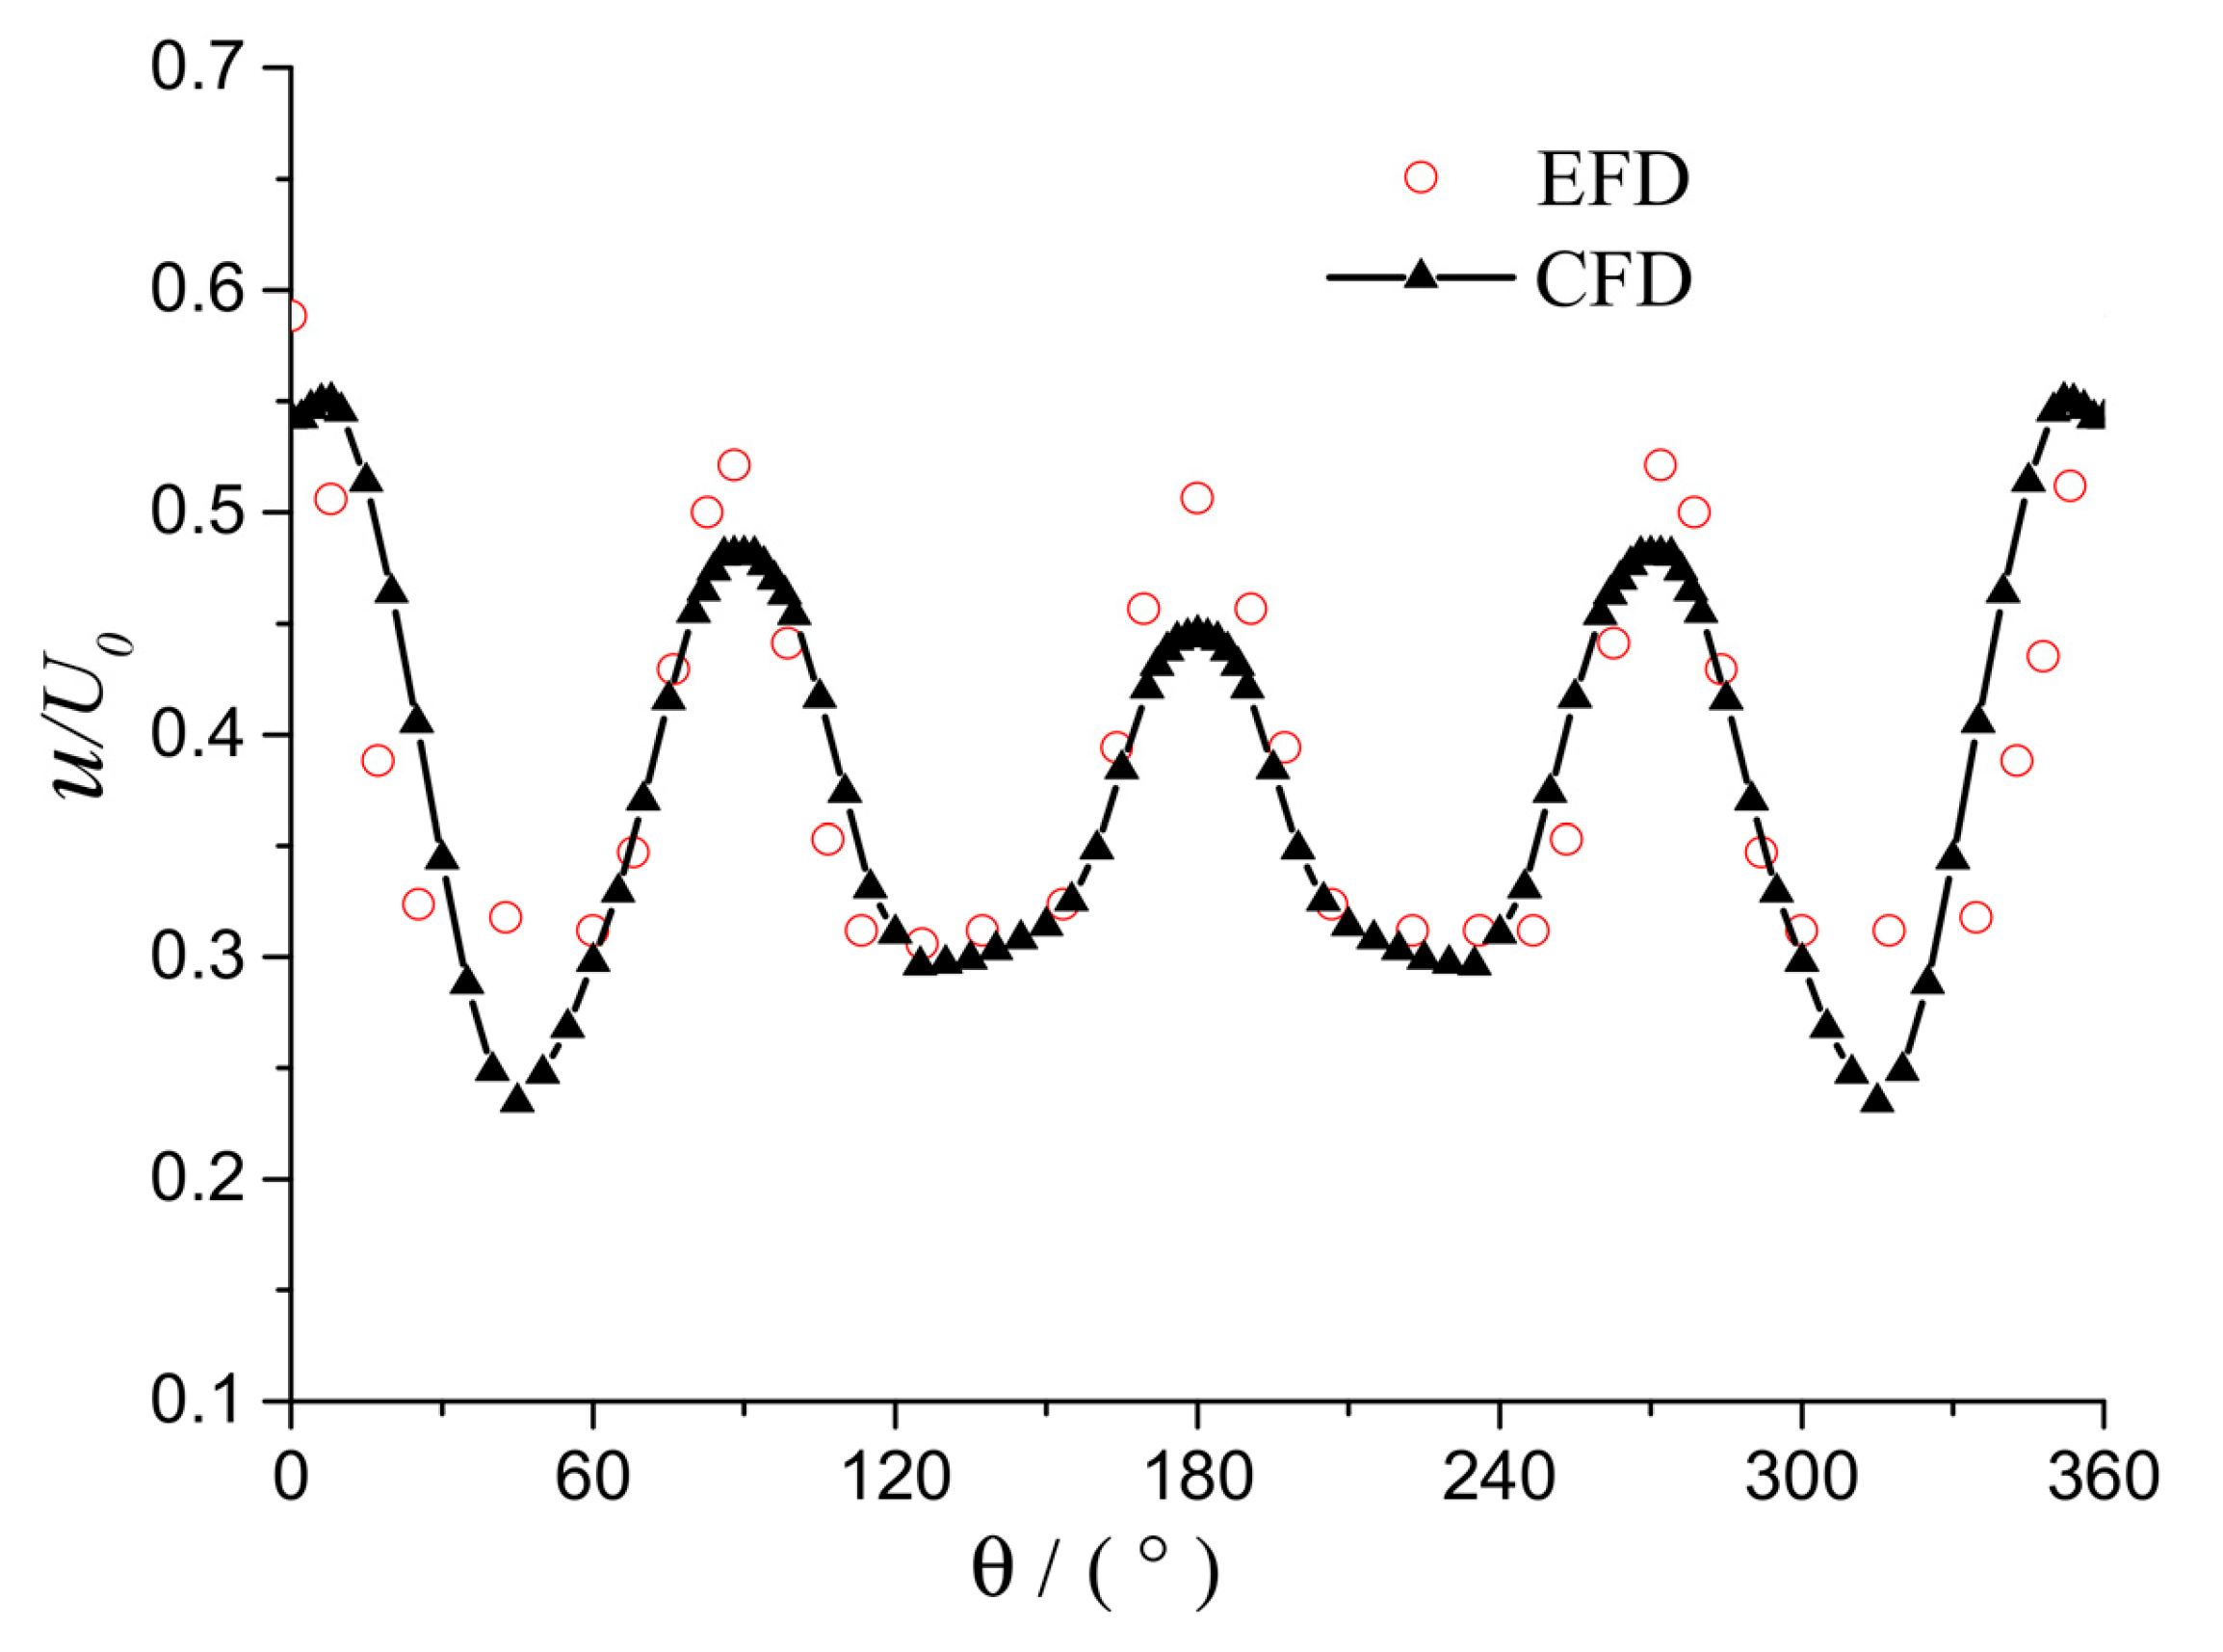
The submarine’s propeller plane is located at a distance of L/3 from the stern, where L is the length of the submarine. To extract information about the wake field at the propeller plane, different grid densities were used to calculate the contour lines of the wake field at the propeller plane, as shown in Figure 6. The contour lines obtained by different meshes are generally consistent. The closer to the surface of the hull, the smaller the velocity potential. When the radius on the propeller plane is less than 0.4R, the flow velocity at the four positions directly behind the cruciform tail fins is significantly accelerated, and when the radius is greater than 0.7R, the flow velocity at the four positions directly behind the cruciform tail fins becomes slower, especially at the circumferential angle of 180 degrees, the minimum; this is due to the obstruction effect of the stern of the cockpit. Figure 7 shows the calculation results of the axial wake fraction at the 0.45R radius of the plane compared to the experimental value. From Figure 7, the flow velocity at the four positions directly behind the cruciform tail fins is the fastest, with the highest at the position of 180 degrees; this is because the front cockpit causes the incoming flow velocity to increase slightly.

4. Results Analysis and Discussion

4.1. Distribution of Velocity

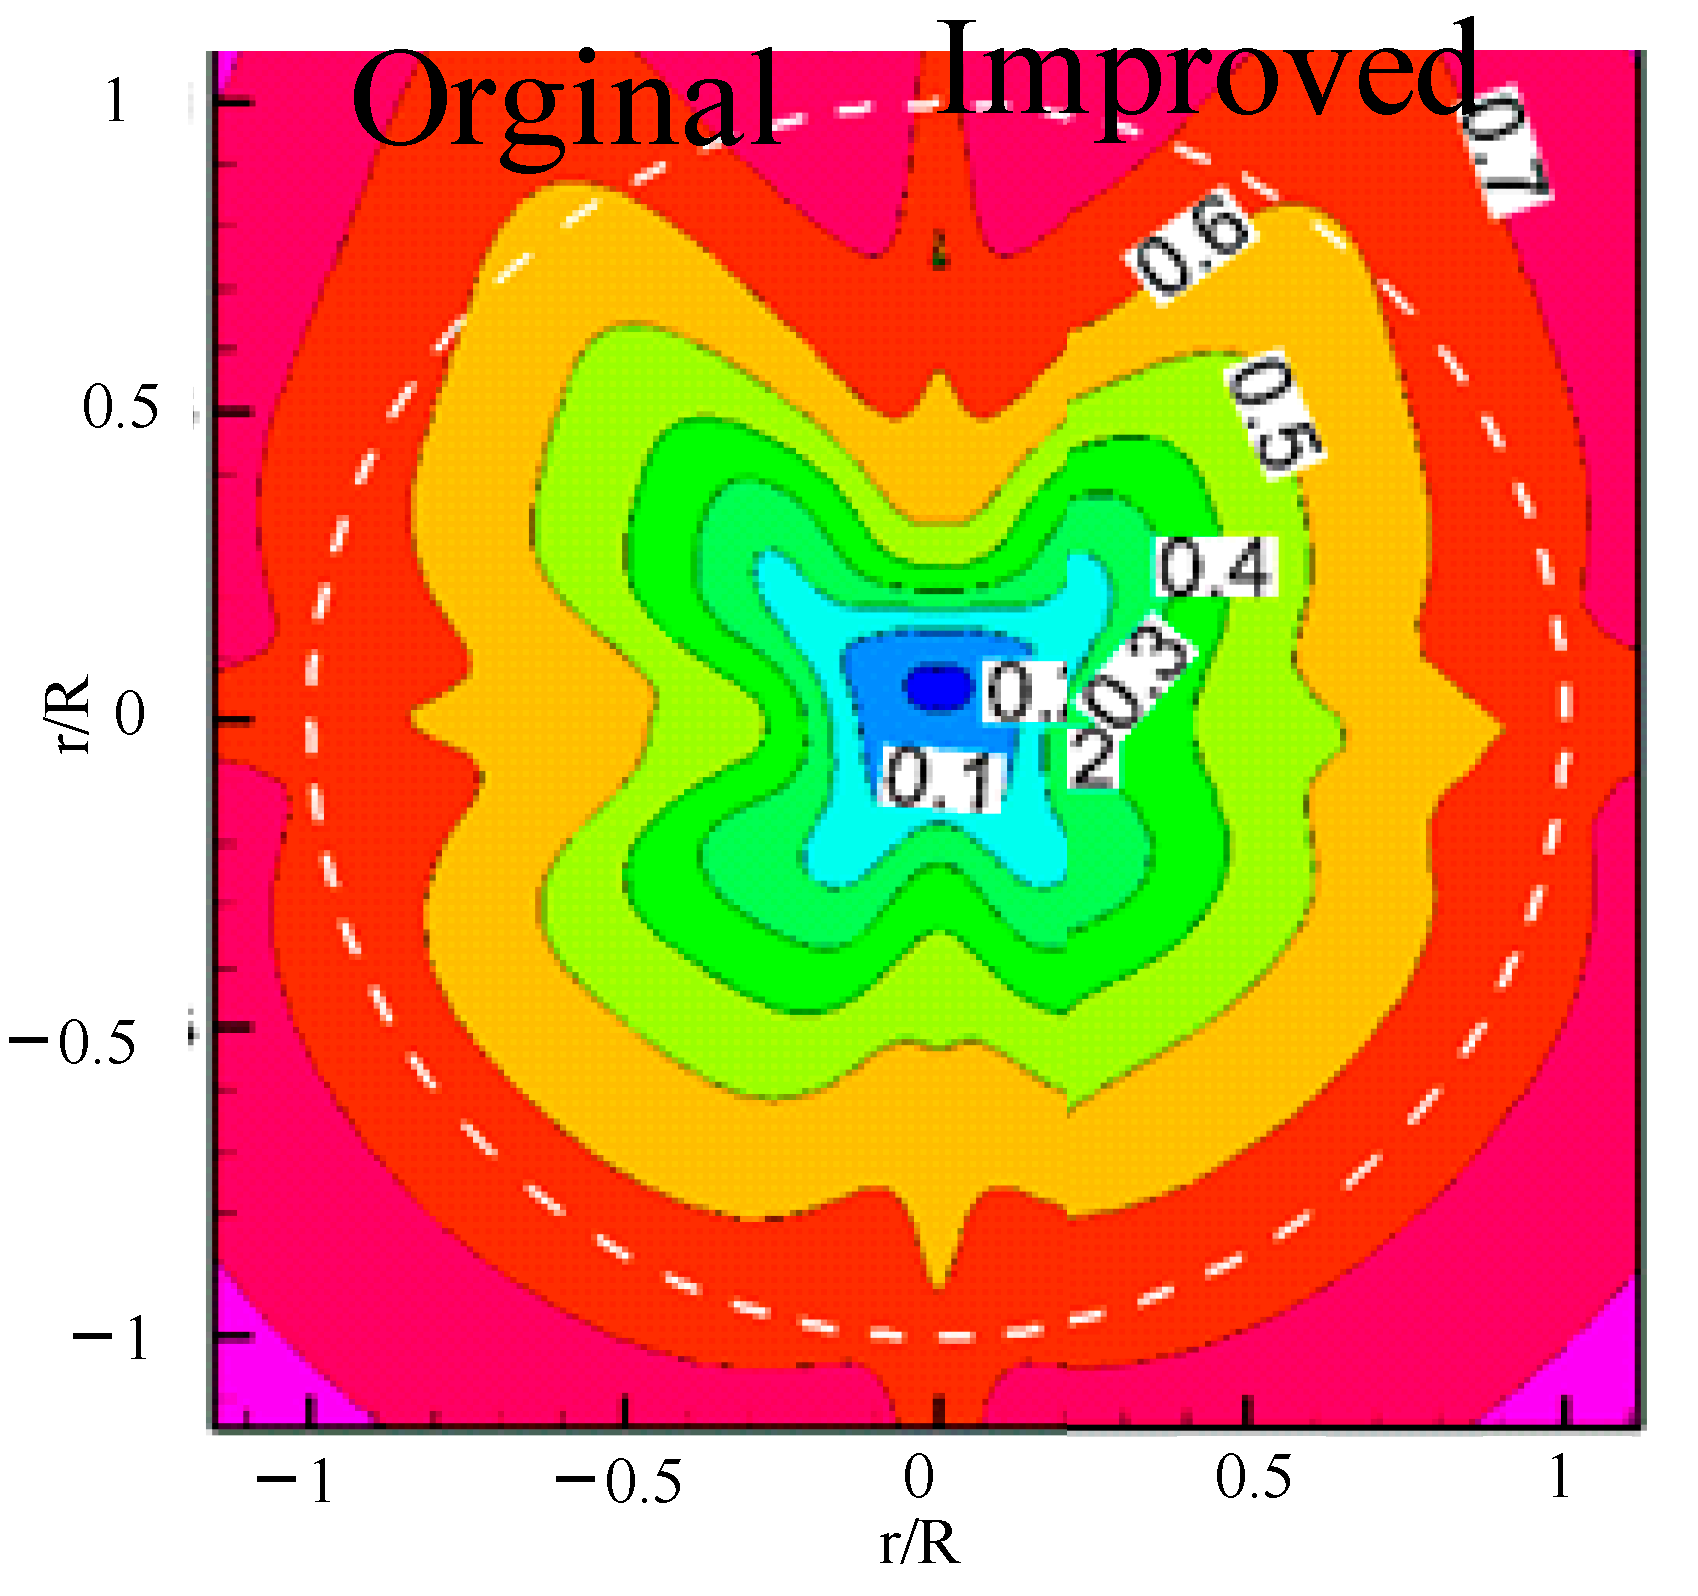
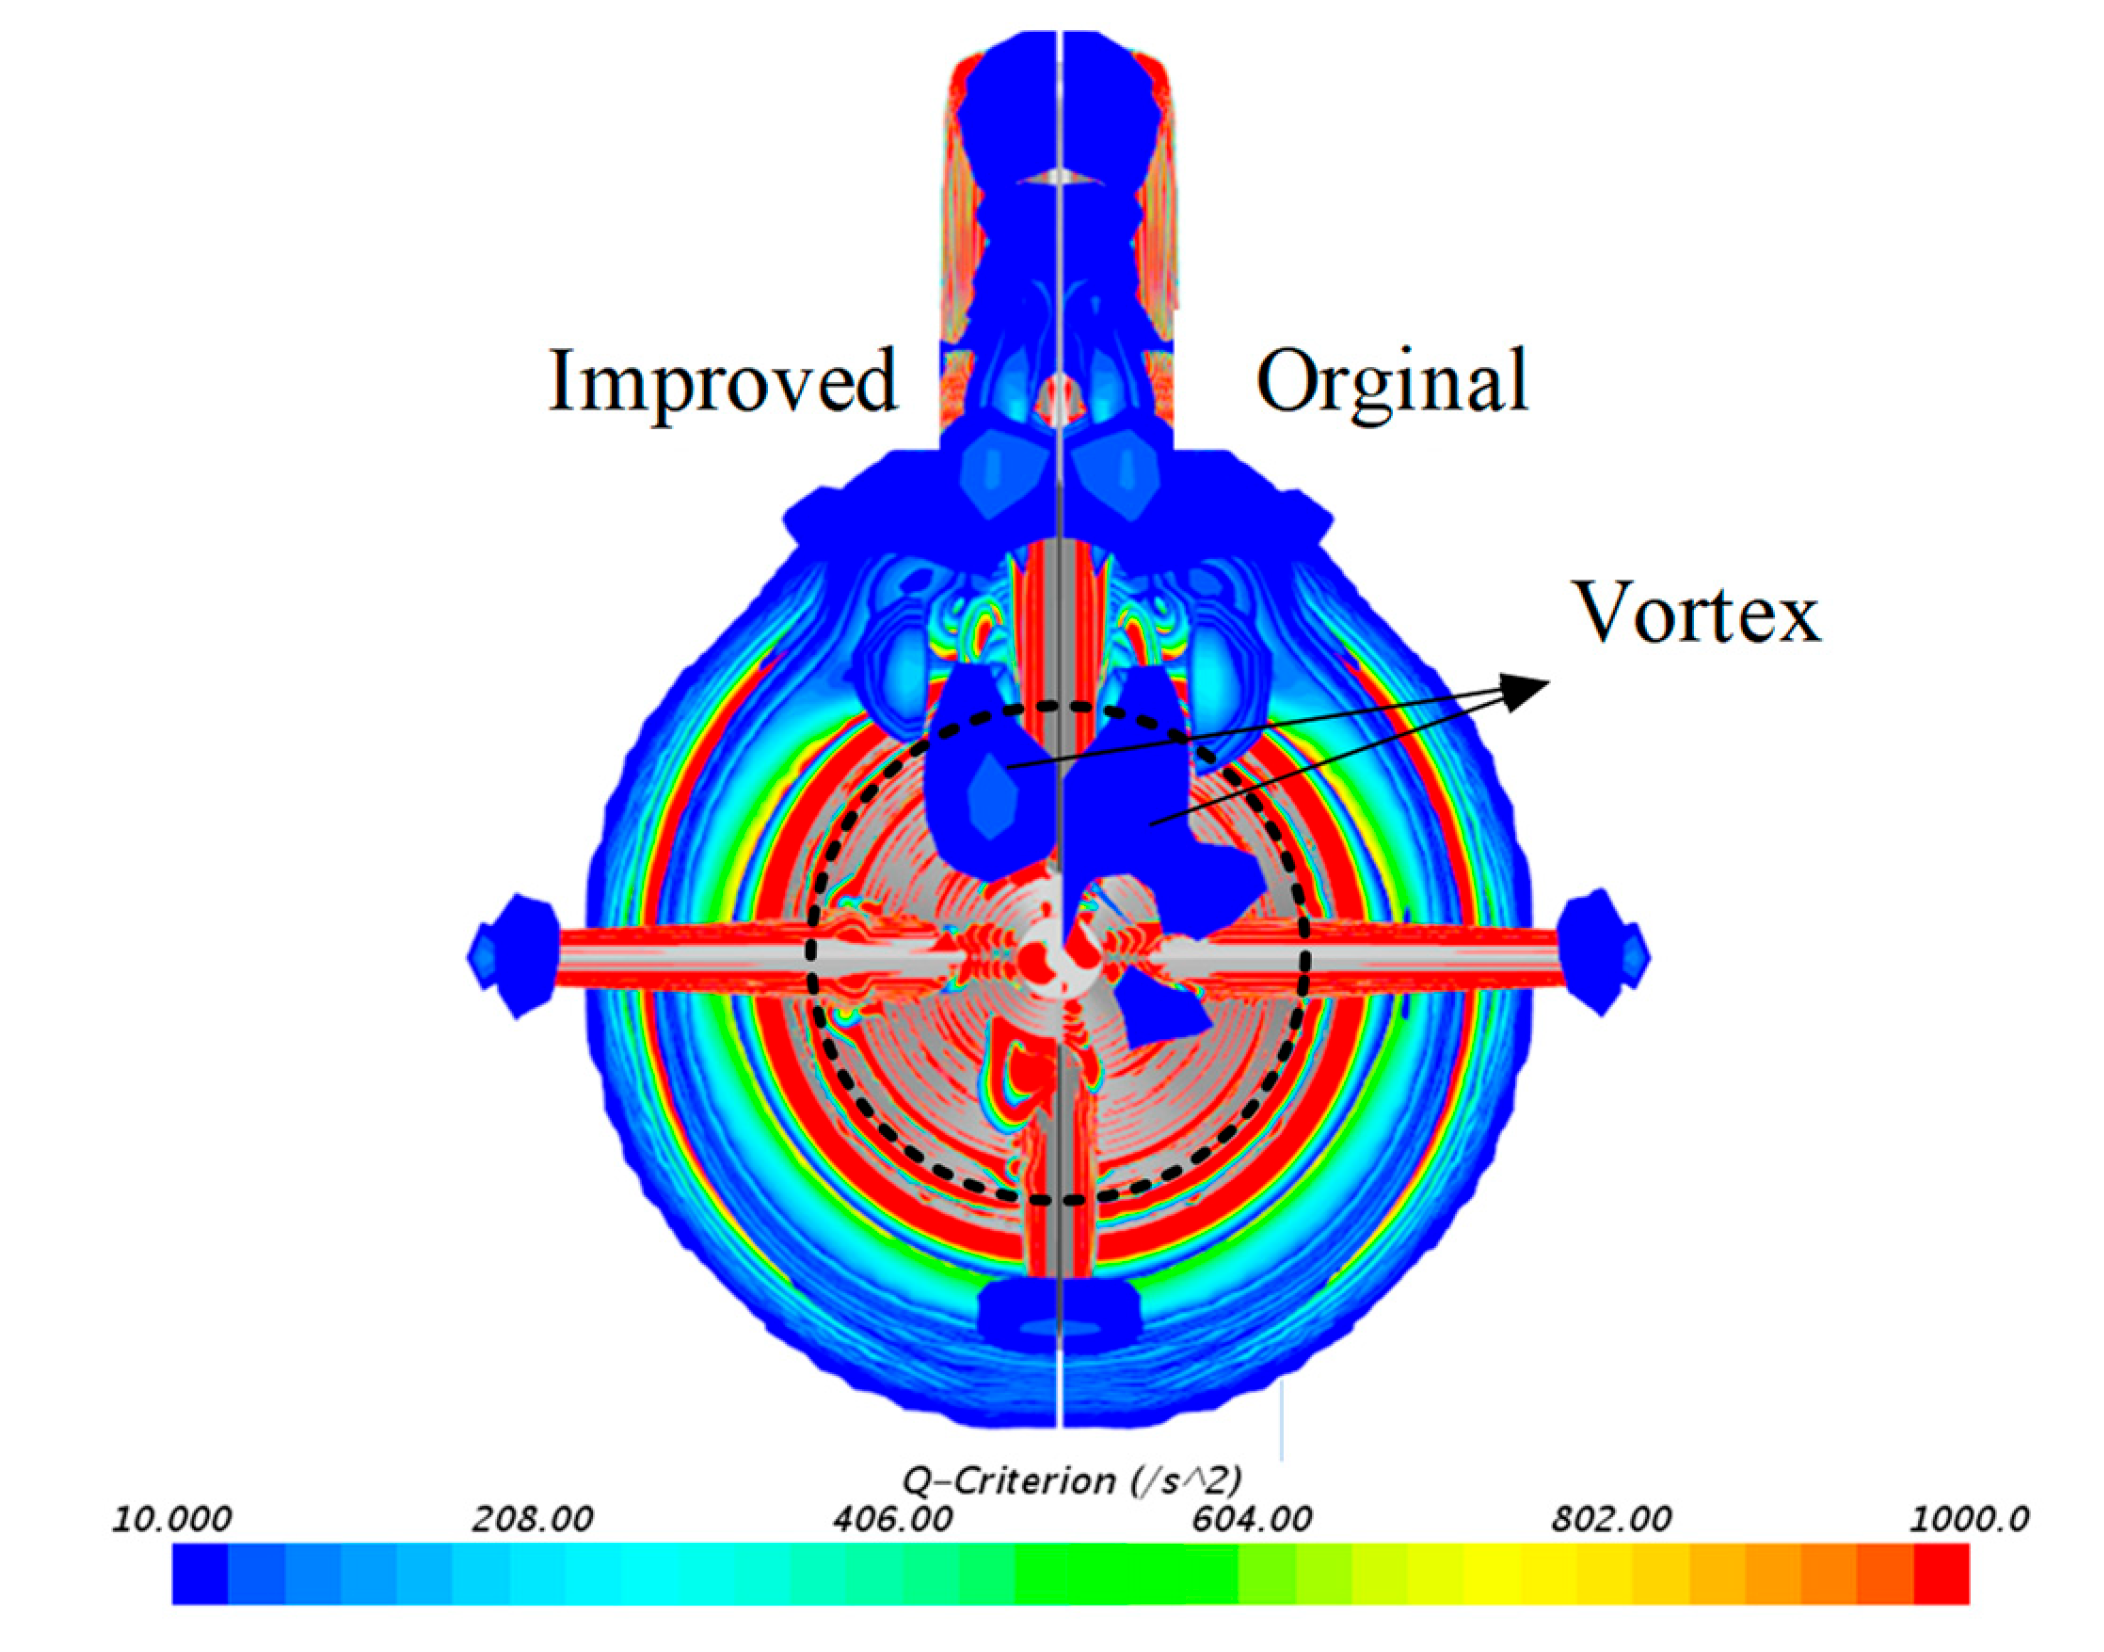
Figure 8 shows contour plots for the axial velocity on the propeller plane for different designs, with the white dotted line representing the propeller radius. It can be seen that the axial velocity distribution on the outer radius is similar for all designs, with the wing mainly affecting the velocity distribution at the inner radius, particularly at the 180-degree position. Comparing the original design to the improved design, it can be seen that, in the original design, velocity contours less than 0.5 show a clear contraction at the rear of the wing, mainly caused by the horseshoe vortex released from the wing. However, the contraction at the rear of the wing is significantly reduced in the improved design. Figure 9, through the Q criterion, shows the vortex distribution around the submarine for both designs. It can be seen that, with the wing improvement, the horseshoe vortex above the propeller plane is significantly reduced, and the horseshoe vortex on the bottom side of the propeller plane disappears, showing a clear vortex suppression effect of the wing.
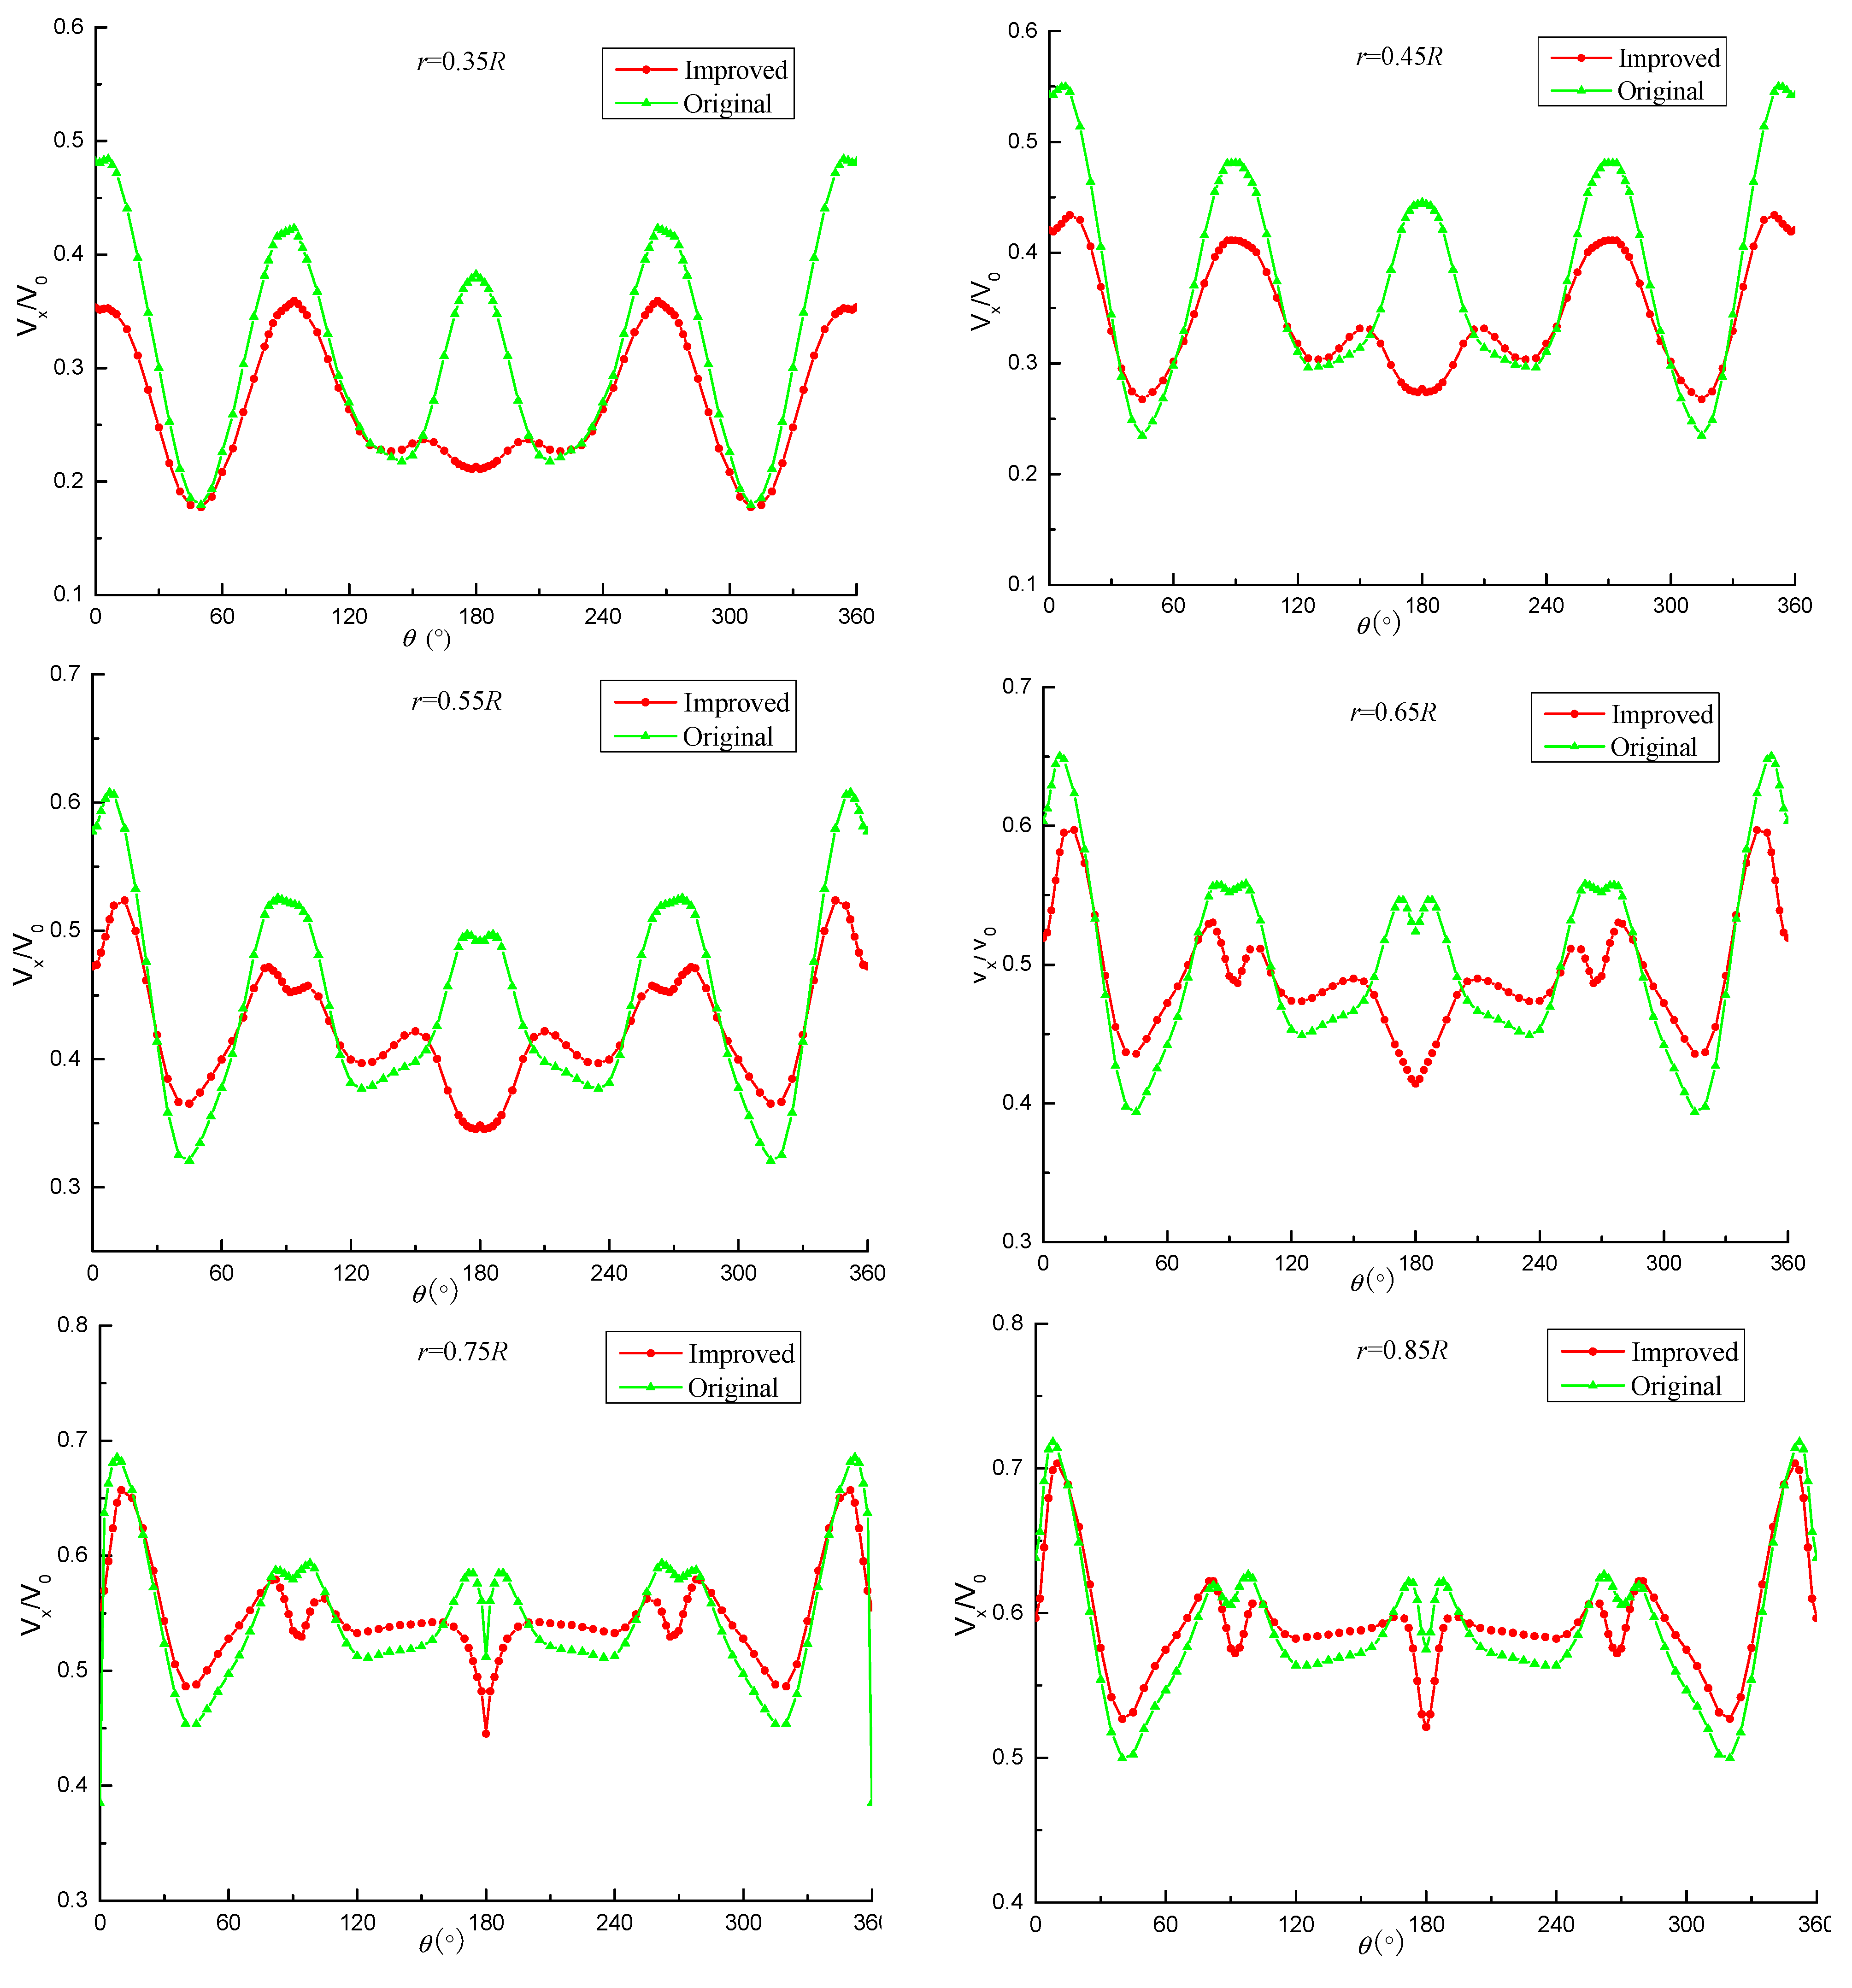
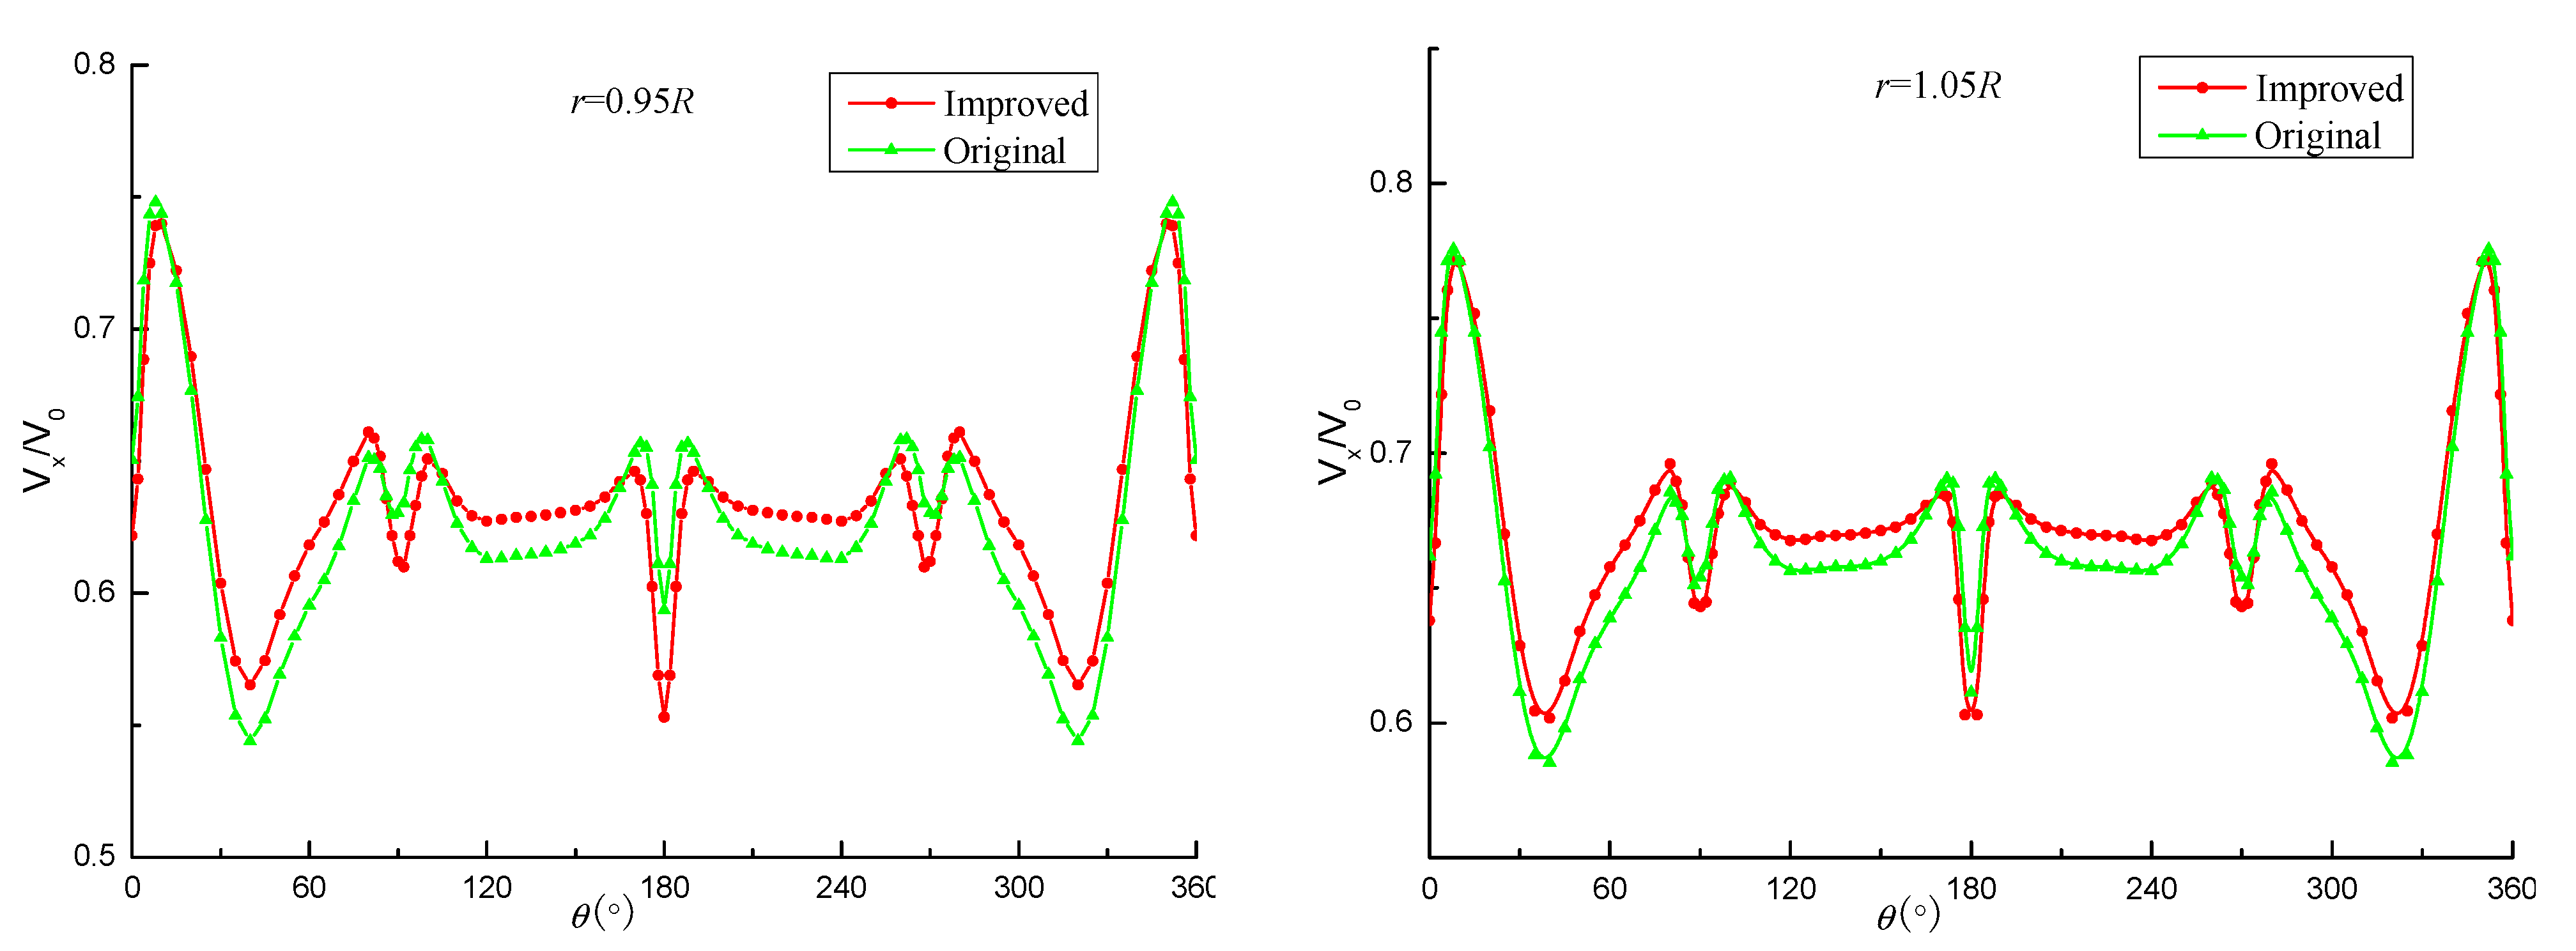
Figure 10 shows the axial velocity distribution at different radii for the two plans. It is found that at the inner radius (r/R < 0.65R), in the rear of the flap; that is, at the 0°, 90°, 180°, and 270° positions, the peak velocity of the improved plan is smaller than that of the original plan at all places. However, in the rear of 180°, there is a phase-opposite situation; that is, the original plan has a speed wave peak at this location, while the improved plan has a relatively small speed valley. It is analyzed that the velocity distribution at this location is less affected by the horseshoe vortex compared to other angles, while, at other positions, in addition to the horseshoe vortex of the flap, there is also nonuniform inflow from the console, and the vortex-canceling effect of the flap only reduces the speed peak. From a 0.75R radius, the axial velocity distribution of the improved plan is basically consistent with that of the original plan, and the amplitude of the improved plan is slightly smaller than that of the original plan. This further indicates that the flap mainly affects the velocity distribution at the inner radius, which is consistent with the previous analysis conclusion.

4.2. Uniformity of Wake Field

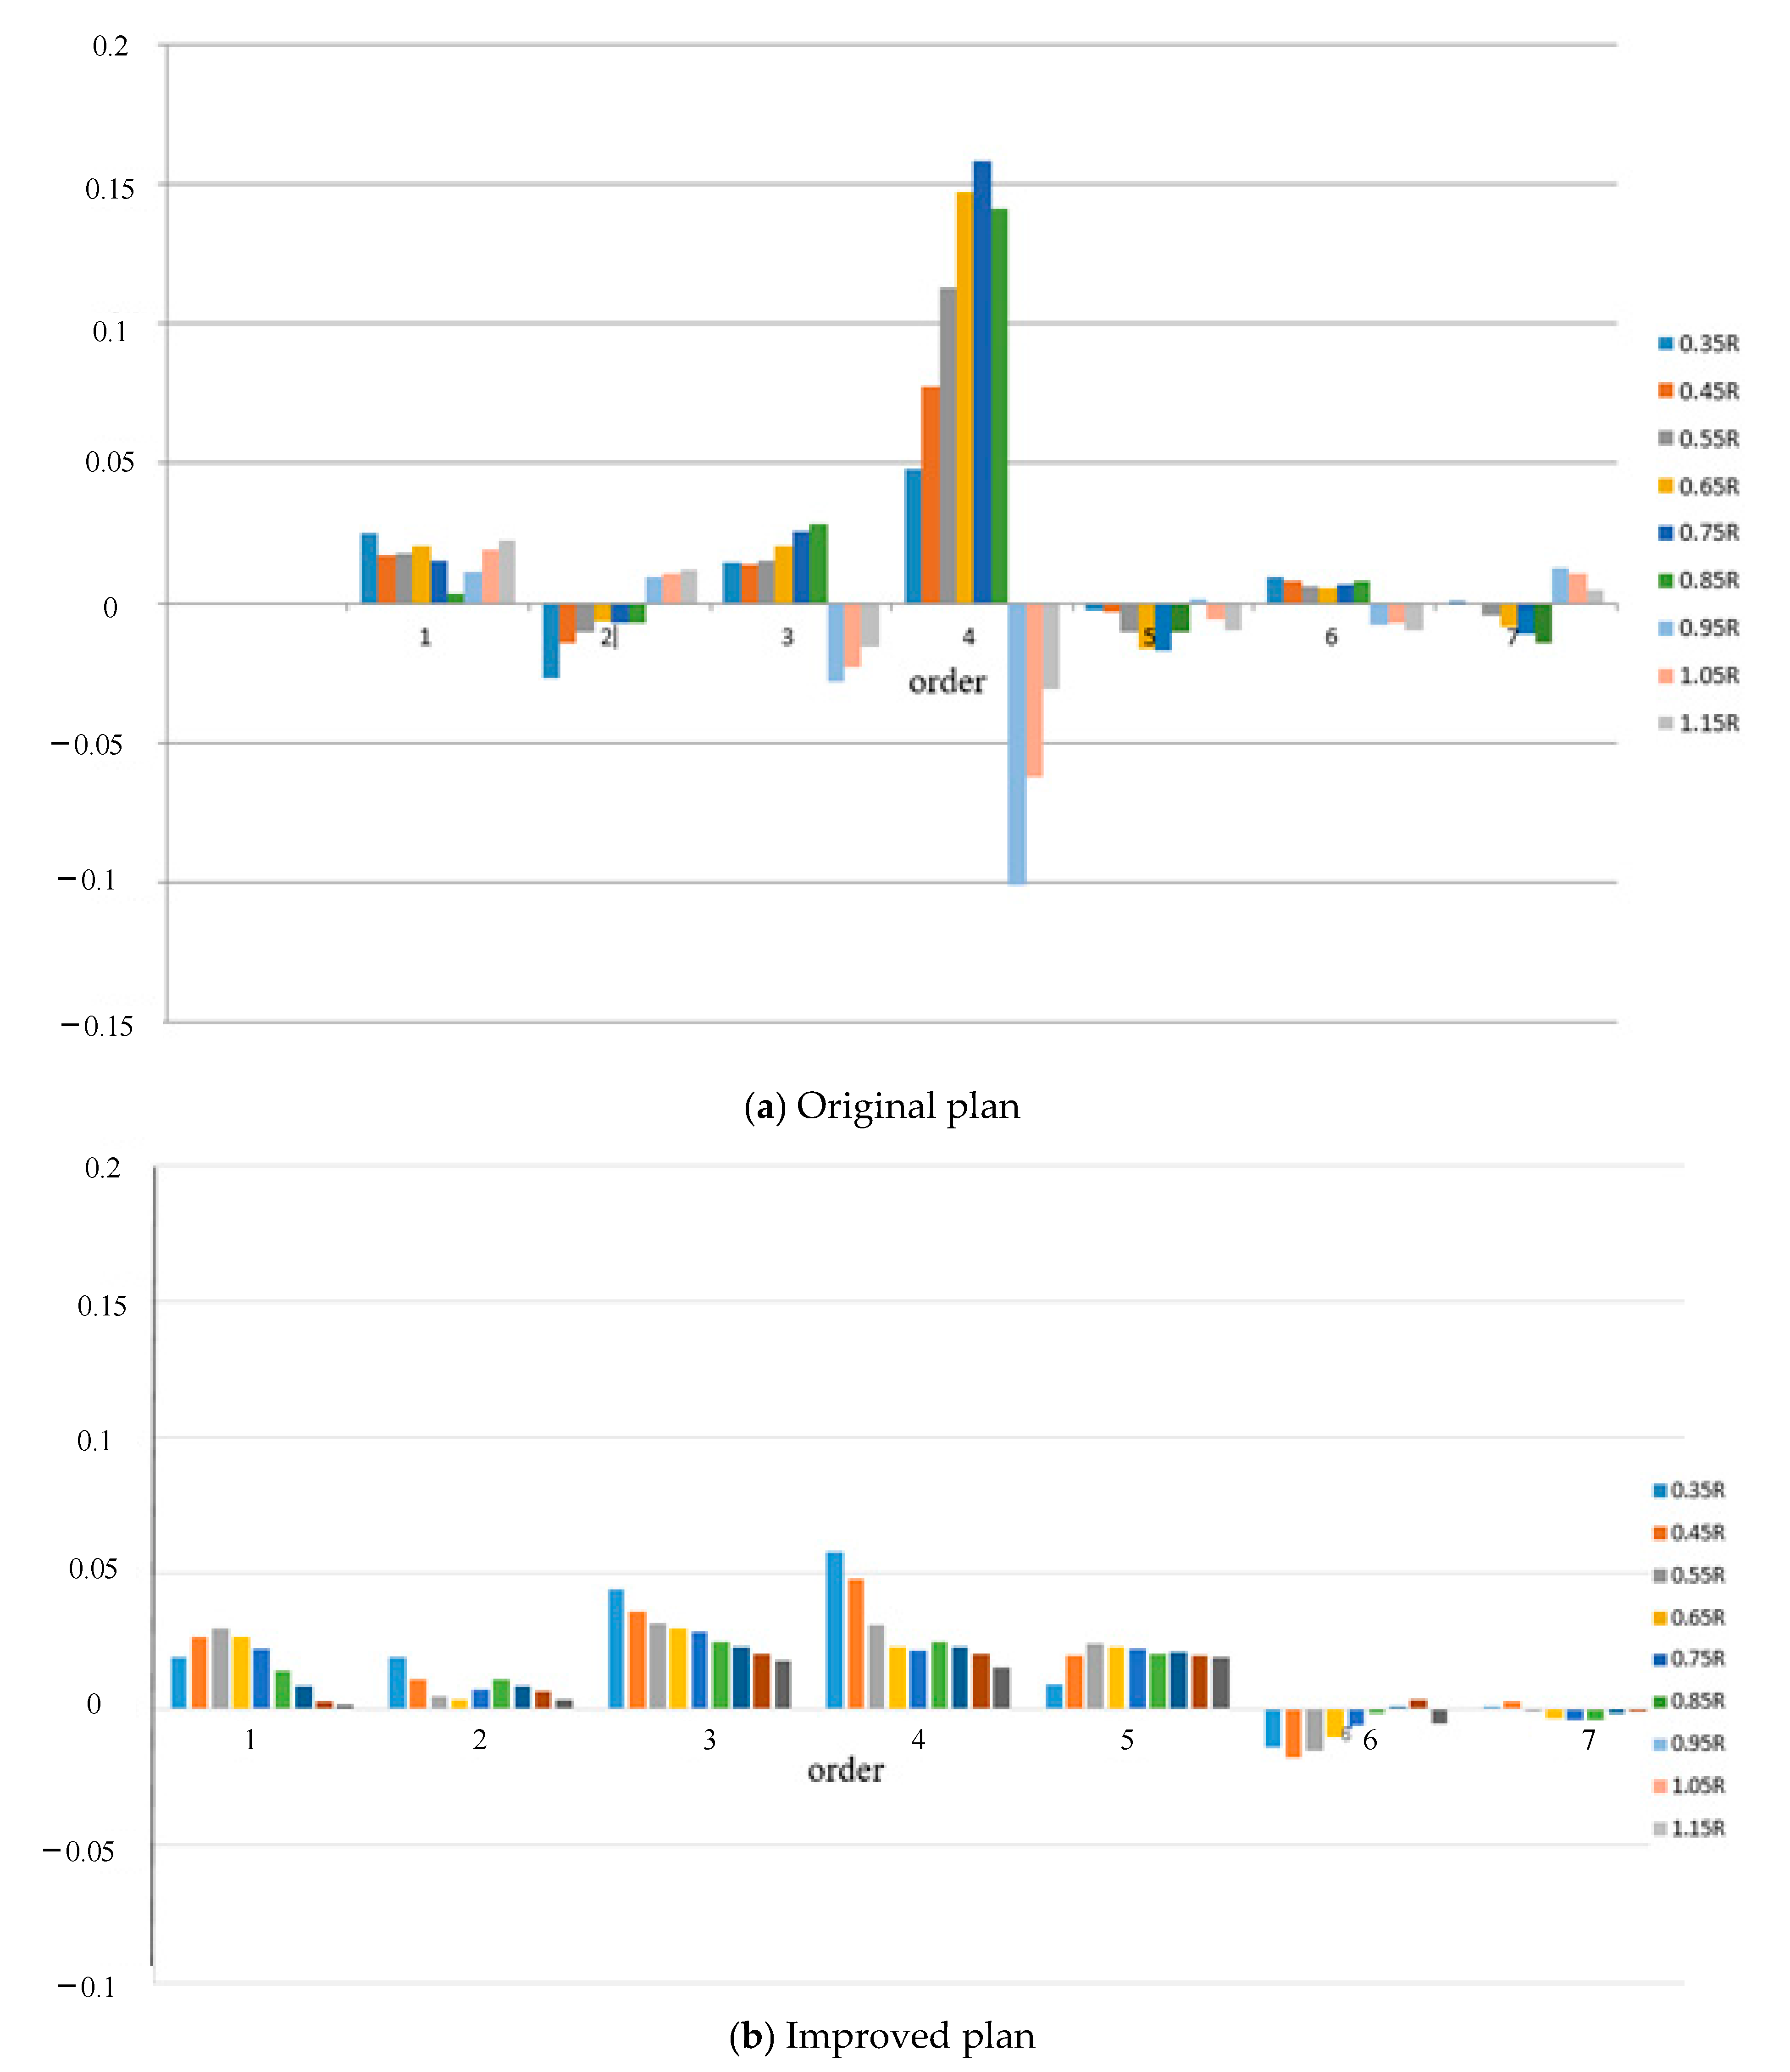
The frequency spectrum is used to express the wake distribution on each radius, which can quantitatively represent the uniformity of the wake field. The wake field is expressed as Formula (8) in the cylindrical coordinate system. Figure 11 shows the harmonics analysis of the axial wake field. The X-axis is the order, and the Y-axis is the amplitude. It is indicated that the amplitudes of low order are larger than those of high order. According to the literature [38], the fluctuation peak values of propeller thrust, torque, and tangential force are associated with the (kZ) harmony component of the wake, while the horizontal force, vertical force, horizontal bending moment, and vertical bending moment of propeller depend on the (Kz + 1) and (kZ − 1) harmonics of the wake, wherein the k = 1, 2, 3… and Z is the blade number, Z = 5 in this paper. It is shown that the wake fields of the improved plan are more uniform than that of the original one, which will cause that the propeller unsteady bearing forces of the improved plan will be lower than those of the original one.
Especially, the amplitudes for six and seven orders are less than 3% of the incoming velocity (3.05 m/s), which explains that submarine propellers usually have a large number of blades. From the point of view of vibration, the bearing force caused by propeller is related to the number of blades. As a general rule, Burnside et al. (1979) pointed out that increasing the number of blades usually lowers the excitation forces on the shafting and the fluid pressures transmitted to the ship’s hull. There is a tradeoff, however, because increasing the number of blades also increases the possible number of resonances with the hull and the propulsion system. It is also noted that the amplitude of the fourth order is largest for the original plan, which results from the effect of the tail fins.
v a r , θ = v ¯ 0 a r + n = 1 A n a r [ sin n θ + ϕ a ) n
Comparing the harmonic components of each stage of the axial wake field in the improved scheme and the original scheme, it can be seen that the maximum amplitude of the improved scheme is about 0.05, while the maximum amplitude of the original scheme is about 0.15. The improved scheme is significantly smaller than the original scheme, which shows that the improved scheme has a better wake field quality, more uniform wake field, and is more conducive to controlling the noise of submarine propellers.

4.3. Analysis of Unsteady Bearing Force

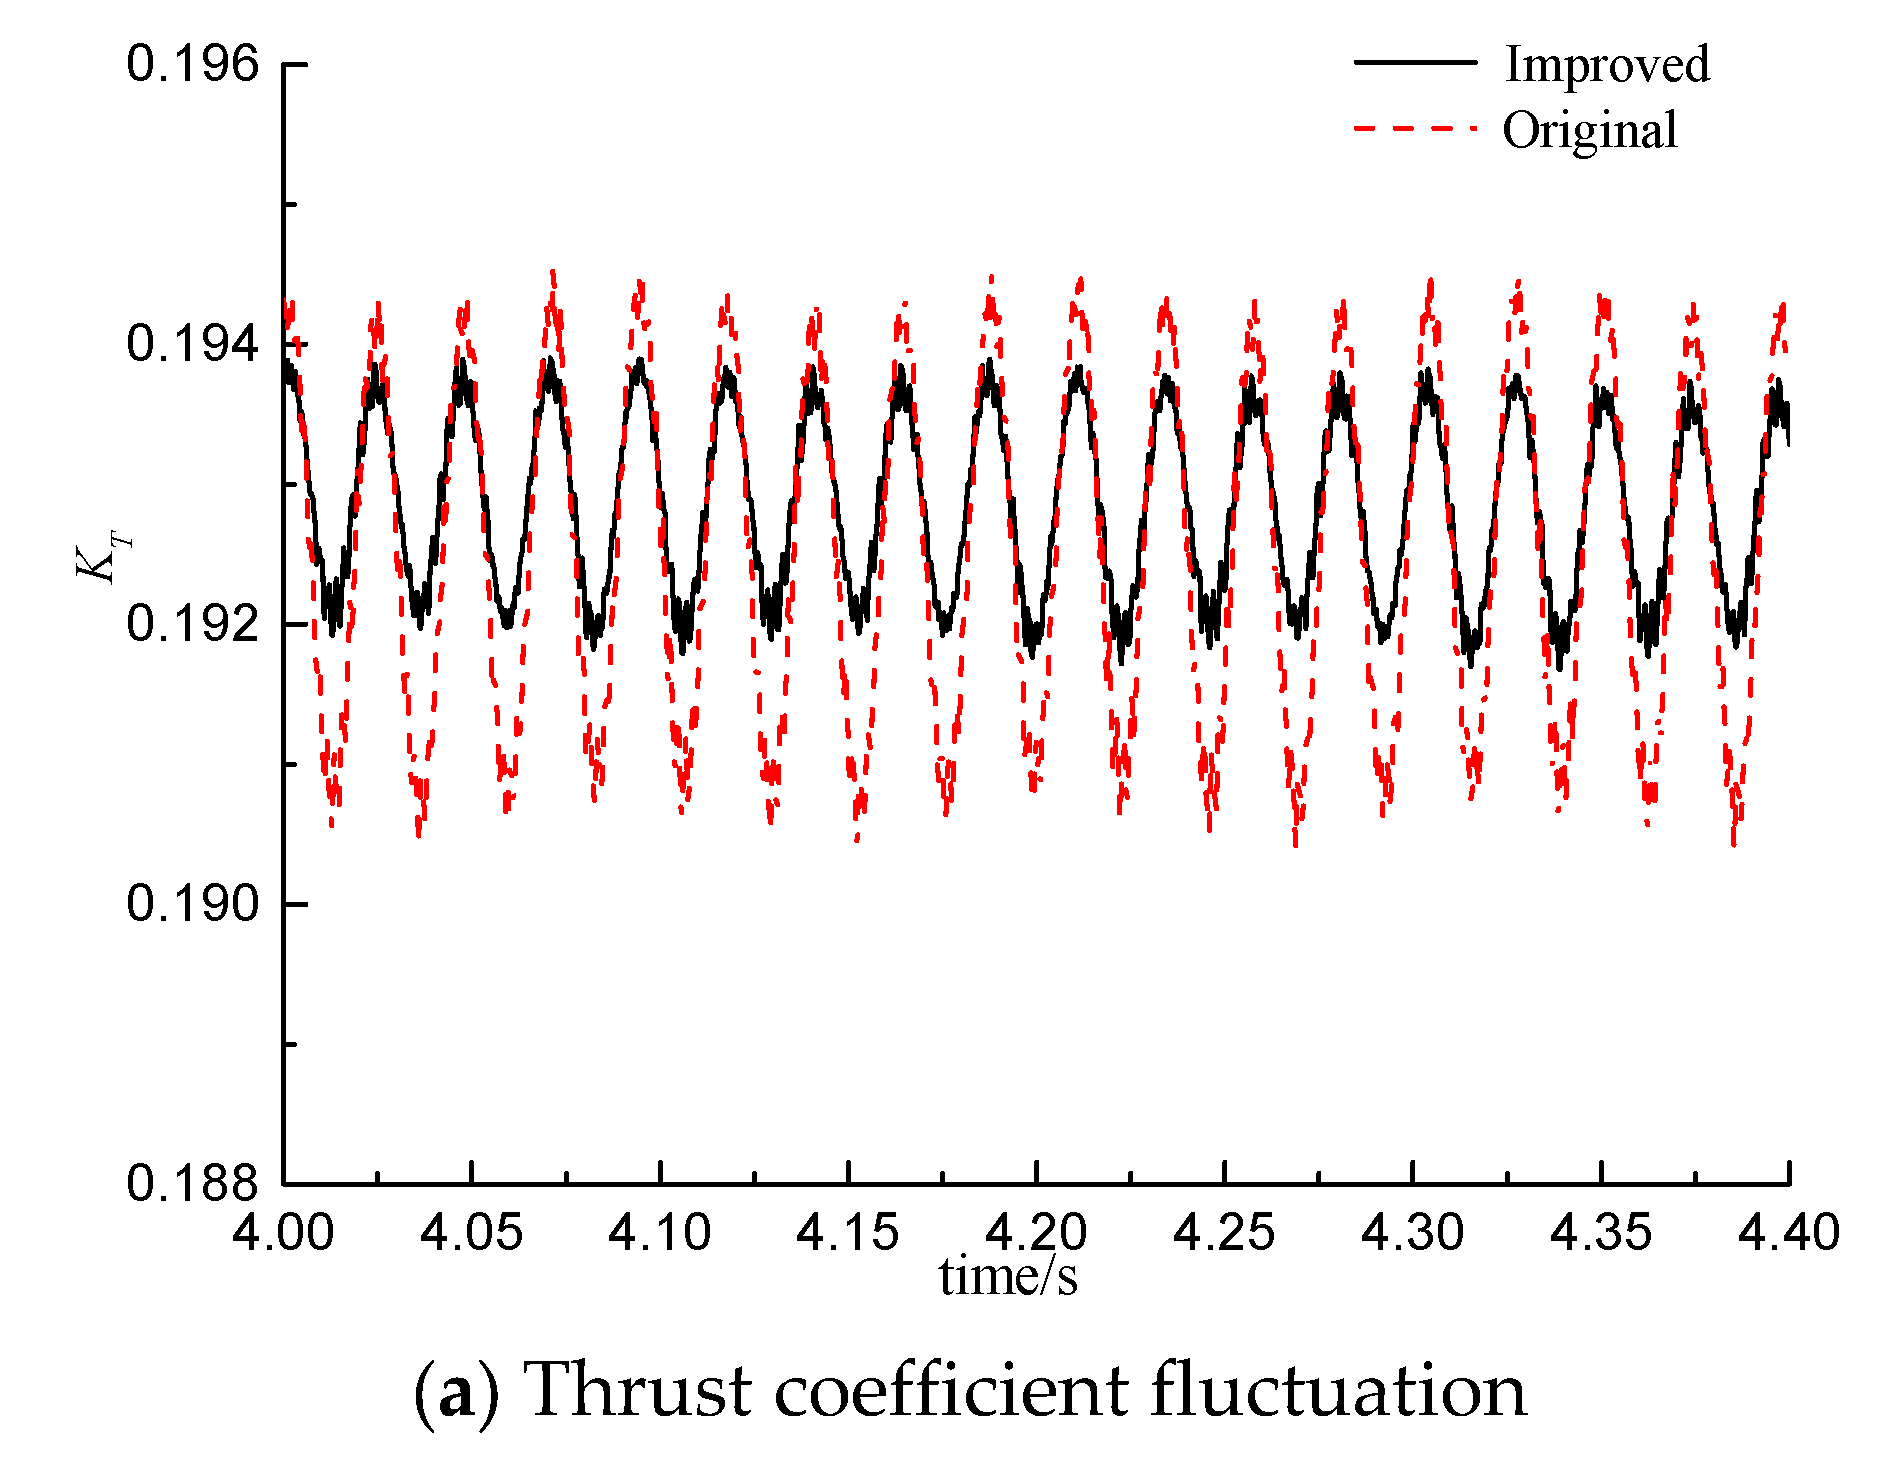
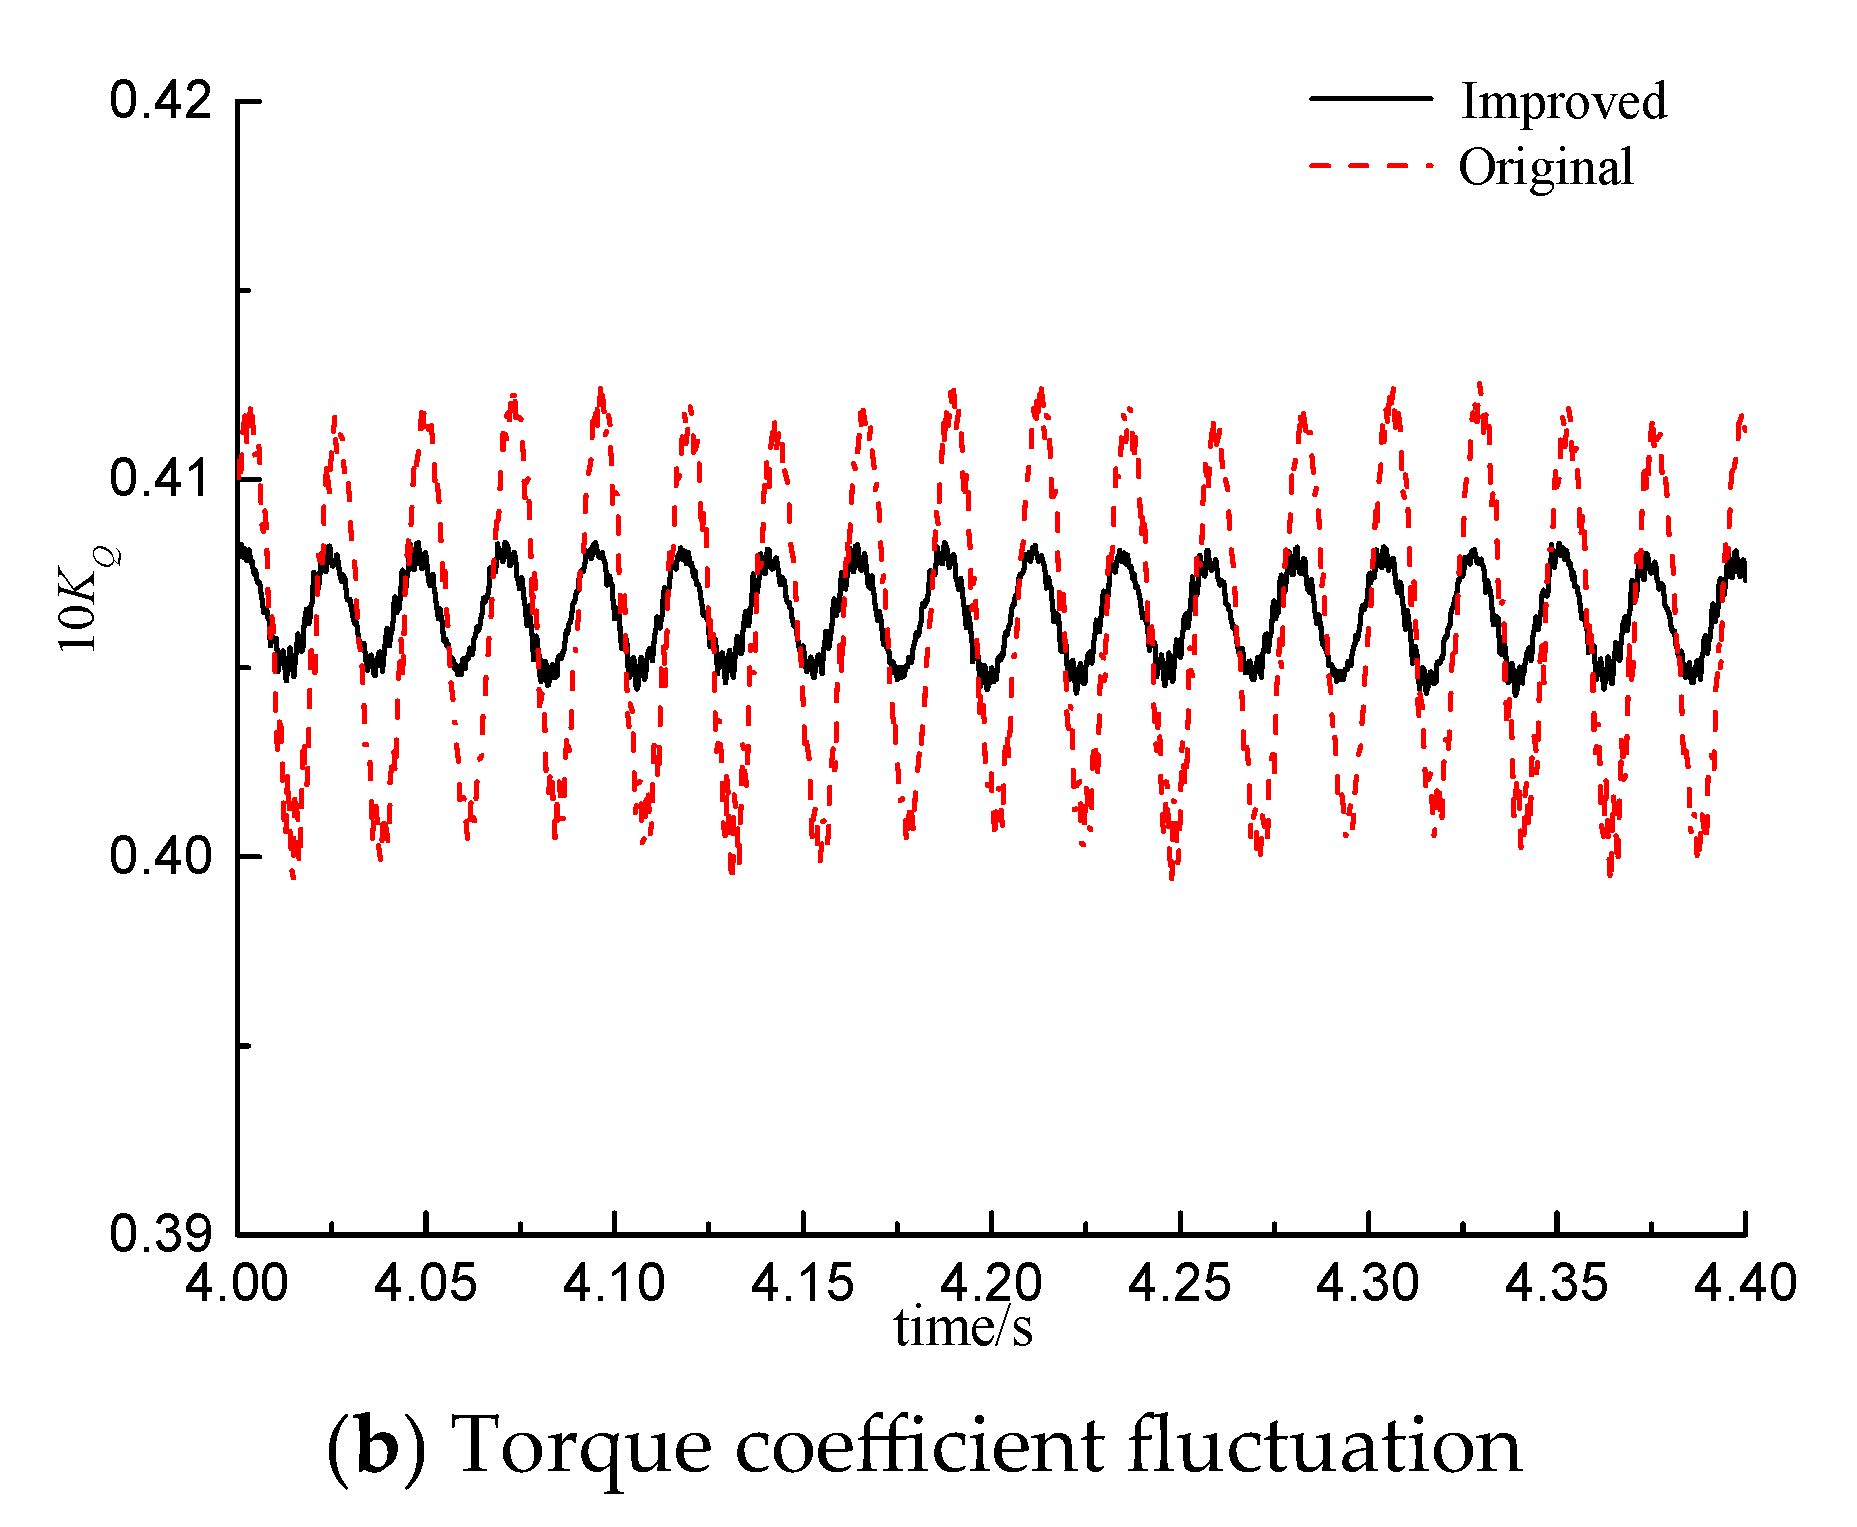
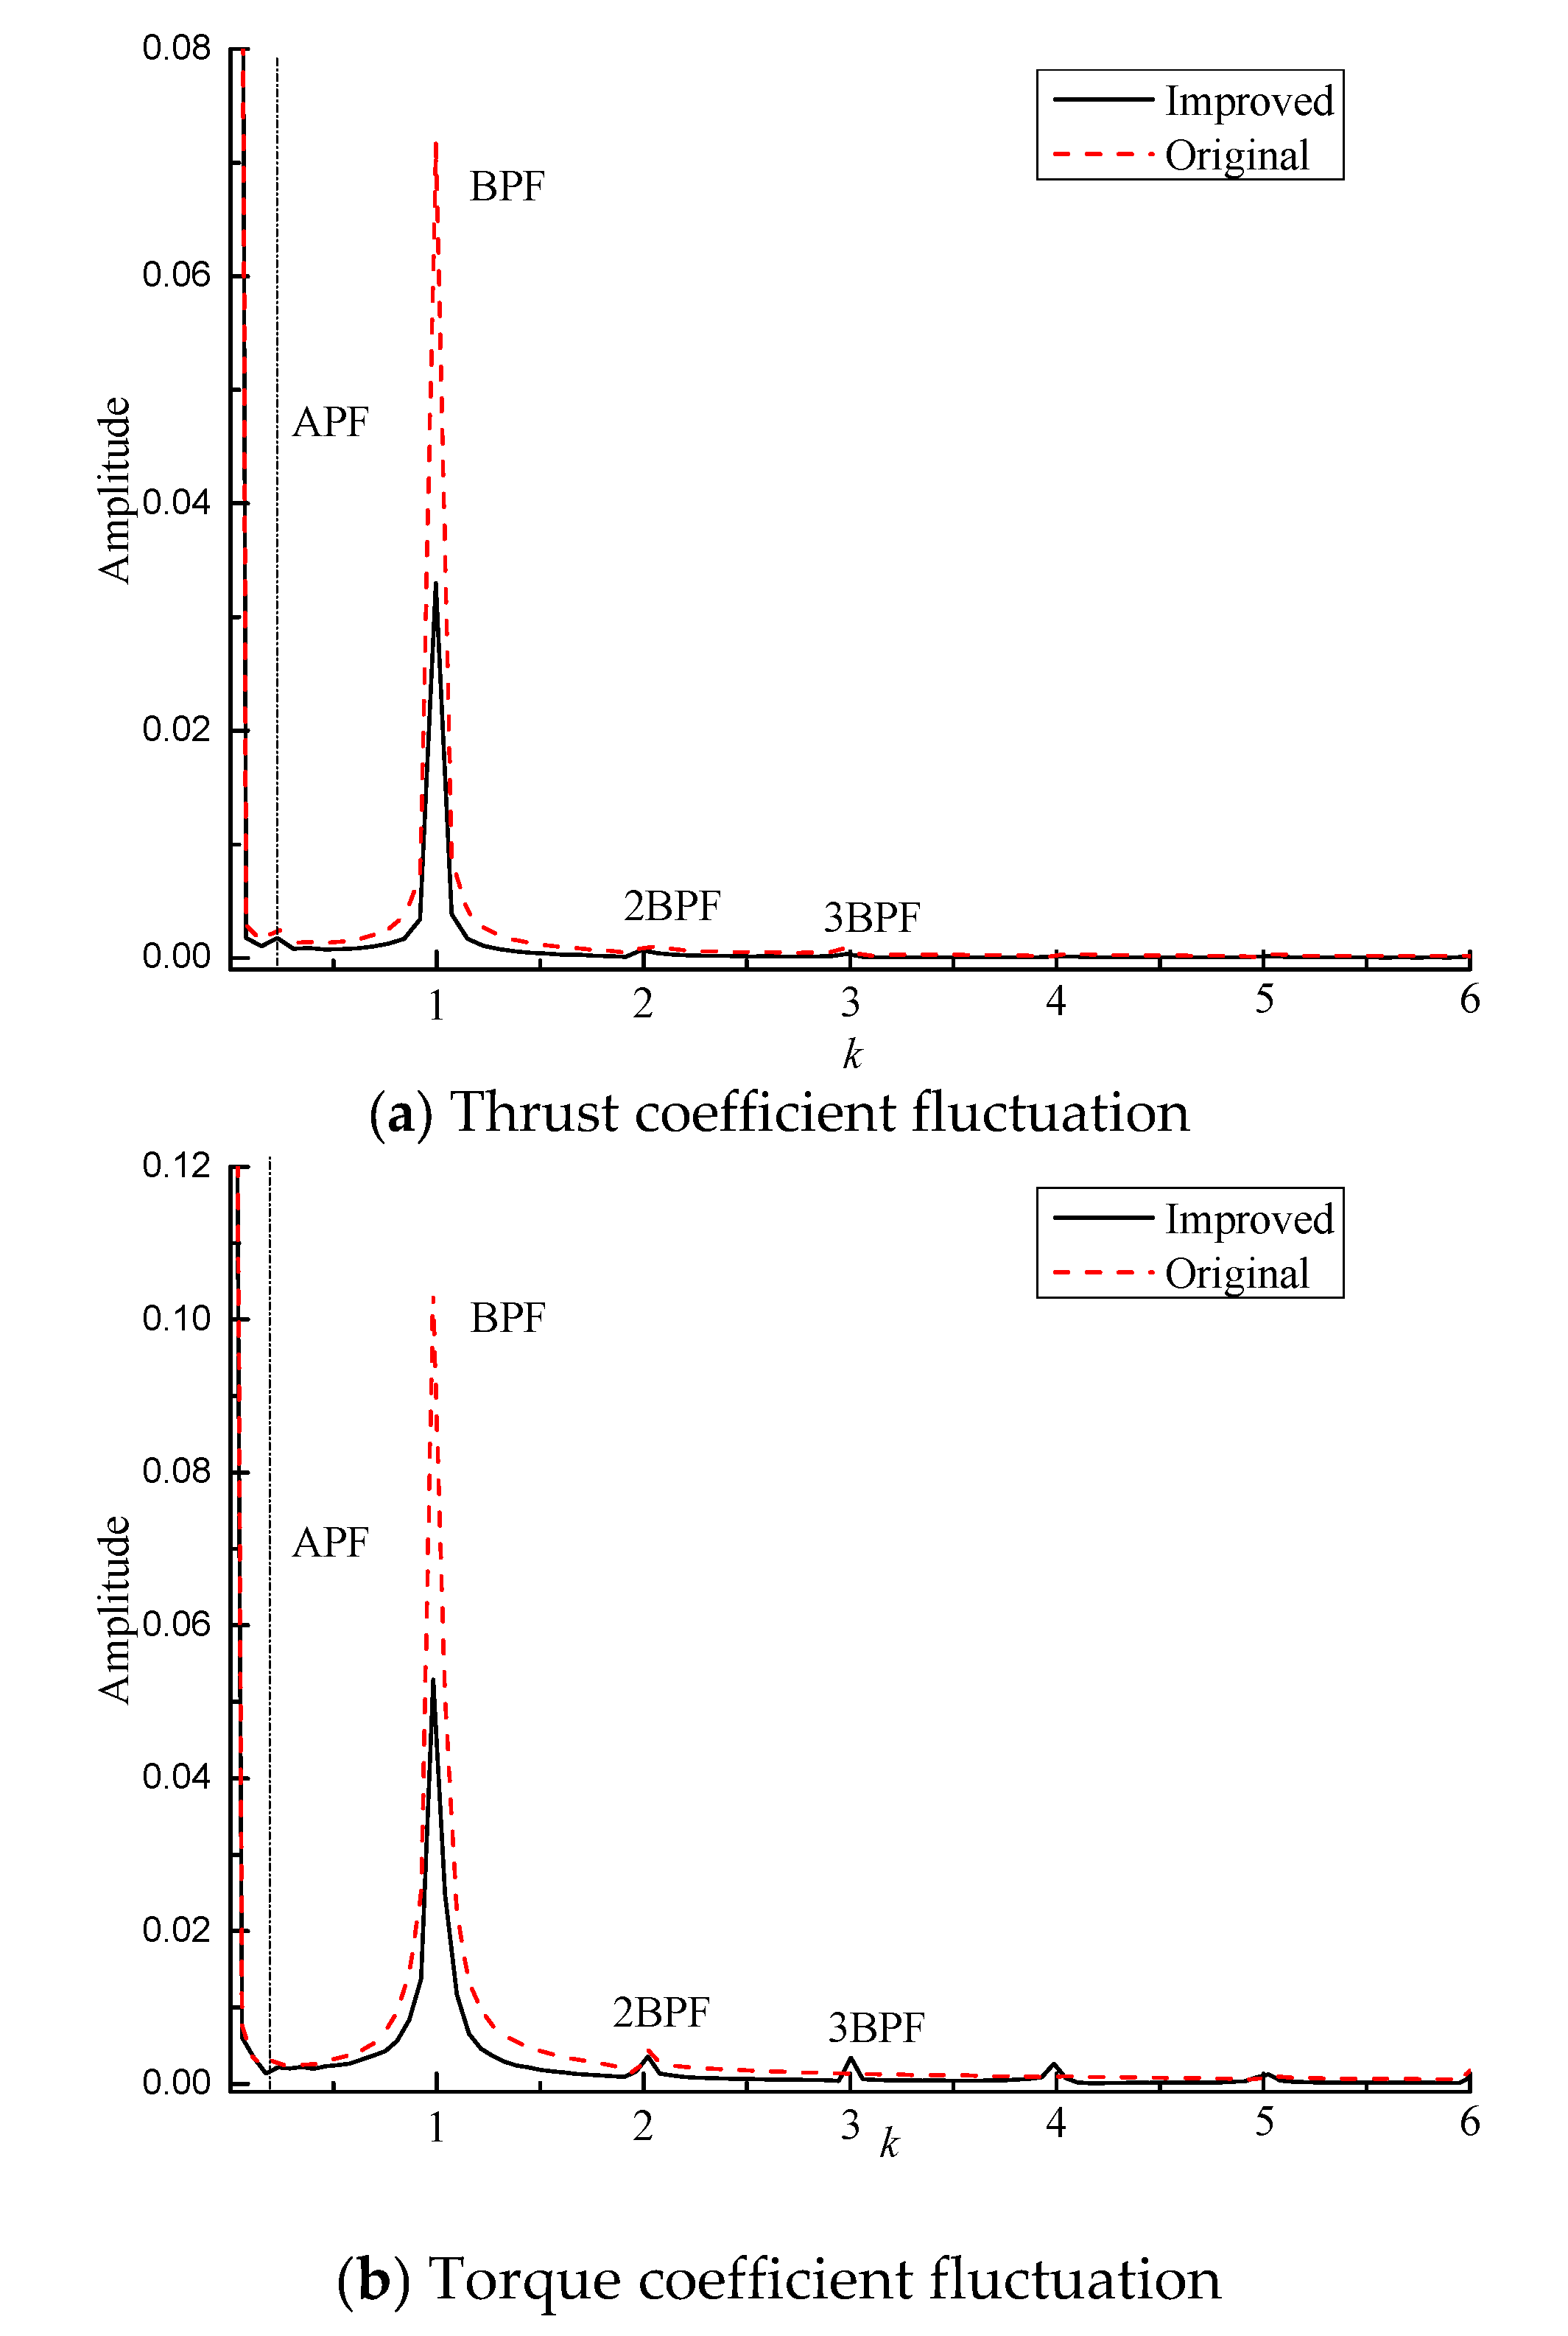
Due to the propeller working in a nonuniform flow field at the tail of the hull, it will generate excitation forces, including bearing forces and pulsating pressure on the surface of the hull. When the excitation forces are severe, it will cause tail vibration of the hull, threaten the bearing strength, and exacerbate the hydrodynamic noise of the propeller. Therefore, the requirements for propeller excitation forces are another way and method to consider the design of low-noise propellers. Considering that the distance between the propeller and the hull is relatively far, the effect on the surface pulsating pressure of the hull is not as obvious as that of surface ships, so this article only analyzes the bearing forces of the propeller. After the calculation converges, the bearing force time domain data recorded within 4~4.4s are selected, and the fast Fourier transform (FFT) is used to convert the time domain values into frequency domain values to study the pulsation of the propeller load. For the ease of comparison and analysis, the following definitions are made here: (1) blade frequency (BPF) = nZ and twice blade frequency (2BPF) = 2nZ, where n is the propeller rotation speed, unit revolution/second (rps), and Z is the number of propeller blades. (2) The wave number k is dimensionless based on BPF, where BPF corresponds to k = 1 and 2BPF corresponds to k = 2. (3) According to Equation (9), the propeller load is standardized, where T and Q are the propeller thrust and torque, respectively; the subscript i (i = x, y, z) represents the load component in three directions, is the density of water, taken as 998.2 kg/m3, and D is the diameter of the propeller, unit m.
K T i = T i ρ n 2 D 4 K Q i = Q i ρ n 2 D 5
The time–domain and frequency–domain curves of the axial bearing force and torque of the propeller are, respectively, plotted in Figure 12. From the time–domain plot, the axial bearing force and torque of the propeller change periodically with time, and the two plans have the same pulsation frequency. Figure 13 is the frequency–domain value after FFT transformation. From the frequency–domain plot, the axial bearing force and torque of the propeller show different degrees of peaks at the integer multiples of the leaf frequency BPF, with the leaf frequency peak being the largest and then rapidly decreasing. After 4BPF, it can be ignored. From the pulsation value, the frequency–domain pulsation value of the improved plan is significantly smaller than that of the original plan, especially as the pulsation peak value of BPF is about the same as that of the original plan; that is, the improved plan is conducive to reducing the pulsation of the axial bearing force of the tail propeller.
For ease of comparison and analysis, the mean values of the propeller load and the peak data of BPF~3BPF in the frequency–domain are listed in Table 5. By comparing the two plans, the following patterns can be found: (1) In terms of time mean, the thrust coefficient and lateral force coefficient mean values of the improved plan are greater than those of the original plan, indicating that the flap does not cause a loss of propeller thrust. (2) In terms of pulsation values, the thrust pulsation value is the largest, followed by the lateral force pulsation value, while the vertical force pulsation is the smallest. The lateral force pulsation value is of the same magnitude as the thrust pulsation value and cannot be ignored. This is mainly because in nonuniform flow fields, the forces on each blade are unbalanced and unable to balance the forces in the YZ direction. Therefore, even though the mean values of the vertical and horizontal forces are not very large, they still generate large pulsation components, which is consistent with the conclusion in the literature [39]. Excessive lateral force pulsation components can cause horizontal and vertical vibrations of the shaft system, which deserves attention from designers. (3) The thrust and lateral force pulsation values of the improved plan are smaller than those of the original plan. As analyzed in the previous section, this is mainly due to the more uniform wake field of the improved plan than that of the original plan. This indicates that after installing the flap, the vibration noise performance of the submarine propeller is better than that of the original plan.
The mean values of the torque and the peak data of BPF~3BPF in the frequency–domain of the propeller’s torque are listed in Table 6. It can be found that, although the mean value of the lateral bending moment is much smaller than the torque, its pulsation value is much greater than the torque, among which, the pulsation value of the bending moment around the Z-axis is the largest, and the bending moment around the Y-axis is the second. Comparing the original plan and the improved plan, it can be known that the mean values of the torque and bending moment coefficients of the improved plan are greater than those of the original plan, indicating that the propeller in the improved plan bears heavier loads; from the perspective of pulsation values, the torque coefficients and the bending moment coefficients around the Z-axis in the improved plan are both smaller than those in the original plan, while the bending moment coefficients around the Y-axis in the improved plan are not much different; overall, the torque pulsation value of the improved plan propeller is smaller.

5. Conclusions

To analyze the effect of the fillets on submarine wake field and propulsion performance, a computational study of the SUBOFF model equipped with a DTMB4383 propeller was conducted using the DES method. The computational results were validated using the experimental data. The study results can be summarized as follows:
  • The velocity distribution on the propeller disk shows that the fillets improve the wake field of the submarine by reducing the horseshoe vortex of the tail rudder, and they mainly affect the flow field characteristics in the inner radius area.
  • The analysis of the harmonic components shows that the fillets can effectively reduce the axial velocity pulsation from 0.15 to 0.5, and the wake field of the improved model is more uniform.
  • The frequency–domain curve shows that the fillets can reduce the bearing force pulsation value from 0.07 to 0.03, indicating that the fillets are conducive to controlling the vibration and noise performance of the submarine propeller.
  • The cavitation is not considered in this paper. In future research, the influence of the fillets on the unsteady excitation force of the submarine will be studied under the condition of considering cavitation.

Author Contributions

Conceptualization, X.L.; methodology, W.C.; software, S.S.; validation, X.L., W.C., N.R. and S.S.; formal analysis, N.R.; investigation, X.L.; resources, X.L.; data curation, X.L.; writing—original draft preparation, X.L.; writing—review and editing, W.C.; visualization, W.C.; supervision, N.R.; project administration, W.C.; funding acquisition, X.L. and S.S. All authors have read and agreed to the published version of the manuscript.

Funding

This research was funded by Natural Science Foundation of Hainan Province (520RC543), National Science Foundation of China (52008313) and Natural Science Youth Foundation of Jiangsu Province (BK20210348).

Data Availability Statement

Not applicable.

Acknowledgments

The authors would like to appreciate all editors and anonymous reviewers for their insightful comments and constructive suggestions to polish this paper in high quality.

Conflicts of Interest

The authors declare no conflict of interest.

References

  1. He, L.; Zhu, H.C.; Qiu, X.J. Acoustic Theory and Engineering Application; Science Press: Beijing, China, 2006. [Google Scholar]
  2. Heng, L.; Wang, Z.Z.; Qi, W.J. Study on the influence of hull shape of submarine command platform on wake flow field. Ship Electron. Eng. 2016, 36, 151–156+187. [Google Scholar]
  3. Li, J.; Hou, L.; Huang, X.C. Experimental study on propeller vibration induced by spatial uneven flow field. China Ship Res. 2017, 12, 92–100. [Google Scholar]
  4. Zheng, X.L.; Wang, C.; Zhang, L.X.; Zhang, S. Prediction of propeller hydrodynamic and noise characteristics in non-uniform flow field. J. Wuhan Univ. Technol. 2014, 38, 122–125. [Google Scholar]
  5. Zhu, X.Q.; Li, Y.; Sun, H.X. Prediction of interaction noise between ship propeller blade and stern turbulent field. Acoust. Technol. 2006, 25, 361–364. [Google Scholar]
  6. Du, D.; Qian, Z.F.; Yang, D.; Chen, K.; Guo, F. Numerical simulation of complex flow field around Submarine Based on STAR CCM. In Proceedings of the Academic Conference Commemorating the 20th Anniversary of Ship Mechanics, Shanghai, China, 3 February 2017. [Google Scholar]
  7. Li, Y.; Fang, Z.Y.; Yao, Z.Q. Numerical simulation of submarine wake flow field with different stern wing types at corresponding positions. Shipbuild. Technol. 2007, 43, 19–22. [Google Scholar]
  8. Bai, T.C.; Lu, J.G. Effects of appendages on submarine drag and wake field. Ship Sci. Technol. 2013, 3, 51–55. [Google Scholar]
  9. Zhai, S.; Liu, Z.H. Numerical research on hydrodynamic performance and wake flow of conformal rudder. Shipbuild. China 2019, 60, 115–125. [Google Scholar]
  10. Zhai, S.; Liu, Z.H. Study on optimization effect of common airfoil rudder with local equal thickness on submarine wake flow field. Propuls. Technol. 2020, 41, 226–235. [Google Scholar]
  11. Lee, S.K.; Manovski, P.; Kumar, C. Wake of a cruciform appendage on a generic submarine at 10 yaw. J. Mar. Sci. Technol. 2020, 25, 787–799. [Google Scholar] [CrossRef]
  12. Zhang, N.; Lv, S.J.; Shen, H.C.; Xie, H. Numerical simulation on the effect of fairwater optimization to suppress the wall pressure fluctuations and flow induced noise. J. Ship Mech. 2014, 18, 448–458. [Google Scholar]
  13. Zhang, N.; Zhang, S.L.; Shen, H.C.; Xie, H. Large eddy simulation of vortical flow structure and wall pressure fluctuations around wing-plate junction. J. Ship Mech. 2013, 17, 729–740. [Google Scholar]
  14. Liu, Z.H.; Xiong, Y.; Wang, Z.Z.; Wang, S.; Tu, C.X. Design and Experimental Study on a New Wake Control Method of Submarine. Shipbuild. China 2010, 51, 47–55. [Google Scholar]
  15. Liu, Z.H.; Xiong, Y. Comparison on the submarine horseshoe vortex control effects by vortex control bafflers and fillets. J. Ship Mech. 2011, 15, 1102–1109. [Google Scholar]
  16. Liu, Z.H.; Xiong, Y.; Tu, C.X. Method to Control Unsteady Force of Submarine Propeller Based on the Control of Horseshoe Vortex. J. Ship Res. 2012, 56, 12–22. [Google Scholar]
  17. Liu, Z.H.; Xiong, Y.; Tu, C.X. Numerical Simulation and Control of Horseshoe Vortex Around an Appendage-Body Junction. J. Fluids Struct. 2011, 27, 23–42. [Google Scholar]
  18. Ding, Z.Y.; Gong, S.Q.; Wang, Z.L.; Wang, X.Z.; Feng, D.K. Comparison of hydrodynamic performance of submarine hull rudder and bow rudder. Ship Sci. Technol. 2017, 39, 22–28. [Google Scholar]
  19. Wu, F.L.; Wu, X.G.; Ma, Y.Y.; Li, Z. Numerical study on the influence of submarine command platform enclosure on resistance and wake field. Ocean Eng. 2009, 27, 95–103. [Google Scholar]
  20. Liu, Z.Y.; Lin, X.P.; Zhou, Z.H. Study on the influence of submarine command station position on hydrodynamic force. J. Nav. Eng. Univ. 2006, 6, 34–37. [Google Scholar]
  21. Huang, Z.Y. Technical Summary Report on Optimal Shape of Submarine Command Console Enclosure; Science and Technology Report of China; Shipbuilding Research Center: Wuxi, China, 2003. [Google Scholar]
  22. Gorski, J.; Coleman, R.M. Use of RANS Calculations in the Design of a Submarine Sail. In Proceedings of the RTO AVT Symposium, Paris, France, 22–26 April 2002. [Google Scholar]
  23. Rais-Rohani, M.; Lokits, J. Reinforcement layout and sizing optimization of composite submarine sail structures. Struct. Multidiscip. Optim. 2007, 34, 75–90. [Google Scholar] [CrossRef]
  24. Toxopeus, S.; Kuin, R.; Kerkvliet, M.; Hoeijmakers, H.; Nienhuis, B. Improvement of Resistance and Wake Field of an Underwater Vehicle by Optimizing the Fin-Body Junction Flow with CFD. In Proceedings of the ASME 2014 33rd International Conference on Ocean, Offshore and Arctic Engineering, San Francisco, CA, USA, 8 June 2014. [Google Scholar]
  25. Wang, Z.B.; Yao, H.Z.; Zhang, N. Computational study on the influence of command console enclosure on submarine wake. Ship Mech. 2009, 13, 196–202. [Google Scholar]
  26. Liu, L.J.; Xu, Y. Numerical simulation of the effect of sand dune enclosure on submarine flow field. J. Ordnance Equip. Eng. 2014, 11, 1–4. [Google Scholar]
  27. Liu, Z.H.; Xiong, Y.; Ye, Q. Model experiment and numerical simulation of the hydrodynamic performance of a conformal rudder. J. Harbin Eng. Univ. 2018, 39, 658–663. [Google Scholar]
  28. Zhang, Y.; Wu, D. Research on Formation Mechanism and Suppression Method of Surface Force Caused by Pump Jet Propeller. In Proceedings of the Fluids Engineering Division Summer Meeting, Wuxi, China, 1 October 2021. [Google Scholar]
  29. Su, Z.; Shi, S.; Huang, X.; Rao, Z.; Hua, H. Effects of the duct on the vibro-acoustic characteristics of the pump-jet–shaft–submarine system under pump-jet excitation. Ocean Eng. 2022, 254, 111327. [Google Scholar] [CrossRef]
  30. Zhang, Y.; Han, J.; Huang, B.; Zhang, D.; Wu, D. Suppression method for exciting force of pump jet propellers based on sinusoidal unevenly spaced rotor blades. Ocean Eng. 2022, 262, 112198. [Google Scholar] [CrossRef]
  31. Wu, X.; Wang, D.; Wei, Y.; Jin, S.B.; Zhu, H.; Hu, P.F.; Sun, F.X. Prediction and parameter analysis of pump jet broadband unsteady excitation force. J. Natl. Univ. Def. Technol. 2023, 45, 7. [Google Scholar]
  32. Spalart, P.R.; Allmaras, S.R. A one equation turbulence model for aerodynamic flows. In Proceedings of the A/AA92-0439, A1AA 30th Aerospace Sciences Meeting and Exhibit, Reno, NV, USA, 14–17 January 1992. [Google Scholar]
  33. Spalart, P.R. Comments on the feasibility of LES for wings, and on a hybrid RANS/LES approach. In Proceedings of the First AFOSR International Conference on DNS/LES, Ruston, LA, USA, 4–8 August 1997. [Google Scholar]
  34. Patil, V.S.; Bano, F.; Kurahatti, R.V.; Patil, A.Y.; Raju, G.U.; Afzal, A.; Saleel, C.A. A study of sound pressure level (SPL) inside the truck cabin for new acoustic materials: An experimental and FEA approach. Alex. Eng. J. 2021, 60, 5949–5976. [Google Scholar] [CrossRef]
  35. Dhaduti, S.C.; Sarganachari, S.G.; Patil, A.Y.; Yunus Khan, T.M. Prediction of injection molding parameters for symmetric spur gear. J. Mol. Model. 2020, 26, 1–12. [Google Scholar] [CrossRef]
  36. Nikitin, N.V.; Nicoud, F.; Wasistho, B.; Squires, K.D.; Spalart, P.R. An approach to wall modeling in large-eddy simulations. Phys. Fluids 2000, 12, 1629–1632. [Google Scholar] [CrossRef]
  37. Li, M.J.; Wang, M.X.; Wang, L.; Liu, Z.H. Experiment and numerical simulation of denoising fillets of stern appendages on underwater vehicle. J. Ship Mech. 2016, 20, 1345–1354. [Google Scholar]
  38. He, Y.; Wang, G. Propeller Exciting Force; Shanghai Jiao Tong University Press: Shanghai, China, 1984. [Google Scholar]
  39. Wang, C.; Sun, S.; Li, L.; Ye, L. Numerical prediction analysis of propeller bearing force for full-scale hull-propeller-rudder system. Int. J. Nav. Archit. Ocean Eng. 2016, 8, 589–601. [Google Scholar] [CrossRef] [Green Version]
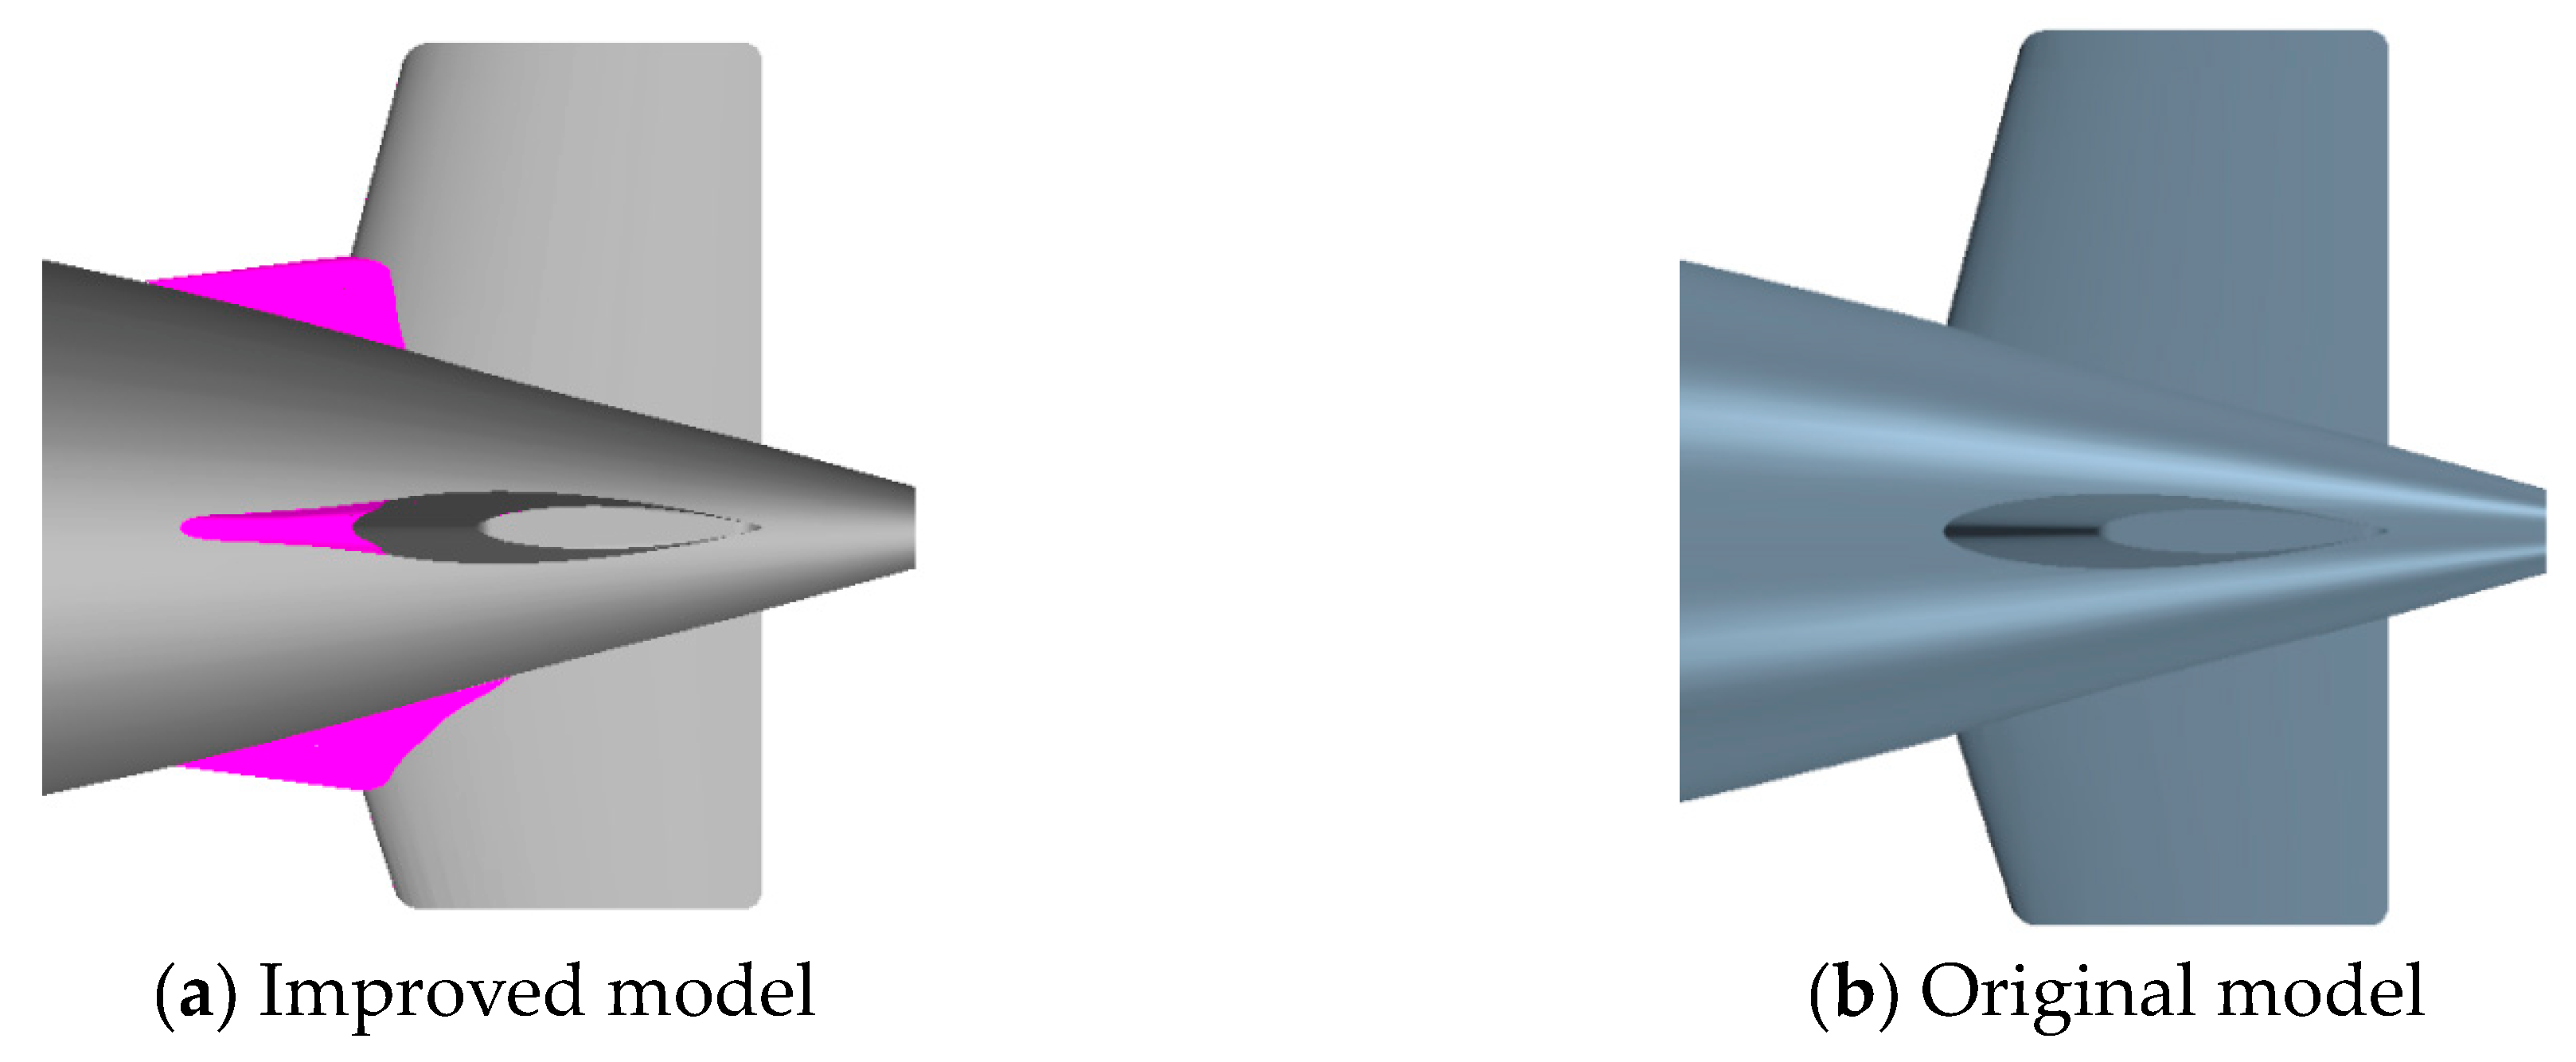
Figure 1. The tail rudder model.
Jmse 11 00727 g001
Figure 2. Calculation domain and boundary conditions.
Jmse 11 00727 g002
Figure 3. Mesh distribution.
Jmse 11 00727 g003
Figure 4. Comparison of pressure coefficients on submarine surfaces.
Jmse 11 00727 g004
Figure 5. Definition of a wake angle.
Jmse 11 00727 g005
Figure 6. Axial velocity contour with different grid numbers.
Jmse 11 00727 g006
Figure 7. Axial wake friction at the propeller plane.
Jmse 11 00727 g007
Figure 8. Distribution of the axial velocity.
Jmse 11 00727 g008
Figure 9. The Q-criterion contour around the submarine.
Jmse 11 00727 g009
Figure 10. The circumferential distribution of the axial velocity.
Jmse 11 00727 g010aJmse 11 00727 g010b
Figure 11. The comparison of the wake harmonic analyses.
Jmse 11 00727 g011
Figure 12. Time–domain fluctuation curves of propeller loads.
Jmse 11 00727 g012aJmse 11 00727 g012b
Figure 13. Frequency–domain fluctuation curves of propeller loads.
Jmse 11 00727 g013
Table 1. Main parameters of SUBOFF.
Jmse 11 00727 i001
Submarine length with full appendages L4.356 m
Maximum hull diameter Dmax0.508 m
Sail length0.368 m
Tail section of airfoilNACA0020
Scale ratio1:24
Table 2. Main parameters of DTMB4383.
Jmse 11 00727 i002geometric parametersDTMB4383
Diameter (D/m)0.305
Number of blades, Z5
Hub diameter ratio, dh/D0.2
Area ratio, AE/A00.725
Table 3. Calculation conditions.
Original ModelImproved Model
Resistance CalculationSelf-Propulsion CalculationResistance CalculationSelf-Propulsion Calculation
Without propellerWith propellerWithout propellerWith propeller
Table 4. Comparison of submarine resistance between the calculation and experiment results.
MeshGrid NumberCFDEFDError
Fine5.12 M106.5102.34.11%
Medium3.85 M107.3102.34.89%
Corse2.25 M112.6102.310.1%
Table 5. The fluctuation peak of the propeller thrust and side force.
ForceBPF2BPF3BPFTime-Average
KTx × 104Improved3128.196.361932
Original7227.415.611926
KTy × 104Improved786.2116.80963
Original965.150.00825
KTz × 104Improved676.245.33716
Original865.131.54521
Table 6. The fluctuation peak of propeller torque and moment.
MomentBPF2BPF3BPFTime-Average
10KQx × 104Improved51213.4410.054086
Original101812.3611.334063
10KQy × 104Improved63224.1513.31762
Original62823.2215.27636
10KQz × 104Improved114815.2111.69714
Original143419.8317.65447
Disclaimer/Publisher’s Note: The statements, opinions and data contained in all publications are solely those of the individual author(s) and contributor(s) and not of MDPI and/or the editor(s). MDPI and/or the editor(s) disclaim responsibility for any injury to people or property resulting from any ideas, methods, instructions or products referred to in the content.