Abstract
Underwater compressed air energy storage (UCAES) is an advanced technology used in marine energy systems. Most components, such as turbines, compressors, and thermal energy storage (TES), can be deployed on offshore platforms or on land. However, underwater gas-storage devices, which are deployed in deep water, have specific characteristics. Flexible inflatables have become a viable alternative for underwater compressed air energy storage (UCAES) as air storage devices. Few studies have been conducted on the characteristics of partially inflated structures during the inflating and deflating processes. A tank experiment of a 1 m model of an underwater spherical airbag was performed to investigate the characteristics of the deformed shape, pressure, and volume of the stored compressed air. A finite element (FE) simulation of an airbag model with the same dimensions was established in Abaqus/Explicit. The simulation under shallow testing conditions was in good agreement with the experimental results. Furthermore, studies on the performance of a 4 m airbag prototype with different water depths are presented. The results indicated that the shape variation was only related to the volume (inflation ratio). The pressure varied approximately linearly with the inflation ratio during the quasi-static process from an empty shape to a zero-pressure shape. The operating depth had a slight effect on the deformation. Because the scaling factor influences the pressure difference of the surface at the same height proportion, the larger the dimensions of the airbag, the higher the pressure difference will be.
1. Introduction
Inflatable structures are used in various engineering projects owing to their advantages of flexibility, mobility, and light weight [1,2,3,4]. The concept can be applied in an underwater compressed air energy storage (UCAES) system, where a closed gas container stores high-pressure gas as the accumulator for long-term operation.
The UCAES operates with a large storage capacity and high output efficiency [5]. It counters the disadvantages of intermittence and randomness of marine renewable energy [6,7]. The excessive and intermittent energy is converted into internal energy of the pressurized air through compressors. High-pressure air is released to drive turbines to generate power to supply islands and ships [8]. The compressed air storage device is a key piece of equipment in the system, which uses the naturally high-pressure environment in deep water. The gas pressure is on the same order as the water pressure. Thus, the structural compression resistance requirement is significantly reduced owing to the slight pressure difference [9]. A flexible airbag is an appropriate option for structural features. Compared with rigid designs [10,11,12], in which the air is delivered into the container and displaces seawater, a closed underwater airbag completely separates the air from seawater. This configuration ensures compressed air quality and prevents the system from reducing the storage capacity owing to the stored gas dissolving in seawater [13]. It has the advantages of a short manufacturing cycle, low cost, and good adaptability to marine environments. Moreover, the underwater equipment of UCAES has special functions such as underwater communication [14] and navigation for underwater vehicles [15,16].
Generally, underwater containers are independent of UCAES systems. System-level analysis includes system design and assessment studies on the UCAES [17,18,19,20]. This illustrates that the gas container does not influence the efficiency of the other modules. For the shape design of a flexible container, Pimm et al. [21] studied a 2-D subsea device with the assumption of an inextensional axisymmetric membrane by applying natural shape analysis and considering the hanging mass and nonzero pressure state. An economic evaluation of the material cost was also discussed. Furthermore, Pimm et al. [22,23] studied the partially inflated shape of an ‘Energy Bag’ with a closed bottom and presented an axisymmetric finite element (FE) analysis of a lobe under different pressure differences. The stress analysis of the full shape in the air was presented in [24]. A tubular design [25] for accumulating gas was proposed by stretching the natural shape rather than revolving, and it was computed for 1 GWh storage at a depth of 1000 m. Schemes for mooring and placing were also presented.
Computational fluid dynamics (CFD) simulations of the wake and flow field have been presented. Wang et al. [26] studied a single balloon using a numerical simulation and a test in a wind tunnel to investigate the relationship between three bluff shapes and the wake field. Vasel-Be-Hagh et al. [27,28,29,30] studied the downstream tube flow of a single storage container and a set of three containers with closely and widely spaced floral configurations. CFD simulations were used to simulate the immovable model in the current. In practice, significantly slow ocean current has a slight effect on the air container in deep seawater, and the results of the fixed and rigid structures have limited reference value for practical engineering. In addition, the partially inflated state indicates the actual scenario most of the time. However, this could not be thoroughly considered because of the limitation and complexity of the CFD simulation.
Pimm et al. [31] performed an ocean experiment at the European Marine Energy Centre (EMEC) in Orkney with a prototype of a 5 m diameter ‘Energy Bag’ for months to investigate its feasibility. Offshore performance was tested and observed to be valuable, although leakage and surface damage occurred. The research proved the feasibility of flexible gas accumulators and illustrated the improvements in design and architecture. Cheung et al. [32] presented an experiment on a pilot UCAES with a heat-storage unit and an expansion mechanism. The study demonstrated variations in the temperature, flow rate, and pressure measured directly from the hose transferring the air. The study results provide a good reference scheme, but the measurement method of the data causes significant errors.
The summarized review indicates a lack of research on the characteristics and predictions of flexible air containers over the cycle process of inflation and deflation, and only a few studies were found on the numerical method to predict the shape variation of the entire structure. The component-level research on the characteristics of the gas containers is of great significance for the design of the UCAES system and the coordination operation between the other components. Therefore, the research purpose of this manuscript is to investigate the general variation of the characteristics of a spherical flexible underwater storage airbag in the quasi-static processes of inflation and deflation, including deformation and the change of the pressure–volume relationship of stored gas, through a tank experiment and a numerical simulation. The tank experiment was carried out to investigate the container characteristics and provide the results to verify the numerical simulation. A simulation modeling method is proposed to simulate the entire airbag with mooring lines and local reinforcement of the structure. To reproduce the practical model, the influences of the external and internal fluids were considered in Abaqus/Explicit. The fluid influences were treated as static pressure because of the quasi-static cycle process and almost no current in deep seawater in practice. The simulations indicated that the experimental results were in good agreement with the 1/4 scaled numerical model. A 4 m prototype model was simulated in deep water. The effects of the operating depth and scaling on the performance and characteristics are discussed herein. The characteristics of a spherical airbag during the operating cycle were investigated through experimental research, and a numerical calculation modeling method was proposed. The study contributes to the selection and the application in the engineering design and provides a basis for further research on the flexible gas container.
The background of the flexible air container of the UCAES is introduced in Section 1. The experimental scheme, including the model design and test procedure, is described in Section 2. Section 3 addresses the FE model and calculates the setting of the numerical simulation using Abaqus/Explicit analysis. The results are analyzed in Section 4, and conclusions are presented in Section 5.
2. Experiment Design
2.1. Model Design
The spherical prototype had a maximum horizontal section diameter of 4 m, working at a water depth of 700 m and storing approximately 7 MPa compressed air in a maximum volume of 30 m3. Geometrical similarity was considered in the experiment to construct a 1/4 downscaled model. The scaling factor is defined for length. Thus, is the surface area factor, and is the volume factor. The 1/4 model was a spherical airbag with a diameter of 1 m diameter. Owing to fabrication, the shape was slightly oblate. A suspension test for the model was performed to evaluate the displacement and storage volume. The airbag was hung and filled with water, and its volume was measured to be approximately 0.465 m3.
The maximum energy stored in the 1/4 downscaled airbag was approximately 9.3 kJ, determined by the product of the maximum volume and rated pressure. A 4 m prototype at a depth of 700 m can store an energy of 210 MJ, i.e., approximately 58.3 kW·h.
In ocean engineering, there are two main types of flexible materials for sealing gas-storage devices: rubber and coated fabrics. They can sustain significant tension and maintain impermeability and corrosion resistance against seawater environments. In addition to meeting these requirements, the gas-storage device for UCAES needs fatigue-resistant material that can withstand the periodic changes in volume and shape during the long-term inflation and deflation process. Under such conditions, rubber products are not as appropriate as coated fabric with the same storage capacity; moreover, rubber products are thicker, which is unfavorable to the exhaust of the structure.
The main membrane material of the airbag was a PVC-coated multi-layer fabric, which is one of the most commonly utilized coated fabrics. The tensile and fatigue strength of this material can meet the requirements of underwater operation. The layers on both sides were PVC coating, and polyester was used as the load-bearing layer in the middle. This material is tough and does not exhibit subtle dense wrinkles. Because the yarn size, fabric compactness, and density of the load-bearing layer are the same in the warp and weft directions, this fabric has almost the same strength in these two directions. In deep water, the material works under a constant and appropriate temperature in UCAES because of the constant ambient temperature in deep water, the TES used for compressed gas, and the cooling during the transmission in pipelines. The parameters of the prototype and the testing model are listed in Table 1.

Table 1.
Specifications of the testing model and prototype.
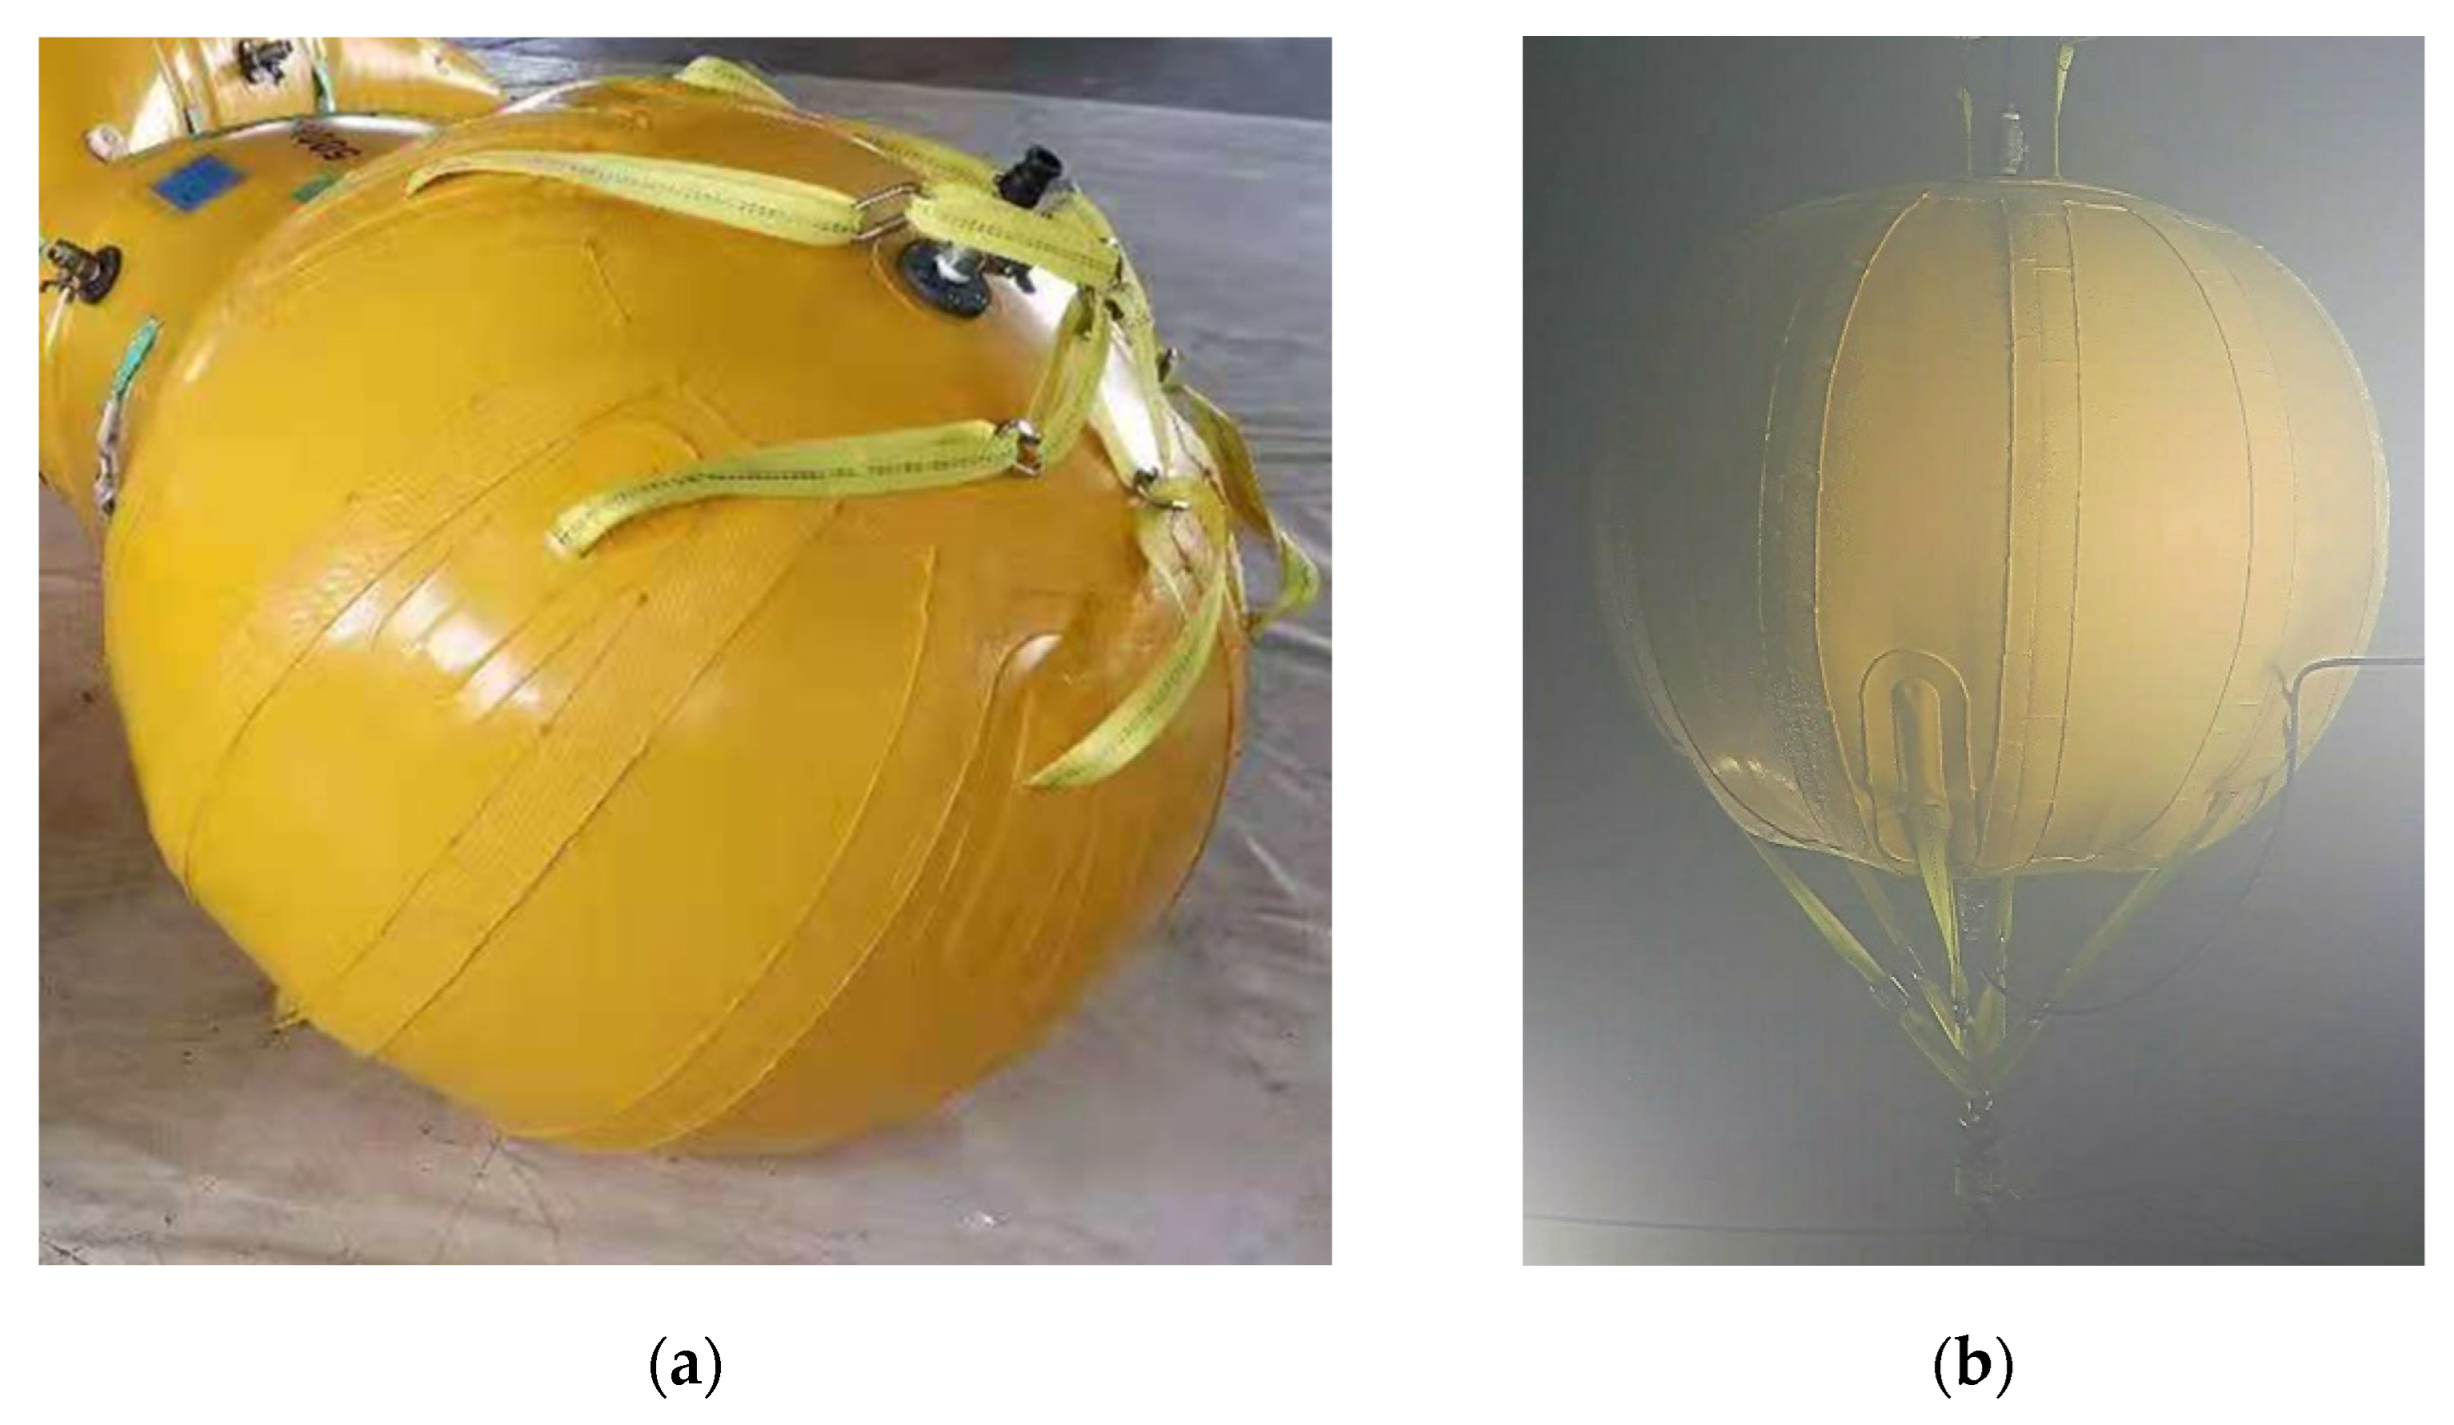
Because of the geometrical particularity, a spherical surface could not be obtained directly through a flat film material. The material was cut into several identical meridional spindle-shaped lobes, which were distributed along the equator and formed the majority of the sphere. Two disk pieces were cut to cover the top and the bottom. These pieces were welded together, and additional reinforcement strengthened the meridional and circular welding lines. The two disks were tailored from a flat material without curvature, such that the final full-filled shape was not ideally spherical but oblate (Figure 1).

Figure 1.
(a) Bottom straps and port of the filled 1/4 model; (b) photo captured via camera #2 at the same depth as the testing model center.
The airbag included straps and two ports. Six straps were evenly distributed around the central axis and were attached to the lower surface. The other ends for fixation at the mooring point were gathered by a shackle. To decrease the model rotation and avoid excessive stress concentration, the attached points on the airbag were away from the bottom, as well as the circle and meridional welding lines. In addition, two thinner straps on the top disk connected the floaters, which provided additional buoyancy in a low-storage state to maintain the underwater posture. Two flanges connected to a port were located at the center of the two disk pieces. One was for the airflow when inflating and deflating, and the other led to the pressure gauge. The functions of the two ports were independent of their locations. The connection type did not influence the air storage and pressure measurement. The welding lines, straps, and ports caused local thickening, which results in shape defects and is determined by manufacturing particularities.
2.2. Test Scheme
Based on the designed model, a tank test was performed in a reservoir to investigate the structural and pressurization characteristics of the flexible spherical airbag by establishing the relationship between the performance and proportion of stored air. The airbag was quasi-static and isothermal, and the temperature effect and discharging equipment in the UCAES, such as turbines and generators, were not considered.
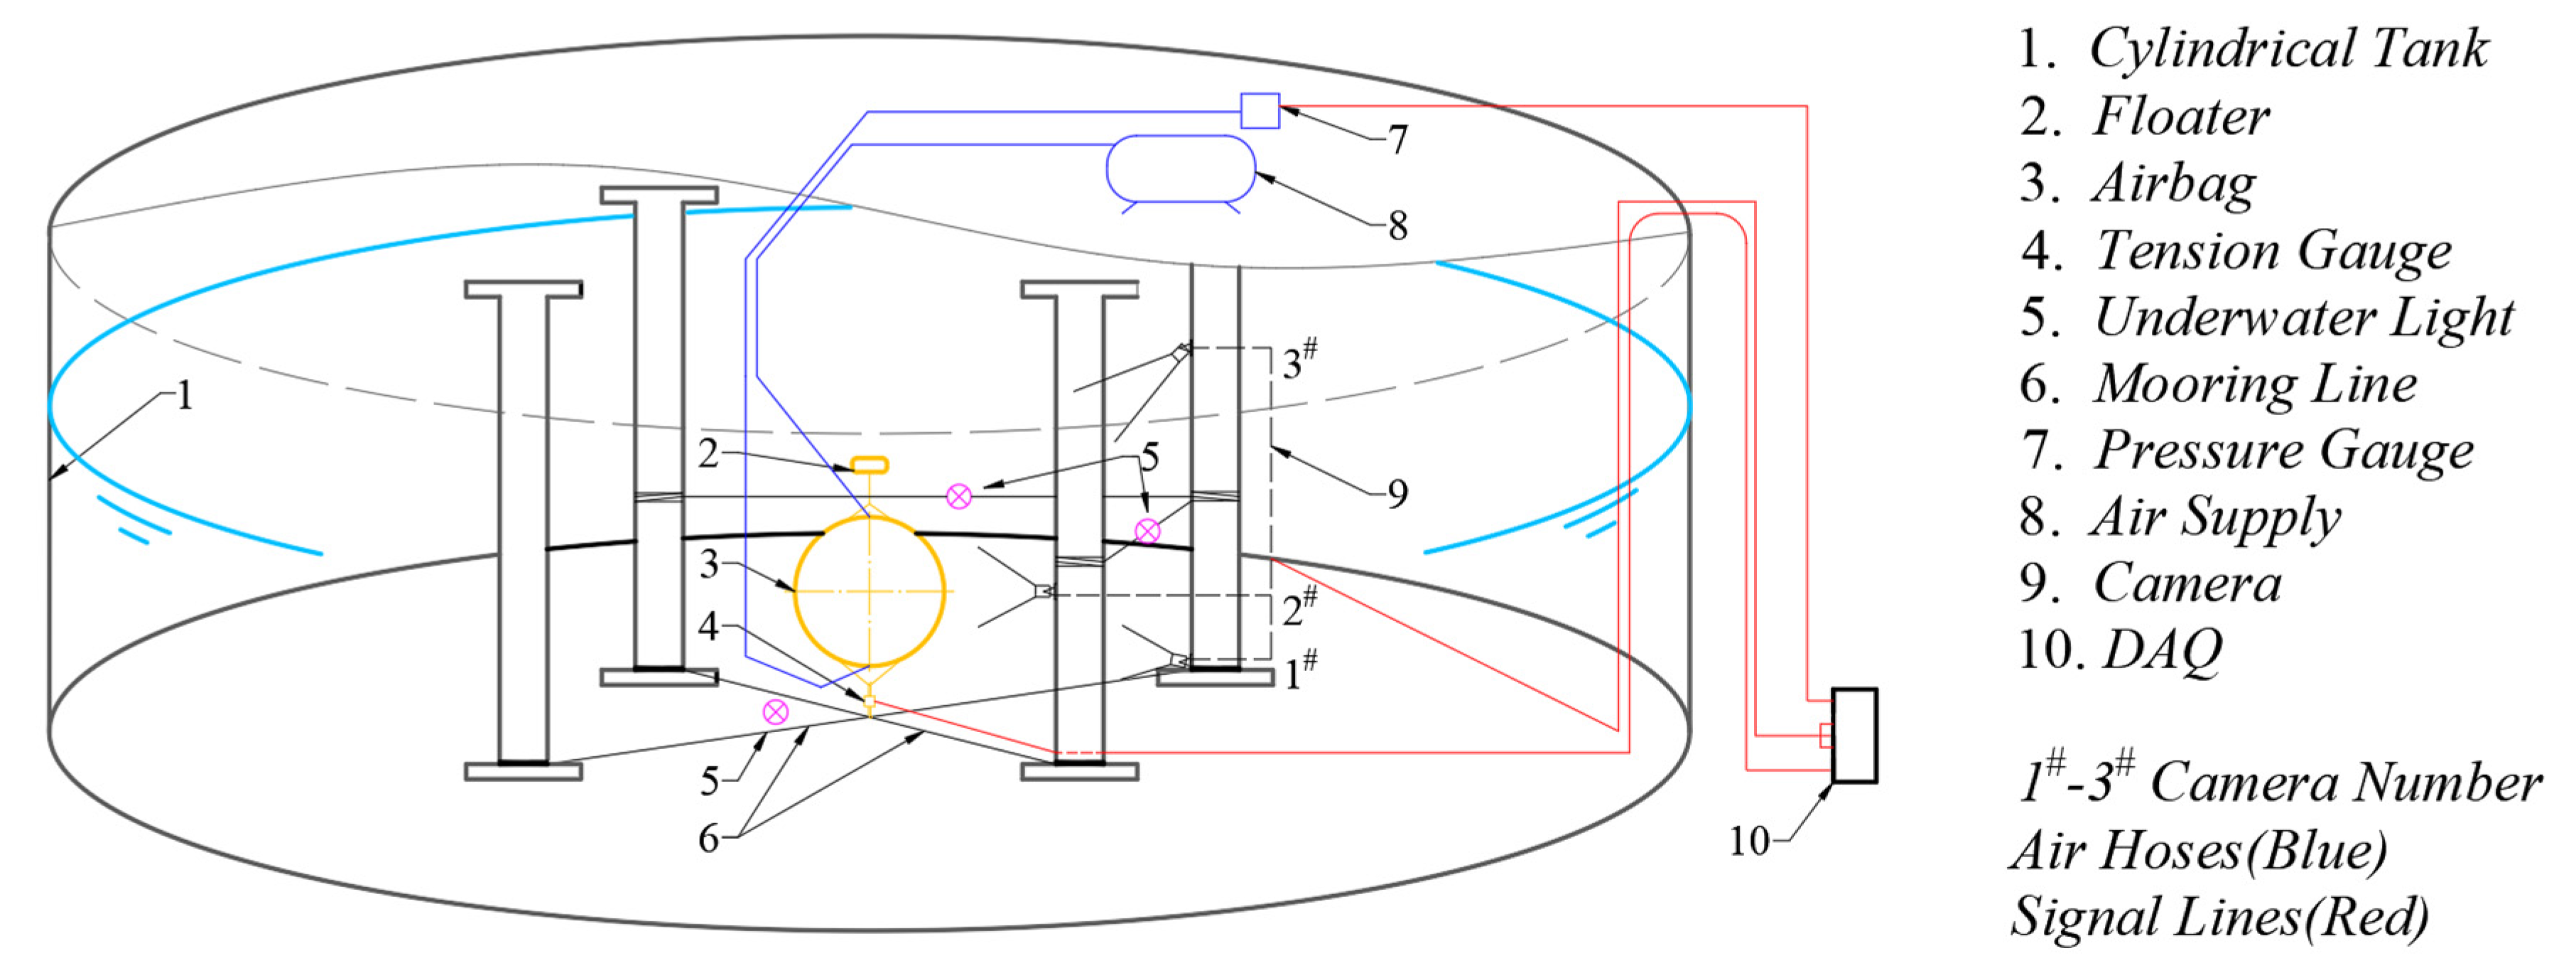
The tank was a cylindrical underground reservoir 3 m high and 11 m in diameter, with a maximum water level of 2.75 m. The configuration is shown in Figure 2. The pondage was more than 220 t, which was much more significant than the maximum displacement of the airbag, and the water surface area was sufficiently large such that the influence of variations in airbag volume on the water level could be neglected during the experiment without water flowing in and out.
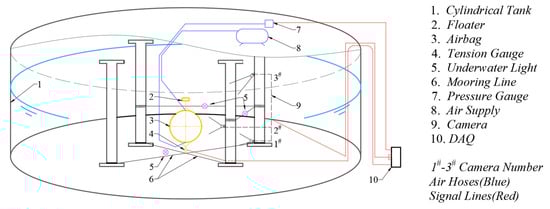
Figure 2.
Layout diagram of equipment and instruments for the reservoir test.
There were four pillars inside, to which the mooring lines and cables were fixed. They formed a square area of 4.1 m in length as the vertexes, and the airbag was installed at the center of the square area.
To ensure the original architectural impermeability of the tank, the instruments and mooring lines were installed using methods to maintain wall integrity. The mooring lines, two stainless steel wire ropes 20 mm in diameter, were mounted at the bottom of the pillars along the diagonals of the square area, and they were tensioned via a chain hoist to maintain sufficient stiffness. At the intersection of the lines, an underwater tension gauge was installed to connect the shackles of the six straps (Figure 3). A set of floaters with a total buoyancy of 10 kgf was installed on top to avoid rolling and falling caused by the lack of buoyancy when the airbag was empty. The fully filled airbag bottom was designed at 1.60 m depth when the tank reached the maximum water level.
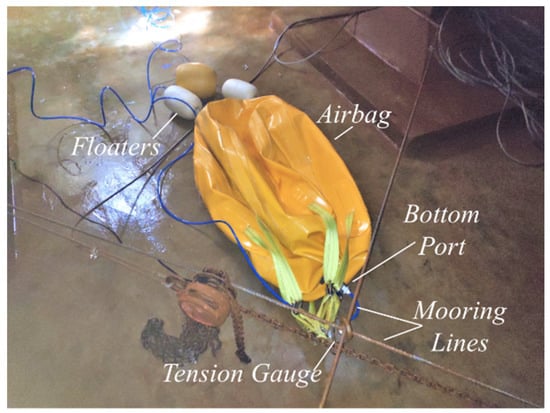
Figure 3.
Installation of the empty airbag model, tension gauge, and mooring lines.
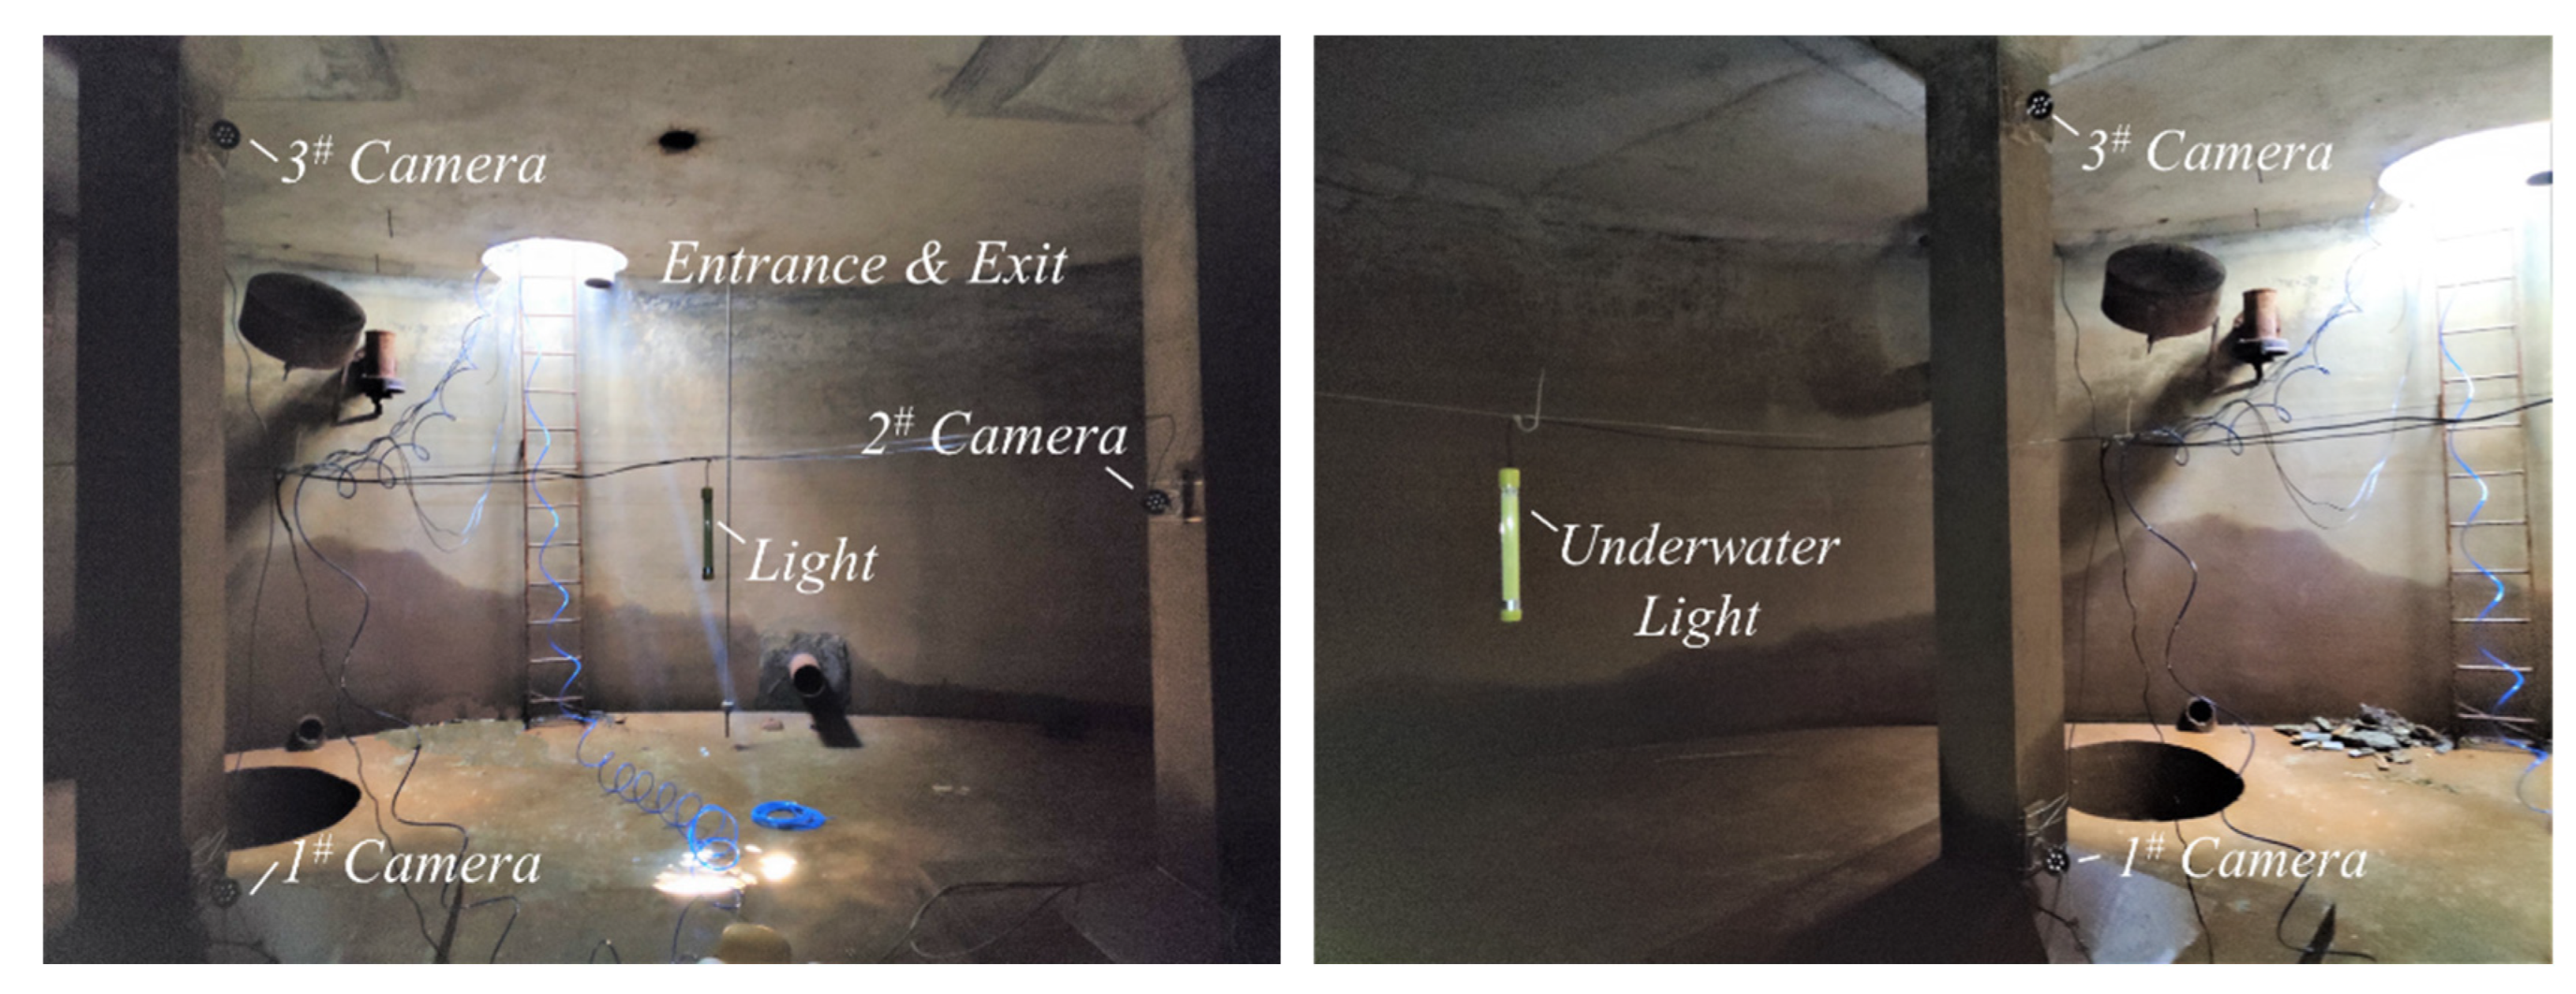
The data to be analyzed were the airbag shape, air pressure, and volume. The deformed shape was captured using three underwater cameras, which were mounted on the pillars to record the deformation process. They were deployed at different shooting angles to decrease the visual error in the distortion caused by the fisheye effect of the cameras, as shown in Figure 2 and Figure 4. They were located at the bottom of the reservoir (#1), at the same height as the airbag center (#2), and at the reservoir ceiling (#3). Camera #1 captured the airbag bottom, #2 focused on the intermediate part, and #3 principally observed the airbag top and water surface. Nevertheless, the underwater image of camera #3 appeared to be severely warped because it crossed two media with a significant refractive index.

Figure 4.
Site configuration of the cameras and lighting in the reservoir.
A pressure gauge was used to measure the air pressure, but the volume was obtained using the equation , where is the buoyancy of the airbag measured by the underwater tension gauge and deals with the effects of the airbag weight and floaters, is water density, and is the gravitational acceleration. The data acquisition (DAQ) system acquired data from these two gauges at a sampling frequency of 2 Hz and saved the images from the cameras simultaneously.
Furthermore, the reservoir was completely enclosed except for a hatch, and it had no lighting. Although the cameras had an infrared function and could acquire images clearly in low-lighting in air, they failed to capture the airbag in the water. Hence three 100 W underwater lamps were arranged near the airbag, and multi-angle lighting provided bright and shadowless photography.
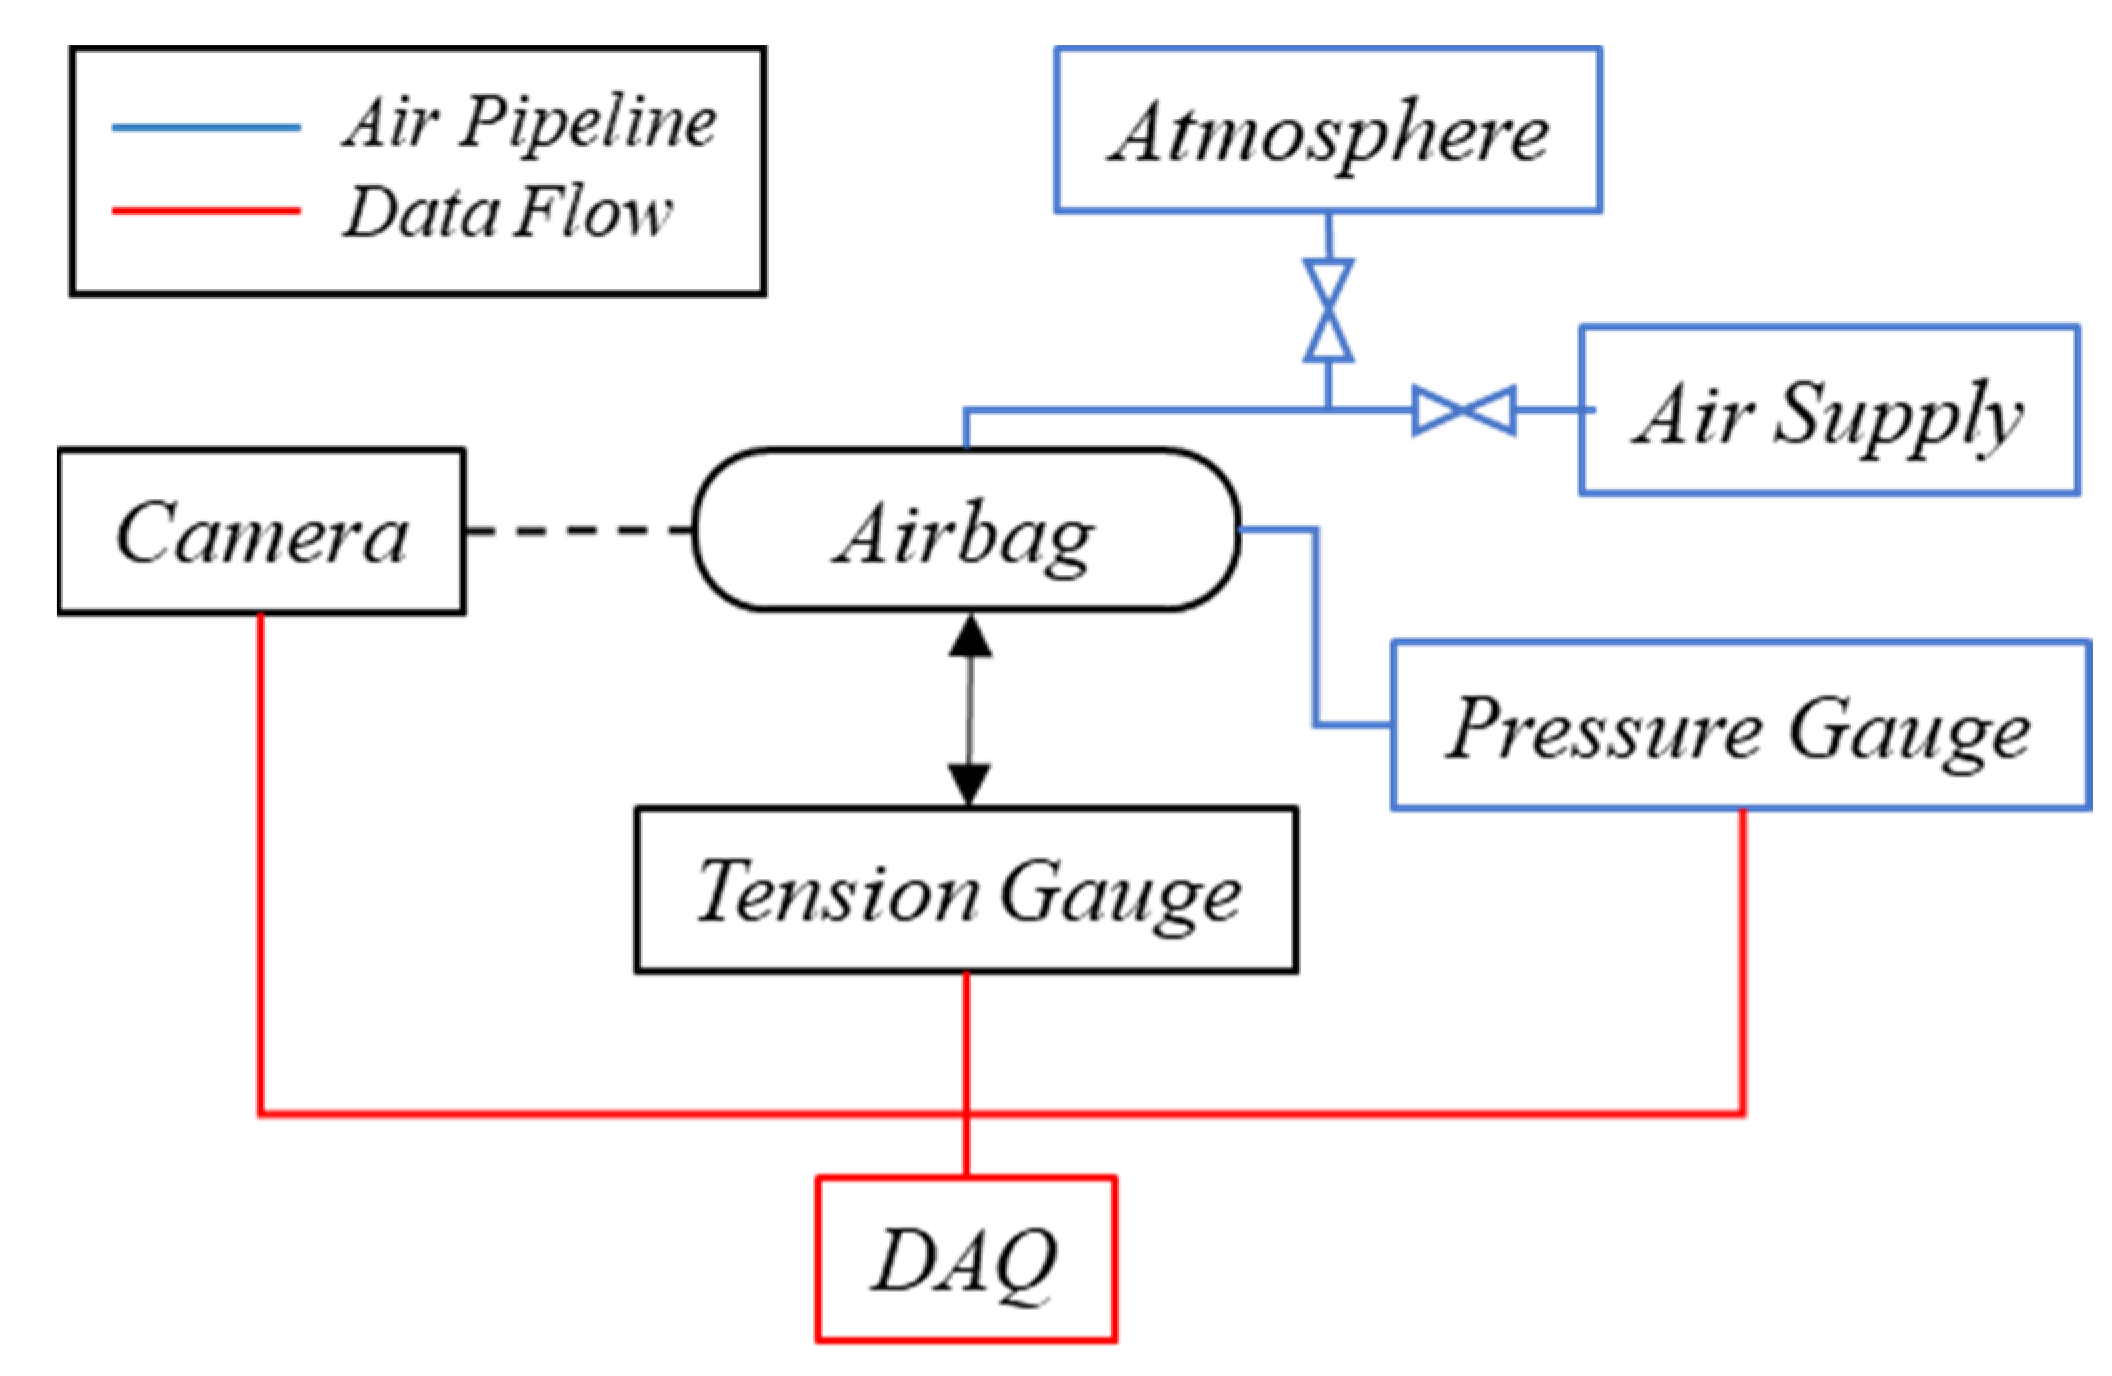
Two 8 mm polyurethane pipelines were attached to the two ports of the airbag. One connected the airbag with a three-way valve that led to the air supply and atmosphere, and the other linked the airbag and gas pressure gauge. The gas flow and measurements were arranged through different ports and pipes, thereby preventing the gauge from being influenced by the stream. A block diagram of the airflow and data flow is shown in Figure 5.

Figure 5.
Block diagram of airflow and data flow.
The air supply comprised a compressor with a rated flux of 100 L/min and a 15 L gasholder. The supply pressure was initially 750 kPa and subsequently decreased to a stable pressure of 300 kPa. The rated pressure of the 1 m airbag was set to 20 kPa, which was the trigger pressure to terminate inflation. The airbag bottom was 1.60 m deep, where the external pressure was approximately 15.7 kPa. The airbag surface could entirely expand owing to the higher internal pressure.
The completely-empty scenario is defined as the initial state. Before the air supply was operated, it was essential to check the underwater lighting, exhaust the internal air and zero the DAQ system. Subsequently, the inflation process began with acquiring the data until the rated pressure was reached. Next, the deflation process began after maintaining a stable pressure for several seconds by switching the valve. Finally, the test ended when the pressure returned to zero and the airbag became empty. In order to ensure the accuracy of the test results, the following measures were adopted in this paper to reduce the system error. The tension gauge and gas pressure gauge were calibrated before installation and testing, and the overall gas circuit underwent a 24-hour pressure-holding test after installation to ensure that there were no leakage points. During the experiment, every test was repeated three times, and the result errors of the repeated tests were less than 2%.
3. Numerical Model
3.1. FE Model
A numerical model of a 1 m airbag comprising the envelope, straps, and mooring point was established. The details of the test model were considered, including the cutting pattern and reinforced welding. Owing to the difference between the ideal sphere and fabricated model, the numerical geometry should parameterize the practical shape to avoid stress concentration and physical distortion produced by too many unsmooth edges.
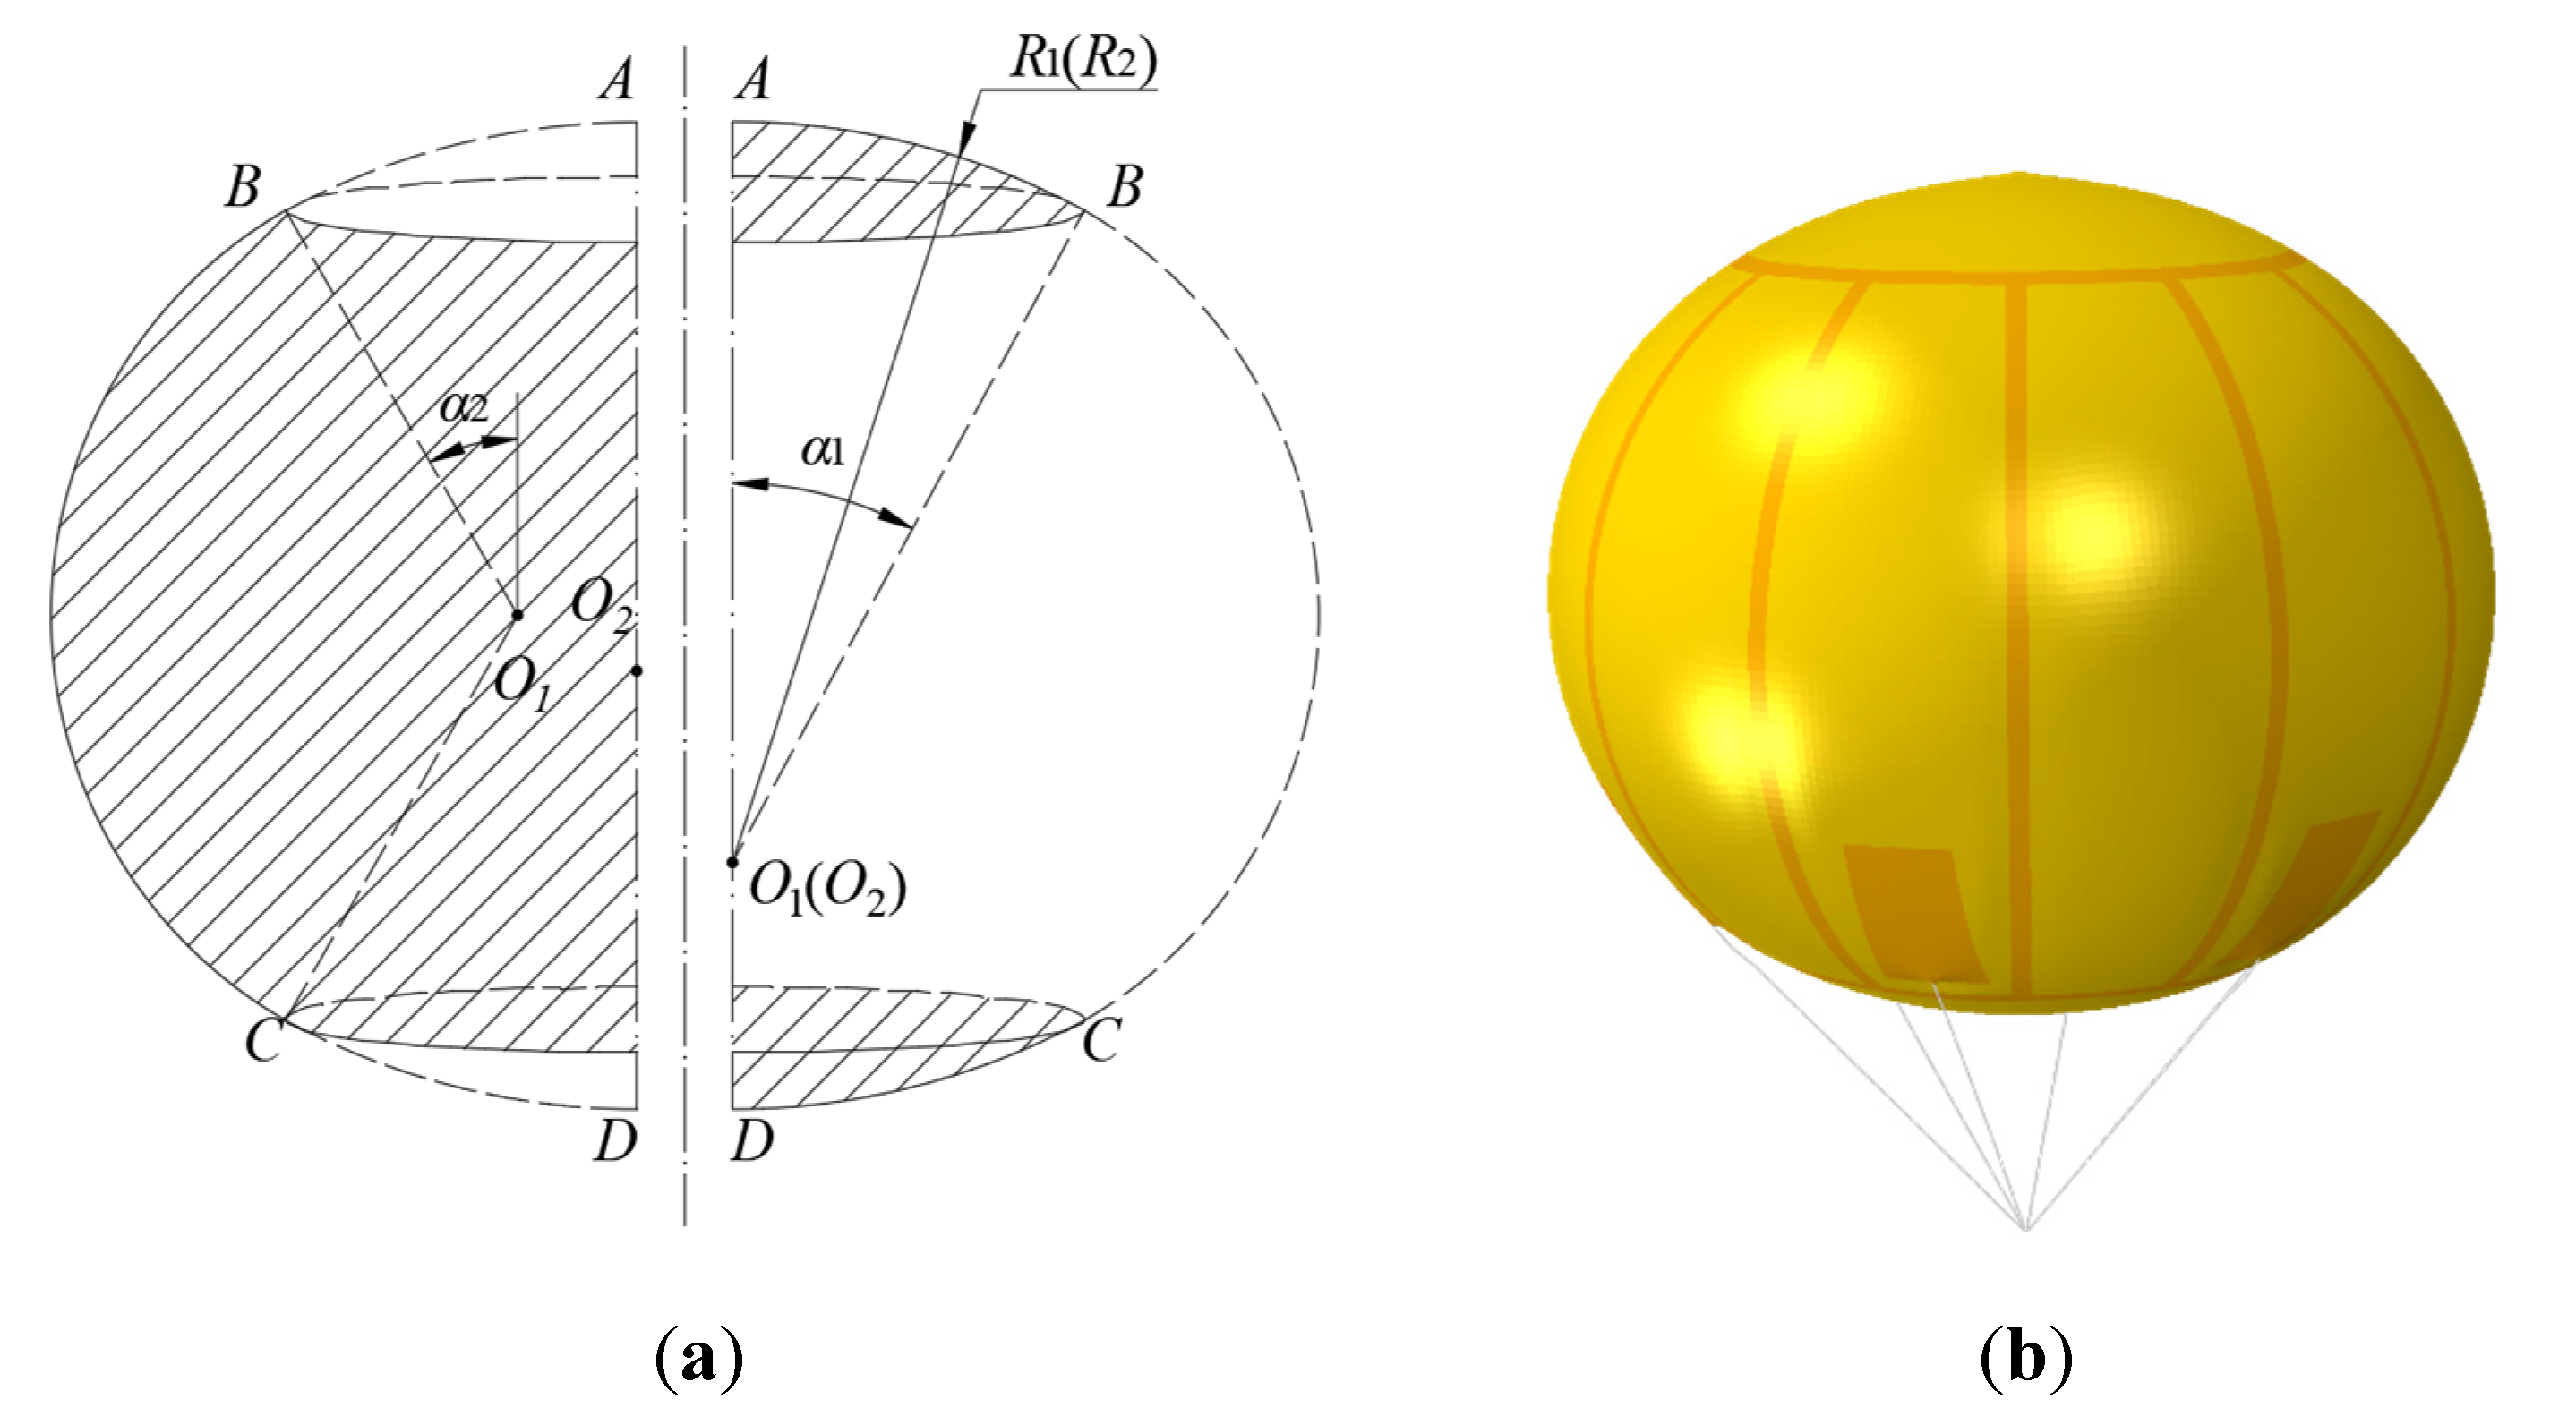
The shape of the fully filled airbag was parameterized, which was axisymmetric around the center axis and symmetric about the equator plane. In Figure 6a, three curves formed the meridian section, and the entire line was continuous and derivable. Points A and D are the top and bottom point, respectively. However, at points B and C, the derivative was discontinuous. The shaded surface in the right half indicates the top and bottom surfaces of the expanded circular disks, and the left shading indicates the lobes. R1 and R2 are the circumferential and meridian radii of curvature, respectively, and O1 and O2 are the corresponding centers of curvature. α1 and α2 are the angles between the vertical axis and the normal direction of the two curves at point B, respectively. The final geometry is shown in Figure 6b. The yellow surfaces represent the ordinary membrane, and the orange portion represents the welding lines and the reinforcement. The grey lines represent the straps.
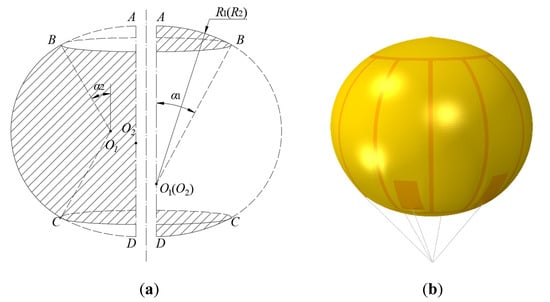
Figure 6.
(a) Layout of the parameterization of the geometry of the 1 m model; (b) geometry model adopted in the simulation.
The properties of ordinary surfaces were set to be the same as those of the PVC-coated fabric, and the material property was assumed to be isotropic in the simulation. The reinforced surface had the same material but was three times thicker than the ordinary surface. The S4 and S3 elements are used at the envelope, and the entire internal side was set as a fluid cavity with F3D4 elements in Abaqus/Explicit [33]. The straps were designed to withstand only tension, hinged at the mooring point and completely tied to the airbag.
A concentrated force of 10 kgf, equal to the buoyancy force of the floaters, was set at the top point to maintain the posture, as in the experiment. The internal and external fluid influences were considered as static pressure forces, because the current is extremely slow in deep water of hundreds of meters and the practical cycle process is quasi-static. The hydrodynamic influences of both fluids were ignored in the simulation based on the practical conditions. Internal gas pressure and external hydrostatic pressure were set as the distributed forces acting on the surface in the normal direction. The hydrostatic pressure was calculated and defined by the subroutine VDLOAD. In the subroutine, the depth of every envelope element was obtained with built-in variables, and the normal pressure was assigned and updated by applying the hydrostatic pressure formula in each time step. In Abaqus/Explicit, the gas pressure in the closed surface defined as a fluid cavity follows the ideal gas law with a given gas flux value or function, and all of the elements are assigned the same pressure value. The approximation of the uniform gas pressure distribution has a slight effect on the surface pressure difference, and it is acceptable because the water pressure gradient with respect to the depth is much higher than the gas pressure gradient. The inflation and deflation behaviors were controlled using the volumetric flux of the fluid cavity and inflator property.
Based on the numerical model above, the characteristic variation of the airbag during a period of the fill/exhaust process could be analyzed using Abaqus/ Explicit. Because the entire model was not equilibrated initially, the airbag oscillated and the properties of the fluid cavity fluctuated. Although the geometry was fully expanded, the simulation could not directly initiate the air-releasing process. Therefore, it was possible to prepare an exhausted airbag and start the cycle simulation from the empty state. First, the full structure was stabilized, and the pressure was maintained at approximately 20 kPa under the same conditions as the experiment. Subsequently, an expected empty shape for a period was obtained after stable deflation. Finally, the empty shape provided natural equilibrium at the beginning of the quasi-static simulation after initialization. The calculation parameters were verified and validated during the initialization process described in Section 3.2.
3.2. Verification and Validation
Three parameters, i.e., mesh number, viscous pressure coefficient, and mass scaling factor (MSF), were evaluated to obtain an acceptable and compromised model that could reproduce the experimental conditions and satisfy the calculation accuracy with a time cost as low as possible. The Abaqus/Explicit procedure integrates through time using many small time increments, and the smaller the increment, the longer the computational cost becomes.
The stable time increment is given by the following equation [33]:
where is the dimension of the smallest element in the model, and is the dilatational wave speed in terms of material properties [33]. Owing to the isotropic and linear-elastic material, is given by:
where is Poisson’s ratio, is Young’s modulus of the material, and is the material density.
3.2.1. Mesh
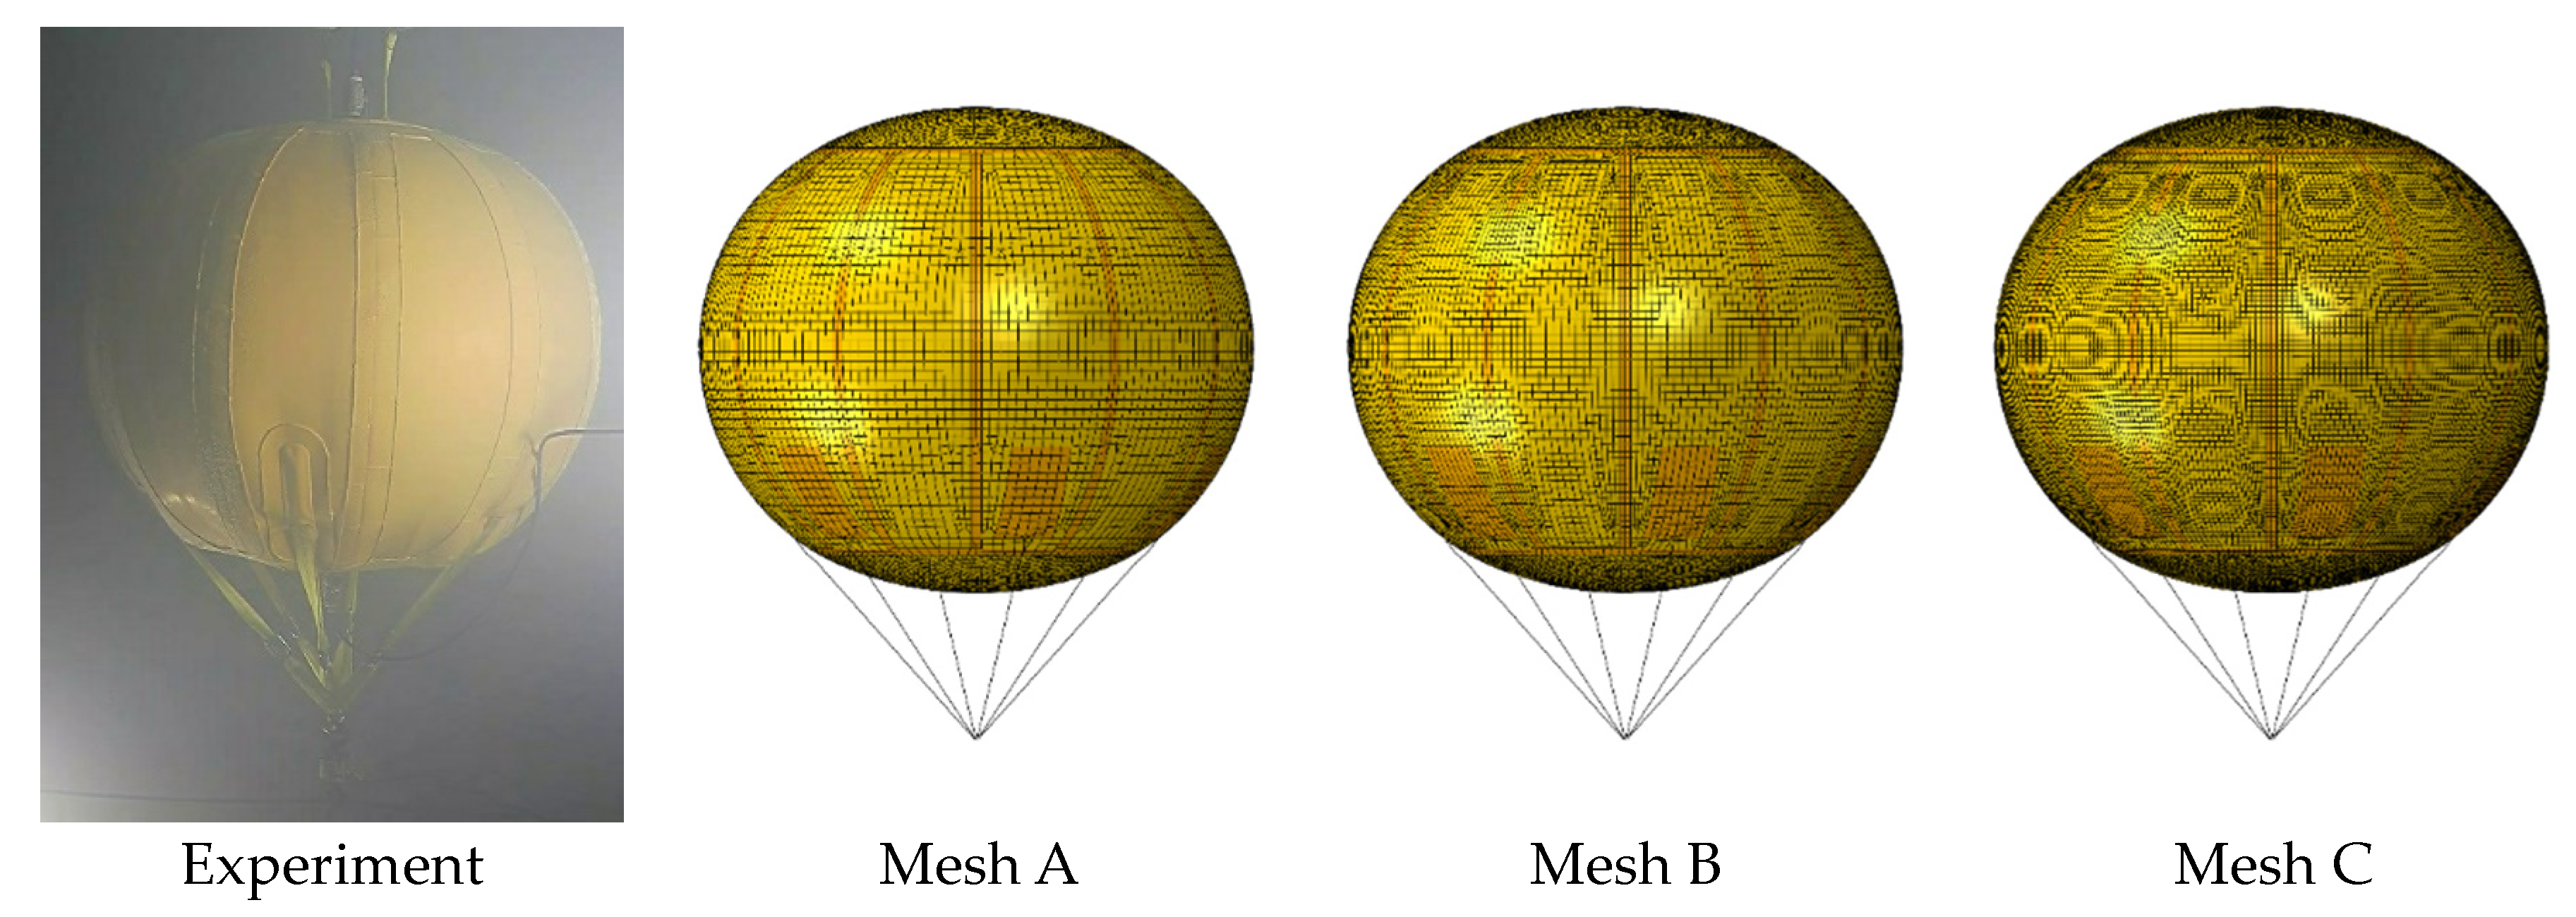
Three different element sizes (0.018, 0.014, and 0.010 m) were used to generate the meshes identified as mesh A, B, and C, respectively, as shown in Figure 7. The mesh was selected from the three sizes by comparing the stress error with the theoretical value, because the practical surface stress was not measured in the experiment.
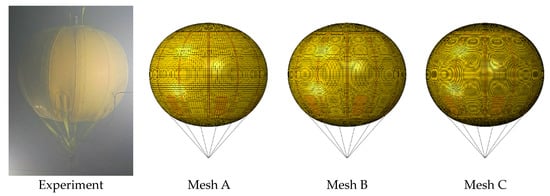
Figure 7.
Full-filled airbag configuration in the experiment and different meshes with three element sizes.
According to the Young-Laplace equation, the meridian and circumferential stresses are the same at the top point on a theoretically spherical surface, and they are evaluated as follows:
where and are the internal and external pressures, respectively, at the top point, is the curvature radius, and is the film thickness. The results of different meshes are summarized in Table 2 and compared with the theoretical value.
Table 2.
Stress results at the top point in the three meshes and errors with respect to the theoretical value.
The stress error of the three meshes was all within the allowable range. It is noted that the top force for additional buoyancy was not used to reduce the error. Although a large element size results in a low time cost, it is crucial to avoid distortion, element penetration, and intersection during contact. Refined meshes minimize the empty airbag volume by closer contact distance, which approaches reality. Therefore, mesh C was adopted for the following calculations.
3.2.2. Viscous Pressure
Viscous pressure is defined to dampen the oscillation motion at the initial stage and the dynamic response when the airbag is partially inflated [33]. Thus, the structure reaches static equilibrium and maintains quasi-static variation without reducing the time increment.
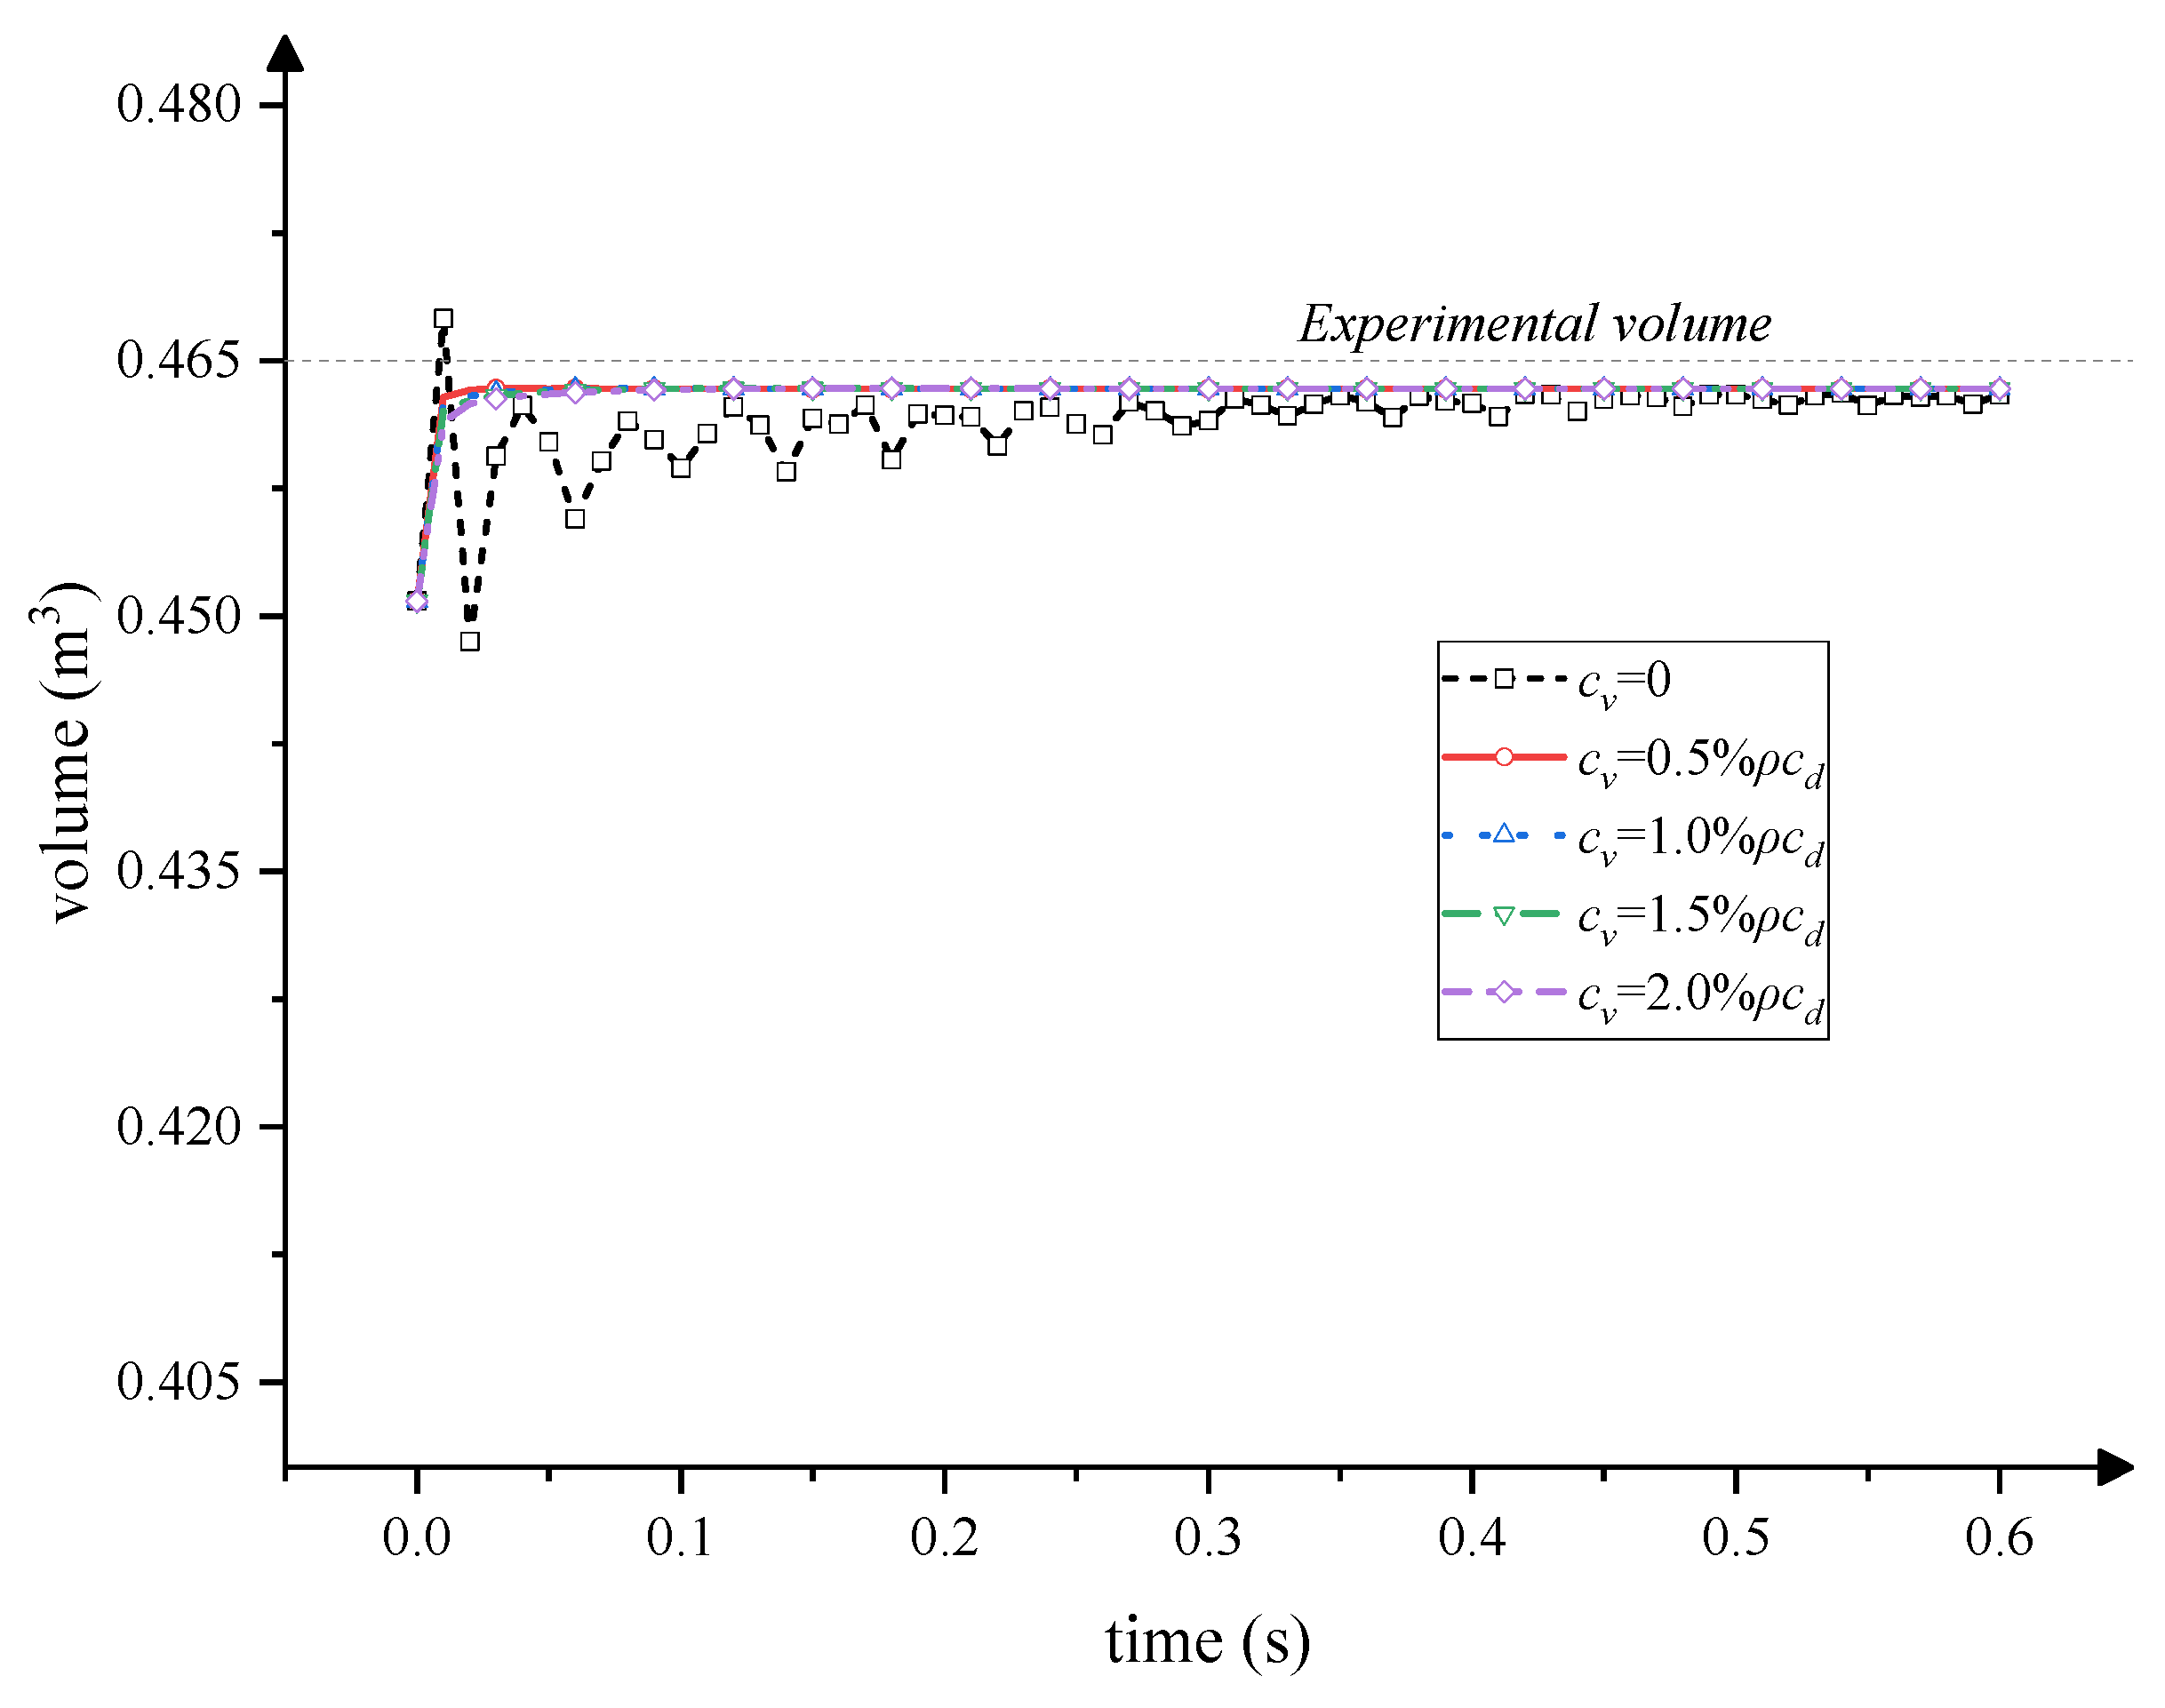
An appropriate viscous pressure can achieve a damping effect without absorbing an excessive amount of energy. The recommended coefficient of viscous pressure is equal to a small percentage of as an effective method of minimizing ongoing dynamic effects, where is the material density. Five percentages (0, 0.5%, 1.0%, 1.5%, and 2.0%) were analyzed in the fully filled airbag without airflow for initial stabilization.
Table 3 shows the simulated volume results in these five simulations for 0.6 s with respect to the experimental parameter. The computational time for all scenarios was within 4.11–4.32 h. For , the cavity volume fluctuated for a long time and hardly converged (Figure 8). The existence of viscous pressure stabilized the value and shortened the convergence time, which was beneficial in reducing the time cost. The four scenarios with viscous pressure revealed an acceptable effect, thus, was adopted in the numerical model.
Table 3.
Volume results for five different percentages of ρcd for viscous pressure coefficient and errors with respect to the experimental volume of 0.465 m3.
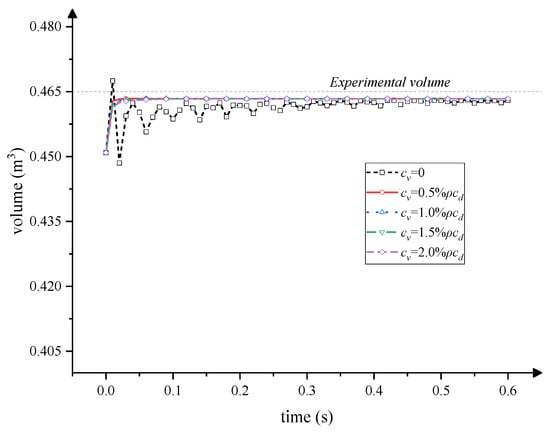
Figure 8.
Volume variation with different viscous pressure coefficients in a 0.6 s calculation of stabilization at the full state.
3.2.3. Mass Scaling Factor
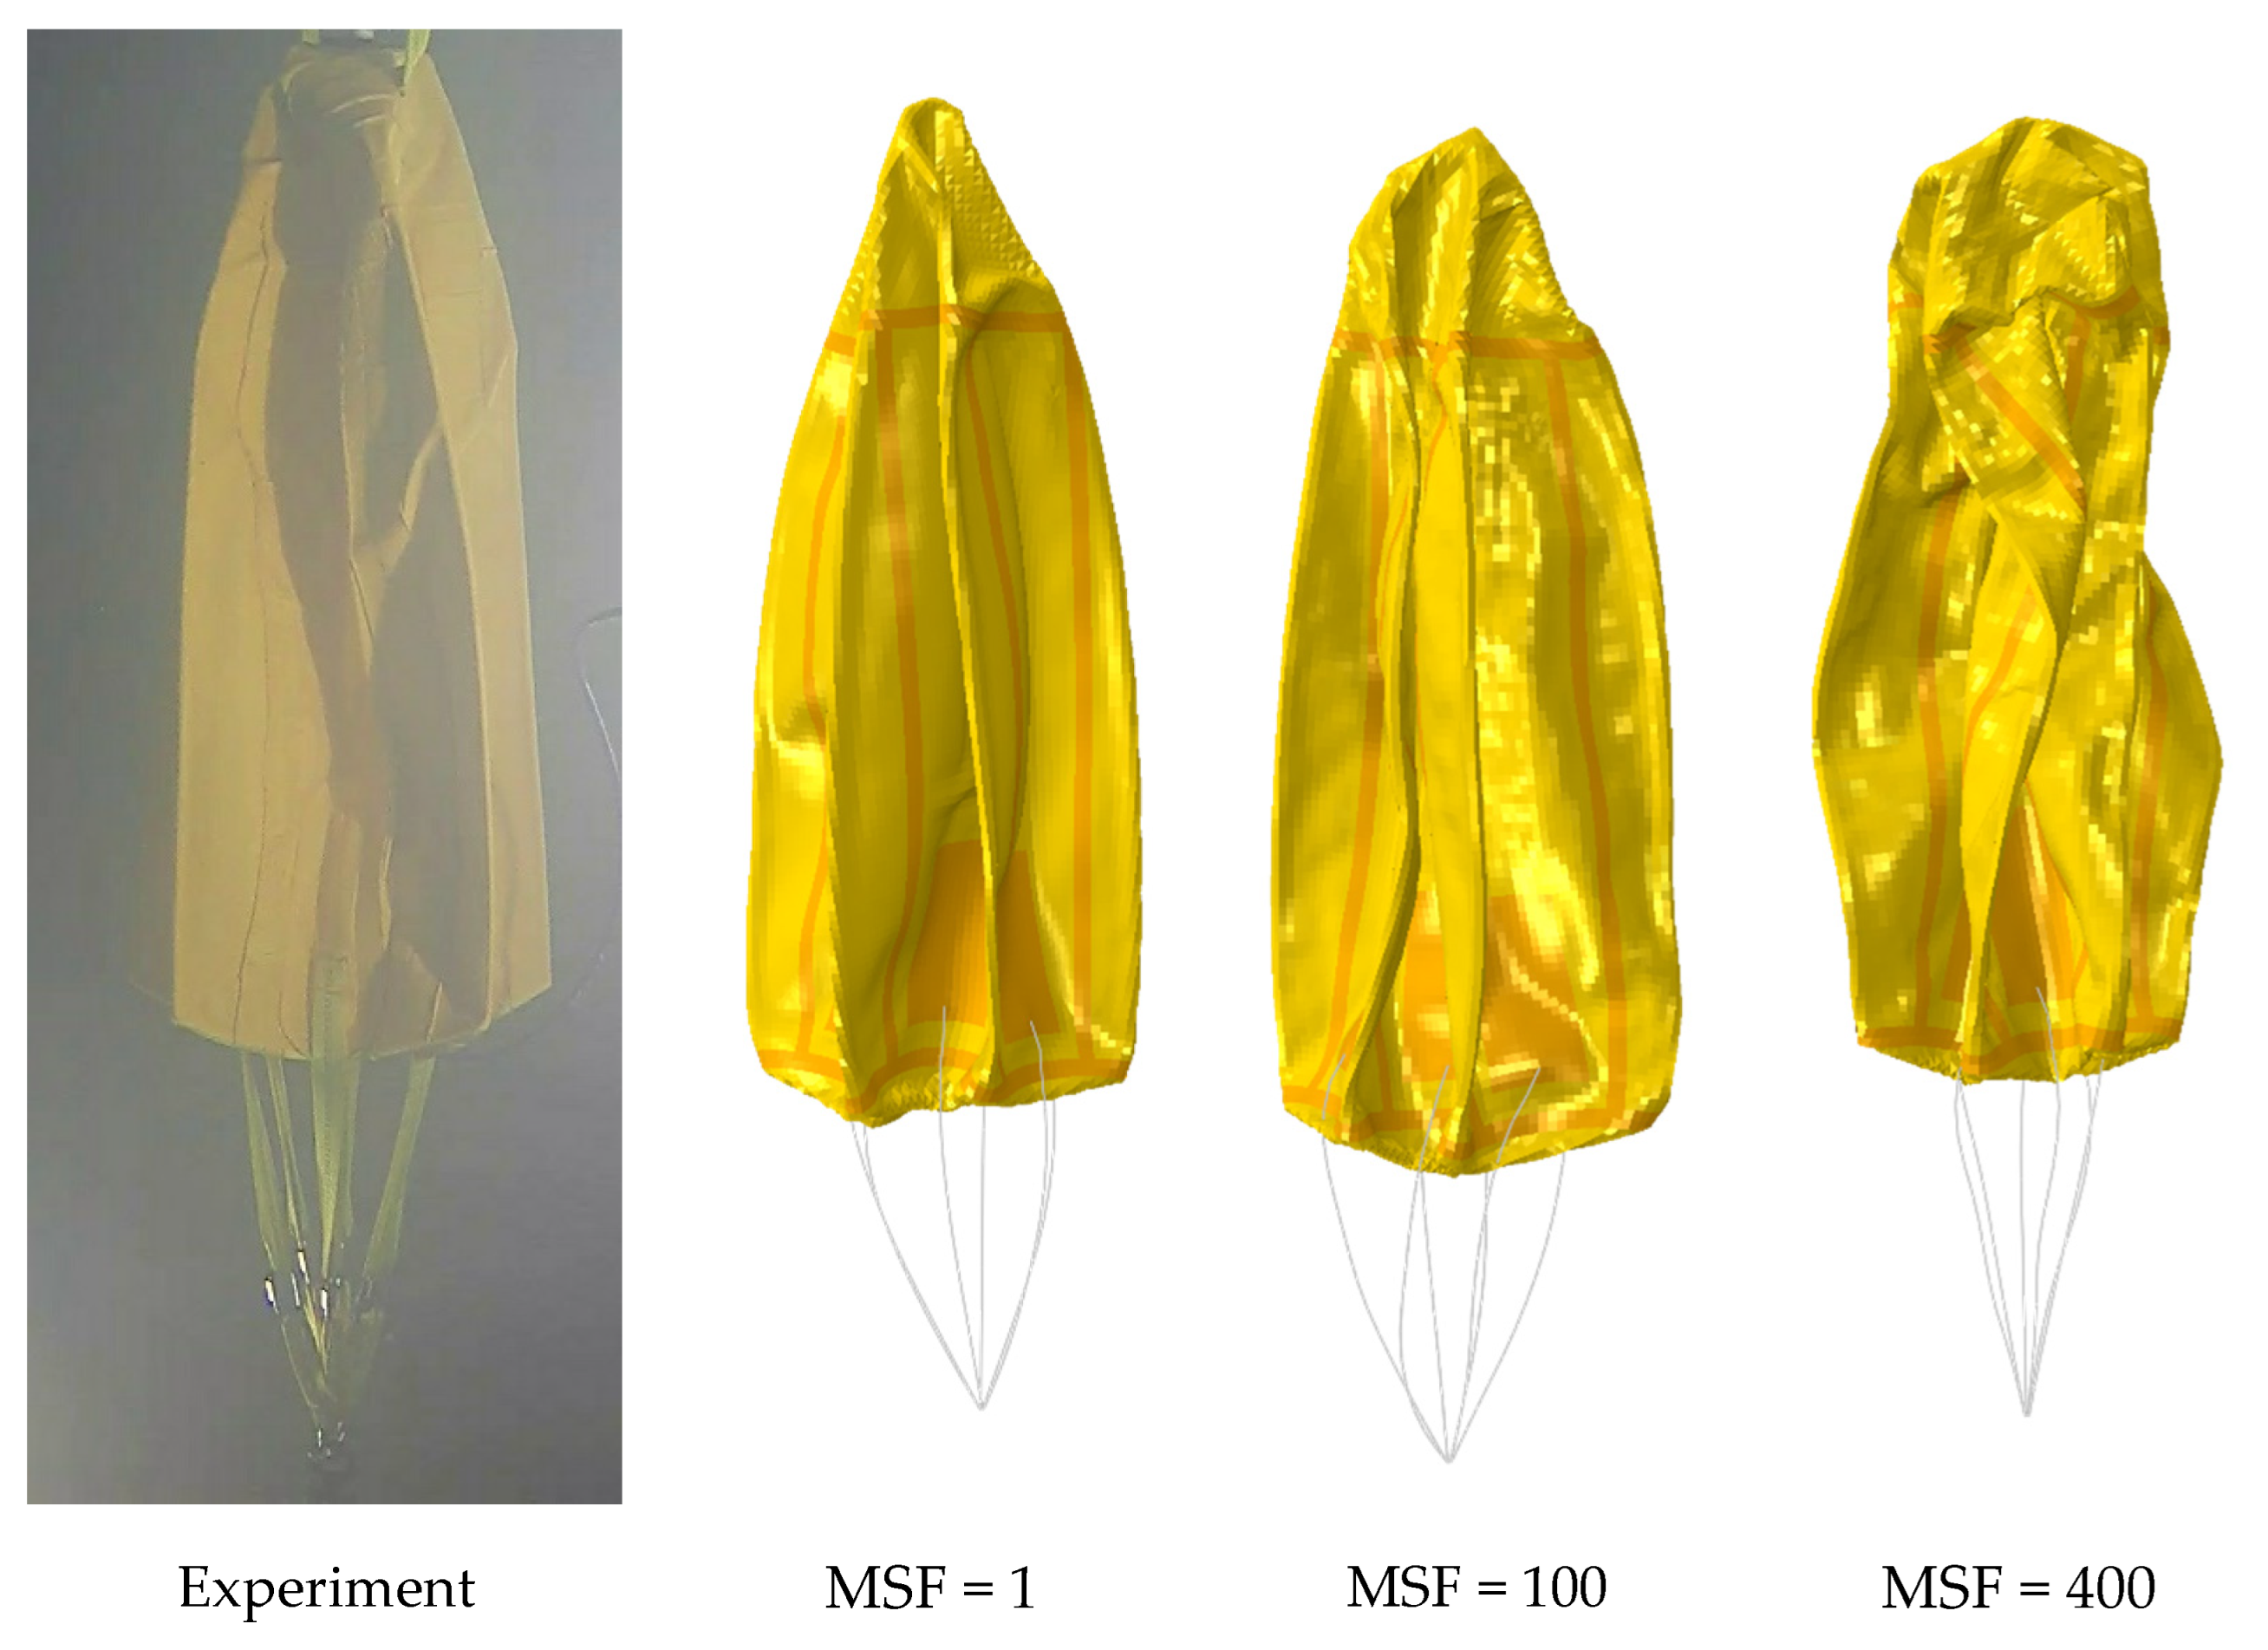
The viscous pressure can decrease the time of convergence, but it does not contribute to increasing the stable time increment. The mass scaling method artificially increases the material density through the MSF, and the time increment theoretically increases to by changing the dilatational wave speed of the material. Nevertheless, a higher factor will change the predicted response of the structure owing to the aggravating effect of the inertial force; thus, the deformation cannot be considered a quasi-static process. In the Abaqus/Explicit procedure, the behavior of the model can be considered quasi-static if the ratio of kinetic energy of the deformed model to its internal energy (KE/IE) is below 5–10% [33]. Three MSF values (1, 100, and 400) were used to simulate the deflation process, corresponding to the proportion of the expected time scaling of 1, 1/10, and 1/20.
The height of the exhausted airbag and the time consumption with different MSFs are summarized in Table 4. The scenarios of MSF = 100 and MSF = 400 required approximately 13.4% and 7.9%, respectively, of the time for that of MSF = 1. All scenarios indicated that the height results compared with the experimental height of 1.10 m were in the permitted range of error, and MSF = 100 had the minimum error. All scenarios could be considered quasi-static owing to the desirable peak KE/IE. However, there was a potential risk of significant inertia effects because the peak value reached 8.58% for MSF = 400.
Table 4.
Time consumption, peak KE/IE ratio, empty airbag height, and height errors with respect to experimental height of 1.10 m under different MSFs during the deflation process.
As shown in Figure 9, a comparison of the simulated shapes with the experimental one shows that the empty shape when MSF = 400 was overtwisted. It can be seen that the high MSF introduces a significant inertial effect, resulting in the apparently unstable motion of the top surface in the final deflation stage. The comparison shows that the overall structure with MSF = 400 has excessive deformation from the physical reality. The results of MSF = 1 and MSF = 100 are consistent with the experiment, and the simulation meets the quasi-static requirements. Hence, MSF = 100 was applied in the subsequent simulations considering the cost of calculation time.
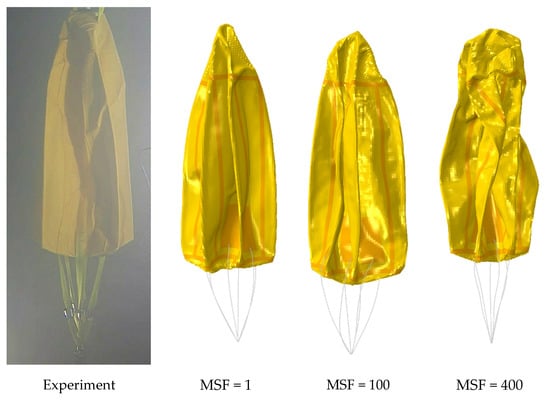
Figure 9.
Comparison of the experimental empty shape and numerical shapes with different MSFs.
4. Results
4.1. 1 m Model
The results of the 1 m model in the test and simulation are discussed. The inflation and deflation simulation cycle was performed based on the numerical model of a 1 m airbag with a maximum storage pressure of 20 kPa. The entire process is considered quasi-static because the overall KE/IE ratio was less than 7.4%.
4.1.1. Pressure
The stored air volume is dimensionless as the inflation ratio , where is the measured time-dependent volume, and is the volume when the airbag reaches the zero-pressure shape. The zero-pressure shape is defined as the specific state when the internal and external pressure difference at the bottom is zero. In the experiment, is given by the measured value in the suspension test.
The normalized pressure is defined as , where is the measured pressure, and is the rated pressure of 20 kPa in a 1 m airbag model. Hence, the theoretical of the zero-pressure shape was 0.785, given by the ratio of the hydrostatic pressure at a 1.60 m depth to the rated pressure. Moreover, the theoretical at the beginning of inflation and the end of deflation was 0.245, given by the ratio of the hydrostatic pressure at the top point of 0.50 m depth to the rated pressure. When the airbag was empty in the experiment, the entire gas circuit had zero relative pressure, which was equal to the atmosphere. Hence, the initial pressure of the fluid cavity was set to zero.
The relationship between and during the cycle is shown in Figure 10. The dashed line at is the theoretical zero-pressure reference line, and the dashed line is the empty-shape reference line. The curves of the simulation and experiment exhibited identical trends and could be divided into three phases by the two reference lines.
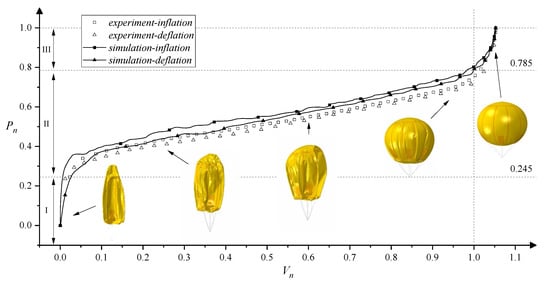
Figure 10.
Relation of dimensionless pressure and inflation ratio of the 1 m airbag in the experiment and simulation.
In phase I, air flowed into or out of the gas circuit and was primarily in the hose above the empty airbag. The airbag was sensitive to changes in pressure, so the pressure rapidly increased from 0 to 0.245 at a low inflation ratio. During phase II, the compressed air flowed into the airbag stably, and the pressure increased linearly with increasing volume until it reached the zero-pressure shape (). In phase III, the over-pressurized airbag was already expanded completely (). Hence the shape and volume changed slightly, but the pressure increased quickly.
In Figure 10, the simulated is approximately at the zero-pressure reference line for , and the simulation results are higher than the corresponding experimental results. When , the higher the , the more significant the difference in the curves, but the curves go gradually closer when the airbag is over-pressurized (). In phases I and III, the normalized pressure error between the simulation and the experiment is below 5%, and the error during phase II is about 6%. The error is not caused by numerical calculation but by the depth change of the movable mooring point within a small range during the experiment. This point in the simulation was fixed; however, the buoyancy made it offset upwards from the designed position in the experiment.
Although dimensions and operating depths were different between the scaled model and prototype, the - relationship of the prototype could be given by moving the experimental reference lines to equal those of the prototype and scaling the results within the local phase range along the pressure axis.
4.1.2. Deformation
The shapes of the inflation and deflation processes have identical characteristics for the same volume. The regulation of the shape variation in the two processes is inverse. Therefore, the deformed shape only depends on the inflation ratio and is independent of the process.
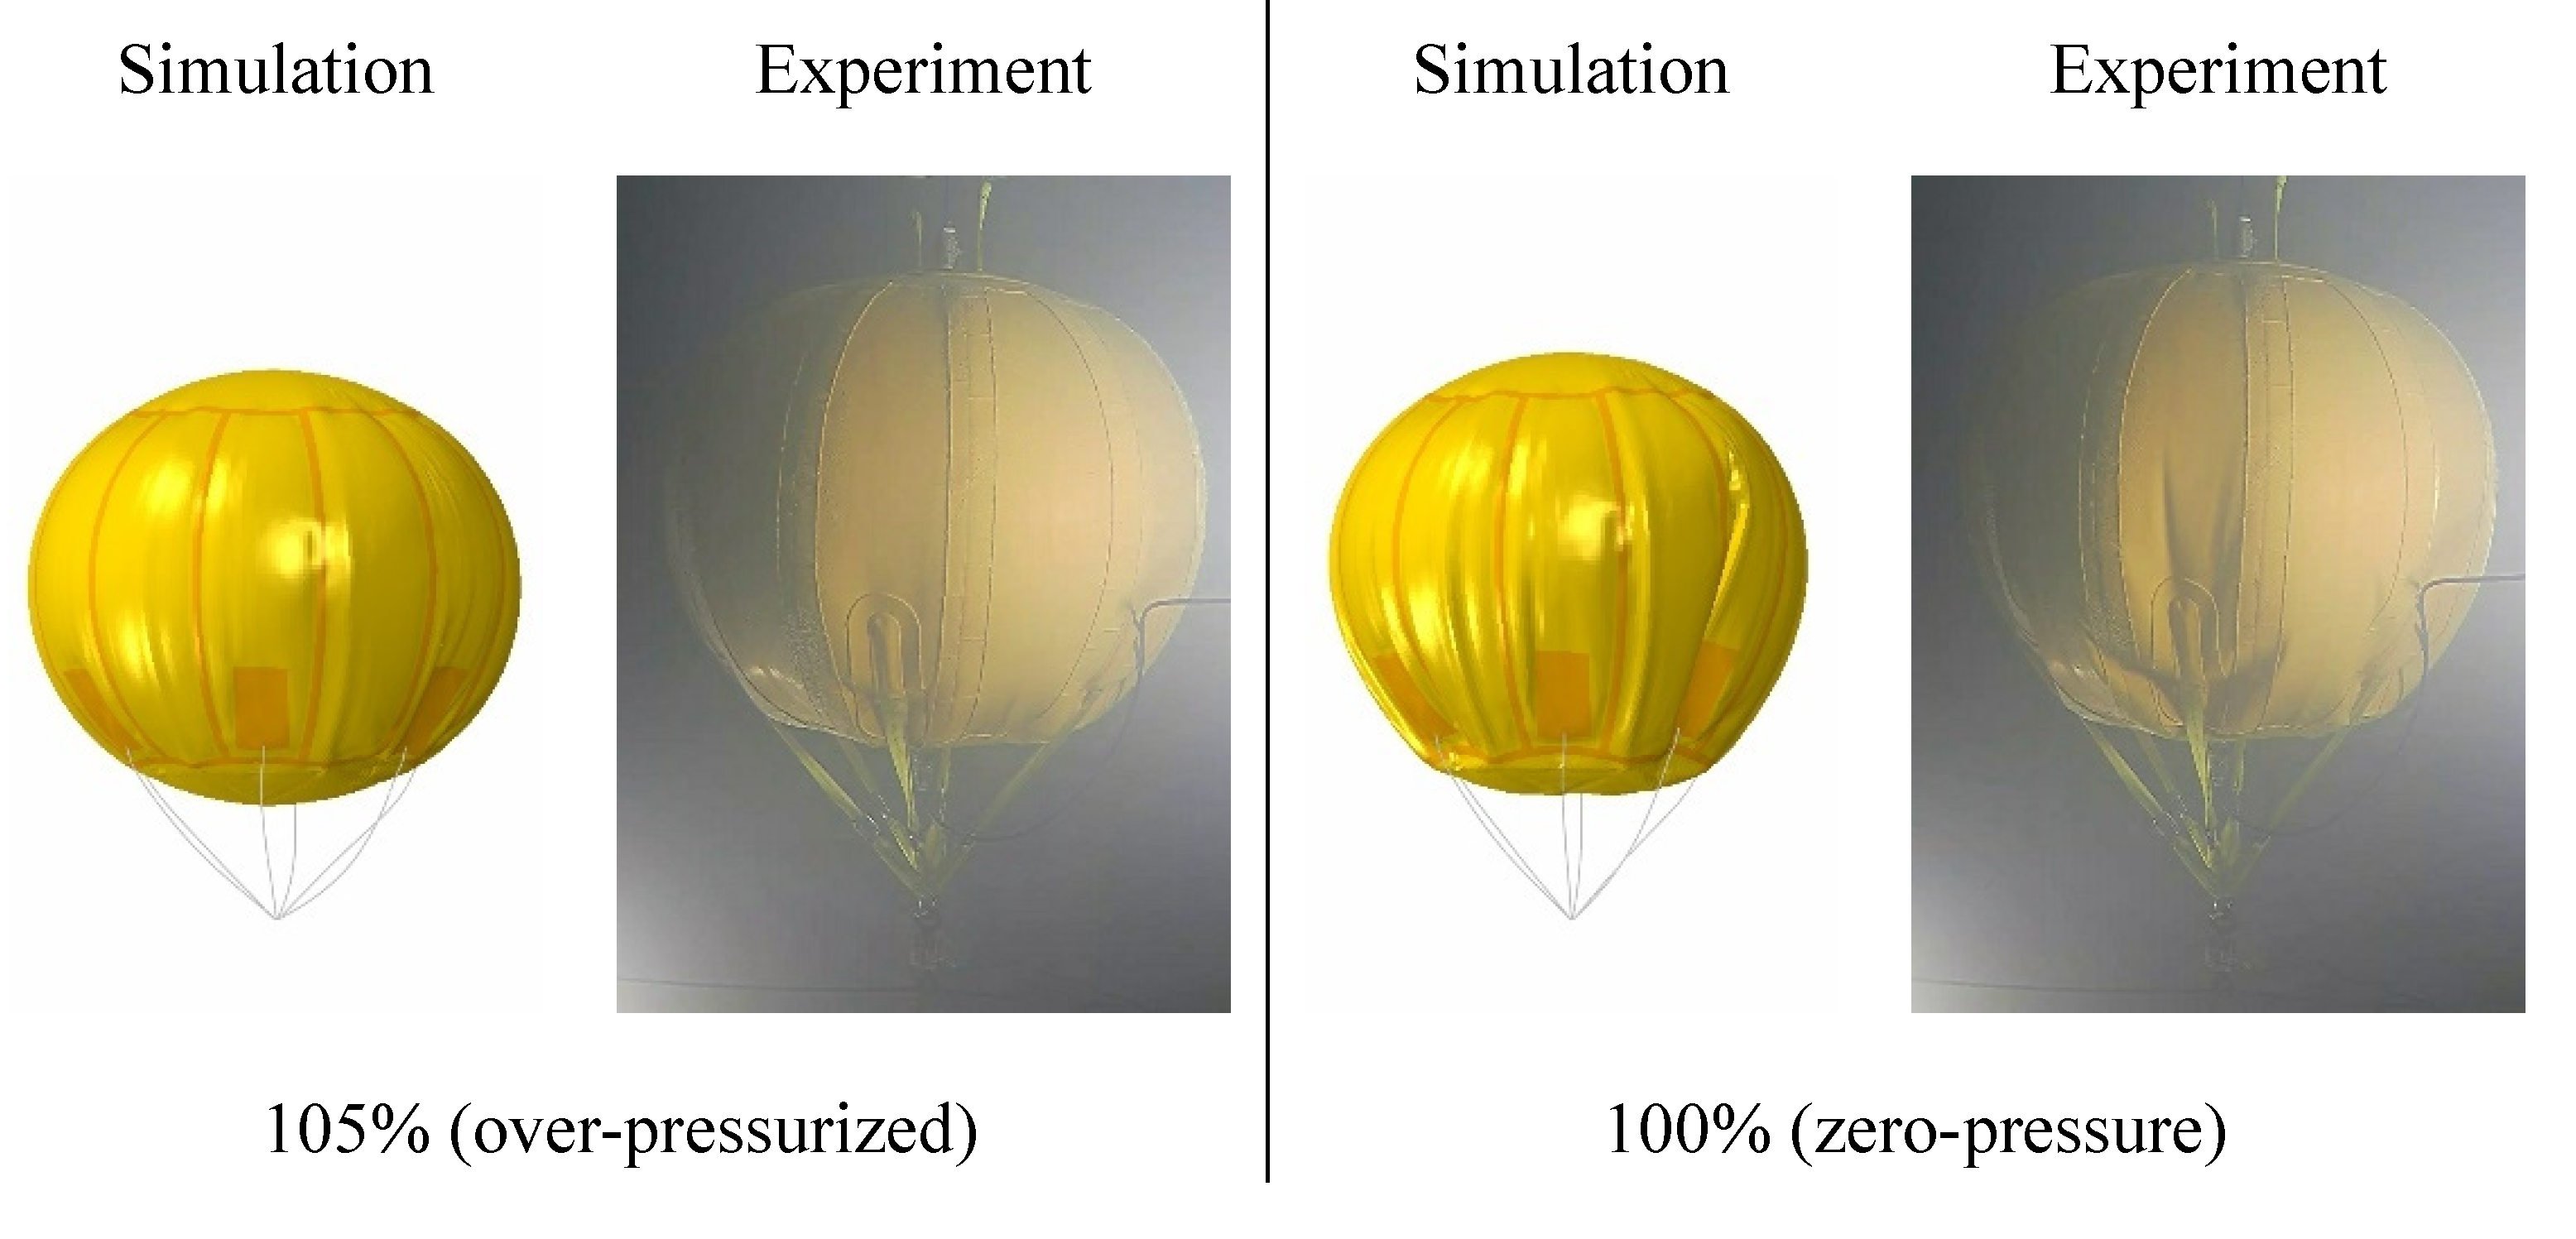
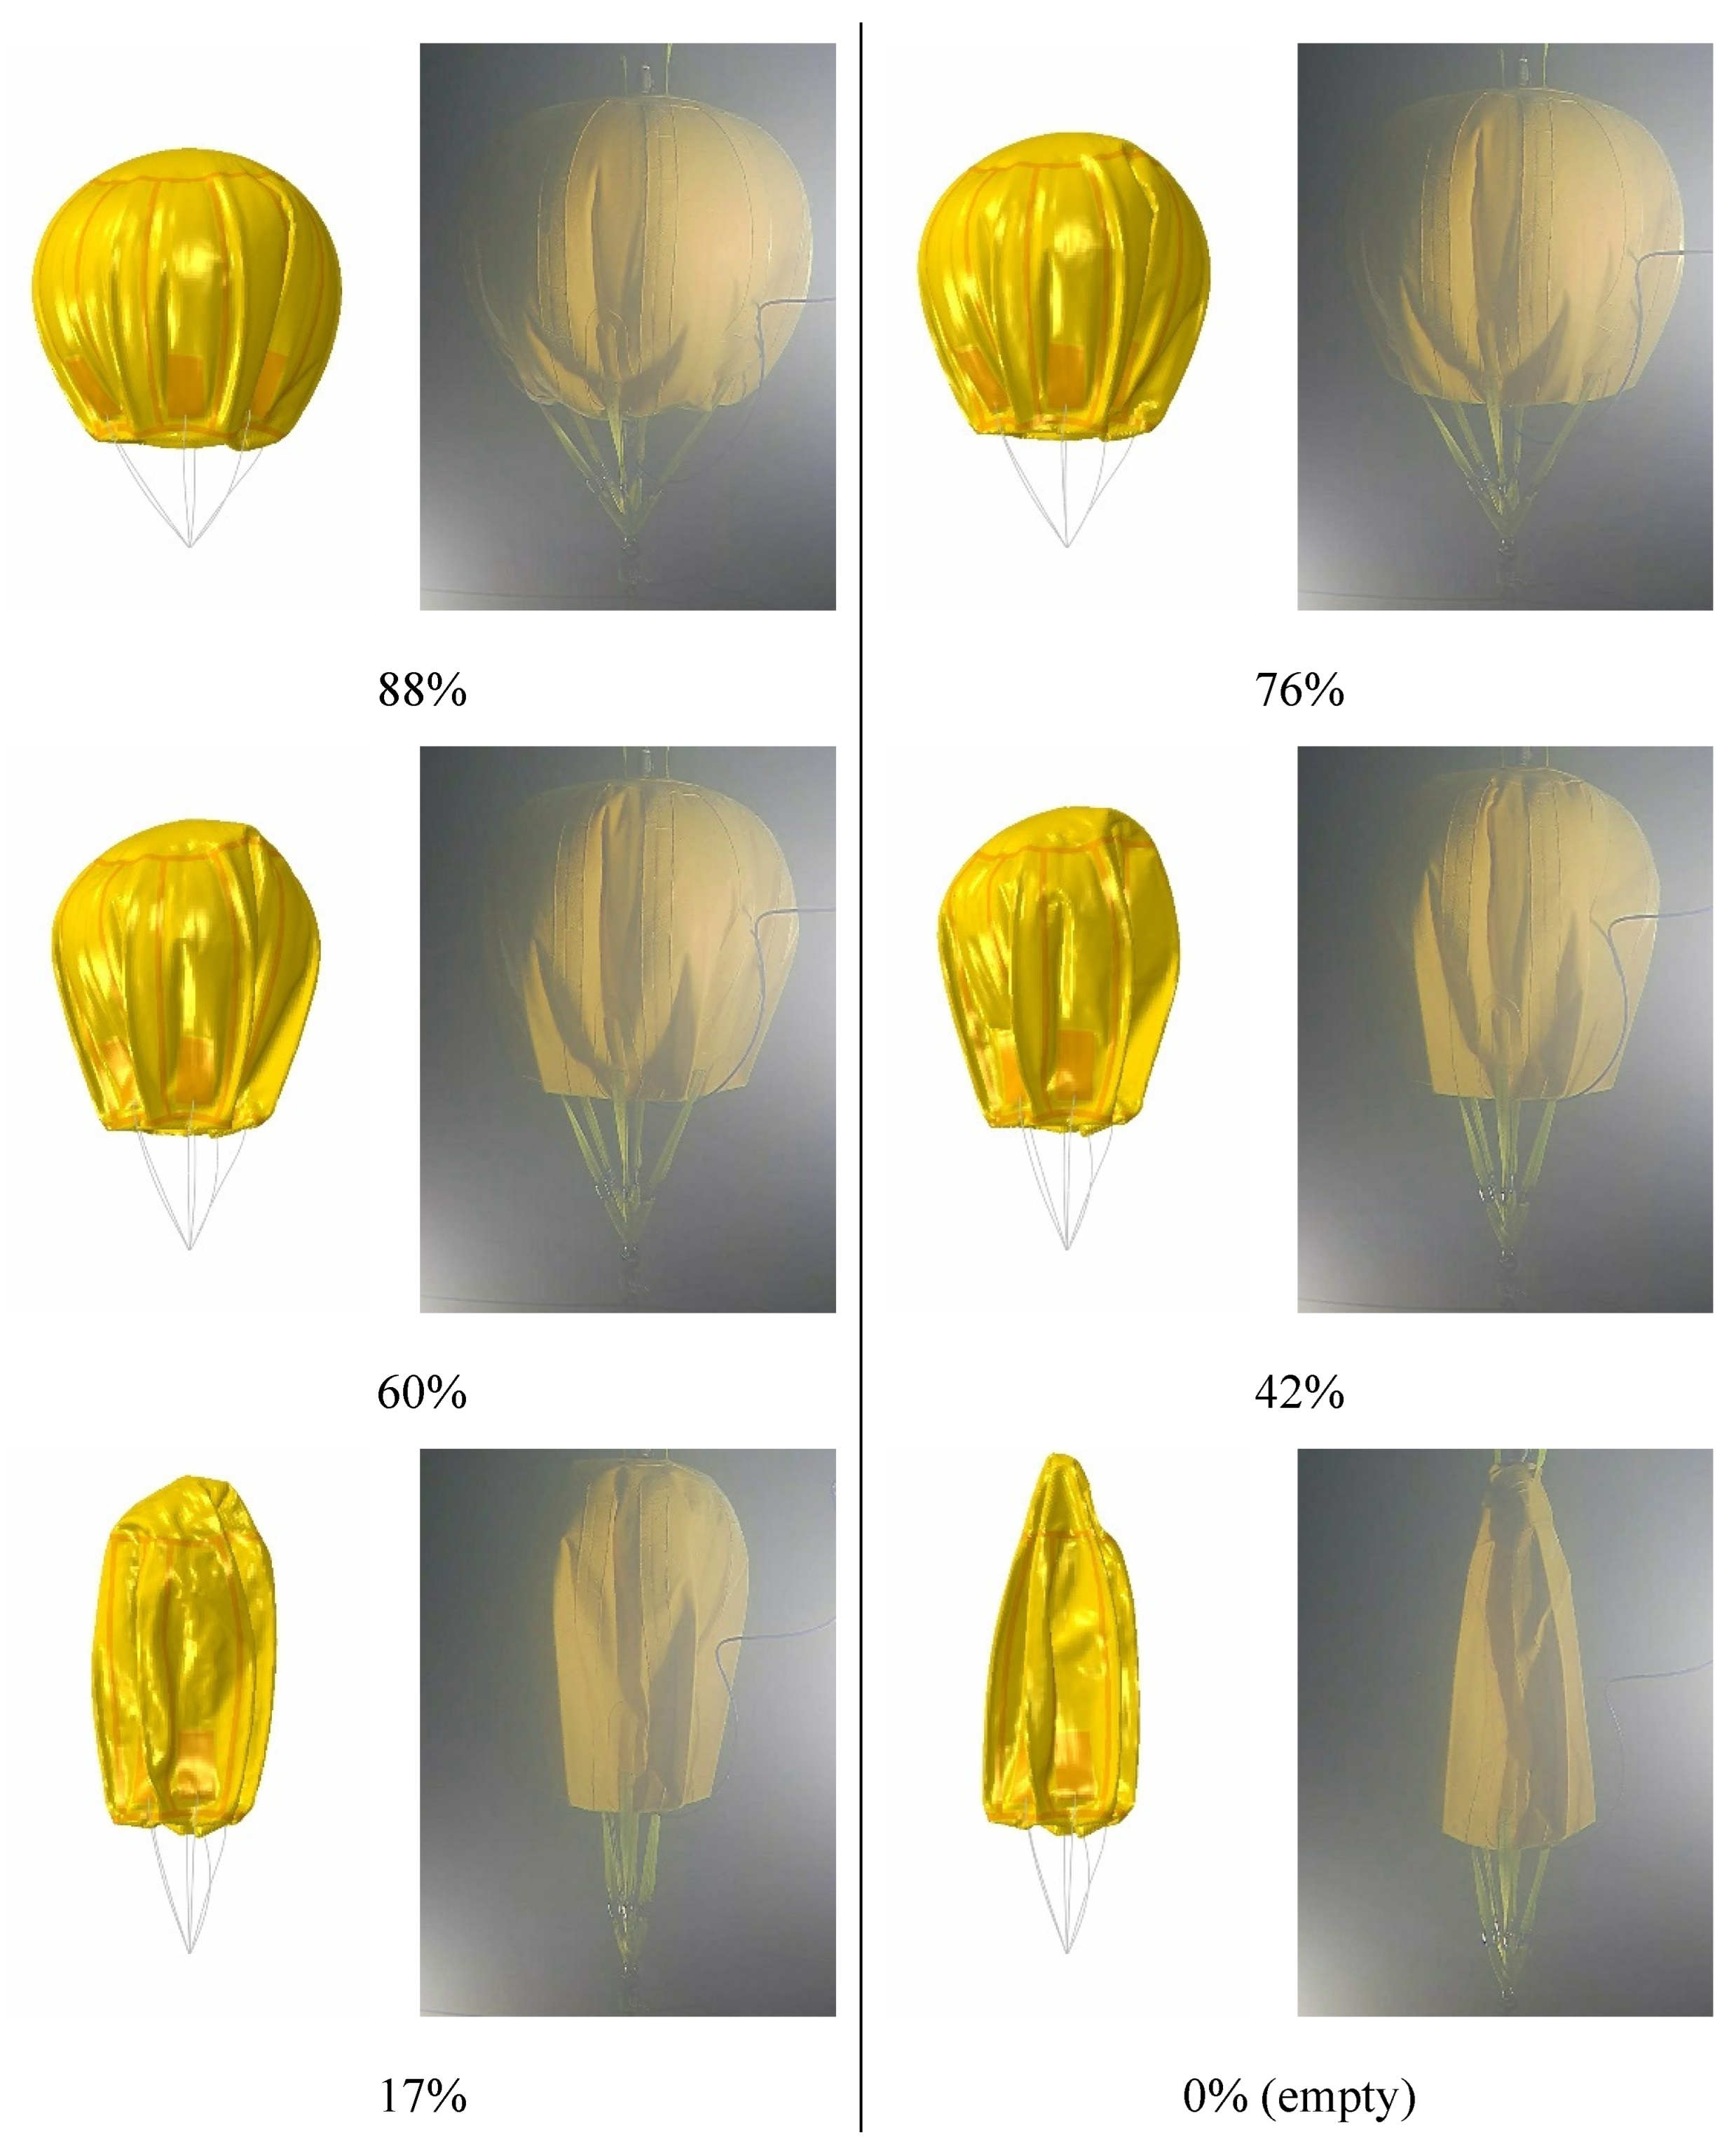
A comparison of the simulation and experiment for the 1 m airbag is shown in Figure 11. From the over-pressurized airbag, the lower part of the envelope under the specific hoop of the attached straps moved upwards and caused the bottom to become concave with the reducing volume. The angle between the straps and the center axis decreased. The meridian lines along the straps gradually pressed on the surface, causing wrinkles to extend towards the top. The concave and wrinkled surfaces fold twice along the specific hoop forming a six-point crease. The folding gradually deepened with a decrease in the inflation ratio. Finally, the deformation formed a carambola-shaped, six-pointed airbag, and the empty underwater shape differed from that in the air. These results implied that the simulation results were in good agreement with the experimental results.
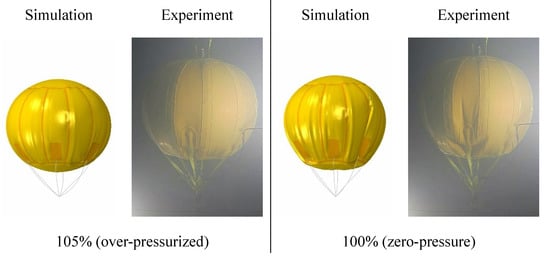
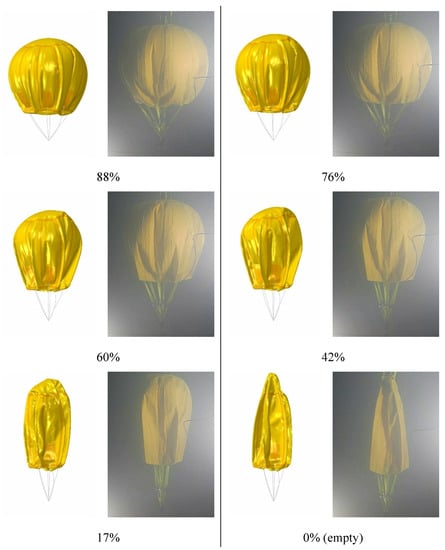
Figure 11.
Comparison of the deformed shape of the 1 m airbag with different inflation ratios in the experiment and simulation.
During the cycle, the simulated results indicated that the maximum stress occurred at the points where the straps attached. However, the maximum stress appeared at the corners of the specific crease folded twice at the bottom when the degree of folding was significant.
4.2. 4 m Model
Based on the 1 m numerical model, simulations of the 4 m prototype, where the bottom was set at 100, 300, 500, and 700 m deep, were performed to investigate the deformation and storage performance. Simultaneously with dimension scaling, the air properties and ambient environment settings changed at different seawater depths. According to the fitting equations in [34], the sea temperature in the South China Sea can be predicted using:
where is the temperature of the seawater surface in degrees centigrade with a value of 15; is the seawater depth; and to are the fitting constants, where , , , and . The compressed air properties of the 4 m airbag at different depths are shown in Table 5.
Table 5.
Compressed air properties of a 4 m airbag at different depths.
The calculations were divided into three parts. The inflating process was within 0–5 s, and deflating was from 5.5 to 10.5 s after a short interval of 0.5 s for stabilization. All scenarios could be considered quasi-static from the KE/IE curves in Figure 12. The value was approximately zero most of the time, and the peak values were less than 10%.
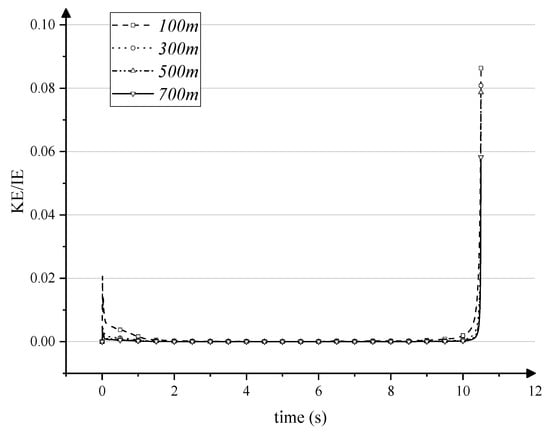
Figure 12.
History curves of the KE/IE ratio in the scenarios of the 4 m airbag at different depths.
4.2.1. Pressure
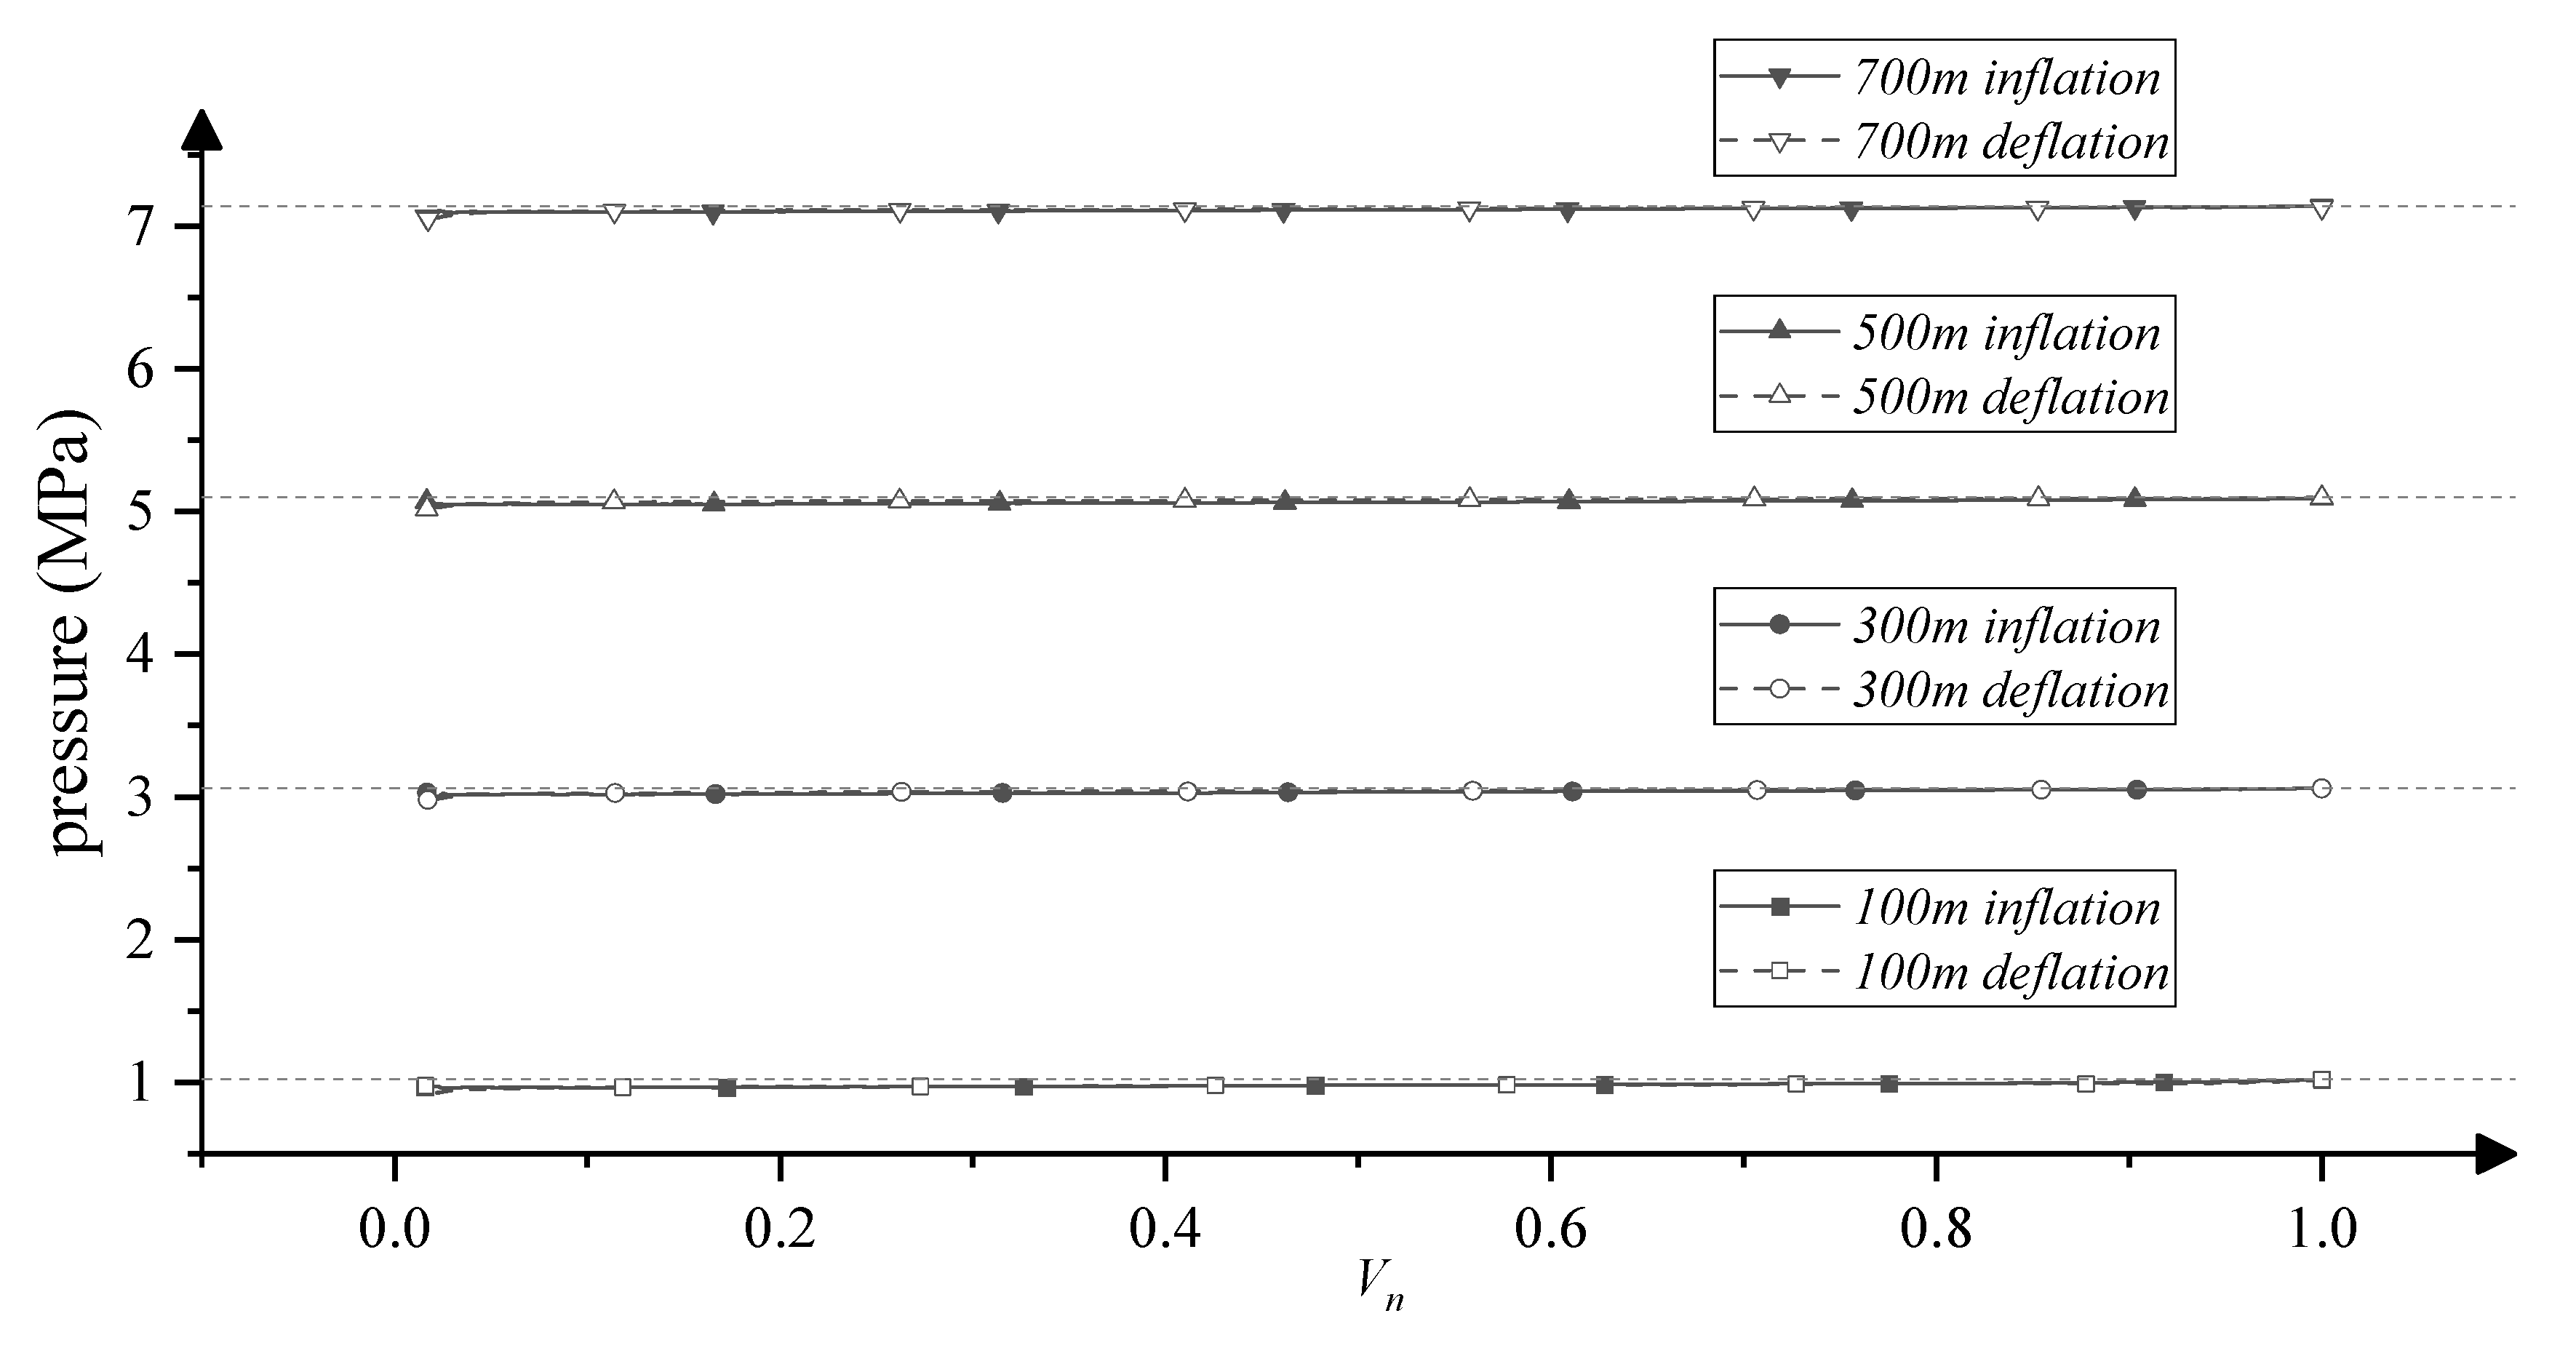
The inflation and deflation processes had the same pressure–volume variation in each case, and the pressures of different scenarios exhibited similar trends, as shown in Figure 13. The four horizontal dashed lines represent the rated pressure of the zero-pressure airbag at the designated depths. The air pressure in four scenarios was slightly lower than the rated pressure. The pressure range in each case was significantly lower than the corresponding rated pressure and equated to the water head height of 4.28 m, which was approximately the height between the top point of the empty shape and the bottom point of the zero-pressure shape.
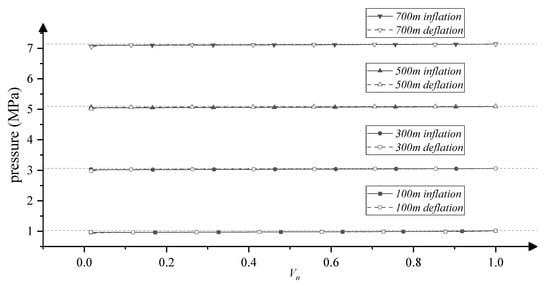
Figure 13.
Relation of the air pressure and inflation ratio of a 4 m airbag at different depths.
In the calculation, phase I within the cycle process was omitted, and the air pressure at the initial state and the exhausted airbag was set to the same order of magnitude as the water depth, which differed from the simulation of the 1 m model in shallow water. Because a completely empty airbag with zero internal pressure was crushed under significant hydrostatic pressure, the simulated elements of the flexible structure exhibited excessive distortion. In practice, this not only causes severe structural damage but also violates the design principle of the small pressure difference in flexible films. The over-pressurized phase III was also not taken into consideration. In the deep-water environment, the narrow pressure variation range of the stored gas makes the pressure measurement and the over-pressure control difficult. In engineering, the safety and reliability are more important than high energy storage capacity through over-pressurization, and the gas containers are designed to be configured with sufficient release valves to deal with the possible high pressure.
4.2.2. Deformation
A comparison of the deformed patterns at different depths indicated that the 4 m airbag had an identical stress contribution and deformation in the scenarios. It shows that the deformed shape was only related to the inflation ratio but not the processes and operating depth.
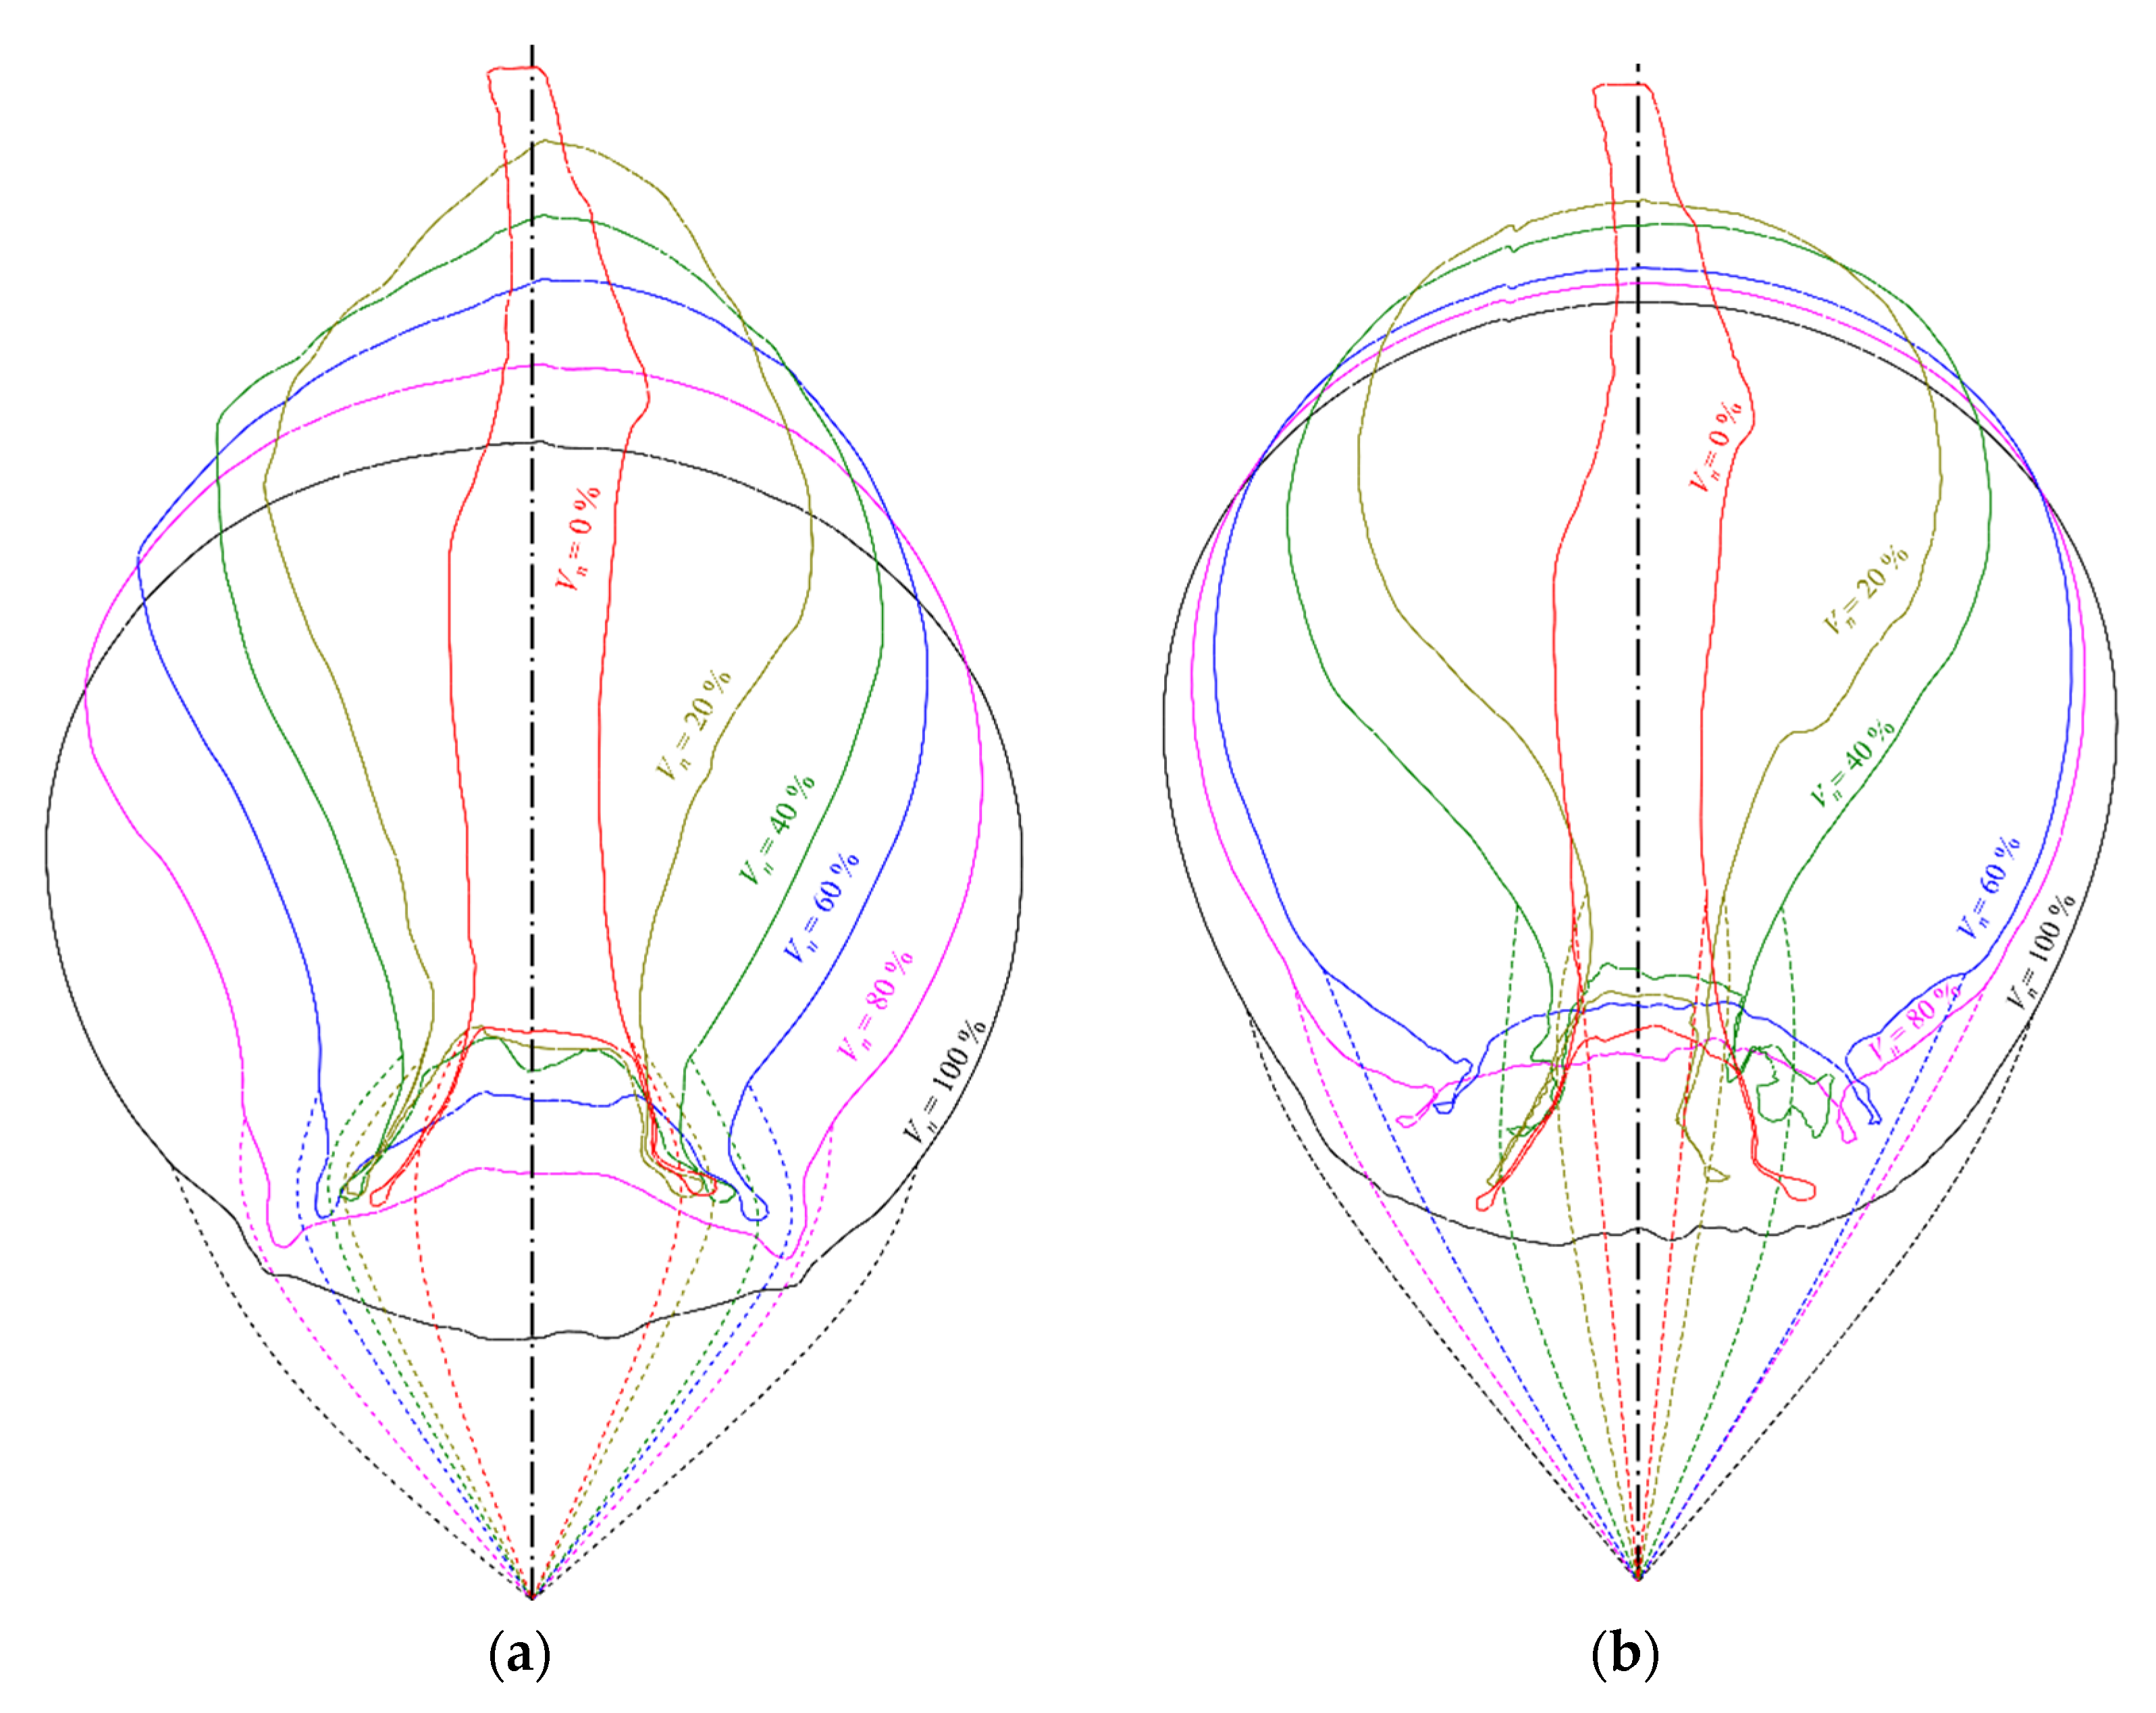
Although the wrinkling and folding patterns of the 1 and 4 m airbags were very similar, several differences were observed between the meridian profiles of the models in two sizes in terms of inflation ratio, as shown in Figure 14. The meridian plane was selected at the same longitude, and lines with various colors represent the shapes at different inflation ratios. The dashed lines under the airbag are the artificial references to indicate the location of the attached straps and mooring points, and they do not represent the actual state of the cross-section. The left-hand figure shows the 1 m model, and the right-hand figure shows the 4 m model. The shapes were captured from the same meridional plane during inflation, and it is convenient to compare their profile variation from the same empty shape ().
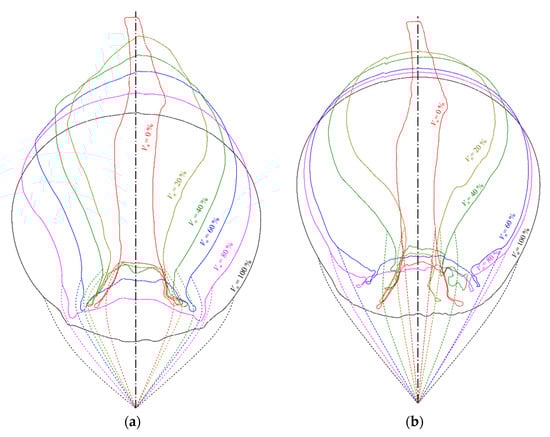
Figure 14.
Lines plans of the meridian profile of the models for two dimensions with different inflation ratios. (a) 1 m model. (b) 4 m model.
The lines of the 1 m model straps were slightly shorter than the lines in the 4 m airbag because of the significant distinction in buoyancy. The angle between the central axis and the straps at the same inflation ratio in the left figure was less than that in the right figure. When the airbags were being inflated with a low inflation ratio, the top surface of the large-scaled airbag expanded faster, and the lower part was thinner than that of the small-scale airbag. The full shape of the small-scale model was identical to that of the spherical design. However, the large-scale model indicated that the entire structure was elongated in the direction of height. The center of the bottom concavity in the 1 m model moved downward gradually during inflation, whereas the location of the concave center in the 4 m model was almost unchanged before the lower surface was puffed out. The primary reason for these distinctions was the different force distribution caused by the different dimensions. The structural stress and shape were independent of the operating depth but were related to the distance from the zero-pressure level. The pressure was approximately linear with volume, except for the step variation. Therefore, the proportion of the zero-pressure level to the airbag height in airbags of different scales was equivalent. The pressure differences on the surface at the same height proportion were also scaled in terms of the distance from the zero-pressure level by the same factor in length.
5. Conclusions
A tank experiment and numerical analysis were conducted to investigate the characteristics of the deformation, air volume, and pressure of a flexible airbag during a quasi-static cycle process. The numerical 1 m model was validated by a corresponding experiment. Furthermore, the performance of a 4 m model at different depths was simulated. The dimensionless volume, the inflation ratio , is defined by the zero-pressure state () to establish the relationship between the shape, gas pressure, and volume. The conclusions are summarized as follows.
The quasi-static processes indicate that the deformation and storage characteristics are independent of the inflating and deflating processes, and that the shape only changes with .
The simulation results of the 1 m model were in good agreement with the experimental results. The pressure varied approximately linearly with volume, ignoring the steep variation with the hardly changed shape when the airbag was over-pressurized (), and the airflow was not stable (). The experimental pressure was slightly less than that in the simulation because the motion of the mooring point reduced the practical operating depth. The deformation exhibited the bottom concave and axisymmetric meridian wrinkling. A specific crease is caused by the twice folding at the bottom, and the empty shape resembles a six-pointed carambola.
The performance of a 4 m airbag was analyzed at different depths. The deformed shape was independent of the operating depth. The pressure of the empty airbag was slightly lower than the rated pressure, and the difference was approximately equal to the pressure head corresponding to the maximum height range over the cycle. It could be negligible in deep water, such that the process could be considered a constant-pressure storage. By comparing the shapes of the models of two sizes under different inflation ratios, the results indicated that the shapes with the same were different because the load at the same height proportion was also scaled.
This study bridged the simulation and experiment of the cycle operation of an air accumulator in a UCAES. It is helpful to predict and study the performance of underwater inflatable structures and to minimize testing trial and error. The flexible structure has potential in UCAES and is adaptable to the operation depth, operating with an approximately constant pressure and high storage capacity in deep water.
Author Contributions
Conceptualization, X.W. and C.L.; Data curation, M.L.; Formal analysis, M.L. and K.S.; Funding acquisition, K.S. and K.L.; Investigation, M.L. and G.M.; Methodology, M.L., X.W. and C.L.; Software, M.L.; Supervision, K.S., G.M. and K.L.; Validation, M.L. and K.S.; Visualization, M.L. All authors have read and agreed to the published version of the manuscript.
Funding
This research was funded by the National Natural Science Foundation of China, Grant Nos. 51979062, 52171255 and 51979050, and the Joint Laboratory of Offshore Wind Power and Intelligent Energy System, North China Electric Power University, Grant No. HNKJ20-H88.
Institutional Review Board Statement
Not applicable.
Informed Consent Statement
Not applicable.
Data Availability Statement
Not applicable.
Conflicts of Interest
The authors declare no conflict of interest.
References
- Li, Q.; Guo, X.; Qing, Q.; Gong, J. Dynamic deflation assessment of an air inflated membrane structure. Thin-Walled Struct. 2015, 94, 446–456. [Google Scholar] [CrossRef]
- Roekens, J.; De Laet, L.; Mollaert, M.; Luchsinger, R. Experimental and numerical investigation of a tensairity arch. Thin-Walled Struct. 2016, 105, 112–120. [Google Scholar] [CrossRef]
- Sosa, E.M.; Thompson, G.J.; Barbero, E.J. Experimental investigation of initial deployment of inflatable structures for sealing of rail tunnels. Tunn. Undergr. Space Technol. 2017, 69, 37–51. [Google Scholar] [CrossRef]
- Pecora, I.; Sosa, E.M.; Thompson, G.J.; Barbero, E.J. FE simulation of ceiling deployment of a large-scale inflatable structure for tunnel sealing. Thin-Walled Struct. 2019, 140, 272–293. [Google Scholar] [CrossRef]
- Pimm, A.; Garvey, S.D. Underwater Compressed Air Energy Storage. In Storing Energy; Elsevier: Amsterdam, The Netherlands, 2016; pp. 135–154. [Google Scholar] [CrossRef]
- Seymour, R.J. Ocean energy on-demand using underocean compressed air storage. In Proceedings of the ASME 2007 26th International Conference on Offshore Mechanics and Arctic Engineering, San Diego, CA, USA, 10–15 June 2007; American Society of Mechanical Engineers Digital Collection: Philadelphia, PA, USA. [Google Scholar] [CrossRef]
- Swinfen-Styles, L.; Garvey, S.D.; Giddings, D. Combining Wind-Driven Air Compression with Underwater Compressed Air Energy Storage. In Proceedings of the 2019 Offshore Energy and Storage Summit (OSES), Brest, France, 13–12 July 2019. [Google Scholar] [CrossRef]
- Debille, A.; Simon, C.; Loisel, R.; Guyomarc’H, D.; Neu, T.; Lemiale, L. Underwater CAES assessment: Economic and engineering references for energy mix sizing in islands grids. In Proceedings of the 2019 Offshore Energy and Storage Summit (OSES), Brest, France, 13–12 July 2019; pp. 1–6. [Google Scholar] [CrossRef]
- Tiano, F.A.; Rizzo, G. Use of an Under-Water Compressed Air Energy Storage (UWCAES) to Fully Power the Sicily Region (Italy) With Renewable Energy: A Case Study. Front. Mech. Eng. 2021, 7, 641995. [Google Scholar] [CrossRef]
- Xiao, J.; Gabr, M.; Rahman, M. Preliminary Structural Design of OCAES Vessel. In ASME 2014 33rd International Conference on Ocean, Offshore and Arctic Engineering; American Society of Mechanical Engineers Digital Collection: Philadelphia, PA, USA, 2014. [Google Scholar] [CrossRef]
- Lim, S.D.; Mazzoleni, A.P.; Park, J.-K.; Ro, P.I.; Quinlan, B. Conceptual design of ocean compressed air energy storage system. Mar. Technol. Soc. J. 2013, 47, 70–81. [Google Scholar] [CrossRef]
- Lim, S.D. Ocean Compressed Air Energy Storage Integrated with Offshore Renewable Energy Sources. 2013. Available online: https://repository.lib.ncsu.edu/bitstream/handle/1840.16/8878/etd.pdf?sequence=2 (accessed on 1 December 2022).
- Xu, W.; Garvey, S.D.; Ren, T.; Hu, Y. Dynamics of dissolution for underwater compressed air energy storage. In Proceedings of the 2019 Offshore Energy and Storage Summit (OSES), Brest, France, 13–12 July 2019. [Google Scholar] [CrossRef]
- Zhou, G.; Li, C.; Zhang, D.; Liu, D.; Zhou, X.; Zhan, J. Overview of Underwater Transmission Characteristics of Oceanic LiDAR. In IEEE Journal of Selected Topics in Applied Earth Observations and Remote Sensing; IEEE: Piscataway, NJ, USA, 2021; Volume 14, pp. 8144–8159. [Google Scholar] [CrossRef]
- Li, R.; Zhang, H.; Chen, Z.; Yu, N.; Kong, W.; Li, T.; Wang, E.; Wu, X.; Liu, Y. Denoising method of ground-penetrating radar signal based on independent component analysis with multifractal spectrum. Measurement 2022, 192, 110886. [Google Scholar] [CrossRef]
- Zhang, X.; Ma, F.; Yin, S.; Wallace, C.D.; Soltanian, M.R.; Dai, Z.; Ritzi, R.W.; Ma, Z.; Zhan, C.; Lü, X. Application of upscaling methods for fluid flow and mass transport in multi-scale heterogeneous media: A critical review. Appl. Energy 2021, 303, 117603. [Google Scholar] [CrossRef]
- Wang, Z.; Ting, D.S.K.; Carriveau, R.; Xiong, W.; Wang, Z. Design and thermodynamic analysis of a multi-level underwater compressed air energy storage system. J. Energy Storage 2016, 5, 203–211. [Google Scholar] [CrossRef]
- Liu, Z.; Liu, X.; Yang, S.; Hooman, K.; Yang, X. Assessment evaluation of a trigeneration system incorporated with an underwater compressed air energy storage. Appl. Energy 2021, 303, 117648. [Google Scholar] [CrossRef]
- Ebrahimi, M.; Carriveau, R.; Ting, D.S.-K.; McGillis, A. Conventional and advanced exergy analysis of a grid connected underwater compressed air energy storage facility. Appl. Energy 2019, 242, 1198–1208. [Google Scholar] [CrossRef]
- Ebrahimi, M.; Carriveau, R.; Ting, D.S.K.; McGillis, A.; Young, D. Transient Thermodynamic Assessment of the World’s First Grid Connected UWCAES Facility by Exergy Analysis. In Proceedings of the 2019 Offshore Energy and Storage Summit (OSES), Brest, France, 10–12 July 2019. [Google Scholar]
- Pimm, A.; Garvey, S. Analysis of flexible fabric structures for large-scale subsea compressed air energy storage. J. Physics Conf. Ser. 2009, 181. [Google Scholar] [CrossRef]
- Pimm, A.; Garvey, S.D.; Drew, R.J. Shape and cost analysis of pressurized fabric structures for subsea compressed air energy storage. Proc. Inst. Mech. Eng. Part C J. Mech. Eng. Sci. 2011, 225, 1027–1043. [Google Scholar] [CrossRef]
- Pimm, A.J. Analysis of Flexible Fabric Structures; The University of Nottingham: Nottingham, UK, 2011. [Google Scholar]
- Jong, M.D. Commercial grid scaling of Energy Bags for underwater compressed air energy storage. Int. J. Environ. Stud. 2014, 71, 804–811. [Google Scholar] [CrossRef]
- Mas, J.; Rezola, J.M. Tubular design for underwater compressed air energy storage. J. Energy Storage 2016, 8, 27–34. [Google Scholar] [CrossRef]
- Wang, Z.; Ting, D.S.-K.; Carriveau, R.; Xiong, W.; Wang, Z. Numerical and experimental investigation of flow around a balloon-shaped bluff body. Sustain. Energy Technol. Assess. 2019, 35, 80–88. [Google Scholar] [CrossRef]
- Vasel-Be-Hagh, A.; Carriveau, R.; Ting, D.-K. Numerical simulation of flow past an underwater energy storage balloon. Comput. Fluids 2013, 88, 272–286. [Google Scholar] [CrossRef]
- Vasel-Be-Hagh, A. Hydrodynamics of Accumulators of Compressed Air for an UWCAES Plant; University of Windsor: Windsor, ON, Canada, 2015. [Google Scholar]
- Vasel-Be-Hagh, A.; Carriveau, R.; Ting, D.S.-K. Flow past an accumulator unit of an underwater energy storage system: Three touching balloons in a floral configuration. J. Mar. Sci. Appl. 2014, 13, 467–476. [Google Scholar] [CrossRef]
- Vasel-Be-Hagh, A.; Carriveau, R.; Ting, D.-K. Flow over submerged energy storage balloons in closely and widely spaced floral configurations. Ocean Eng. 2015, 95, 59–77. [Google Scholar] [CrossRef]
- Pimm, A.J.; Garvey, S.D.; de Jong, M. Design and testing of Energy Bags for underwater compressed air energy storage. Energy 2014, 66, 496–508. [Google Scholar] [CrossRef]
- Cheung, B.; Cao, N.; Carriveau, R.; Ting, D. Distensible air accumulators as a means of adiabatic underwater compressed air energy storage. Int. J. Environ. Stud. 2012, 69, 566–577. [Google Scholar] [CrossRef]
- Dassault Systèmes Simulia Corp. Abaqus User’s Manual, Documentation Collection Version 6.14-2; Dassault Systèmes Simulia Corp.: Providence, RI, USA, 2021. [Google Scholar]
- Mao, L.; Liu, Q.; Nie, K.; Wang, G. Temperature prediction model of gas wells for deep-water production in South China Sea. J. Nat. Gas Sci. Eng. 2016, 36, 708–718. [Google Scholar] [CrossRef]


Disclaimer/Publisher’s Note: The statements, opinions and data contained in all publications are solely those of the individual author(s) and contributor(s) and not of MDPI and/or the editor(s). MDPI and/or the editor(s) disclaim responsibility for any injury to people or property resulting from any ideas, methods, instructions or products referred to in the content. |
© 2023 by the authors. Licensee MDPI, Basel, Switzerland. This article is an open access article distributed under the terms and conditions of the Creative Commons Attribution (CC BY) license (https://creativecommons.org/licenses/by/4.0/).