Article

In Situ Radioactivity Measurements and Water Flow Characteristics of a Thermal Spring in Gera Gulf, Lesvos Island, Greece

by
Christos Tsabaris
1,*,
Vassilis Zervakis
2,
Spyros Saitanis
2,
Dionisis Patiris
1,
Filothei K. Pappa
1,2,
Antonios Velegrakis
2,
Stylianos Alexakis
1 and
Sotirios Kioroglou
1
1
Hellenic Center for Marine Research, Institute of Oceanography, 46.7 Km Athens-Sounio Ave, 190 13 Anavyssos, Greece
2
Department of Marine Sciences, University of the Aegean, 811 00 Mytilene, Greece
*
Author to whom correspondence should be addressed.
J. Mar. Sci. Eng. 2023, 11(4), 801; https://doi.org/10.3390/jmse11040801
Submission received: 9 March 2023 / Revised: 24 March 2023 / Accepted: 4 April 2023 / Published: 8 April 2023
(This article belongs to the Special Issue Application of Coastal/Ocean Sensors and Systems)

Abstract

:
In this study, a thermal spring located in the Gulf of Gera (Lesvos Island) is investigated in terms of radiotracers, water flow velocities and acoustic back-scattering properties by in situ observations. Water flow characteristics were deduced using in situ deployments of three marine sensors: an Acoustic Doppler Velocimeter (ADV), a High-Frequency Acoustic Doppler Current Profiler (ADCP), and a medium-resolution underwater gamma-ray detection system. The flow velocity combined with the activity concentration of natural radionuclides in the thermal spring provided information on the characteristics of the thermal spring in the specific gulf. The proposed methodology estimated the water supply, the residence time in the effective area of the in situ systems, and the residence time in the gulf. Eventually, the estimation of the characteristics of the discharged water source resulted from the synthetic evaluation of oceanographic measurements alongside appropriate models.

1. Introduction

Investigations of oceanographic dynamic systems, such as Submarine Groundwater Discharge (SGD), are of crucial importance for protecting coastal freshwater and groundwater resources, and for the sustainable development and marine environment protection. Freshwater, groundwater, and coastal seawater interactions have received considerable attention during the last twenty years, due to increasing interest regarding water scarcity and basin-scale inputs into coastal zones. SGDs and submarine springs have been studied in the last few years mainly as key pathways of freshwater sources [1,2,3] and as tracers to assess the nutrient budget [1,4,5] and other inorganic and organic substances [6,7] into the coastal zone. The scarcity of water and sub-optimality of the integrated water resources management in a worldwide basis require the appropriate research output for efficient water use and thus SGDs may play a critical role. Recently, several studies have been performed to analyze the dependencies among precipitation, groundwater level, and SGD [8], as well as to assess methodologies of SGDs considering both the terrestrial and marine driving forces [9]. In coastal surface waters, the influence of groundwater and pore water exchange on dissolved organic matter dynamics is investigated by combining surface water CDOM versus 222Rn concentrations for different systems [10]. SGDs were also used to investigate in a first approximation the nutrient fluxes to the ocean (including pore water fluxes) by combining nutrient concentrations in groundwater and the SGD-derived 228Ra fluxes [11] and are considered as a pathway for contaminants of emerging concern [12].
An immediate way of studying the SGDs and submarine springs is the laboratory-based method, where sampling and sample preparation are required before the measurement process. SGDs are dynamic hydrogeological systems with significant temporal variations so that the gradients of efflux velocities are expected to affect the activity concentration of natural radionuclides enriched in the water. Thus, the monitoring of the temporal variation in efflux requires the use of an in situ approach. The sensors being directly in contact with the efflux source can obtain variations in the measured water flow velocities and activity concentrations. Much work has been done in recent years to use in situ methods in the field of study by recording continuous measurements using manned experimental devices. In this case, the weather conditions and high costs create obstacles to perform such experiments. Much progress has been made using unmanned fixed stations (integrated with in situ sensors) for monitoring the physicochemical parameters of the groundwater that is discharged into the coastal zone. Some examples are strongly related with radiotracers such as the natural radionuclides for the groundwater and seawater, respectively [13,14,15]. Recently, in situ gamma-ray spectrometry was applied to monitor the radioactivity levels of key natural radionuclides enriched in the water [16].
The evaluation of groundwater pathways and fluxes are also determined in the coastal zone using 40K, 222Rn, and 228Ra progenies as radiotracers. 222Rn is an excellent tracer due to its high enrichment in submarine springs; it is a chemically nonreactive gas and has a short half-life (3.83 days). 40K is a long-lived radiotracer and always present at high concentration levels in seawater (~12–13 Bq/L) according to the salinity values. 228Ra and 224Ra progenies are also present in groundwater discharge areas and in the seawater as natural constituents, and may contribute to the estimation of the residence time in a system through the detection of gamma rays from 228Ac and 208Tl, respectively [17]. Given that both 222Rn progenies and 40K radionuclides comprise conservative tracers, their simultaneous monitoring in a submarine thermal spring provides better understanding of the mixing process between groundwater and seawater.
In this preliminary study, a test measurement was performed with an underwater gamma-ray detector named GeoMAREA [18] alongside with two other in situ sensor measurements, providing pointwise high-frequency measurements of water velocity (Acoustic Doppler Velocimeter—ADV—“Vector”) on the one hand and high-resolution profiles of velocity (Acoustic Doppler Current Profiler—ADCP—“Aquadopp”) on the other hand. Current measurements using Doppler systems have been used extensively by oceanographers during the past four decades. These instruments have a widely acknowledged reliability in accomplishing tasks related to healthy ocean and coastal processes for performing scientific studies. Moreover, the GeoMAREA detection system has been calibrated for measurements in the aquatic environment [18,19,20] and has been used successfully in similar aquatic ecosystems [18]. Preliminary results provide significant information about the radon activity concentration (Bq/m3) detected by the gamma-ray emission of 222Rn progenies (214Bi and 214Pb) and by 228Ra (228Ac) and 224Ra (208Tl), respectively [17].
The aim of this study was to evaluate the effectiveness of the experimental approach of simultaneous volumetric and point measurements revealing limitations and benefits for the investigation of low-flow springs. Thus, an oceanographic expedition took place in the northeastern part of the Gulf of Gera for an investigation of a submarine thermal spring located at Therma (Gera Bay, Lesvos Island, Greece). Our methodology consisted of simultaneous data collection from the three previously mentioned in situ sensors, toward identifying and quantifying some of the aquifer’s characteristics related to the groundwater discharge process (i.e., the supply of the thermal spring effluxing mass and the residence times of the latter mass in Gera Bay). Finally, the quantification of the radionuclide inputs at the spring point (or the discharged area) is alternatively performed under the assumption that the Gulf of Gera comprises a closed system.

2. Study Area and Fieldwork

This study took place during October 2018 at the Gulf of Gera in Lesvos Island (Figure 1). Lesvos is located in the northeastern extremity of the Aegean Sea and is mainly characterized by its Miocene volcanism. Moreover, in the northeastern part of the island, near the study site of Gera, there are outcrops of an ophiolite basement [21], and alluvial deposits are known to have been formed along the gulf [22].
The study area is situated at the northeastern extremity of the Aegean Sea, an area well known in terms of the geological setting and the freshwater discharges and thermal springs. The formation of the gulf is probably linked to a WNW–ESE fault system [23] that was responsible for shaping the tectonic graben that hosts the gulf [24]. Previous volcanic activity and faulting in Lesvos have been related to thermal springs that appear to have various outcrops. A thermal spring at the NNE side of Gera (Figure 1c) forms a shallow well 2 m deep, with a water level a few centimeters above sea level. The spring emerges from a fault in Triassic marbles and phyllites [25].
The gulf is a shallow-water, semi-enclosed mesotrophic marine environment related to the adjacent oligotrophic Aegean Sea [26]. The surface area of the gulf is approximately 43 Km2, and the mean depth is about 10 m. The gulf is connected to the open sea through a channel with a width 200–800 m, length 6.5 Km, and depth 10 to 30 m [27]. The eastern margin of the gulf has steep relief and small drainage systems, whereas the remaining margins are smoother, with larger drainage systems. In the northern areas, the Evergetoulas River basin is the largest fluvial input, and in the west, the Paleokipos, Papados, and Skopelos drainage systems predominate. The rainfall ranges between 600 and 800 mm per annum [26].
The circulation pattern and therefore the transport of materials in the gulf are controlled by a multitude of factors and processes (i.e., coastline geometry, seabed morphology, density variations and gradients, tide and wind stress). During winter, colder and denser gulf waters have been reported to flow under the open Aegean Sea waters in the vicinity of the channel [28]. However, the seasonal cycle of thermohaline functioning of the gulf is still under investigation. Application of the Princeton Ocean Model for southeast blowing winds has shown a cyclonic movement of seawater masses with relatively low current velocities [29]. This pattern reverses during the summer period. The maximum depth is around 20 m and it is located at the center of the gulf. The depth-averaged current velocity ranges from threshold values to 0.08 m/s, while the maximum velocities (0.14 m/s) can be observed at the mouth of the gulf. During the warm months of the year (April to October), the physical factors (density, temperature, salinity, wind pattern) allow the entrance of oligotrophic water masses from the Aegean Sea into the gulf and the area is characterized by an anticyclonic circulation pattern. The hydrodynamic regime is reversed during the winter (November to March), and the renewal time of the seawater of the gulf is between 2 and 3 months.
A sidescan sonar consisting of a towed two-channel high-frequency unit (Starfish 450F, 450 kHz, Tritech, Mumbai, India) was used for the morphological mapping of the seabed where appearances of landforms (such as rock formations) along with the location of the main spring flow are clearly seen [30]. The crater surface of the spring is calculated at around 16 m2 and the diameter is 9 m.

3. Materials and Methods

The main principles that determine the approaches used in SGD assessment are (a) modeling, (b) direct physical measurement, and (c) the use of chemical and geophysical tracers. The instruments used in this study for both direct measurement and the analytical model approach for the residence time and the water supply are described below.

3.1. Instrumentation

3.1.1. Acoustic Doppler Measurements

Two acoustic instruments were incorporated in the benthic platform and were used to measure the velocity throughout the lower water column. A 6 MHz Nortek Vector (Acoustic Doppler Velocimeter, ADV) was used to record the water flow in the immediate vicinity of the thermal spring near the seabed, while a 2 MHz Nortek Aquadopp (a type of Acoustic Doppler Current Profiler, ADCP) was used to capture the variability in the velocity profile in a depth range from about 0.5 to about 2.5 m above the spring.
Acoustic Doppler velocimeters were originally developed and tested for use in laboratory facilities [31]. These instruments use three converging acoustic beams to measure three-dimensional water velocity using the Doppler effect at very small spatial scales and very high sampling frequencies. Measurements are performed by measuring the velocity of suspended particles in a remote sampling volume (point of the three converging acoustic beams) based on the Doppler shift effect [32,33,34]. The sampling volume is located either 5 or 10 cm from the tip of the probe; some studies show that the distance may vary slightly [35], while the sampling volume size is determined by the sampling conditions. In a standard configuration, the sampling volume is about a cylinder of water with a diameter of 6 mm and a height of 9 mm. Similar studies have shown that Acoustic Doppler Velocimetry is also well-suited for coastal shallow-water systems. An ADV system records simultaneously nine values with each sample: three velocity components, three signal strength (acoustic back-scatter intensity) values, and three correlation values. Signal strengths and correlations are used primarily to determine the quality and accuracy of the velocity data. The “raw” ADV velocity data are evidenced by high levels of noise and spikes in all components under certain conditions [36,37], and thus the acquired data require suitable post-processing.
Acoustic Doppler Current Profilers (ADCPs) have been tested and proven to be effective oceanographic tools [38,39,40,41,42,43] to measure currents. ADCPs transmit sound pulses along three or more diverging acoustic beams, and record the sound back-scattered by suspended particulate matter in the water column. Thus, radial velocities are computed from the Doppler shift of the back-scattered signal [42]. Division of the listening period after each transmission to smaller temporal intervals leads to the estimation of radial velocities from different spatial intervals along each beam (the so-called “depth cells” or “bins”). For large-scale flows, the critical assumption of horizontal homogeneity over the length-scale of the sound beams leads to the ability to combine the several velocity components and construct a single 3D velocity vector at each depth bin, this leading to a velocity profile of the measurement area. However, this three-dimensional vector estimation is not valid in applications focused on small-scale flows (comparable or shorter than the horizontal distance of the acoustic beams). In these cases, the analysis needs to be based on separate radial velocity components along each acoustic beam of the instrument. In both ADVs and ADCPs, the computed 3D velocity vectors can be expressed in either a Cartesian system of orthogonal axes aligned to the Earth meridional and zonal axes or to the instrument axis of reference using full compass and tilt corrections.
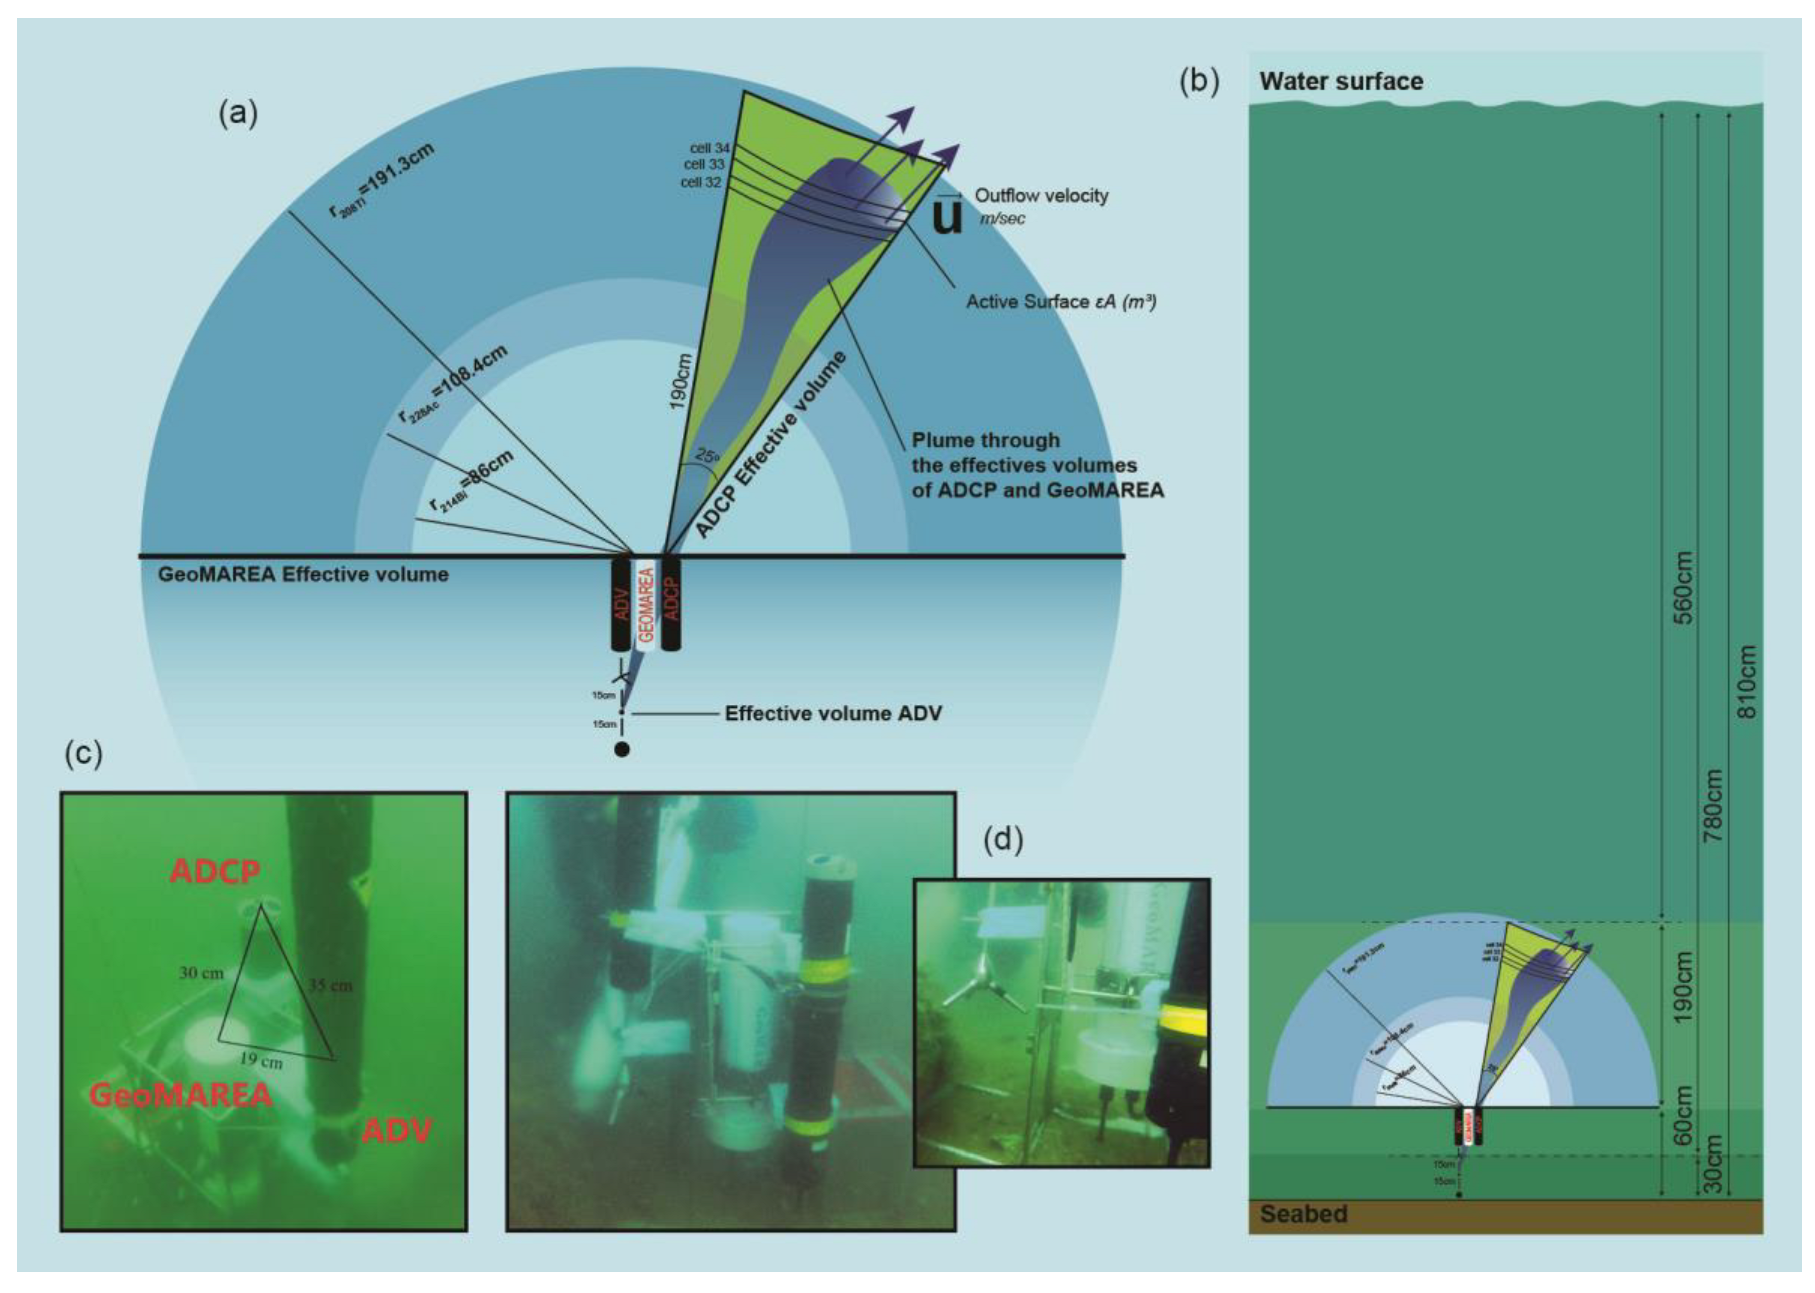
For this study, the Nortek Vector velocimeter (operating frequency 6 MHz) was deployed at a depth of about 8 m, very close to the efflux point of the spring (15 cm apart). A total of 848,916 measurements were obtained at a sampling rate of 8 Hz during the experiment, spanning the period between 13:00:00/18 October 2018 and 18:28:56/19 October 2018. The point-sensitive ADV was deployed directly over the seabed (see Figure 2) where the flow of the groundwater was more intense, as visually observed by the diver team.
To capture the water flow at the depth range up to 2.5 m above the seabed, a 2 MHz Nortek Aquadopp HR ADCP was used, set to record data between 12:30:00/18 October 2018 and 19:10:00/19 October 2018. The instrument was attached on the benthic platform facing upward, with a profile range of 1.9 m, achieving a very high vertical resolution (number of cells 38, cell size 0.05 m), providing 10 min averaged velocity records. The acoustic frequencies of the Vector ADV and Aquadopp ADCP do not interfere since the transmission frequencies differ significantly.
Both instruments were set to report velocity vectors in their own Cartesian XYZ systems, and were oriented so that the Aquadopp’s own X-axis was aligned with the Nortek ADV (and thus the effluent spring location), with increasing values of position along the X-axis signifying increasing distance from the ADV. The Vector’s X-axis original orientation was set to point to the gamma-ray detection system GeoMAREA. The Aquadopp and the Vector were attached on the platform at a horizontal distance of about 35 cm between them. For the purposes of this work, the Vector measurements were rotated horizontally by −33.5 degrees to be projected to a XYZ Cartesian system parallel to Aquadopp’s original orientation. In this way, positive x-component near-bed velocities represent thermal effluent flow toward the Aquadopp profiler, while negative values reveal motion of the near-bed current away from the profiler.

3.1.2. GeoMAREA Detection System

The underwater gamma-ray detection system GeoMAREA [18] was integrated into the designed fixed platform moored in the vicinity of the thermal spring, toward acquiring, during the monitoring period, a sequence of in situ data of the natural radionuclides that emanated from the spring. The aforementioned sensor provided continuous monitoring data of the activity concentration of the radionuclides of interest in every predefined time lag of the system. The concentration gradients, which were induced by the interaction of the spring water with the seawater in the effective volume of the sensor, are related to the water flow characteristics.
The GeoMAREA system consists of a 2” × 2” CeBr3 scintillator with low intrinsic activity, connected with a photomultiplier tube, a preamplifier equipped with appropriate units for signal amplification, and data acquisition and storage. The CeBr3 crystal was selected due to its higher energy resolution compared to other scintillators such as the KATERINA detection system [19]. Moreover, the adequate energy resolution combined with the favorable cost of CeBr3 crystals (compared to HPGe detectors) render these systems competitive candidates for laboratory measurements as well. The output of the whole detection system is connected to a computer via the three commonly used communication protocols: serial, USB, and Ethernet. The data logger consists of a compact standalone digital multichannel analyzer with a fully controlled microprocessor to perform data acquisition using digital signal processing algorithms. The electronic modules require low power consumption (~0.8–1.0 W) and all modules fit inside the detector enclosure. The GeoMAREA system is designed to be integrated in any fixed station, floating and/or mobile platform, in standalone as well as in (near) real-time mode of operations.
In this experiment, the system was pre-programmed before the deployment to provide sequential measurements (as time series) without any connection to a computer system. All details for the calibration and simulation exercises of the system are given elsewhere [18].

3.2. Model Approaches

3.2.1. Residence Time

The application of the Land–Ocean Interactions in the Coastal Zone (LOICZ) method [43] about the water exchange in a semi-enclosed basin, determines the residence time of the groundwater effluxing into Gera Bay, assuming that the bay has a steady surface level during the study period (implying that the total water input must compensate for the total water output). Concerning this, the Gera Gulf residence time for water flow of the thermal spring source in the semi-closed system (Gera Gulf) is given by Equation (1):
T G G R T = V T o t a l G G Q
where TGGRT is the coastal residence time in the gulf, VTotalGG is the total volume of the Gera Gulf (m3), and Qin is the water volume influx rate (m3/s), whilst the residence time of the water flow of the spring in the effective volume of the GeoMAREA sensor (TGV) is specified by Equation (2):
T G V = V A w S A ο
where w is the vertical efflux flow velocity of the spring, S is the active surface of the discharged area of the water flow, Ao is the activity concentration of the inflow water of the spring in the effective volume, A is the activity concentration at the detection area, and V is the effective volume of the GeoMAREA system. In turn, the flow balance is expressed by Equation (3):
F i n f l o w = F o u t f l o w + A V λ
Further substitution of the Finflow and Foutflow parameters into Equation (3) yields:
w S A o = A ( u ε A + V λ )
whilst combining Equations (2) and (4) results in:
T G V = V A A ( u ε A + V λ ) = 1 u ε R + λ
where u is the water velocity at the detection area, R is the effective radius of radionuclide, and ε is the time fraction during which the vertical velocity values were greater than 0.02 m/s. This value was selected according to the dataset to omit the noise signals (the velocity at the first local extrema of the number of recordings).
Ultimately, the water supply of the spring is given by Equation (6):
Qin = wS
where w is the vertical flow velocity and S the total active surface of the spring.

3.2.2. Discharge Rate of the Radionuclides

The discharge rate of naturally occurring radionuclides is calculated using the balance model (see Equation (4)) of the water. In the schematic shown in Figure 2, depicted are the discharged area due to the interaction between groundwater and seawater, the sensor setup and the effective area of the GeoMAREA for various natural radionuclides, and the ADCP and the ADV sensors. The effective radius of the radionuclides is calculated according to the emission energy and the constituents (such as salinity) of the seawater [20]. The effective volume is calculated using the dimensions of the corresponding sphere due to the symmetry crossing a gamma ray.
According to the balance equation, the activity concentration of the detected radionuclides in the discharged area is specified by Equation (7) (as given from Equation (4)):
A ο = A u ε A + V λ w S
The sensor recordings of this study were properly substituted into the aforementioned equations using a standard software package. The estimation of the normalized activity concentration values at the efflux area of the spring (Ao) is the crucial parameter to estimate the water flow characteristics according to the above equations.

4. Results

The results of this study are related to a synchronized application of three in situ recording–detection systems at the efflux area of a thermal spring, toward estimating the emanating spring water flow characteristics and better understanding the spring’s interaction with the ambient gulf system. Concerning the measured salinity–temperature measurements, a preliminary study was made by the divers, where the averaged results of the temperature was 22 °C, while the averaged salinity values were 25 psu close to the spring and 28 psu at the maximum height of the instrumentation setup.

4.1. Water Velocity and Acoustic Back-Scatter Observations

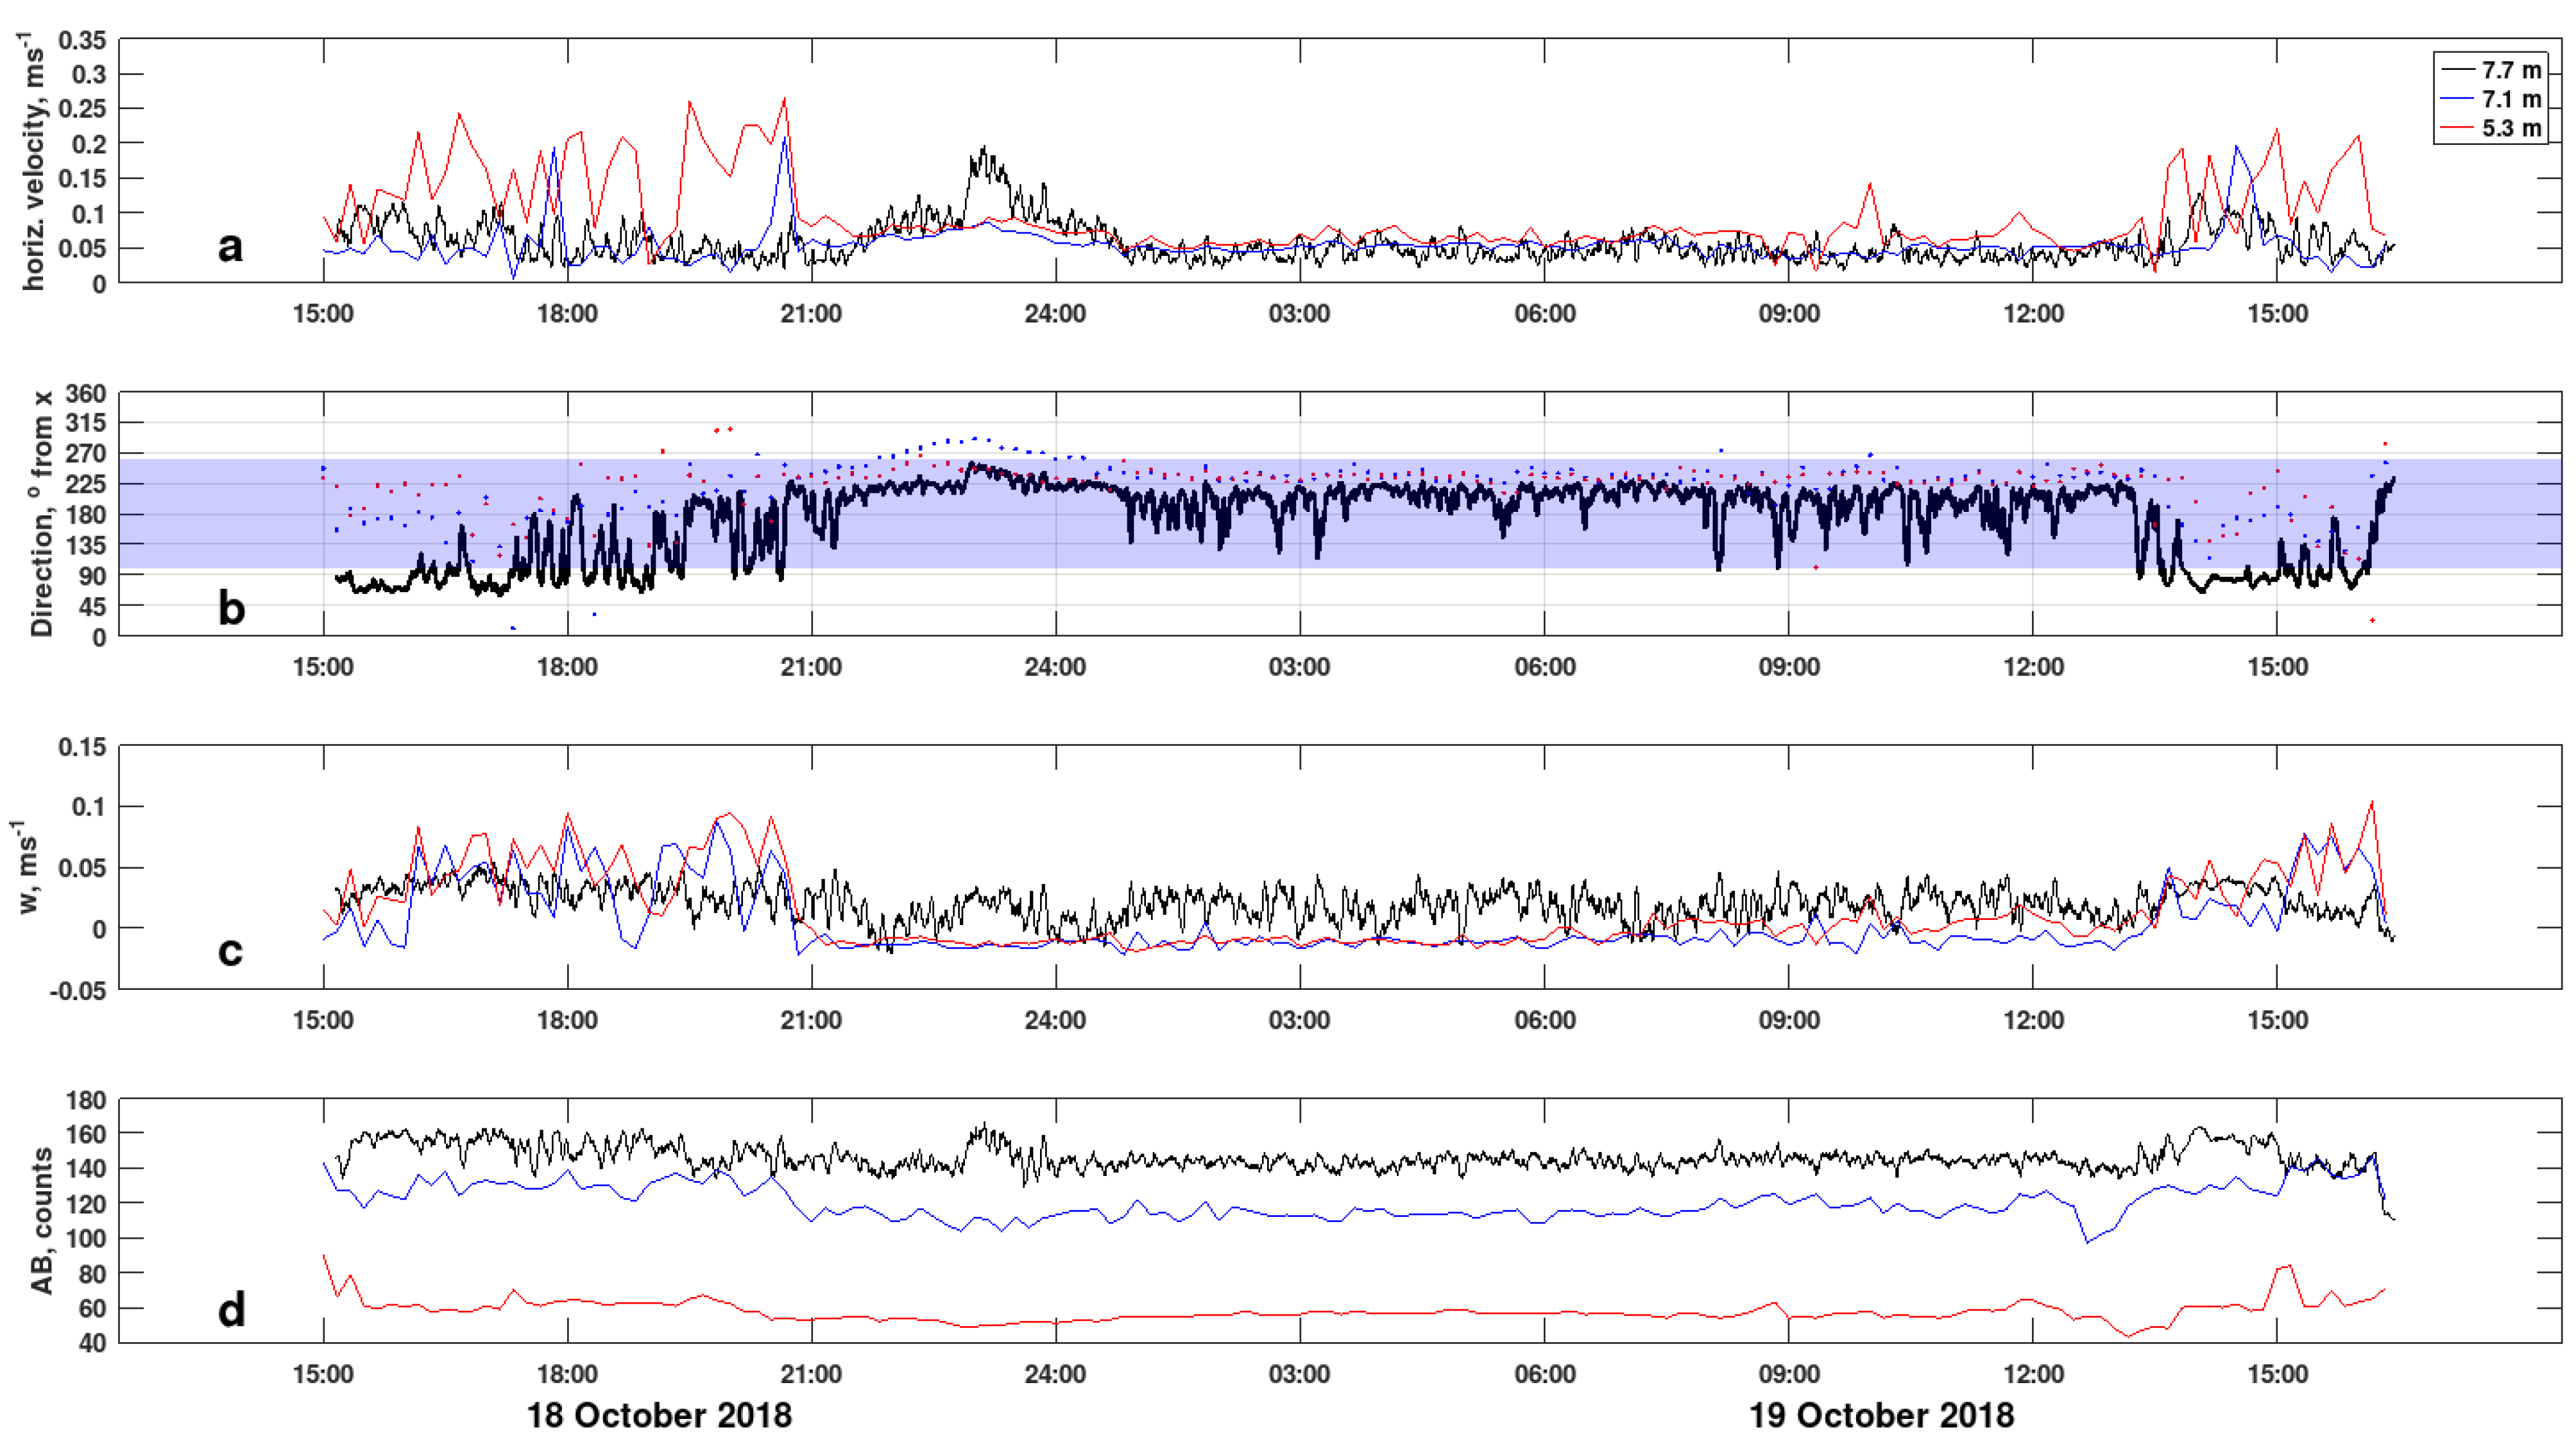
The recordings of the two acoustic Doppler instruments are examined in parallel, to provide a comprehensive view and understanding of the water circulation throughout the lower 2.5 of the water column. This information is combined with acoustic back-scatter intensity data, as the latter can be used as an index of the concentration of sound scatterers (for example, bubbles or suspended matter) in the water column. In order to obtain a preliminary view of the conditions, the time series of pressure from the ADV, velocity, and acoustic back-scatter from the ADV and two depth bins of the Aquadopp are presented in Figure 3.
The tidal range experienced during the deployment, as recorded by the Vector ADV pressure gauge, corresponds to vertical displacements of about 0.10 m in one diurnal tidal period (Figure 3a). The pressure record reveals a dominant semi-diurnal cycle during the sampling period. However, comparison of the currents (Figure 3b–d) with the horizontal velocity variability (Figure 3a) does not reveal any obvious correlation.
Examination of the velocity record from the Aquadopp profiler reveals two hydrodynamic regimes: The first regime exhibits very high horizontal (especially in the upper bin) and vertical currents. This regime is witnessed during the first and last sections of the sampling period, i.e., prior to 21:00 18 October 2018 and after 13:30 19 October 2018.
Between these two energetic periods, there exists a quiescent period, where both horizontal and vertical components of velocity recorded by the Aquadopp profiler remain low. During the two energetic periods, the shear between the 5.3 and 7.1 m depth bins is very strong, and acoustic back-scatter seems to be enhanced in relation to the quiescent period.
Comparison to the near-bed conditions as recorded by the Vector ADV instrument, reveal that the Aquadopp-recorded energetic periods are observed when the near-bed current exhibits directions below 100 degrees, i.e., moves toward the positive values (Figure 3c). Furthermore, it is notable that during the quiescent period, the vertical velocities captured by the Aquadopp profiler at 5.3 and 7.1 m depth are significantly smaller than the vertical velocity component recorded by Vector at 7.7 m.
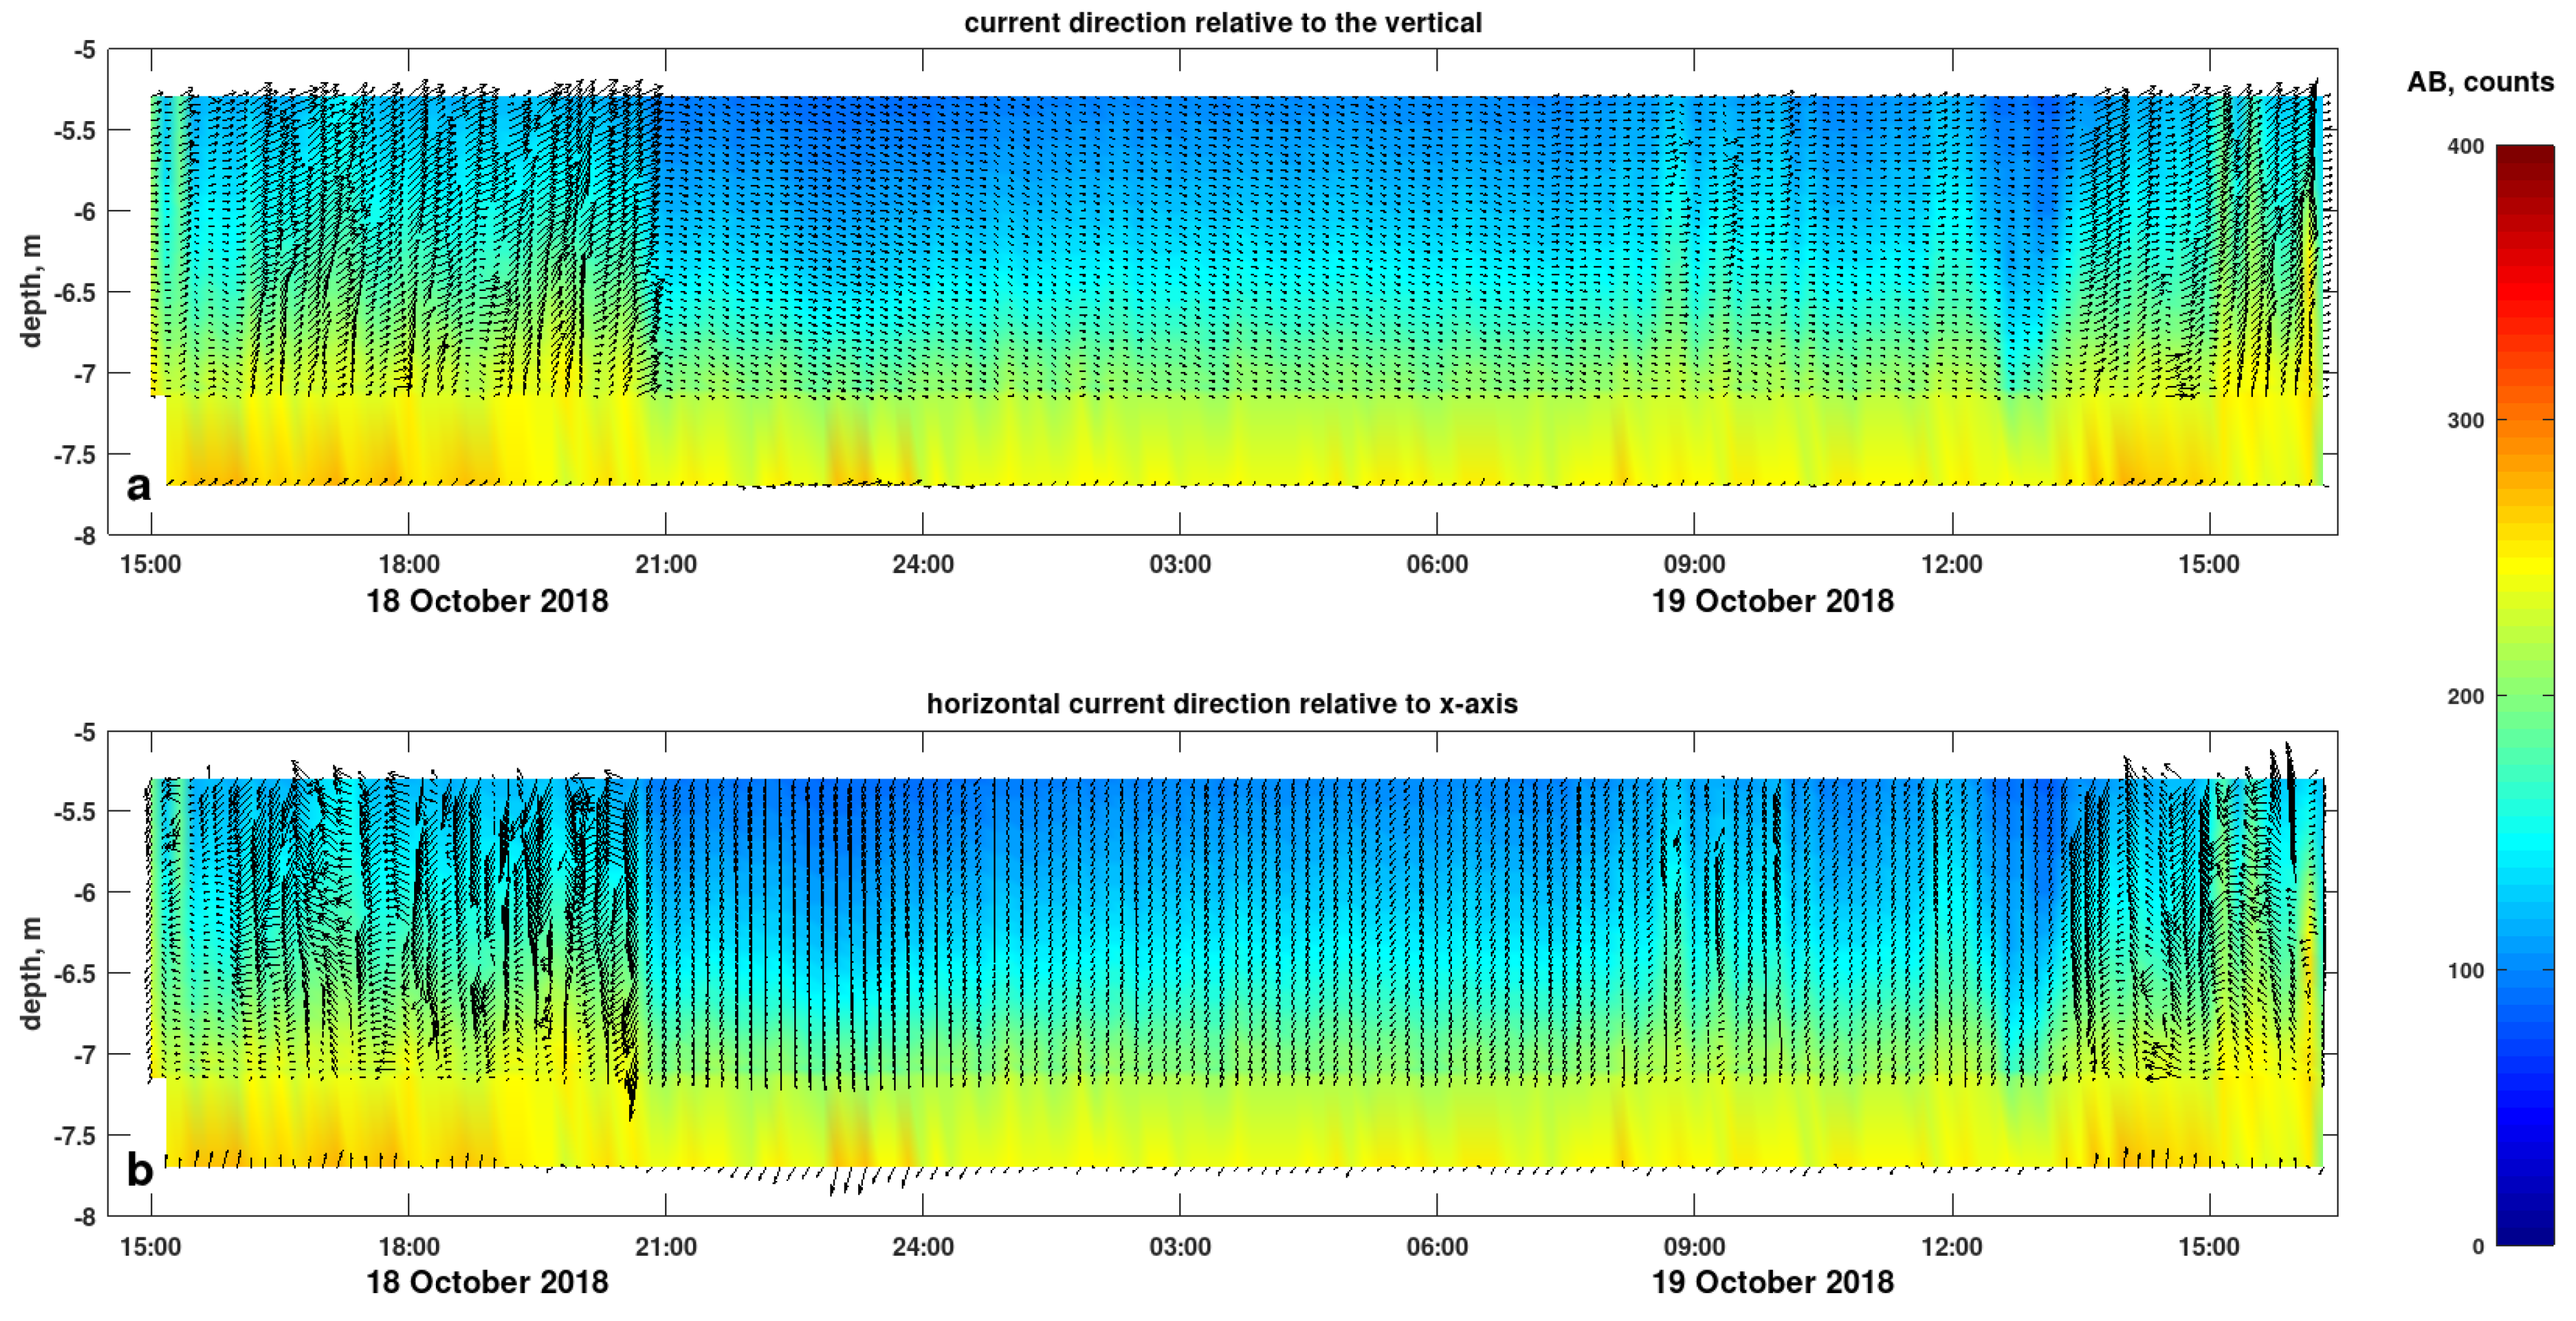
In order to provide a comprehensive and complete image the complete velocity and acoustic back-scatter profile variability, the Vector time series were subjected to low-pass filtering with a length of 1500 points and subsampling at the sampling interval of the Aquadopp profiler. In order to reveal the vertical flows, current vectors comprising horizontal and vertical velocity components were computed and superposed over the acoustic background intensity (Figure 4a). Similarly, to reveal the horizontal direction of the currents, vectors comprising the x-axis and y-axis components (omitting the vertical velocity) are presented in Figure 4b, superposed over the acoustic back-scatter.
Despite the fact that the near-bed current is mostly oriented along the y-axis (across the line connecting the Aquadopp profiler and the Vector), it is clear that during the periods that the upwelling thermal plume is captured by the former instrument, the latter records near-bed currents flowing toward the Aquadopp’s location. During these energetic periods, high back-scatter values rise high into the Aquadopp’s acoustic beams, signifying scatterers advected by the upwelling flows, as revealed by the recorded 3D currents.
When the x-axis component of the near-bed velocity is negative, the near-bed flow is directed away from the Aquadopp, so any present upwelling thermal plume is not captured by any of its three acoustic beams. Thus, the Aquadopp records quiescent conditions representative of the flow surrounding the plume.
Occasionally, large velocity values directed away from the Aquadopp are witnessed by Vector near the seabed, concurrent with high acoustic back-scatter signatures (the most intense recorded at about 23:00 of 18 October 2018). The available information does not permit to discriminate whether the anomalous flow is a thermal upwelling plume that is not captured by the Aquadopp profiler, as it is directed away from its acoustic beams, or whether it is a turbidity current of high acoustic-scattering signature, which remains near the seabed.

4.2. GeoMAREA Data

In total, 25 acquired spectra (each of 1 h) were deduced and analyzed using SPECTRW software [44] to calculate the activity concentration variation for the main natural radionuclides in arbitrary units. The radionuclides that were used as groundwater passive tracers comprised the natural radioactive gases (such as radon and thoron) through their progenies 214Bi and 208Tl, respectively, since they escape from aquifers during the water efflux from the terrestrial to the coastal area. Seawater, on the other hand, is characterized by high concentrations of potassium and it is monitored through the radionuclide 40K.
The measured counts of 40K were almost stable along with time within uncertainties, while the concentration of the radioactive gas progenies varied due to the gradients of the water supply. In terms of quantified data, the calculated activity concentration using the recordings of 1 day spectrum was performed by analyzing the energy peaks of 583 and 609 keV using deconvolution methods [43]. The results were (312 ± 34) Bq/m3 for 208Tl and (438 ± 41) Bq/m3 for 214Bi, respectively. Following the simplified approach of the model section, the total discharge rates of the activity of the naturally occurring radionuclides (208Tl, 214Bi) at the area of water entrance to the sea was (79.8 ± 7.1) and (21.9 ± 2.9) Bq/s, respectively.

5. Discussion

5.1. Residence Time and Water Supply

The residence time of the thermal water at the effective volume of GeoMAREA sensor was estimated in combination with the recordings from the other two sensors. According to Equation (2), the estimated residence time TGV ranges from 40 to 85 s. The total surface of the discharged area of the spring (S) is calculated elsewhere [30]. Moreover, the effective volume (V) of the GeoMAREA sensor and the methodology to quantify the activity concentration A for the requested radionuclides is described previously [20]. Furthermore, according to Equation (1), the residence time of the spring water in Gera Gulf has an approximation value of ~800 y while the water supply of the thermal spring was estimated according to Equation (7), and the results ranged from 50 to 150 m3/h. These estimated values facilitate the calculation of the total water inflow (Qin) of the thermal spring into the gulf taking into account the total active surface of the spring (S) from the literature [30] and the average vertical flow velocity (w) as recorded from the velocimeter.

5.2. Correlation of the Water Flow Velocity with Activity Concentration

This section focuses on the correlation between the efflux velocity of the thermal spring (as recorded from the ADV and ADCP) and the activity concentration of radon and thoron progenies (214Bi, 208Tl) entrained by the thermal water. The time series are shown overlapped to facilitate comparison in Figure 5. We can clearly notice two enhancements of the spring water flow velocity, one of 0.18 m/s at around 18/10/2018, 23:00, and one of 0.14 m/s at 19/10/2018, 14:00. Contrarily, the nominal values defined as calmer flow velocities ranged from 0.08 to 0.10 m/s of ambient seawater. Respectively, the activity concentration of 214Bi and 208Tl at the same periods was (425 ± 38) and (170 ± 19) Bq/m3. Albeit the difference between the response times of the two instruments must be taken into account, there can still be discerned a lagged coherence between enhancements of velocity and preceding enhancements in the activity concentration of 214Bi. Furthermore, the activity concentration of 214Bi and 208Tl is reduced during increase in water supply, as identified by the high velocities at the time 18/10/2018, 23:00. This lagged correlation could be attributed to the fact that the ADV exhibited maximum values of water flow velocities in the y direction (see Figure 5) and at the same time ADCP (see Figure 3) exhibited a slight downward flux observation in the z direction.
These features hint to a lateral flux with lesser radionuclide content probably due to the reduction in the effective volume of the GeoMAREA system. An additional reason might also be that the water masses identified by maximum velocities are not enriched with radon and thoron progenies due to potential recharges of other water masses (e.g., originated from the neighboring baths). A holistic consideration of both atmospheric (due to the rainfall intensity) and oceanographic conditions in a long-term basis is a requirement for better understanding the mechanism underlying the aforementioned lagged correlation.

6. Conclusions and Perspectives

The main motivation for this study was to investigate a low-flow coastal SGD thermal spring, where the emanation rate was rather low and the groundwater efflux direction varies. This investigation was performed combining existing sensors to record flow parameters close to the outflow of the spring as well as to the surrounding volume (as formed from the groundwater–seawater interaction process). More specifically, the point-sensitive ADV was deployed directly over the seabed where the flow of the groundwater was more intense, as visually observed. The ADCP records the velocity profile along an inverted narrow pyramidal shape over it, while the GeoMAREA acquire data from a spherical volume of seawater around it, according to its effective volume of measurement. This feature makes possible the acquisition of data even if the sensors are not deployed on the spot at the outflow of the spring; however, capture of the thermal plume by the ADCP depends on the initial direction of the thermal jet at the spring and the mean water flow over it.
The proposed experimental setup comprised a synthesis of distinct, in situ recording methods suitable for studying submarine spring systems, which methods would render any relevant laboratory measurements unnecessary. Increased turbulence and rapid mixing were also observed along the routes of this water mass. In the proposed experimental setup, the average vertical velocity as recorded from the ADV was more representative of the thermal spring volume flux since it was placed close to the source, while the initial direction of the spring outflow determines to a large degree whether the plume is recorded by the ADCP profiler.
However, the combination of the three in situ sensors was used to interpret the underestimation of radionuclide concentration when maximum values of lateral water flux takes place in the spring. During the lateral water flux, the concentration of natural radionuclides was reduced, probably due to the reduction in the effective volume of the GeoMAREA system. It is of interest that the plume was captured by the Aquadopp at times when the direction of the original thermal jet at the spring orifice was directed toward the profiler. During this deployment, this took place during the same subsequent phases of the diurnal tide, but not during similar phases of the overall tidal signal, dominated by the interaction of semidiurnal and diurnal tides. Whether this is due to some tidal modulation in the spring outflow or to complex interactions of tidal currents in the Gulf remains to be studied in the future, which will require a more focused and suitably designed expedition.
The Aquadopp-recorded velocities during “quiescent” periods exhibit downward vertical components when outside but in the vicinity of the plume (Figure 3d and Figure 4a). This could be attributed to the potential forcing of an overturning cell with weak downwelling over a larger area, balancing the intense upwelling of the plume. The injection of the upward jet of warm water at the spring would cause an intensification of upward motion locally, and thus horizontal divergence at the sea-surface, which could induce convergence and subsequent downwelling around it.
In this work, the synchronous determinations of the water flow velocities combined with natural radioactivity activity concentration enriched at the efflux spring water, recommend the use of the applied sensors to characterize groundwater–seawater interaction. The residence time of the thermal water originating from this spring into the gulf was determined without sampling and laboratory measurements. In addition, the residence time at the effective area of GeoMAREA system was determined to understand the radon mobility along with the velocity of the water flow. The water supply of the thermal spring was estimated within a range between 50 and 150 m3/h, with a corresponding mean value of 72 m3/h, while the residence time of the spring inside the entire gulf was found approximately equal to 800 y.
The experimental data demonstrated that when the recordings of the two velocimeters (ADV and ADCP) agree within uncertainties, the plume is homogenously distributed in the effective volume of the GeoMAREA detection system. This research should be complemented by time series of other types of data and be seasonally repeated. In particular, a more comprehensive insight would pre-require monitoring of additional crucial parameters, related to temperature, salinity, and turbulent mixing induced by the thermal water–seawater interaction and particulate matter transfer. The aforementioned radionuclide measurements point to the ensuing research regarding the use of these measurements for validating an appropriate model of the thermal spring in the form of an upward effluxing turbulent flow. The latter validation would be optimized if the radionuclide measurements were combined with measurements of turbulent stresses along the vertical column in the vicinity of the spring. The combination of these sensors can be further applied in similar marine systems to study land–sea interaction processes and how their variability is related to global climate change factors. This future research would enable the statistical study of the variability of the aquifer characteristics.
The turbulent transport of discharged groundwater into the bay should be examined in conjunction with oceanographic parameters and/or marine drivers induced by water level fluctuations, tidal amplitudes, and wave action, and be approached by using state-of-the-art theory regarding the distribution of turbulent overturning eddies within the effluxing spring [5,45,46]. Additionally, studying the crucial influence of the atmospheric parameters on the formation of the water flow gradients at the spring alongside geophysical parameter studies would enable the correlation with climate change and tectonic variations (e.g., volcanic eruption, seismicity).

Author Contributions

Data curation, S.S., V.Z., A.V., C.T. and S.A.; formal analysis, S.S., V.Z., A.V., F.K.P. and D.P; investigation, S.S., C.T., V.Z. and S.K.; methodology, S.S. and V.Z; software, V.Z.; supervision, V.Z. and C.T.; validation, C.T. and D.P.; visualization, V.Z., C.T., D.P., S.S. and F.K.P.; writing—original draft, C.T. and S.S.; writing—review and editing, C.T., V.Z., D.P., F.K.P., S.K. and A.V. All authors have read and agreed to the published version of the manuscript.

Funding

This research was not funded by an authority or any other third party.

Institutional Review Board Statement

The study was conducted in the frame of a master’s thesis and approved for submission by the Institutional Director of the Institute of Oceanography.

Informed Consent Statement

Informed consent was obtained from all subjects involved in the study.

Data Availability Statement

The data are available on request. The data presented in this study are available on request to Spyridon Saitanis.

Acknowledgments

The research leading to these results has been supported from the BEACH project under the frame of HCMR-IO and IAEA. All authors would also like to acknowledge the crew of the research vessel provided by the University of Aegean for supporting the experimental setup and the deployment tasks.

Conflicts of Interest

The authors declare no conflict of interest.

References

  1. Garrison, G.; Glenn, C.R.; Mc Murtry, G.R. Measurement of submarine groundwater discharge in Kahana Bay, O′ahu, Hawai’i. Limnol. Oceanogr. 2003, 48, 920–928. [Google Scholar] [CrossRef] [Green Version]
  2. Taniguchi, M.; Ishitobi, T.; Saeki, K.-I. Evaluation of spacetime distributions of submarine groundwater discharge. Groundwater 2005, 43, 336–342. [Google Scholar] [CrossRef]
  3. Knee, K.L.; Street, J.H.; Grossman, E.E.; Boehm, A.B.; Paytan, A. Nutrient inputs to the coastal ocean from submarine groundwater discharge in a groundwater-dominated system relation to land use (Kona coast, Hawai’i, USA). Limnol. Oceanogr. 2010, 55, 1105–1122. [Google Scholar] [CrossRef] [Green Version]
  4. Crotwell, A.M.; Moore, W.S. Nutrient and radium fluxes from submarine groundwater discharge to Port Royal Sound, South Carolina. Aquat. Geochem. 2003, 9, 191–208. [Google Scholar] [CrossRef]
  5. Burnett, W.C.; Wattayakorn, G.; Taniguchi, M.; Dulaiova, H.; Sojisuporn, P.; Rungsupa, S.; Ishitobi, T. Groundwater derived nutrient inputs to the Upper Gulf of Thailand. Cont. Shelf Res. 2007, 27, 176–190. [Google Scholar] [CrossRef]
  6. Basu, A.R.; Jacobson, S.B.; Poreda, R.J.; Dowling, C.B.; Aggarwal, P.K. Large groundwater strontium flux to the oceans from the Bengal Basin and the marine strontium isotope record. Science 2001, 293, 1470–1473. [Google Scholar] [CrossRef] [Green Version]
  7. Montluçon, D.; Sañudo-Wilhelmy, S.A. Influence of net groundwater discharge on the chemical composition of a coastal environment: Flanders Bay, Long Island, New York. Environ. Sci. Technol. 2001, 35, 480–486. [Google Scholar] [CrossRef] [PubMed]
  8. McKenzie, T.; Dulai, H.; Fuleky, P. Traditional and novel time-series approaches reveal submarine groundwater discharge dynamics under baseline and extreme event conditions. Sci. Rep. 2021, 11, 22570. [Google Scholar] [CrossRef]
  9. Taniguchi, M.; Dulai, H.; Burnett, K.M.; Santos, I.R.; Sugimoto, R.; Stieglitz, T.; Kim, G.; Moosdorf, N.; Burnett, W.C. Submarine Groundwater Discharge: Updates on Its Measurement Techniques, Geophysical Drivers, Magnitudes, and Effects. Front. Environ. Sci. 2019, 7, 141. [Google Scholar] [CrossRef] [Green Version]
  10. Webb, J.R.; Santos, I.R.; Maher, D.T.; Tait, D.R.; Cyronak, T.; Sadat-Noori, M.; Macklin, P.; Jeffrey, L.C. Groundwater as a source of dissolved organic matter to coastal waters: Insights from radon and CDOM observations in 12 shallow coastal systems. Limnol. Oceanogr. 2019, 64, 182–196. [Google Scholar] [CrossRef]
  11. Cho, H.M.; Kim, G.; Kwon, E.Y.; Moosdorf, N.; Garcia-Orellana, J.; Santos, I.R. Radium tracing nutrient inputs through submarine groundwater discharge in the global ocean. Sci. Rep. 2018, 8, 2439. [Google Scholar] [CrossRef] [PubMed] [Green Version]
  12. McKenzie, T.; Holloway, C.; Dulai, H.; Tucker, J.P.; Sugimoto, R.; Nakajima, T.; Harada, K.; Santos, I.R. Submarine groundwater discharge: A previously undocumented source of contaminants of emerging concern to the coastal ocean (Sydney, Australia). Mar. Pollut. Bull. 2020, 160, 111519. [Google Scholar] [CrossRef]
  13. Tsabaris, C.; Scholten, J.; Karageorgis, A.P.; Comanducci, J.F.; Georgopoulos, D.; Liong Wee Kwong, L.; Patiris, D.L.; Papathanassiou, E. Underwater in situ measurements of radionuclides in selected submarine groundwater springs, Mediterranean Sea. Radiat. Prot. Dosim. 2010, 142, 273–281. [Google Scholar] [CrossRef] [PubMed]
  14. Tsabaris, C.; Anagnostou, M.N.; Patiris, D.L.; Nystuen, J.A.; Eleftheriou, G.; Dakladas, T.; Papadopoulos, V.; Prospathopoulos, A.; Papadopoulos, A.; Anagnostou, E.N. A marine groundwater spring in Stoupa, Greece: Shallow water instrumentation comparing radon and ambient sound with discharge rate. Procedia Earth Planet. Sci. 2011, 4, 3–9. [Google Scholar] [CrossRef] [Green Version]
  15. Tsabaris, C.; Patiris, D.L.; Karageorgis, A.P.; Eleftheriou, G.; Papadopoulos, V.P.; Georgopoulos, D.; Papathanassiou, E.; Povinec, P.P. In-situ radionuclide characterization of a submarine groundwater discharge site at Kalogria Bay, Stoupa, Greece. J. Environ. Radioact. 2012, 108, 50–59. [Google Scholar] [CrossRef] [PubMed]
  16. Dulai, H.; Kamenik, J.; Waters, C.A.; Kennedy, J.; Babinec, J.; Jolly, J.; Williamson, M. Autonomous long-term gamma-spectrometric monitoring of submarine groundwater discharge trends in Hawaii. J. Radioanal. Nucl. Chem. 2016, 307, 1865–1870. [Google Scholar] [CrossRef]
  17. Eleftheriou, G.; Tsabaris, C.; Patiris, D.L.; Androulakaki, E.G.; Vlastou, R. Estimation of coastal residence time of submarine groundwater discharge using radium progenies. Appl. Radiat. Isot. 2017, 121, 44–50. [Google Scholar] [CrossRef] [PubMed]
  18. Tsabaris, C.; Androulakaki, E.G.; Prospathopoulos, A.; Alexakis, S.; Eleftheriou, G.; Patiris, D.L.; Pappa, F.K.; Sarantakos, K.; Kokkoris, M.; Vlastou, R. Development and optimization of an underwater in-situ cerium bromide spectrometer for radioactivity measurements in the aquatic environment. J. Environ. Radioact. 2019, 204, 12–20. [Google Scholar] [CrossRef]
  19. Tsabaris, C.; Bagatelas, C.; Dakladas, T.; Papadopoulos, C.T.; Vlastou, R.; Chronis, G.T. An autonomous in situ detection system for radioactivity measurements in the marine environment. Appl. Radiat. Isot. 2008, 66, 1419–1426. [Google Scholar] [CrossRef]
  20. Bagatelas, C.; Tsabaris, C.; Kokkoris, M.; Papadopoulos, C.T.; Vlastou, R. Determination of marine gamma activity and study of the minimum detectable activity (MDA) in 4pi geometry based on Monte Carlo simulation. Environ. Monit. Assess. 2010, 165, 159. [Google Scholar] [CrossRef]
  21. Mendrinos, D.; Choropanitis, I.; Polyzou, O.; Karytsas, C. Exploring for geothermal resources in Greece. Geothermics 2009, 39, 124–137. [Google Scholar] [CrossRef]
  22. Bencini, A.; Duchi, V.; Casatello, A.; Kolios, N.; Fytikas, M.; Sbaragli, L. Geochemical study of fluids on Lesbos Island, Greece. Geothermics 2004, 33, 637–654. [Google Scholar] [CrossRef]
  23. Pavlides, S.; Tsapanos, T.; Zouros, N.; Sboras, S.; Koravos, G.; Chatzipetros, A. Using active fault data for assessing seismic hazard: A case study from NE Aegean Sea, Greece. In Proceedings of the 17th International Conference on Soil Mechanics & Geotechnical Engineering, Alexandria, Egypt, 2–3 October 2009. [Google Scholar]
  24. Anagnostou, C.; Sioulas, A. A sedimentological study of the Gulf of Geras (Lesvos) and the possible anthropogenic influence in the geochemical cycle of the region. Bull. Geol. Soc. Greece 1989, 23, 193–207. [Google Scholar]
  25. Lambrakis, N.J.; Stamatis, G.N. Contribution to the study of thermal waters in Greece: Chemical patterns and origin of thermal water in the thermal springs of Lesvos. Hydrol. Process 2008, 22, 171–180. [Google Scholar] [CrossRef]
  26. Arhonditsis, G.; Tsirtsis, G.; Angelidis, M.O.; Karydis, M. Quantification of the effects of nonpoint nutrient sources to coastal marine eutrophication: Applications to a semi-enclosed gulf in the Mediterranean Sea. Ecol. Model. 2000, 129, 209–227. [Google Scholar] [CrossRef]
  27. Tsirtsis, G.; Kitsiou, D.; Nitis, T.; Avagianou, E. Synthesis Report Gulf of Gera; DITTY Project Synthesis Report 2003; University of the Aegean: Lesvos, Greece, 2003. [Google Scholar]
  28. Arhonditsis, G.; Tsirtsis, G.; Karydis, M. The effects of episodic rainfall events to the dynamics of coastal marine ecosystems: Applications to a semi-enclosed gulf in the Meditteranean Sea. J. Mar. Syst. 2002, 35, 183–205. [Google Scholar] [CrossRef]
  29. Kolovoyiannis, V.; Tsirtsis, G. Implementation of a high resolution 3 dimensional hydrodynamic model to a shallow, semi-closed water body, Gulf of Gera-Lesvos. In Proceedings of the 9th International Conference on Environmental Science and Technology, Rhodes Island, Greece, 1–3 September 2005. [Google Scholar]
  30. Manoutsoglou, E.; Hasiotis, T.; Kyriakoudi, D.; Velegrakis, A.; Lowag, J. Puzzling micro-relief (mounds) of a soft-bottomed, semi-enclosed shallow marine environment. Geo-Mar. Lett. 2018, 38, 359–370. [Google Scholar] [CrossRef]
  31. Kraus, N.C.; Lohrmann, A.; Cabrera, R. New acoustic meter for measuring 3D laboratory flows. J. Hydraul. Eng. 1994, 120, 406–412. [Google Scholar] [CrossRef]
  32. Voulgaris, G.; Trowbridge, J.H. Evaluation of the Acoustic Doppler Velocimeter (ADV) for Turbulence Measurements. J. Atmosph. Ocean. Tech. 1998, 15, 272289. [Google Scholar] [CrossRef]
  33. McLelland, S.J.; Nicholas, A.P. A New Method for Evaluating Errors in High Frequency ADV Measurements. Hydrol. Process. 2000, 14, 351–366. [Google Scholar] [CrossRef]
  34. Chanson, H.; Trevethan, M.; Aoki, S. Acoustic doppler velocimetry (ADV) in a small estuarine system, field experience and “despiking”. In Proceedings of the 31st Biennial IAHR Congress, Seoul, Republic of Korea, 11–16 September 2005; Choi, G.W., Ed.; Theme E2, Paper 0161. International Association for Hydro-Environment Engineering and Research: Madrid, Spain; pp. 3954–3966. [Google Scholar]
  35. Chanson, H.; Aoki, S.; Maruyama, M. Unsteady Two-Dimensional Orifice Flow: An Experimental Study. In Coastal/Ocean Engineering Report, No. COE00-1; Department of Architecture and Civil Engineering, Toyohashi University of Technology: Toyohashi, Japan, 2000. [Google Scholar]
  36. Tropea, C. Laser Doppler anemometry: Recent Developments and future challenges. Meas. Sci. Technol. 1995, 6, 605. [Google Scholar] [CrossRef] [Green Version]
  37. Goring, D.G.; Nikora, V.I. Despiking acoustic Doppler velocimeter data. J. Hydraul. Eng. 2002, 128, 117–126. [Google Scholar] [CrossRef] [Green Version]
  38. Delcroix, T.; Masia, F.; Eldin, G. Comparison of profiling current meter and shipboard ADCP measurements in the western equatorial Pacific. J. Atmos. Oceanic Technol. 1992, 9, 867–871. [Google Scholar] [CrossRef]
  39. Lien, R.-C.; Mc Phaden, M.J.; Hebert, D. Intercomparison of ADCP measurements at 08, 1408W. J. Atmos. Oceanic Technol. 1994, 11, 1334–1349. [Google Scholar] [CrossRef]
  40. Winant, C.; Mettlach, T.; Larson, S. Comparison of buoy mounted 75-kHz acoustic Doppler current profilers with vector measuring current meters. J. Atmos. Oceanic Technol. 1994, 11, 1317–1333. [Google Scholar] [CrossRef]
  41. Irish, J.D.; Plueddemann, A.J.; Lentz, S.J. In-situ comparisons of moored acoustic Doppler profilers with conventional VACM and VMCM current meters. In Proceedings of the IEEE Fifth Working Conference on Current Measurement, St. Petersburg, FL, USA, 7–9 February 1995; IEEE: Piscataway, NJ, USA; pp. 59–64. [Google Scholar]
  42. Gordon, R. Acoustic Doppler Current Profiler: Principles of Operation, a Practical Primer, 2nd ed.; Teledyne RD Instruments Inc.: San Diego, CA, USA, 1996; Available online: http://misclab.umeoce.maine.edu/boss/classes/SMS_598_2012/RDI_BroadbandPrimer_ADCP.pdf (accessed on 25 July 2018).
  43. Holligan, P.M.; de Boois, H. Land-Ocean Interactions in the Coastal Zone (LOICZ) Science Plan. In IGBP Report no. 25; International Council of Scientific Unions: Stockholm, Sweden, 1993; p. 50. [Google Scholar]
  44. Kalfas, C.A.; Axiotis, M.; Tsabaris, C. SPECTRW: A software package for nuclear and atomic spectroscopy. Nucl. Instrum. Methods Phys. Res. Sect. A Accel. Spectrometers Detect. Assoc. Equip. 2016, 830, 265–274. [Google Scholar] [CrossRef]
  45. Kioroglou, S. On the probability of a displacement within an overturn: The influence of structural details of the potential density profile. In Proceedings of the 2014 Oceans—St. John’s, St. John’s, NL, Canada, 14–19 September 2014; pp. 1–8. [Google Scholar] [CrossRef]
  46. Kioroglou, S. On Independent Degrees of Freedom of Turbulent Mixing. Phys. Fluids 2021, 33, 105125. [Google Scholar] [CrossRef]
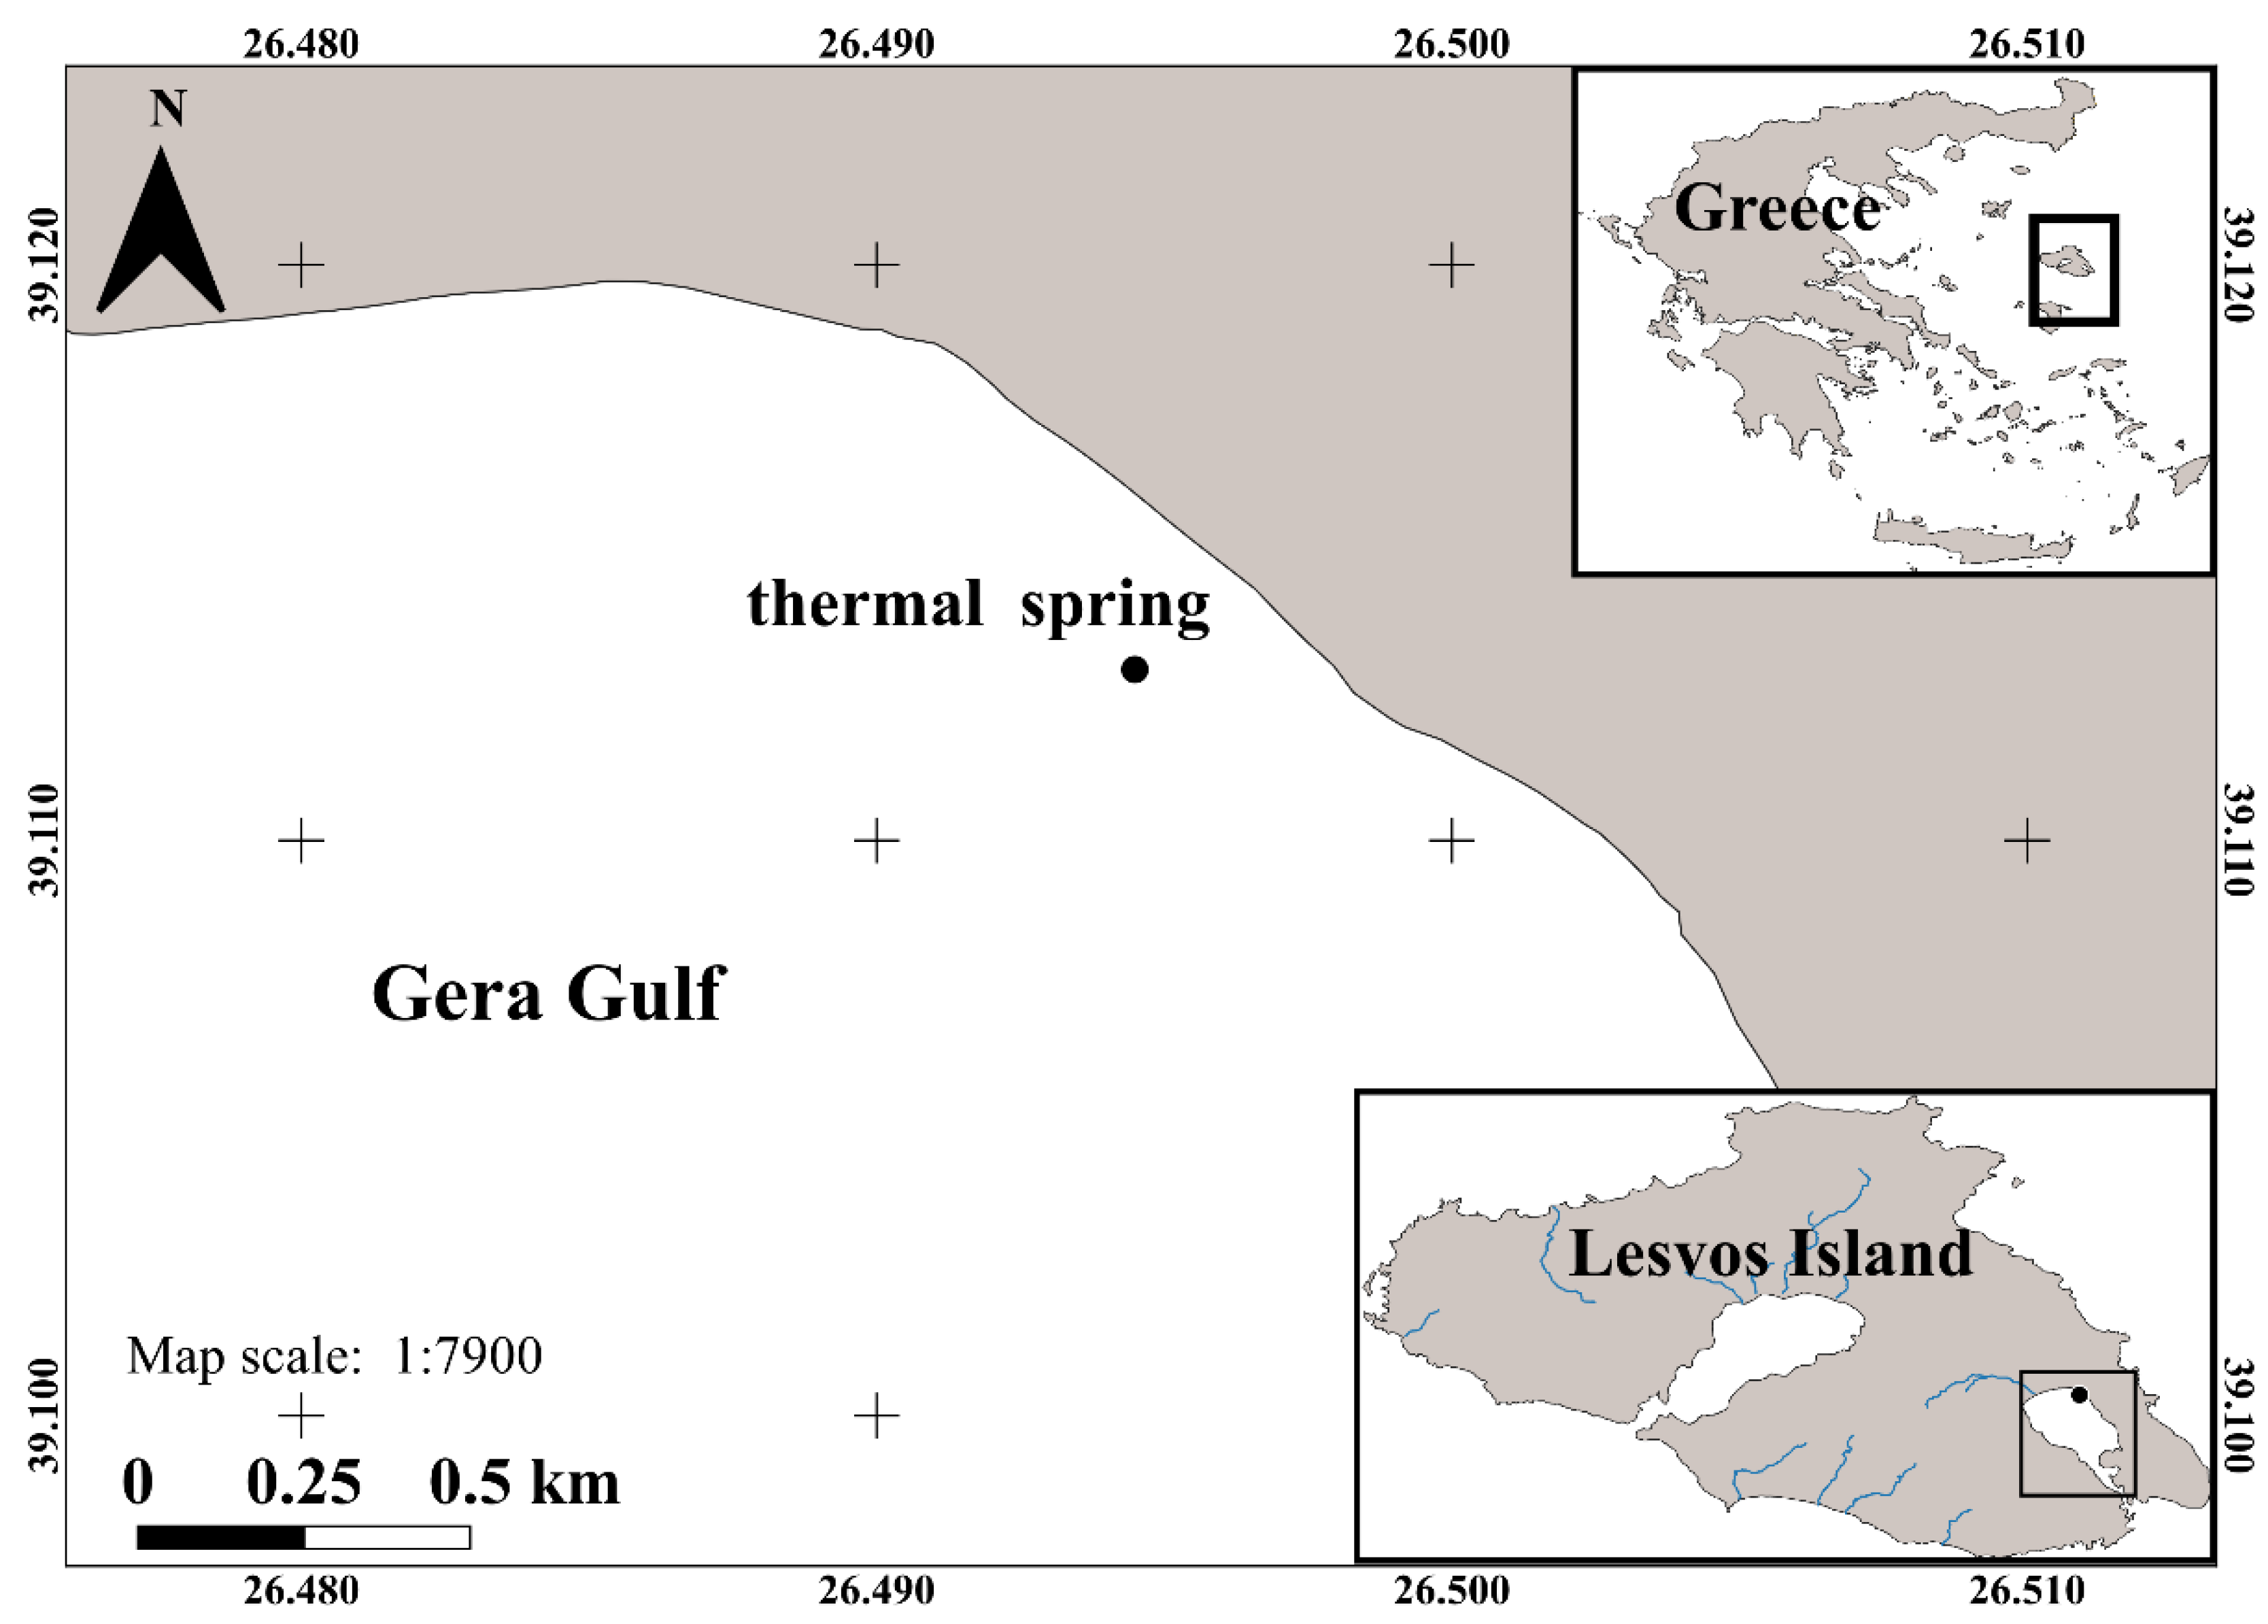
Figure 1. Map of the study area (thermal spring) in Lesvos Island, Greece.
Jmse 11 00801 g001
Figure 2. A schematic drawing of the experimental setup of the sensors’ deployments. The experimental station (c) and sensors’ setup on the flow (d). The effective radii (reff) of the measurement geometry of the GeoMAREA system are also indicated (a). The geometry of sensors’ setup effective volume are also depicted including the water surface level (b).
Jmse 11 00801 g002
Figure 3. (a) Magnitude of horizontal velocities at depths 7.7, 7.1, and 5.3 m. (b) Direction of the horizontal velocities reported in (a). The blue shading corresponds to directions of the vector-recorded, near-bed flow away from the Aquadopp profiler. (c) Vertical velocities and (d) acoustic back-scatter intensities (in counts). Throughout the figure, black refers to Vector near-bed data at 7.7 m depth, while blue to data from 7.1 m and red to data from 5.3 m, both from Aquadopp depth bins.
Jmse 11 00801 g003
Figure 4. (a) Current vertical direction superposed over acoustic back-scatter. The x- and y-axis components of the displayed vectors are proportional to the horizontal and vertical velocity components, respectively. (b) Similarly to (a), however, the x- and y-axis components of the displayed vectors correspond to the x- and y-axis horizontal components of the flow, thus near-bed vectors pointing to the right suggest flow toward the Aquadopp profiler.
Jmse 11 00801 g004
Figure 5. Overlapped time series of current velocity by the two instruments and activity concentration of radon progeny (214Bi) and thoron progeny (208Tl).
Jmse 11 00801 g005
Disclaimer/Publisher’s Note: The statements, opinions and data contained in all publications are solely those of the individual author(s) and contributor(s) and not of MDPI and/or the editor(s). MDPI and/or the editor(s) disclaim responsibility for any injury to people or property resulting from any ideas, methods, instructions or products referred to in the content.