Article

Study on the Micro-Mechanical Mechanism of Fine-Grained Marine Sediments Subjected to Shallow Gas Invasion

1
State Key Laboratory of Geomechanics and Geotechnical Engineering, Institute of Rock and Soil Mechanics, Chinese Academy of Sciences, Wuhan 430071, China
2
University of Chinese Academy of Sciences, Beijing 100049, China
3
Key Laboratory of Geotechnical Mechanics and Engineering of the Ministry of Water Resources, Yangtze River Scientific Research Institute, Wuhan 430010, China
*
Author to whom correspondence should be addressed.
J. Mar. Sci. Eng. 2023, 11(4), 822; https://doi.org/10.3390/jmse11040822
Submission received: 20 February 2023 / Revised: 10 April 2023 / Accepted: 11 April 2023 / Published: 13 April 2023
(This article belongs to the Special Issue Advances in Offshore Geotechnics)

Abstract

:
Marine sediment is an important channel for methane leakage from the earth interior to the atmosphere. The investigation of gas invasion in fine-grained marine sediments is of great theoretical and practical significance in marine science and engineering. To study the mechanical mechanisms of fine-grained marine sediments subjected to shallow gas invasion, a gas injection test with a self-developed experimental apparatus was performed, and the gas invasion behavior was investigated. The results showed that the behavior of gas invasion in fine-grained sediments can be divided into different phases; the fracturing direction β gradually changes from vertical to horizontal, and finally fractures along the roof. Based on the 2D undrained elliptical cavity model and the tensile strength of sediments, considering both tensile and shear failure modes, a discrimination criteria of gas invasion was proposed. It revealed that gas invasion gradually changes from shear failure to tensile failure, and the fracturing angle θ predicted by the criteria is consistent with the experimental phenomenon.

1. Introduction

Existing studies and investigations have indicated that there is a wide range of shallow gas seepage on the seabed [1]. Marine sediments act as the inevitable passage, through which gas seeps into the atmosphere [2]. Gas seepage not only forms many special submarine geomorphologies and geological structures (such as pockmark, gas chimney, mud volcano, etc.) [3,4,5], but also causes geological disasters, and even seriously threatens the safety of offshore structures [6,7,8]. It is of great significance to study the mechanical mechanisms of gas invasion in marine sediments, since it is conducive to clarify the occurrence characteristics of shallow gas, reveal the disaster mechanisms and prevent disasters in marine engineering [9,10].
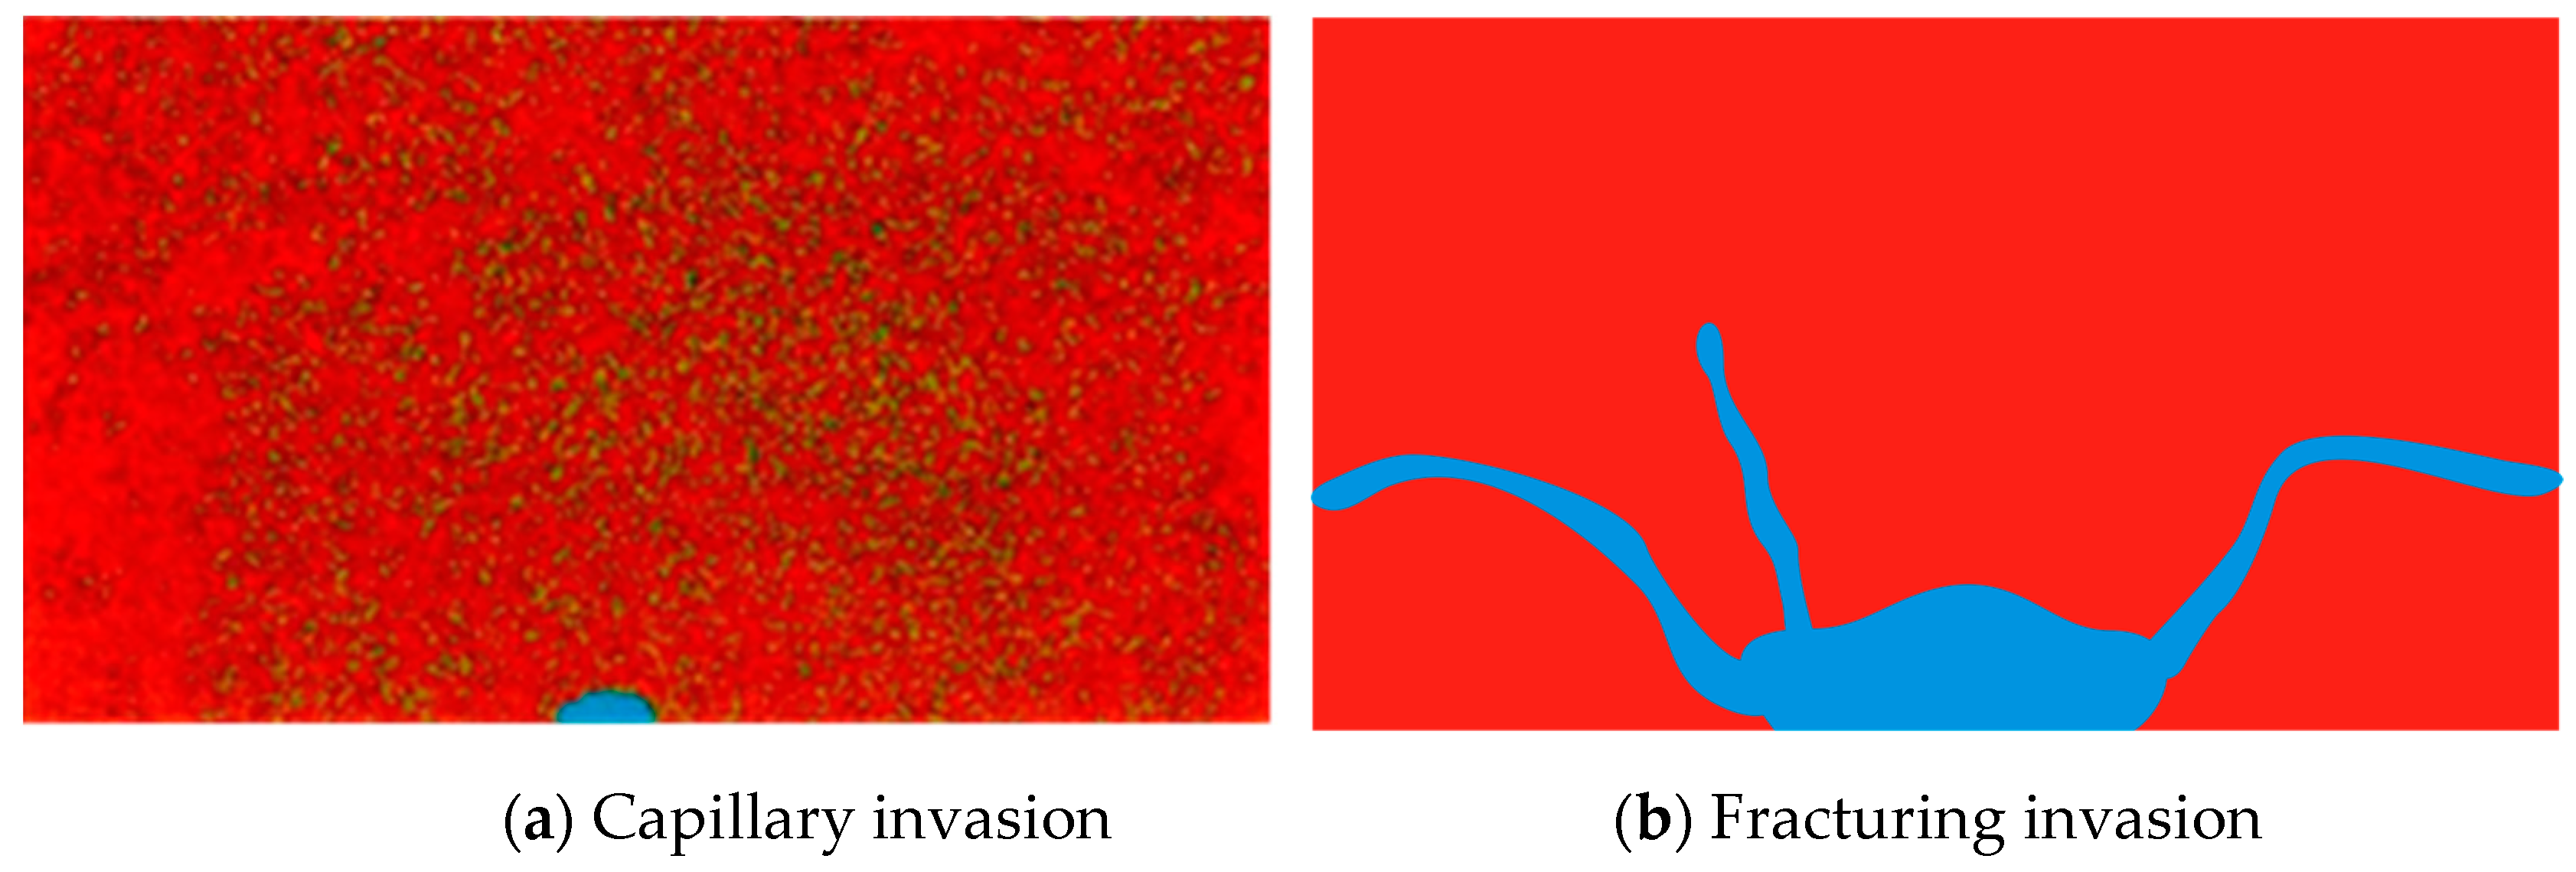
Jain and Juanes [11] pointed out that the behavior of gas invasion in sediments is jointly controlled by capillary force and the strength of sediments, which can be divided into two modes [12], as shown in Figure 1:
(1)
Capillary invasion: the gas invades into sediments along the pore space and displaces pore water with no skeleton deformation of the sediments [13].
(2)
Fracturing invasion: particles are displaced to form a crack, and the gas continues to invade into the sediments along the crack, causing significant sediment skeleton deformation [14,15].
The particle size of sediments is an important factor in determining the gas invasion modes [16]. Since particle size is positively correlated with the capillary invasion pressure pc, coarse-grained sediments have smaller pc and are prone to exhibit capillary invasion, while fine-grained sediments have larger pc and are prone to exhibit fracturing invasion.
Choi et al. [17] performed gas injection tests on two sediments with different particle sizes; using a combination of X-ray scanning technologies (CT), they confirmed for the first time that capillary invasion mainly occurs in the coarse-grain sediments, while fracturing invasion mainly occurs in the fine-grain sediments. Wang et al. [18] captured the entire process of capillary and fracturing invasion by scanning the different gas injection phases with a high-precision industrial CT. As shown in Figure 2, red area represents soil mass, while blue area represents gas bubbles. In the case of capillary invasion, the bubbles appeared to be diffused, while in the case of fracturing invasion, the cracks develop diagonally upward along the bubble surface.
At present, a number of studies have been conducted to explore the mechanical mechanism of gas capillary invasion in the coarse-grained sediments; meanwhile, gas fracturing invasions in the fine-grained sediments have not been investigated in-depth.
The gas fracturing invasion mode is mainly determined by the strength of sediments [19]. Researchers have considered different failure modes of sediment mass and put forward a series of invasion pressure formulas according to different theories [20]. Several researchers suggested that tensile failure is the cause of fracturing (Bjerrum et al. [21], Decker and Clemence [22], Jaworski et al. [23], Fukushima [24], Lo and Kaniaru [25], Andersen et al. [26], Medeiros and Moffat [27]), while others suggested that shear failure is the cause (Mori and Tamura [28], Panah and Yanagisawa [29], Yanagisawa and Panah [30], Atkinson et al. [31], and Zervos et al. [32]). Jaworski et al. [23] proposed that gas fracturing invasion in sediments is caused by tensile failure, and they considered the influence of confining pressure and other factors on the tensile failure process. Mitchell and Soga [33] also suggested that gas fracturing invasion is caused by tensile failure, and the minimum effective principal stress σ3′ obtained from the circular cavity expansion theory was used as the criterion. When σ3′ is manifested as tensile stress and its value exceeds the effective tensile strength σt’, then failure occurs. Soga et al. [34] suggested that shear failure could occur before tensile failure, and they took the ultimate cavity expansion pressure proposed by Vesic [35] based on the cylindrical cavity expansion theory of linearly elastic isotropic sediment as the criterion of gas fracturing invasion.
Experimental studies have found that the gas fracturing invasion pressure is often lower than the ultimate cavity expansion pressure. Panah and Yanagisawa [29] improved the previous work and took the yield stress obtained from the cavity expansion theory as the criterion, assuming that the radius differed before and after cavity expansion and existed under the condition of no drainage. Soga et al. [34] proposed that, in the process of cavity expansion, due to the deformation of plastic zone, the cavity is in an unstable state, which leads to the generation of tensile stress at microcracks. Therefore, fracturing invasions caused by shear failure are actually caused by tensile failure. Daigle [36] proposed a simpler method to determine the tensile strength of sediments based on Hoek and Brown’s failure criterion [37]. From above, previous studies mainly focused on a single failure mode to propose the criterion of gas fracturing invasion. In fact, gas invading upward along a crack until the breakthrough is a continuously changing process, with different behaviors in different phases [38]; therefore, there are limitations to describing the process with reference to a single failure mode.
In light of the aforementioned issues, this work aims to investigate the behavior of the gas invasion in fine-grained marine sediments and put forward a criteria of gas invasion corresponding to the different phases of experimental phenomena. Based on the gas injection test in fine-grained sediments conducted with a self-designed test apparatus, the gas invasion behaviors were observed. Considering the different failure modes of sediments under tensile and shear conditions, a criteria of gas invasion was proposed, and the predicted results were compared with the experimental phenomena.

2. Materials and Methods

2.1. Test Materials

In order to eliminate the interference of chemical composition, considering the influence of particle size on gas invasion modes in sediments, the tested fine-grained materials were made of silica powder, and their main chemical composition was SiO2; the composition of the silica power is shown in Table 1.
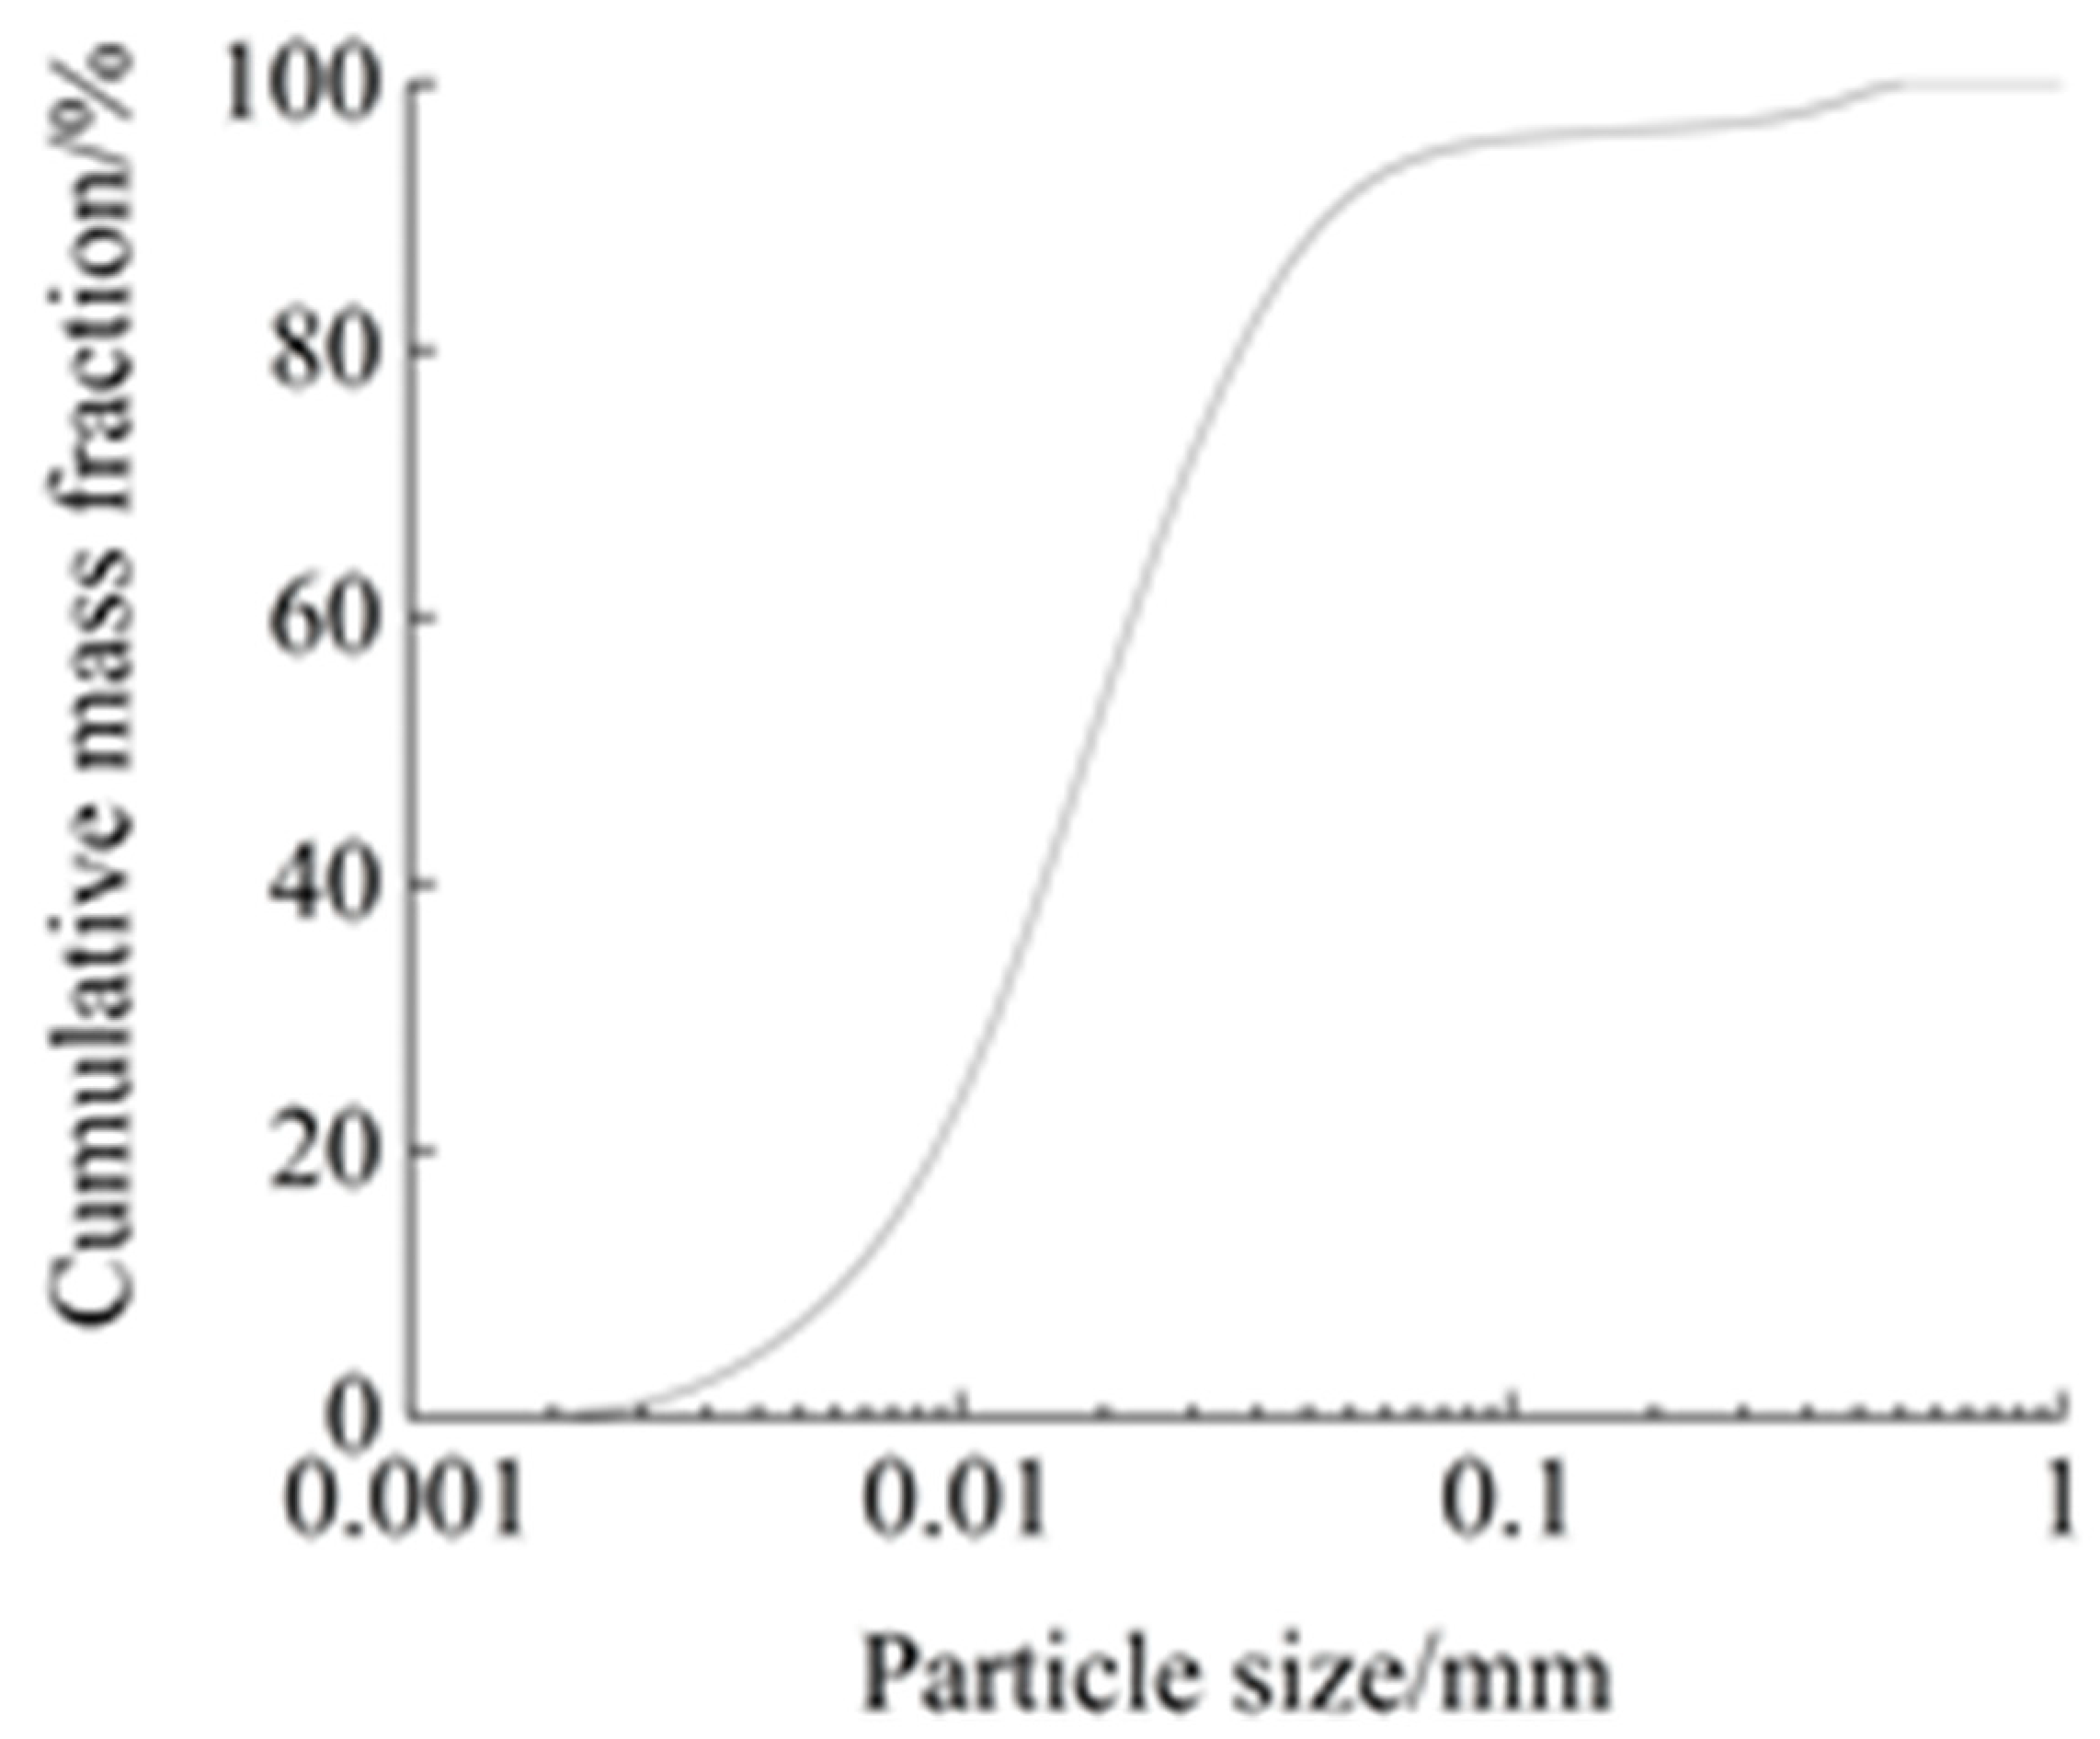
The particle size distribution curve of silica powder was determined using a laser diffraction apparatus (Mastersizer 3000, malvern panalytical, Malvern, UK). As shown in Figure 3, the particle size of silica powder is mainly in the range of 10–100 μm, the median particle size (D50) is 17 μm, and the maximum particle size is 517 μm.
It can be seen from Figure 3 that the particles smaller than 0.075 mm account for more than 50% of the total particles; so it can be classified as a fine-grained sediment. In addition, as can be seen from Table 2, the liquid limit is 35.5% (less than 50%), and the plasticity index is below the A-line of plasticity chart. According to the Unified Soil Classification System (USCS) [39], the sediments can therefore be classified as silt.

2.2. Test Apparatus

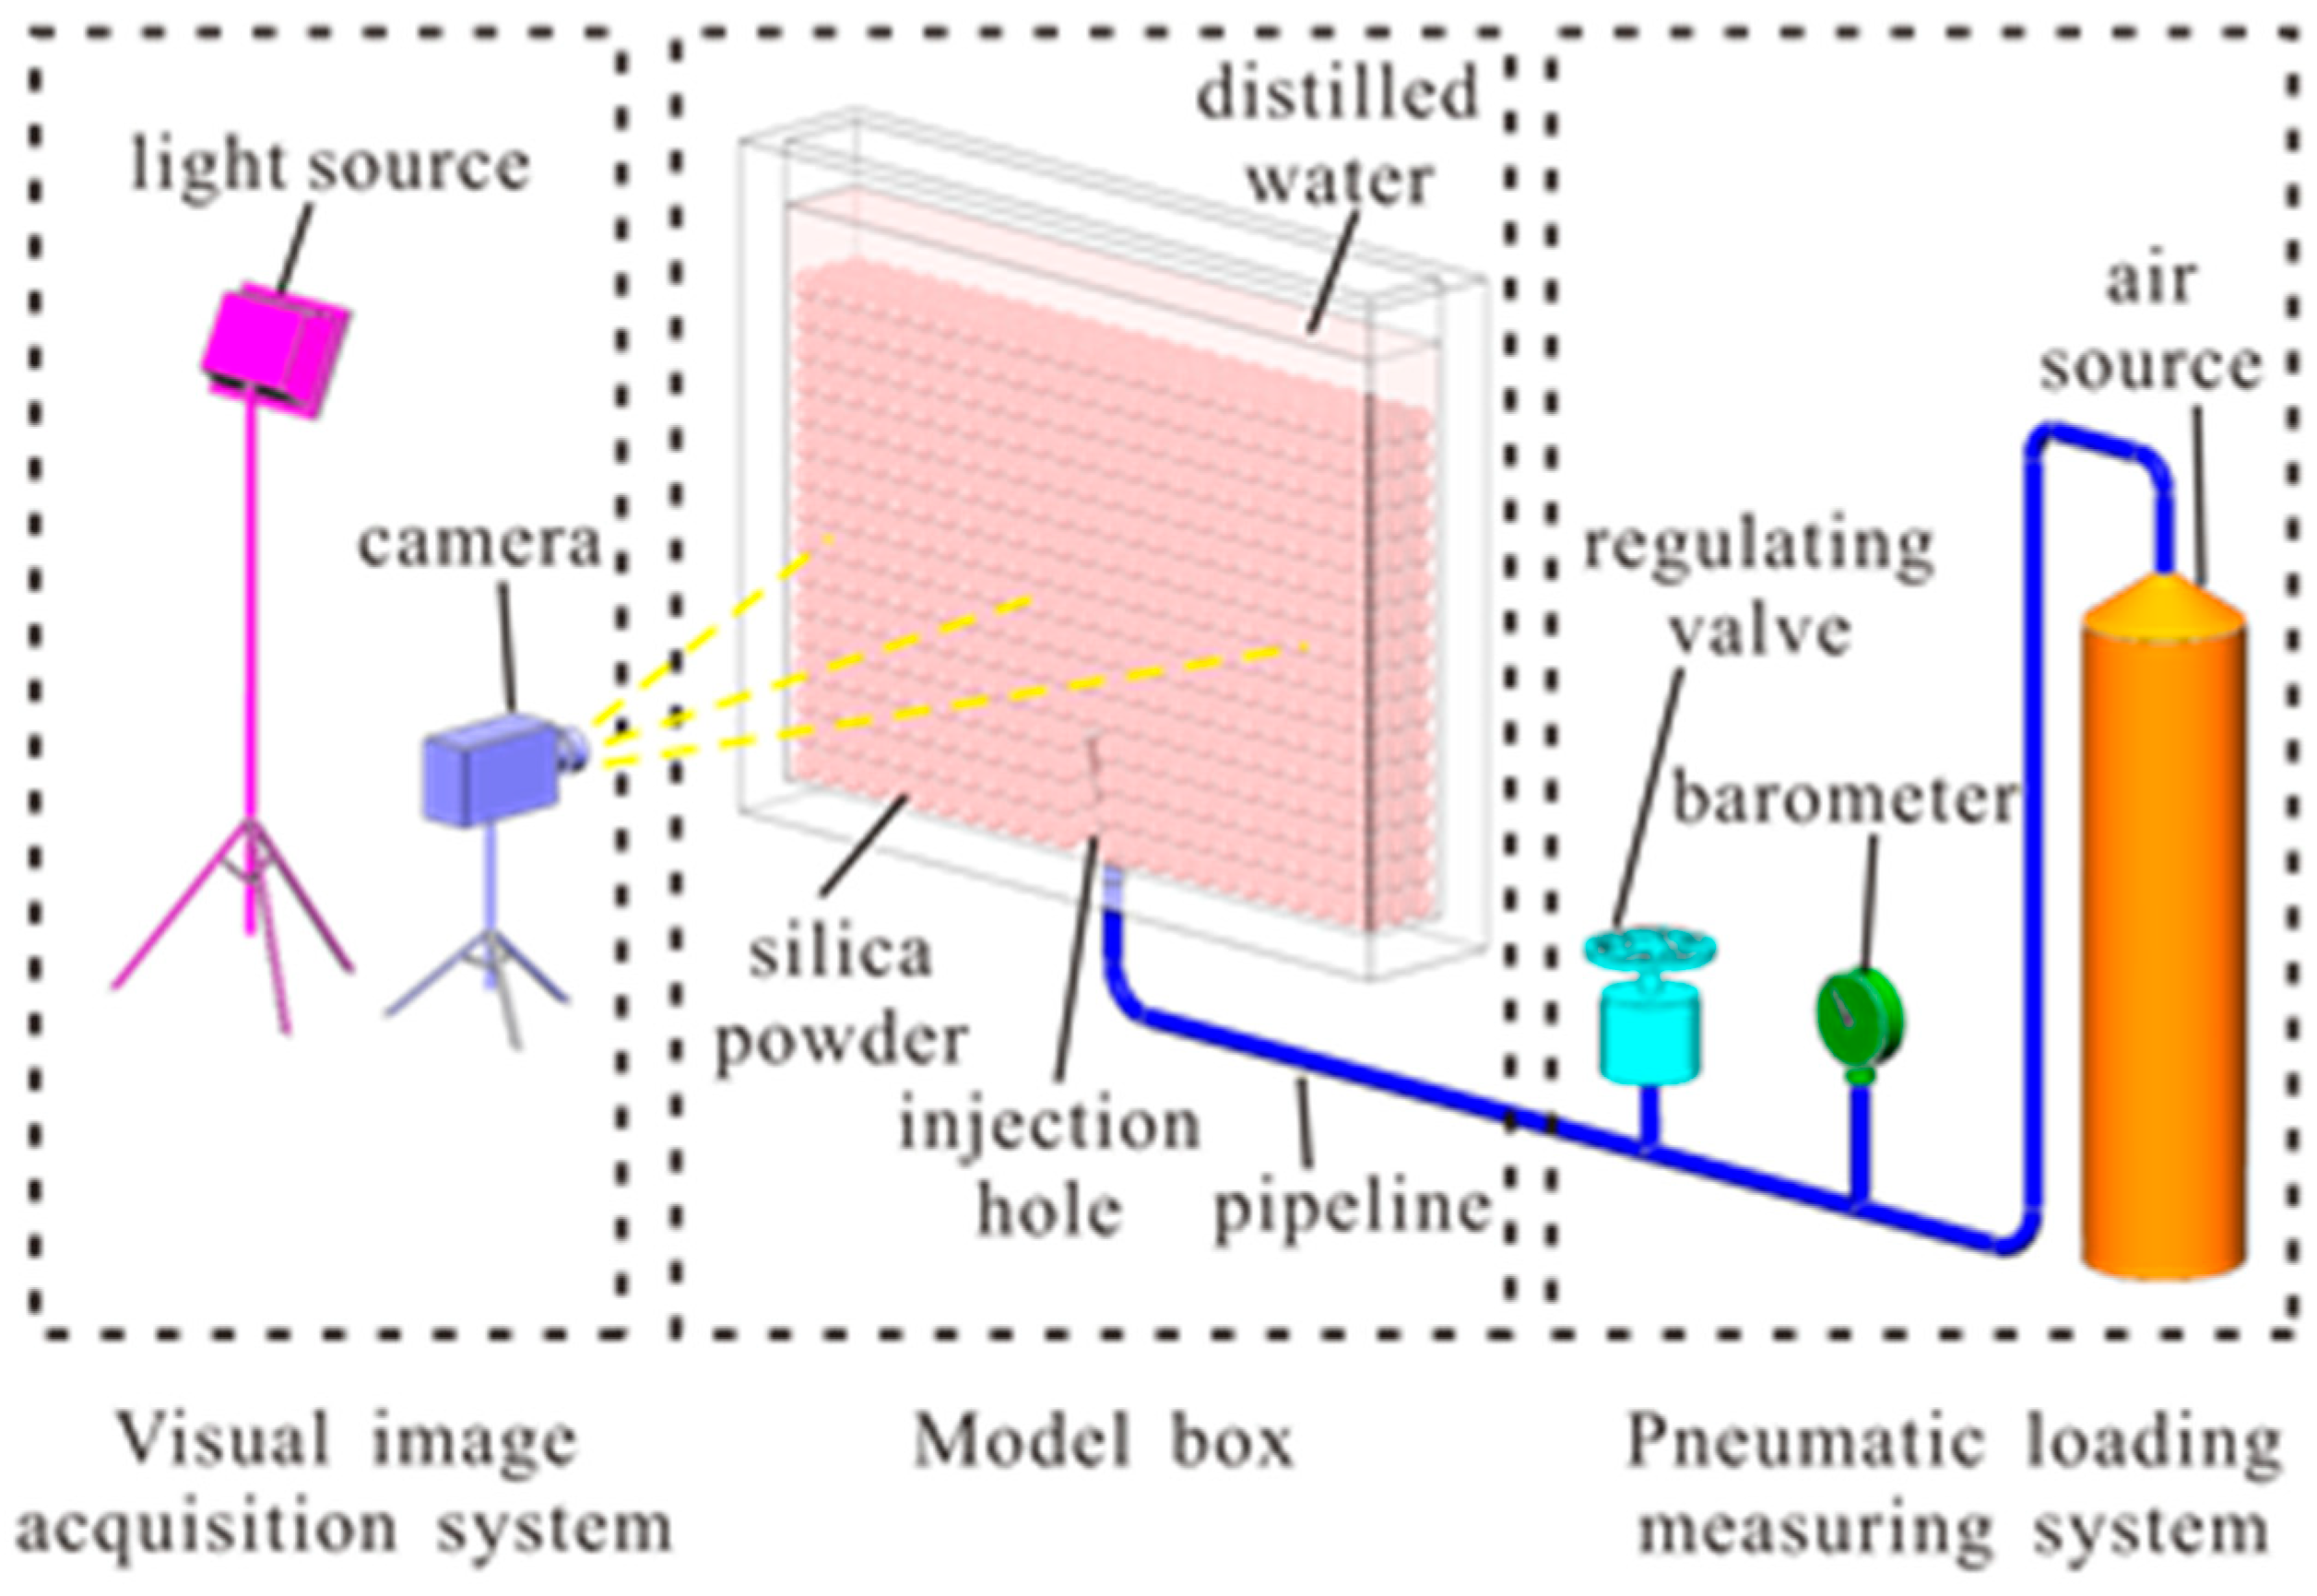
In order to analyze the gas invasion behaviors in fine-grained marine sediments, a novel experimental apparatus was developed, as shown in Figure 4, which was composed of three parts: a model box, a pneumatic loading measuring system, and a visual image acquisition system. Gas can be continuously injected into the sediments through an injection hole; with the combination of visualization method, the evolution characteristics of gas invasion behavior were observed. The main components of the test apparatus are introduced as follows.

2.2.1. Model Box

The model box used in the test was designed as square slot, which was mainly made of plexiglass plate. The net size inside the model box is 25 cm × 3.5 cm × 20 cm. In order to prevent gas invading along the bottom surface of the model box, forcing gas to invade into the sediments upward, and to obtain a complete image of gas invasion behavior, it is necessary to place the injection hole within the height range of 1/5–1/3 sediments from the bottom. Therefore, a duck nozzle with a height of 4 cm, a length of 3.5 cm, and a width of 1 mm was connected to the upper end of the bottom plate. The duck nozzle was placed close to the front and back of the model box and perpendicular to the length direction of the bottom plate.
The particle size effect needs to be considered in relation to the size of the model box. Only when the size of model box is much larger than the particle size can the sediments be considered to satisfy the assumption of continuity and uniformity. Otherwise, the particle size effect could affect the test results [40]. Criag [41] suggested that the particle size effect could be eliminated when the ratio of the model box size to the particle size exceeded 40; Xu [42] contended that the particle size effect could be eliminated when the ratio of the model box size to the particle size exceeded 30; and Kusakabe [43] believed that the particle size effect could be essentially eliminated when the ratio of the model box size to the particle size exceeded 100. As the median particle size D50 of the test material selected in Section 2.1 is 17 μm, and the minimum net size of the model box is 3.5 cm (it is more than 200 times D50), the particle size effect can be eliminated in this work.

2.2.2. Pneumatic Loading Measuring System

The pneumatic loading measuring system comprised three parts: an air source, a regulating valve, and a barometer. Although the main component of shallow gas is methane, in order to ensure safety in the laboratory environment, nitrogen gas was selected in the test, since methane and nitrogen are both non-polar molecules, both of which are insoluble in water and do not differ significantly in terms of molecular weight and viscosity. At the same time, in order to ensure the stability of injection gas pressure, a high-purity nitrogen cylinder was used as the gas source. The regulating valve used in the test has a set pressure range of 0.005–0.2 MPa, and its sensitivity can be controlled within 0.2%, which meets the requirement of pressure control. The measuring range of the barometer used in the test is 0–100 kPa and its measuring accuracy is 0.01 kPa.

2.2.3. Visual Image Acquisition System

The visual image acquisition system included a camera and a light source. The camera is a Canon 5D MARK II with 21.1 million effective pixels and a frame rate of 25. The camera was placed directly in front of the model box in a vertical direction. The image included the whole sample length and height range. At the same time, in order to obtain a better image effect during the shooting process, an LED light source was set directly above the camera 30 cm away from the model box and shined vertically on the front of model box.

2.3. Test Methods

The test procedures mainly involve the sample preparation, saturation and consolidation, and the gas injection test, as follows:

2.3.1. Sample Preparation

Before loading the sample, clean the impurities inside the model box to obtain a better visualization image, and clean the pipeline. Weigh the air-dried silica powder and fill the model box with it. Set the total height of the sample as 15 cm, and load the silica powder into the model box five times according to the deposition method. Before filling the next layer, the current layer surface of sample should be shaved. If the sample height exceeds the preset height, use tools to tamp until the sample height matches the target height. If the sample height is less than the target height, reinstall the sample until the sample height meets the target height to ensure the uniformity of sample. In the process of sample preparation, special attention should be paid to not touching the injection hole to prevent damaging it. After filling the model box with the sample, filter paper and permeable stone with the same size in length and width as the model box were placed on top of the sample to ensure it is not disturbed in subsequent process of saturation and consolidation.

2.3.2. Saturation and Consolidation

Vacuum extraction: as shown in Figure 5, keeping the injection hole open, put the model box into a vacuum chamber, which was connected to the pump. Then, close the pipe clamp, and perform the vacuum extraction. The pump-down time should not be less than 2 h. It is worth noting that the water inlet should not be placed directly above the model box to reduce disturbance to the sample.
Saturation and consolidation: as shown in Figure 6, the distilled water was prepared in advance, then it was injected into the vacuum chamber after the vacuum extraction was completed. When the liquid level in the vacuum chamber was close to the top surface of the model box, the rate needed to be slowed down to ensure that the water continued to flow into the sample from the top surface of the model box at a slow speed, so as to reduce disturbance to the sample. At this time, the distilled water entered into the sample either through the injection hole and the top of model box. The consolidation time should not be less than 24 h, to ensure the full saturation of sample.

2.3.3. Gas Injection Test

The model box was placed on the horizontal platform, and the injection hole, the regulating valve, the barometer, and the air source were connected through the pipeline. Check the air tightness of the device, keep the injection hole closed, open the air source, and adjust the regulating valve. If the barometer maintains a constant pressure value, the air tightness of the device is good. If the barometer cannot maintain a pressure value, and the pressure value is declining, and the air tightness of the whole device should be checked before the subsequent gas injection test is carried out.
Keep the injection hole closed, open the air source, and set the initial gas pressure to 2 kPa due to the water head height of 20 cm. Keeping the injection hole open, the gas-liquid interface in the pipeline receded at the beginning; then, adjust the regulating valve and allow the gas pressure to increase by increments of 0.5 kPa, until the gas-liquid interface slowly pushed forward, indicating that the gas was constantly invading. Record the gas pressure as ug. The whole process whereby the gas invaded into the sediments was recorded by the camera.
After the gas injection test, the video software “Adobe Premiere” was used to analyze and screen the typical phase behaviors of the gas invasion in sediments frame by frame, while “ImageJ” software was used to process the figures obtained from the experiment.

3. Results and Discussion

3.1. Test Phenomenon Analysis

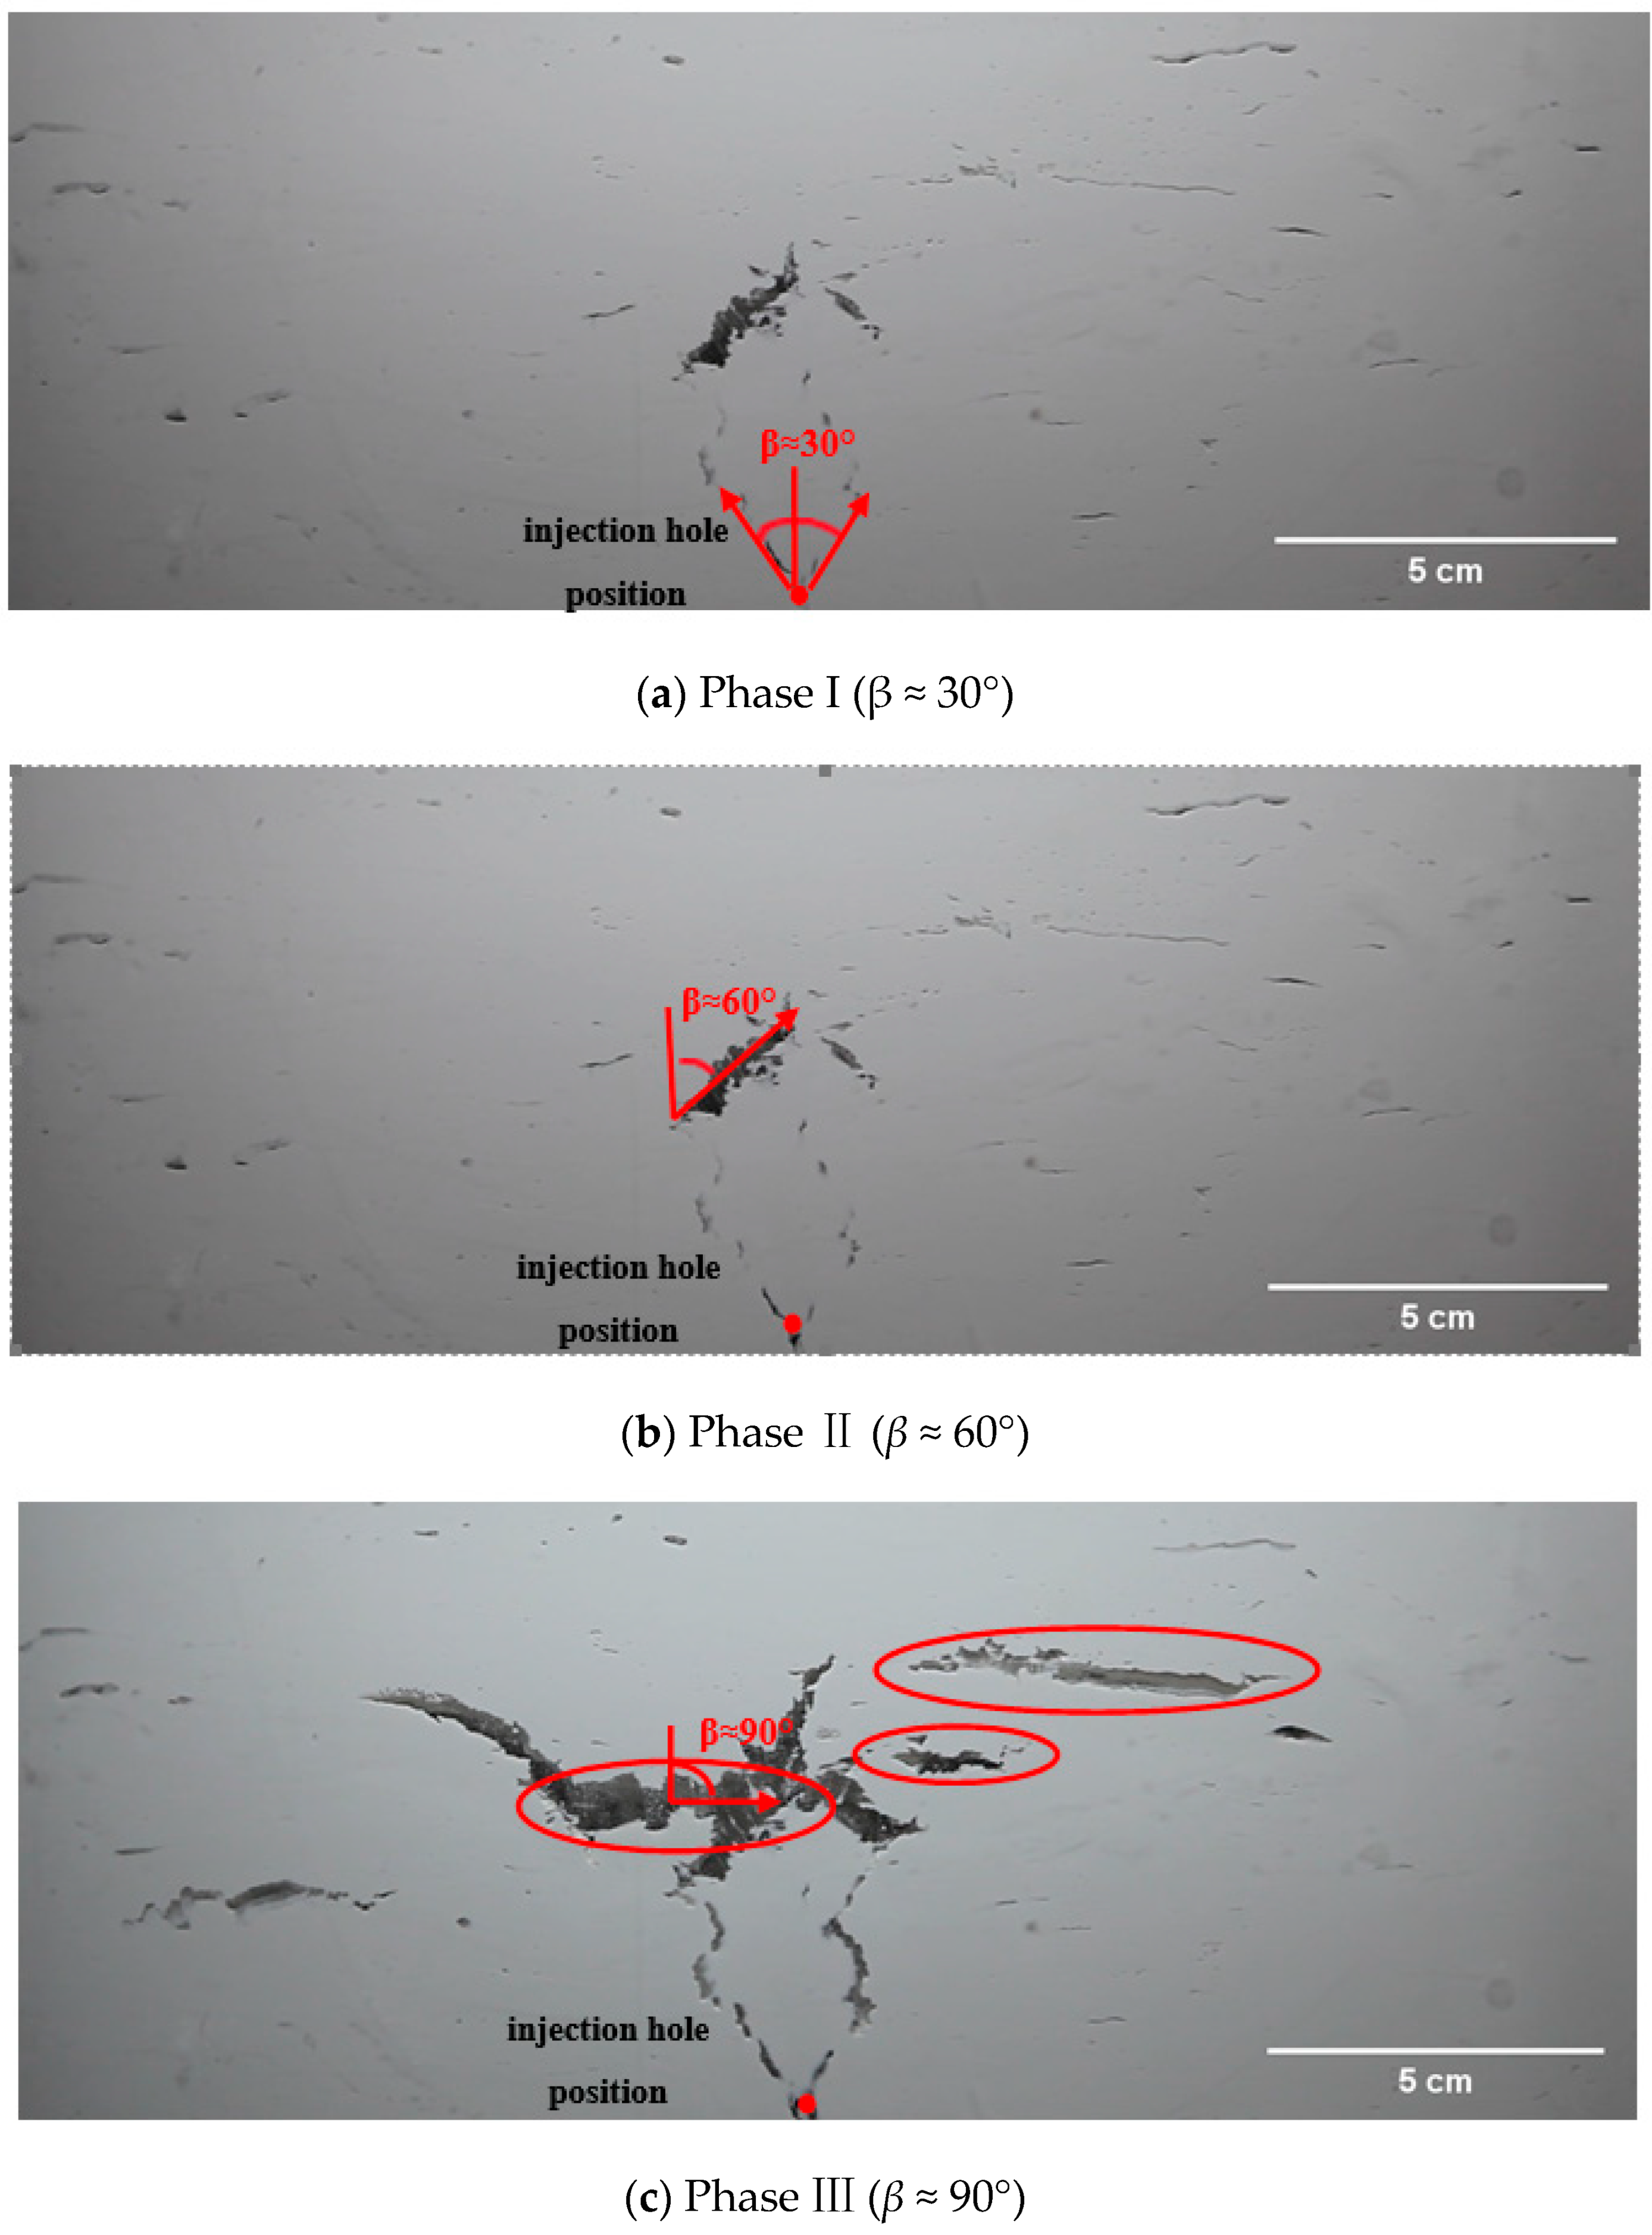
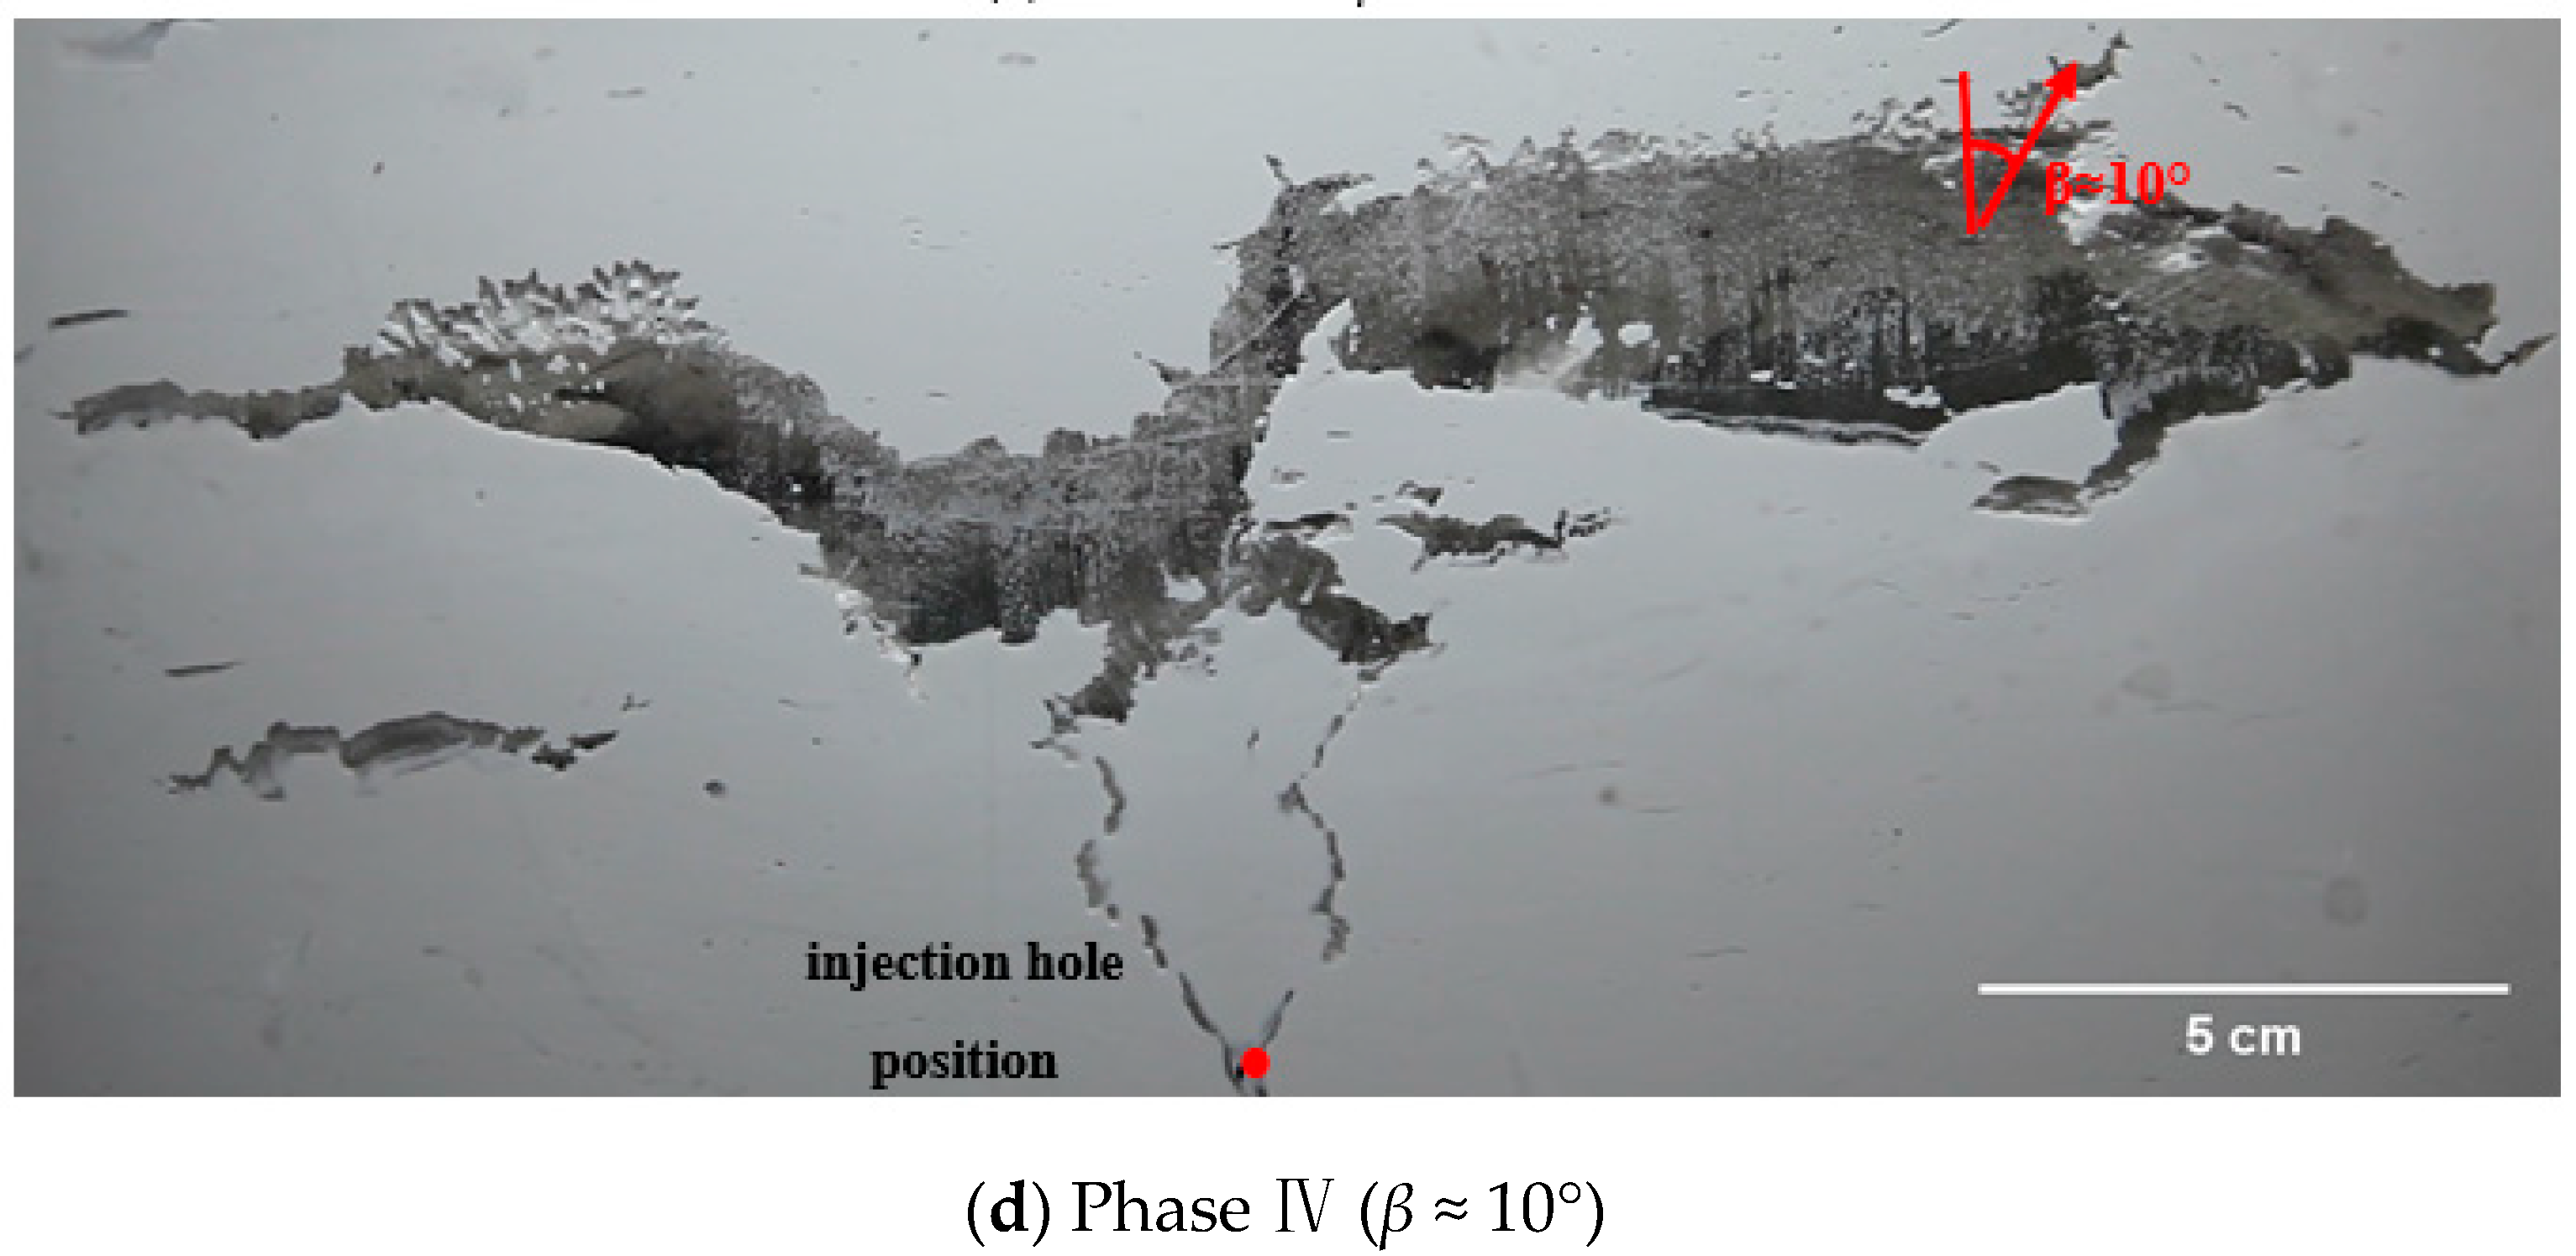
According to the visual image acquisition system described in Section 2.2.3, the behavior of gas invasion in fine-grained sediments was analyzed. It is worth noting that the gas injection test was repeated for five times, and the experimental phenomena obtained from these tests almost have no significant differences. As shown in Figure 7, gas mainly invades into the fine-grained sediments in the form of fracturing invasion. Here, the fracturing direction β is defined as the angle between the long axis direction of the crack and the vertical direction. Therefore, the behavior of gas fracturing invasion can be divided into four phases:
(1)
Phase I
As shown in Figure 7a, after gas accumulated into a circular bubble with a radius of 0.1 cm at the location of injection hole, it symmetrically fractured the sediments along the upper left and upper right directions from the position of injection hole. The fracturing direction β ≈ 30° is indicated by the red arrow in Figure 7a. At this time, the length of the crack along the fracturing direction kept increasing. Along the vertical fracturing direction, the length far exceeded the width, but the width essentially showed no increase. Specifically, the crack resembled a pancake, with β ≈ 30°.
(2)
Phase II
When the length of crack continued to increase along the fracturing direction of phase I, it reached about 1 cm, but the width remained at about 0.1 cm, the gas began to fracture fine-grained sediments along the upper right direction; the fracturing direction β ≈ 60° is indicated by red arrow in Figure 7b. At this time, both the length and width of the crack increased synchronically. Specifically, the crack resembled a disk, with β ≈ 60°.
(3)
Phase III
The length of crack continued to increase along the fracturing direction of phase II, and the width also increased synchronously; when the length of the cracks reached about 5 cm and the width reached about 0.2 cm, gas began to fracture the sediments along the horizontal direction; the fracturing direction β ≈ 90° is indicated by the red circle in Figure 7c. As the case in phase II, the length and width of the crack further increased, and the crack resembled a disk, with β ≈ 90°.
(4)
Phase IV
The length of the crack continued to increase along the fracturing direction of phase III, and the width also increased simultaneously. When the length of crack reached about 11.5 cm and the width reached about 2.5 cm, the gas began to fracture sediments along the upper right direction (the fracturing direction β ≈ 10° is indicated by the red arrow in Figure 7d) until the gas completely fractured sediments.

3.2. The Criteria for Fracturing Invasion

As shown in Figure 7, the behavior of gas invasion in fine-grained sediments mainly takes the form of fracturing invasion; it is observed that, during the process of fracturing invasion, the fracture direction β continuously transitions from vertical to horizontal until the crack develops to a certain extent along the horizontal direction, and further fractures along the top of crack.
As mentioned above, previous studies focused on the single tensile or shear failure mode to propose the criterion of gas fracturing invasion, which has difficulty in reasonably explaining the whole process of fracturing invasion. Therefore, based on the stress state of the cavity boundary and the strength of sediments, considering the different failure modes of sediments under tensile and shear conditions, the following criteria for fracturing invasion are proposed in Equation (1):
σ min σ t 1 , σ min 0 , tensile   failure q 2 s u 1 , σ min > 0 ,   shear   failure  
where σmin and su are the minimum principal stress and undrained strength at the bubble boundary, respectively. According to Equation (1), the value calculated by Equation (1) is dimensionless, if σmin is negative, the sediment is tensioned. It is stated that, if σmin exceeds the tensile strength σt of the sediment, the sediment mass suffers tensile failure. If σmin is positive, then the sediment mass is compressed. It is further stated that, when the deviator stress q exceeds two times su, the sediment mass suffers the shear failure.
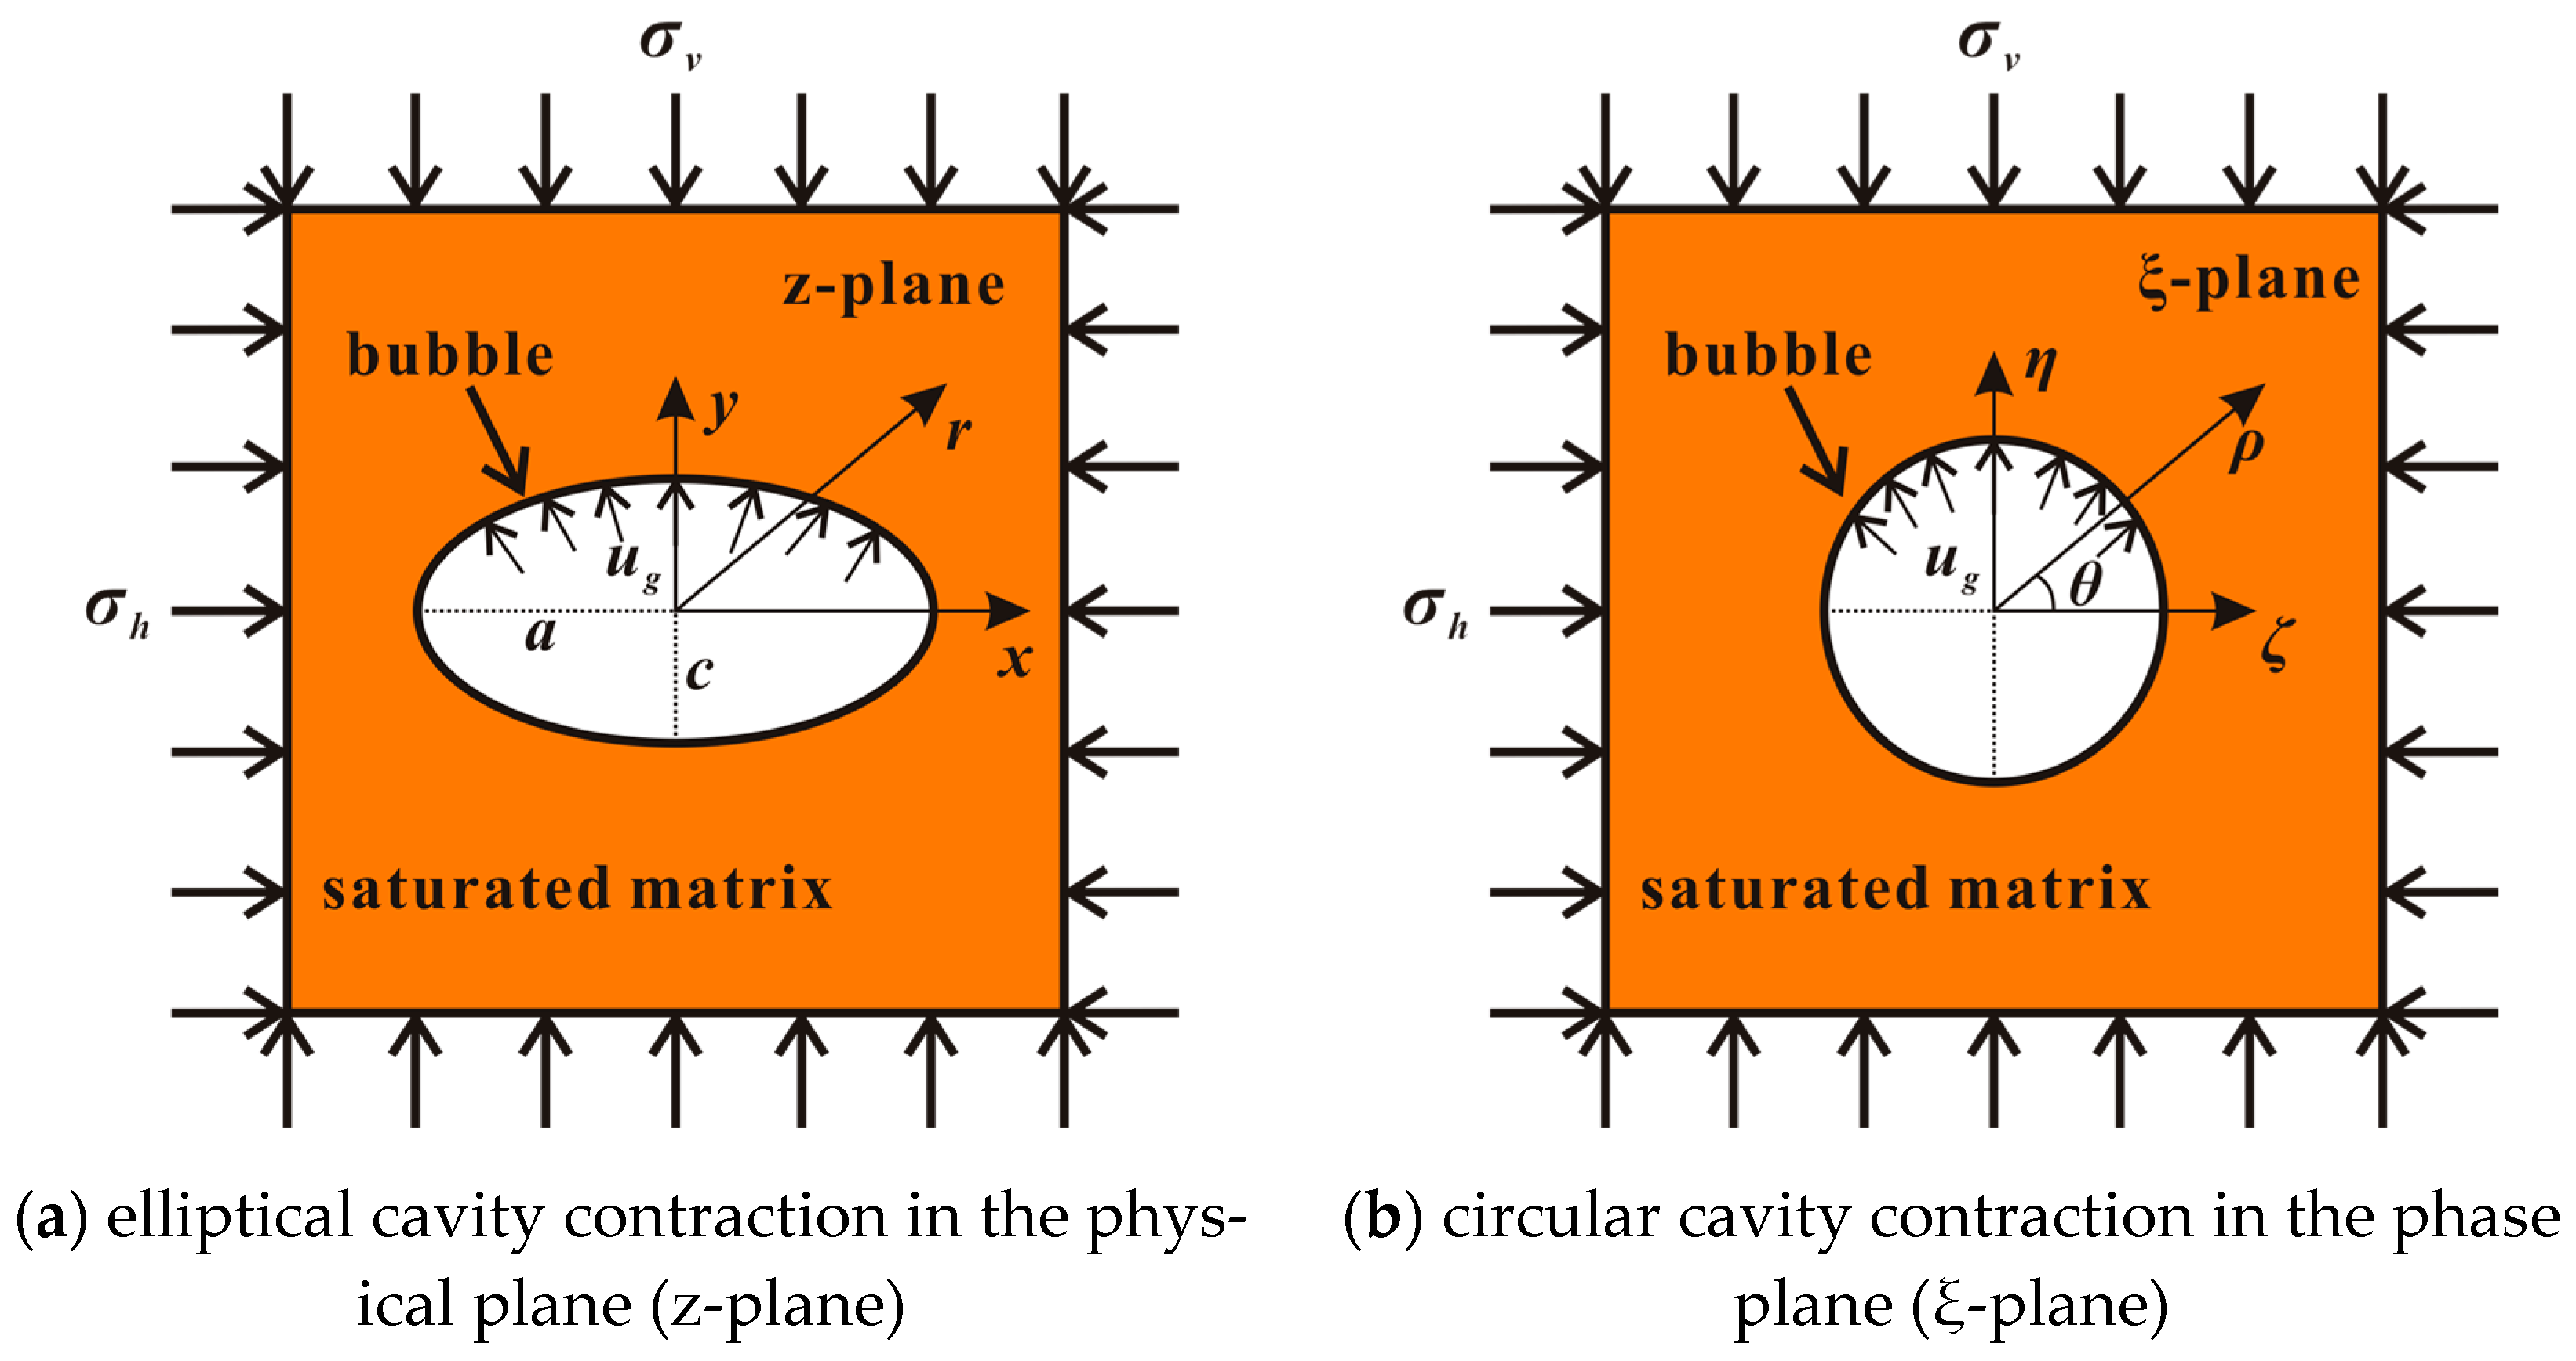
σmin and su shown in Equation (1) can be obtained by solving the undrained compression problem of the 2D elliptic cavity. As shown in Figure 8, the bubble is idealized as an elliptical cavity with the horizontal axis radius a and vertical axis radius c existing in anisotropic saturated matrix. The saturated matrix is subjected to a vertical load σv and horizontal load σh on its external surface and a uniform gas pressure ug on the internal surface of the bubble.
Using the conformal mapping technique, the stress around an elliptic cavity in the physical plane can be transformed by available solutions for stresses near a circular cavity in the phase plane (i.e., ρ-θ plane, where ρ radius of the circular bubble and θ the angle between the ζ axis and ρ axis).
The stresses around a circular cavity within an anisotropically stressed elastic material in the phase plane have been derived by Muskhelishvili [45] (circumference stress σρ, radial stress σθ, tangential stress τρθ), as shown below:
σ θ = σ υ 1 m 2 2 m + 2 cos 2 θ 1 + m 2 2 m cos 2 θ + σ h 1 m 2 + 2 m 2 cos 2 θ 1 + m 2 2 m cos 2 θ u g 1 3 m 2 + 2 m cos 2 θ 1 + m 2 2 m cos 2 θ
σ ρ = u g
τ ρ θ = 0
where σρ is obtained via the superposition resulting from the vertical and horizontal external stresses (σv and σh) and the internal stress applied to the cavity (ug). m is a function of the horizontal axis and vertical axis radius (a and c), as formulated in Equation (5):
m = a c / a + c
Based on Equation (2) to Equation (4), the minimum principal stress σmin and the undrained shear strength su around the elliptical cavities can be determined by the following equations:
σ min = σ ρ + σ θ 2 σ ρ σ θ 2 2 + τ ρ θ 2 = 1 2 u g + σ υ 1 m 2 2 m + 2 cos 2 θ 1 + m 2 2 m cos 2 θ + σ h 1 m 2 + 2 m 2 cos 2 θ 1 + m 2 2 m cos 2 θ u g 1 3 m 2 + 2 m cos 2 θ 1 + m 2 2 m cos 2 θ 1 2 u g σ υ 1 m 2 2 m + 2 cos 2 θ 1 + m 2 2 m cos 2 θ σ h 1 m 2 + 2 m 2 cos 2 θ 1 + m 2 2 m cos 2 θ + u g 1 3 m 2 + 2 m cos 2 θ 1 + m 2 2 m cos 2 θ 2
s u = σ ρ σ θ 2 2 + τ ρ θ 2 = 1 2 u g σ υ 1 m 2 2 m + 2 cos 2 θ 1 + m 2 2 m cos 2 θ σ h 1 m 2 + 2 m 2 cos 2 θ 1 + m 2 2 m cos 2 θ + u g 1 3 m 2 + 2 m cos 2 θ 1 + m 2 2 m cos 2 θ 2
σ t = e K I C π d
where σt is the tensile strength of the sediment mass, which is defined by Johnson [46] with the theory of LEFM (linear elastic fracture mechanics) shown in Equation (8), and KIC is the fracture toughness of the sediment. Since the test material is classified as silt, referring to the fracture toughness result of silt measured by Zhang [47] based on a gas injection test, the selected KIC value is 150 Pa·m0.5, which is consistent with the result measured by Barry [48] through an in situ test. d is the half-length of the crack, that is, half of the larger value of a or c, and e is a geometrically dependent coefficient. As the shape of the bubbles is oblate or oblong according to the acoustic and CT testing methods, the geometric parameter e = π/2.

3.3. Mechanism of Fracturing Invasion

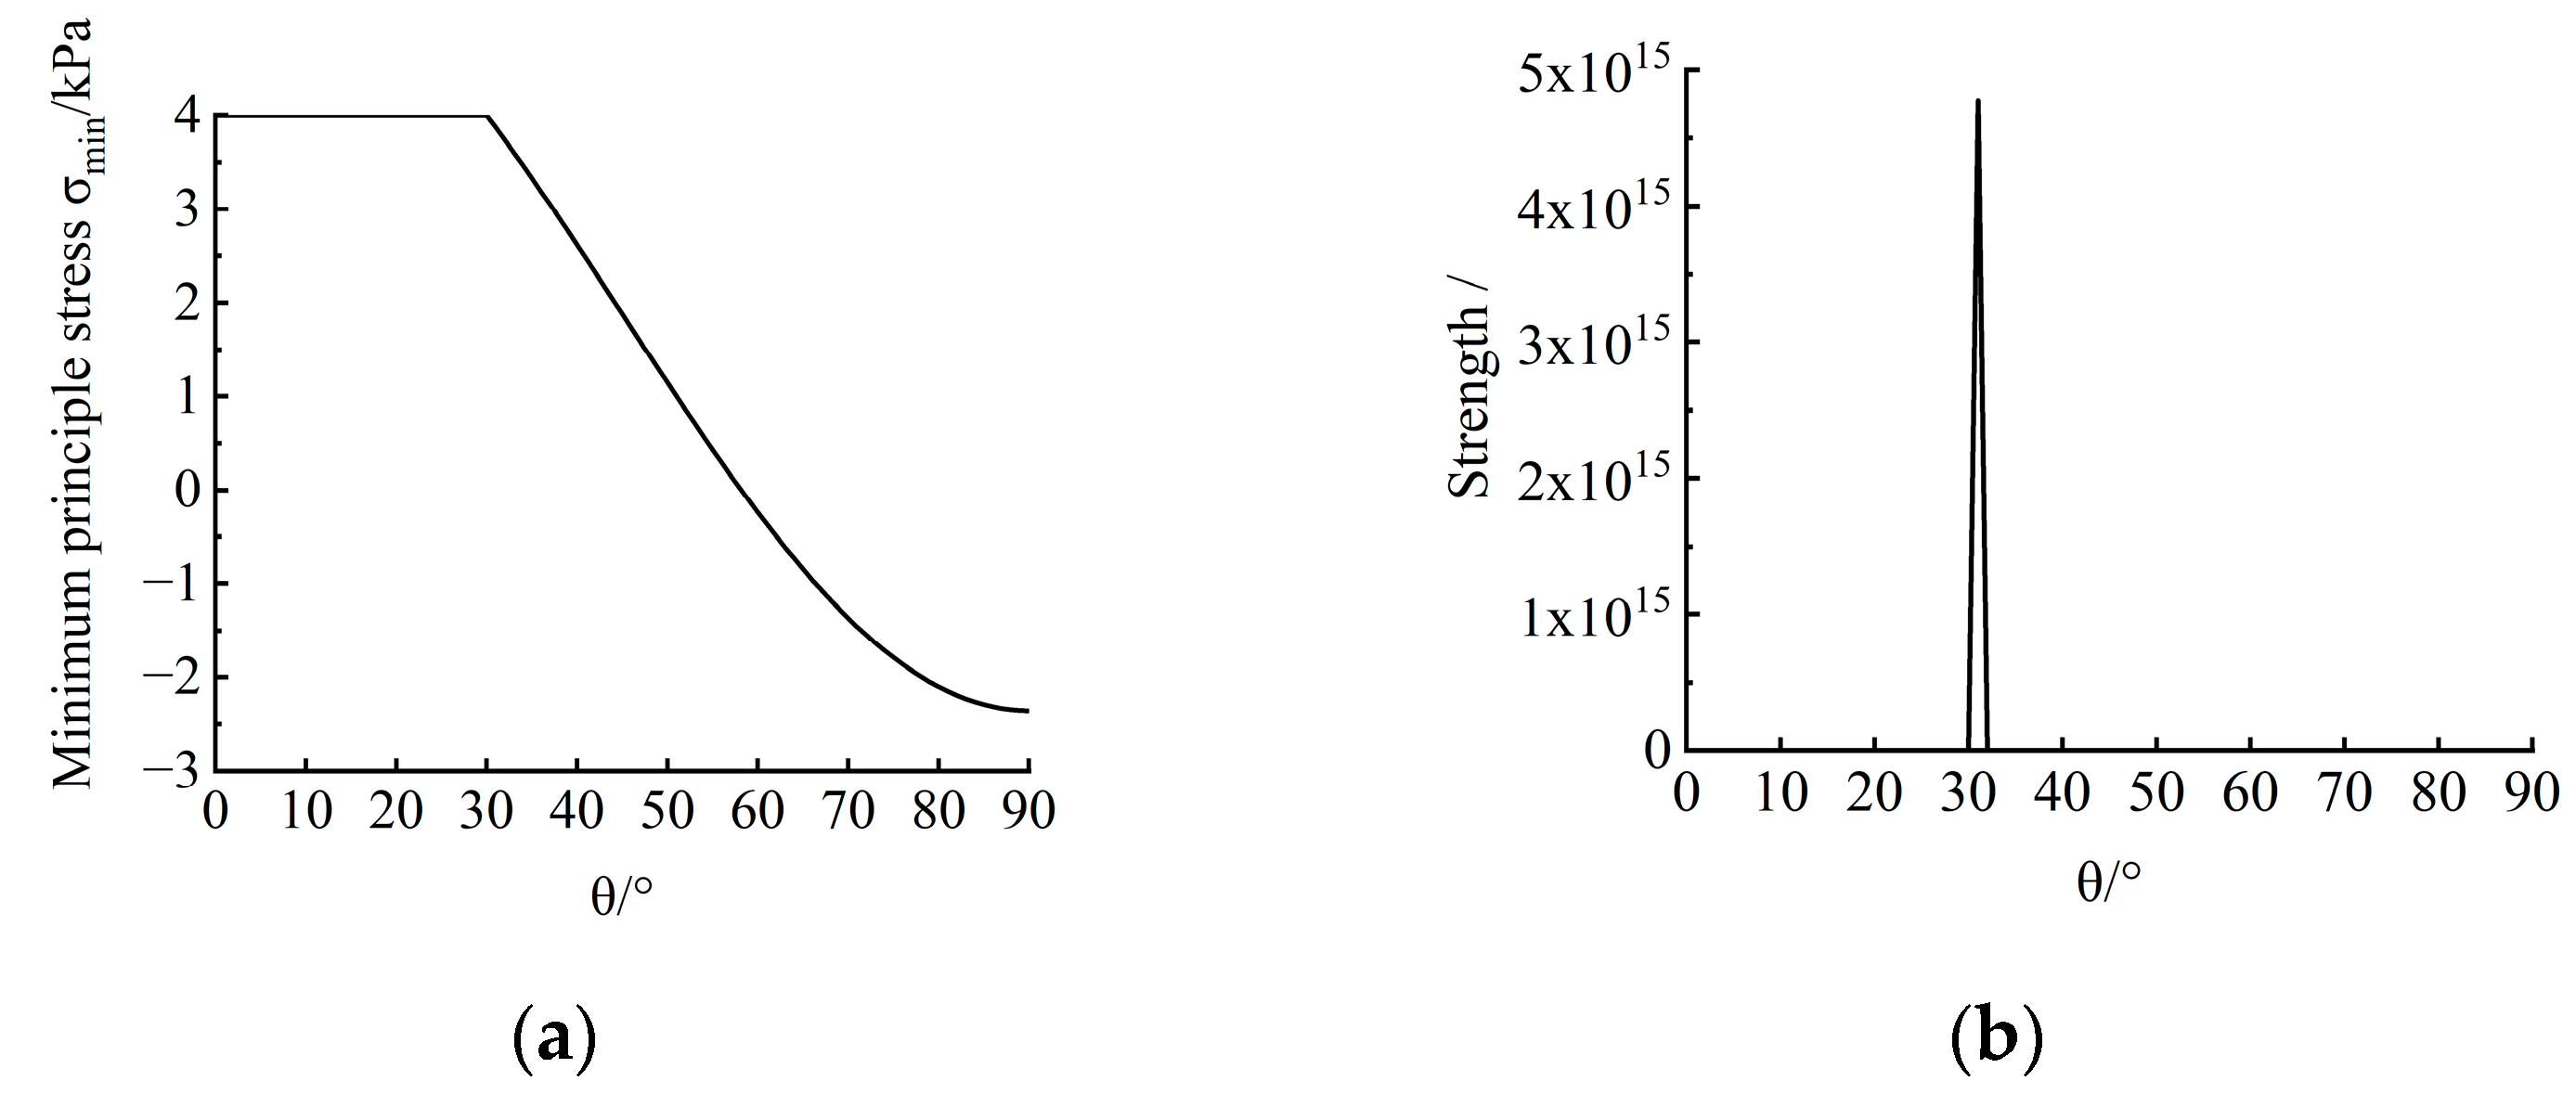
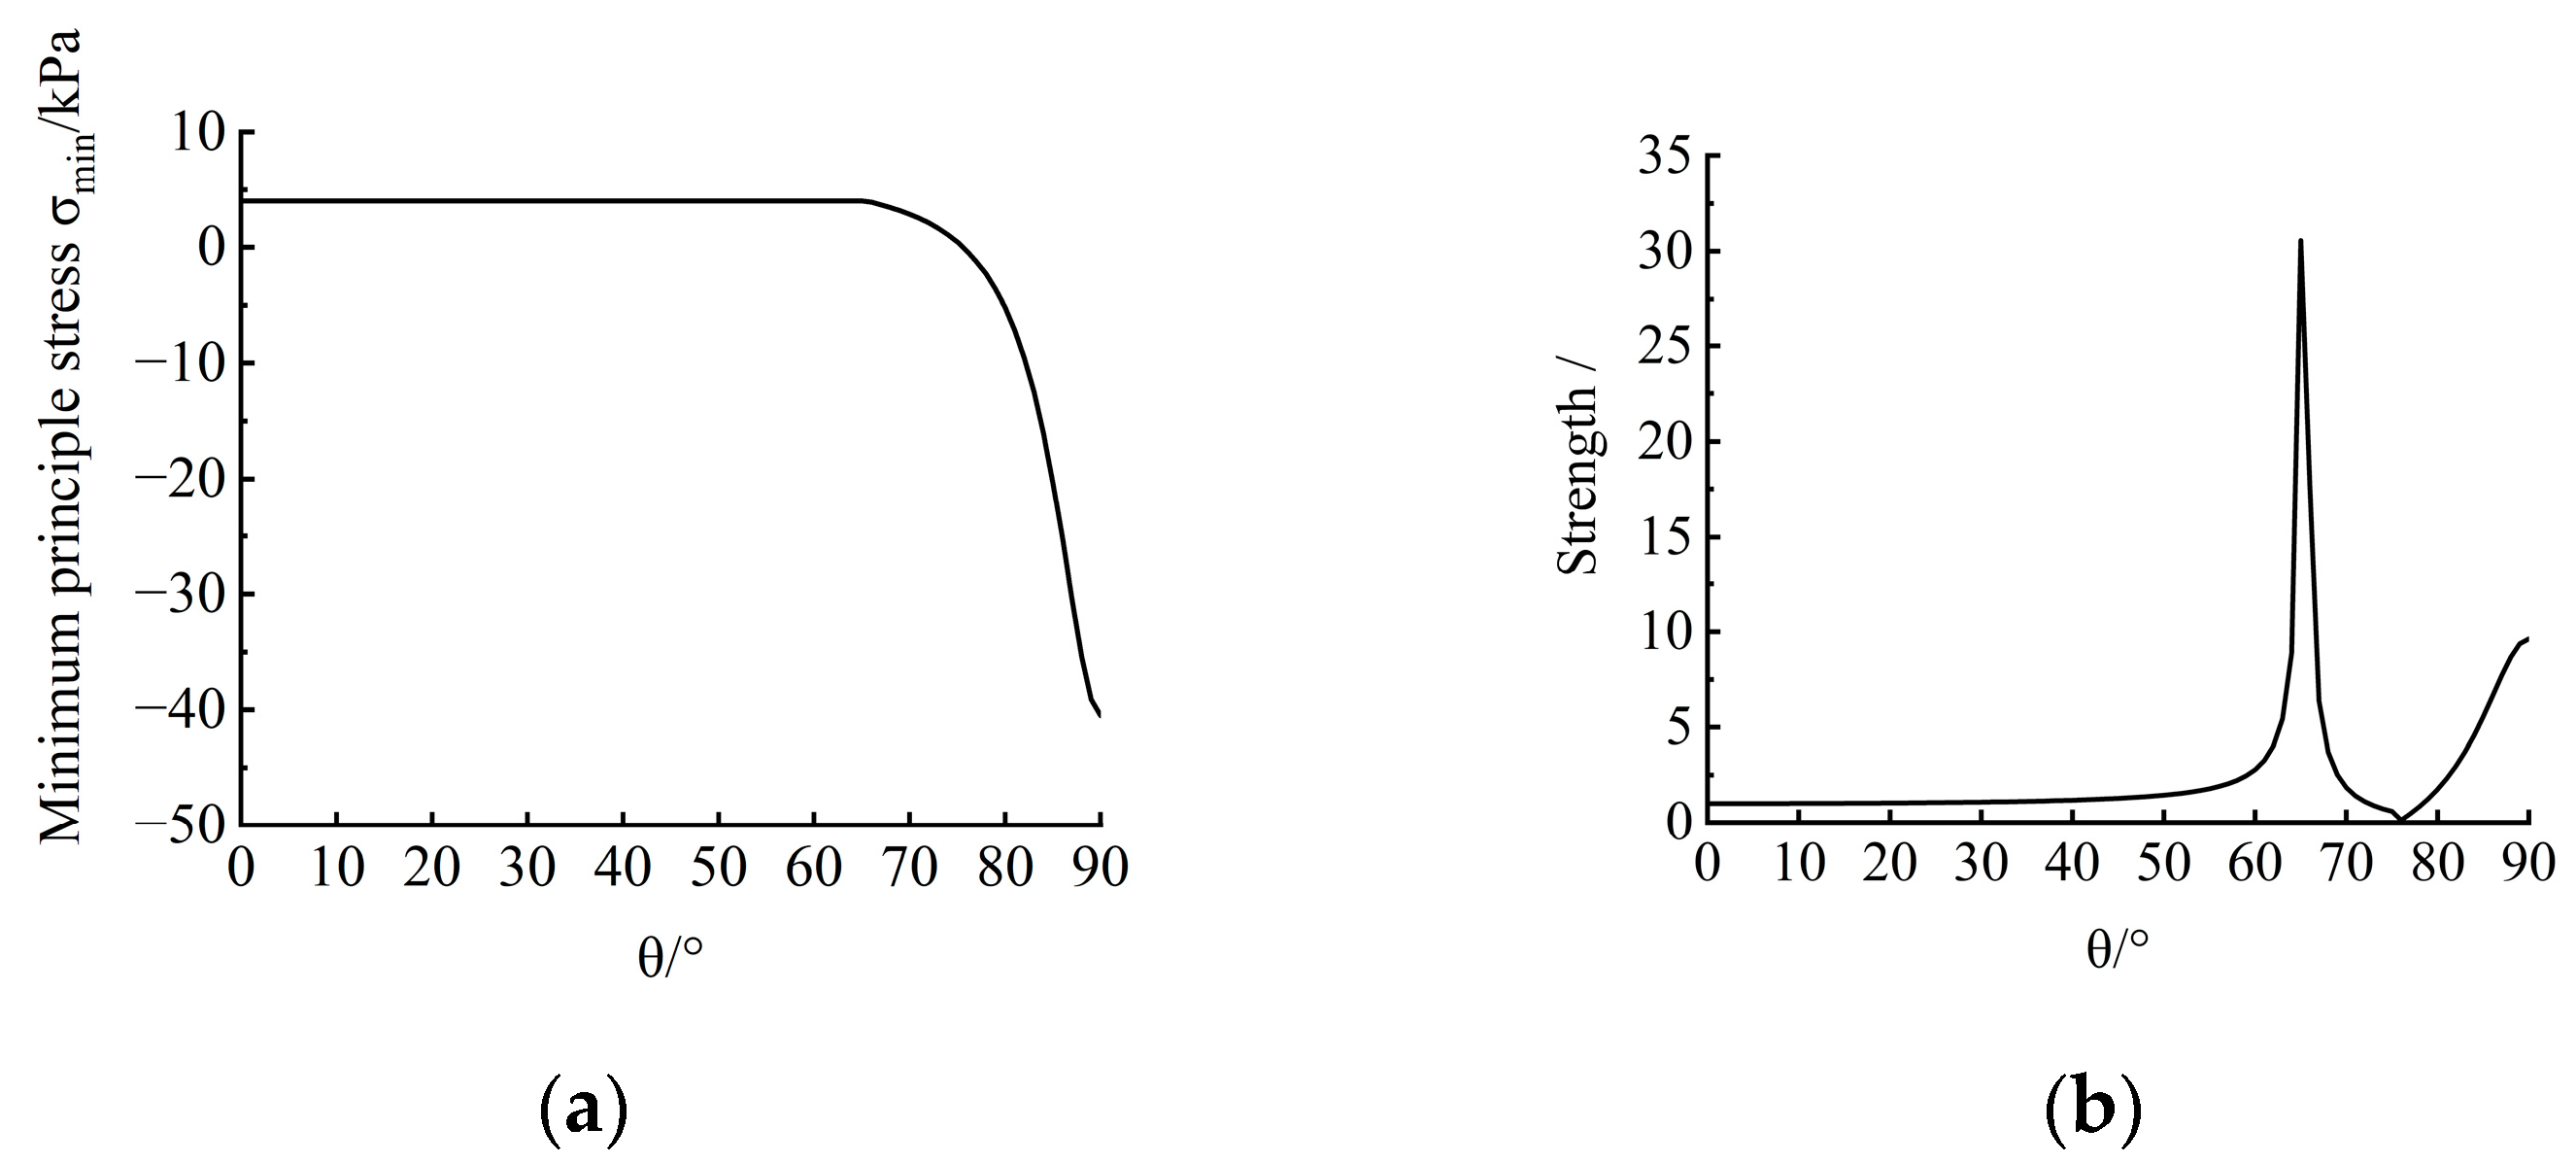
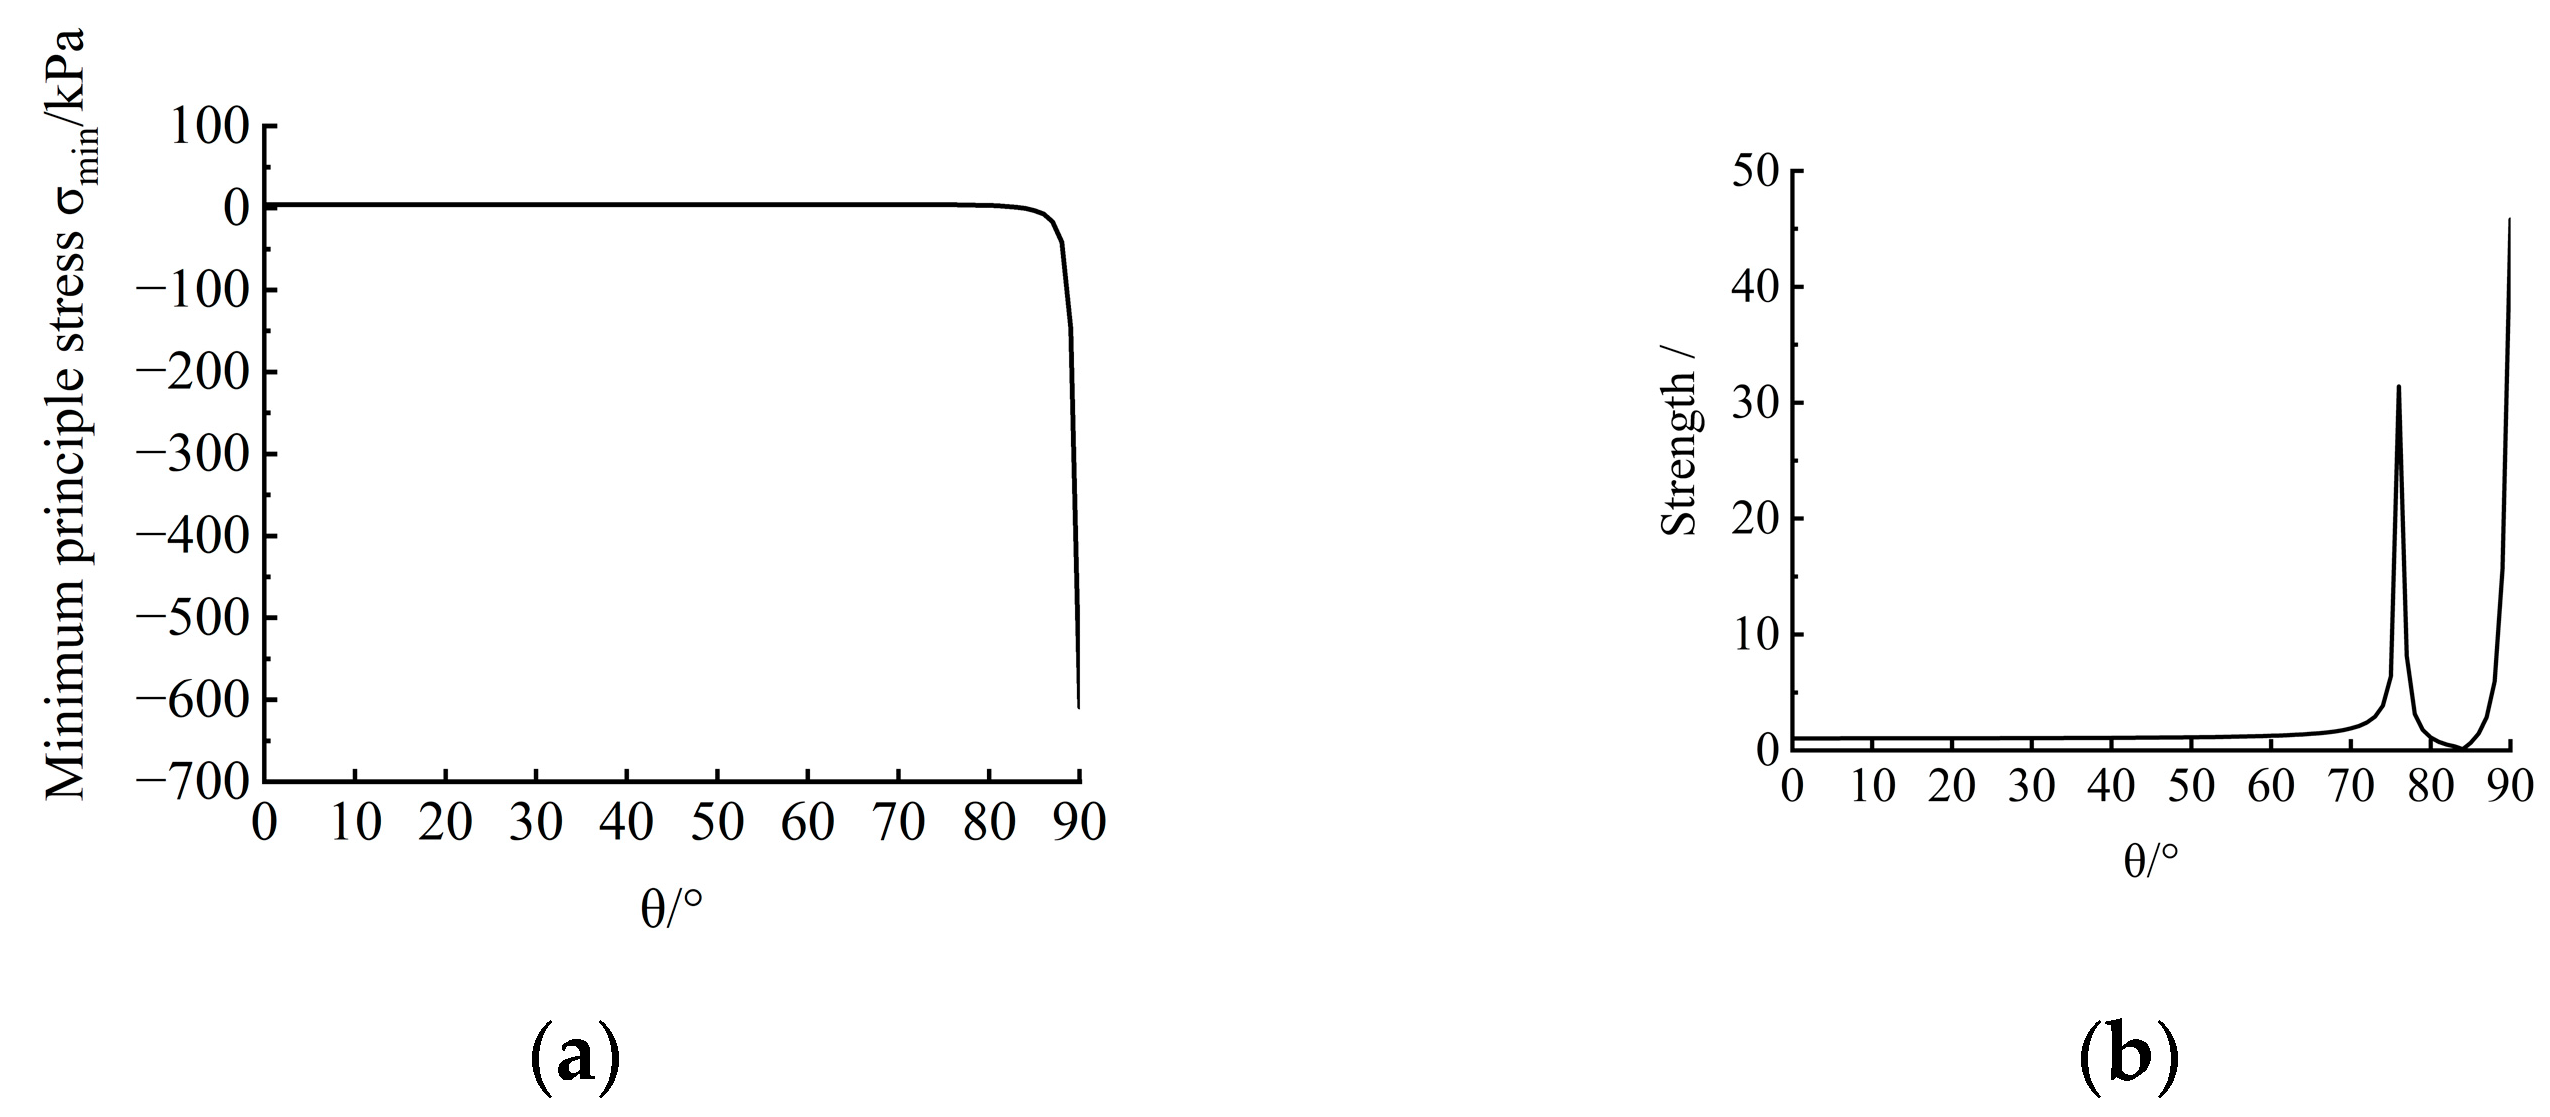
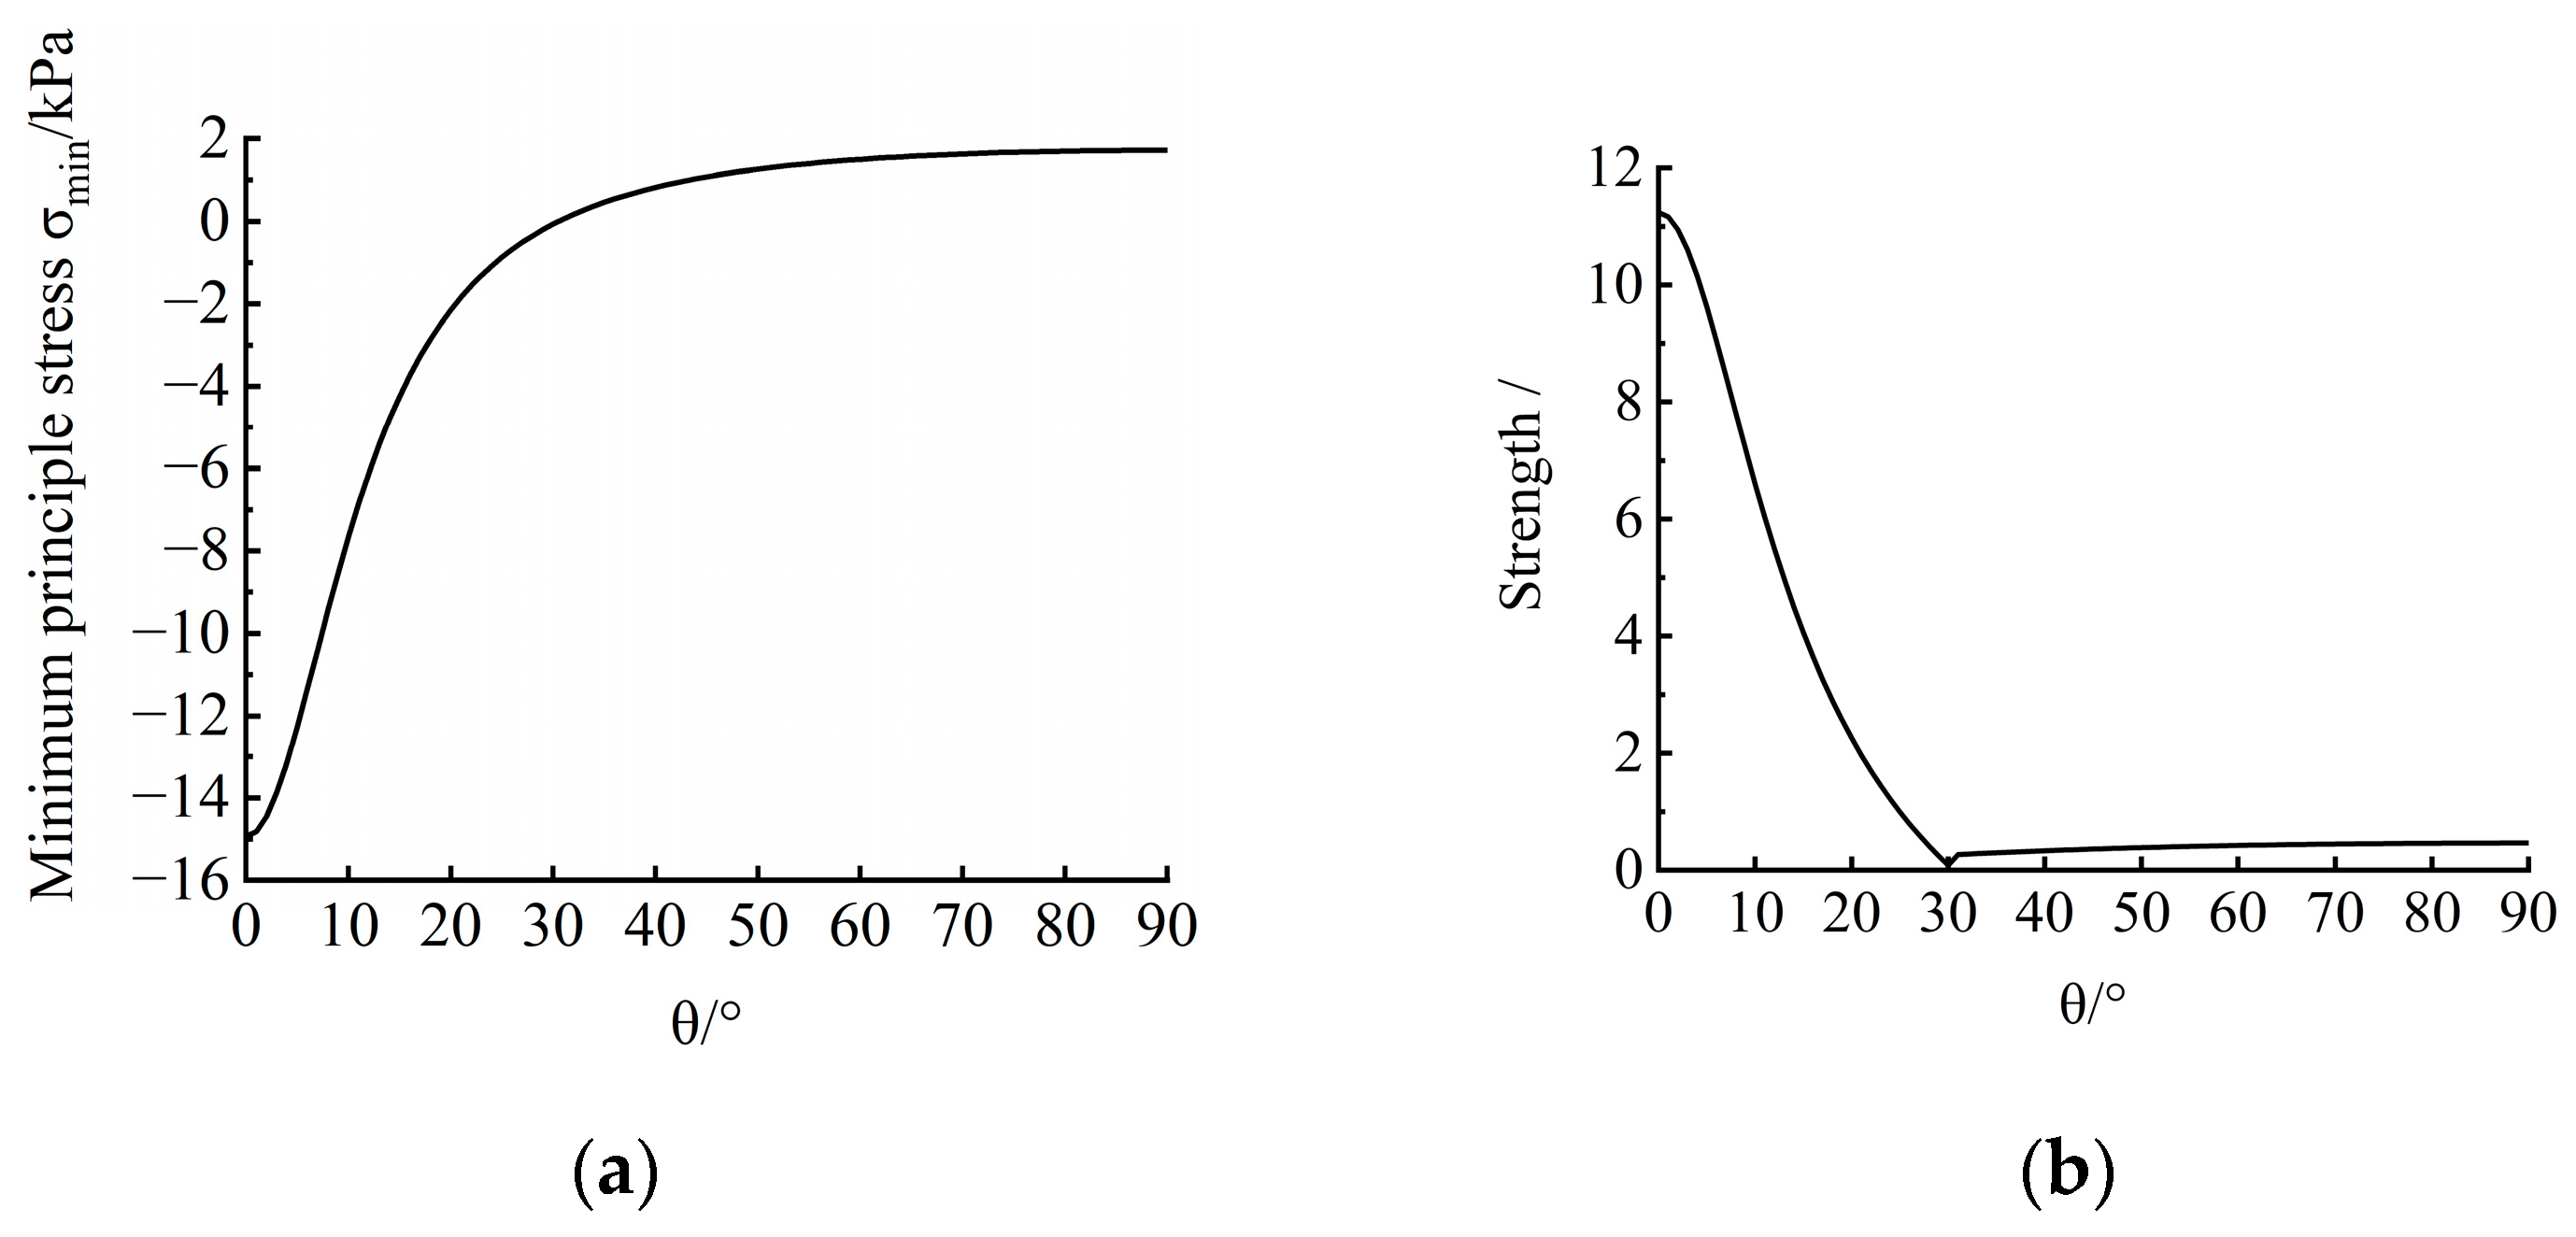
According to the damage discrimination criteria of gas invasion detailed in Equation (1), the failure modes of invasion in different phases in Figure 7 can be analyzed. Figure 9a, Figure 10a, Figure 11a and Figure 12a show the distribution curves of σmin at the boundary of the elliptic cavity during different phases of the gas fracturing invasion, as obtained from Equation (6). If σmin is positive, it represents compression, while a negative σmin represents tension. The horizontal coordinate θ represents the angle between any point on the boundary of the elliptical cavity and the vertical direction, θ = 0° corresponds to the position of the roof, while θ = 90° corresponds to the equatorial position. Figure 9b, Figure 10b, Figure 11b and Figure 12b show the strength distribution curve at the boundary of the elliptic cavity from Equation (1). When the value exceeds 1, it means that sediments suffer failure. Combined with the positive or negative values of σmin, the failure mode can be determined as shear failure or tensile failure.
(1)
Phase I
As shown in Figure 7a, gas accumulated into a circular bubble with a radius of 0.1 cm at the injection hole position; therefore, a = c = 0.1 cm was substituted to obtain the result.
According to Figure 9a, it can be found that σmin indicates both compressive stress and tensile stress on the boundary of entire elliptic cavity. In the vertical direction near the roof (θ < 58°), σmin is positive and manifests as compressive stress, and in the position of roof (θ < 30°), the compressive stress reaches the maximum value. In the horizontal direction near the equator (θ > 58°), σmin is negative, which manifests as tensile stress; at the equator, the tensile stress reaches the maximum. This means that the sediments are compressed near the roof and tensioned near the equator.
According to Figure 9b, the strength distribution value exceeds 1 only at θ = 30°. Combined with the positive or negative values of σmin in Figure 9a, it indicates that the shear failure occurs at θ = 30°, while the other positions do not suffer failure, which corresponds to the behavior of gas fracturing invasion in phase I (β ≈ 30°) shown in Figure 7a.
(2)
Phase II
As shown in Figure 7b, the length of the crack reached about 1 cm, and the width of the crack remained about 0.1 cm. Considering the direction of the long axis of the elliptic cavity, a = 0.1 cm, c = 1 cm were substituted to obtain the result.
According to Figure 10a, similarly to phase I, σmin indicates both compressive stress and tensile stress on the boundary of the elliptical cavity. In the vertical direction near the roof (θ < 76°), σmin is positive and manifests as compressive stress; meanwhile, in the roof position (θ < 65°), the compressive stress reaches the maximum value. In the horizontal direction near the equator (θ > 76°), σmin is negative and manifests as tensile stress, and the tensile stress reaches the maximum at the equator. This means that the sediment mass is compressed near the roof and tensioned near the equator.
Compared with phase I, the range of minimum principal compressive stress in phase II is wider, but the value is basically unchanged; meanwhile, the range of minimum principal tensile stress is narrower, and the value is obviously increased, which indicates that tensile failure may occur.
According to Figure 10b, it can be deduced that the areas with a strength distribution value exceeding 1 are mainly located near θ = 65° and θ = 90°, and the former is larger. Combined with the positive or negative values of σmin in Figure 10a, it indicates that shear failure occurs near θ = 65°, which corresponds to the behavior of gas fracturing invasion in phase II (β ≈ 60°) shown in Figure 7b.
(3)
Phase III
As shown in Figure 7c, the length of the crack reached about 5 cm, and the width of the crack reached about 0.2 cm. Considering the direction of the long axis of the elliptic cavity, a = 0.2 cm, c = 5 cm were substituted to obtain the result.
According to Figure 11a, similarly to phase II, σmin indicates both compressive stress and tensile stress on the boundary of the elliptic cavity. In the vertical direction near the roof (θ < 83°), σmin is positive and manifests as compressive stress; meanwhile, in the position of roof (θ < 77°), the compressive stress reaches the maximum value. In the horizontal direction near the equator (θ > 83°), σmin is negative and manifests as tensile stress; at the equator, the tensile stress reaches the maximum. This means that the sediment mass is compressed near the roof and tensioned near the equator.
Compared with phase II, the range of minimum principal compressive stress is wider in phase III, but the value is basically unchanged; meanwhile, the range of minimum principal tensile stress is narrower, and the corresponding value is further increased, which indicates that tensile failure may occur.
According to Figure 11b, the areas with strength distribution values exceeding 1 are mainly concentrated near θ = 76° and θ = 90°, while the latter is larger. Combined with the positive or negative values of σmin in Figure 11a, the result indicates that tensile failure occurs near θ = 90°, which corresponds to the behavior of gas fracturing invasion in phase III (β ≈ 90°), as shown in Figure 7c.
(4)
Phase IV
As shown in Figure 7d, the length of the crack reached about 11.5 cm, and the width of the crack reached about 2.5 cm. Considering the direction of the long axis of the elliptic cavity, a = 11.5 cm, c = 2.5 cm were substituted to obtain the result.
According to Figure 12a, it can be deduced that σmin indicates both compressive stress and tensile stress on the boundary of the entire elliptic cavity. In the vertical direction near the roof (θ < 30°), σmin is negative and manifests as tensile stress, and in the roof position (θ = 0°), tensile stress reaches the maximum. Meanwhile, in the horizontal direction near the equator (θ > 30°), σmin is positive and manifests as compressive stress, and in the equator position (θ = 90°), the tensile stress reaches the maximum. It means that the sediment mass is tensioned near the roof and compressed near the equator, which is the opposite of phase III.
According to Figure 12b, the areas with strength distribution values exceeding 1 are mainly concentrated around the roof of 0° < θ < 20°. Combined with the positive or negative values of σmin in Figure 12a, this finding indicates that tensile failure occurs around the roof of 0° < θ < 20°, which corresponds to the behavior of gas fracturing invasion in phase IV (β ≈ 10°) in Figure 7d.

4. Conclusions

In this work, the gas injection test was performed on fine-grained sediments using a self-developed experimental apparatus to observe the behavior of gas invasion and study the mechanical mechanisms of sediments subjected to shallow gas invasion. The following conclusions can be drawn:
(1)
Gas mainly invaded into the fine-grained sediments in the form of fracturing invasion, and the behavior of gas fracturing invasion can be divided into four phases, in which the fracture direction β continuously transitions from vertical to horizontal. In phase I, the length of the crack far exceeds the width, with the fracturing direction close to the vertical direction; in phase II, both the length and width of the crack increase synchronically, and the fracturing direction develops horizontally; in phase III, the length and width of the crack further increase, with the fracturing direction close to the horizontal direction; in phase IV, the crack develops to a certain extent along the horizontal direction, and gas further fractures along the top of crack.
(2)
The behavior of gas fracturing invasion in fine-grained sediments is controlled by both tensile and shear failure. Based on the 2D undrained elliptic cavity model and the tensile strength of sediments, an identification criterion for gas fracturing invasion was proposed; by combining the area with a strength distribution value exceeding 1 and positive or negative values of σmin, the failure mode can be determined as shear failure or tensile failure.
(3)
Based on the identification criteria, the micro-mechanical mechanisms of fine-grained sediments subjected to gas invasion across four phases were revealed. In phase I, the shear failure occurred at θ ≈ 30°; in phase II, the shear failure occurred near θ ≈ 65°; in phase III, the tensile failure occurred near θ ≈ 90°; in phase IV, the tensile failure occurred around the roof of 0° < θ < 20°. This means that gas invasion gradually changes from shear failure to tensile failure. In addition, the fracturing angle θ predicted by the criteria was consistent with the fracturing direction β, which verifies the feasibility of the identification criteria.

Author Contributions

Conceptualization, Y.W. (Yehuan Wang) and Y.W. (Yong Wang); funding acquisition, Y.W. (Yong Wang); investigation, Y.W. (Yehuan Wang), Y.W. (Yanli Wang), C.C. and M.X.; methodology, Y.W. (Yehuan Wang); resources, Y.W. (Yong Wang), Y.W. (Yanli Wang), C.C. and L.K.; validation, Y.W. (Yanli Wang), C.C. and M.X.; writing—original draft, Y.W. (Yehuan Wang); writing—review and editing, Y.W. (Yong Wang), Y.W. (Yanli Wang) and L.K. All authors have read and agreed to the published version of the manuscript.

Funding

This research was funded by the National Natural Science Foundation of China, grant numbers 52127815 and 51979269; Wuhan Research Program of Application Foundation and Frontier Project, grant number 2020010601012181.

Institutional Review Board Statement

Not applicable.

Informed Consent Statement

Not applicable.

Data Availability Statement

Date associated with this research are available and can be obtained by contacting the corresponding author.

Conflicts of Interest

The authors declare that they have no conflict of interest.

References

  1. Ma, G.; Zhan, L.; Lu, H.; Hou, G. Structures in shallow marine sediments associated with gas and fluid migration. J. Mar. Sci. Eng. 2021, 9, 396. [Google Scholar] [CrossRef]
  2. Kopp, H.; Chiocci, F.L.; Berndt, C.; Çağatay, M.N.; Ferreira, T.; Fortes, C.J.E.M.; González Vega, A.; Kopf, A.; Sørensen, M.B.; Sultan, N.; et al. Marine Geohazards: Safeguarding Society and the Blue Economy from a Hidden Threat; Position Paper 26 of the European Marine Board; European Marine Board IVZW: Ostend, Belgium, 2021. [Google Scholar]
  3. Hovland, M.; Gardner, J.V.; Judd, A.G. The significance of pockmarks to understanding fluid flow processes and geohazards. Geofluids 2002, 2, 127–136. [Google Scholar] [CrossRef] [Green Version]
  4. Aiello, G.; Caccavale, M. New Seismoacoustic Data on Shallow Gas in Holocene Marine Shelf Sediments, Offshore from the Cilento Promontory (Southern Tyrrhenian Sea, Italy). J. Mar. Sci. Eng. 2022, 10, 1992. [Google Scholar] [CrossRef]
  5. Hovland, M. The Geomorphology and nature of seabed seepage processes. In Bathymetry and Its Applications; Blondel, P., Ed.; IntechOpen: Rjeka, Croatia, 2012; Chapter 4; pp. 79–104. [Google Scholar]
  6. Goswami, B.K.; Weitemeyer, K.A.; Bünz, S.; Minshull, T.A.; Westbrook, G.K.; Ker, S.; Sinha, M.C. Variations in pockmark composition at the Vestnesa Ridge: Insights from marine controlled source electromagnetic and seismic data. Geochem. Geophys. Geosystems 2017, 18, 1111–1125. [Google Scholar] [CrossRef]
  7. Turrini, L.; Jackson, C.A.L.; Thompson, P. Seal rock deformation by polygonal faulting, offshore Uruguay. Mar. Pet. Geol. 2017, 86, 892–907. [Google Scholar] [CrossRef]
  8. de Mahiques, M.M.; Schattner, U.; Lazar, M.; Sumida, P.Y.G.; de Souza, L.A.P. An extensive pockmark field on the upper Atlantic margin of Southeast Brazil: Spatial analysis and its relationship with salt diapirism. Heliyon 2017, 3, e00257. [Google Scholar] [CrossRef] [Green Version]
  9. Wang, Y.; Kong, L.; Wang, Y.; Wang, M.; Cai, K. Deformation analysis of shallow gas-bearing ground from controlled gas release in Hangzhou Bay of China. Int. J. Geomech. 2018, 18, 04017122. [Google Scholar] [CrossRef]
  10. Wang, Y.; Kong, L.; Wang, M.; Wang, Y.; Cheng, P. An improved specimen preparation method for marine shallow gas-bearing sand sediments and its validations. J. Rock Mech. Geotech. Eng. 2021, 13, 682–693. [Google Scholar] [CrossRef]
  11. Jain, A.K.; Juanes, R. Preferential mode of gas invasion in sediments: Grain-scale mechanistic model of coupled multiphase fluid flow and sediment mechanics. J. Geophys. Res. Solid Earth 2009, 114, B08101. [Google Scholar] [CrossRef]
  12. Fu, X.; Jimenez-Martinez, J.; Nguyen, T.P.; Carey, J.W.; Viswanathan, H.; Cueto-Felgueroso, L.; Juanes, R. Crustal fingering facilitates free-gas methane migration through the hydrate stability zone. Proc. Natl. Acad. Sci. USA 2020, 117, 31660–31664. [Google Scholar] [CrossRef]
  13. Zhang, Y.; Chen, Y.; Lv, H.; Hu, M.; Zhou, Y. Gas injection test of remolded saturated soil with consolidation. Mar. Georesources Geotechnol. 2021, 39, 1115–1124. [Google Scholar] [CrossRef]
  14. Shin, H.; Santamarina, J.C. Open-mode discontinuities in soils. Géotechnique Lett. 2011, 1, 95–99. [Google Scholar] [CrossRef]
  15. Sun, H.; Guo, X.J.; Wu, J.X. Progress in analysis and monitoring technology for gas migration in submarine sediments. Prog. Geophys. 2022, 37, 869–881. [Google Scholar]
  16. Ye, W.M.; Xu, L.; Ye, B.; Chen, B.; Chen, Y.G.; Cui, Y.J. Experimental investigation on gas migration in saturated Shanghai soft clay. Eng. Geol. 2017, 222, 20–28. [Google Scholar] [CrossRef]
  17. Choi, J.H.; Seol, Y.; Boswell, R.; Juanes, R. X-ray computed-tomography imaging of gas migration in water-saturated sediments: From capillary invasion to conduit opening. Geophys. Res. Lett. 2011, 38, L17310. [Google Scholar] [CrossRef]
  18. Wang, M.; Feng, Y.T.; Wang, Y.; Qu, T.M.; He, W. A hybrid discrete bubble-lattice Boltzmann–discrete element model for gas-charged sediments. Comput. Part. Mech. 2020, 7, 509–522. [Google Scholar] [CrossRef]
  19. Sun, Z.; Santamarina, J.C. Grain-displacive gas migration in fine-grained sediments. J. Geophys. Res. Solid Earth 2019, 124, 2274–2285. [Google Scholar] [CrossRef] [Green Version]
  20. Marchi, M.; Gottardi, G.; Soga, K. Fracturing pressure in clay. J. Geotech. Geoenvironmental Eng. 2014, 140, 04013008. [Google Scholar] [CrossRef]
  21. Bjerrum, L.; Nash, J.K.T.L.; Kennard, R.M.; Gibson, R.E. Hydraulic fracturing in field permeability testing. Géotechnique 1972, 22, 319–332. [Google Scholar] [CrossRef]
  22. Decker, R.A.; Clemence, S.P. Laboratory study of hydraulic fracturing in clay. In Proceedings of the 10th ICSMFE, Stockholm, Sweden, 15–19 June 1981; Volume 1, pp. 573–575. [Google Scholar]
  23. Jaworski, G.W.; Duncan, J.M.; Seed, H.B. Laboratory study of hydraulic fracturing. J. Geotech. Eng. Div. 1981, 107, 713–732. [Google Scholar] [CrossRef]
  24. Fukushima, S. Hydraulic fracturing criterion in the core of fill dams. Rep. Fujita Kogyo Tech. Inst. 1986, 22, 131–136. [Google Scholar]
  25. Lo, K.Y.; Kaniaru, K. Hydraulic fracture in earth and rock-fill dams. Can. Geotech. J. 1990, 27, 496–506. [Google Scholar] [CrossRef]
  26. Andersen, K.H.; Rawlings, C.G.; Lunne, T.A.; By, T.H. Estimation of hydraulic fracture pressure in clay. Can. Geotech. J. 1994, 31, 817–828. [Google Scholar] [CrossRef]
  27. Medeiros, C.H.A.C.; Moffat, A.I.B. A hydraulic fracturing test based on radial seepage in the Rowe consolidation cell. In Advances In Site Investigation Practice; Thomas Telford Publishing: London, UK, 1996; pp. 828–839. [Google Scholar]
  28. Mori, A.; Tamura, M. Hydrofracturing pressure of cohesive soils. Soils Found. 1987, 27, 14–22. [Google Scholar] [CrossRef] [Green Version]
  29. Panah, A.K.; Yanagisawa, E. Laboratory studies on hydraulic fracturing criteria in soil. Soils Found. 1989, 29, 14–22. [Google Scholar] [CrossRef] [Green Version]
  30. Yanagisawa, E.; Panah, A.K. Two dimensional study of hydraulic fracturing criteria in cohesive soils. Soils Found. 1994, 34, 1–9. [Google Scholar] [CrossRef] [Green Version]
  31. Atkinson, J.H.; Charles, J.A.; Mhach, H.K. Undrained hydraulic fracture in cavity expansion tests. In Proceedings of the 13th International Conference on Soil Mechanics and Foundation Engineering, New Delhi, India, 5–10 January 1994; pp. 1009–1012. [Google Scholar]
  32. Zervos, A.; Papanastasiou, P.; Vardoulakis, I. Shear localisation in thick-walled cylinders under internal pressure based on gradient elastoplasticity. J. Theor. Appl. Mech. 2008, 38, 81–100. [Google Scholar]
  33. Mitchell, J.K.; Soga, K. Fundamentals of Soil Behavior; John Wiley & Sons Publisher: New York, NY, USA, 2005; Volume 3. [Google Scholar]
  34. Soga, K.; Ng, M.; Gafar, K. Soil fractures in grouting. In Proceedings of the 11th International Conference on Computer Methods and Advances in Geomechanics, Torino, Italy, 19–24 June 2005; pp. 397–406. [Google Scholar]
  35. Vesic, A.S. Expansion of cavities in infinite soil mass. J. Soil Mech. Found. Div. 1972, 98, 265–290. [Google Scholar] [CrossRef]
  36. Daigle, H.; Cook, A.; Fang, Y.; Bihani, A.; Song, W.; Flemings, P.B. Gas-driven tensile fracturing in shallow marine sediments. J. Geophys. Res. Solid Earth 2020, 125, e2020JB020835. [Google Scholar]
  37. Hoek, E.; Brown, E.T. Practical estimates of rock mass strength. Int. J. Rock Mech. Min. Sci. 1997, 34, 1165–1186. [Google Scholar] [CrossRef]
  38. Rocco, S.; Woods, A.W.; Harrington, J.; Norris, S. An experimental model of episodic gas release through fracture of fluid confined within a pressurized elastic reservoir. Geophys. Res. Lett. 2017, 44, 751–759. [Google Scholar] [CrossRef] [Green Version]
  39. Stevens, J. Unified soil classification system. Civ. Eng.—ASCE 1982, 52, 61–62. [Google Scholar]
  40. Yang, J.J.; Liu, F.; Toyosawa, Y.; Horiyi, N.; Itoh, K. Particle size effects on bearing capacity of sandy ground in centrifugal tests. Chin. J. Geotech. Eng. 2007, 29, 477–483. [Google Scholar]
  41. Craig, W.H. Simulation of foundations for offshore structures using centrifuge modelling. In Developments in Soil Mechanics and Foundation Engineering: Model Studies; Applied Science Publisher: London, UK, 1983. [Google Scholar]
  42. Xu, G.M.; Zhang, W.M. Study on the grain-size effects and boundary effects in centrifugal test. Chin. J. Geotech. Eng. 1996, 18, 80–85. [Google Scholar]
  43. Kusakabe, O. Application of centrifuge modeling to foundation engineering. Foun Constr. 1993, 11, 1–10. [Google Scholar]
  44. Hong, Y.; Zhang, J.F.; Wang, L.Z.; Liu, T. On evolving size and shape of gas bubble in marine clay under multi-stage loadings: Microcomputed tomography (μCT) characterization and cavity contraction analysis. Can. Geotech. J. 2020, 57, 1072–1091. [Google Scholar] [CrossRef]
  45. Muskhelishvili, N.I. Some Basic Problems of the Mathematical Theory of Elasticity; Noordhoff Publisher: Groningen, The Netherlands, 1953; Volume 15. [Google Scholar]
  46. Johnson, B.D.; Boudreau, B.P.; Gardiner, B.S.; Maass, R. Mechanical response of sediments to bubble growth. Mar. Geol. 2002, 187, 347–363. [Google Scholar] [CrossRef]
  47. Zhang, Y.; Chen, Y.; Hou, Y.; Jin, Z.; Zhou, Y. Fracture toughness measurements of soft sediments based on gas injection tests. Mar. Georesources Geotechnol. 2022, 40, 847–855. [Google Scholar] [CrossRef]
  48. Barry, M.A.; Johnson, B.D.; Boudreau, B.P.; Law, B.A.; Page, V.S.; Hill, P.S.; Wheatcroft, R.A. Sedimentary and geo-mechanical properties of Willapa Bay tidal flats. Cont. Shelf Res. 2013, 60, S198–S207. [Google Scholar] [CrossRef]
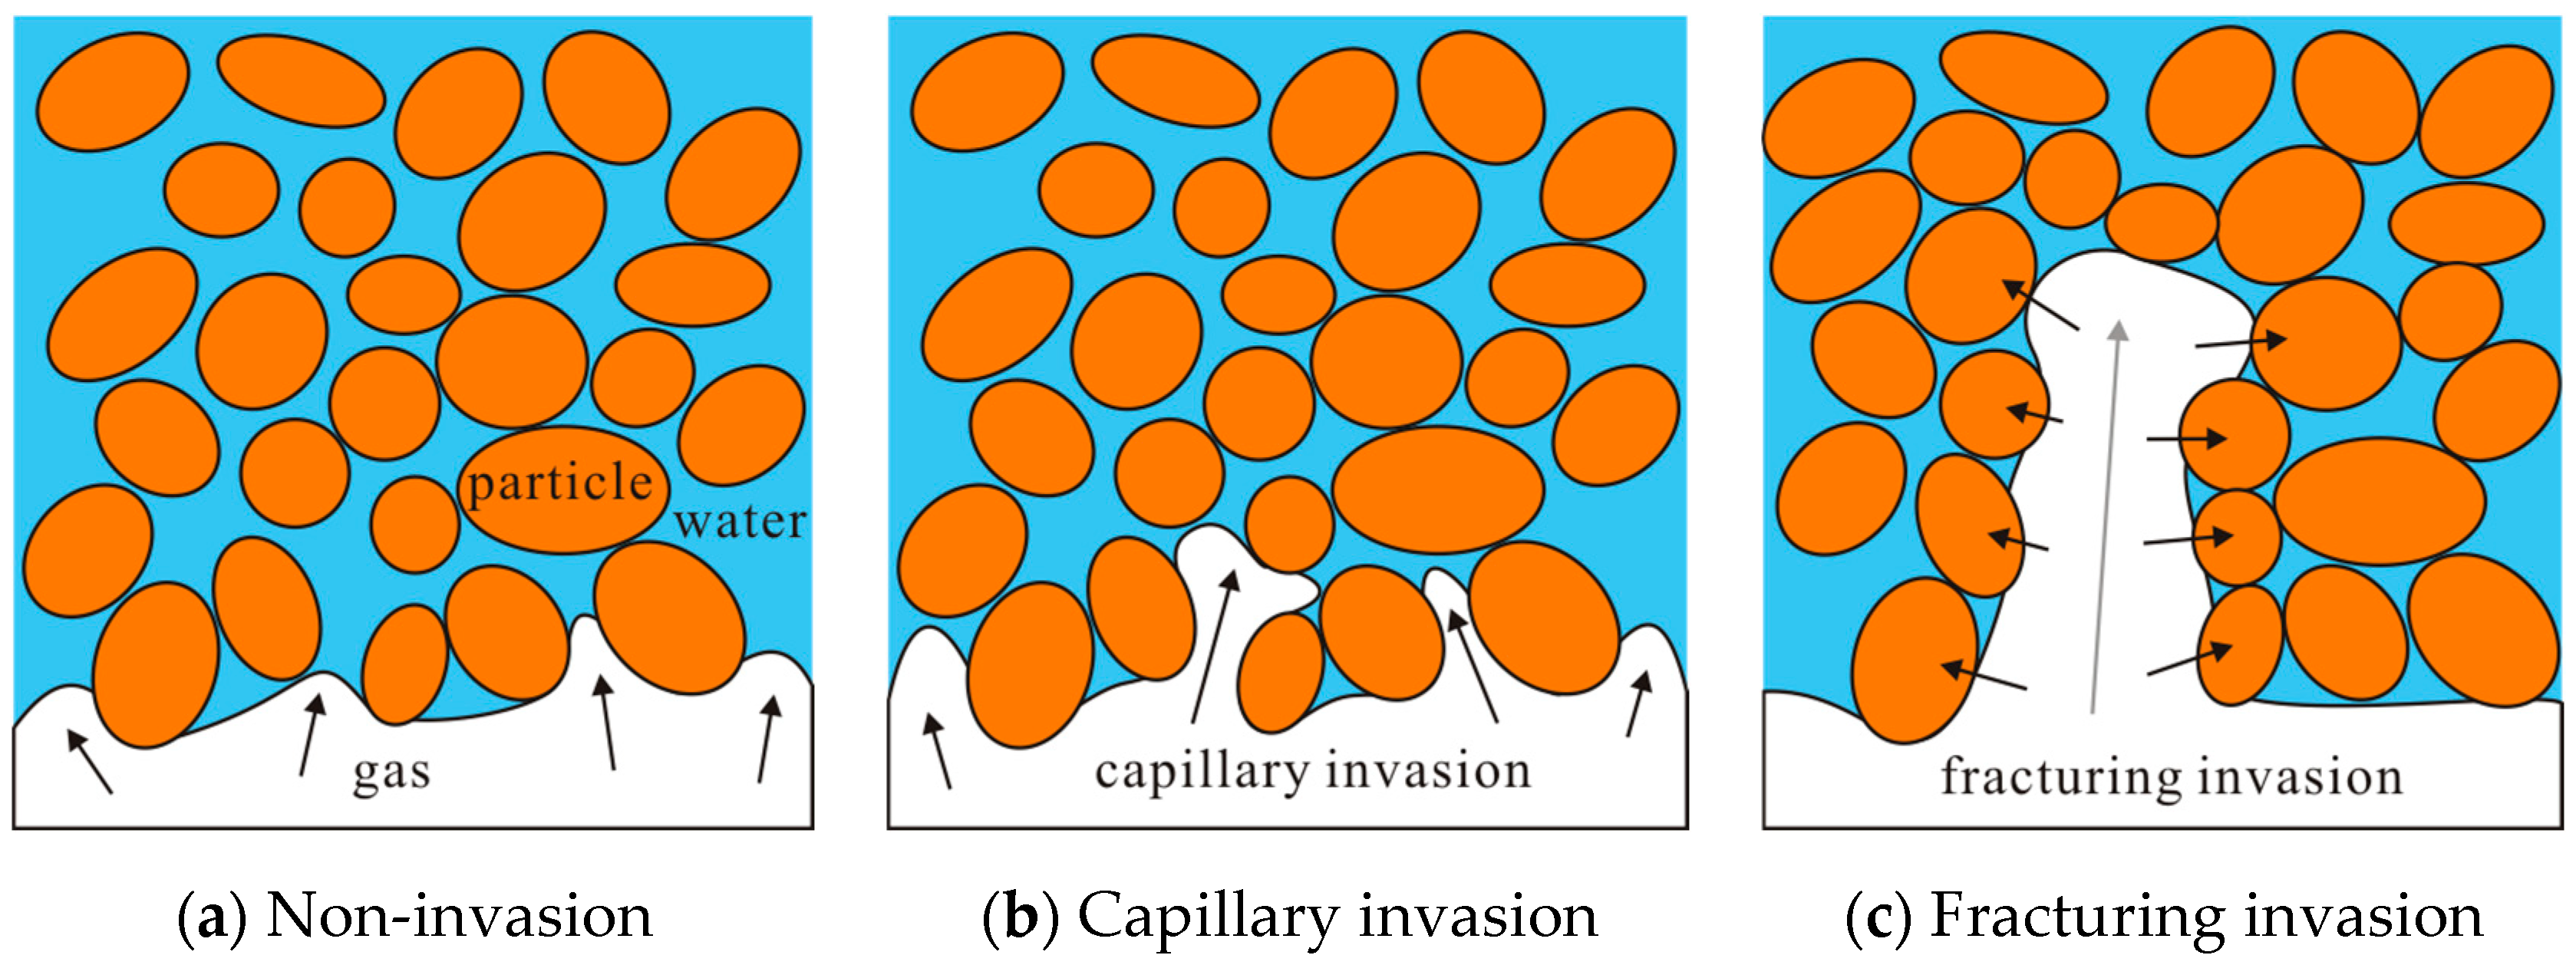
Figure 1. Schematic diagram of two modes of gas invasion in sediments.
Jmse 11 00822 g001
Figure 2. CT scanning results of gas invasion in sediments.
Jmse 11 00822 g002
Figure 3. Particle size distribution of silica powder.
Jmse 11 00822 g003
Figure 4. Schematic diagram of the test procedure for shallow gas invasion in fine-grained marine sediments.
Jmse 11 00822 g004
Figure 5. Schematic diagram of vacuum extraction.
Jmse 11 00822 g005
Figure 6. Schematic diagram of saturation and consolidation.
Jmse 11 00822 g006
Figure 7. Behaviors of gas invasion in the fine-grained sediments.
Jmse 11 00822 g007aJmse 11 00822 g007b
Figure 8. Schematic diagram of 2D undrained elliptical bubble contraction(redrawn from [44]).
Jmse 11 00822 g008
Figure 9. Phase I (β ≈ 30°). (a) Distribution of minimum principal stress; (b) distribution of strength.
Jmse 11 00822 g009
Figure 10. Phase II (β ≈ 60°). (a) Distribution of minimum principal stress; (b) distribution of strength.
Jmse 11 00822 g010
Figure 11. Phase III (β ≈ 90°). (a) Distribution of minimum principal stress; (b) distribution of strength.
Jmse 11 00822 g011
Figure 12. Phase IV (β ≈ 10°). (a) Distribution of minimum principal stress; (b) distribution of strength.
Jmse 11 00822 g012
Table 1. The composition of silica powder.
SiO2/%TiO2/%Al2O3/%CaO/%Fe2O3/%
99.50.010.390.010.09
Table 2. Physical properties parameters of silica powder.
Liquid Limit (%)Plastic Limit (%)Plasticity Index
35.524.710.8
Disclaimer/Publisher’s Note: The statements, opinions and data contained in all publications are solely those of the individual author(s) and contributor(s) and not of MDPI and/or the editor(s). MDPI and/or the editor(s) disclaim responsibility for any injury to people or property resulting from any ideas, methods, instructions or products referred to in the content.