
Safety Assessment of Coastal Bridge Superstructures with Box Girders under Potential Landslide Tsunamis

Abstract
:1. Introduction
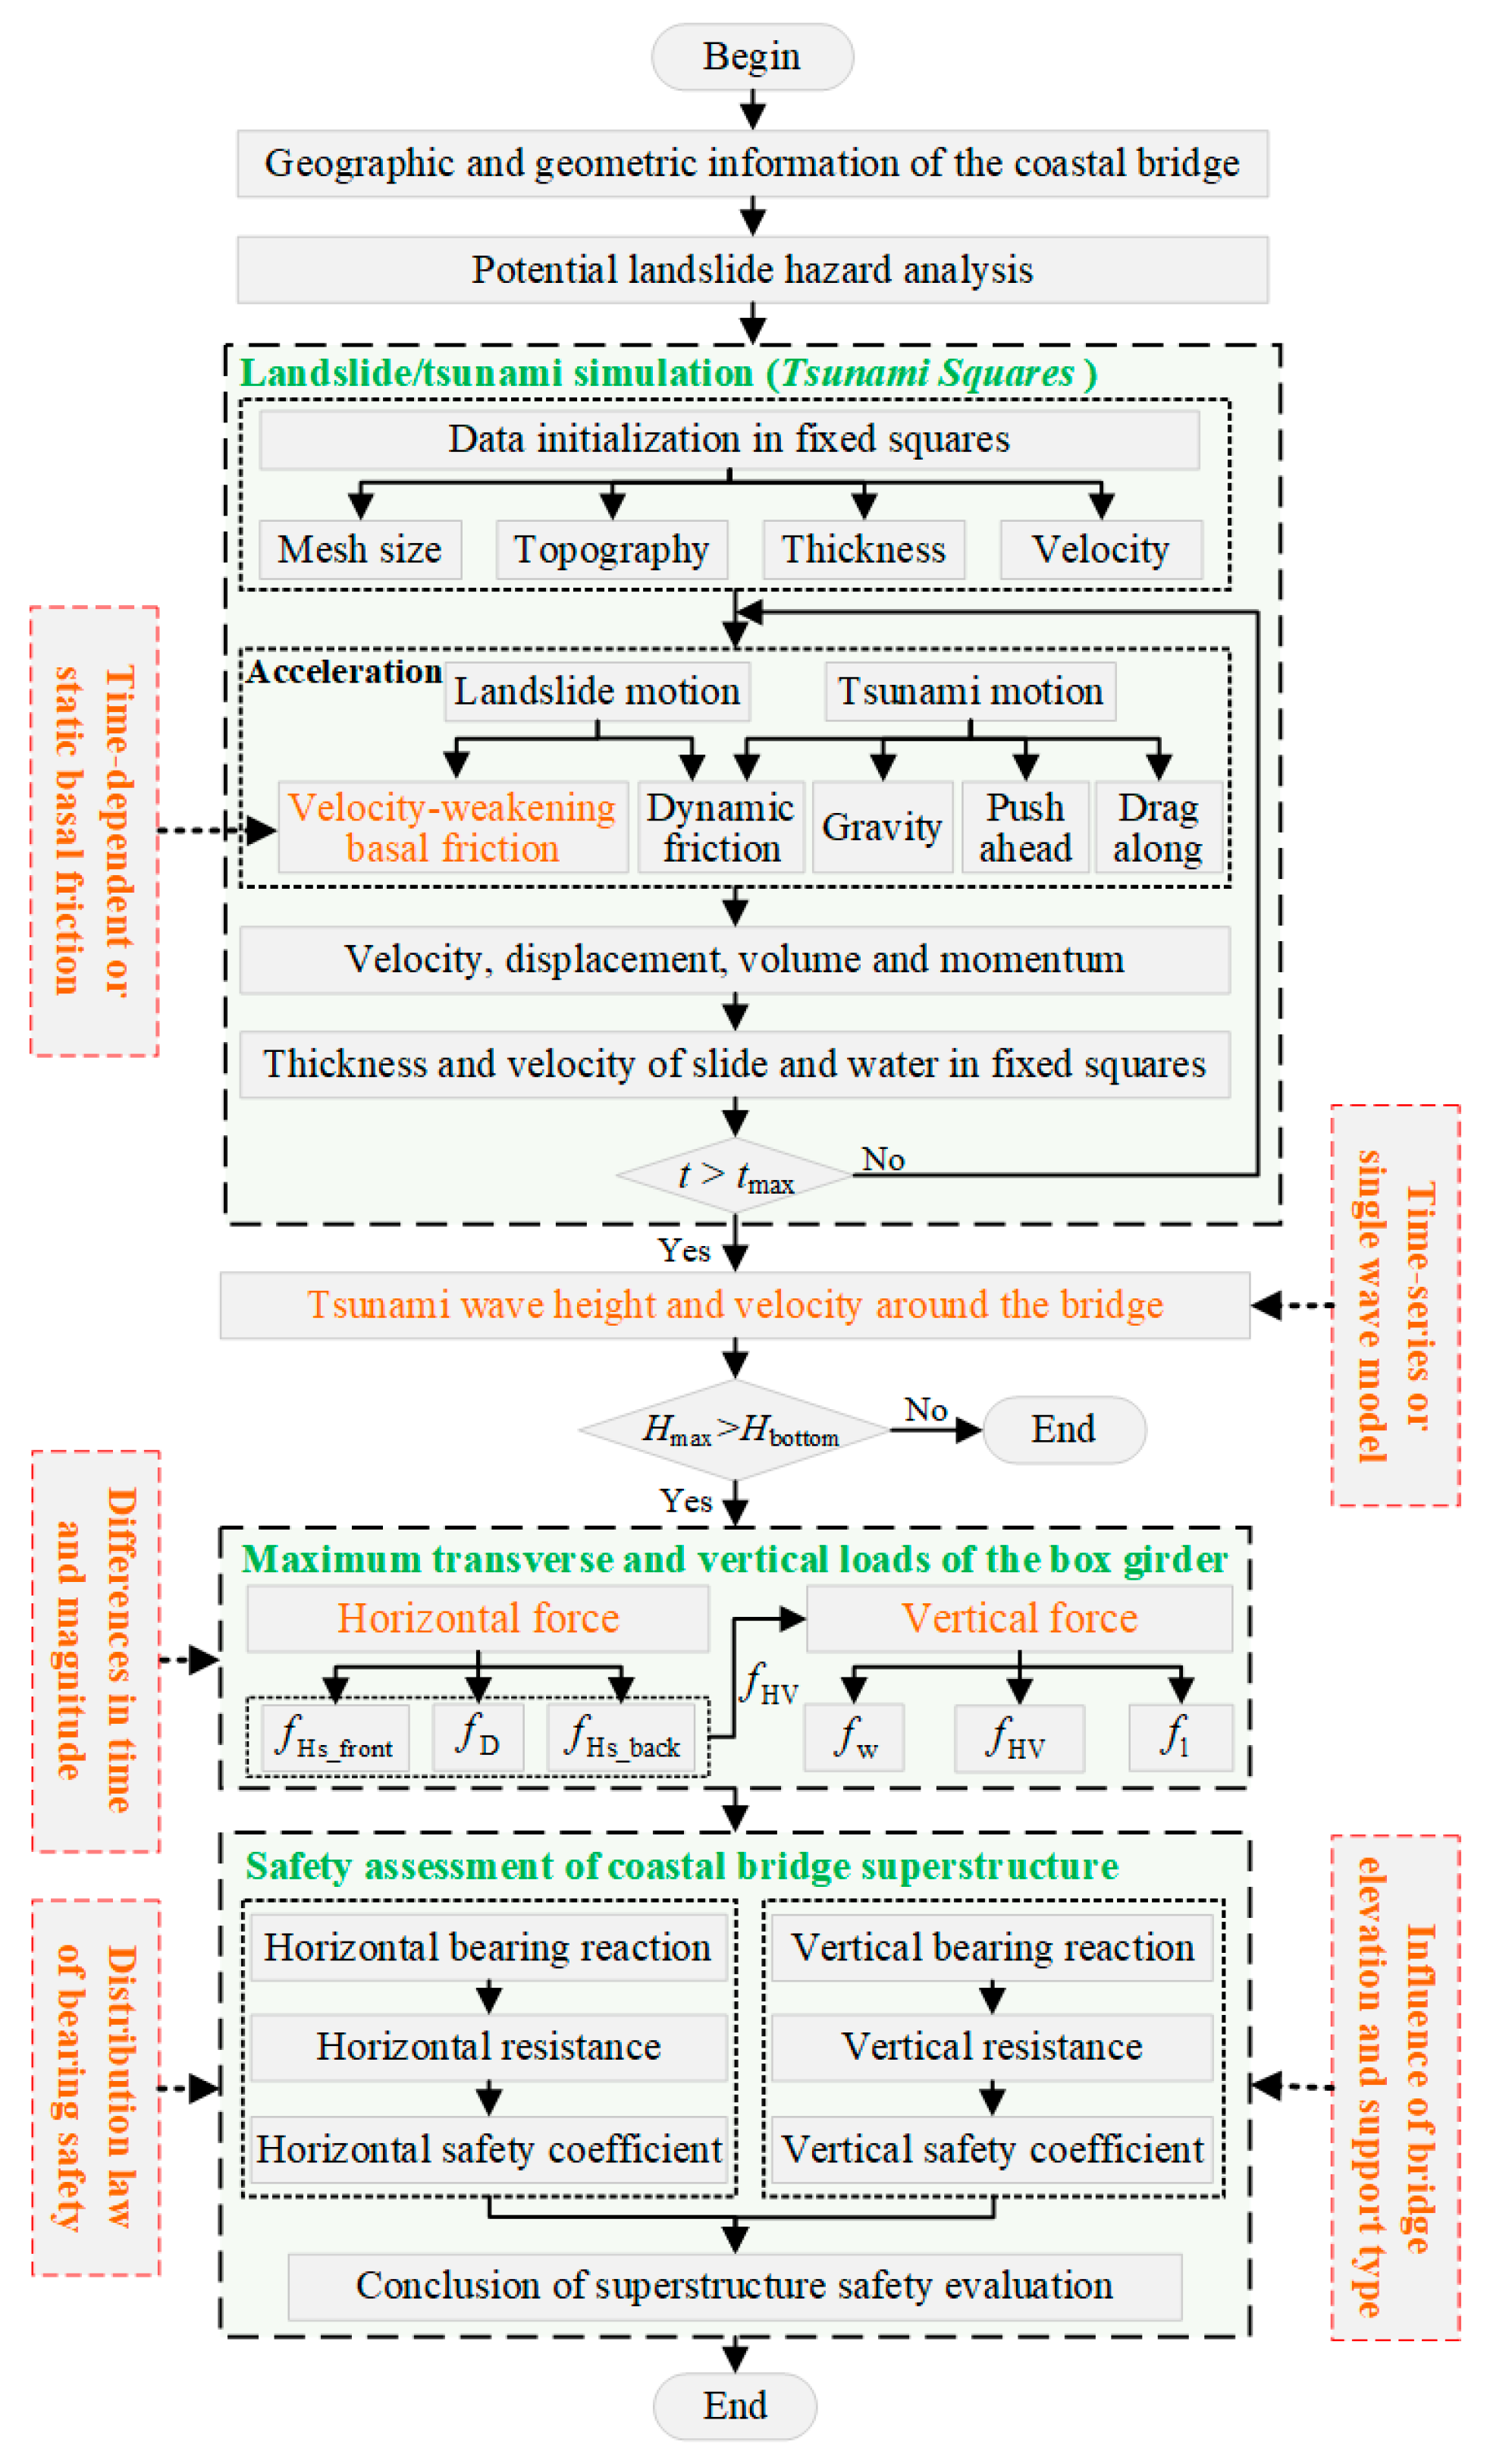
2. Methodology
2.1. Tsunami Squares Method
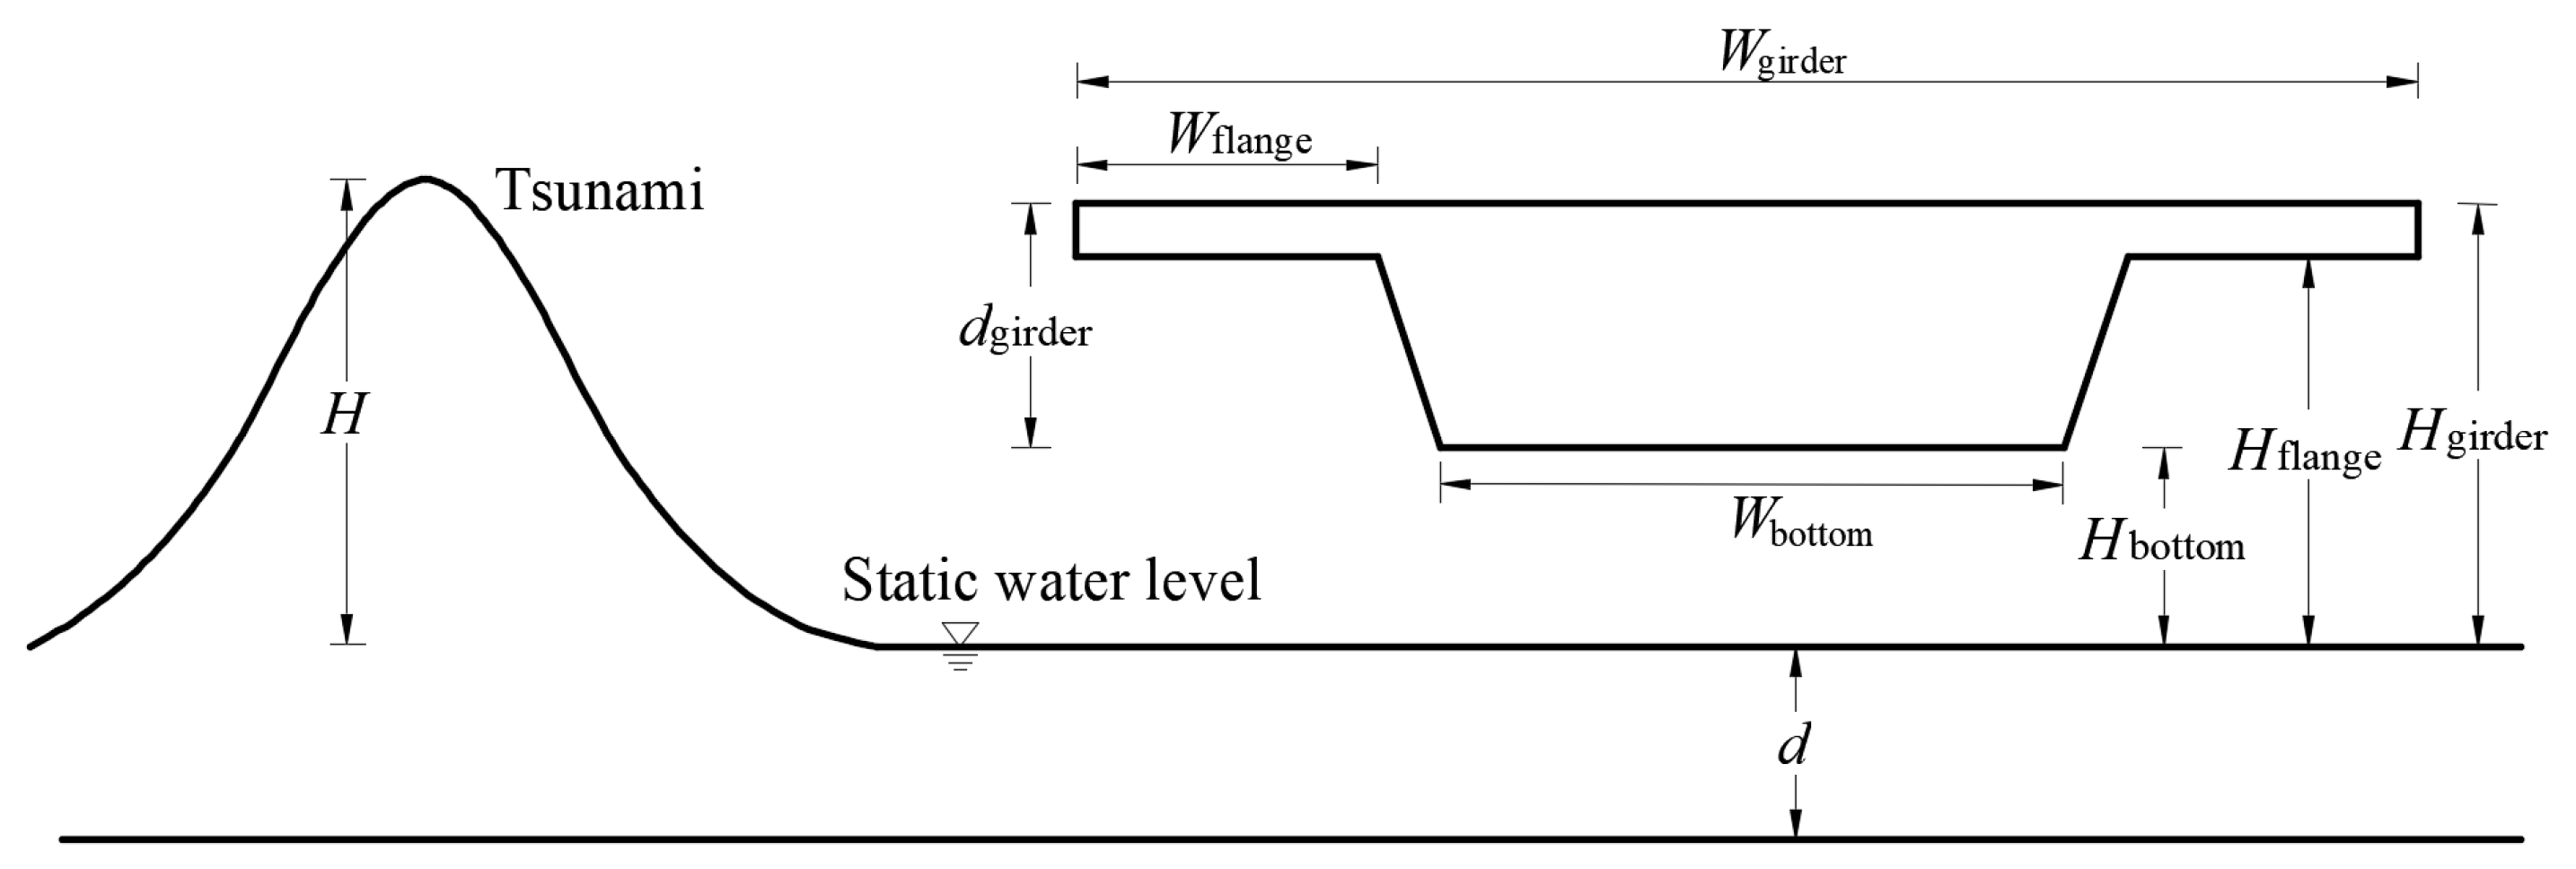
2.2. Wave Force on a Box Girder
2.3. Safety Assessment
3. Case Study
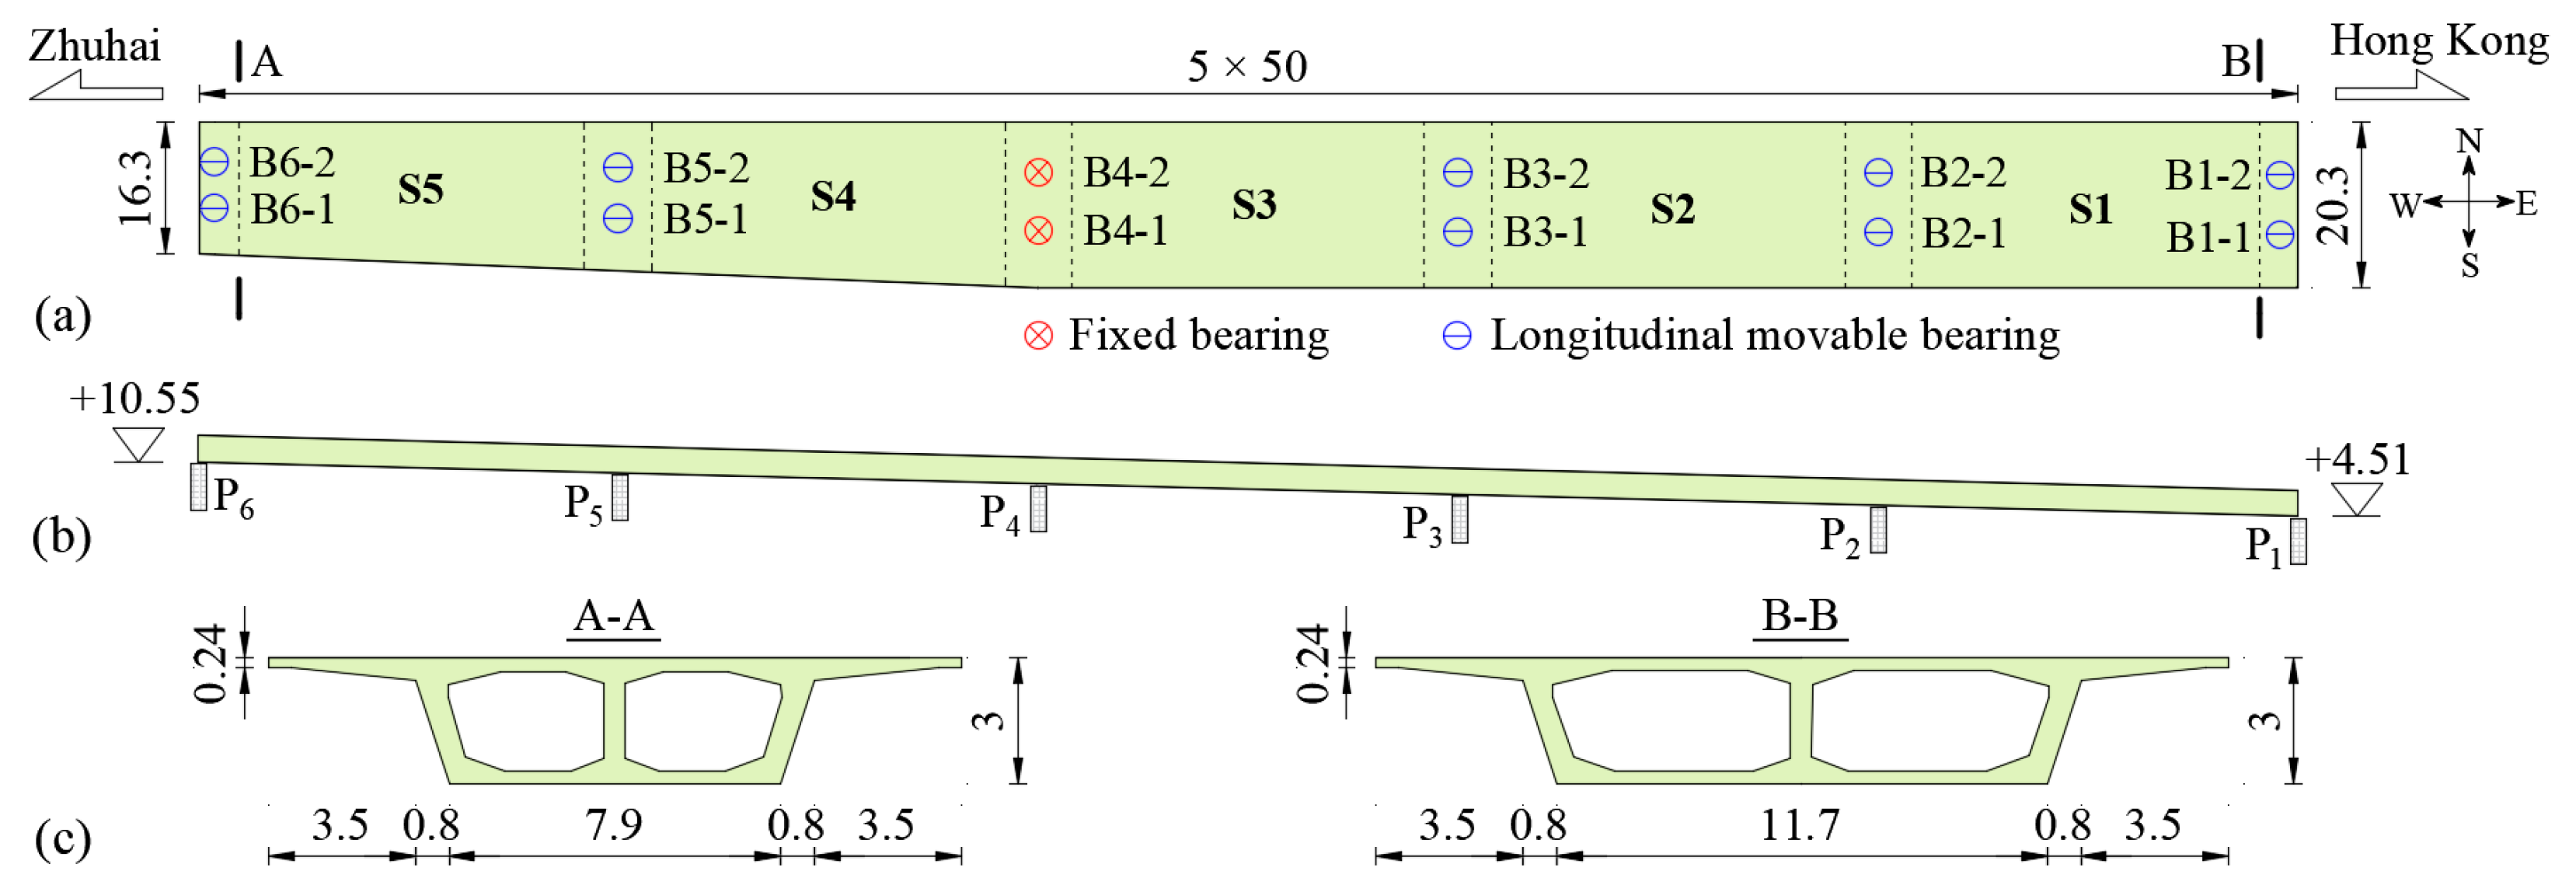
3.1. Prototype Bridge
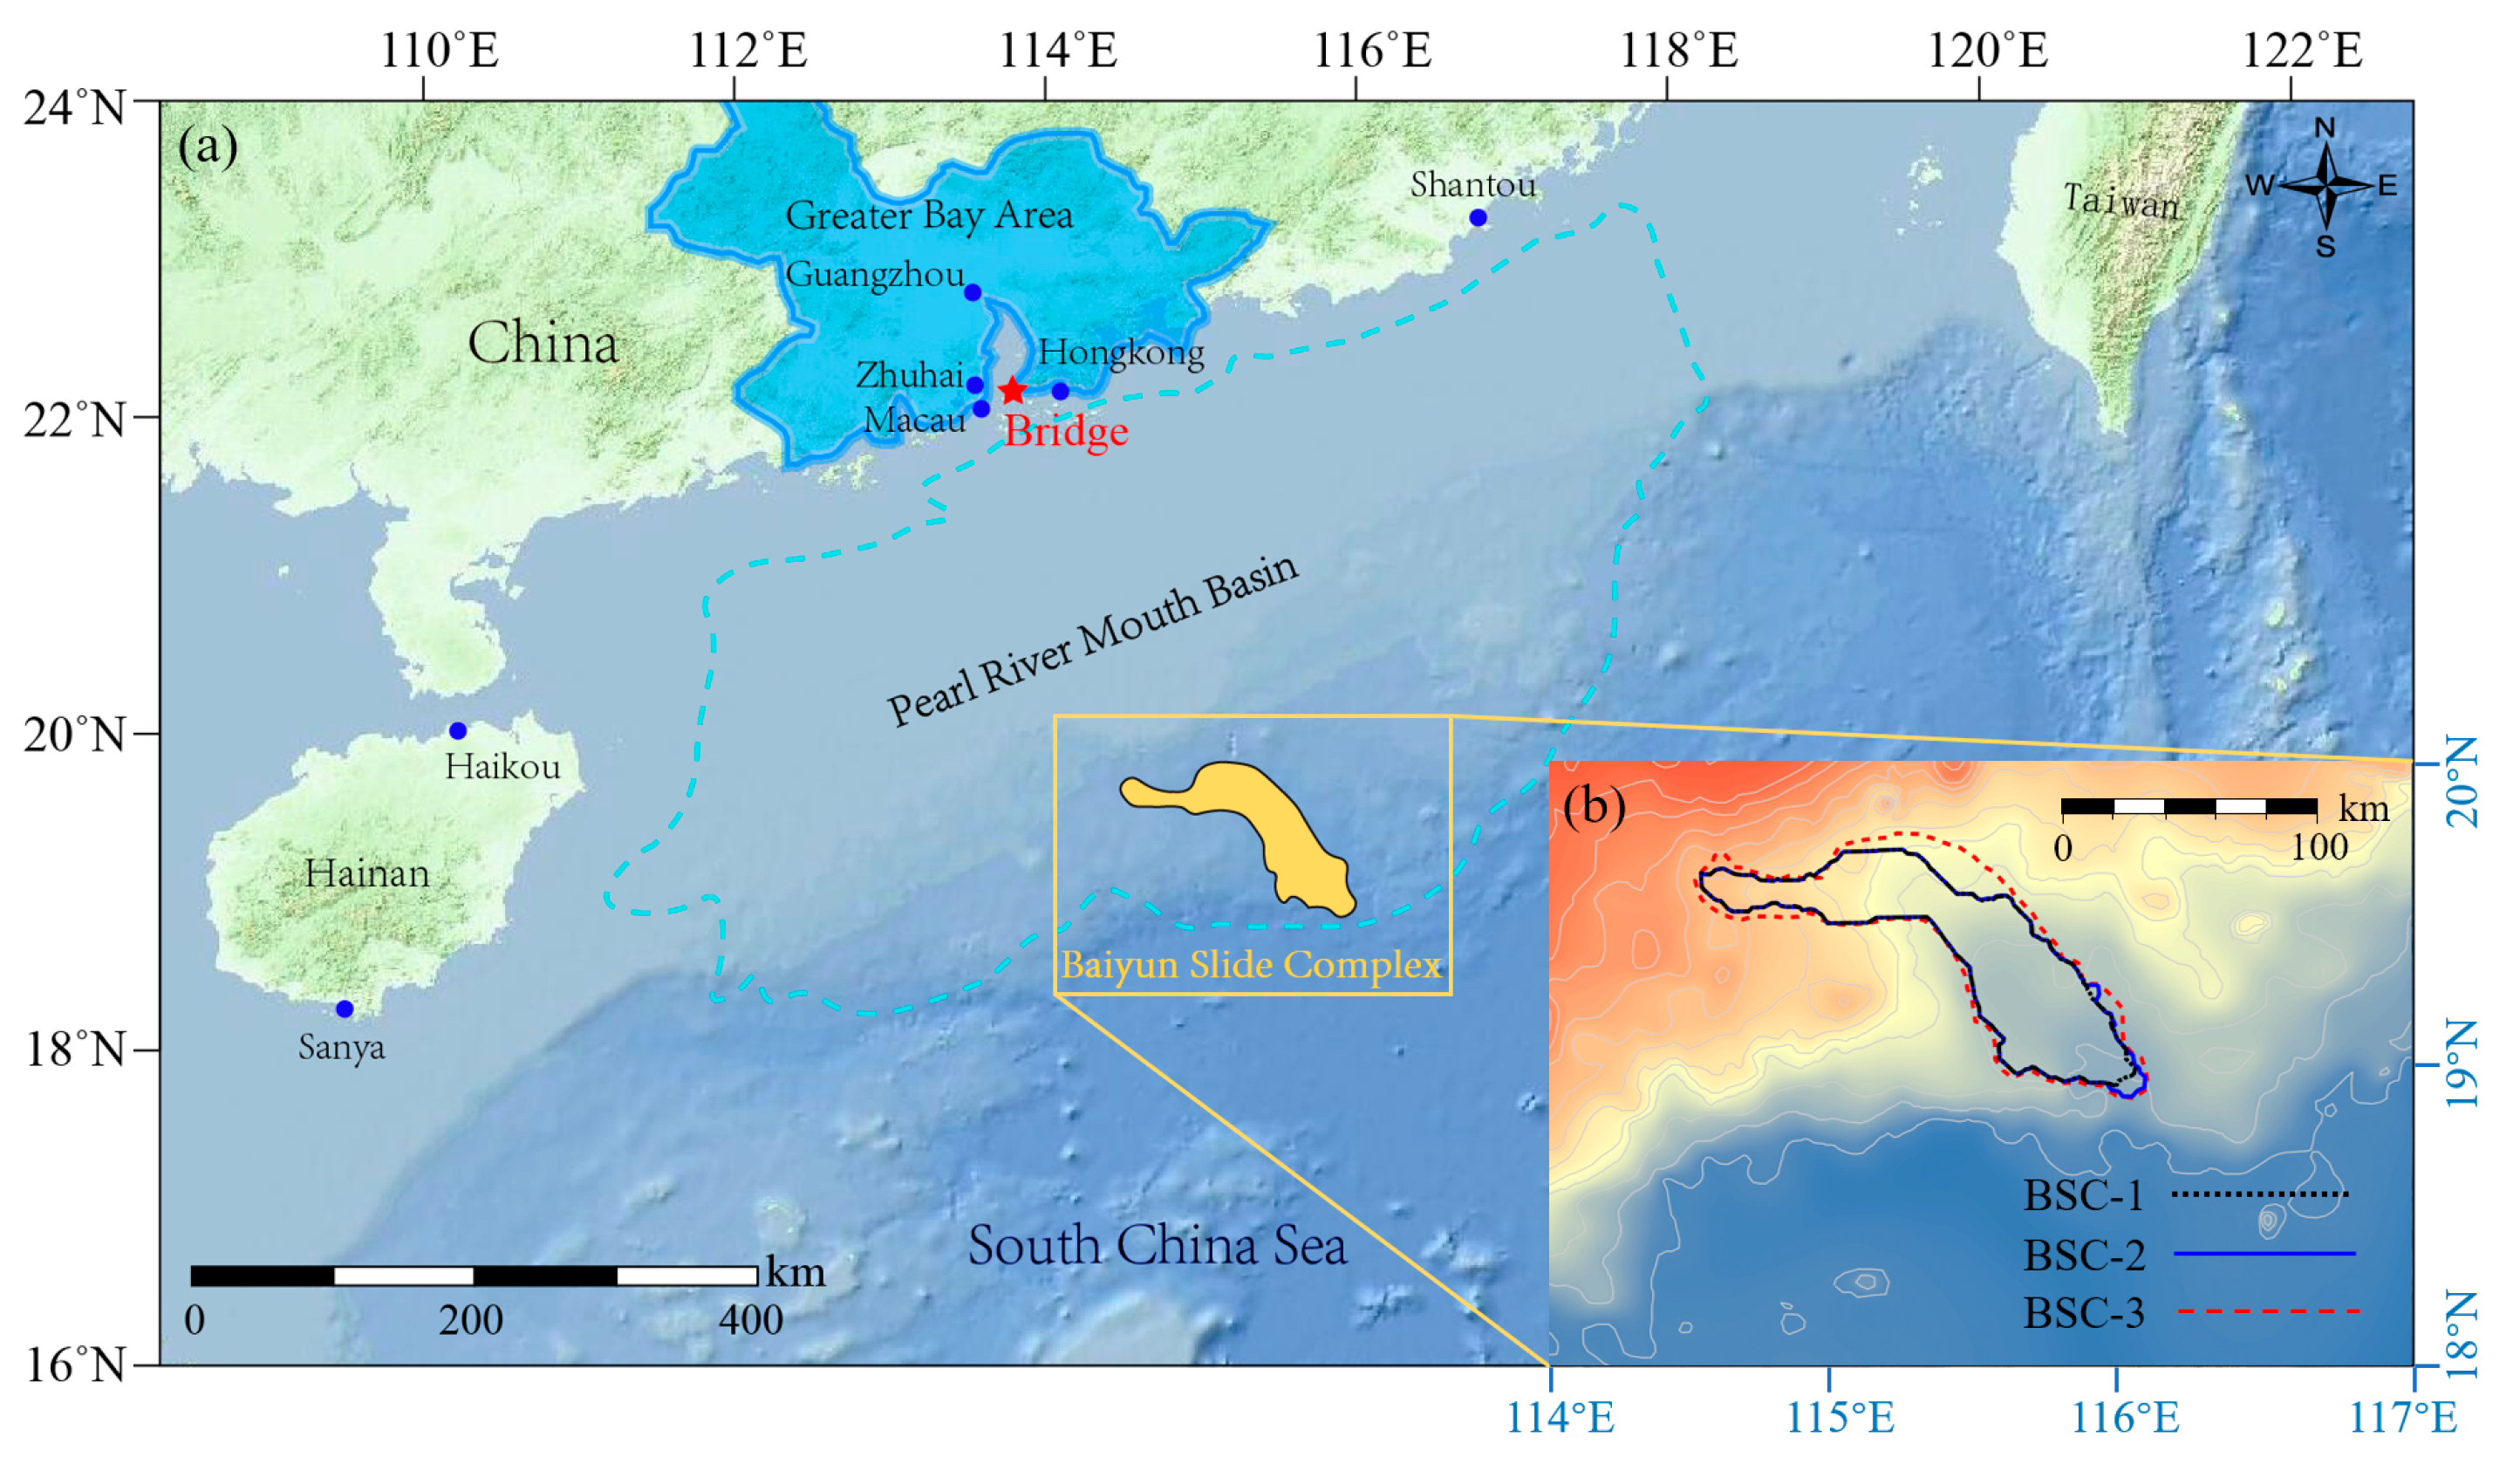
3.2. Baiyun Slide Complex
3.3. Landslide and Tsunami Simulation
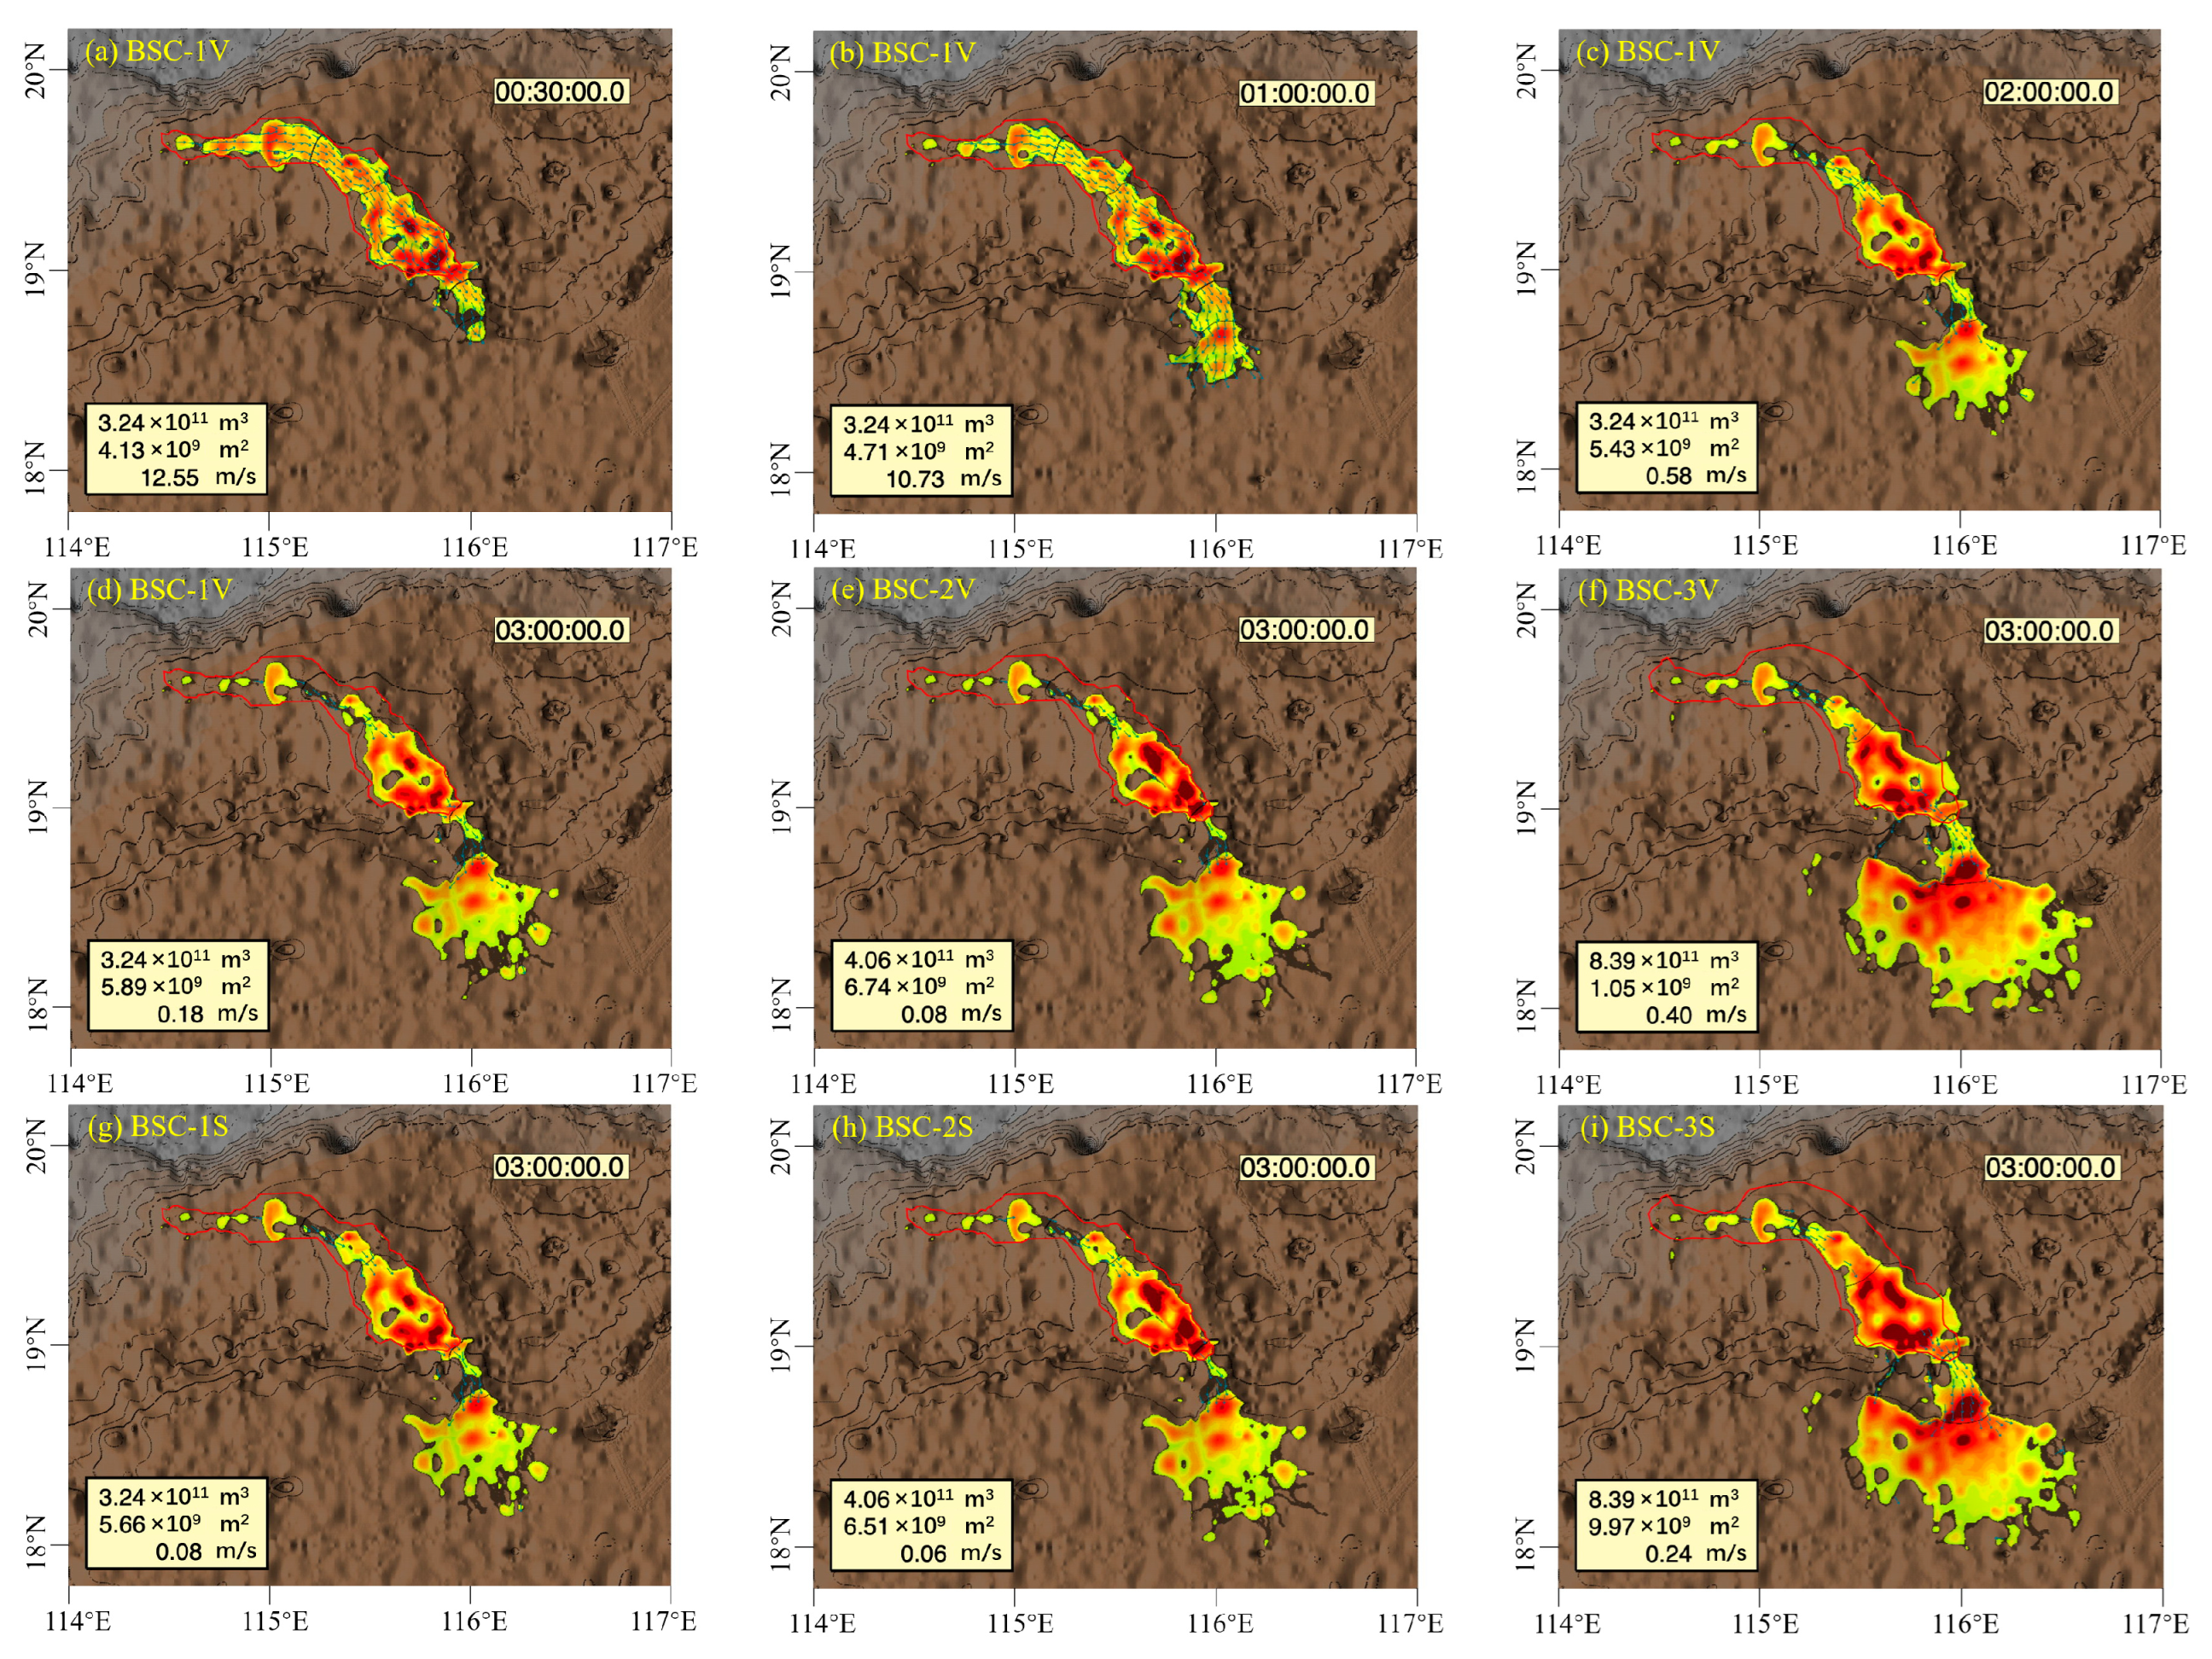
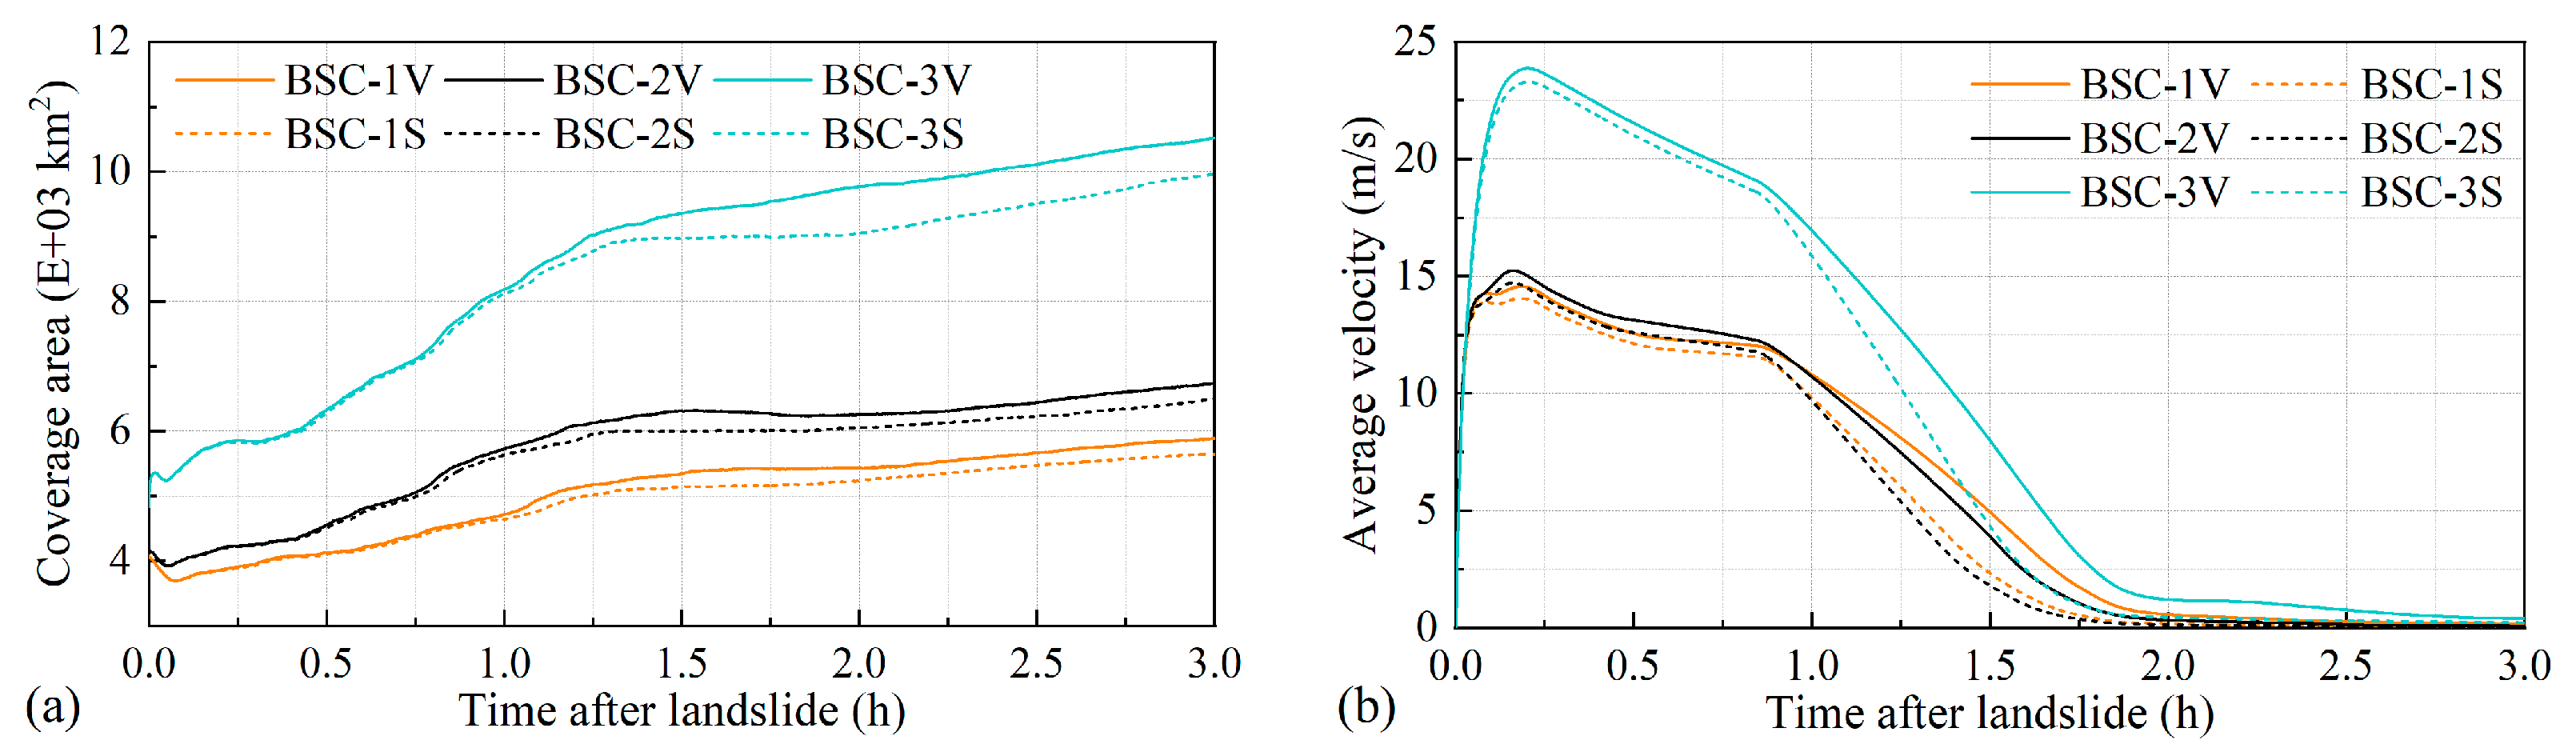
3.3.1. Landslide Motion
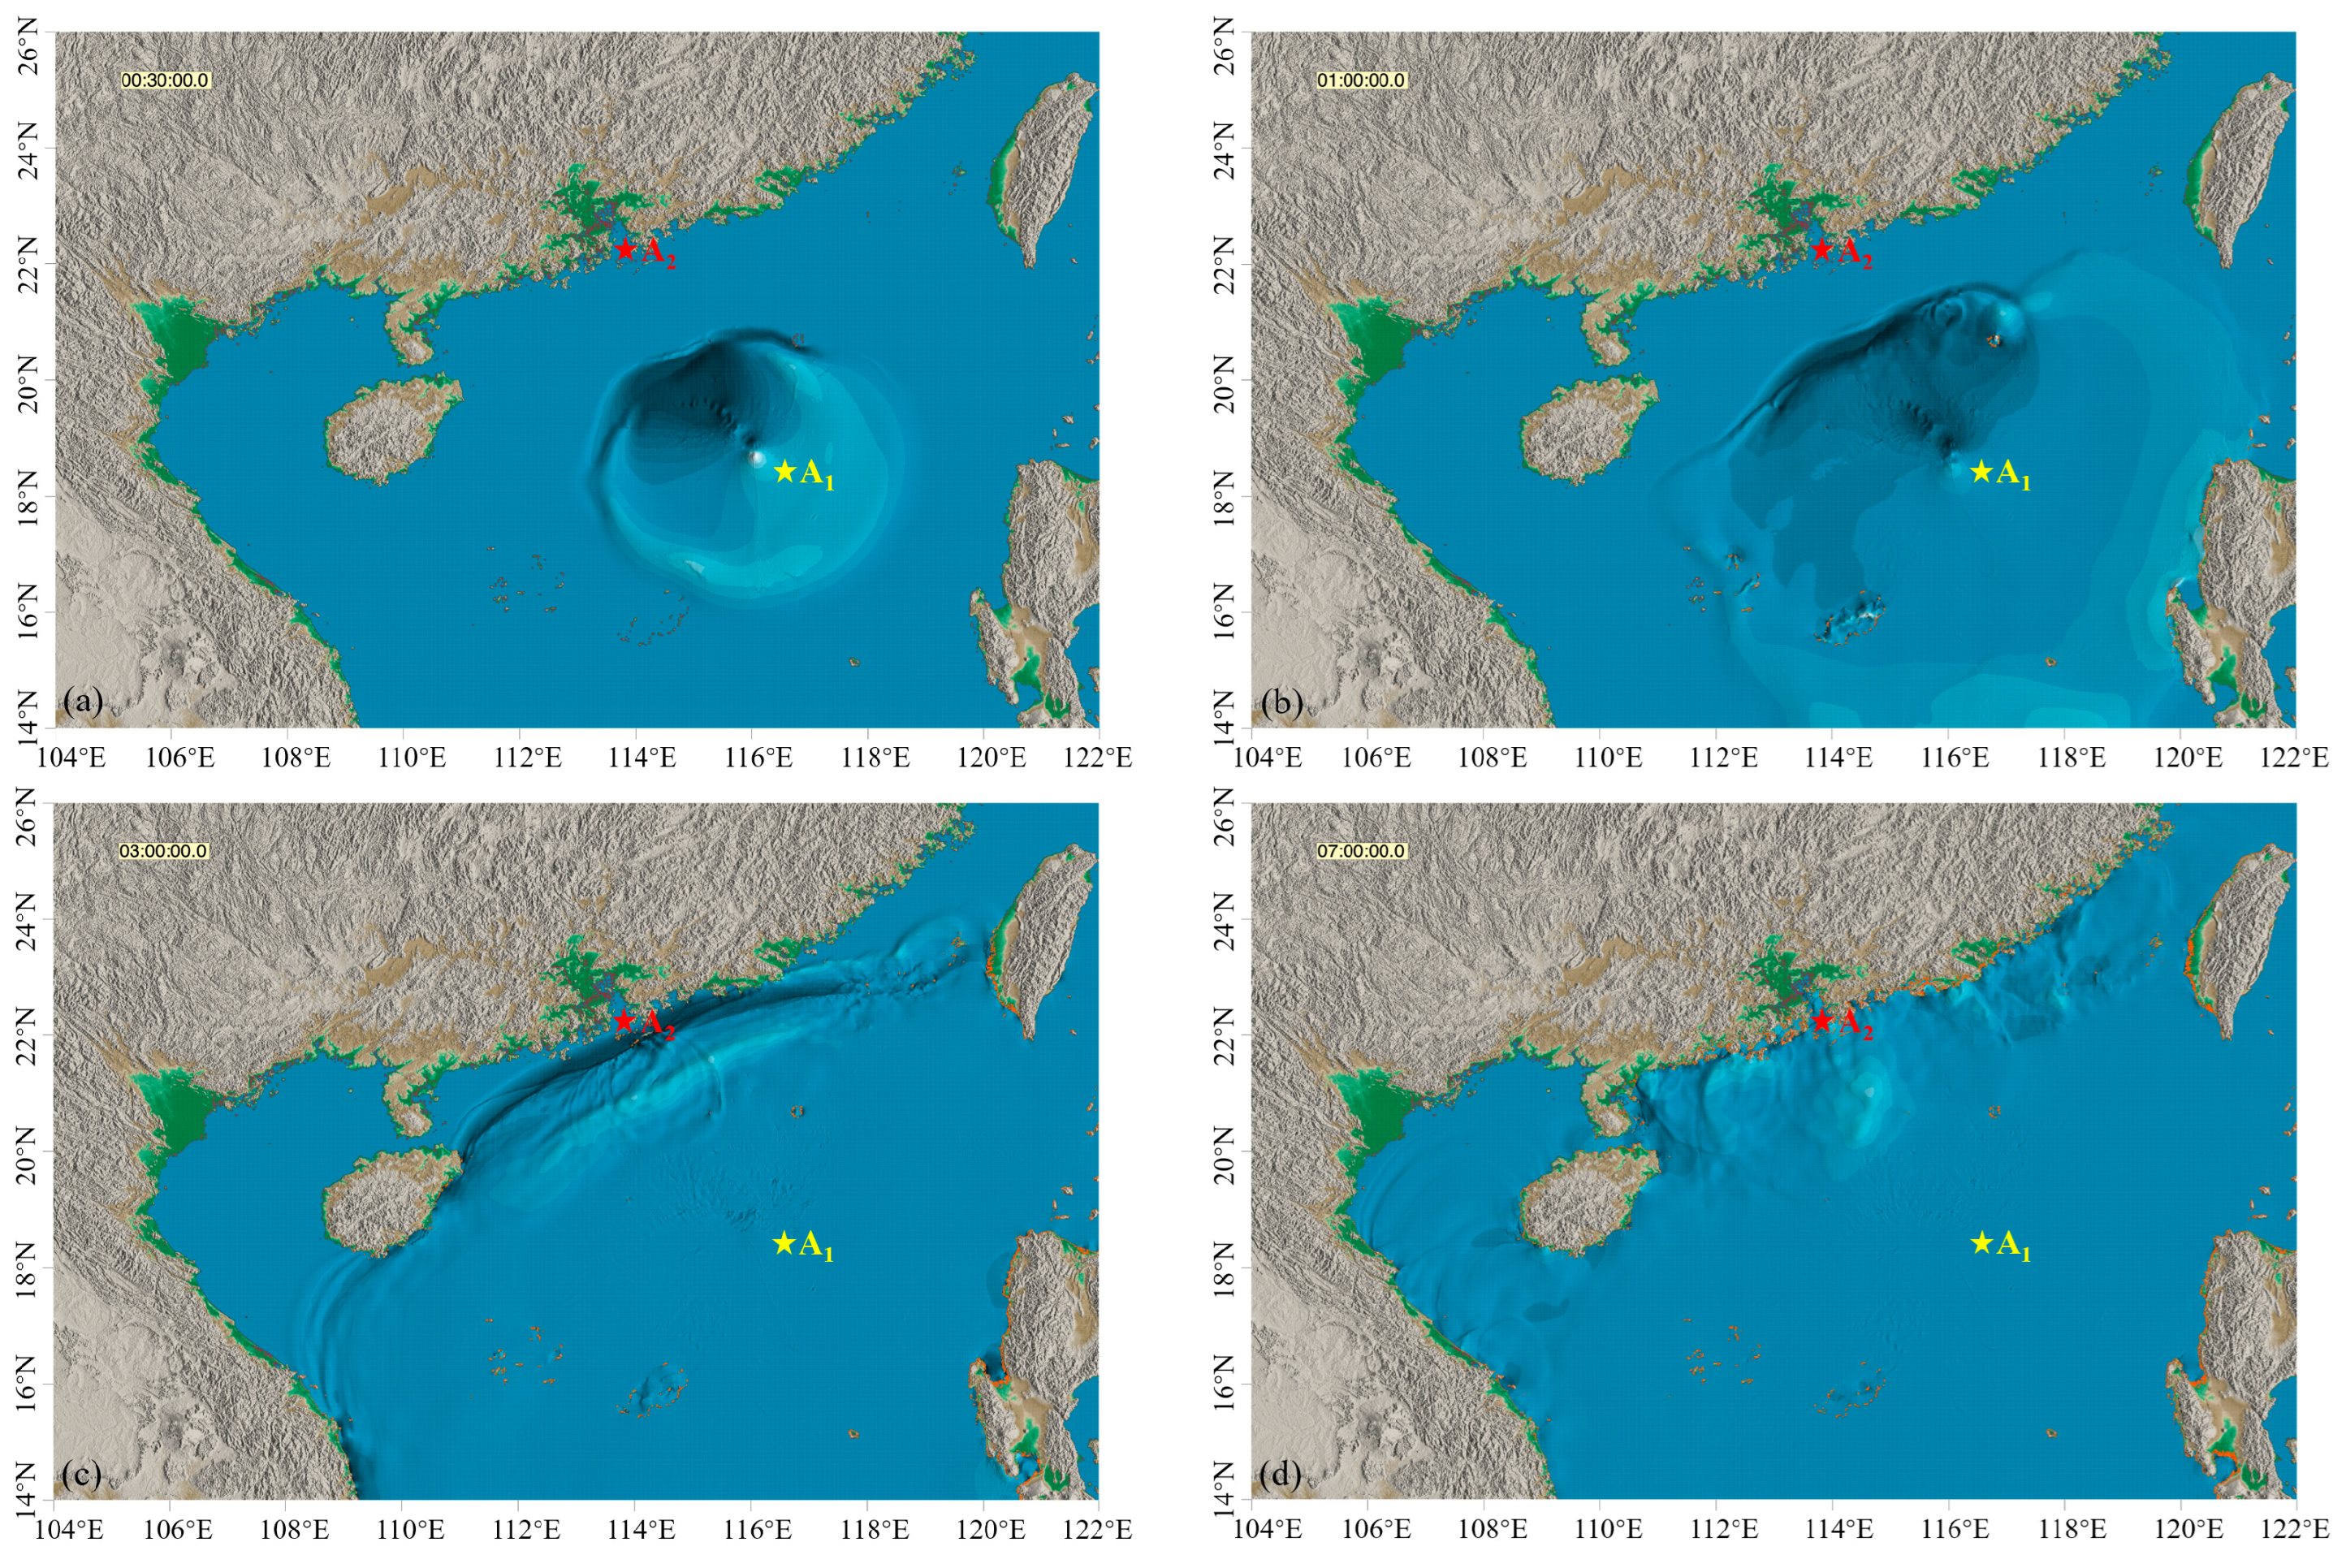
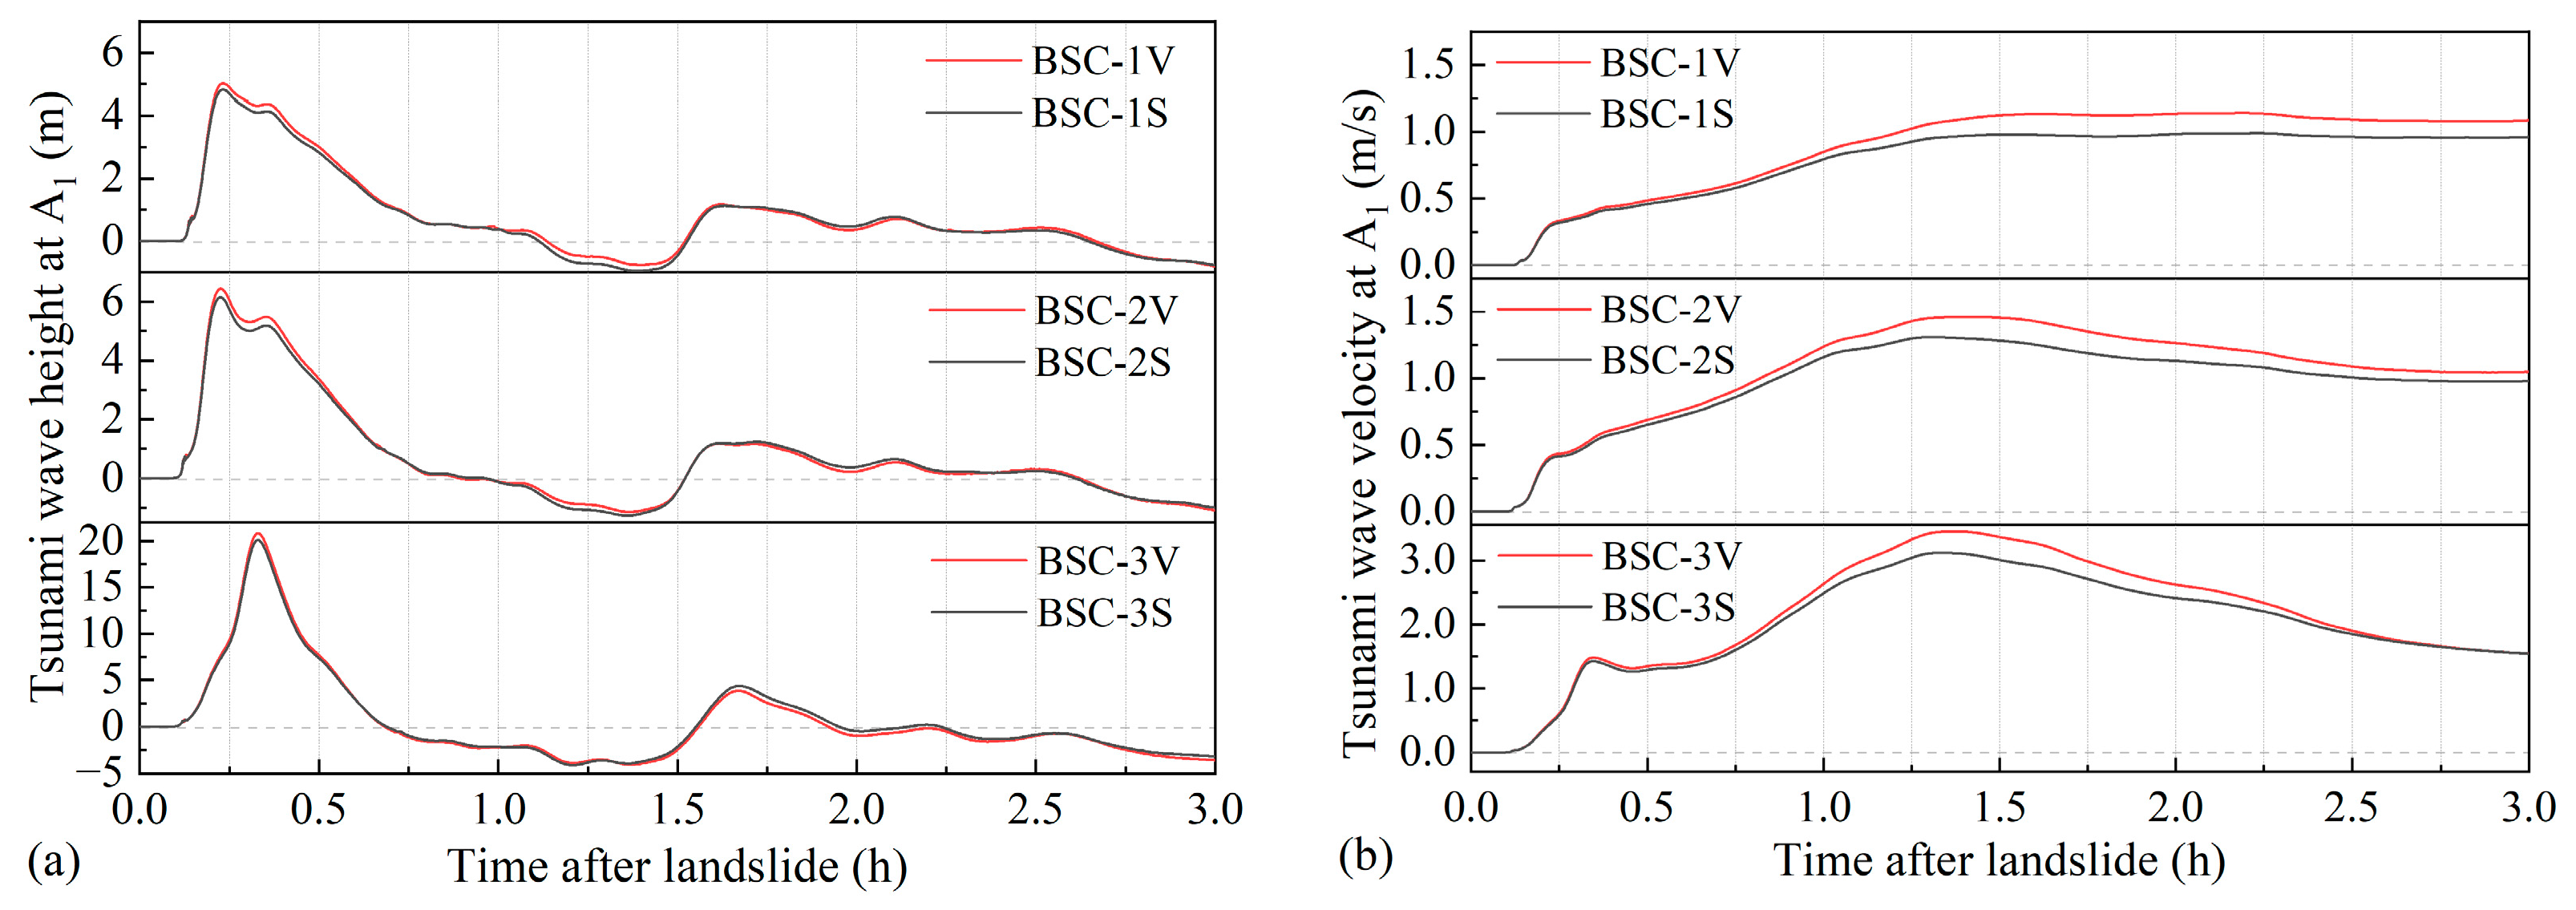
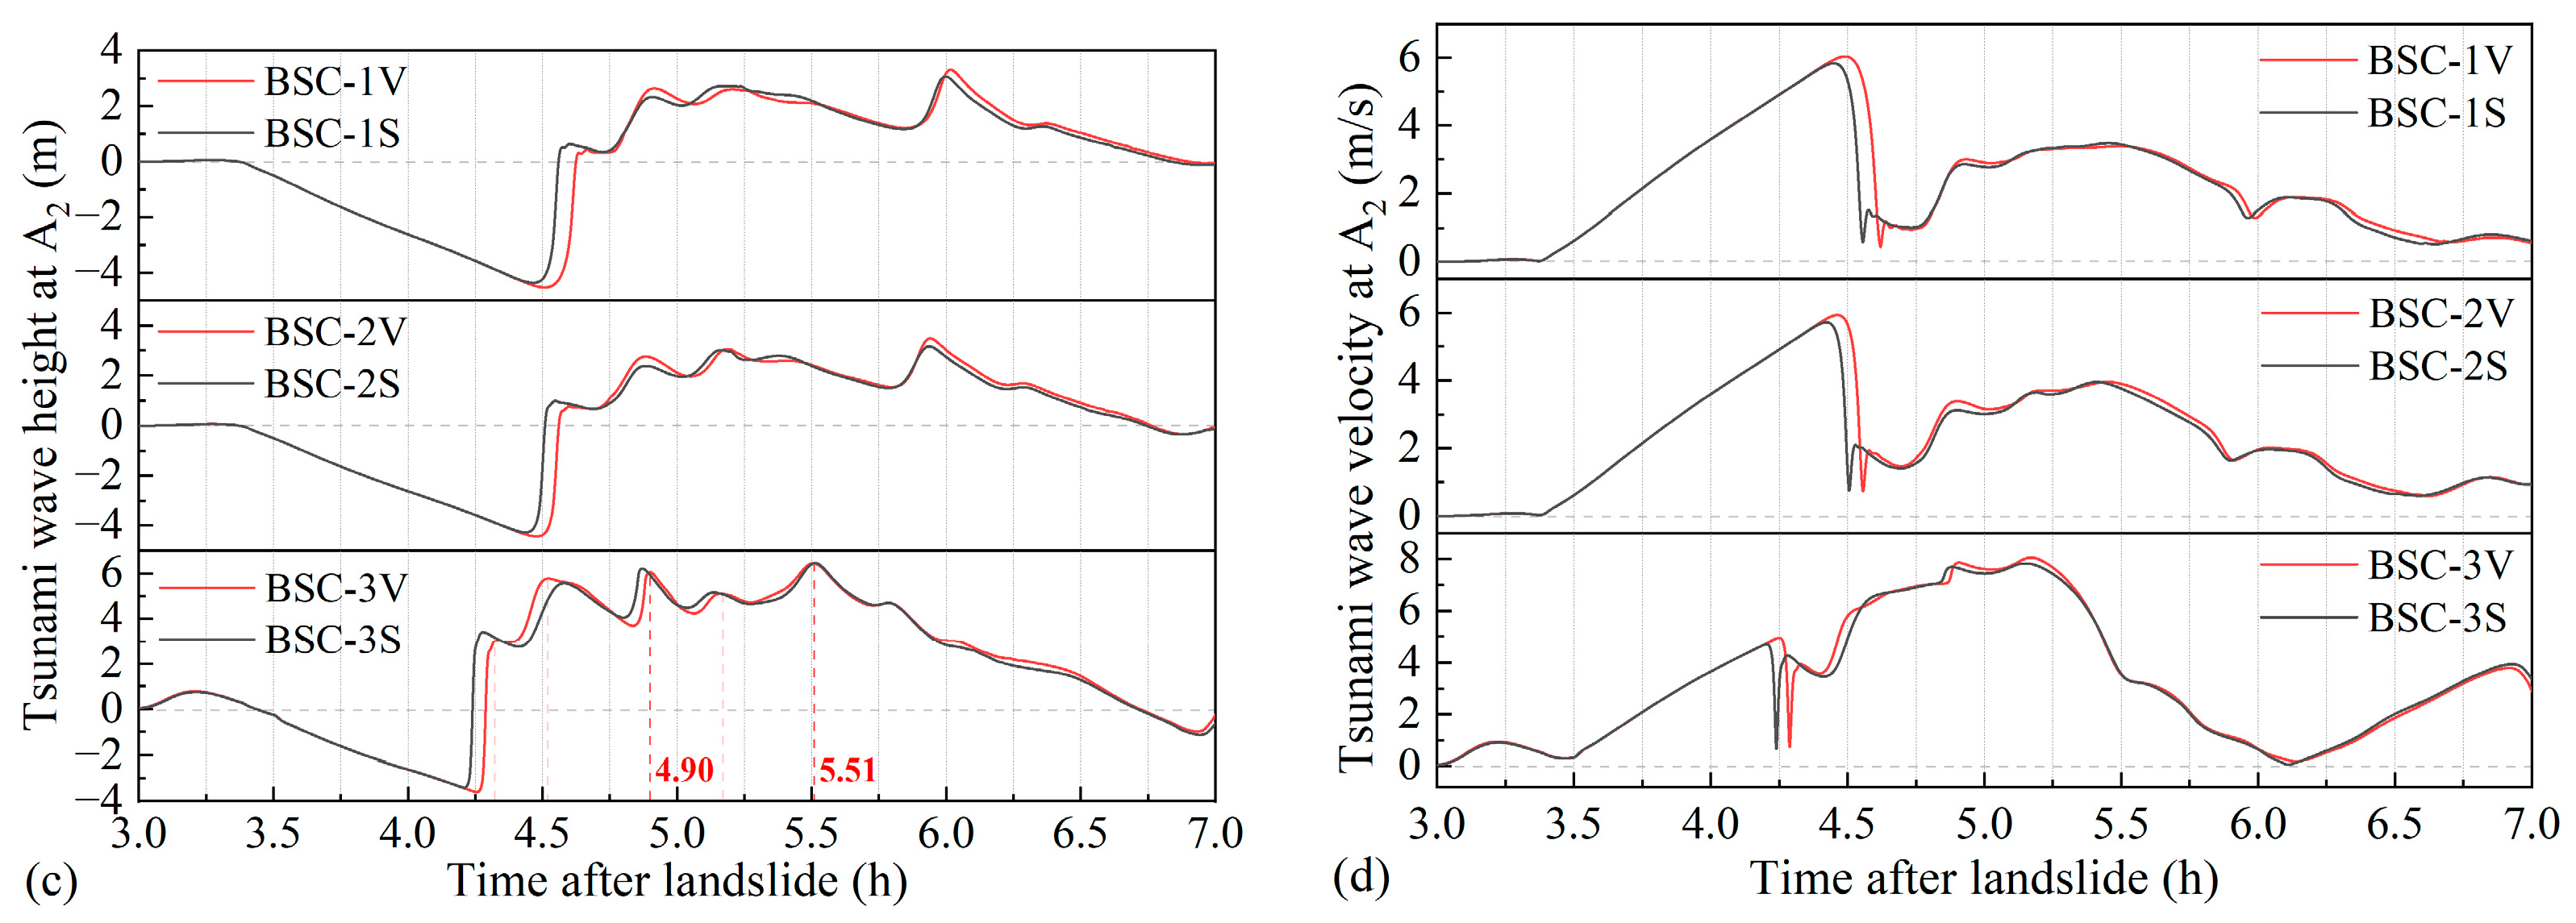
3.3.2. Tsunami Motion
3.4. Safety Assessment
3.4.1. Tsunami Wave Force
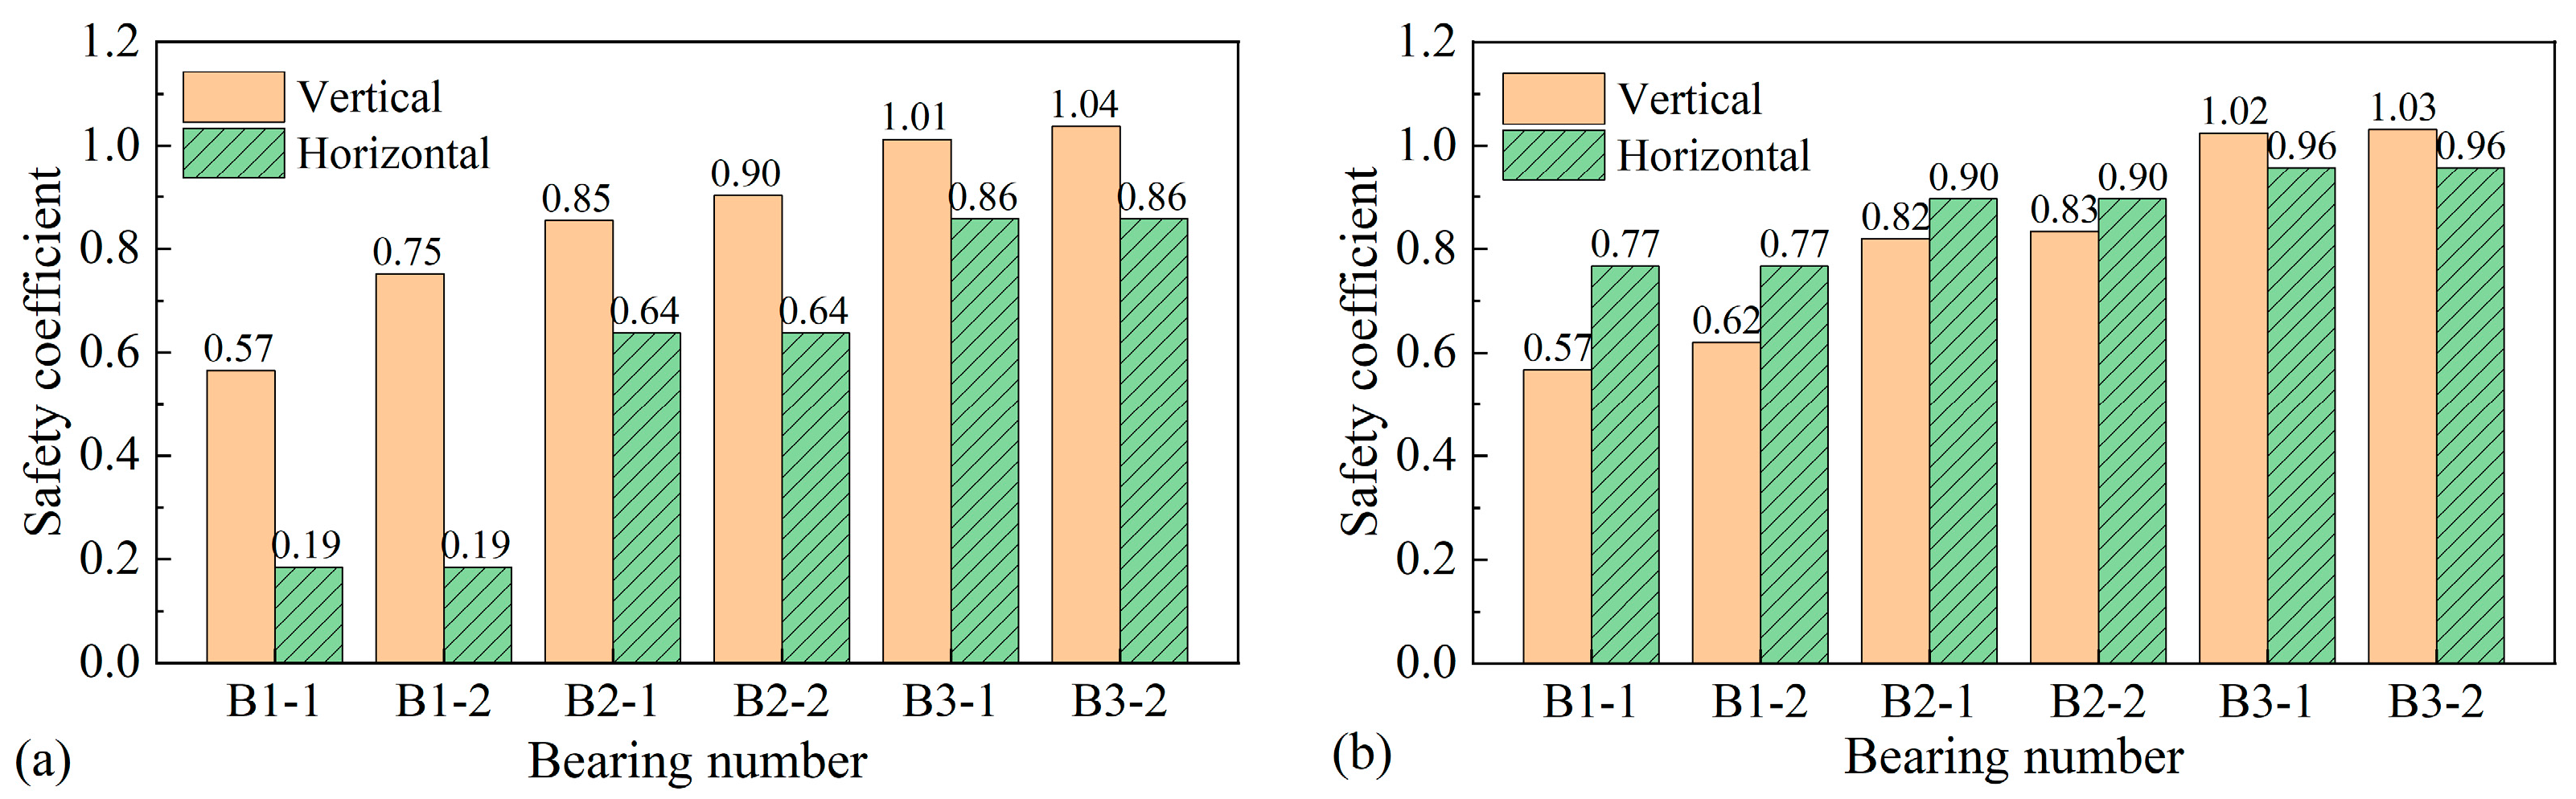
3.4.2. Safety Evaluation
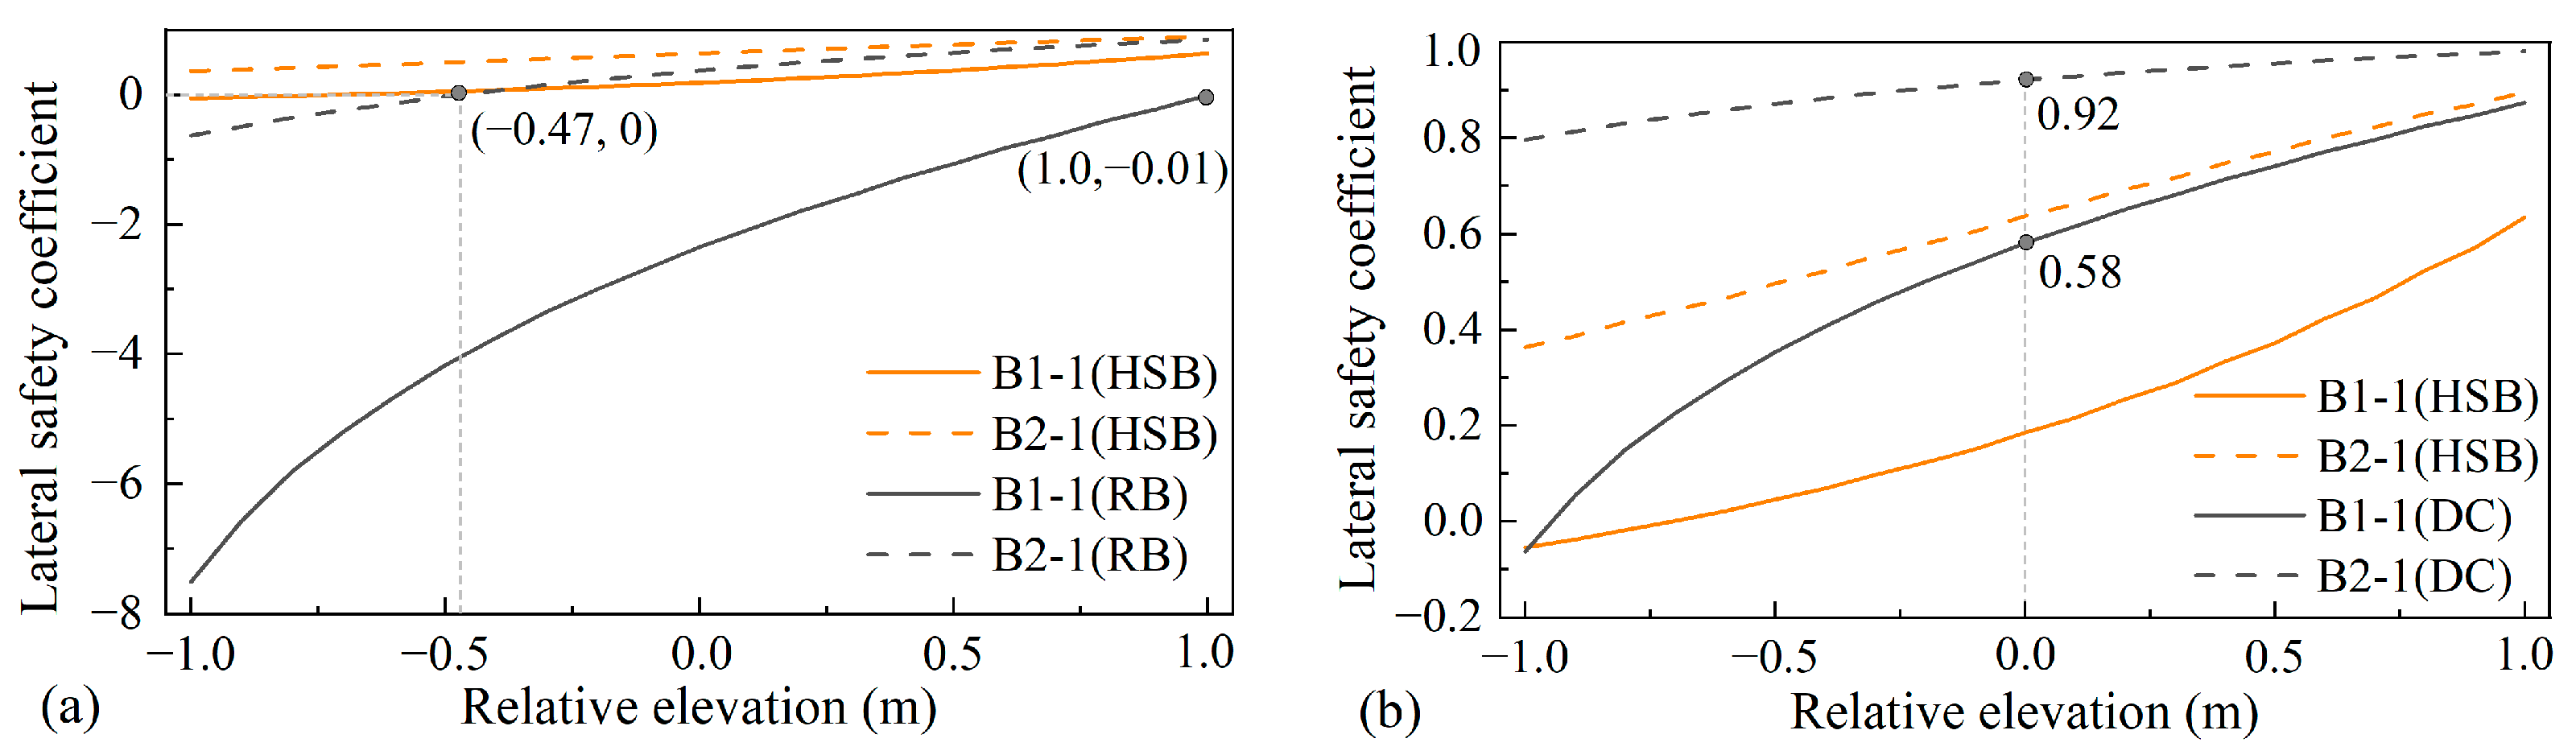
3.5. Parametric Analysis of Bridge Elevation and Support Type
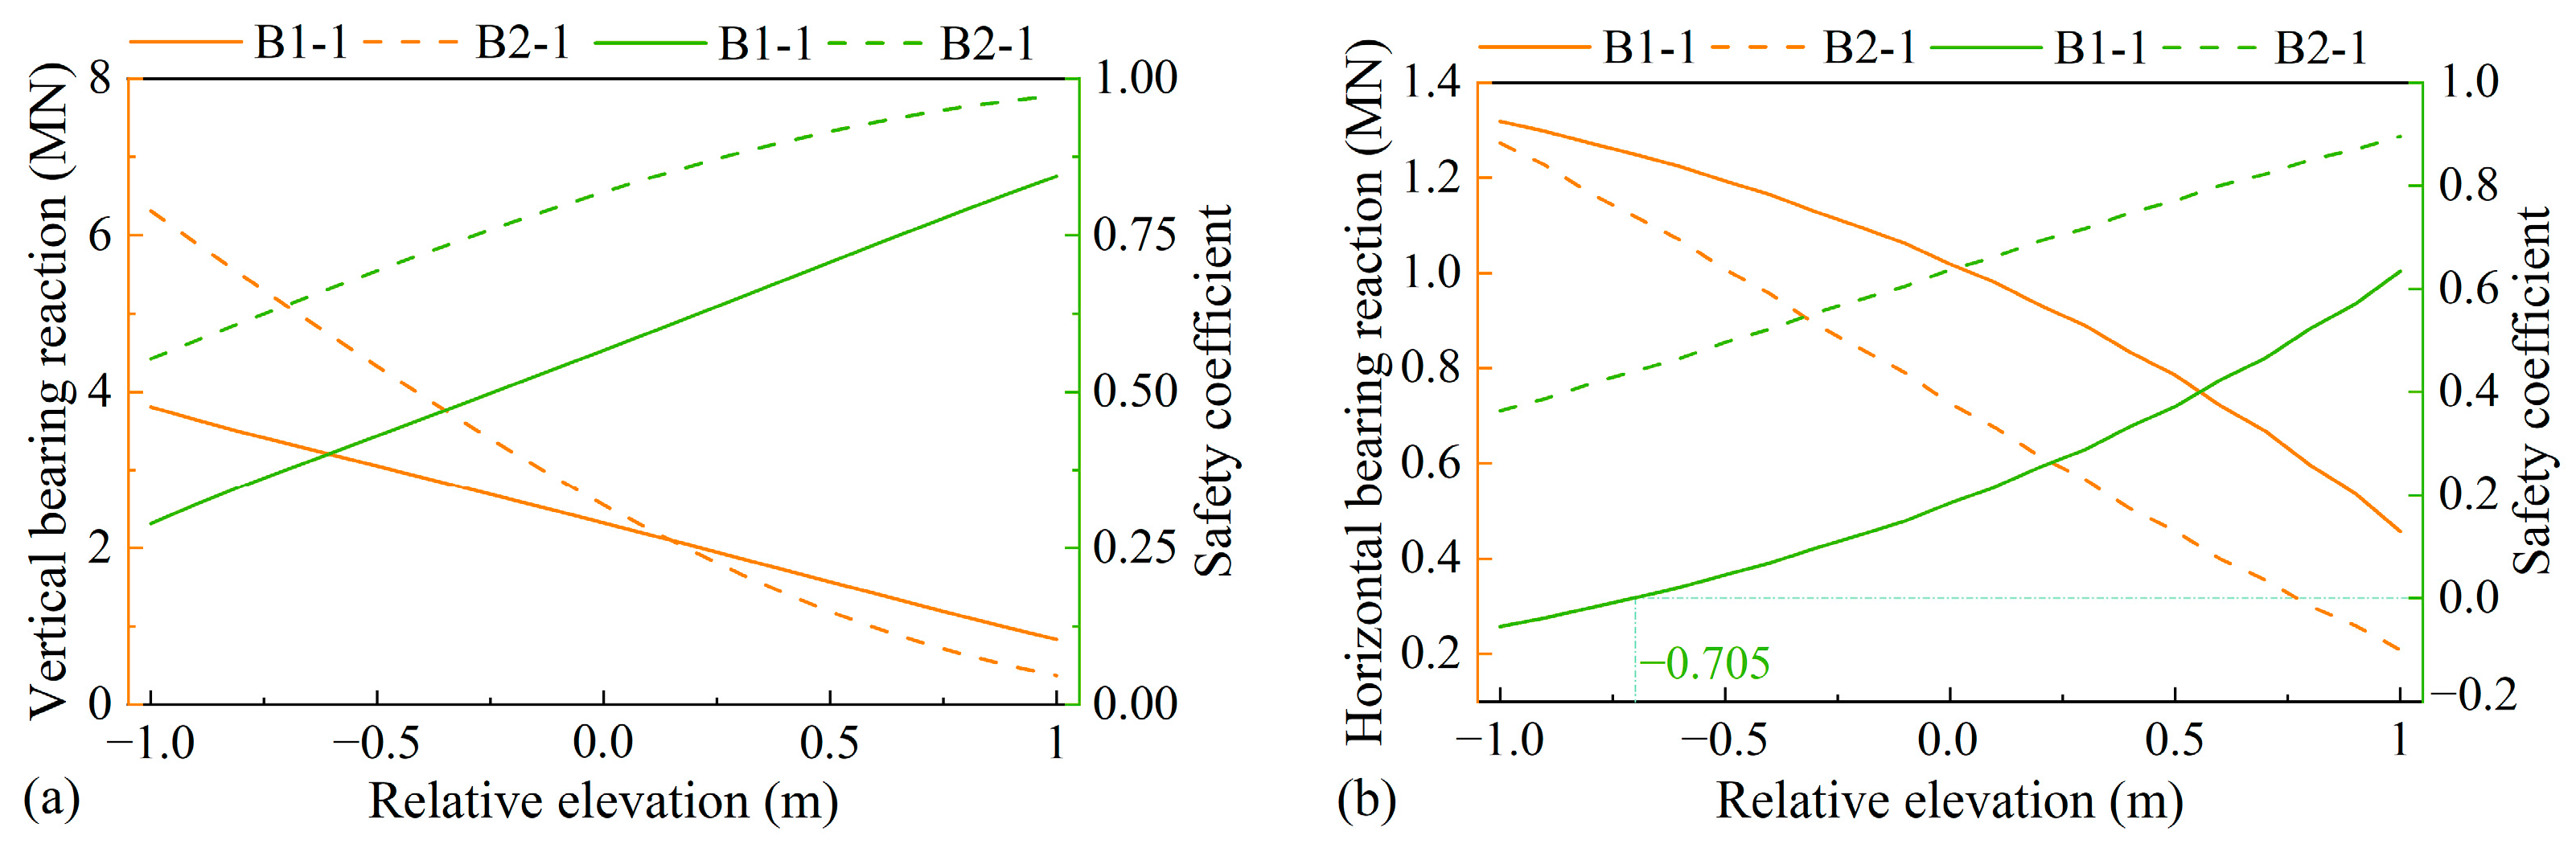
3.5.1. Bridge Elevation
3.5.2. Support Type
4. Conclusions
Author Contributions
Funding
Institutional Review Board Statement
Informed Consent Statement
Data Availability Statement
Acknowledgments
Conflicts of Interest
References
- Masina, M.; Archetti, R.; Lamberti, A. 21 May 2003 Boumerdès Earthquake: Numerical Investigations of the Rupture Mechanism Effects on the Induced Tsunami and its Impact in Harbors. J. Mar. Sci. Eng. 2020, 8, 933. [Google Scholar] [CrossRef]
- Samaras, A.G.; Karambas, T.V.; Archetti, R. Simulation of tsunami generation, propagation and coastal inundation in the Eastern Mediterranean. Ocean Sci. 2015, 11, 643–655. [Google Scholar] [CrossRef]
- Linton, C.M. The finite dock problem. Z. Für Angew. Math. Und Phys. ZAMP 2001, 52, 640–656. [Google Scholar] [CrossRef]
- Garrett, C.J.R. Wave forces on a circular dock. J. Fluid Mech. 1971, 46, 129–139. [Google Scholar] [CrossRef]
- Kar, P.; Sahoo, T.; Behera, H. Effect of Bragg scattering due to bottom undulation on a floating dock. Wave Motion 2019, 90, 121–138. [Google Scholar] [CrossRef]
- Khan, M.B.; Gayathri, R.; Behera, H. Wave attenuation properties of rubble mound breakwater in tandem with a floating dock against oblique regular waves. Waves Random Complex Media 2021, 1–19. [Google Scholar] [CrossRef]
- Nasr, A.; Björnsson, I.; Honfi, D.; Ivanov, O.L.; Johansson, J.; Kjellström, E. A review of the potential impacts of climate change on the safety and performance of bridges. Sustain. Resilient Infrastruct. 2021, 6, 192–212. [Google Scholar] [CrossRef]
- Jia, L.; Zhang, Y.; Zhu, D.; Dong, Y. 3D Numerical Modeling and Quantification of Oblique Wave Forces on Coastal Bridge Superstructures. J. Mar. Sci. Eng. 2022, 10, 860. [Google Scholar] [CrossRef]
- Tappin, D.R.; Grilli, S.T.; Harris, J.C.; Geller, R.J.; Masterlark, T.; Kirby, J.T.; Shi, F.; Ma, G.; Thingbaijam, K.K.S.; Mai, P.M. Did a submarine landslide contribute to the 2011 Tohoku tsunami? Mar. Geol. 2014, 357, 344–361. [Google Scholar] [CrossRef]
- Borrero, J.C.; Solihuddin, T.; Fritz, H.M.; Lynett, P.J.; Prasetya, G.S.; Skanavis, V.; Husrin, S.; Kushendratno; Kongko, W.; Istiyanto, D.C.; et al. Field Survey and Numerical Modelling of the December 22, 2018 Anak Krakatau Tsunami. Pure Appl. Geophys. 2020, 177, 2457–2475. [Google Scholar] [CrossRef]
- Huang, B.; Duan, L.; Yang, Z.; Zhang, J.; Kang, A.; Zhu, B. Tsunami Forces on a Coastal Bridge Deck with a Box Girder. J. Bridge Eng. 2019, 24, 04019091. [Google Scholar] [CrossRef]
- Xiao, L. Numerical Simulation of Landslide Generated Waves in Reservoir. Doctoral Dissertation, China University of Geosciences, Wuhan, China, 2015. [Google Scholar]
- Deng, Y.; Yan, S.; Scaringi, G.; Liu, W.; He, S. An Empirical Power Density-Based Friction Law and Its Implications for Coherent Landslide Mobility. Geophys. Res. Lett. 2020, 47, e2020GL087581. [Google Scholar] [CrossRef]
- Lucas, A.; Mangeney, A.; Ampuero, J.P. Frictional velocity-weakening in landslides on Earth and on other planetary bodies. Nat. Commun. 2014, 5, 3417. [Google Scholar] [CrossRef] [PubMed]
- Scaringi, G.; Hu, W.; Xu, Q.; Huang, R. Shear-Rate-Dependent Behavior of Clayey Bimaterial Interfaces at Landslide Stress Levels. Geophys. Res. Lett. 2018, 45, 766–777. [Google Scholar] [CrossRef]
- Hu, W.; Huang, R.; McSaveney, M.; Yao, L.; Xu, Q.; Feng, M.; Zhang, X. Superheated steam, hot CO2 and dynamic recrystallization from frictional heat jointly lubricated a giant landslide: Field and experimental evidence. Earth Planet. Sci. Lett. 2019, 510, 85–93. [Google Scholar] [CrossRef]
- Dong, J.-J.; Yang, C.-M.; Yu, W.-L.; Lee, C.-T.; Miyamoto, Y.; Shimamoto, T. Velocity-Displacement Dependent Friction Coefficient and the Kinematics of Giant Landslide. In Earthquake-Induced Landslides; Ugai, K., Yagi, H., Wakai, A., Eds.; Springer: Berlin/Heidelberg, Germany, 2012; pp. 397–403. [Google Scholar] [CrossRef]
- Wang, Y.F.; Dong, J.J.; Cheng, Q.G. Velocity-dependent frictional weakening of large rock avalanche basal facies: Implications for rock avalanche hypermobility? J. Geophys. Res. Solid Earth 2017, 122, 1648–1676. [Google Scholar] [CrossRef]
- Hayatdavoodi, M.; Ertekin, R.C. Review of Wave Loads on Coastal Bridge Decks. Appl. Mech. Rev. 2016, 68, 030802. [Google Scholar] [CrossRef]
- Douglass, S.L.; Chen, Q.; Olsen, J.M.; Edge, B.L.; Brown, D. Wave Forces on Bridge Decks; Final Report; Department of Transportation, Federal Highway Administration, Office of Bridge Technology: Washington, DC, USA, 2006. [Google Scholar]
- Mcpherson, R.L. Hurricane Induced Wave and Surge Forces on Bridge Decks. Doctoral Dissertation, Texas A&M University, College Station, TX, USA, 2008. [Google Scholar]
- Seiffert, B.R.; Hayatdavoodi, M.; Ertekin, R.C. Experiments and calculations of cnoidal wave loads on a coastal-bridge deck with girders. Eur. J. Mech.—B/Fluids 2015, 52, 191–205. [Google Scholar] [CrossRef]
- Istrati, D.; Buckle, I.; Lomonaco, P.; Yim, S. Deciphering the Tsunami Wave Impact and Associated Connection Forces in Open-Girder Coastal Bridges. J. Mar. Sci. Eng. 2018, 6, 148. [Google Scholar] [CrossRef]
- Xiang, T.; Istrati, D. Assessment of Extreme Wave Impact on Coastal Decks with Different Geometries via the Arbitrary Lagrangian-Eulerian Method. J. Mar. Sci. Eng. 2021, 9, 1342. [Google Scholar] [CrossRef]
- Huang, B.; Zhu, B.; Cui, S.; Duan, L.; Zhang, J. Experimental and numerical modelling of wave forces on coastal bridge superstructures with box girders, Part I: Regular waves. Ocean Eng. 2018, 149, 53–77. [Google Scholar] [CrossRef]
- Fang, Q.; Liu, J.; Hong, R.; Guo, A.; Li, H. Experimental investigation of focused wave action on coastal bridges with box girder. Coast. Eng. 2021, 165, 103857. [Google Scholar] [CrossRef]
- Chen, M.; Huang, B.; Yang, Z.; Ren, Q.; Zhu, B. The Influence of Lateral Restraining Stiffness on the Box-Girder Superstructure under Unbroken Solitary Waves. J. Mar. Sci. Eng. 2022, 10, 1019. [Google Scholar] [CrossRef]
- Yang, Z.; Huang, B.; Zhu, B.; Zhang, J.; Kang, A. Comparative Study of Tsunami-Like Wave-Induced Forces on Medium-Scale Models of Box Girder and T-Girder Bridges. J. Bridg. Eng. 2021, 26, 04020125. [Google Scholar] [CrossRef]
- Zhu, D.; Dong, Y.; Frangopol, D.M. Experimental and numerical investigation on wave impacts on box-girder bridges. Struct. Infrastruct. Eng. 2022, 18, 1379–1397. [Google Scholar] [CrossRef]
- Xu, G.; Cai, C.; Deng, L. Numerical prediction of solitary wave forces on a typical coastal bridge deck with girders. Struct. Infrastruct. Eng. 2016, 13, 254–272. [Google Scholar] [CrossRef]
- Gao, H.; Song, Y.; Fang, Q.; Li, S. Wave forces on box-girder-type bridge deck located behind trench or breakwater. Ocean Eng. 2021, 237, 109618. [Google Scholar] [CrossRef]
- Istrati, D. Large-Scale Experiments of Tsunami Inundation of Bridges Including Fluid-Structure-Interaction. Doctoral Dissertation, University of Nevada, Reno, Nevada, 2017. [Google Scholar]
- Huang, B.; Liao, L.; Ren, Q.; Cui, X.; Zhang, J.; Zhu, B. Fragility analysis of the box-girder coastal bridge with different connections subjected to extreme random waves. Ocean Eng. 2022, 245, 110580. [Google Scholar] [CrossRef]
- Rahman, S.; Khan, M.T.R. Physical assessment of wave forces on bridge girder impacted by potential tsunami hazard. ISH J. Hydraul. Eng. 2022, 28, 72–78. [Google Scholar] [CrossRef]
- Xiao, L.; Ward, S.N.; Wang, J. Tsunami Squares Approach to Landslide-Generated Waves: Application to Gongjiafang Landslide, Three Gorges Reservoir, China. Pure Appl. Geophys. 2015, 172, 3639–3654. [Google Scholar] [CrossRef]
- Wang, J.; Ward, S.N.; Xiao, L. Numerical modelling of rapid, flow-like landslides across 3-D terrains: A Tsunami Squares approach to El Picacho landslide, El Salvador, September 19, 1982. Geophys. J. Int. 2015, 201, 1534–1544. [Google Scholar] [CrossRef]
- Ward, S.N.; Day, S. Particulate kinematic simulations of debris avalanches: Interpretation of deposits and landslide seismic signals of Mount Saint Helens, 1980 May 18. Geophys. J. Int. 2006, 167, 991–1004. [Google Scholar] [CrossRef]
- Ward, S.N.; Day, S. Tsunami balls: A granular approach to tsunami runup and inundation. Commun. Comput. Phys. 2008, 3, 222–249. [Google Scholar]
- Ward, S.N.; Day, S. THE 1958 LITUYA BAY LANDSLIDE AND TSUNAMI—A TSUNAMI BALL APPROACH. J. Earthq. Tsunami 2010, 4, 285–319. [Google Scholar] [CrossRef]
- Wang, J.; Ward, S.N.; Xiao, L. Tsunami Squares modeling of landslide generated impulsive waves and its application to the 1792 Unzen-Mayuyama mega-slide in Japan. Eng. Geol. 2019, 256, 121–137. [Google Scholar] [CrossRef]
- Wang, J.; Xiao, L.; Ward, S.N. Tsunami Squares modeling of landslide tsunami generation considering the ‘Push Ahead’ effects in slide/water interactions: Theory, experimental validation, and sensitivity analyses. Eng. Geol. 2021, 288, 106141. [Google Scholar] [CrossRef]
- Wang, J.; Xiao, L.; Ward, S.N.; Du, J. Tsunami Squares modeling of the 2007 Dayantang landslide generated waves considering the effects in slide/water interactions. Eng. Geol. 2021, 284, 106032. [Google Scholar] [CrossRef]
- Mizoguchi, K.; Hirose, T.; Shimamoto, T.; Fukuyama, E. Reconstruction of seismic faulting by high-velocity friction experiments: An example of the 1995 Kobe earthquake. Geophys. Res. Lett. 2007, 34, L01308. [Google Scholar] [CrossRef]
- Togo, T.; Shimamoto, T.; Ma, S.; Hirose, T. High-velocity frictional behavior of Longmenshan fault gouge from Hongkou outcrop and its implications for dynamic weakening of fault during the 2008 Wenchuan earthquake. Earthq. Sci. 2011, 24, 267–281. [Google Scholar] [CrossRef]
- Yang, C.M.; Yu, W.L.; Dong, J.J.; Kuo, C.Y.; Shimamoto, T.; Lee, C.T.; Togo, T.; Miyamoto, Y. Initiation, movement, and run-out of the giant Tsaoling landslide—What can we learn from a simple rigid block model and a velocity-displacement dependent friction law? Eng. Geol. 2014, 182, 158–181. [Google Scholar] [CrossRef]
- Li, P.; Mao, Y.; Dong, Z.; Wei, H. Study on flood action mechanism and flood resistance of highway girder bridge superstructure. Eng. Mech. 2020, 37, 217–223. [Google Scholar]
- Shoji, G.; Moriyama, T. Evaluation of the Structural Fragility of a Bridge Structure Subjected to a Tsunami Wave Load. J. Nat. Disaster Sci. 2007, 29, 73–81. [Google Scholar] [CrossRef]
- Balomenos, G.P.; Padgett, J.E. Fragility Analysis of Pile-Supported Wharves and Piers Exposed to Storm Surge and Waves. J. Waterw. Port Coast. Ocean Eng. 2018, 144, 04017046. [Google Scholar] [CrossRef]
- Sun, Q.; Xie, X.; Wu, S. Submarine landslides in the northern South China Sea: Characteristics, geohazard evaluation and perspectives. Earth Sci. Front. 2021, 28, 258–270. [Google Scholar]
- Li, W.; Wu, S.; Völker, D.; Zhao, F.; Mi, L.; Kopf, A. Morphology, seismic characterization and sediment dynamics of the Baiyun Slide Complex on the northern South China Sea margin. J. Geol. Soc. 2014, 171, 865–877. [Google Scholar] [CrossRef]
- Sun, Q.; Alves, T.; Xie, X.; He, J.; Li, W.; Ni, X. Free gas accumulations in basal shear zones of mass-transport deposits (Pearl River Mouth Basin, South China Sea): An important geohazard on continental slope basins. Mar. Pet. Geol. 2017, 81, 17–32. [Google Scholar] [CrossRef]
- Wang, L.; Wu, S.-G.; Li, Q.-P.; Wang, D.-W.; Fu, S.-Y. Architecture and development of a multi-stage Baiyun submarine slide complex in the Pearl River Canyon, northern South China Sea. Geo-Marine Lett. 2014, 34, 327–343. [Google Scholar] [CrossRef]
- Sun, Q.; Cartwright, J.; Xie, X.; Lu, X.; Yuan, S.; Chen, C. Reconstruction of repeated Quaternary slope failures in the northern South China Sea. Mar. Geol. 2018, 401, 17–35. [Google Scholar] [CrossRef]
- GEBCO Compilation Group (2022). GEBCO 2022 Grid. 2022. Available online: https://www.gebco.net/data_and_products/historical_data_sets/#gebco_2022/ (accessed on 12 October 2022).
- Liu, W.; He, S.; Li, X.; Xu, Q. Two-dimensional landslide dynamic simulation based on a velocity-weakening friction law. Landslides 2016, 13, 957–965. [Google Scholar] [CrossRef]
- Hayashi, H. Study on tsunami wave force acting on a bridge superstructure. Kozo Kogaku Ronbunshu A. J. Struct. Eng. 2014, 60, 45–58. [Google Scholar]
- Huang, B.; Zhu, B.; Cui, S.; Duan, L.; Cai, Z. Influence of Current Velocity on Wave-Current Forces on Coastal Bridge Decks with Box Girders. J. Bridg. Eng. 2018, 23, 04018092. [Google Scholar] [CrossRef]
- Lum, L. Assessment of the Vulnerability of Oahu’s Coastal Bridges to Storm Waves and Tsunami Inundation. Doctoral Dissertation, University of Hawaii at Manoa, Honolulu, HI, USA, 2011. [Google Scholar]
- Hayatdavoodi, M.; Ertekin, R.C.; Robertson, I.N.; Riggs, H.R. Vulnerability assessment of coastal bridges on Oahu impacted by storm surge and waves. Nat. Hazards 2015, 79, 1133–1157. [Google Scholar] [CrossRef]
- Archetti, R.; Lamberti, A. Assessment of Risk due to Debris Flow Events. Nat. Hazards Rev. 2003, 4, 115–125. [Google Scholar] [CrossRef]

| Number | Bearing Reaction (kN) | Number | Bearing Reaction (kN) | Number | Bearing Reaction (kN) |
|---|---|---|---|---|---|
| B1-1 | 5359.8 | B2-1 | 14,124.5 | B3-1 | 12,357.8 |
| B1-2 | 5357.0 | B2-2 | 14,123.2 | B3-2 | 12,399.6 |
| B4-1 | 12,136.2 | B5-1 | 12,817.5 | B6-1 | 4536.1 |
| B4-2 | 12,559.7 | B5-2 | 13,044.5 | B6-2 | 4376.1 |
| Parameter | BSC-1 | BSC-2 | BSC-3 |
|---|---|---|---|
| Maximum thickness/m | 188.7 | 296.8 | 359.1 |
| Area/km2 | 4076.1 | 4155.9 | 4836.6 |
| Volume/km3 | 324.3 | 405.6 | 838.7 |
| Case | Maximum Velocity (m/s) | Maximum Coverage Area (km2) | ||||
|---|---|---|---|---|---|---|
| BSC-1 | BSC-2 | BSC-3 | BSC-1 | BSC-2 | BSC-3 | |
| Velocity-weakening friction model | 14.55 | 15.24 | 23.87 | 5894 | 6739 | 10,524 |
| Static friction model | 14.05 | 14.71 | 23.29 | 5648 | 6505 | 9969 |
| Relative difference | 3.47% | 3.44% | 2.44% | 4.17% | 3.47% | 5.27% |
| Landslide Motion | Maximum Wave Height (m) | Maximum Wave Velocity (m/s) | ||
|---|---|---|---|---|
| A1 | A2 | A1 | A2 | |
| BSC-1V | 5.02 | 3.30 | 1.14 | 6.04 |
| BSC-1S | 4.82 | 3.06 | 0.99 | 5.83 |
| RVS | 3.97% | 7.28% | 13.14% | 3.45% |
| BSC-2V | 6.44 | 3.49 | 1.46 | 5.93 |
| BSC-2S | 6.15 | 3.16 | 1.31 | 5.72 |
| RVS | 4.53% | 9.19% | 10.26% | 3.58% |
| BSC-3V | 20.85 | 6.45 | 3.45 | 8.05 |
| BSC-3S | 20.11 | 6.46 | 3.12 | 7.83 |
| RVS | 3.57% | −0.06% | 9.63% | 2.77% |
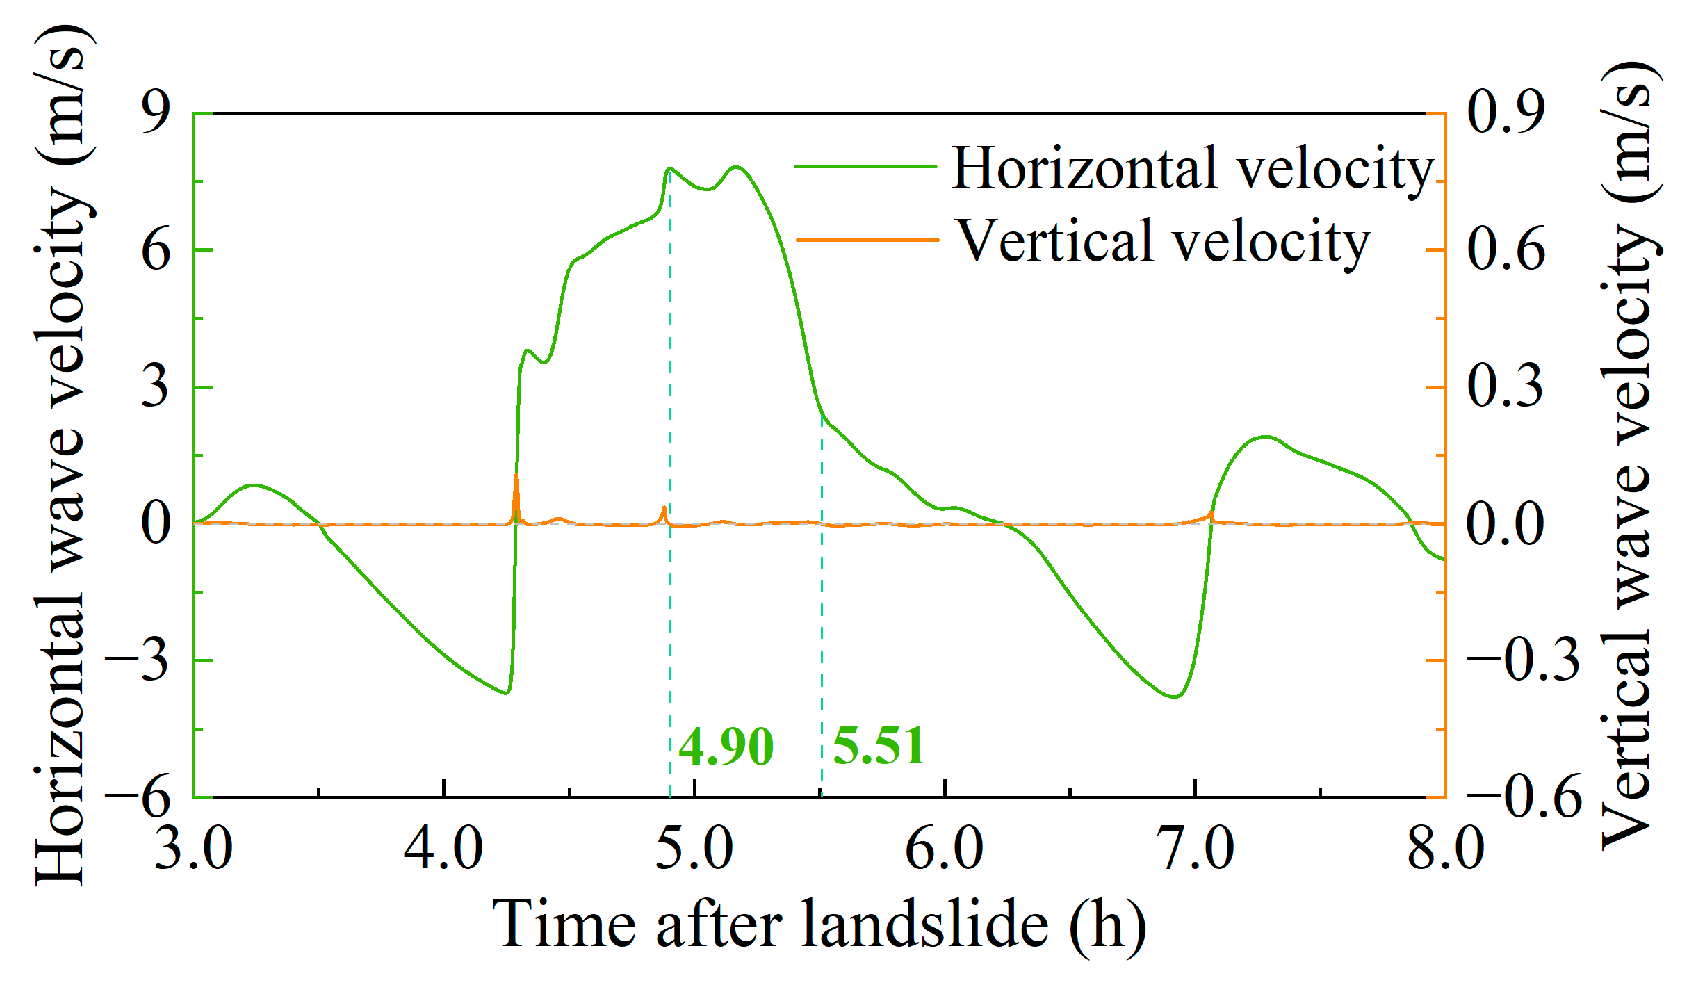
| Time (h) | Vertical Force/kN | Horizontal Force/kN | Ratio of Total Vertical to Horizontal Force | ||||
|---|---|---|---|---|---|---|---|
| S1 | S2 | Total | S1 | S2 | Total | ||
| 4.90 | 6440.5 | 148.9 | 6589.4 | 3633.1 | 324.1 | 3957.2 | 1.665 |
| 5.51 | 8049.1 | 663.3 | 8712.5 | 970.1 | 172.0 | 1142.0 | 7.629 |
Disclaimer/Publisher’s Note: The statements, opinions and data contained in all publications are solely those of the individual author(s) and contributor(s) and not of MDPI and/or the editor(s). MDPI and/or the editor(s) disclaim responsibility for any injury to people or property resulting from any ideas, methods, instructions or products referred to in the content. |
© 2023 by the authors. Licensee MDPI, Basel, Switzerland. This article is an open access article distributed under the terms and conditions of the Creative Commons Attribution (CC BY) license (https://creativecommons.org/licenses/by/4.0/).
Share and Cite
Han, W.; Xu, X.; Wang, J.; Xiao, L.; Zhou, K.; Guo, X. Safety Assessment of Coastal Bridge Superstructures with Box Girders under Potential Landslide Tsunamis. J. Mar. Sci. Eng. 2023, 11, 1062. https://doi.org/10.3390/jmse11051062
Han W, Xu X, Wang J, Xiao L, Zhou K, Guo X. Safety Assessment of Coastal Bridge Superstructures with Box Girders under Potential Landslide Tsunamis. Journal of Marine Science and Engineering. 2023; 11(5):1062. https://doi.org/10.3390/jmse11051062
Chicago/Turabian StyleHan, Wanshui, Xin Xu, Jiajia Wang, Lili Xiao, Kai Zhou, and Xuelian Guo. 2023. "Safety Assessment of Coastal Bridge Superstructures with Box Girders under Potential Landslide Tsunamis" Journal of Marine Science and Engineering 11, no. 5: 1062. https://doi.org/10.3390/jmse11051062