1. Introduction
The rotation of the Earth has been the subject of many studies ranging from astronomy to geophysical flows. Its importance for life cannot be underestimated, as it governs the major displacements of weather systems in the atmosphere (together with the effects of the sun). Likewise, in the ocean, the large-scale near-surface circulation of water flows is modified by the Earth’s rotation (and by wind, i.e., the sun).
An established means to study varying deep-ocean flows is using the Eulerian principle of fixing instrumentation in space on an underwater mooring cable and registering the passing flow at regular intervals in time [
1,
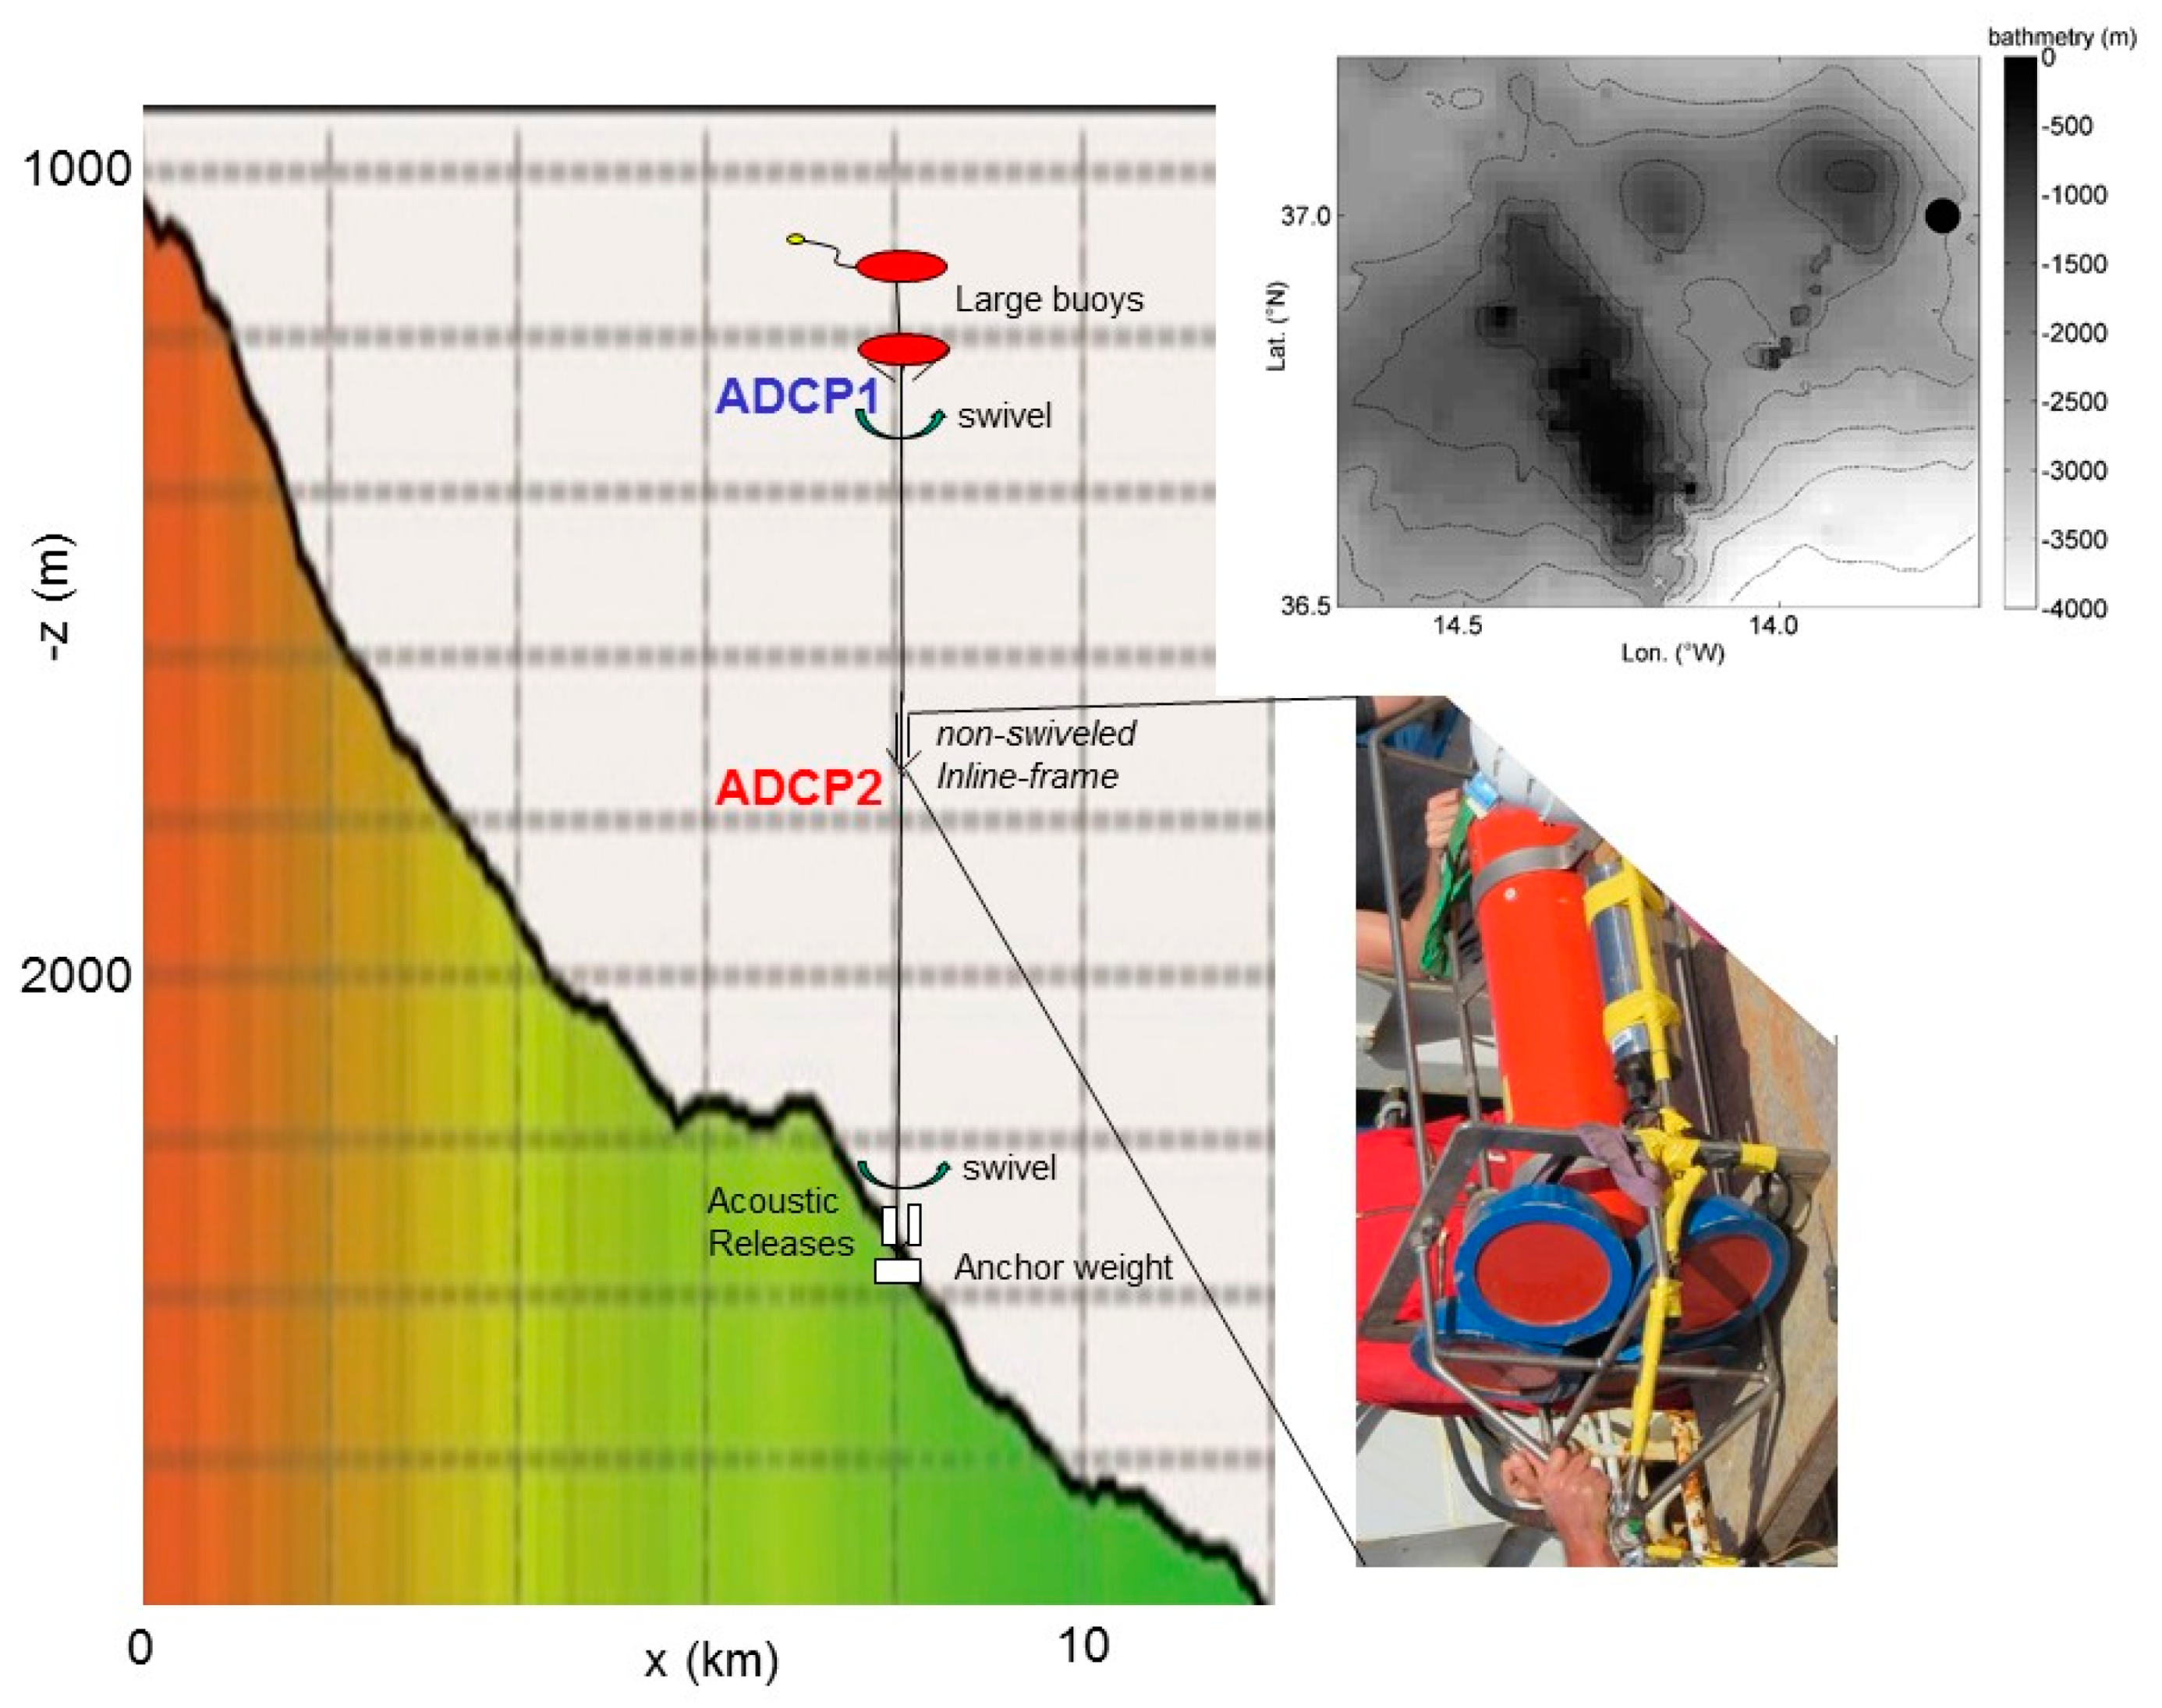
2]. Records of physical variables, such as pressure, temperature and current velocity, can be registered in remote areas by means of self-contained instrumentation with power and data storage in water-tight and pressure-resistant containers that remain on site for months. Such moorings use underwater buoys for keeping the instrumented cable taut and acoustic release devices for recovery, leaving the anchor weight at the seafloor.
Mechanical engineering efforts for good sub-surface mooring design [
3] have resulted in taut-wire moorings with cable tensions O(1–10 kN) that deflect less than O(1 m) vertically and O(10 m) horizontally over O(1000 m) lengths under deep-ocean flow conditions. Such moorings vibrate under water-flow drag, the particular cable flexibility allowing some elastic stretching to prevent breaking under normal tension loads. As the ocean is never motionless, such vibrations are also quasi-permanent in the deep. High-frequency O(1 s
−1) vibrations cause some deterioration of oceanographic signals, which, however, are generally found at much lower frequencies O(10
−3–10
−4 s
−1) than the vibrations. Prominent deep-ocean signals include tides and inertial motions at the frequency of Coriolis parameter
f = 2
Ωsin
φ, with
Ω denoting the Earth’s angular velocity and
φ the latitude. The vertically stable density-stratified ocean supports freely propagating ‘internal waves’ in a frequency band between
f and buoyancy frequency
N, with typical values of
N = 10
f.
At mid-latitudes, semidiurnal (tidal) frequencies are >
f and within the internal wave band, while diurnal frequencies are <
f and are outside this band [
2]. In the ocean, long barotropic surface-gradient-driven tidal waves generally provide highly deterministic, predictable narrow-band signals that characterize records from instrumentation like moored pressure sensors. Shorter baroclinic internal tidal waves provide more broadband signals that are less predictable due to their interactions with background flows and stratification and characterize the records from instrumentation, like temperature sensors and, to a lesser extent, current meters [
4,
5,
6,
7]. In strongly stratified waters, near-inertial (near-
f) motions are mainly horizontal and are easily detectable in current meter records but less or not detectable in temperature and pressure records that are most sensitive to vertical (displacement) motions [
8].
In this paper, an unusual record from a tautly moored pressure sensor is presented that contains sharp, very narrow band peaks of deterministic signals at the sub-harmonics of a near-inertial frequency. The record is compared with that from other pressure instrumentation in the same mooring and with those from other variables like temperature, current velocity components and vertical current differences (shear). The possible effects of cable dynamics and Earth rotation are discussed.
3. Observations
Three major vibrations and rotations are recognized in the mooring system. Typical water-flow speeds of
U = 0.2 m s
−1 cause vibrations in the tensioned mooring cable due to vortex shedding at the Strouhal frequency ω
s = StU/D = 6 s
−1 [
11]. Here, Strouhal number St = 0.2, which is common for open-ocean Reynolds numbers (Re) between 10
4 < Re < 10
6 that represent turbulent flows. The inline frame with ADCP2 has a diameter of approximately
D ≈ 0.25 m and will cause vibrations at ω
s ≈ 0.16 s
−1. These vibrations may transfer to tension variations in the cable via rotation, as the inline frame is non-swiveled. Although it is unclear at what rate the inline frame rotates, swiveled inline current meters in previous moorings typically swing at angular speeds of 0.02–0.1 s
−1 [
10]. The rotations of the top buoys are unlikely transmitted in the cable, as they are separated by swivels. Unfortunately, all these vibrations and rotations are not directly measured by the ADCPs because of their relatively slow sampling rate of once per 900 s. The deep-ocean water flow varies at many frequencies, of which the semidiurnal principal lunar tidal M
2 is the dominant one, at 1.405 × 10
−4 s
−1, and vertical water-flow differences over scales of 50 m are dominant at near-inertial f* = 9.52 × 10
−5 s
−1, as will be shown below. These (varying) water flows are the main drivers of drag on the mooring, and thus variations therein.
The mooring cable thus experiences vibrations and rotations with periods that vary over four orders of magnitude. Some of the variations in motions are well-predictable, ‘deterministic’, like those for barotropic surface tides and, to a certain extent, Strouhal vibrations, although these vibrations vary their central frequency depending on the water-flow speed. Others are more erratic, intermittent and poorly predictable, like those associated with internal waves and turbulence. Baroclinic internal tidal and near-inertial waves have approximately the same finite bandwidth, which is attributed to common background variations [
12]. The slopes of Mount Josephine are known for the vigorous breaking of internal tides in the lower few 100 m above the seafloor [
13].
The four-month mean spectra of unfiltered full data records of various parameters from ADCP-sensors demonstrate the common dominant variance peaking at semidiurnal frequencies D
2 (
Figure 2a). Some parameters show a smaller, relative peak at, or just higher than,
f. A small but dominant near-inertial peak blue-shifted from f is found in a record of |dz| = 50-m-scale vertical shear
S = [d
u/dz, d
v/dz]. Bandpass-filtered near-inertial shear-magnitudes are |
Sf| < 8 × 10
−4 s
−1, which are generated by differences in water-flow velocities O(0.01 m s
−1). This spectral shear peak confirms the relatively small vertical length scale of internal near-inertial motions [
14]. Pressure is the only parameter that shows a relatively large peak at diurnal frequencies D
1. With temperature, pressure also shows a relative peak at quarter-diurnal higher tidal harmonic frequencies. The water-flow ADCP data are too noisy to distinguish significant higher frequency motions. No peak is observed in any variable at f
h, the horizontal Coriolis parameter that may govern vertical motions in near-homogeneous waters [
14]. Near-homogeneous layers may occur in the present data but are not common as the mean
N = 12–20
f [
13].
An unusual, non-oceanographic, as will be explained below, sequence of peaks is observed in the spectrum of mid-cable pressure variance p22. In fact, in comparison with the upper-pressure variance p12, p22 >> p12 at all frequencies except for the (largest) D2-peak that is indistinguishable between the two pressure spectra. Additionally, in p22, relative peaks appear in the mid-cable spectrum at near-inertial frequency f* = 1.085f, at which also 50 m shear peaks, a larger one at D1, and especially at sub-harmonics f*/2 and f*/4, the largest peak of the sequence. Outside the sharp sub-harmonic near-inertial peaks, p22 also shows more variance distributed over broader frequency ranges in comparison with p12. This broader-range variance is associated with the different mounting of the two ADCPs. The ADCP1 in a leveling and swiveled heavy buoy that can quickly release any build-up torsion is less prone to vertical (pressure) excursions than the ADCP2 in a non-swiveled mid-cable weighted frame, which may also build up some torsion before releasing at swivels 600 m above and below. Outside the tidal peaks, the p12 spectrum basically represents instrumental white noise as its level is horizontal with almost zero average slopes. The larger level of broadband variance in p22 reflects 1 m vertical motions, also near the Nyquist (highest spectral) frequency. (Here and henceforth, vertical excursions are used as a proxy for pressure variations. In water, a vertical variation of 1 m is nearly equivalent to a pressure variation of 104 N m−2.)
Although sharp, sub-harmonic near-inertial relative peaks are only found large in p22, there are small elevations in variance around these frequencies in the mid-cable T-spectrum. However, these small elevations are distributed over broader frequency bands like internal tides instead of the sharp peaks in p22, representing quasi-deterministic narrowband signals like surface tides. The kinetic energy of the water flow and shear of the vertical flow differences do not show elevated variance around the sub-harmonic near-inertial frequencies.
Nearly raw, weakly smoothed [
1] pressure spectra (
Figure 2b; in fundamental bandwidth-preserving form) at diurnal (surface) tidal constituent frequencies of the principal lunar O
1 (6.76 × 10
−5 s
−1) and lunar-solar declinational K
1 (7.29 × 10
−5 s
−1) [
15] show distinguishable narrowband relative peaks in p
12 in addition to the three peaks at main semidiurnal frequencies. In contrast, the dominant diurnal peak in p
22 is at σ = 7.14 × 10
−5 s
−1 = f*/4 + f*/2 = 3f*/4, which suggests an interaction between motions at the two main sub-harmonics of f* rather than excitation from diurnal tides O
1 and K
1, which have significantly distinguishably different frequencies. At semidiurnal 3f*/2, which is indistinguishable from the non-tidal constituent (M
2 + S
2)/2 centered between M
2 and S
2, no peak is observed at all. It is noted that 3f*/2 = 3f*/4 + f*/2 +f*/4, which may represent a sub-harmonic disintegration.
Comparison with the peaks at highly deterministic diurnal and semidiurnal tidal frequencies demonstrates that the f*/4- and f*/2-peaks in p
22 are as narrowband as M
2, K
1 and O
1 and narrower than principal solar S
2 and lunar elliptical N
2. In the diurnal band, K
1 is one effective fundamental bandwidth significantly separated from 3f*/4. The f*-sub-harmonics mid-cable pressure variations are thus not associated with oceanographic internal wave motions because they are persistent throughout the entire four-month record rather than being 3–7-day intermittent [
6,
12].
In the time series that is low-pass filtered with a cut-off at 5.8 × 10
−5 s
−1 < D
1 <
f, hence ‘sub-inertial’ daily-averaged, to remove noise, turbulence, tides and internal waves, the distinction between the two pressure records is also obvious (
Figure 3). The time series p
1 shows much smaller amplitudes and a slow trend over the four-month record compared with p
2. The slow trend in p
1 is either due to a settling of the piezo-element of the pressure sensor or of the strands of the mooring cable, as values decrease with time, suggesting that the sensor gets higher in the water column. There is no particular association with
T, which decreases over the first month and then increases during the second half of the record. However, this trend in
T is also visible in p
2. In addition to the slow monthly variation, the T-record also shows a small variation with a periodicity of about 3 days.
In contrast with
T and p
1, three-day periodicity dominates p
2. It reflects the large deterministic peak in the p
22-spectrum at f*/4. Temperature and pressure move in and out of phase, which indicates the more intermittent character of the sub-inertial T-data compared with the highly deterministic sub-inertial p
2-data. The p
2 shows a sharp dip every 3 days (so that the instrument went up), followed by a longer duration of a higher level with a smaller-amplitude secondary wave. The secondary wave and the dip reflect the spectral peak at f*/2. As this persists throughout the four-month record, the f*/4- and f*/2-motions are strictly in phase. Per a three-day period, the equivalent vertical excursion in p
2 between crest and trough amounts to about 1.0 m, i.e., an amplitude of 0.5 m. The η-amplitude-ratio of f*/2 over f*/4 is about 0.73, commensurate with their p
22-variance ratio (
Figure 2b).
The three-day T-variations are about 0.1 °C between the crest and trough and are more variable whilst lacking a strong one-sided (downward) peak. This implies no direct link between this T-variation and a physical vertical motion of 1 m going upward. A 1 m vertical excursion corresponds with a temperature increase of 2 × 10⁻³ °C under the local thermal stratification. The T-variation of 0.1 °C is also not related to a direct pressure effect on the T-measurement, as the 1 m upward motion implies a temperature decrease of −1.5 × 10⁻⁴ °C following the local adiabatic lapse rate. The observed three-day T-variation of 0.1 °C corresponds with oceanographic >10 m vertical isotherm internal wave excursions, which are much larger than a physical 1 m excursion of the mid-cable ADCP2. The pressure and temperature records are thus only indirectly related. As no oceanographic explanation can be given for the sub-harmonic deterministic-as-tides spectral peaks in p2, mechanical explanations are proposed below.
4. Discussion
The oceanographically anomalous pressure observations have been made using a sensor mounted on a heavy non-swiveled frame halfway elastic steel cables on a taut deep-ocean mooring. Given that the observations are only made under pressure implies that motions must have a vertical component with unknown horizontal components. In comparison with the upper-pressure sensor in the swiveled top buoy that is rotationally decoupled from the cable, the mid-cable pressure sensor shows higher variance throughout its entire data record and at all frequencies, except at semidiurnal tidal frequencies that are dominated by surface pressure (sea level) variations. This higher variance at p2 implies more vertical motions, possibly also at the Strouhal-frequency, which is unresolved by the sampling.
Although the mooring cable is less moved by water flow at inertial periodicity compared to larger amplitude flow at tidal and sub-inertial periodicities, it may feel some effects of the water-flow difference with the vertical as the 50 m shear peaks at f*. This may be by imposing variable tension on the cable via differential water-flow drag, but this is smaller than 1 N. Recall that in non-rotating equilibrium, the tension in the cables just above and below the inline-frame changes by about 1 kN due to the frame’s weight.
The tilt angle of ADCP2 is up to 40% larger than for ADCP1, which can be related to the observation that the velocity fluctuations are larger in the deeper part, together with the mooring floatation being concentrated in two buoys near the top of the cable. The maximum tilt angle for ADCP2 is about 1°. Assuming a straight cable, this corresponds to a relative altitude change of 1.5 × 10⁻⁴, leading to 0.09 m over the 600 m-long cables. This does not explain the vertical variations of about 1 m.
However, the cable is not straight due to the drag force on the cable itself, produced by a water flow of 50% larger speed and differently directed near the seafloor than mid-depth. Such a vertical variation in internal tidal flow is associated with the sloping seafloor of the seamount [
16]. The dominant motions that deform the (tensioned and elastic) mooring cable by flow drag are at semidiurnal tidal frequencies (
Figure 2). Observations also indicate a baroclinic semidiurnal tidal phase variation of 90° over a height of 600 m [
16]. Such phase and amplitude variations could cause a vertical displacement around mid-cable O(1) m. Instead of a vertical phase difference that is fixed in time, the resulting helix shape of the mooring cable may also be influenced by semidiurnal constituents that vary in amplitude and phase over the vertical in all components, which causes the polarization (ellipse traverse) of horizontal motions to vary with depth and time. Such is commonly observable in the open ocean, e.g., [
17], and may induce further unknown variation in height per oscillation.
ADCP currents from arbitrary good data at z = −2220 and −1620 are taken and band-pass filtered over the semidiurnal band. Thus, not the individual harmonic constituents are separated, but the entire semidiurnal band, between about 0.95N
2 and 1.05S
2. Of these signals, the vertical water-flow component differences are computed. The resulting “shear” modulus of semidiurnal vertical water-flow difference |Δ
u|
SD shows considerable variability over different periods, including 3-day periodicities (
Figure 4a). Demodulating this signal at f*/4 and f*/2 gives a combined signal that corresponds in time with the observed band-pass filtered mid-cable pressure signal (between 0.1 and 0.8 cpd). The lowest pressure (
Figure 4b) occurs when the shear is lowest, which is expected for most upright mooring when the flow drag is low. However, the combined asymmetric effect in pressure is not precisely mimicked. Only by reversing (multiplying by −1) the demodulated shear and shifting in time by 1.2 days is a correct correspondence between pressure and shear obtained (
Figure 4b).
Although some correspondence is found in the large-scale variations, such as a minimum of variations in both signals around day 180, no attempt was made to ‘best-fit’ the band-pass filtered p2 and demodulated shear signals. Over a larger vertical range, the water-flow difference becomes somewhat less, which implies that there seems to be some compensation for the intensified near-bottom currents away from the seafloor. As no information is available on the precise response in the cable due to integrated shear, and noting that only two frequencies have been used in the demodulation, it is not surprising that a precise correspondence is not found.
If applicable, the explanation is that the mooring shape under semidiurnal flow varies in the vertical because the shear varies with time. The shear varies because the semidiurnal lunar and solar (and perhaps minor other) constituents show varying vertical phase differences so that the ellipse polarization varies with time. As it happens, this triggers a modulation between M2 and S2, i.e., their center frequency (M2 + S2)/2, which is indistinguishable from 3f*/2 in our data. Indeed, the semidiurnal band is rather broadband-filled in vertical water-flow differences over 600 m. How this precisely translates in the vertical motions of the mid-cable pressure is unclear, thereby smoothing out small-scale variations and providing a resonant response at some particular frequencies f*/4, f*/2 and 3f*/4, but not 3f*/2. Perhaps 3f*/2 simply disintegrates by draining its energy, as the other three frequencies add up to 3f*/2. To this, one can add that the short-scale (50-m) shear peaks at f*, which may explain a somewhat larger peak observed in p2 at f*/2 than is expected from a rigid sloping sequence (−2 in the log–log plot) from 3f*/2 via 3f*/4 to f*/4.
As for the Coriolis effect, the mooring system can be considered as a big pendulum upside down, where buoyancy replaces gravity. Then, the Coriolis force should produce a rotation of the oscillation direction with frequency
f, like in a Foucault pendulum [
18]. The principle of the pendulum evidencing the Earth’s rotation is based on the exchange of angular momentum via the Coriolis effect [
19] between a relatively rapidly oscillating device, the pendulum, in a slowly rotating frame of reference, the Earth. The exchange results in the rapid pendulum oscillation being added by pendulum rotation frequency F
p =
f/2, which is half the local inertial frequency. However, such a pendulum requires a very stable rapid oscillation. Any perturbation or damping effect would blur the effect [
20], also summarized in [
21]. In the underwater mooring system, the hydrodynamic friction is large, with noisy perturbations. Furthermore, the motion is mainly horizontal, with a vertical excursion limited to a few cm. Finally, it has no a priori reason to be shifted to f*/2 = 1.085
f/2, unless the sub-inertial motions governing relative vorticity play a role.
In addition to pendulums, other devices have been constructed to demonstrate Foucault’s principle. Wheatstone introduced a tabletop version to demonstrate the rotational effect of a turntable rotating at a different frequency than that of the Earth by the suspension of a spring between the rotating table and a vertical arc [
22]. Equivalent versions include placing a weight as a bob in the middle of two springs [
23]. The ensemble of springs and weight may be put vertically under rectangular support at some distance off the rotational axis. Although this somewhat resembles the set-up of the mooring with the inline-frame ADCP2 as a bob between two elastic cables, no Earth-rotation-equivalent for such Foucault–Wheatstone devices are known to the author.
5. Concluding Remarks
The oceanographically anomalous observations have been made using a pressure sensor suspended in the middle of an 1170 m-long elastic cable under considerable tension. The vertical excursions of the nearly 1 kN weighing inline frame are about 1 m crest-trough and have been observed at sub-inertial frequencies. These excursions can thus not be related to freely propagating internal waves that range between [
f, N], where
N >>
f [
14]. As the pressure variations are found to be highly deterministic at sub-harmonics of f*, they are distinctly different from M
2-f = 5.28 × 10
−5 s
−1 or M
2-f* = 4.55 × 10
−5 s
−1. Thus, they do not represent common strongly nonlinear interactions between semidiurnal tidal and (near-)inertial internal-wave motions. This is also because interaction peaks would be more broadband and because the observations are not found in water-flow data. This lack of correspondence with known oceanographic internal wave properties thus points at other mechanical sources that somehow drive the system to resonance.
A primary question is whether f* = f
eff and, subsequently, what causes a rather deterministic quasi-permanent background relative vorticity (
Appendix A) in an oceanographic context. It may be associated with the seamount. Steady and persistent relative vorticity of sufficient strength may be plausible after being generated by the flow around the (large) seamount. This seems to appear in numerical model studies in which relative vorticity remained quasi-steady above a slope in the close vicinity of a seamount [
24,
25,
26].
Technically, the vertical excursions that are almost exclusively registered by the mid-cable pressure sensor are probably caused by differential shear deforming the mooring cable. However, why such pressure variations are not observed in the upper sensor remains to be investigated in the future. It may be that the (internal wave) shear compensates over the upper part. The integrated response of shear variations over the entire mooring cable is not resolved yet. Although swivels are applied 600 m above and below, torsion may locally build up and release to an unknown extent. Around mid-cable, high-frequency vibrations cause vertical excursions of 1 m of the 1 kN weighing bob that are not observed in the upper-pressure sensor and which yield the observed much noisier mid-cable pressure signal. Together with the vertical excursions in the direction of the cable, vibrations are expected in the horizontal plane. Oceanographically, a pressure sensor normally does not register quasi-horizontal inertial motions, cf. the p1-record (and >100 historic p-sensor records previously collected from various ocean moorings).
The mid-cable pressure observations from a non-swiveled inline frame show a resonant behavior at sub-inertial frequencies reminiscent of a Foucault–Wheatstone device, by chance and for the first sub-harmonic only. The unique mid-cable pressure observations indicate that taut-wire mooring cables behave more complexly than hitherto assumed. I invite colleagues to produce a model that suitably describes the observations.


