Article

Desalination Plant for Irrigation Purposes Driven by an Inland Floating Photovoltaic System

by
B. Del Rio-Gamero
1,*,
Edgar Rodríguez-López
2 and
Julieta Schallenberg-Rodríguez
1
1
Process Engineering Department, Industrial and Civil Engineering School, Universidad de Las Palmas de Gran Canaria, Las Palmas de Gran Canaria, 35001 Las Palmas, Spain
2
SATOCAN Group, Las Palmas de Gran Canaria, 35001 Las Palmas, Spain
*
Author to whom correspondence should be addressed.
J. Mar. Sci. Eng. 2023, 11(5), 905; https://doi.org/10.3390/jmse11050905
Submission received: 19 March 2023 / Revised: 15 April 2023 / Accepted: 19 April 2023 / Published: 23 April 2023
(This article belongs to the Special Issue The Use of Hybrid Renewable Energy Systems for Water Desalination)

Abstract

:
In places where water and land are scarce it is vital to look for innovative solutions that can ensure water production for agricultural purposes. This study considers the treatment of water using desalination processes to meet the quality requirements needed for irrigation purposes in agriculture. As the water is stored in a pond, an inland floating photovoltaic (FPV) system is proposed to meet the desalination energy demand. This system would enable energy production without using additional land that could otherwise be used for agricultural purposes. The use of FPV technology also reduces water evaporation, thus avoiding unnecessary energy consumption. To generate enough electricity to treat 12,000 m3/day of water, using an electrodialysis reversal desalination plant, a 1.85 MWp FPV farm is proposed. The results indicate that this FPV farm would generate 3,005,828 kWh per year while avoiding the emission of 58,300 tons of CO2 and the evaporation of 159,950 m3 of water during its 25-year lifetime. Such systems allow higher renewable penetration in the energy mix and preserve the original use of the land.

1. Introduction

In response to the challenge of climate change, several international and national roadmaps have been proposed to achieve zero net emissions by 2050 [1,2]. An important aspect for the attainment of this goal is the integration of renewable energy sources (RES) in electricity systems. Among RES, solar photovoltaic (PV) generation has experienced remarkable growth, increasing by 22% to exceed 1000 TWh in 2021 [3], based mainly on the decreasing price of the panels [4]. This cost saving has resulted in a reduction of 82% in the levelized cost of energy (LCOE) for large-scale PV plants over the period 2010–2019 [4]. The search for additional surface area for installation has led to growing interest in floating photovoltaic (FPV) systems. FPV has been presented as a new alternative that takes advantage of natural or artificial water bodies, providing them with a second use and avoiding the competition for land that could be used for other purposes. Although initially FPV was developed on inland water surfaces, such as lakes, more recently it has made the leap to the sea, and today a distinction is made between inland and offshore FPV systems [5]. Compared to its terrestrial counterpart, it offers advantages such as an increase in PV panel performance due to the cooling effect of the aquatic environment [6,7,8,9]. Quantified improvements have been reported reaching values of 10–12% performance increase compared to conventional PV systems [10,11]. In addition, inland FPV systems avoid losses of stored water by reducing evapotranspiration losses [6,9,12]. A clear example of this effect can be found in a study by Soltani et al. [13], in which a 70% loss in volume was avoided during the five years of the study. Among the most recent studies on this technology and its features are those developed by Manish Kumar et al. [14] in 2021 and Chao Ma & Zhao Liu in 2022 [15]. According to the latter authors, the global installed capacity for this technology was expected to rise to 4.6 GWp by the end of 2022, with China leading the market with 76% of installed capacity [15]. In the same year, Manoj Kumar et al. [16] published an advanced simulation tool specifically for FPV systems. Their paper also included a compilation of testing and analysis studies of FPV systems developed in different environmental conditions worldwide. Many systems have been installed in existing hydropower reservoirs [17,18]. This symbiosis is very positive, since periods of abundant solar energy tend to coincide with periods of low hydropower plant water flow; this therefore helps to meet peak demand, reduce power fluctuations and decrease the investment cost through the utilization of existing infrastructure [19]. Another interesting alternative is the potential integration of PV and aquaculture. Photovoltaic panels could serve as a shelter for fish in summer [20], with adjustments of the light source, light intensity and light duration to adapt to the photoperiod of fish [21]. They could also be used as the energy source for remote video surveillance purposes, or to power, for example, current, oxygen and wireless cage sensors [22]. Their latest and most popular use is in ponds that are in intensive cultivation areas where water is used for irrigation purposes. In this case, the energy is either used for small pumps [23,24,25] or directly discharged to the grid.
Islands tend to be areas where available space is limited, and electrical grid interconnections are uncommon. [26,27]. In fact, many of the more than 2200 inhabited islands of the European Union [28] use desalination (mainly reverse osmosis technology) to obtain the majority of their water resources [28]. This situation implies a clear increase in the islands’ electricity consumption [29]. Therefore, an attractive way to ensure a sustainable desalination process is to use RES to power desalination plants. Studies have been published involving the coupling to desalination plants of other offshore renewable technologies, such as offshore wind [30], wave energy [29,31,32] and tidal energy [33]. However, to our knowledge, this is the first time that a real case of a grid-connected desalination plant supplied by an FPV system has been studied.
This research studies the coupling, from an energetic point of view, between an FPV system and an electrodialysis reversal (EDR) desalination plant. It is proposed to place the FPV system on a pond used to supply irrigation water treated by the EDR plant. The main objective of the FPV generator will be to supply the electricity consumption of the plant. The simulations aim to evaluate the potential of FPV power generation as a sustainable system in terms of energy, water conservation and its techno-economic feasibility. As far as the authors are aware, no previous studies have been conducted on real-scale desalination plants driven by FPV. This is the challenge of the work presented in this paper.

2. Materials and Methods

The methodology used is divided into four sections. Firstly, an analysis is made of the criteria for siting of the system and the practical case study is defined (Section 2.1). This is followed by an analysis of the solar energy resource in the pilot area (Section 2.2). The installation design is then considered, taking into account the variety of available floating structures (Section 2.3). Finally, the coverage of the desalination plant electricity demand and its economic and environmental implications are analysed (Section 2.4). Figure 1 shows the flowchart of the entire methodology in detail.

2.1. Suitability Identification for Supplying a Desalination Plant Using FPV

The main conditions to select the desalination plant linked to a water body were: (i) areas where land use is highly competitive; (ii) location of an artificial water body that is intended for use for irrigation purposes but with insufficient water quality; (iii) location of an area with good solar resource and preferably where other renewable energies such as wind energy will not be viable (either because the wind resource is scarce or because wind deployment is restricted); (iiii) location unaffected by environmental constraints. It was also of interest that the operation of the desalination plant serves to regulate irrigation water demand given the importance of the water-energy nexus.
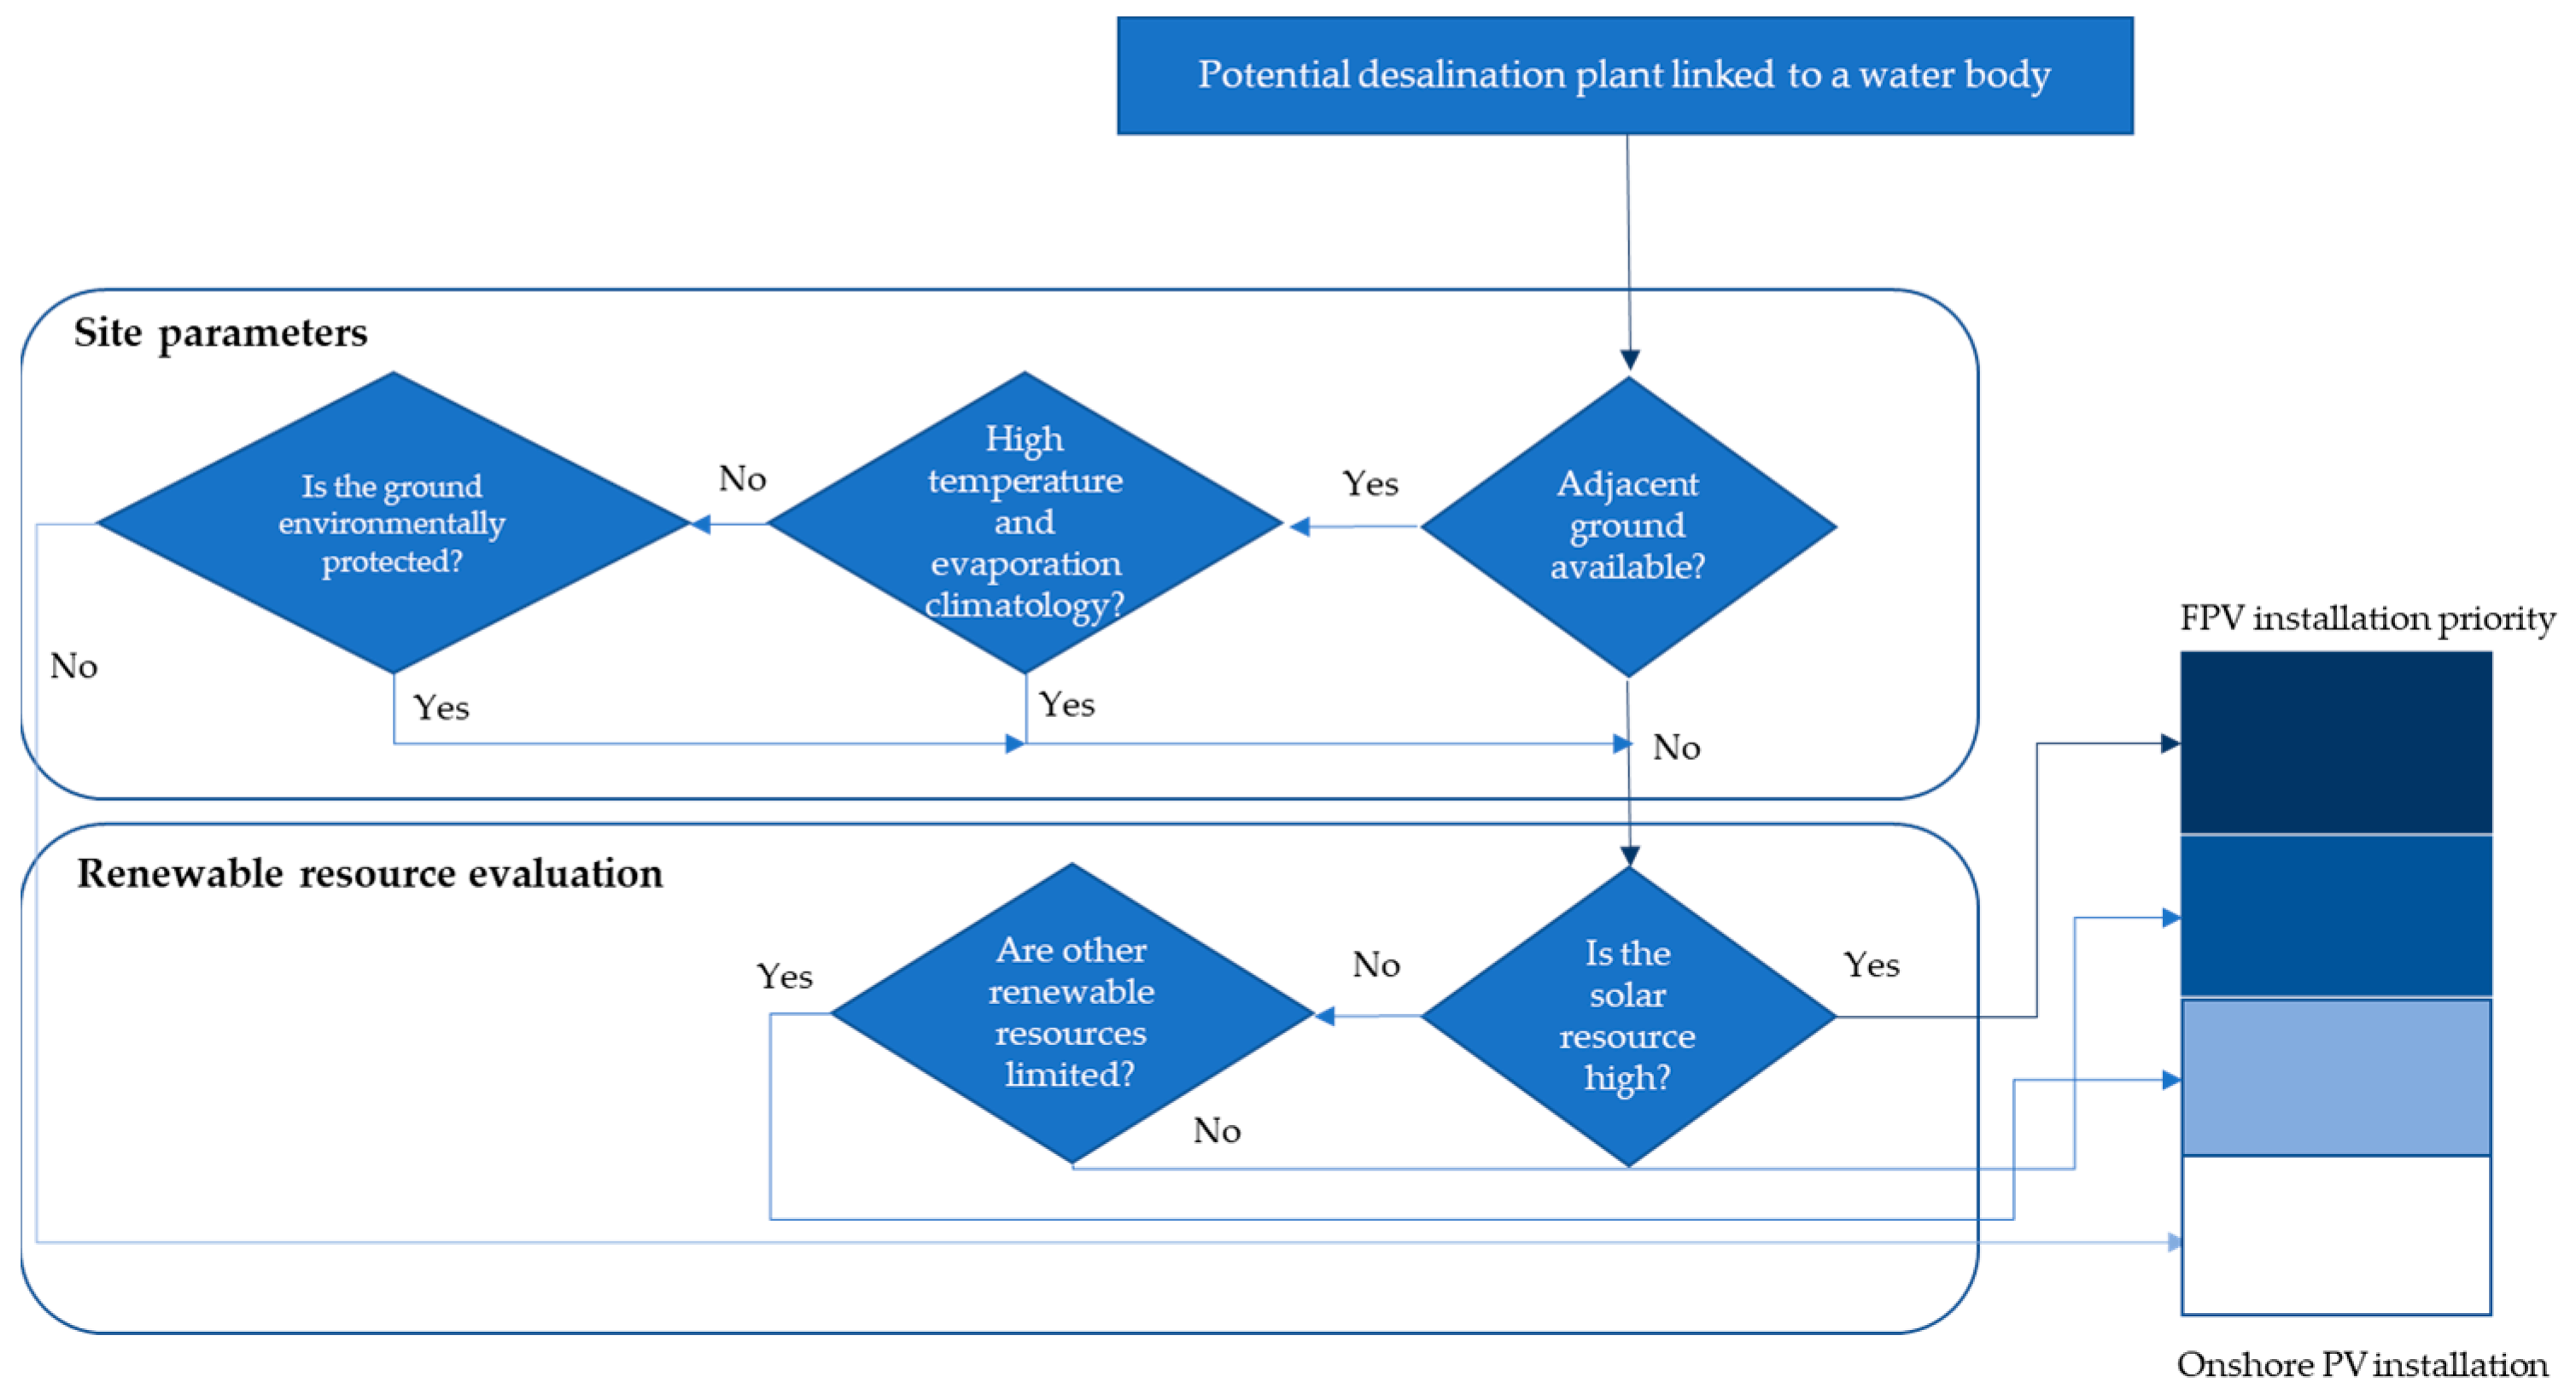
For a better understanding of the appropriate desalination plant selection, Figure 2 shows a logic diagram indicating the steps to be followed depending on the advancement of the decision-making process. This methodology can be replicated in any scenario obtaining different solutions depending on the characteristics of each area/region.

2.2. Renewable Resources Analysis

A detailed analysis of the solar energy resource in the pilot area was carried out. Among the various sources of resource data (satellite data, simulated data and pyranometer data), the most accurate data available for the location were obtained using the Photovoltaic Geographical Information System (PVGIS) tool [34]. This software, developed by the Joint Research Centre of the European Commission, allows the estimation of hourly-PV solar production for different systems and intervals.
The first step was to select a 6-year period (2010–2016) to determine the monthly and yearly average solar radiation (kWh/m2) and to select one average year, meaning a year with an average solar radiation (nor the highest neither the lowest). Then the hourly data for the selected year were extracted from PVGIS. These hourly data were then used to calculate the hourly production. This method avoids the potential loss of extreme data values from using the average values of the standard year.

2.3. FPV Selection

2.3.1. Floating Structure

The main selection criterion is the floating structure. This item is the crucial and differentiating element of this type of technology and is determinant in the subsequent decisions, with respect to other components such as the mooring system and the PV panels. In its selection, diverse factors were examined, including: (i) the buoyancy and safety of all the supported elements; (ii) the durability of the materials in a hostile environment and their non-toxicity to the aquatic environment; (iii) the flexibility of the structure in the face of water level variations, waves and aerodynamic forces. Finally, consideration was given to the simplicity of deployment and installation modularity.

2.3.2. PV System Design

The energy demand to be covered is the desalination plant demand, using as design criteria the monthly average of an annual period provided by the plant owner. With this information, together with the characteristics of the pond where the water is stored, the floating generator system elements were determined.
Equation (1) establishes the monthly PV power required to supply the existing demand. The power of the system is established according to the requirements of the highest demand month.
P i n s t a l l e d = E d e m a n d P R * R a d i a t i o n
where:
  • Pinstalled: peak power required to be installed in the PV system (kWp)
  • Edemand: energy demand to be supplied (kWh)
  • PR: Installation performance ratio (%)
  • Radiation: average monthly solar radiation (kWh/m2).
PR is calculated on a monthly baseline according to a combination of factors such as temperature losses, wiring losses, inverter performance and panel fouling, among others. To determine the thermal losses (Equation (2)), it was also necessary to establish the module operating temperature using Equation (3).
R T = 100 γ * ( T C e l l 25 )
T c e l l = T a + ( N O C T 20 ) 800 * S
where:
  • RT (%): power loss thermal coefficient provided by the manufacturer
  • γ: thermal coefficient of power loss, (γ = −0.352%/°CC), provided by the panel manufacturer in its data sheet
  • Tcell (°C): working temperature of the solar cell
  • Ta (°C): air temperature
  • NOCT: nominal operating cell temperature
  • S: average daily insolation (W/m2).
Air temperature and insolation values were obtained using the PVGIS 5.2 software.
After establishing the installed power and selecting the PV panel the next step in the design is the configuration of the PV modules that compose the generator, and their electrical coupling to the solar inverter. To do this, a certain number of restrictions must be met depending on the inverter selected:
  • Maximum power point (MPP) search voltage range. Working outside this range does not damage the equipment, but it can cause energy losses;
  • Maximum input voltage to the inverter;
  • Maximum input current to the inverter.
This defines the maximum and minimum number of panels that can be connected in series in each string and the maximum number of parallel strings that can be supported by the selected inverter. The inverter was designed by applying a 0.9 factor to the peak installed power. Finally, the space requirement on the surface of the pond must be considered.

2.4. Analysis of the Coverage of Electricity Demand

An hourly analysis was conducted to check the match between demand and FPV energy production. The objective was to check how this renewable technology adapts to both overall and hourly demand. To perform this analysis the Matlab software tool was used [35].

2.5. Environmental and Economic Aspects

For the environmental impact assessment, the GRAFCAN tool [36] was used to visualize the possible influence of protected areas on the desalination plant location. The presence of protected flora and/or fauna species was also determined. The annual water evaporation rate (m3) of the pond prior to FPV installation was estimated using Equation (4).
E = S · K p · E p
where:
  • E: estimated annual evaporation in the water body (m3)
  • S: pond surface (m2)
  • Kp: dimensionless coefficient based on pond geometry and local climatic conditions
  • Ep: annual evapotranspiration (mm/year) at the pond location.
Calculation was then made of the evaporation volume that would be saved as a result of implementation of the FPV system using the reduction percentages offered by several studies [37], as well as by the floating module manufacturer who established it at 80% [38].
Finally, calculation of avoided carbon dioxide emissions was made using Equation (5) [24].
t C O 2 = E * k C O 2
where:
  • tCO2: carbon dioxide emissions amount (kg)
  • E: electricity generated (kWh)
  • kCO2: emission coefficient (kgCO2/kWh) specific to the Canary Islands (0.776).
With the average annual price of carbon dioxide emission allowances for the year 2020 (24.75 EUR/Tn) [39], the economic savings that the proposed system entails could then be quantified.
The economic feasibility study was based on the analysis of cash flows over the installation’s lifetime (25 years) and on the net present value (NPV) and the internal rate of return (IRR) variables. The initial investment was estimated on the basis of other projects. Finally, the results were analysed in viability terms by calculating the LCOE.

3. Practical Case Study

This section presents the results of the research carried out, starting with the selection of the desalination plant used as a practical case study and ending with an analysis of the FPV system proposed in the methodology.

3.1. Desalination Plant Site Selection: Valle de San Lorenzo EDR Brackish Water Desalination Plant

Figure 3 shows the practical case location in the present study.
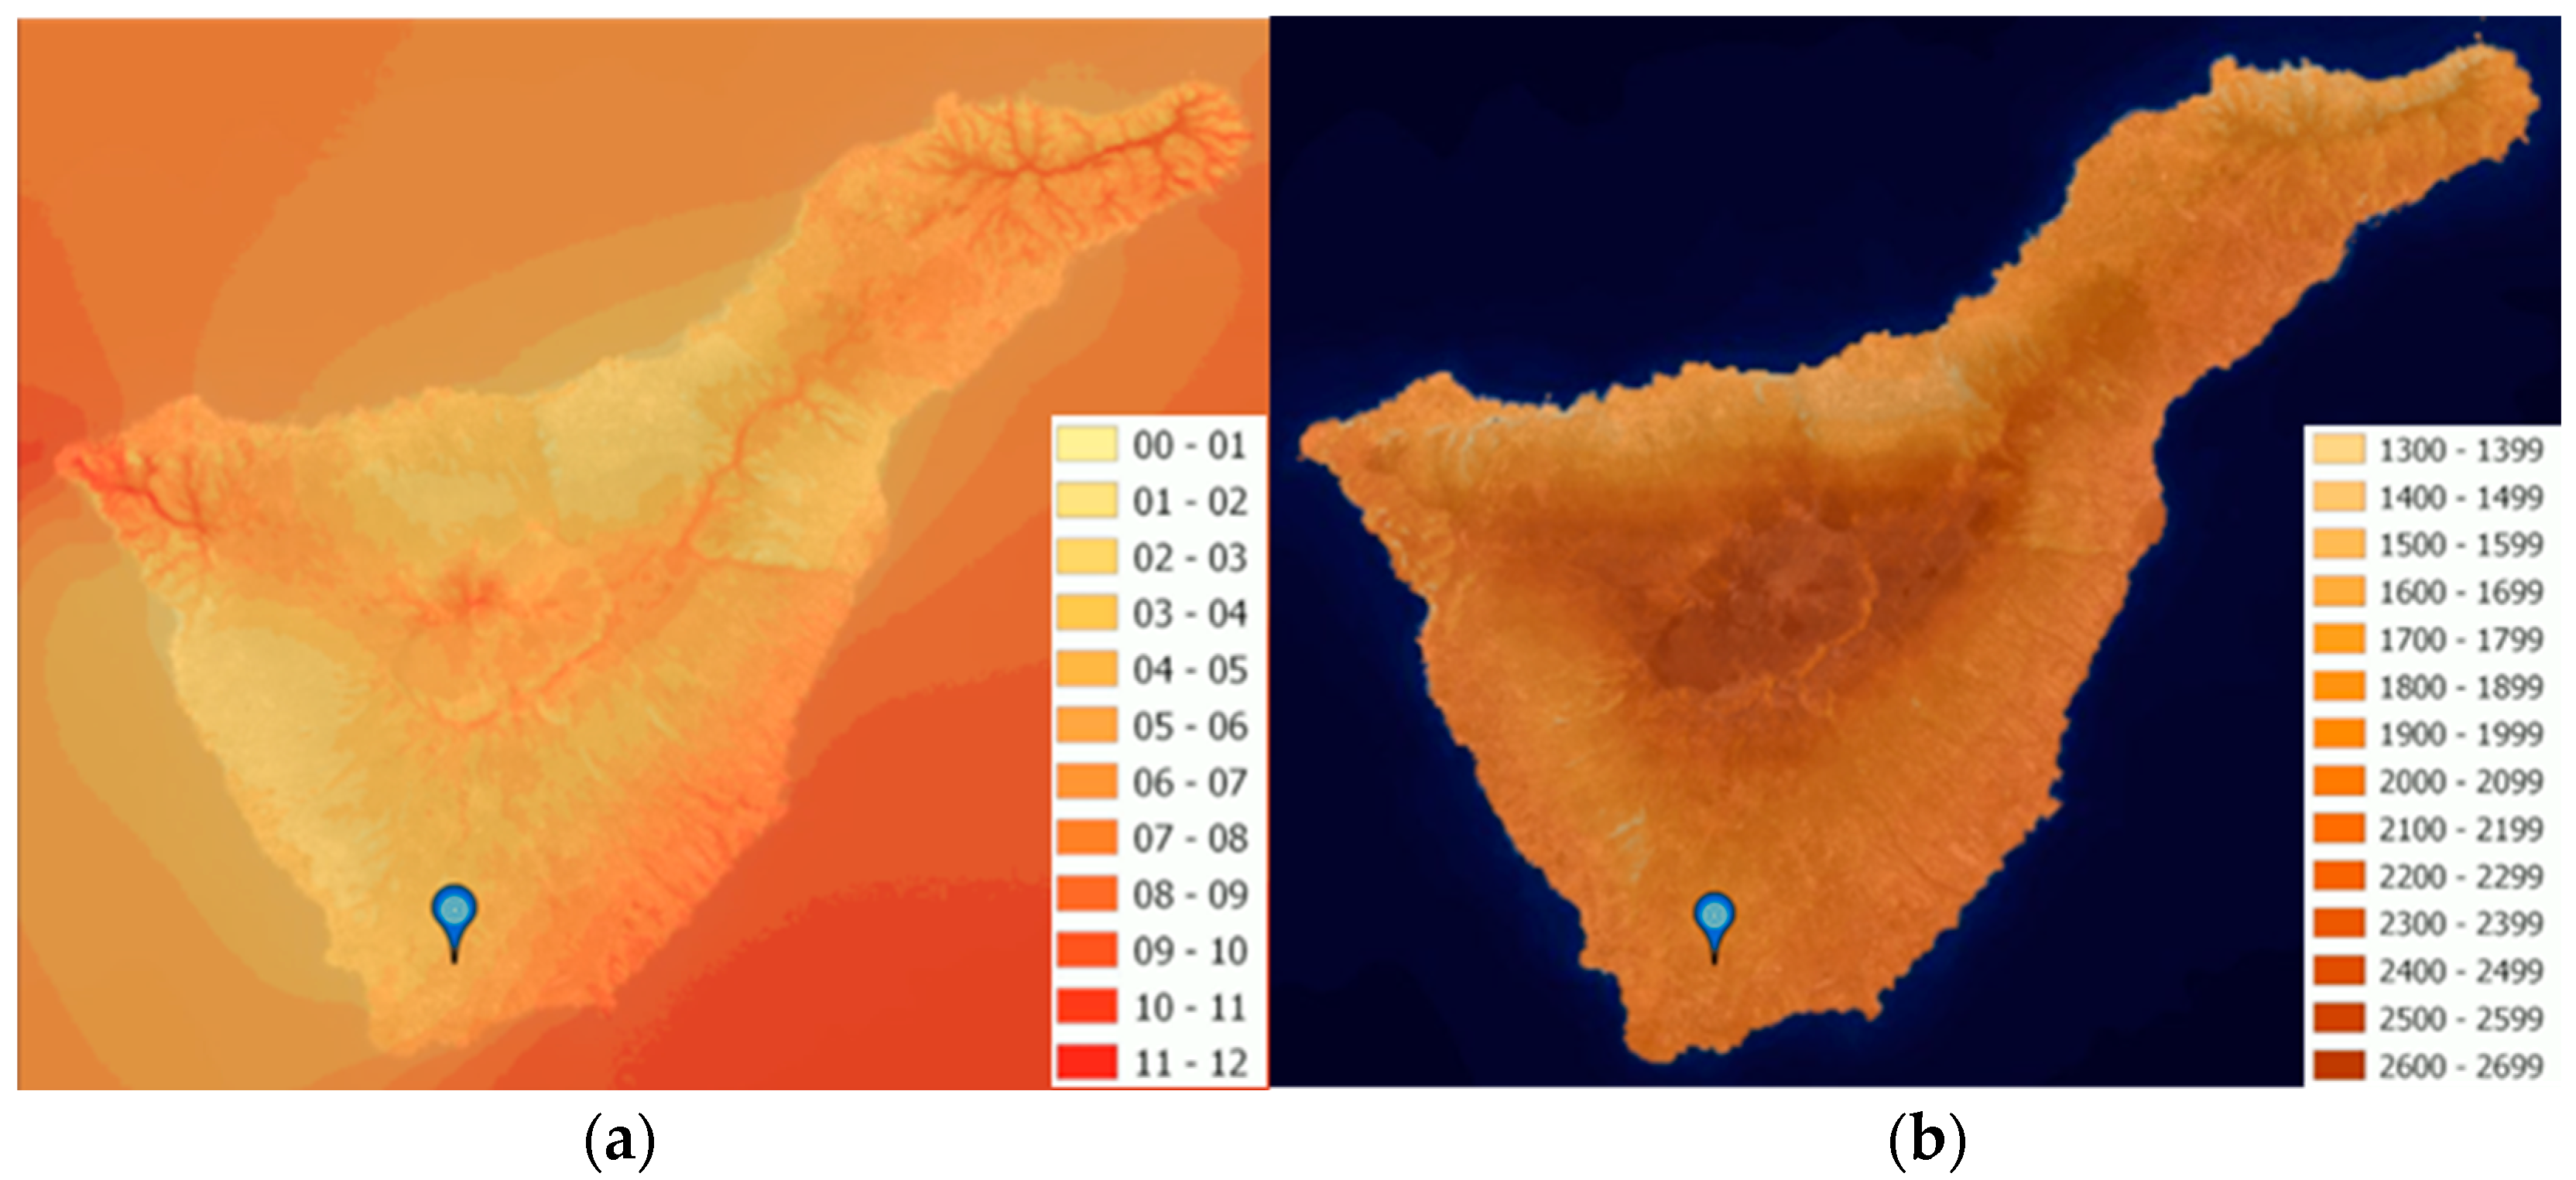
Desalination plant site selection was made in accordance with the conditions previously described (see Section 2.1): area without adjacent ground and poor wind conditions (average wind speed below 3.25 m/s at 100 m height [40]), high solar radiation (annual radiation higher than 2000 kWh/m2) and no relevant environmental constraints. Valle de San Lorenzo, in the municipality of Arona (Tenerife, Spain), met all these requirements and an EDR desalination plant is located there next to an irrigation pond. Figure 4 shows the solar radiation and wind speed maps of the island, highlighting the location of the case study.
Table 1 shows the results of the decision-making process of the case study using the logic diagram presented in the Section 2.1.
The pond is waterproofed with a 2 mm thick high-density polyethylene (HDPE) geomembrane. Its surface is covered with a 5 mm polyamide wire mesh shade net, which prevents birds from watering, reduces evaporation and algae proliferation and protects the waterproofing membrane. This barrier is in poor condition, and the owners plan to replace it, so this effect could be partially provided by the FPV installation instead [41]. Currently, the stored water come from two wastewater treatment plants (WWTPs). In the first case, after biological and tertiary treatment, the water is piped across the island from north to south (62 km), ending its journey in the pond under study. The second WWTP has an activated sludge treatment; after processing, the water is piped to the San Lorenzo Valley, where it can be directly stored in the pond or fed to the desalination plant [42].
Often the water coming from the WWTPs does not have a chemical quality suitable for agricultural irrigation due to salinity values that can be as high as 2000 µS/cm [43]. In this case, the water is piped to the EDR desalination plant where it is treated and then mixed with the water from the pond, producing water with a conductivity below 1100 µS/cm. The rated capacity of the desalination plant is 12,000 m3/day and its annual energy consumption was 2491 MWh in 2019, with a specific energy consumption of 0.6 kWh/m3 [44]. Table 2 presents the configuration of the EDR desalination plant provided by General Electric Company.
The water flows supplied to the end user can be summarized as shown in Table 3. The largest supply is produced in the mid-summer months, a period expected to be the driest of the year. This period can be extended to include the interval between May and October and can be catalogued as the most demanding.
The water from the pond allows the irrigation of 230 farms with about 1000 hectares of crops [43,45], satisfying more than 40% of the existing agricultural demand [46]. However, 15–20% of the water is used for other purposes, such as the irrigation of golf courses. The main and dominant crop in the area is banana. It is a high water-demanding fruit which, added to the fact that the municipality of Arona is one of the driest and most desert-like areas of the island (annual average rainfall between 100–200 mm, annual average temperature of 21 °C [47]), means that water conservation is of fundamental importance. Figure 5 shows on the left (a) the pond and the distribution piping network in the area of Las Galletas and Los Herales. The crop map in the study area is displayed on the right side (b). Table 4 also reports an analysis of the water produced by the EDR plant where its possible use in irrigated areas is verified.

3.2. Solar Resource Analysis

Table 5 shows the monthly average solar radiation values on the horizontal plane and other inclinations commonly used in PVF installations. The radiation coordinates are for the Valle de San Lorenzo pond. The monthly mean temperature values for the generated standard year are also presented.
An inclination closer to the horizontal will allow the installation of a greater number of PV modules per unit area and, therefore, the ability to install a higher rated power. In addition, the effect of the wind will generate a lesser load on the floating structure, reducing the risk of compromising its stability. This enables a simpler and more economical mooring system to be installed. Finally, among these configurations, the 5° inclination was selected because of its better adaptability to the selected floating structure.

3.3. FPV Selection and Configuration Design

The chosen solution will be in an irrigation pond of limited size, so no large external wave or wind forces need to be considered. A lightweight flotation system was selected, mostly made of plastic material with a minimum of metal parts. A further consideration was that the system should be easy to assemble and deploy on the surface of the pond, using common tools and without special means, after training of local personnel. Another key factor was to minimize the cost, ensuring the economic feasibility of the project for the owners. In this regard, the supply logistics costs were also taken into account.
After consideration of all the above, it was decided to opt for ISIFLOATING 4.0 floating modules, developed by the Spanish company Isigenere in Alicante city [38]. Considering the incident solar radiation in the selected location, the 5° angle offered by this configuration allows the capture of the greatest amount of solar radiation in the season of greatest water demand (summer), as well as minimizing shadows between the modules (reducing the number of PV panels installed). The technology used for the ISIFLOATING modules also offers the advantage of flexibility in regard to water level changes, which are quite common in the pond under study. In peak periods there is a gradient of 35,000 m3/day. According to the values recorded by the Balten company, throughout 2019 and 2020 [41] the accumulated water volume suffered strong variations, with values ranging from 9% to 100% of the capacity. The inverted trunk-pyramidal shape of the pond means that its lower surface (bottom) is much smaller than the upper surface. This allows the outermost panels to be supported on the slopes when the water level drops, without seriously affecting the structure as a whole or the performance of the system.
The current version of the floating structure is the company’s “4.0” and is composed of a double-HDPE float for each solar panel. It has a minimum thickness of 3 mm which gives it a load resistance of 240 kg/unit, providing improved buoyancy and stability of the system. The structure is capable of withstanding winds of up to 180 km/h. Figure 6 shows a picture of the system and specifies the characteristics of the floating module.
The most suitable mooring system is the so-called shore mooring type, since the pond has a geo-membrane which should not be damaged (for further information on mooring systems see Appendix A.3).

Configuration Design

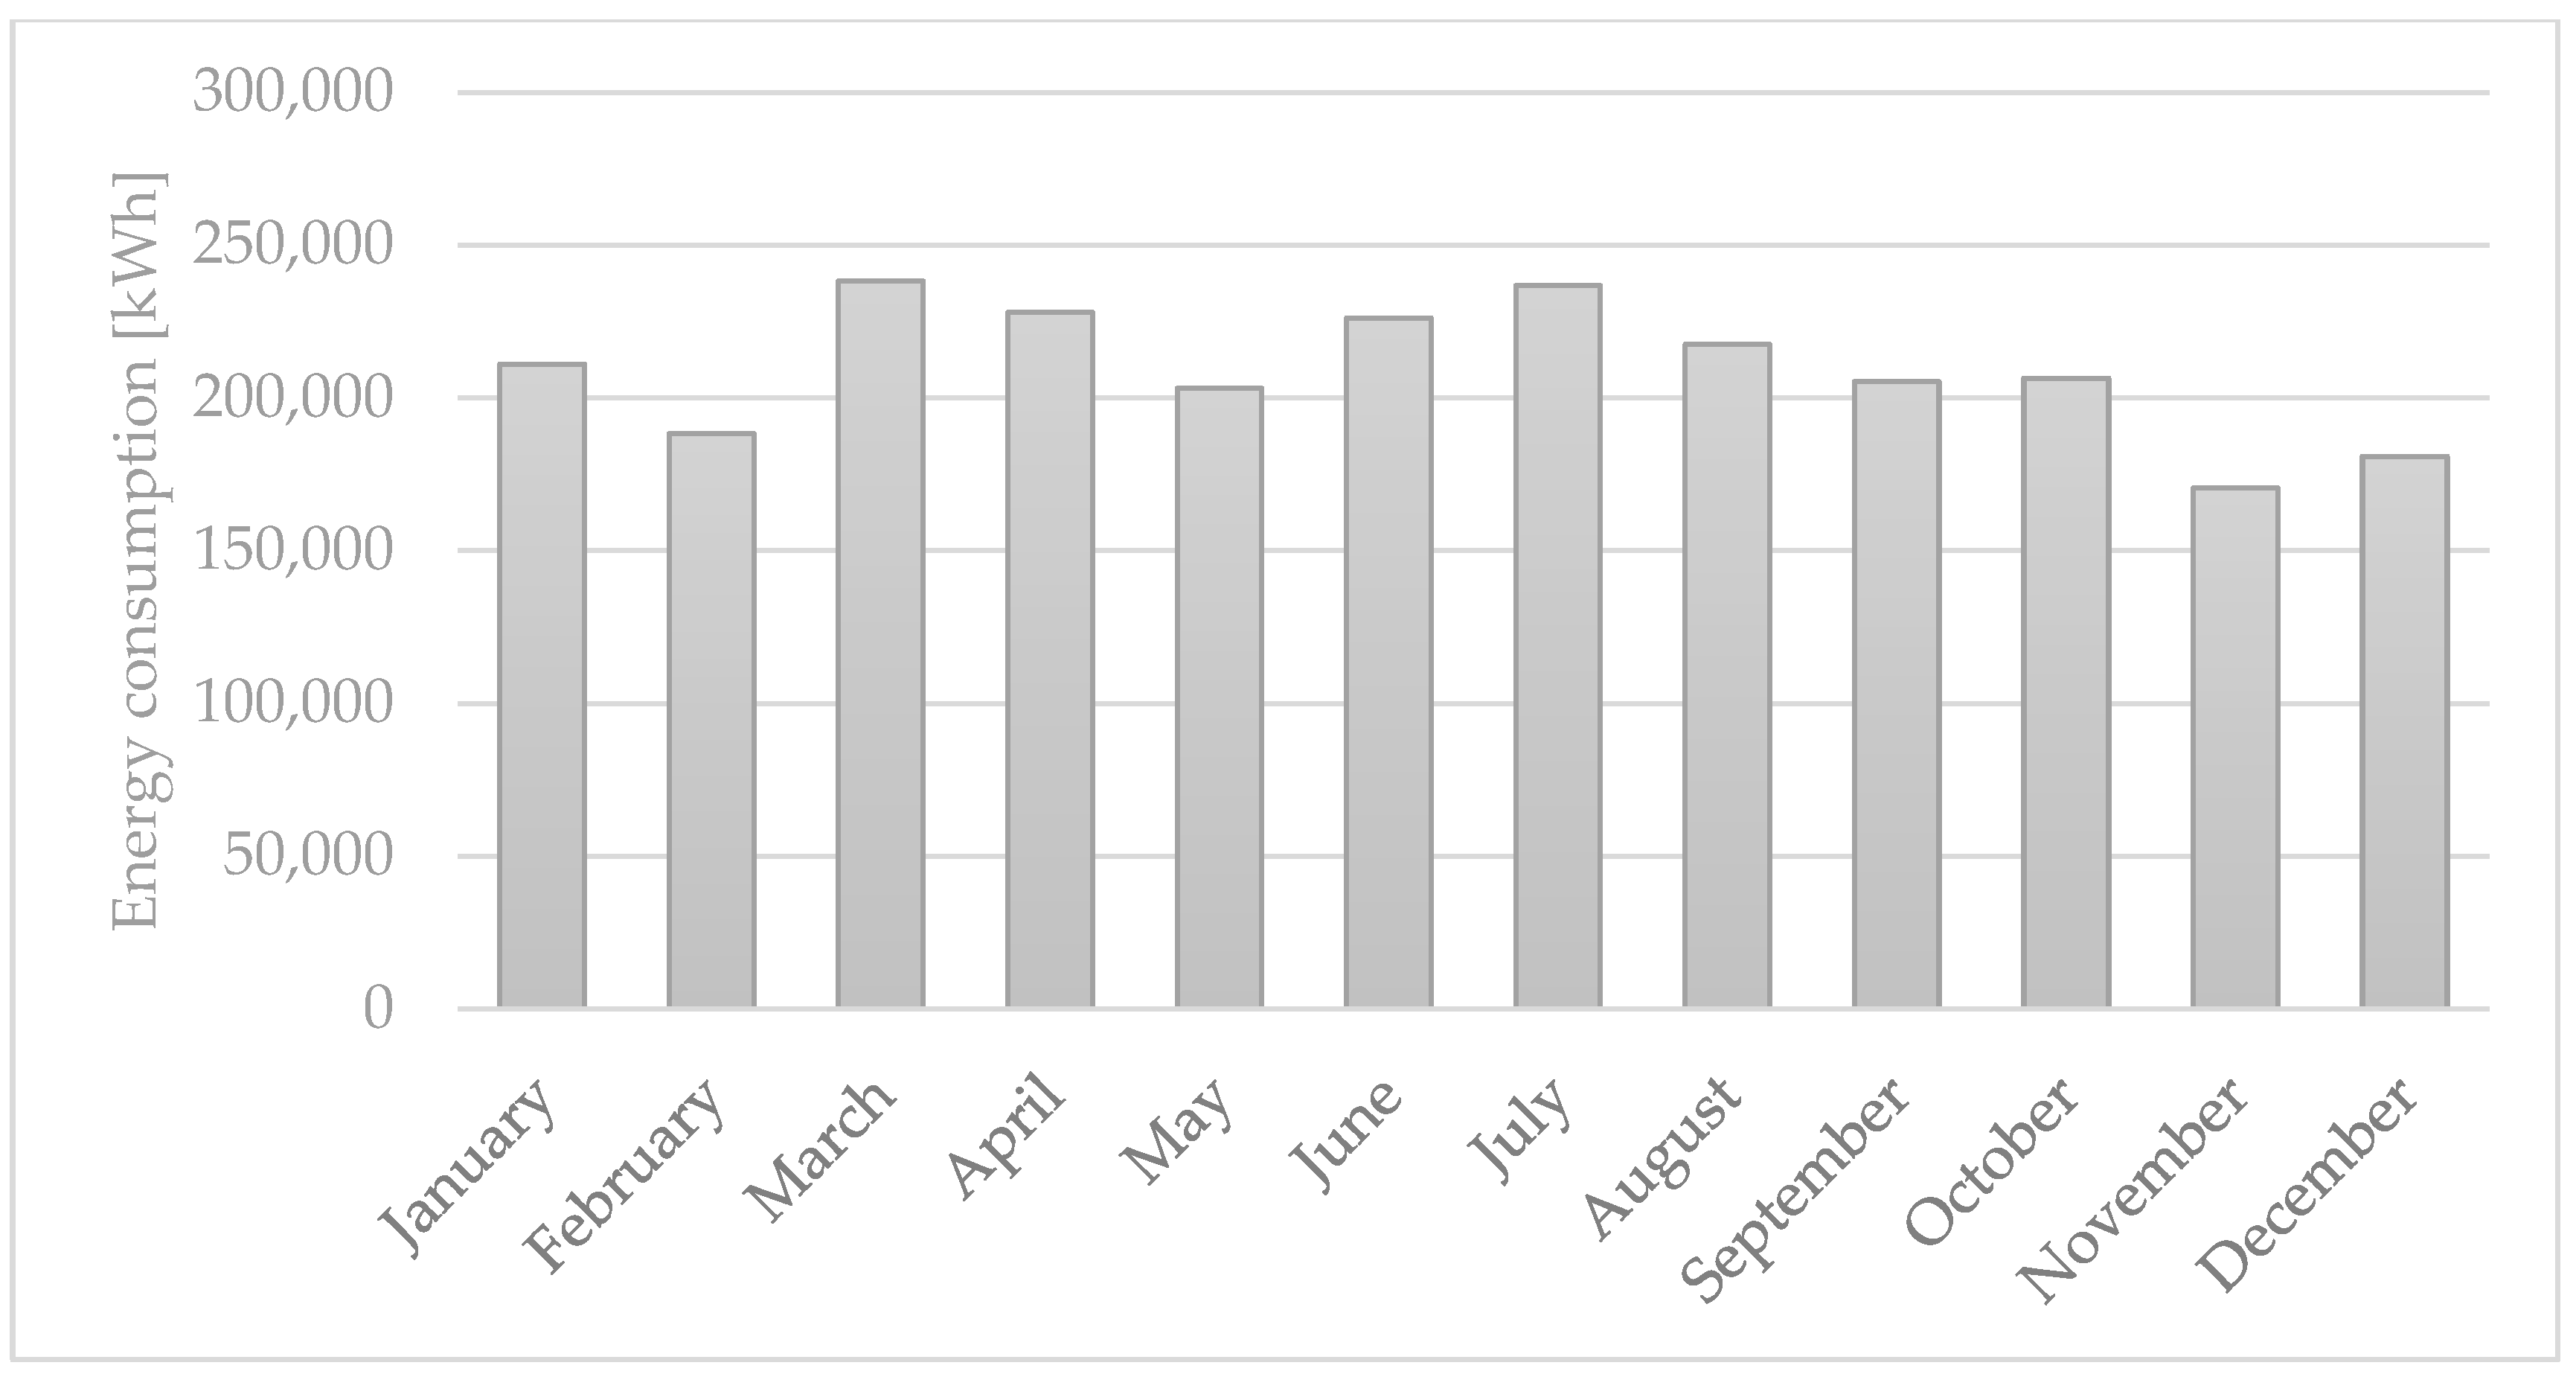
To initiate the system design, the energy demand to be supplied must be known. For this purpose, the monthly demand data of the desalination plant was used. These data were provided by BALTEN company through the electricity bills [44]. Figure 7 shows the average monthly energy consumed during a type year, based on 2017 and 2018 consumption. Once the demand values are known, the next step is to select the system elements used, mainly the solar panels and the inverter.
The selected PV panel is the A-450M GS model from ATERSA. It is a monocrystalline panel consisting of 144 cells (Half-Cell) with PERC technology and a 450 Wp power. The main characteristics of the selected panel are shown in Table 6 [48,49].
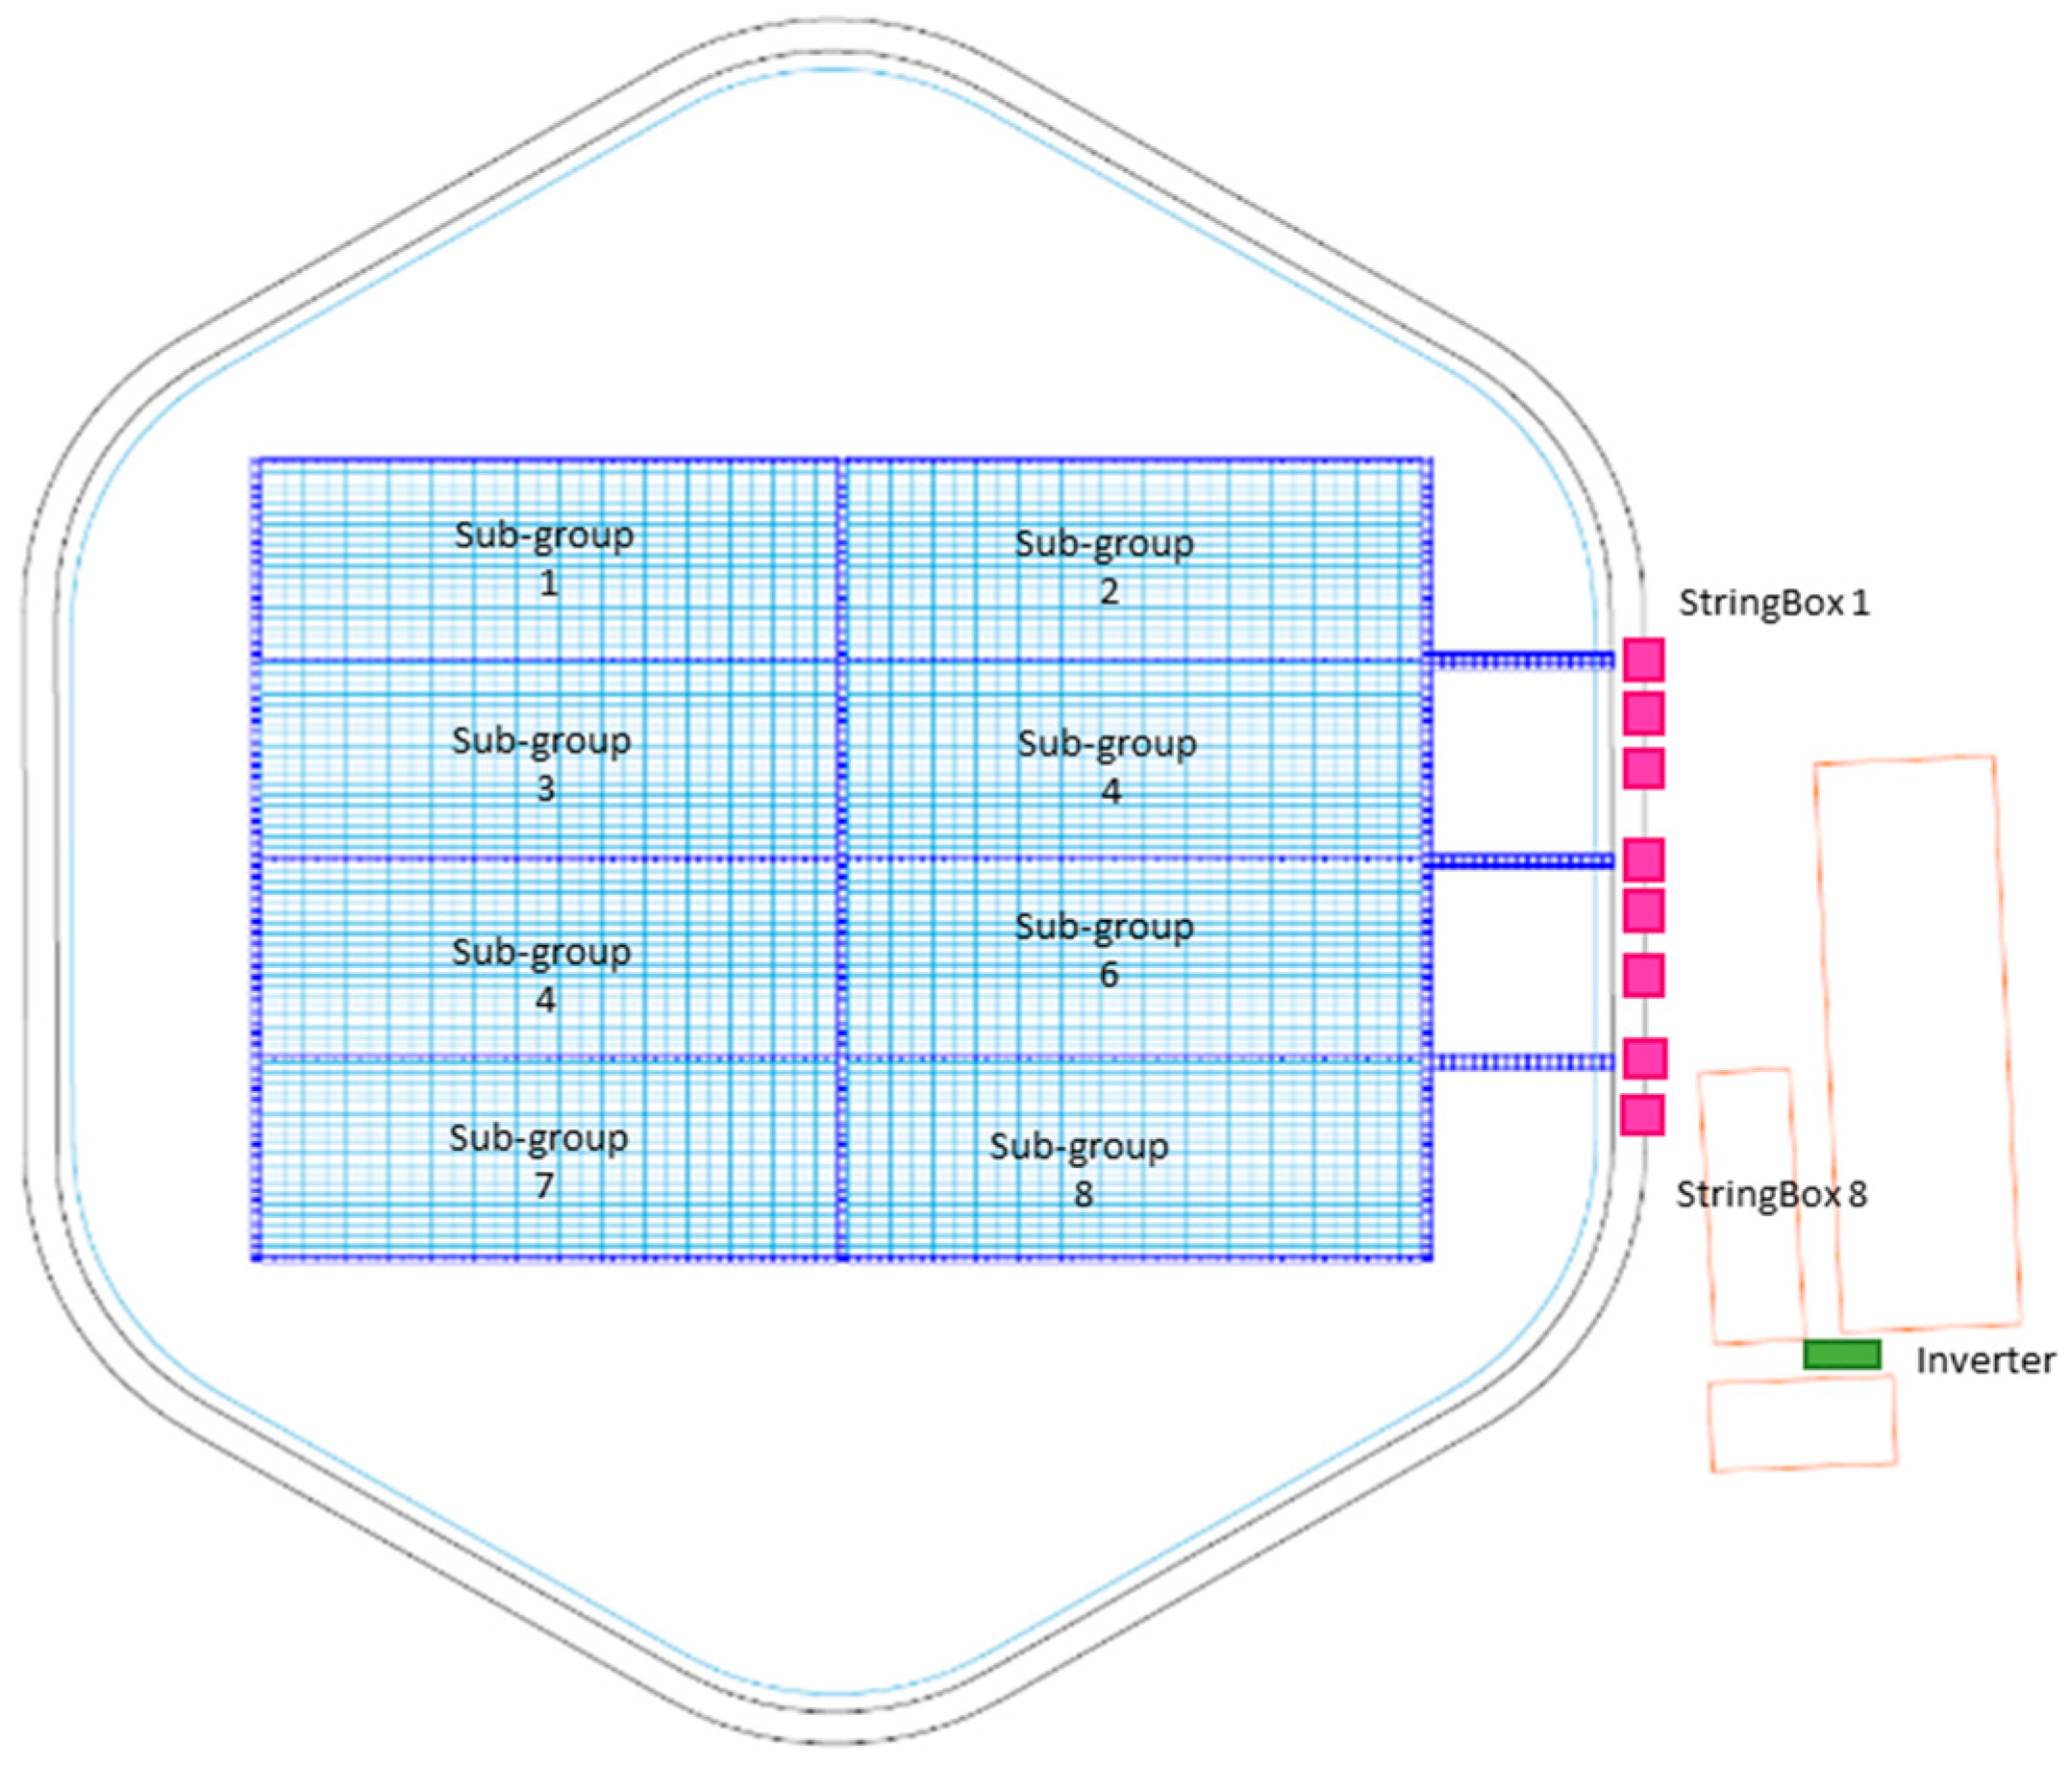
The PV generator consists of 4104 modules distributed in eight generator subgroups with their corresponding string combiner boxes. Each has a configuration consisting of 19 parallel strings of 27 modules in series. The total installed power is 1846 kWp. The inverter of the photovoltaic system is the INGECON SUN 1715TL B660 model, manufactured by INGETEAM, whose main characteristics are shown in Table 7.
The described PV generator design calculations indicate that a DC current of 1763 A can be achieved, which is lower than the 1870 A limit set at the inverter input.
The maximum voltage of the PV array would reach 1331 V, which is lower than the maximum DC voltage supported by the inverter input. Considering the maximum power voltage of the PV panels, each string would provide a DC voltage of 1120 V, which is within the range of the maximum power point follower of the selected inverter.
Table 8 shows the design results of the PV generator. The values are within the limits established by the selected inverter, validating the configuration.
The floating structure required to contain them covers a surface area of 12,074 m2 (representing 48.42% of the irrigation pond’s total surface area). With this configuration, the FPV facility generates 3,005,828 kWh of energy per year. As the energy demand for the desalination plant is 2,513,203 kWh/year, this system could theoretically cover the annual energy demand. In practice, however, this would not be the case, as monthly energy production does not match monthly demand. Figure 8 shows a layout diagram of the FPV design (scale 1:1).

4. Results

This section presents the results of the case study applied in this research. These results have been classified in two subsections, analysing first the energy balance of the system and its technical effectiveness (Section 4.1). Secondly, the environmental and economic implications are detailed in Section 4.2.

4.1. Energy Balance

For the hourly analysis of the energy coverage, the electricity consumption data of the desalination plant were provided by the company that manages the plant [44]. The hourly energy that the FPV is capable of generating over a year was simulated with PVGIS.
The aim of the FPV is to supply the electricity demand of a water treatment industrial plant, which has a fairly constant energy consumption throughout the day. Thus, ensuring that there is a match between supply and demand is critical.
The annual hourly comparative analysis of the energy produced by the FPV system versus the desalination plant demand is shown in Figure 9.
From the results of the simulation, it can be concluded that the average hourly power demanded throughout the year is 284 kW, with a maximum of 405 kW, while the average hourly power generated is 343 kW, with a maximum of 1486 kW. In theory, the FPV system alone could be capable of meeting the energy requirements of the desalination plant.
However, the unavailability of the solar resource during periods of time means that during more than 60% of the year’s hours (exactly 5347 h), it will not be possible to meet the requested electrical load solely by direct contribution of the FPV plant. In addition, there are 3413 h in which the FPV system will produce more energy than is required by the plant.
During these hours, the production far exceeds the plant’s demand (in almost 50% of the hours it is exceeded by more than 600 kW), creating an energy surplus that over the year amounts to 1,934,600 kWh (nearly 2/3 of the energy production). This surplus energy must either be injected into the distribution network or be stored using technologies designed for this purpose. The latter, although possible, entails a high cost at present. With this in mind, it is interesting to know the data obtained in relation to the number of hours in which there are differences between the generated and demanded hourly energy, quantified in Table 9.
Despite the favourable data for the energy self-supply scenario, a deficit exists that requires more than 1,400,000 kWh of electricity from the grid throughout the year to ensure the desalination plant’s unrestricted operation. Solar self-consumption will provide 43% of the total annual demand.
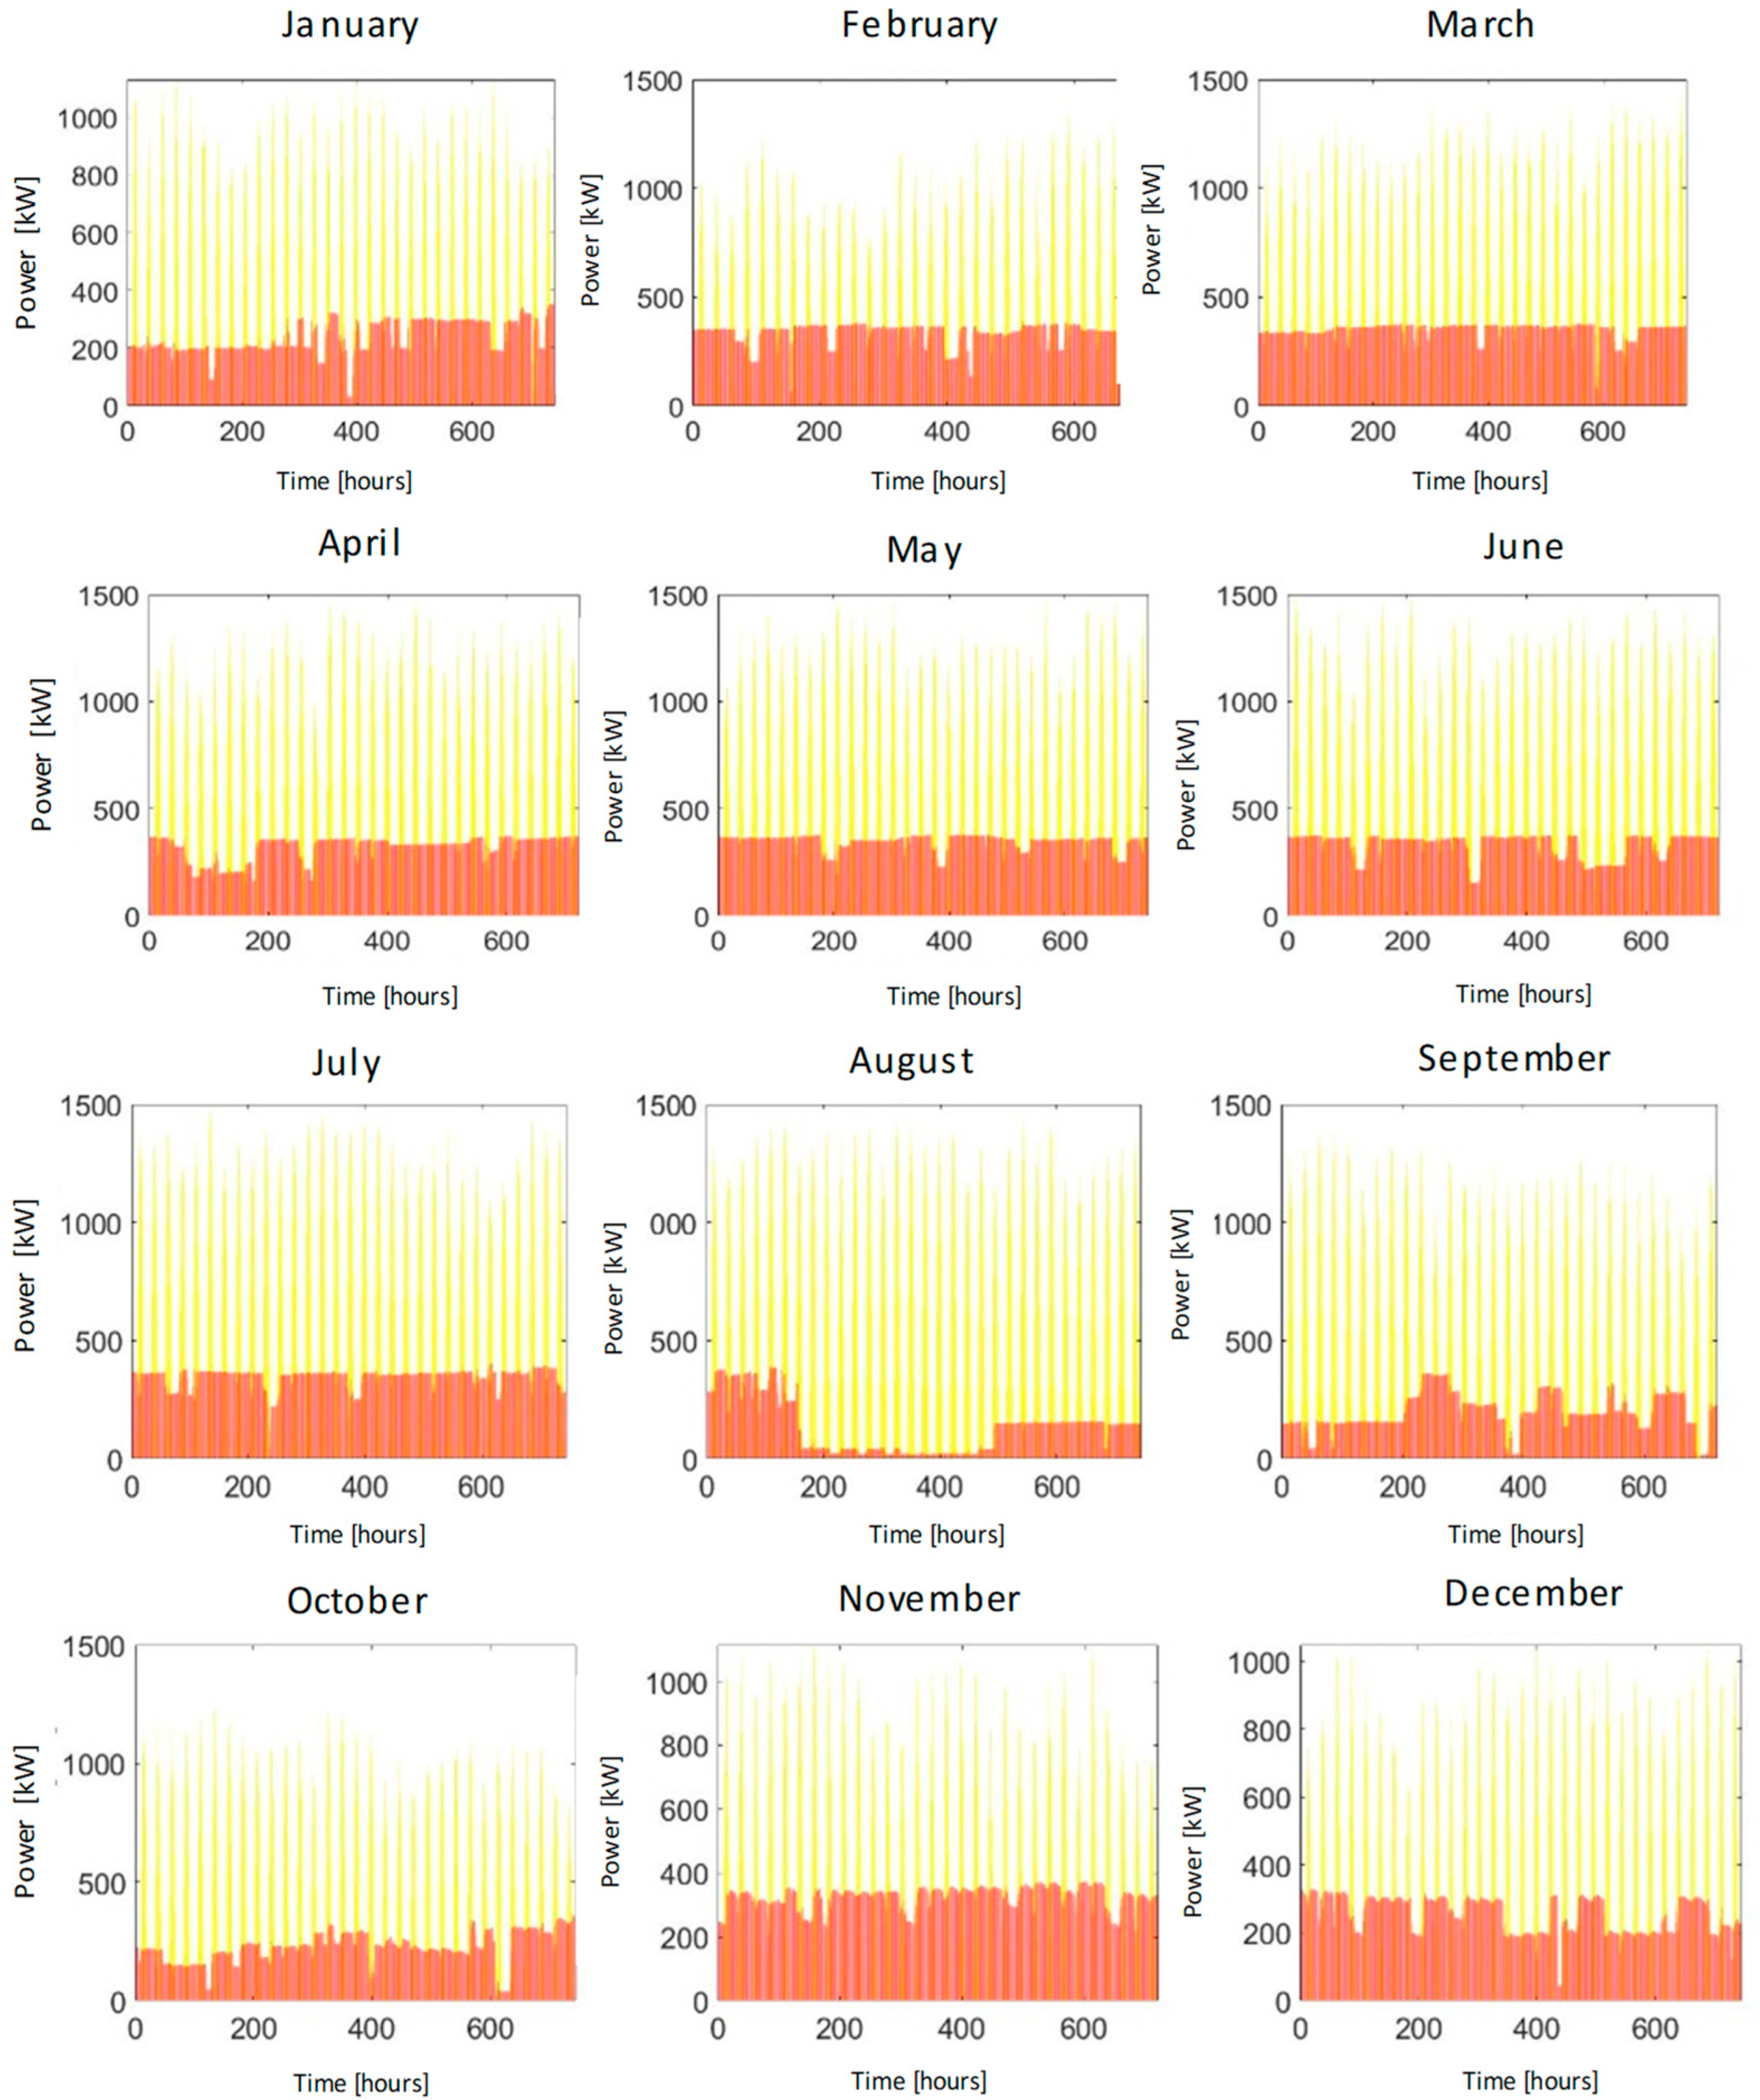
The behaviour of the system is shown in a more detailed way in Figure 10, where the monthly representation confirms that, in addition to the characteristics of solar technology (day-night), there is a pronounced gradient of energy production depending on the period of the year.

4.2. Environmental and Economic Implications

Concerning the possible impact that the deployment of the facility may have on the surrounding ecosystem, in terms of landscape, vegetation and fauna, it was confirmed that the selected area is not affected by any Nature 2000 network, biosphere reserve or natural protection area. Regarding the flora and fauna of the area, it was found that the facility is delimited in an area with 1 protected species, a plant called Echium triste nivariense, a subspecies only found in the islands of Tenerife and La Gomera (Canary Islands, Spain). Since the installation will only cover the water surface available in the pond, no damage will be caused. Figure 11: Echium triste nivariense, protected species plant (a) and the protected species map in the case study area (b).
Regarding water evaporation avoided by deploying the floating structure, the value obtained is 6398 m3 per year, which translates into 2.56% of the pond’s total capacity. As the plant is located in a water-scarce climate, this value is significant. If the specific consumption of the desalination plant is taken into account (0.6 kWh/m3), over its lifetime the system simultaneously saves EUR 5550 in energy terms (with an average price of 100 EUR/MWh).
In terms of CO2 emissions avoided, the results indicate that, thanks to the operation of the FPV plant, the emissions are reduced by 2332 Tn/year (CO2 emission factor in the specific case of the Canary Islands: 0.776 kgCO2/kWh [24]). These emissions amount to a total of 58,300 Tn over the lifetime of the project (25 years), which equates to an economic saving of EUR 1,442,925 for the islands’ conventional thermal power plants in terms of emission rights (considering the average annual price for 2022, whose value is 24.75 EUR/Tn [50]). Given the strong possibility that this price will increase considerably in coming years, the final economic saving could be much higher.
The initial investment for project start-up was found to amount to EUR 1,874,722. The NPV and IRR variables were also found to provide positive results, with values of EUR 1,223,087 and 5.18% respectively. Payback on investment would be achieved in 15 years. Finally, the LCOE was calculated as 0.034 EUR/kWh.

5. Discussion and Conclusions

This research demonstrates the added value of covering the electricity demand of a desalination plant using an inland FPV system. For this purpose, a detailed methodology has been presented, which involves a logical diagram to facilitate a decision-making process that will vary according to the peculiarities of each system.
In the case studied, an EDR desalination plant was used to improve the quality of treated water to meet local irrigation requirements. The same system could have been used in the case of seawater. The pond used to store the water was partially covered (48.4%) by FPV modules.
With the designed FPV system and its installed power of 1846 kWp, it is possible to supply 46% of the electricity demand of the desalination plant situated next to the irrigation pond. The annual demand of the plant is lower than the annual production of the FPV system, but the variability of the solar resource, compared to the homogeneity of the desalination plant’s consumption, means that, in hourly terms, only 46% of the plant’s demand can be covered, while almost two-thirds of the photovoltaic production is injected into the grid. The possible implementation of an energy storage system would allow use of the energy surplus generated to cover the hours with energy deficit in terms of PV power and to fully meet demand. The environmental analysis confirms the benefits of this technology in terms of reductions of CO2 emissions (58,300 Tn avoided) and water evaporation (6398 m3 per year), together with the consequent positive economic benefit in terms of energy savings, estimated at EUR 5550. The system was found to be to be economically viable, with amortization in the 15th year of its lifetime, with an LCOE of 33.93 EUR/MWh. This system allows maximization of land use, favouring its deployment for agricultural purposes while producing irrigation water without the need for additional surface by using the irrigation pond itself for the production of electricity.
Future directions should involve the study of temperature ranges and climatology to show globally which is the best location for the installation of this system. The realization of a multi-index analysis in the planet’s geographical areas, adding data such as humidity or water scarcity, is very interesting when coupling FPV systems to desalination plants.

Author Contributions

Conceptualization, B.D.R.-G. and E.R.-L.; methodology, B.D.R.-G. and E.R.-L.; software, B.D.R.-G.; validation, B.D.R.-G., E.R.-L. and J.S.-R.; formal analysis, B.D.R.-G. and J.S.-R.; investigation, B.D.R.-G. and E.R.-L.; resources, E.R.-L.; data curation, B.D.R.-G. and E.R.-L.; writing—original draft preparation, B.D.R.-G.; writing—review and editing, J.S.-R. and E.R.-L.; visualization, B.D.R.-G. and J.S.-R.; supervision, J.S.-R.; project administration, J.S.-R.; funding acquisition, B.D.R.-G. and J.S.-R. All authors have read and agreed to the published version of the manuscript.

Funding

This research was co-funded by the ERDF, INTERREG MAC 2014–2020 programme, within the E5DES project (MAC2/1.1a/309).

Institutional Review Board Statement

Not applicable.

Informed Consent Statement

Not applicable.

Data Availability Statement

Not applicable.

Acknowledgments

The authors of this article would like to thank the company Balsas de Tenerife (BALTEN), especially the person in charge of the South Zone, Juan Antonio Medina, and the company Isigenere, for their continuous collaboration and provision of information during the project. Thanks also go to Ángel A. Bayod Rújula, for all the support and guidance offered. Publication fees have been charged by the project ULPGC Excellence, funded by the Consejería de Economía, Conocimiento y Empleo del Gobierno de Canarias.

Conflicts of Interest

The authors declare no conflict of interest.

Nomenclature

PVPhotovoltaic
RESRenewable energy sources
LCOELevelized cost of energy
FPVFloating photovoltaic
EDRElectrodialysis reversal
PVGISPhotovoltaic Geographical Information System
PRPerformance ratio
MPPMaximum power point
NPVNet present value
IRRInternal rate of return
HDPEHigh-density polyethylene
WWTPsWastewater treatment plants
NTUNephelometric turbidity units
TSSTotal suspended solids
CFUColony Forming Units

Appendix A. Floating PV Systems. State-of-the-Art

Appendix A.1. Structural Concept Diagram of the FPV System
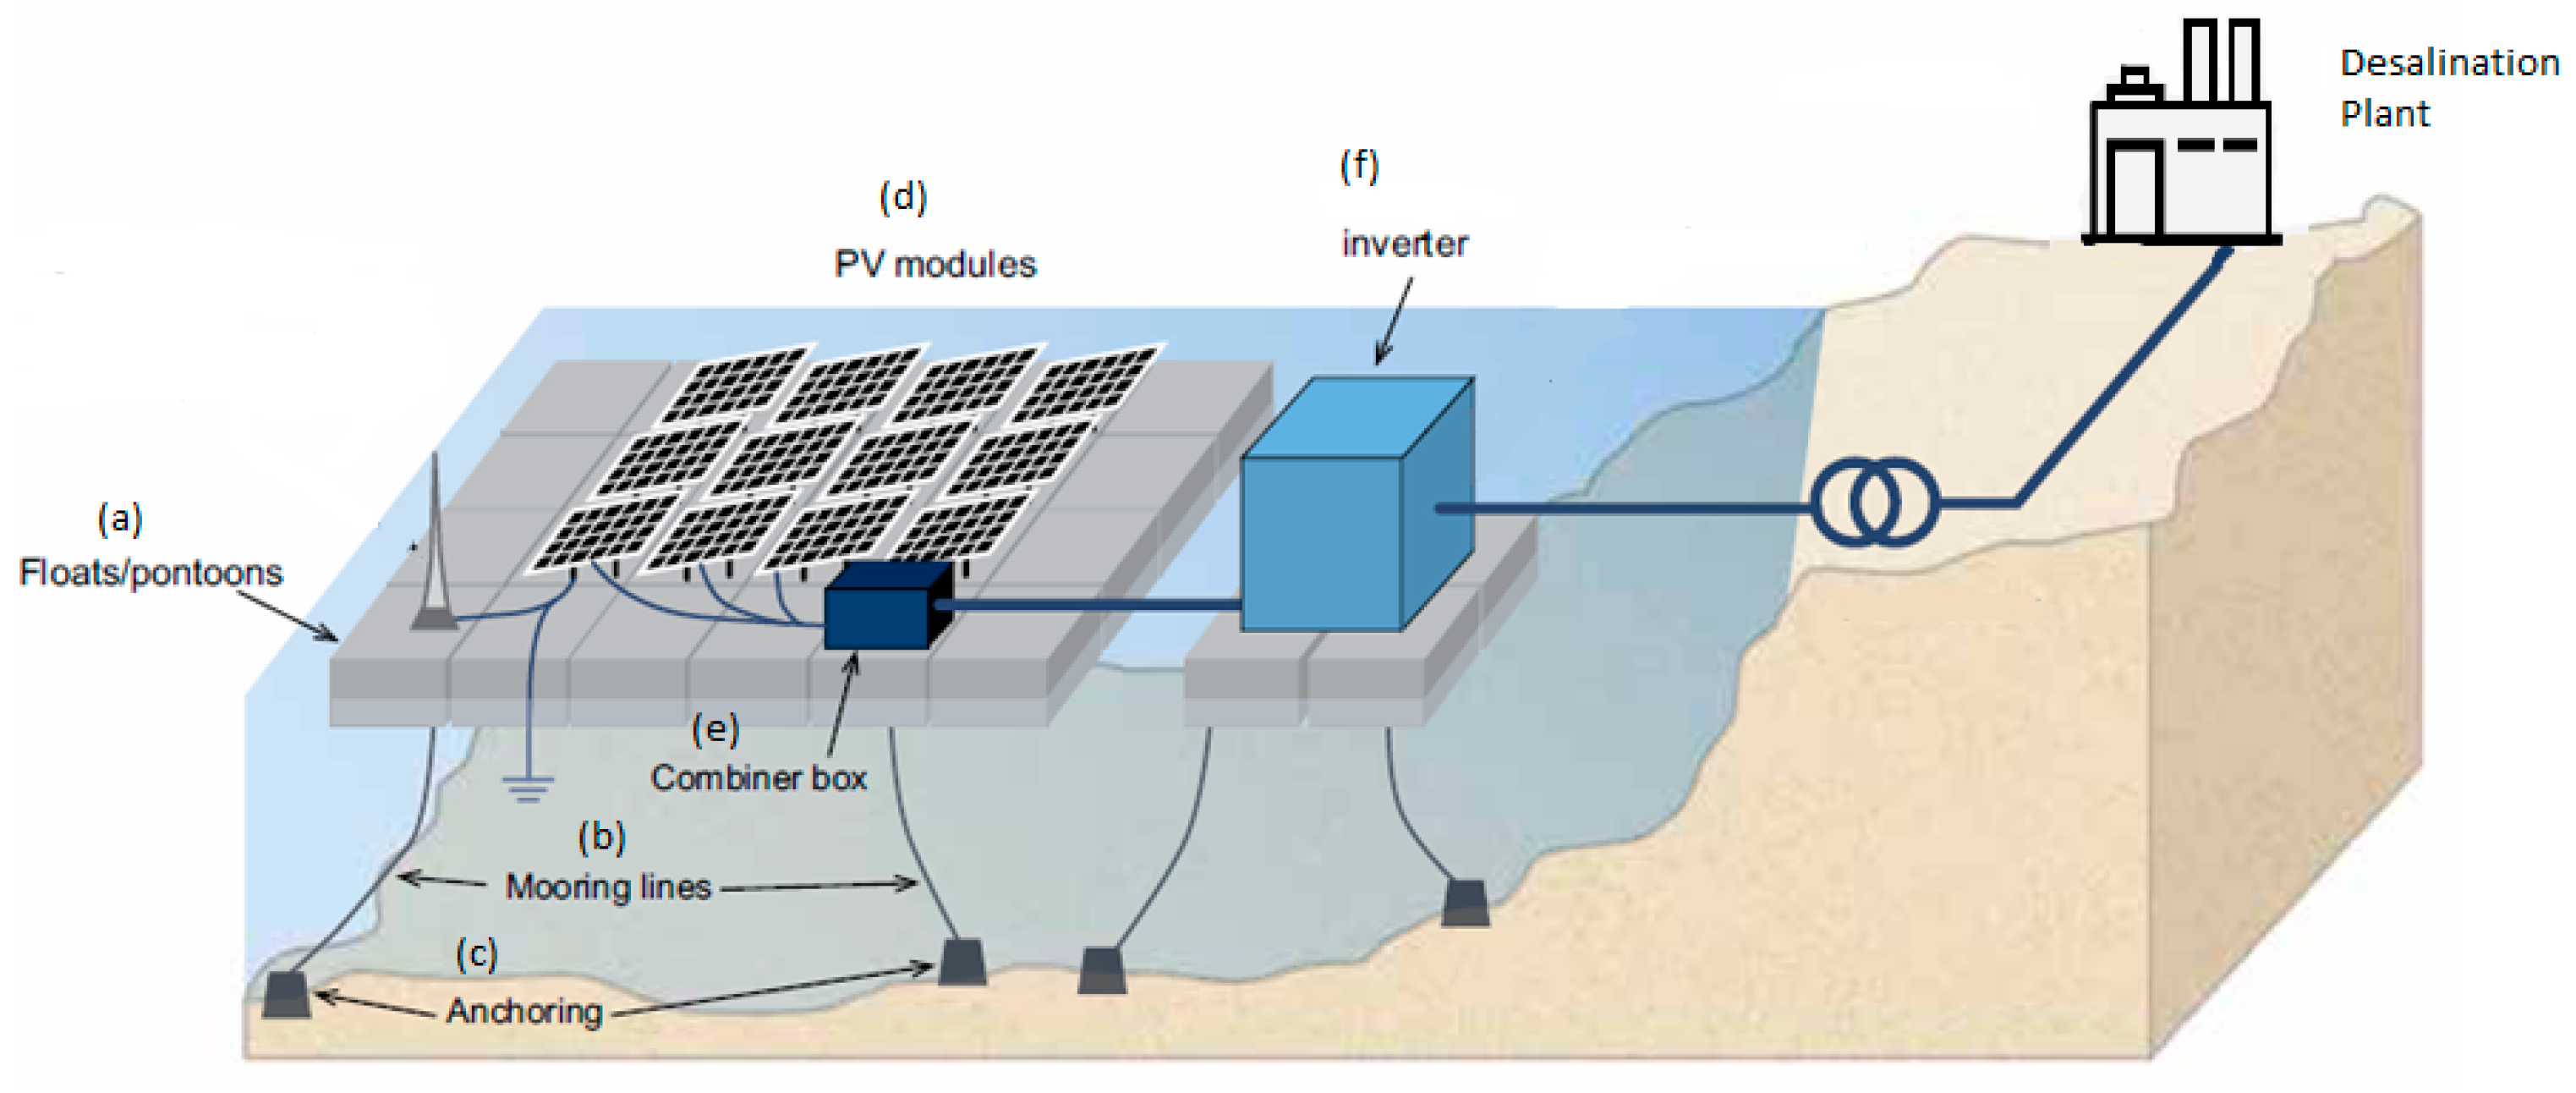
Figure A1 shows the main components of an FPV system. The differentiating element compared to a conventional solar PV system is the floating structure (floats/pontoons) indicated in the figure with the letter (a). Likewise, the mooring system (b) and the anchoring (c) are necessary for its correct fixing. The solar panels are indicated with letter (d). The following sections of Appendix A explain in detail the different configurations and peculiarities of the elements identified above. Finally, in this same figure can also be found the combiner box for grouping the panels in parallel (e) and the inverter (f) that transforms the direct current produced by the solar panels to alternating current, used in the desalination plant.
Figure A1. Structural concept diagram of the FPV system. Adapted from [51].
Jmse 11 00905 g0a1

Appendix A.2. Floating Structure

At present there is no consensus classification, but a distinction can be made between the following options [52,53]:
  • Configuration 1: high-density polyethylene (HDPE) pipes, combined with a structure, usually metallic, that provides rigidity and supports the PV panels, resulting in a raft;
  • Configuration 2: small HDPE floating modules (usually housing only one PV panel per unit) and suitably joined to others to form larger assemblies;
  • Configuration 3: Floating pontoon-type structures linked together and capable of supporting the rest of the PV structure, housed on rigid elements;
  • Configuration 4: Membrane configuration, where the PV panels are placed on this element, supported on a floating circular structure.
Configuration 1, despite offering robustness, stability and little contact between the structure and the water (reducing its degradation while improving the cooling and performance of the system), is derived from projects dating back to the beginning of the technology. It is difficult to compete nowadays with other typologies, due to its high costs and the difficulty of joining the rafts. However, these disadvantages have been overcome with new projects, such as the solution proposed by Gable Slender, consisting of larger connectable modular rafts. The base unit is assembled using HDPE pipes 12 m long and 0.5 m in diameter, and up to four-times thicker than Configuration 2, allowing the use of fewer floating elements and, consequently, fewer components throughout the system. This gives them enormous buoyancy and walkability [53,54].
In Configuration 2, the French company Ciel & Terre leads the market with more than 100 projects and 300 MWp realized around the world since 2011 [55]. Nowadays, a wide range of manufacturers mimic this configuration, making it the most widespread, with hundreds of megawatts installed. Its main attractions lie in its price and quick manufacturing, assembly and deployment, as well as the minimal use of metallic parts, which are more susceptible to corrosion [53,56]. However, the lightness and weakness of the structure can compromise it in locations or during strong winds or waves, thus complicating the anchoring system. In addition, the proximity of the panels to the water makes cooling difficult due to poor air circulation, creating a more humid atmosphere.
Hydrelio is the name of the module patented by the French company and is composed of two floats: the main one, which supports the PV module on aluminium rails and has a central hole to allow its natural cooling, and a secondary one, which allows buoyancy and maintenance tasks. They offer resistance to solar degradation for 20 years, to winds of up to 210 km/h and to 1 m waves. There are currently three versions available, designed to meet different market needs. Hydrelio Classic, manufactured with a fixed angle of 12° for the panels (with extra options to be modified to 15° or 22°). Hydrelio Equato, for regions close to the equator with angles of 5° and Hydrelio Air focused on improving air circulation and cooling of the system [51].
Following the same line, the Spanish company ISIGENERE is developing its own model, ISIFLOATING. Their first project dates back to 2009 in an irrigation pond in Alicante (Spain), with a capacity of 320 kWp for sale of energy to the grid, which gives them great experience in the sector. Its current version 4.0 is composed of a double-HDPE float for each solar panel, with a minimum thickness of 3 mm, which gives it a load resistance of 240 kg/unit, improving the buoyancy and stability of the system. This solution offers a fixed inclination of 5° and allows the mounting of PV modules of different sizes and powers. Its modular system adapts well to small surfaces, achieving a high Wp/m2 ratio. The structure is able to adapt to changes in water level, with the floats supporting each other or on the slopes if necessary and can withstand winds of up to 180 km/h. Years of development have led the manufacturer to be able to manufacture 1 MWp in just five days and achieve more efficient transport. Once on site, a team of four people, with no special resources, is able to install this model in less than three weeks [38].
Configuration 3 is based on creating structures that base their buoyancy on the support of a series of cubic elements of plastic material (pontoons), normally used to manufacture platforms or gangways for use in marine environments. These in turn are capable of being joined together to create photovoltaic parks of various sizes. With this configuration, the manufacturer claims to achieve better cooling (with the energy efficiency this entails) thanks to the existing space for air circulation, but at a higher price. In addition, this space allows the installation of bifacial panels that capture and take advantage of the solar radiation reflected by the water surface. NRG Island is an Italian manufacturer with a product framed within this typology. It produces each of its units using HDPE cubes, which support the aluminium structure containing a row of 4 PV panels, with the advantage of being able to adapt any size, power and type available on the market, as well as selecting the desired angle of inclination. These units can be joined together, both horizontally and vertically, creating the required shape and size. In addition, these joints provide the necessary passageways for maintenance personnel, offering a buoyancy of 350 kg/m2 [38].
Lastly, and a somewhat newer development, is the membrane-based Configuration 4. This solution, patented by the Norwegian company Ocean Sun, is similar to the aquaculture installations on which it bases its mooring system. It consists of a floating ring made of HDPE pipes surrounding the inner surface formed by a plastic material with hydroelastic characteristics, on which the PV modules are placed. This configuration allows a reduced use of elements to achieve buoyancy, which should translate into lower cost and greater ease of transport. In addition, it adapts better to forces produced by wind and wave motion, rather than resisting them [57].
The PV panels must be of a special type, flexible, and cannot be adapted to the rigid construction used in other installations. Another of its strong points is the cooling of the system, generated through direct contact of the membrane with the water. According to data obtained in some tests, PV modules reach a working temperature slightly higher than that of water, improving efficiency by up to 10% over other floating and land-based technologies [58]. On the other hand, the impossibility of tilting the panels could affect performance at latitudes far from the equator. The manufacturer currently has two models, OS-75 (650 kWp) and OS-50 (280 kWp), which mount 60-cell silicon panels with double glass. By electrically joining these rings, it would be possible to form wind farms of various sizes.
This typology will be tested in the marine environment of the east coast of Gran Canaria. The project, named BOOST, and carried out thanks to the association of several companies and institutions, will serve Ocean Sun as a showcase to demonstrate to the world the state of development of its floating technology [59].

Appendix A.3. Mooring Systems

The mooring system is a basic component that allows the structure to maintain a quasi-static positioning on the surface (movement within an acceptable range without presenting a risk to the elements as a whole) and to counteract the effects of external forces such as wind, waves and maintenance access. In addition, the system must be able to allow for vertical movements resulting from changes in the level of the body of water on which the installation is located. The configuration of the floating structure and the selected mooring system are closely linked. Other factors, such as the characteristics of the bottom and sides of the body of water, size, bathymetry or the fluctuation in height levels, will also have to be analysed. All this, added to the external forces experienced at each moment, will contribute to the dynamic response of the installation. Within the different existing typologies, we can distinguish between [51,60,61]:
Shore mooring systems are used in installations located on small bodies of water or in those with great depth. They are also suitable when the bottom, due to its typology, does not allow other mooring systems. It is economical, but with a greater visual impact since they are usually composed of civil works elements installed along the perimeter where the mooring lines are directed. Rigid mooring systems are mainly used in the fastening of systems built in marine environments with pontoons. They consist of link arms to a fixed structure located on the shore or the connection by means of a sliding connection to piles (stakes), allowing a greater vertical displacement. The latter configuration can be installed in the water, closer to the floating system, although limited to shallow waters.
Systems with tensioned moorings consist of the use of vertical cables (although it is possible to install them at a certain angle) that are kept in tension dragged by the buoyancy of the structure and connected to land by means of piles on the bottom or weights (clump weights), allowing limited vertical movement to the system and more freedom in the horizontal plane. Therefore, they are not suitable for surfaces with significant variations in water level.
Catenary mooring systems use the weight of the mooring cable itself as a buffer for the movement allowed to the floating structure, giving it some horizontal and vertical travel. They are usually formed by chains, of a size equivalent to the counterweight that we want to provide to the structure, resting on the bottom before joining the structure. They exert a horizontal load on the floats, so several of these moorings are usually installed in opposite directions. Finally, the weight/float mooring system is similar to the catenary system, but with less impact on the bed of the body of water as it uses one or more intermediate weights or buoys between the anchoring to the bottom and the attachment of the main cable to the structure.

Appendix A.4. Photovoltaic Panels

As mentioned above, with the exception of membrane-based floating structures, all other configurations allow the installation of solar panels manufactured for onshore use. Currently, the commercial market for PV panels is quite extensive, with variations in manufacturing materials, sizes, powers, configurations, technologies and efficiencies. The industry has been dominated since its inception by PV modules manufactured using crystalline silicon (c-Si) solar cells, accounting for 95% of global production in 2019 [62]. Within this type we can distinguish between two-main variants, monocrystalline and polycrystalline. The former have a number of advantages, such as better efficiency, better performance at high temperatures and longer service life, which results in a higher cost. Currently, the efficiency of these solar cells on a commercial scale ranges from 20–24% for monocrystalline c-Si and 18–20% for polycrystalline c-Si [63].

References and Note

  1. European Commission. 2030 Climate & Energy Framework. Available online: https://ec.europa.eu/clima/policies/strategies/2030 (accessed on 13 December 2022).
  2. Ministry of Ecological Transition. National Integrated Energy and Climate Plan; Spanish Institute for Energy Diversification and Saving: Madrid, Spain, 2019; p. 25. [Google Scholar]
  3. International Energy Agency. Solar PV 2022; IEA: Paris, France, 2022; License: CC BY 4.0.; Available online: https://www.iea.org/reports/solar-pv (accessed on 15 December 2022).
  4. International Renewable Energy Agency (IRENA). Renewable Power Generation Costs in 2019; IRENA: Abu Dhabi, United Arab Emirates, 2019; ISBN 978-92-9260-244-4. [Google Scholar]
  5. Wang, J.; Lund, P.D. Review of Recent Offshore Photovoltaics Development. Energies 2022, 15, 7462. [Google Scholar] [CrossRef]
  6. Campana, P.E.; Wästhage, L.; Nookuea, W.; Tan, Y.; Yan, J. Optimization and Assessment of Floating and Floating-Tracking PV Systems Integrated in on- and off-Grid Hybrid Energy Systems. Sol. Energy 2019, 177, 782–795. [Google Scholar] [CrossRef]
  7. Liu, L.; Sun, Q.; Li, H.; Yin, H.; Ren, X.; Wennersten, R. Evaluating the Benefits of Integrating Floating Photovoltaic and Pumped Storage Power System. Energy Convers. Manag. 2019, 194, 173–185. [Google Scholar] [CrossRef]
  8. Liu, L.; Wang, Q.; Lin, H.; Li, H.; Sun, Q.; Wennersten, R. Power Generation Efficiency and Prospects of Floating Photovoltaic Systems. Energy Procedia 2017, 105, 1136–1142. [Google Scholar] [CrossRef]
  9. Ranjbaran, P.; Yousefi, H.; Gharehpetian, G.B.; Astaraei, F.R. A Review on Floating Photovoltaic (FPV) Power Generation Units. Renew. Sustain. Energy Rev. 2019, 110, 332–347. [Google Scholar] [CrossRef]
  10. Kumar, M.; Chandel, S.S.; Kumar, A. Performance Analysis of a 10 MWp Utility Scale Grid-Connected Canal-Top Photovoltaic Power Plant under Indian Climatic Conditions. Energy 2020, 204, 117903. [Google Scholar] [CrossRef]
  11. Trapani, K.; Millar, D.L.; Smith, H.C.M. Novel Offshore Application of Photovoltaics in Comparison to Conventional Marine Renewable Energy Technologies. Renew. Energy 2013, 50, 879–888. [Google Scholar] [CrossRef]
  12. Pouran, H.M. From Collapsed Coal Mines to Floating Solar Farms, Why China’s New Power Stations Matter. Energy Policy 2018, 123, 414–420. [Google Scholar] [CrossRef]
  13. Khalifeh Soltani, S.R.; Mostafaeipour, A.; Almutairi, K.; Hosseini Dehshiri, S.J.; Hosseini Dehshiri, S.S.; Techato, K. Predicting Effect of Floating Photovoltaic Power Plant on Water Loss through Surface Evaporation for Wastewater Pond Using Artificial Intelligence: A Case Study. Sustain. Energy Technol. Assess. 2022, 50, 101849. [Google Scholar] [CrossRef]
  14. Kumar, M.; Mohammed Niyaz, H.; Gupta, R. Challenges and Opportunities towards the Development of Floating Photovoltaic Systems. Sol. Energy Mater. Sol. Cells 2021, 233, 111408. [Google Scholar] [CrossRef]
  15. Ma, C.; Liu, Z. Water-Surface Photovoltaics: Performance, Utilization, and Interactions with Water Eco-Environment. Renew. Sustain. Energy Rev. 2022, 167, 112823. [Google Scholar] [CrossRef]
  16. Manoj Kumar, N.; Chakraborty, S.; Kumar Yadav, S.; Singh, J.; Chopra, S.S. Advancing Simulation Tools Specific to Floating Solar Photovoltaic Systems—Comparative Analysis of Field-Measured and Simulated Energy Performance. Sustain. Energy Technol. Assess. 2022, 52, 102168. [Google Scholar] [CrossRef]
  17. Farfan, J.; Breyer, C. Combining Floating Solar Photovoltaic Power Plants and Hydropower Reservoirs: A Virtual Battery of Great Global Potential. Energy Procedia 2018, 155, 403–411. [Google Scholar] [CrossRef]
  18. Moraes, C.A.; Valadão, G.F.; Renato, N.S.; Botelho, D.F.; Oliveira, A.C.L.d.; Aleman, C.C.; Cunha, F.F. Floating Photovoltaic Plants as an Electricity Supply Option in the Tocantins-Araguaia Basin. Renew. Energy 2022, 193, 264–277. [Google Scholar] [CrossRef]
  19. Meydani, A.; Meidani, A.; Shahablavasani, S. Clean Energy’s Role in Power Plant Development. In Proceedings of the 2023 8th International Conference on Technology and Energy Management (ICTEM), Babol, Iran, 8–9 February 2023; pp. 1–7. [Google Scholar]
  20. Armstrong, A.; Page, T.; Thackeray, S.J.; Hernandez, R.R.; Jones, I.D. Integrating Environmental Understanding into Freshwater Floatovoltaic Deployment Using an Effects Hierarchy and Decision Trees. Environ. Res. Lett. 2020, 15, 114055. [Google Scholar] [CrossRef]
  21. Boeuf, G.; Le Bail, P.Y. Does Light Have an Influence on Fish Growth? Aquaculture 1999, 177, 129–152. [Google Scholar] [CrossRef]
  22. Menicou, M.; Vassiliou, V. Prospective Energy Needs in Mediterranean Offshore Aquaculture: Renewable and Sustainable Energy Solutions. Renew. Sustain. Energy Rev. 2010, 14, 3084–3091. [Google Scholar] [CrossRef]
  23. Woodhouse, M.; Repins, I.; David, M. LID and LeTID Impacts to PV Module Performance and System Economics: Draft Analysis. In Proceedings of the Impacts to PV Module Performance and System Economics, Online, 14 December 2020. [Google Scholar]
  24. Ministerio de Industria, E.y.T. Factores de Emisión de CO2 y Coeficientes de Paso a Energía Primaria de Diferentes Fuentes de Energía Final Consumidas En El Sector de Edificios En España. Doc. Reconocido Reglam. Instal. Térmicas Edif. 2016, 16, 17–18. [Google Scholar]
  25. Mercedes Garcia, A.V.; Sánchez-Romero, F.J.; López-Jiménez, P.A.; Pérez-Sánchez, M. A New Optimization Approach for the Use of Hybrid Renewable Systems in the Search of the Zero Net Energy Consumption in Water Irrigation Systems. Renew. Energy 2022, 195, 853–871. [Google Scholar] [CrossRef]
  26. Li, H.X.; Edwards, D.J.; Hosseini, M.R.; Costin, G.P. A Review on Renewable Energy Transition in Australia: An Updated Depiction. J. Clean. Prod. 2020, 242, 118475. [Google Scholar] [CrossRef]
  27. Gils, H.C.; Simon, S. Carbon Neutral Archipelago—100% Renewable Energy Supply for the Canary Islands. Appl. Energy 2017, 188, 342–355. [Google Scholar] [CrossRef]
  28. Santamarta, J.C.; Neris, J.; Rodríguez-Martín, J.; Arraiza, M.P.; López, J.V. Climate Change and Water Planning: New Challenges on Islands Environments. IERI Procedia 2014, 9, 59–63. [Google Scholar] [CrossRef]
  29. Del Río-Gamero, B.; Lis Alecio, T.; Schallenberg-Rodríguez, J. Performance Indicators for Coupling Desalination Plants with Wave Energy. Desalination 2022, 525, 115479. [Google Scholar] [CrossRef]
  30. Roggenburg, M.; Warsinger, D.M.; Bocanegra Evans, H.; Castillo, L. Combatting Water Scarcity and Economic Distress along the US-Mexico Border Using Renewable Powered Desalination. Appl. Energy 2021, 291, 116765. [Google Scholar] [CrossRef]
  31. Fernández Prieto, L.; Rodríguez Rodríguez, G.; Schallenberg Rodríguez, J. Wave Energy to Power a Desalination Plant in the North of Gran Canaria Island: Wave Resource, Socioeconomic and Environmental Assessment. J. Environ. Manag. 2019, 231, 546–551. [Google Scholar] [CrossRef]
  32. Schallenberg-Rodríguez, J.; Del Rio-Gamero, B.; Melian-Martel, N.; Lis Alecio, T.; González Herrera, J. Energy Supply of a Large Size Desalination Plant Using Wave Energy. Practical Case: North of Gran Canaria. Appl. Energy 2020, 278, 115681. [Google Scholar] [CrossRef]
  33. Delgado-Torres, A.M.; García-Rodríguez, L. Off-Grid SeaWater Reverse Osmosis (SWRO) Desalination Driven by Hybrid Tidal Range/Solar PV Systems: Sensitivity Analysis and Criteria for Preliminary Design. Sustain. Energy Technol. Assess. 2022, 53, 102425. [Google Scholar] [CrossRef]
  34. European, C. Photovoltaic Geographical Information System (PVGIS). Available online: https://ec.europa.eu/jrc/en/pvgis (accessed on 1 November 2022).
  35. MATLAB and Statistics Toolbox Release 2018, The MathWorks, Inc.: Natick, MA, USA, 2018.
  36. Grafcan. Gobierno de Canarias. Territorial Information System of the Canary Islands. Protected Areas. Available online: https://visor.grafcan.es/visorweb/ (accessed on 15 November 2022).
  37. Graber, T.A.; Galleguillos, H.R.; Cabeza, L.F.; Rojas, R.; Taboada, M.E.; Cáceres, L. Solar Water Heating System and Photovoltaic Floating Cover to Reduce Evaporation: Experimental Results and Modeling. Renew. Energy 2017, 105, 601–615. [Google Scholar] [CrossRef]
  38. Isigenere Company. Isifloating es el Sistema Solar Flotante de mas alta Calidad y Durabilidad. Available online: https://www.isifloating.com/wp-content/uploads/2021/05/ANEJO2_FICHA_ISIFLOATING-ESP-ISI200715.pdf (accessed on 23 December 2022).
  39. Sendeco2. Precios CO2. Available online: https://www.sendeco2.com/es/precios-co2 (accessed on 3 January 2023).
  40. Grafcan. Gobierno de Canarias. Territorial Information System of the Canary Islands. Wind Resource at 100 Meters. Available online: https://visor.grafcan.es/visorweb/ (accessed on 15 November 2022).
  41. BALTEN. Estado de Almacenamiento de las Balsas. Available online: https://www.balten.es/Articulo/Display/16?titulo=estado-de-almacenamiento-de-las-balsas&categoria=estado-de-las-balsas (accessed on 25 February 2021).
  42. BALTEN. Pliego de Condiciones Técnicas. Operación, Mantenimiento y Conservación de las Instalaciones del Sistema de Reutilización y Desalación de la isla de Tenerife. Available online: https://www.infopublic.net/concursos/servicio-realizacion-funciones-operacion-mantenimiento-conservacion-instalaciones-sistema-reutilizacion-desalacion-isla-tenerife-2845595?top_concept=Agua&concurso=Convocatorias&sort=fecha&page_number=4&noIndex (accessed on 25 March 2022).
  43. BALTEN. Memorias 20 años de BALTEN. Available online: https://www.balten.es/Articulo/Display/18?titulo=memoria-de-balten&categoria=otros-documentos (accessed on 25 March 2022).
  44. BALTEN. Balsas de Tenerife. Datos de La Demanda Horaria de La Planta Desalinizadora EDR Del Valle de San Lorenzo 2019. Oral communication by Juan Antonio Medina on 18 February 2021.
  45. Aguiar, E.; Delgado, S.; Renz, O.; Gonzalez, A.; Reutilización de Aguas Depuradas en la Isla de Tenerife. Instalaciones Para la Mejora de la Calidad para uso Agrícola. Available online: http://hispagua.cedex.es/sites/default/files/hispagua_articulo/Ingcivil/113/articulo1/reutilizacion.htm (accessed on 22 April 2022).
  46. Dirección General de Agricultura y Desarrollo Rural. Plan de Regadíos de Canarias, 2014–2020; Dirección General de Agricultura y Desarrollo Rural: Brussel, Belgium, 2014; Volume 1, pp. 1–281. Available online: https://www.gub.uy/ministerio-ganaderia-agricultura-pesca/dgdr (accessed on 18 December 2022).
  47. Cabildo de Tenerife; Consejo Insular de Aguas de Tenerife. Plan Hidrológico Tenerife. 2015. Annex3, p. 268. Available online: https://www.tenerife.es/portalcabtfe/es/temas/aguas/consejo-insular-de-aguas-de-tenerife/33-temas/aguas (accessed on 18 March 2023).
  48. Atersa. Panel Solar 450W A-450M ATERSA GS. Available online: https://atersa.shop/panel-solar-450w-a-450m-atersa-gs-m6x24/ (accessed on 7 May 2022).
  49. Ingeteam. INGECON SUN Power (1170–1800 kVA). Available online: https://www.ingeteam.com/es-es/sectores/energia-fotovoltaica/p15_24_36/ingecon-sun-power-1170-1800-kva.aspx (accessed on 8 May 2022).
  50. Sendeco2. CO2 Costs. Available online: https://www.sendeco2.com/es/precios-co2 (accessed on 18 December 2022).
  51. World Bank Group; Energy Sector Management Assistance Program; Solar Energy Research Institute of Singapore. Where Sun Meets Water: Floating Solar Handbook for Practitioners; World Bank: Washington, DC, USA, 2019. [Google Scholar]
  52. Friel, D.; Karimirad, M.; Whittaker, T.; Doran, J.; Howlin, E. A Review of Floating Photovoltaic Design Concepts and Installed Variations. In Proceedings of the 4th International Conference Offshore Renew Energy CORE, Lisbon, Portugal, 12–15 October 2020. [Google Scholar]
  53. Cazzaniga, R. Floating PV Structures; Elsevier Inc.: Amsterdam, The Netherlands, 2020. [Google Scholar] [CrossRef]
  54. Cossu, S.; Baccoli, R.; Ghiani, E. Utility Scale Ground Mounted Photovoltaic Plants with Gable Structure and Inverter Oversizing for Land-Use Optimization. Energies 2021, 14, 3084. [Google Scholar] [CrossRef]
  55. Ciel et Terre. The Floating Solar Company. Available online: https://ciel-et-terre.net/floating-solar/ (accessed on 5 January 2023).
  56. Oliveira-Pinto, S.; Stokkermans, J. Assessment of the Potential of Different Floating Solar Technologies—Overview and Analysis of Differente Cases Studies. Energy Convers. Manag. 2020, 211, 112747. [Google Scholar] [CrossRef]
  57. Ocean Sun Company. Ocean Sun Products. Available online: https://oceansun.no/ (accessed on 18 March 2022).
  58. Power PVTECH. PV Tech Power Report: Asia Focus. Solar and Storage Finance Asia; PV Tech Power: London, UK, 2019; Volume 1, pp. 1–56. [Google Scholar]
  59. CORDIS. European Commission. Bringing Offshore Ocean Sun to the Global Market. Available online: https://cordis.europa.eu/project/id/965671 (accessed on 2 February 2023).
  60. Acharya, M.; Devraj, S. Floating Solar Photovoltaic (FSPV): A Third Pillar to Solar PV Sector? TERI Discussion Paper:Output of the ETC India Project; The Energy and Resources Institute: New Delhi, India, 2019; pp. 1–68. [Google Scholar]
  61. Whittaker, T.; Folley, M.; Hancock, J. Environmental Loads, Motions, and Mooring Systems; Elsevier Inc.: Amsterdam, The Netherlands, 2020. [Google Scholar] [CrossRef]
  62. Institute for Solar Energy Systems. Fraunhofer’s Photovoltaics Report; Institute for Solar Energy Systems: Freiburg im Breisgau, Germany, 2020; Available online: https://www.ise.fraunhofer.de/content/dam/ise/en/documents/annual_reports/fraunhofer-ise-annual-report-2020-2021.pdf (accessed on 10 February 2023).
  63. Masson, G.; Kaizuka, I. Trends in Photovoltaic Applications 2019; International Energy Agency: Sweden, 2019; ISBN 978-3-906042-91-6. [Google Scholar] [CrossRef]
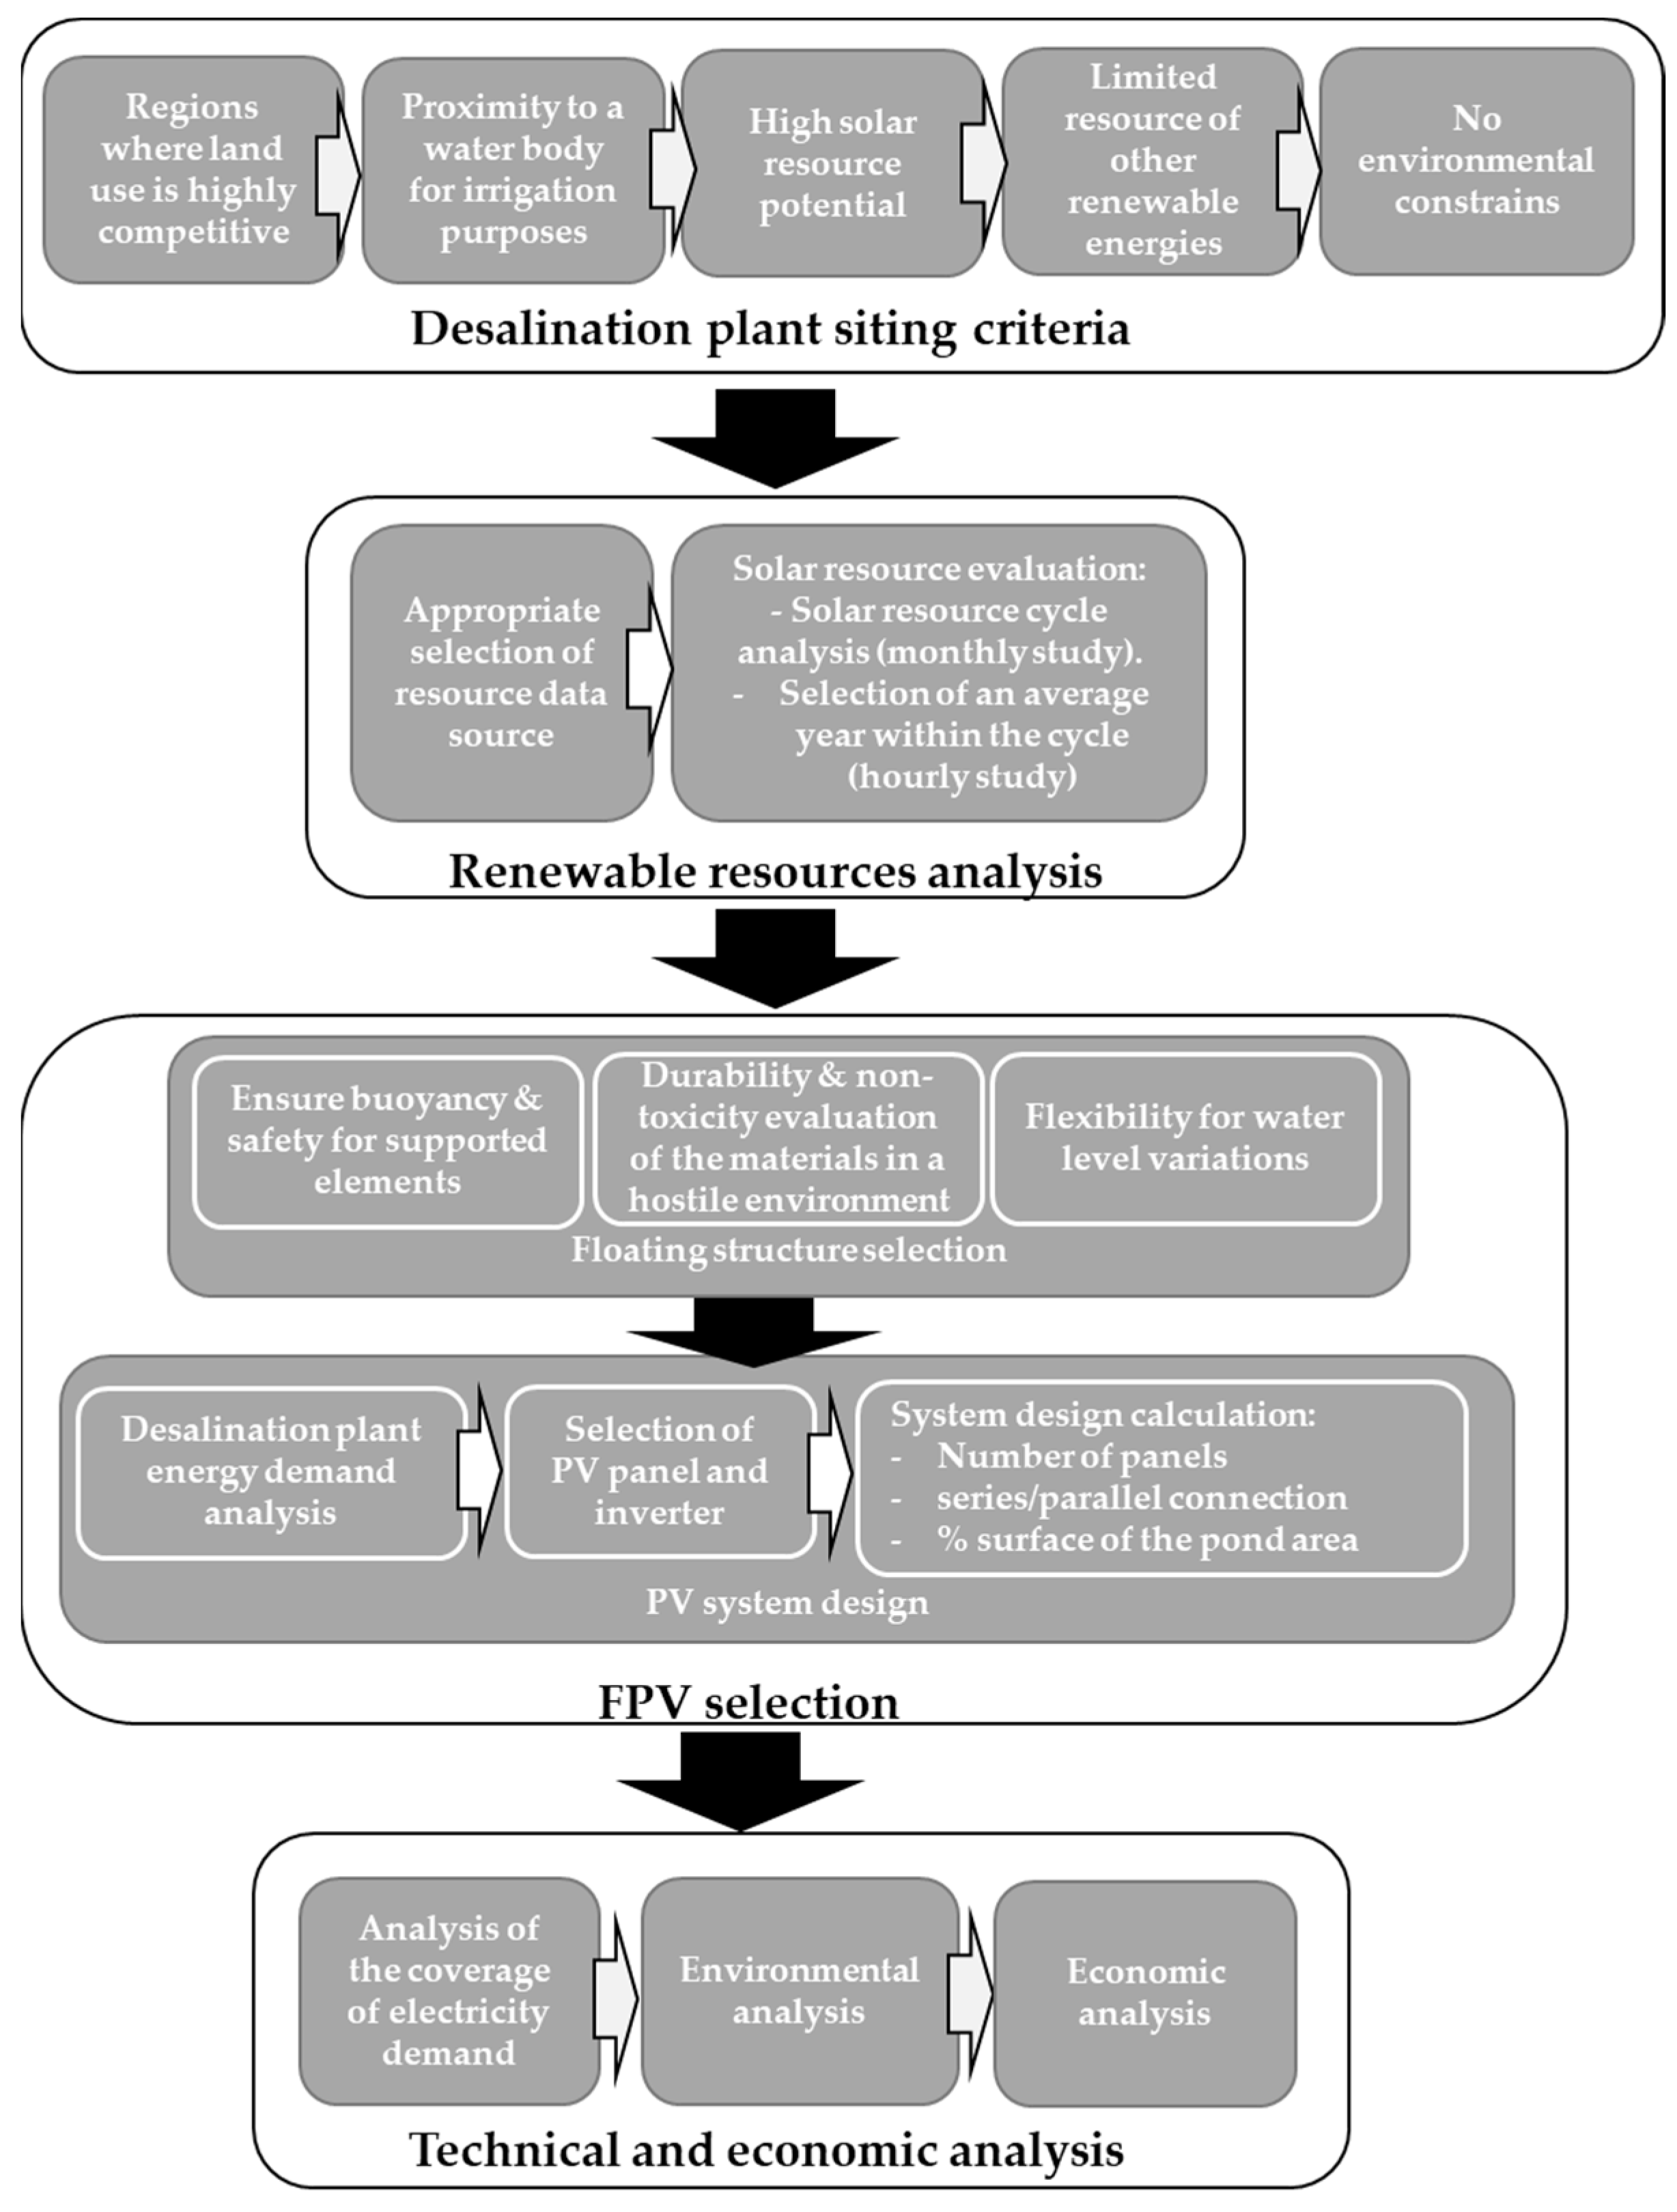
Figure 1. Methodology flowchart.
Jmse 11 00905 g001
Figure 2. Logic diagram for the decision-making process in the desalination plant potential selection.
Jmse 11 00905 g002
Figure 3. San Lorenzo Valley pond. Southern region of Tenerife Island. Canary Islands, Spain.
Jmse 11 00905 g003
Figure 4. (a) Wind speed map (m/s); (b) Solar radiation map (kWh/m2) [40].
Jmse 11 00905 g004
Figure 5. (a) distribution pipeline network [44]; (b) crop map [40].
Jmse 11 00905 g005
Figure 6. Characteristics of the Isifloating floating module, developed by the Spanish company Isigenere [38].
Jmse 11 00905 g006
Figure 7. Desalination plant monthly energy demand.
Jmse 11 00905 g007
Figure 8. FPV system layout.
Jmse 11 00905 g008
Figure 9. Hourly comparative analysis of photovoltaic generation vs. electricity consumption of the desalination plant.
Jmse 11 00905 g009
Figure 10. Monthly behaviour study at hourly scale. Comparison of energy produced (yellow colour) vs. energy demanded (red colour).
Jmse 11 00905 g010
Figure 11. (a) Echium triste nivariense protected species plant; (b) protected species map in the case study area.
Jmse 11 00905 g011
Table 1. San Lorenzo Valley pond decision-making process.
Site ParametersRenewable Resource Evaluation
Adjacent ground available?High temperature & evaporation climatology?Is the ground environmental protected?Is the solar resource high?Are other RES limited?
NoYesN/AYesYes
Table 2. EDR plant configuration [44].
Number of Desalination Units 8
Conversion rate (%)85
Net production per unit (m3/d)2000
Number of lines per desalination unit3
Number of stages per line4
Number of stacks per unit12
Total number of stacks96
cation-exchange membranesCR67HMR
anion-exchange membranesAR908
Spacer-MarkIV
Max stack voltage (V)/current (A)600/65
Table 3. Bimonthly water flow rates served [m3] by the BALTEN company in the San Lorenzo-Las Galletas Valley area. Period: 2015–2019 [44].
January–FebruaryMarch–AprilMay–JuneJuly–AugustSeptember–OctoberNovember–DecemberTotal Year
20151,167,4401,177,0001,373,9281,519,0141,097,244873,8507,208,476
20161,049,0541,172,9861,322,8081,575,5051,175,637820,0057,115,995
2017997,4761,123,5751,396,1101,536,4021,394,0421,013,9527,461,557
2018968,9371,133,9081,281,2791,573,5971,295,7991,045,8017,299,321
20191,114,8551,207,6281,309,0671,643,9121,664,398908,6717,848,531
Period average1,059,5521,163,0191,336,6381,569,6861,325,424932,4567,386,776
Table 4. EDR plant product water analytics.
Preliminary Analysis
pH7.7Total hardness (°F)8.1
Conductivity (μS/cm, 20 °C)982Silica (mg/L)29
Cations (mg/L)Anions (mg/L)
Calcium11.0Carbonates<0.25
Magnesium13Bicarbonates 324
Potassium24.6Sulfates 37
Sodium157Chlorides 137
Iron0.08Nitrates 3.4
Ammonium18.3Nitrites 3.2
Phosphates 6.5
Fluorides0.2
Trace elements
Boron (mg/L)0.8Manganese (mg/L)0.03
Copper (mg/L) <0.005Chromium (mg/L) <0.005
Organic analysis
TSS (mg/L) <2.5Turbidity (NTU) 1
Microbiological analysis
Escherichia coli (CFU/100 mL)2Intestinal nematodes (Eggs/10l)0
Legionella spp. (CFU/L)0
Table 5. Monthly and annual average incident solar radiation over different angles and mean temperatures obtained for the established period. Values in kWh/m2 and °C.
Month Inclination DegreesTemperature
10°15°(°C)
January 118.75129.49139.50148.7118.9
February 125.60133.26140.20146.3417.8
March 177.33183.96189.57194.1117.8
April 191.30194.01195.66196.2418.5
May 216.62216.33214.85212.1819.4
June 218.25216.45213.44209.2520.8
July 226.35225.29222.99219.4622.0
August 213.90215.68216.27215.6423.2
September 173.67178.28181.95184.6223.2
October 145.69153.14159.77165.5222.7
November 113.44122.13130.17137.4721.1
December 106.60116.77126.31135.1119.9
Annual total 2027.52084.82130.72164.6
Table 6. Electrical characteristics of the solar panel A-450M GS [48].
Maximum power (Pmax)450 W
Maximum power voltage (Vmp)41.50 V
Maximum power current (Imp)10.85 A
Open-circuit voltage (Voc)49.30 V
Short-circuit current (Isc)11.60 A
Module efficiency (%)20.70
Table 7. Electrical characteristics of the inverter INGECON SUN B660 [49].
Minimum MPPT voltage 935 V
Maximum MPPT voltage1300 V
Maximum voltage1500 V
Maximum current 1870 A
Power IP54 30 °C1715 kVA
Table 8. PV generator design results.
MPP voltage1120 V (upper 935 V)
Maximum voltage1331 V (lower 1500 V)
Maximum current1763 A (lower 1870 A)
Table 9. Average hourly surplus energy generated by the FPV installation and number of hours in which it is obtained.
Number of HoursSurplus Power [kW]Percentage with Respect to Total Surplus Hours (%)
4112001.20
10711003.14
26110007.65
53390015.62
87780025.70
123670036.21
163760047.96
201350058.98
230540067.54
Disclaimer/Publisher’s Note: The statements, opinions and data contained in all publications are solely those of the individual author(s) and contributor(s) and not of MDPI and/or the editor(s). MDPI and/or the editor(s) disclaim responsibility for any injury to people or property resulting from any ideas, methods, instructions or products referred to in the content.