Article

Array-Based Underwater Acoustic Target Classification with Spectrum Reconstruction Based on Joint Sparsity and Frequency Shift Invariant Feature

1
School of Marine Science and Technology, Northwestern Polytechnical University, Xi’an 710072, China
2
715th, Institute of China Shipbuilding Industry Company, Hangzhou 310023, China
3
School of Electrical and Electronic Engineering, Nanyang Technological University, 50 Nanyang Avenue, Singapore 639798, Singapore
*
Author to whom correspondence should be addressed.
J. Mar. Sci. Eng. 2023, 11(6), 1101; https://doi.org/10.3390/jmse11061101
Submission received: 7 April 2023 / Revised: 13 May 2023 / Accepted: 20 May 2023 / Published: 23 May 2023
(This article belongs to the Section Ocean Engineering)

Abstract

:
The target spectrum, which is commonly used in feature extraction for underwater acoustic target classification, can be improperly recovered via conventional beamformer (CBF) owing to its frequency-variant spatial response and lead to degraded classification performance. In this paper, we propose a target spectrum reconstruction method under a sparse Bayesian learning framework with joint sparsity priors that can not only achieve high-resolution target separation in the angular domain but also attain beamwidth constancy over a frequency range at no cost of reducing angular resolution. Experiments on real measured array data show the recovered spectrum via our proposed method can effectively suppress interference and preserve more detailed spectral structures than CBF. This indicates our method is more suitable for target classification because it has the capability of retaining more representative and discriminative characteristics. Moreover, due to target motion and the underwater channel effect, the frequency of prominent spectral line components can be shifted over time, which is harmful to classification performance. To overcome this problem, we proposed a frequency shift-invariant feature extraction method with the help of elaborately designed frequency shift-invariant filter banks. The classification experiments demonstrate that our proposed methods outperform traditional CBF and Mel-frequency features and can help improve underwater recognition performance.

1. Introduction

Underwater acoustic target recognition technology, as one of the key parts of the underwater acoustic signal processing system, deserves more exploration. Passive underwater acoustic target recognition can identify target types by target radiated noise, which is collected by either a single-channel hydrophone or a multi-channel hydrophone array [1,2]. Presently, thanks to rapid technological development, hydrophone arrays have been widely used in ocean monitoring and observation [3]. With the help of hydrophone array and array signal processing techniques, the incident angle of a target can be estimated via the direction of arrival (DOA) estimation, and the beamformer can be utilized to enhance the signal from a desired direction with a higher SNR gain and suppress noise and interference from other directions [4]. In the case that underwater targets radiated noises from different directions are impinging on the hydrophone array, we can generally first perform DOA estimation to find out target directions and then use a beamformer as a spatial filter, steering to the estimated direction of our interested target. In passive sonar acoustic signal processing [5], the beamformed output signal, as the spatially filtered and enhanced target radiated signal, can be used to build samples and extract features to train classification models together with corresponding target labels for automatic underwater target recognition purposes. The array-based target-radiated signal reconstruction method serves as one of the key foundations for successful target recognition tasks. Therefore, reconstructing target-radiated noise suitable for underwater recognition systems is an important research topic.
Considering that underwater vehicles and ships radiated noise is typically a wideband signal [6], two important problems need to be discussed. On the one hand, the DOA estimation results of the same target over a wide frequency range can be different, which can make the recovered spectrum inconsistent over different frequencies and susceptible to interference. On the other hand, the main lobe width varies among different frequencies, and this can lead to a noticeable rapid energy decay with the growth of frequency on the spectrum due to a narrower main lobe width at a higher frequency. These problems can both lead to recovered signal distortion and are therefore not suitable for target reconstruction tasks. To address this problem, a wideband constant beamwidth beamformer whose main lobe width remains consistent over a frequency range is required [7].
The traditional way to design a constant beamwidth beamformer often requires numerical optimization algorithms [8,9,10,11]. Once the desired spatial response is defined, the array weight vector can be optimized to minimize the loss function between the estimated spatial response and the desired spatial response. There are three problems in the real application. First, their deployments are limited by high computational complexity. Second, the fitting spatial response at low frequencies is usually not good enough. This is because the beam pattern has a wider main lobe at low frequencies, and decreasing the main lobe width comes at the cost of increasing the side lobe level, which can lead to aliasing. Third, the spatial response fitting is calculated discretely, and improper choice of optimization method or improperly defined spatial response can lead to an invalid result. In practical application, finding the right balance between desired spatial response, calculative complexity, and robustness is not an easy task.
Under the sparse Bayesian learning framework [12], with the help of structured sparsity [13,14,15], high-resolution DOA estimation [16,17,18,19] and signal recovery [20,21,22,23] methods based on the Bayesian probabilistic model have been studied by many researchers in recent years. In this paper, we propose an underwater target radiated noise spectrum reconstruction method under a sparse Bayesian learning framework with structured sparsity priors that can achieve high-resolution DOA estimation in the angular domain and, at the same time, reconstruct target spectrum with beamwidth constancy via structured sparsity constraints on the angular domain over different frequencies at no cost of reducing angle resolution. The measured data experiment shows that the proposed method can effectively suppress side lobe interference and preserve more detailed spectral structures, which are important representative and discriminative target characteristics and can be beneficial to target classification.
In fact, the received acoustic signals of a passive sonar array are inevitably corrupted by underwater channel distortion and environmental noise [24]. The highly time-varying underwater acoustic channel will alter the envelope of the target radiated noise spectrum, leading to distortion of the characteristics of the target spectrum and degrading the classification performance. In addition, the spectrum frequency shift due to the Doppler effect can stretch or compress the shape of the frequency spectrum, which is harmful to recognition performance. The Mel Frequency Cepstrum Coefficient (MFCC) feature, as a prevailing feature stemming from the speech recognizer, has been used in underwater acoustic target classification [25,26]. As a cepstrum-based feature [27], MFCC is convenient to process channel distortion because the convolutional composition of the acoustic channel and source signal can be transformed into an additive composition in the cepstrum domain. To maintain the advantages of the cepstrum-based feature, we designed a series of filter banks that can make cepstrum-based features more resistant to frequency shift distortion. A classification experiment conducted on real measured data shows our proposed frequency shift-invariant feature outperforms the traditional Mel-Frequency feature.
The main contributions of this paper are listed as follows:
(1)
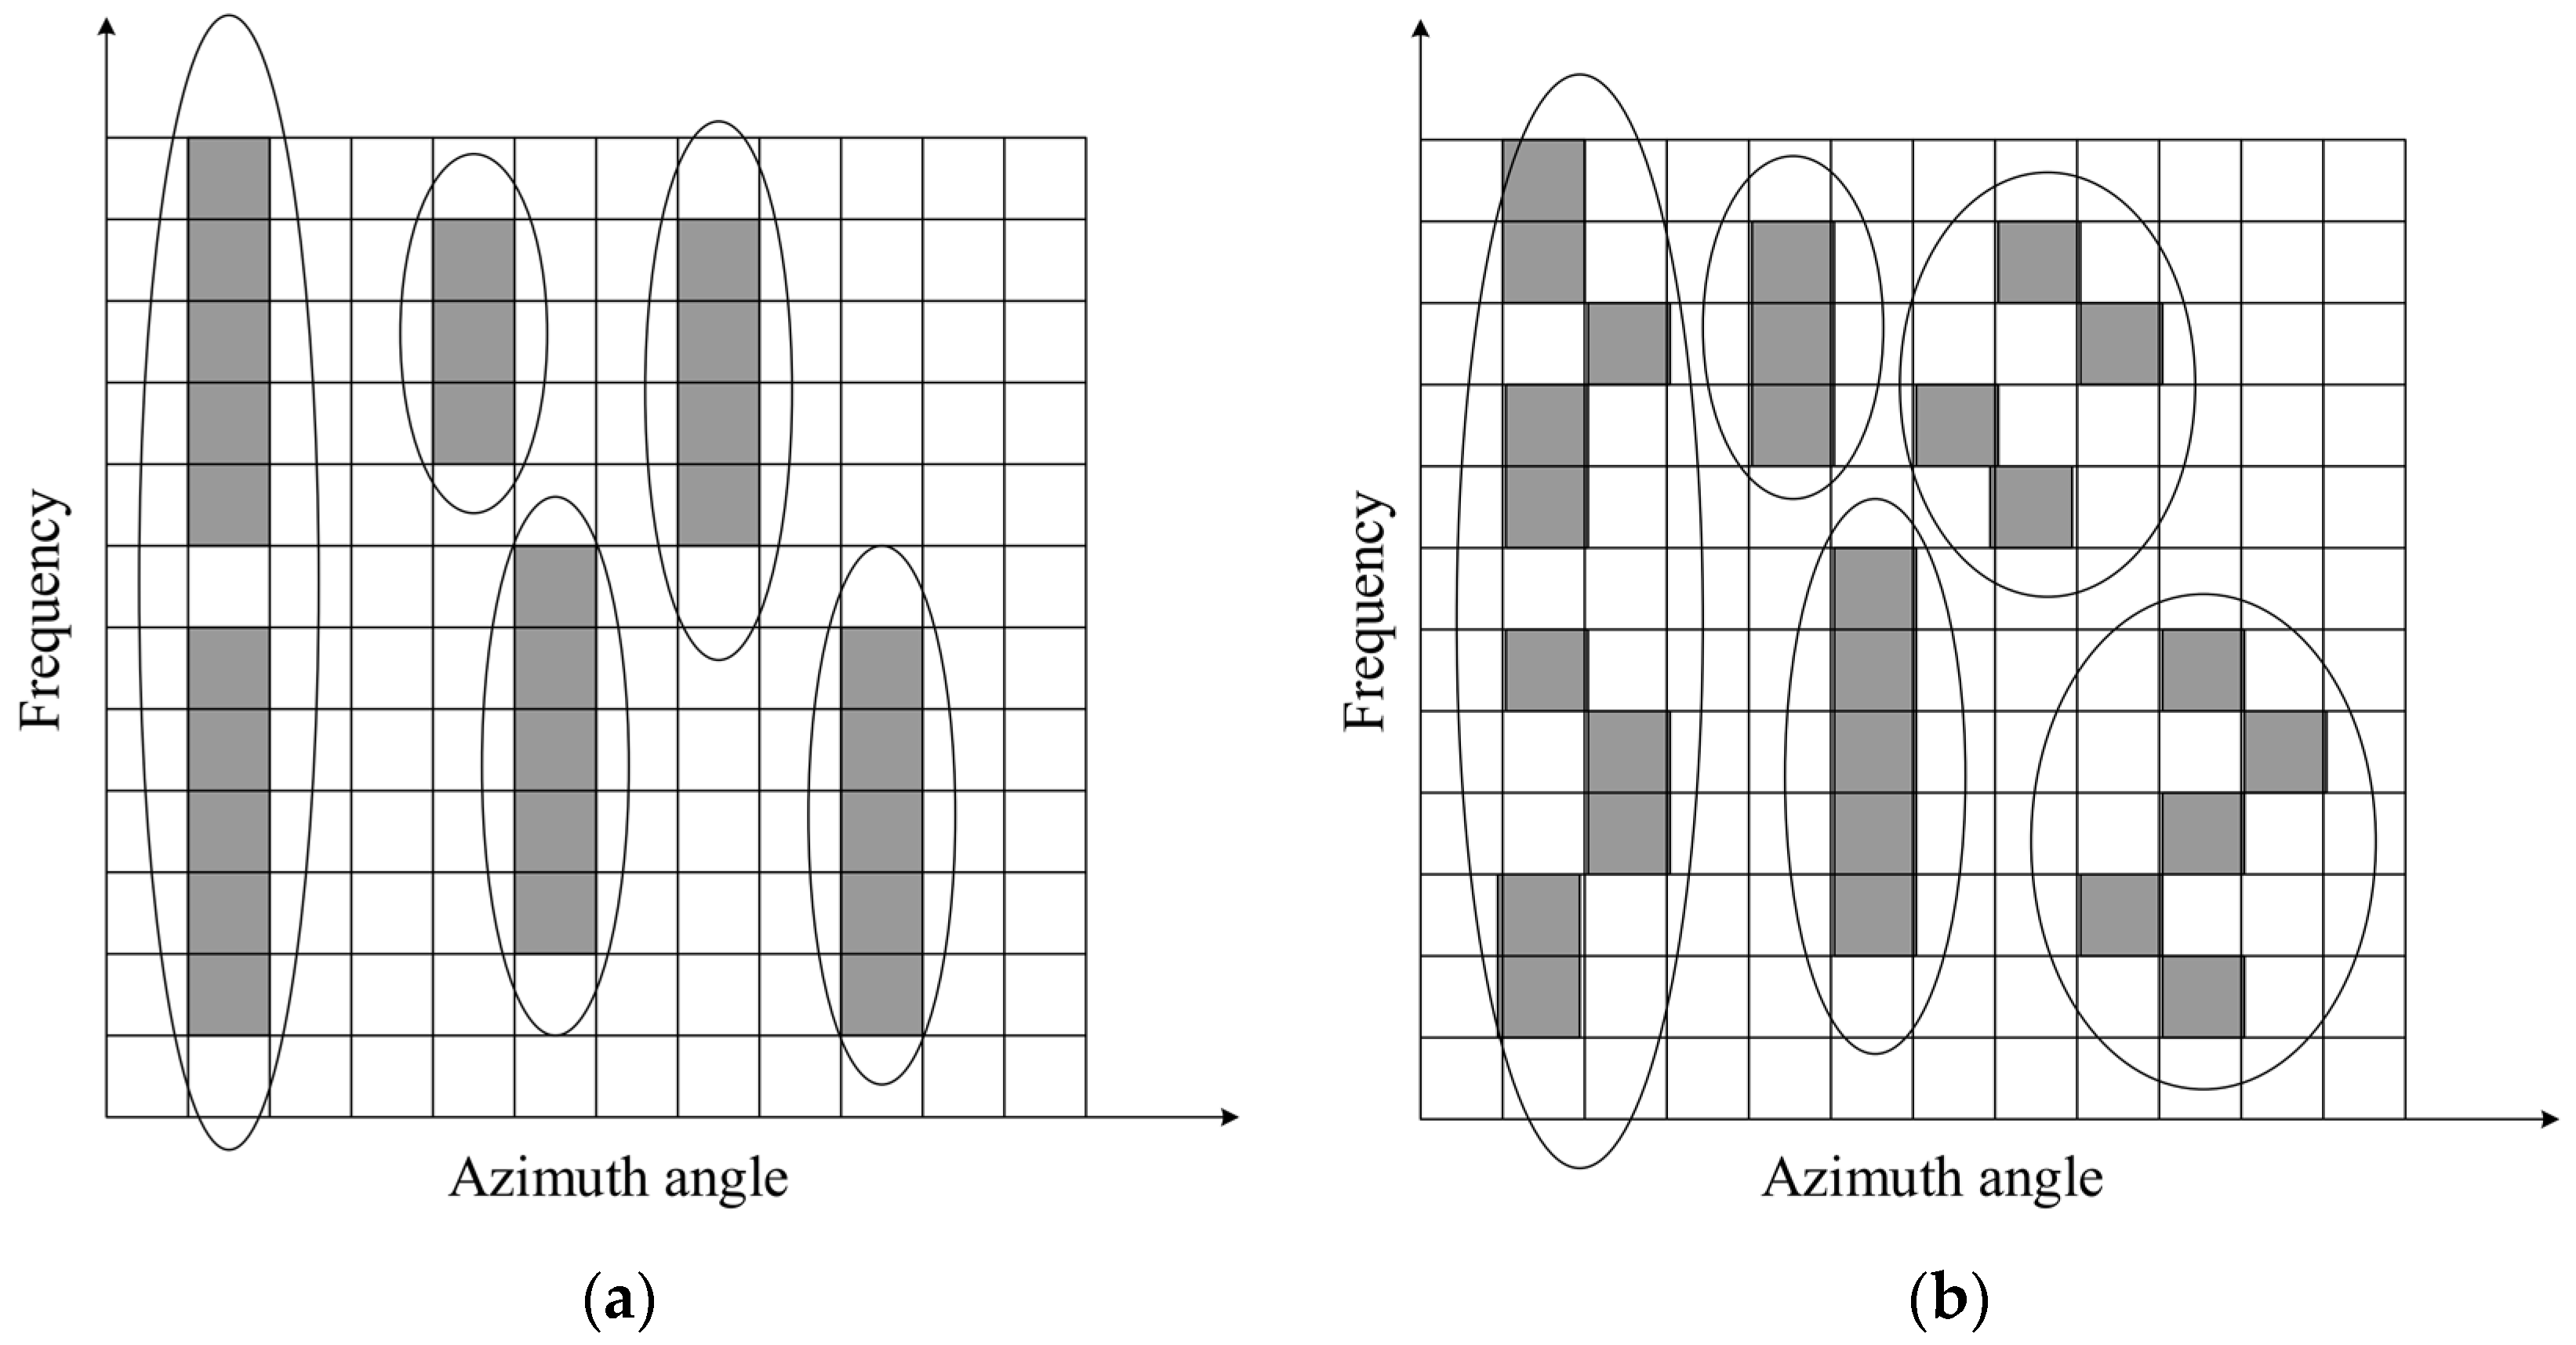
With the help of hydrophone array data, we introduce a sparse decomposition framework with joint sparsity to perform high-resolution DOA estimation and improve the target spectrum reconstruction quality with a higher SNR gain;
(2)
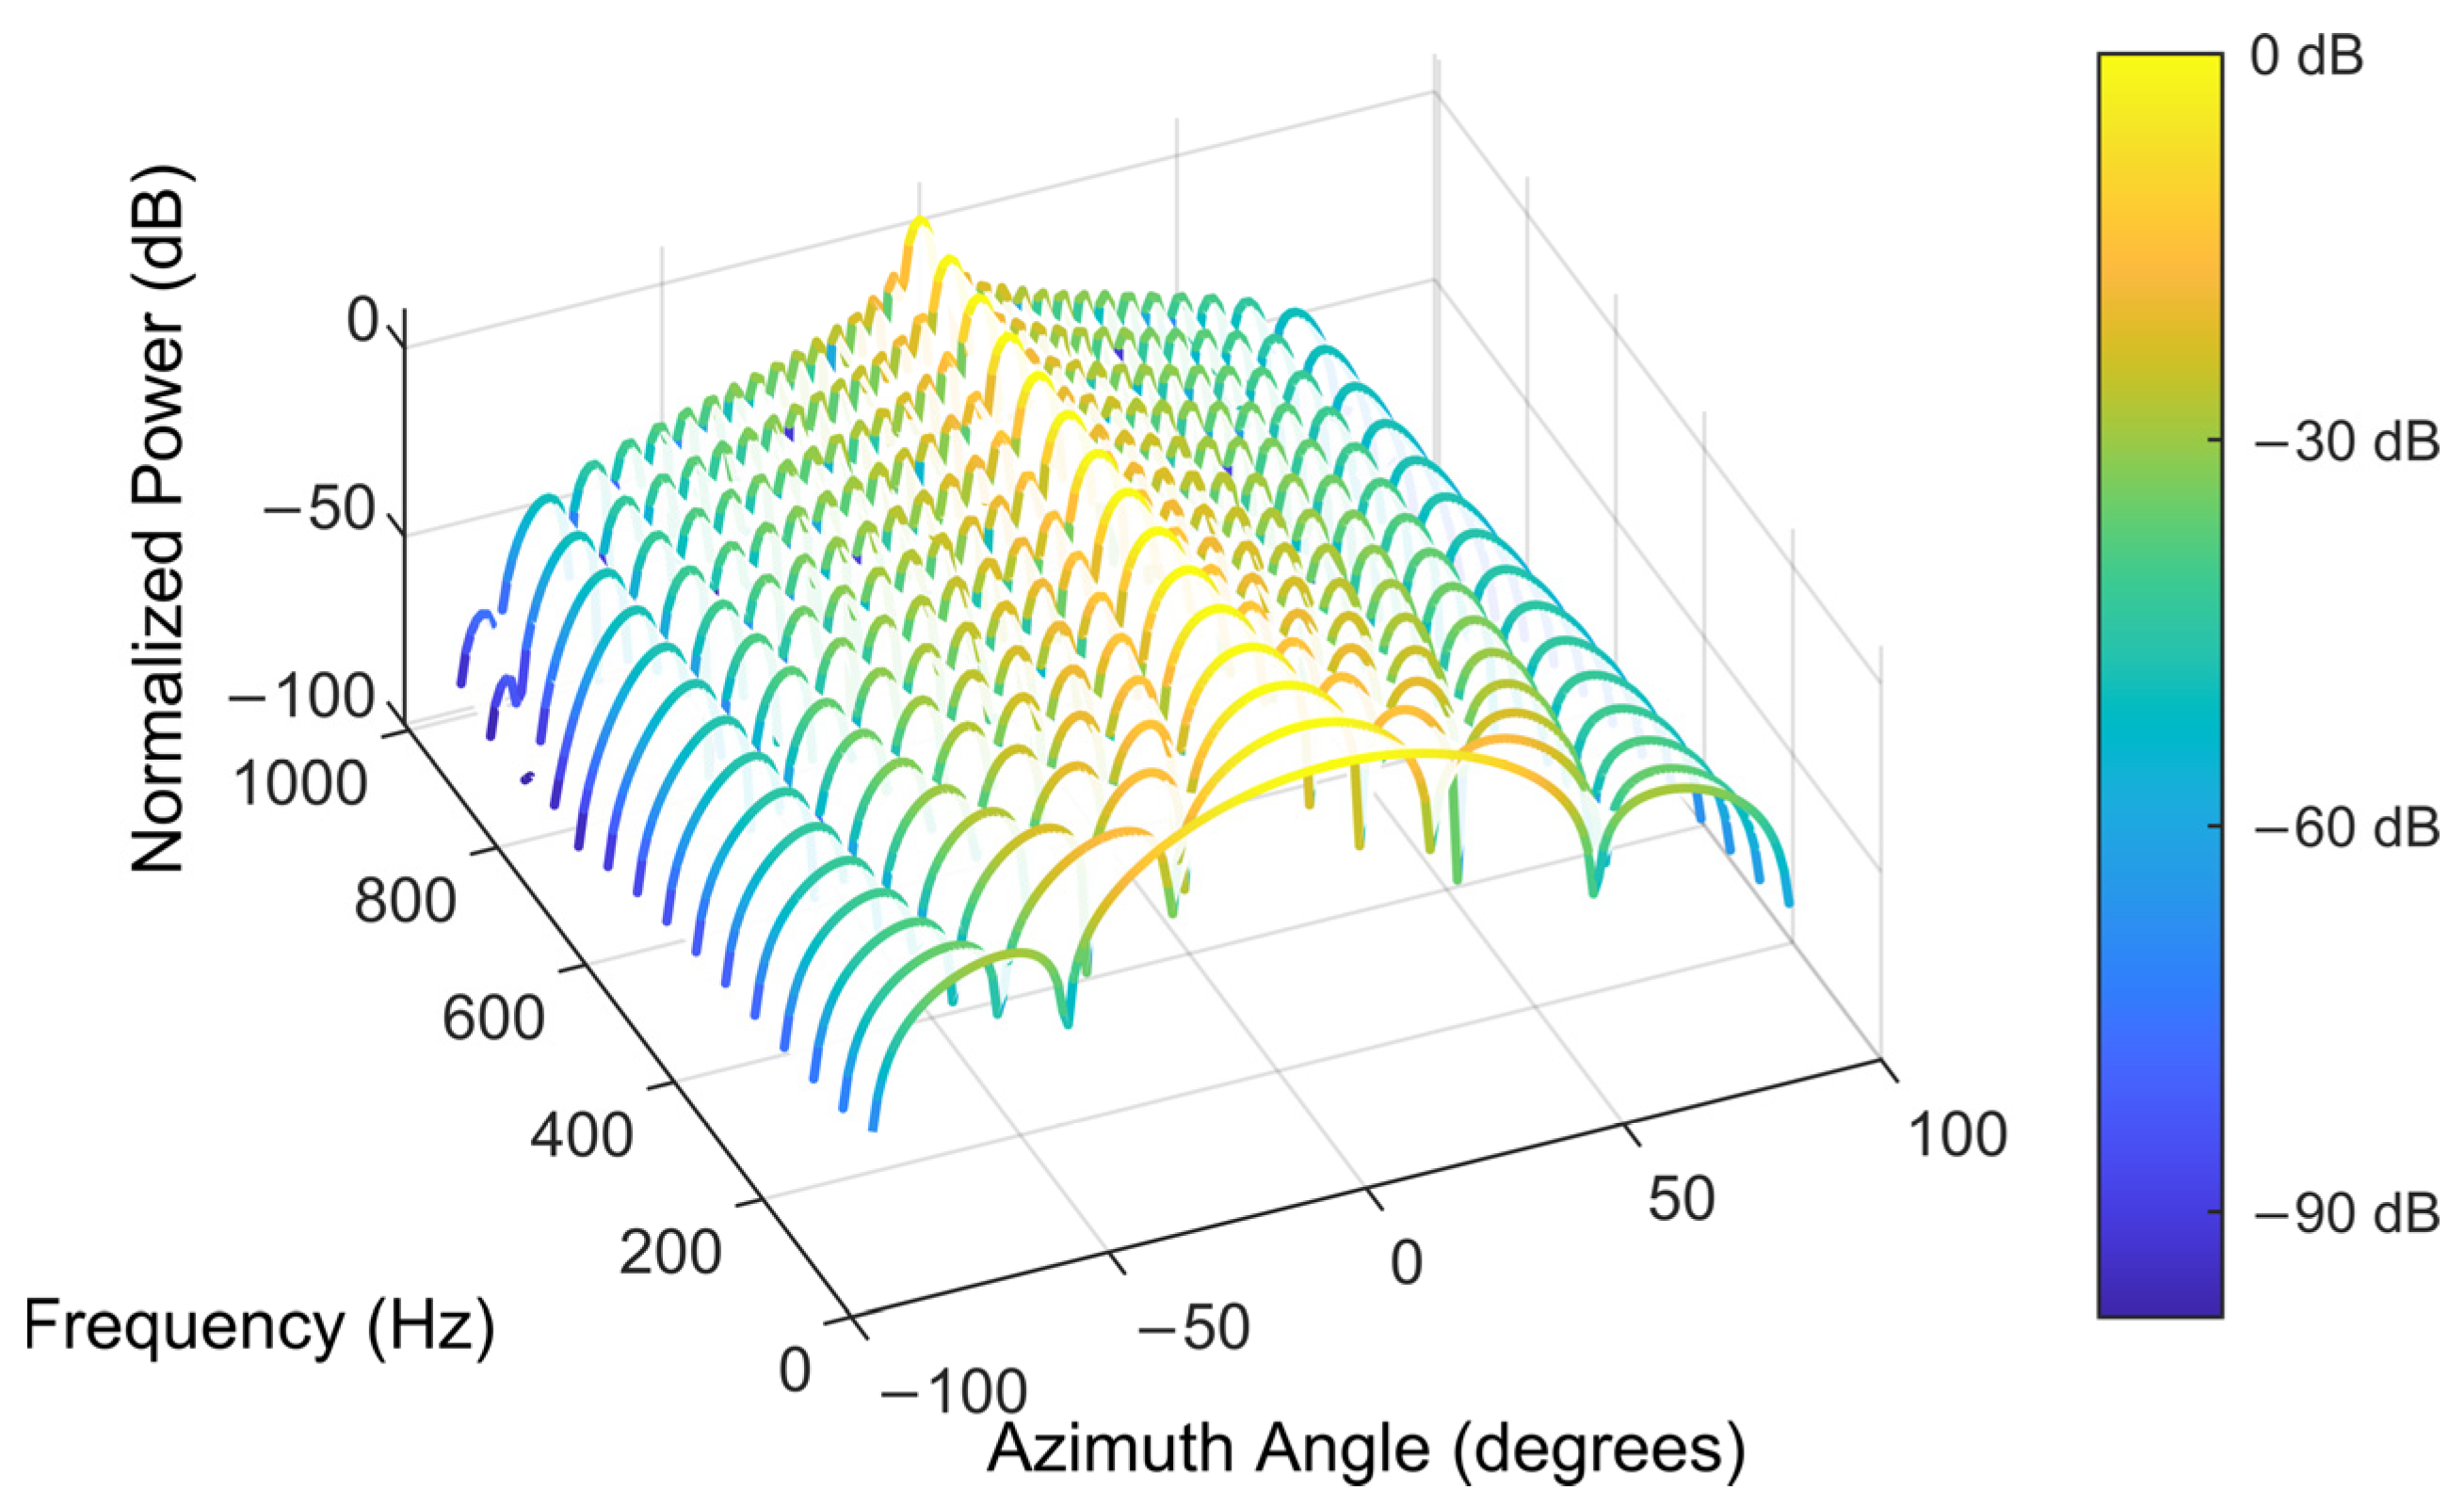
We utilize joint sparsity to attain beamwidth constancy over different frequencies for target spectrum reconstruction, which makes our proposed method able to suppress interference and retain more target representative and discriminative spectral structural characteristics, which can be helpful to target classification tasks. Classification experiment conducted on real measured data validates the importance of attaining beamwidth constancy for underwater target recognition systems;
(3)
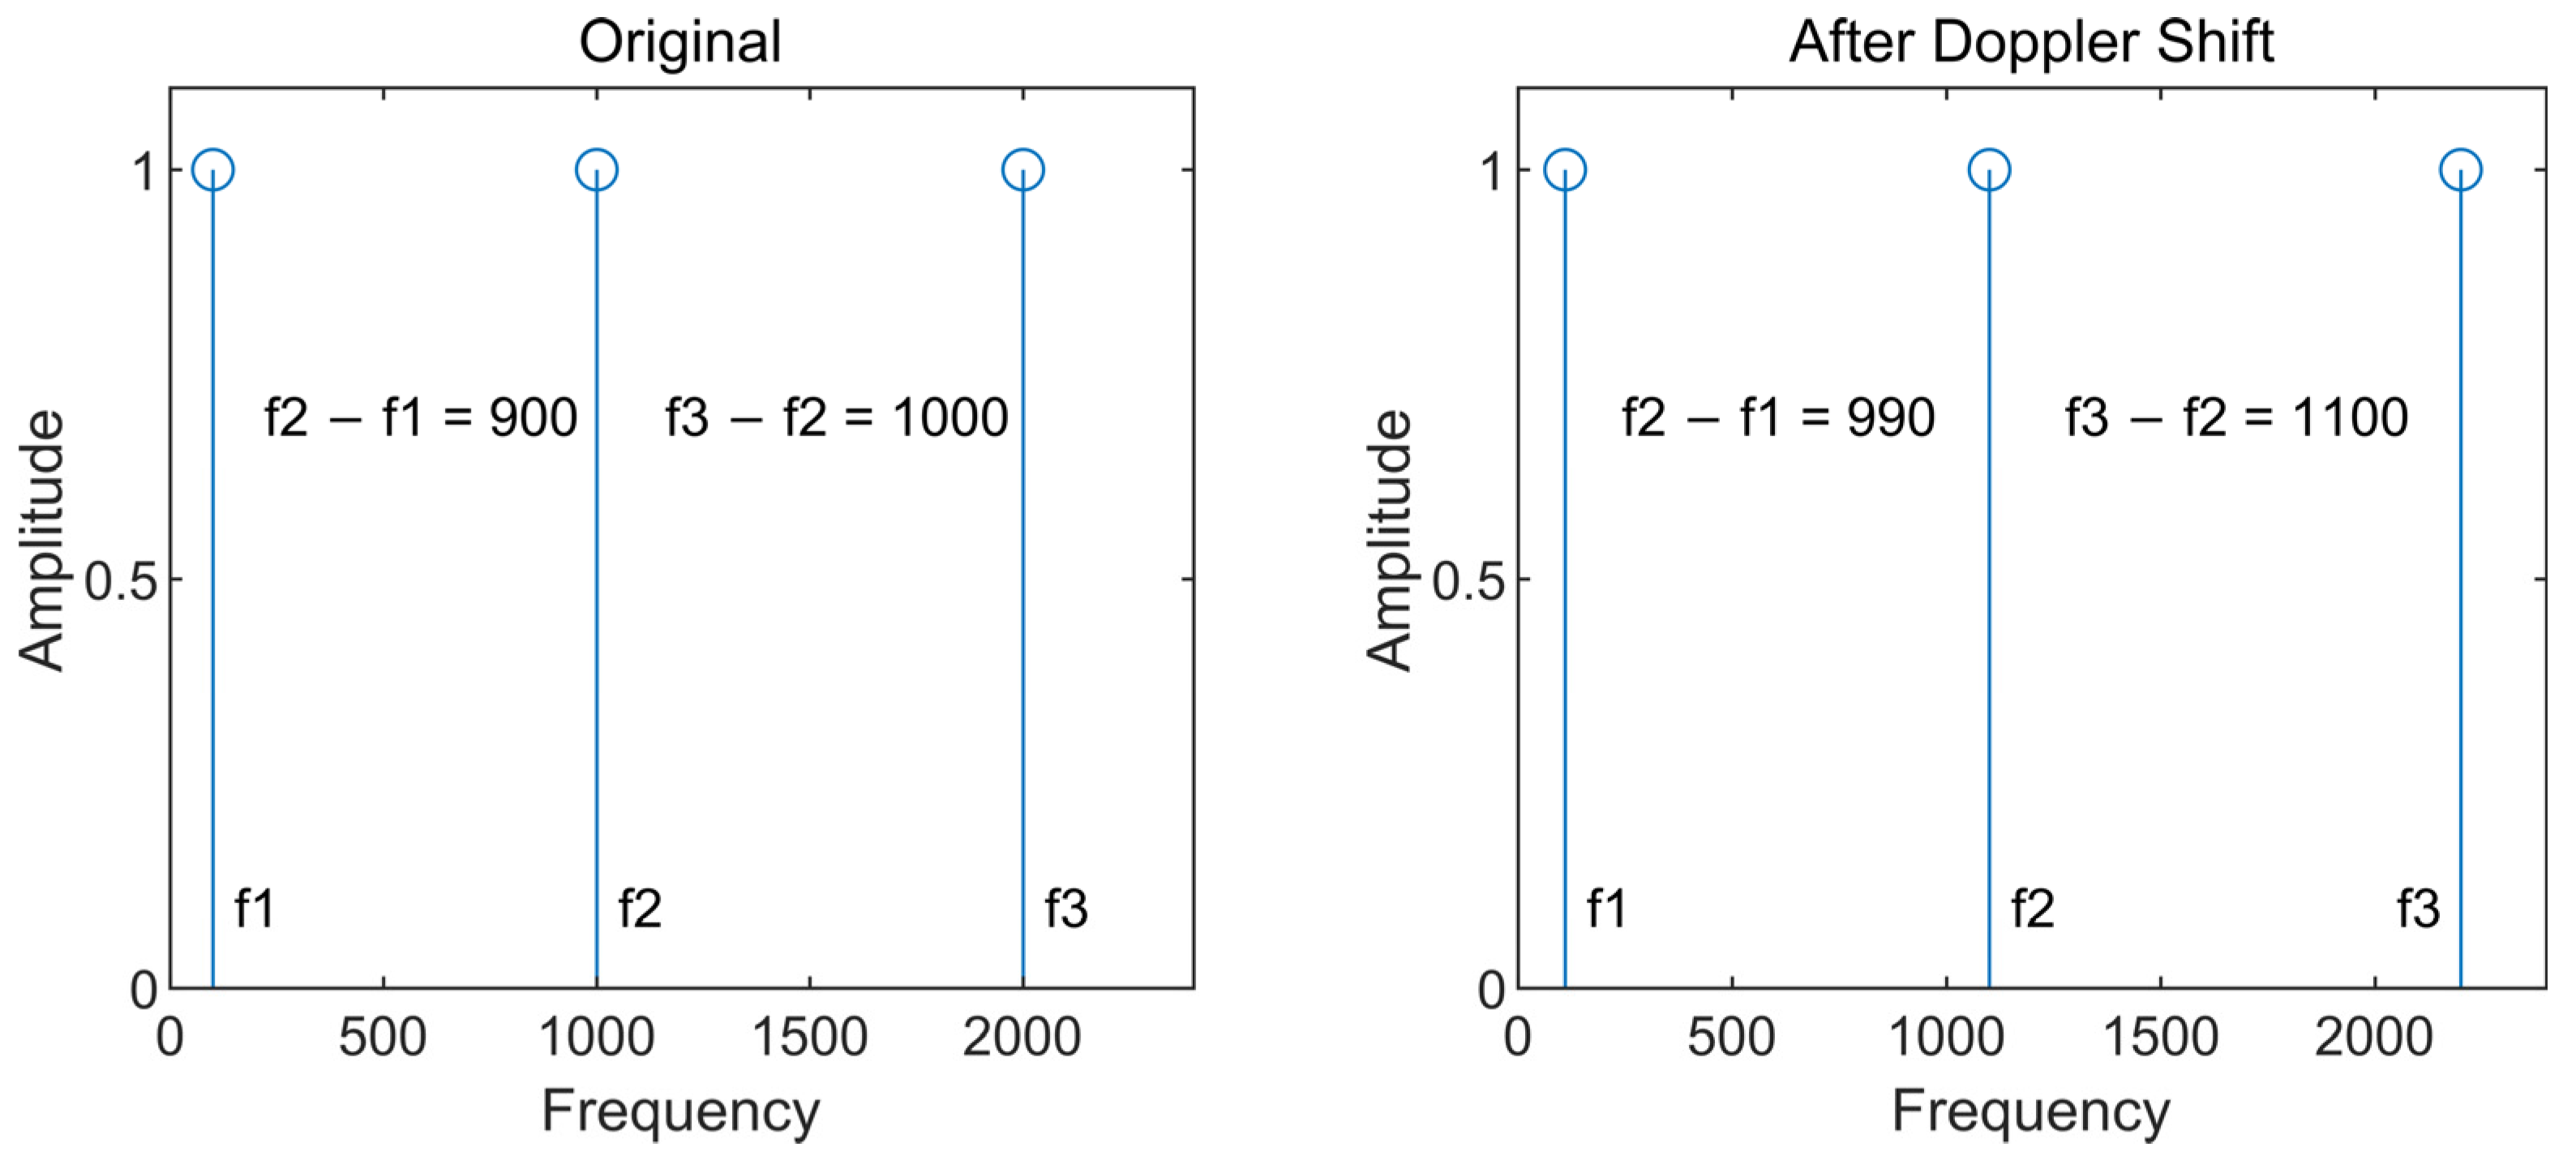
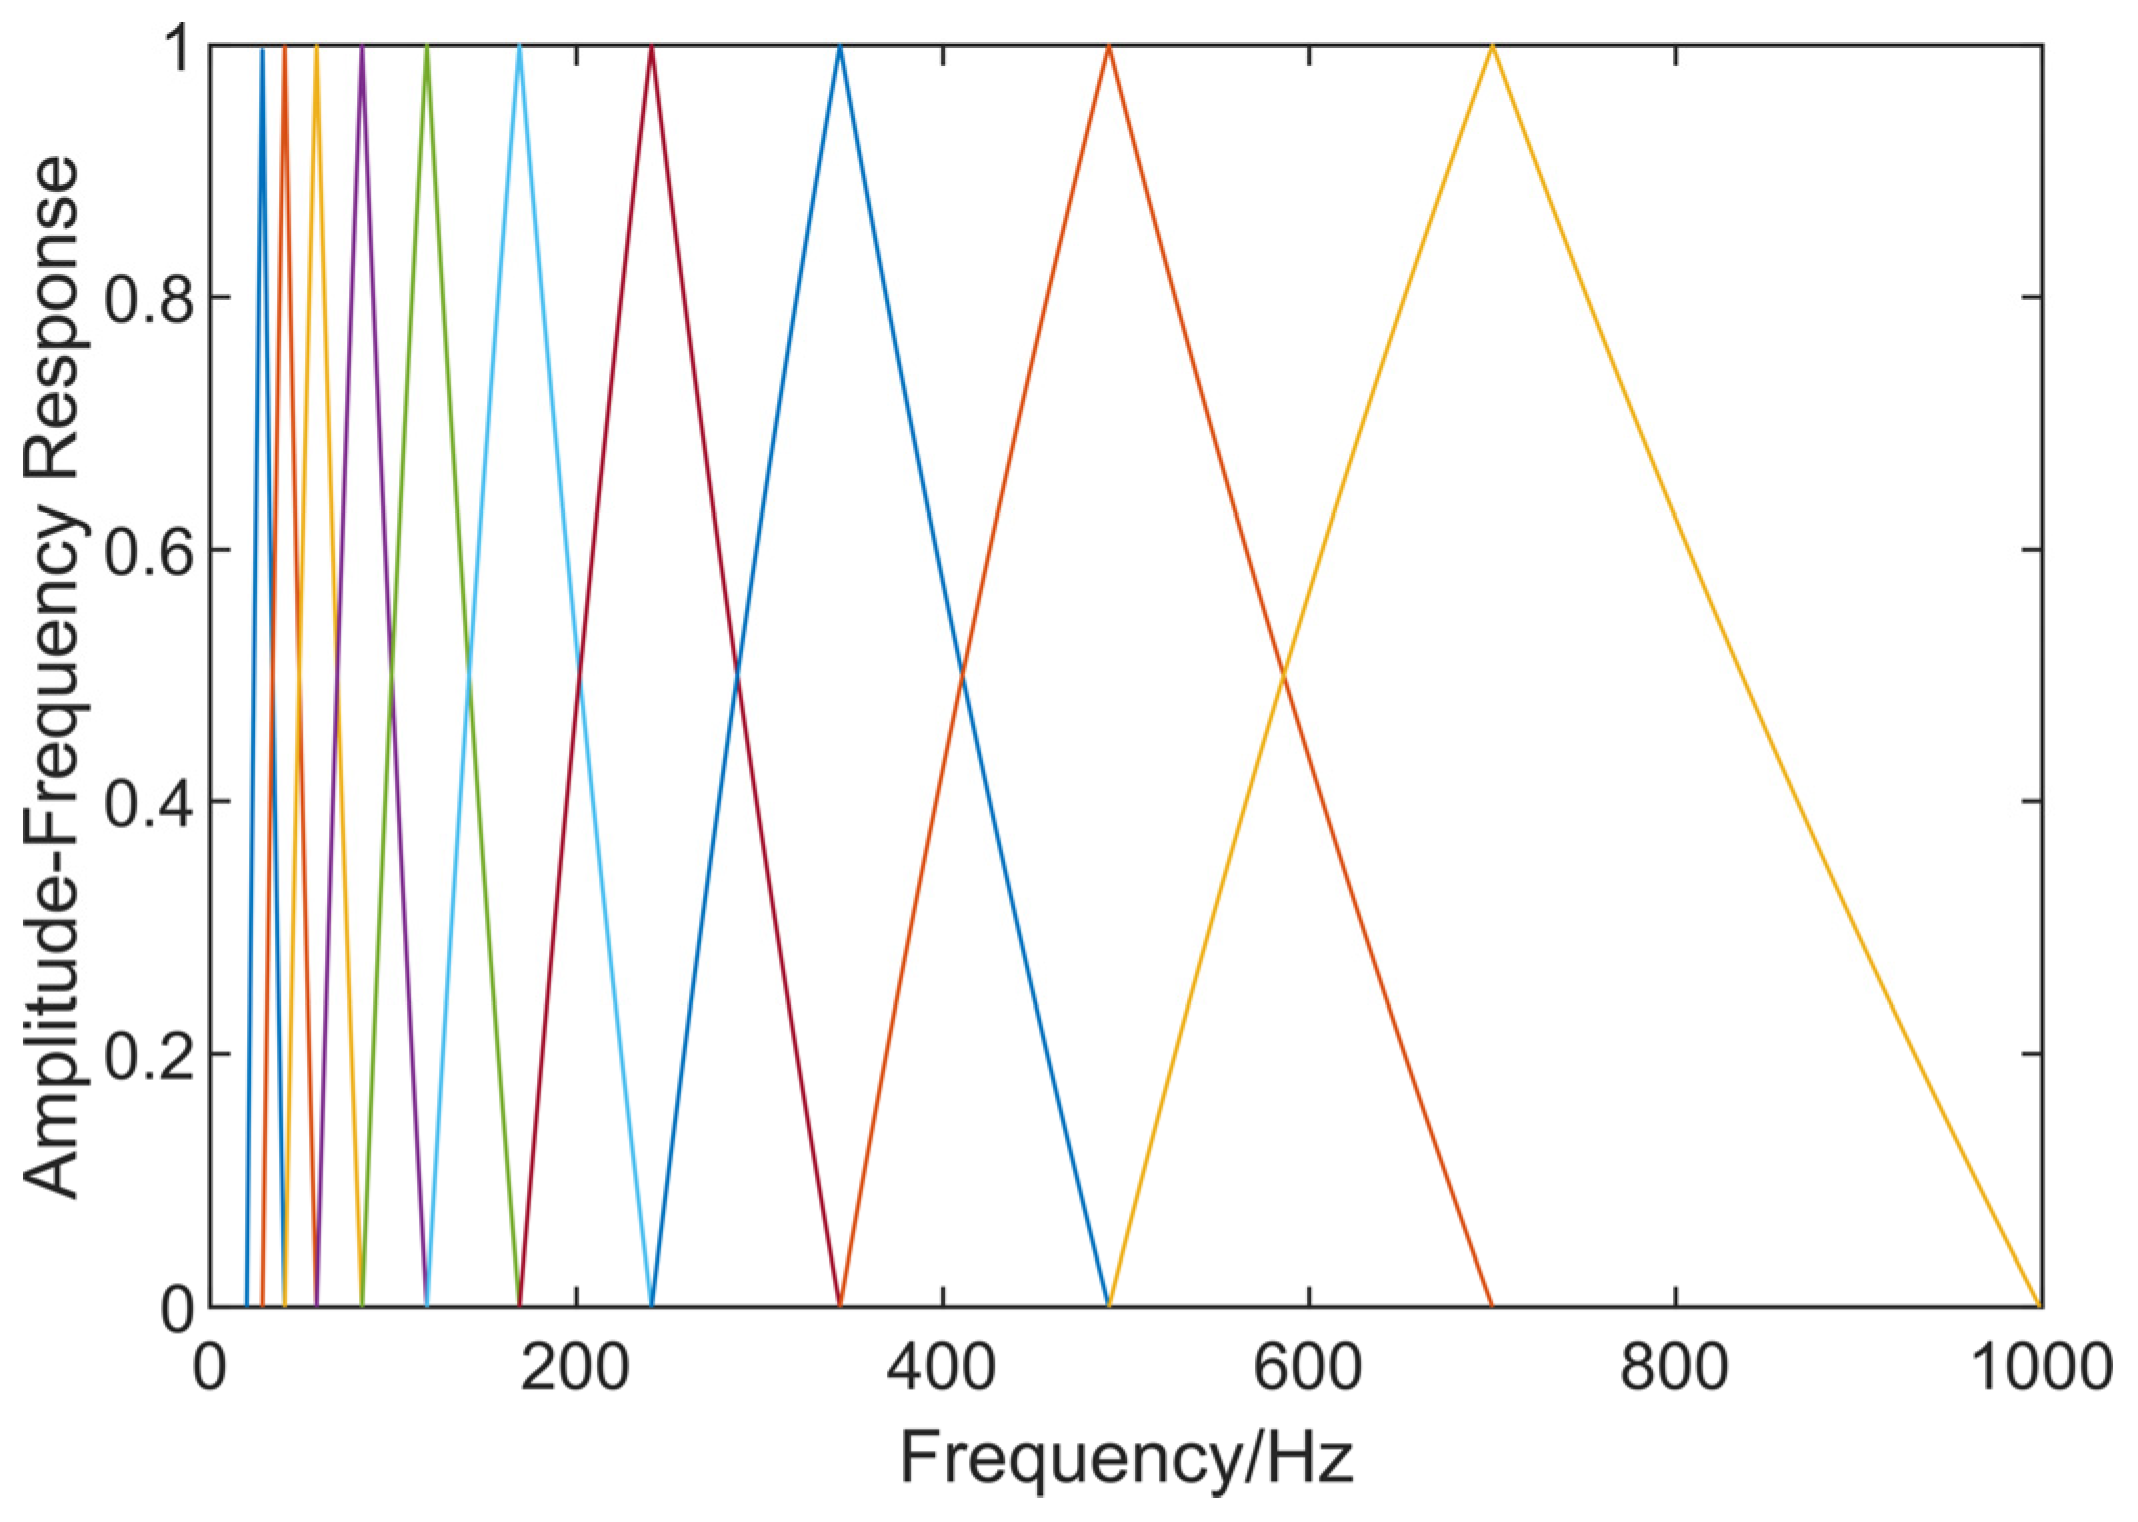
To suppress the negative impact of target spectrum distortion caused by Doppler frequency shift on classification performance, considering that MFCC as a cepstral feature is convenient to process channel distortion, we adopt a similar framework of MFCC feature and design triangular filter banks to extract a frequency shift-invariant feature that is insensitive to spectrum frequency shift distortion and can help improve target classification performance.
The rest of the paper is organized as follows: Section 2 describes the target spectrum reconstruction method based on joint sparsity and the Doppler-shift invariant cepstral feature extraction method in detail. Section 3 shows the effectiveness of the proposed methods on the real data set. Section 4 concludes the paper.

2. Materials and Methods

Given the recorded data from array hydrophones, we need to reconstruct the target signals by spatial filtering from different directions. A wideband conventional beamformer, as the most commonly used method to reconstruct the target signal spectrum in the frequency domain, is described in Section 2.1. To improve target spectrum reconstruction quality and later target recognition performance, in Section 2.2, we introduce a sparse Bayesian learning framework with joint sparsity priors to reconstruct the target frequency spectrum. Moreover, to achieve higher target classification performance, a robust feature extraction method that is resistant to the Doppler effect and underwater acoustic channel effects is proposed and described in Section 2.3.

2.1. Array Signal Model

In the case of the uniform linear array (ULA) composed of M hydrophones with element spacing d , the time delay of the m t h hydrophone relative to the first hydrophone for the direction θ is
τ m ( θ ) = ( m 1 ) d   cos θ / c
where c is the underwater sound speed. Assuming that there are N far-field signals from directions { θ i } i = 1 , N , then the received signal at the m t h hydrophone is
y m ( t ) = i = 1 N s i ( t τ m ( θ i ) ) + n m ( t )
where s i ( ) represents the envelope of the i t h source and n m ( t ) is the additive Gaussian environmental noise at the m t h hydrophone. For wideband underwater target radiated noise, the array received signal can be decomposed into F non-overlapping sub-bands in the frequency domain by using a fast discrete Fourier transform (FFT). In this way, the hydrophone array’s received signal at the frequency f can be denoted as
y ( f i ) = D ( f i ) s ( f i ) + n ( f i ) , i = 1 , 2 , , F
where f i denotes the center frequency of the i t h sub-band, D ( f i ) M × N is the array manifold, and y ( f i ) M × 1 , s ( f i ) N × 1 , n ( f i ) M × 1 are discrete Fourier coefficients of the source signal y ( t ) , s ( t ) and n ( t ) at i t h sub-band respectively. The array manifold D f of directions { θ i } i = 1 , N is defined as
D f = α ( f , θ 1 ) α ( f , θ 2 ) ... α ( f , θ N )
α ( f , θ n ) = [ 1 , e j 2 π f d cos ( θ n ) c , , e j ( M 1 ) 2 π f d cos ( θ n ) c ] T
where α ( f , θ n ) is the steering vector of direction θ n . For the target from the direction θ , the reconstructed frequency spectrum composed of discrete Fourier coefficients on all sub-bands can be denoted as
S θ = s f 1 ( θ ) s f F ( θ ) T
In order to recover the target frequency spectrum S θ , if the target direction θ is known, the phase differences between sensors from direction θ can be compensated and then sum together to produce a spectrum S θ with higher SNR gain. If the target direction is unknown in advance, we can make a DOA estimation of targets of our interest at first.
In the case of conventional beamforming, DOA estimation is performed by beam scanning. The element received signal y i ( t ) is weighted by w i ( θ ) and sum together to produce a spatial power spectrum B ( t , θ ) and then the DOA is estimated according to the peak position in the spatial power spectrum. Under the assumption of a narrowband signal, the weighted array output can be expressed as
B ( t , θ ) = w H ( θ ) y ( t ) = i = 1 M w i ( θ ) y i ( t )
Given a specific frequency f , the array output power spectrum P f ( θ ) can be written as
P f ( θ ) = E | B ( t , θ ) | 2 = w H ( θ ) R w ( θ )
where E { } is the expectation function and R = E { y ( t ) y H ( t ) } is the covariance matrix of array output signal. The array weighted vector w ( θ ) in a conventional beamformer is defined as
w ( θ ) = α ( θ )
Figure 1 shows the spatial response of conventional beamformers at different frequencies. We can find that the conventional beamformer has a narrower main lobe at higher frequencies and a wider main lobe at lower frequencies. This means that the gains within the main lobe region decay with the growth of frequency, which can lead to frequency spectrum distortion. Therefore, a frequency-invariant beamformer is important for better frequency spectrum reconstruction and later target recognition tasks.
In addition, when designing a beampattern with constant beamwidth, we generally adapt a high-frequency beampattern into a low-frequency beampattern instead of the opposite. This is because a low-frequency array beampattern has a wider main lobe and a higher side lobe level, and decreasing the main lobe width comes at the cost of increasing the side lobe level, which can lead to spatial aliasing. In practical application, due to a wider main lobe at low frequency, the energy of the interfering signal near the target can be leaked into the target signal, which harms the target recognition task. Therefore, the traditional method of beamformer design has limitations for underwater target recognition systems.

2.2. Constant Beamwidth Spectrum Reconstruction via Joint Sparsity

To overcome the above problems, we introduce a sparse Bayesian learning framework and joint sparsity priors to perform high-resolution DOA estimation and constant beamwidth target spectrum reconstruction at the same time. The angular domain can be divided into a discrete angular grid { θ k } k = 1 , K , where K determines the angular resolution. For ULA, An over-complete dictionary A f = α ( f , θ 1 ) α ( f , θ 2 ) ... α ( f , θ K ) composed of steering vectors can be formed according to the angular grid { θ k } k = 1 , K with k - t h atom α ( f , θ k ) = [ 1 , e j 2 π f d cos ( θ k ) c , , e j ( M 1 ) 2 π f d cos ( θ k ) c ] T that corresponds to the steering vector from the direction θ k . The received signal filtered by the Discrete Fourier Transform (DFT) filter bank into F sub-bands can be written as
y f = A f x f + n f , f = 1 , 2 , , F
where y f M × 1 and n f M × 1 are received narrowband signal and additive environment noise respectively. Because the number of signals impinging on the array is considered much less than that of the discrete angular grid { θ k } k = 1 , K , the coefficient vector x f K × 1 is sparse coefficient vector and its non-zero entries determine the signal incident angles.
Considering that the incident angle of one specific target is unique at a time, the estimated angle over different frequencies is supposed to be the same. In other words, the non-zero supports in sparse coefficient vectors { x f } f = f 1 , f F are supposed to be the same as well. From the perspective of structured sparsity, this is joint sparsity that can be imposed on x f over different narrow bands. In this way, the angle range used for the reconstructed target spectrum over a frequency range is supposed to be the same, which is helpful to improve the consistency of the recovered frequency spectrum. Figure 2a,b illustrate the estimated direction of a target on different frequencies via joint sparsity and the conventional beamforming (CBF) method, respectively. Each circle in Figure 2 indicates a specific target. Considering the incident angle of a specific target is unrelated to frequency, the estimated target direction at different frequencies should remain the same. As shown in Figure 2b, the estimated incident angle via the CBF beam scan method varies over different frequencies. However, in Figure 2a, the incident angle of the same target is constrained by joint sparsity over different frequencies. In this way, our proposed method can improve DOA estimation accuracy and make the reconstructed target spectrum more consistent with the advantage of frequency-invariant beamwidth.
In order to induce joint sparsity, sparse coefficient vectors can be modeled as Gaussian distributions sharing the same covariance matrix under a sparse Bayesian learning framework. For every frequency bin f = f 1 , f 2 , .... f F , the signal model in Equation (10) can be formulated as
p ( y f x f ) = C N ( y f A f x f , α 0 1 I M ) , f = f 1 , f 2 , .... f F
where C N ( ) represents complex Gaussian distribution and I M denotes an identity matrix of size M . To make Bayesian inference of α 0 , a gamma prior Γ ( ) with hyper-parameters a and b is imposed on α 0
p ( λ ) = Γ ( λ a , b )
The prior of sparse coefficient x f is a complex Gaussian distribution with a precision matrix Λ = d i a g ( α )
p ( x f α ) = C N ( x f 0 , Λ f 1 I K ) , f = f 1 , f 2 , .... f F
where d i a g ( α ) represents a diagonal matrix where its main diagonal is the same as the vector α T = [ α 1 α K ] and α is followed by a Gamma prior with hyper-parameters c and d
p ( α ) = k = 1 K Γ ( x k c , d ) , k = 1 , 2 , ... K
In the above model, given the target direction θ k , x θ k shares the same hyper-parameter α k for different frequencies { f 1 , f 2 , , f F } to induce joint sparsity. That is, the non-zero support in sparse coefficients { x f } f = f 1 , f F determining the target directions will be constrained to be shared over different frequencies. In this way, the reconstructed spectrum S θ can attain beamwidth constancy at no cost of reducing angle resolution.
For the above probabilistic model, we resort to the variational Bayesian Expectation and Maximization (VBEM) technique [28] to infer the hidden variables including { x f } f = f 1 , f F , α 0 and α . In summary, these hidden variables are updated by the equations below
x ˜ f = μ f = α ˜ 0 Γ f 1 A f H y f
Γ f = ( Λ ˜ + α ˜ 0 A f H y f ) 1
α ˜ = ( c + F ) / ( d + f = f 1 f F diag ( x f x f H + Γ f ) )
α ˜ 0 = a + M F b + f = f 1 f F ( y f A f μ f 2 2 + Tr ( A f Γ f A f H ) )
where Λ ˜ = diag ( α ˜ ) and Tr ( ) represents matrix trace operation. The algorithm of estimation of the sparse coefficients x f operates in an iterative manner which is summarized in Algorithm 1.
Algorithm 1: Spectrum reconstruction by sparse Bayesian learning with joint sparsity.
Input: Received signal { y f } f = f 1 , f F and Dictionary { A f } f = f 1 , f F .
Output: The reconstructed s θ k from direction θ k
Initialize: hyper-parameters a , b , c , d , hidden variables α . set T h r = 10 6 ,
N m a x i t e r = 100 and iteration counter l = 0
While max f x ˜ f x ˜ f < T h r   o r   l < N m a x i t e r
1.
Update x f by Equation (15);
2.
Update α by Equation (17);
3.
Update α 0 by Equation (18);
4.
l l + 1 ;
end while
x ˜ f is the estimation from the previous iteration
For the target from the direction θ , the reconstructed frequency spectrum can be expressed as
x θ = x f 1 ( θ ) x f F ( θ ) T
Our proposed method can achieve high-resolution DOA estimation and reduce spatial aliasing. For the CBF-based method, strong line spectral energies from other directions can be easily leaked into the target spectrum due to lower angular resolution with a wider main lobe at low frequency and the existence of a side lobe and high-frequency grating lobe. In contrast, our proposed method is not subject to the bias of estimated direction owing to the characteristics of frequency-invariant beamwidth and contributes to more consistent spectrum construction and better target recognition performance. More details of the comparative experiment of target spectrum reconstruction via CBF and our proposed joint sparse method are described in Section 3.2.

2.3. Robust Feature Extraction Method

Suppressing the impact of underwater acoustic channels and target motion parameters is relatively difficult. A good feature extraction method is supposed to be capable of reserving target-related characteristics and suppressing non-related factors, such as environmental noise, underwater acoustic channels, and underwater target motion states. In this chapter, we discuss a cepstral feature extraction method that is robust to underwater acoustic channel effects and Doppler frequency shifts caused by target motion.
The source signal and the underwater acoustic channel are denoted as s ( t ) and h ( t ) , respectively. Then the received signal can be expressed as
y ( t ) = s ( t ) h ( t )
where is the convolution operator. Usually, the channel h ( t ) cannot be estimated, so it is generally impossible to remove it directly.
Considering the highly varying characteristics and multipath effect of the underwater acoustic channel, the channel response H ( f ) can be treated as high-frequency modulated underwater background noise. For the cepstrum, the logarithm of the estimated signal spectrum makes the convolution of the acoustic channel and source signal in the time domain into an additive composition in the cepstrum, expressed as Equation (21), which can make acoustic channel suppression easier on the cepstrum.
log Y ( f ) = log X ( f ) + log H ( f )
This is an important idea behind cepstral features. In the Mel-frequency cepstral coefficients feature [29], the energy of the received signal filtered by the Mel-frequency filter is transformed into cepstrum, and then the discrete cosine transform (DCT) is used to remove the correlation of features to compress most feature information in low-frequency coefficients. To preserve more target-related information and suppress highly varying acoustic channel energy, the final cepstral feature normally keeps only the low-frequency coefficients.
In addition to underwater acoustic channels, the Doppler frequency shift caused by target motion can also lead to target spectrum distortion. The original frequency of target radiated noise is unknown, and the received signal frequency shown in the target spectrum is related to the target motion state and not necessarily equal to the original frequency. Figure 3 shows the spectrogram of one moving target, where the frequency of the prominent spectral line components changes over time and the frequency changing rate increases as frequency increases. The frequency change caused by the Doppler shift is not intrinsic information about the target itself and is harmful for target classification. Therefore, extracting the frequency shift-invariant feature is important for robust target classification under such critical circumstances.
For the Doppler effect, the received signal frequency is proportional to the transmission frequency:
f r = α f s
where α is related to the target motion state. If the original frequency is f 1 , f 2 , , f F , then the received frequency is α f 1 , α f 2 , , α f F .
Figure 4 illustrates the Doppler frequency shift on the frequency spectrum on a linear frequency scale. We can find that the relative position of frequencies f 1 , f 2 and f 3 is affected by the Doppler effect. This implies that the Doppler effect can have a heavy impact on the shape of the target frequency spectrum. If filters with linear frequency scales are used, the frequencies on the spectrum or cepstrum will be shifted to lower or higher frequencies due to the Doppler effect.
Figure 5 illustrates the Doppler frequency shift on the frequency spectrum in the logarithmic frequency scale. We can find that the relative position of frequencies in the logarithmic scale is not affected by the Doppler effect. Doppler frequency shift in linear frequency scale can be regarded as fixed shifting in logarithmic frequency scale, which means that the shape of the frequency spectrum or cepstrum is not stretched or compressed by Doppler frequency shift in logarithmic frequency scale. Therefore, the idea of using filters in the logarithmic frequency scale to resist the distortion is inspired.
A series of filter banks can be designed to transform the received frequency α f 1 , α f 2 , , α f F in a linear frequency scale into log α + log f 1 , log f 2 , , log f F in logarithmic scale. For this purpose, we propose a method for the design of a triangular filter within the frequency range f l , f h . In total M filter banks are formed and distributed uniformly on a logarithmic frequency scale. The center frequency, upper and lower frequency are expressed as
log f 0 m = m M ( l o g f h l o g f l ) + l o g f l
log f l m = m 1 M ( l o g f h l o g f l ) + l o g f l
log f h m = m + 1 M ( l o g f h l o g f l ) + l o g f l
where f l m and f l m are defined as the center frequency, upper and lower frequency of the m t h filter. The amplitude-frequency response of the m t h filter can be defined as
W ( f m ) = log f m log f l m log f 0 m log f l m ,   f l m < f m < f 0 m log f m log f h m log f 0 m log f h m ,   f 0 m < f m < f h m 0                                             others
The amplitude-frequency response of the proposed triangular filter banks is illustrated in Figure 6. The designed triangular filter banks are uniformly divided in logarithmic scale and thus make the spectrum stretch and compress in linear scale into a plain phase shift in logarithmic scale, which can relieve the distortion caused by Doppler frequency shift and improve the feature robustness to target motion state.
The energy of the received signal filtered by the m t h Mel-frequency filter W m ( f ) can be written as
E m = H ( f ) f = f l ( m ) f h ( m ) W m ( f ) | S ( f ) |  
where S ( f ) is the spectrum energy of the frequency f and H ( f ) is the transfer function of the underwater acoustic channel. To suppress modulated acoustic channels, which can be seen as the high-frequency modulated underwater background noise, we follow the framework of MFCC and use the cepstral energy log E m instead of E m . With the help of the triangular filter banks in the logarithmic frequency scale, the Doppler frequency shift is turned to be a frequency-invariant offset. These offsets which are not target-related information are supposed to be removed for the target classification task. For this purpose, the Fourier transform is performed on log E m , and then the phase is removed. The extracted feature can be computed by
C ( i ) = m = 1 M log E m exp j ( m 1 2 ) i π L             i = 1 , 2 , , L

3. Results

3.1. Experimental Settings

The dataset used in the experiment was collected under real ocean circumstances with a hydrophone array of 256 m long and 96 sensors. Due to the hardware limit of a 2048 Hz sampling frequency, the analysis frequency range is selected from 10 Hz to 900 Hz. For both CBF and sparse reconstruction methods, the incident angles are set from 0° to 180° with a 0.5° step. The underwater targets of our interest are discovered and traced in the bearing-time record (BTR) plot, which is commonly used in discovering and localizing targets in passive sonar [30].
The dataset in classification experiments includes four types of underwater targets from around 48°, 55°, 107°, and 126°, respectively, in the BTR plot. The duration of each type of underwater target noise is approximately 500 s. The signal frame length is 0.5 s, and four types of targets contain 984, 998, 988, and 978 valid frame samples. In classification experiments, together with corresponding target labels, the half samples are used to train SVM (support vector machine) [31] classifier models with cross-validation and grid search to find the best classifier parameter combination, and the remaining half samples are used as testing samples to evaluate the classification performance of the trained classifier. We partition sample data on purpose to allow the largest data difference.

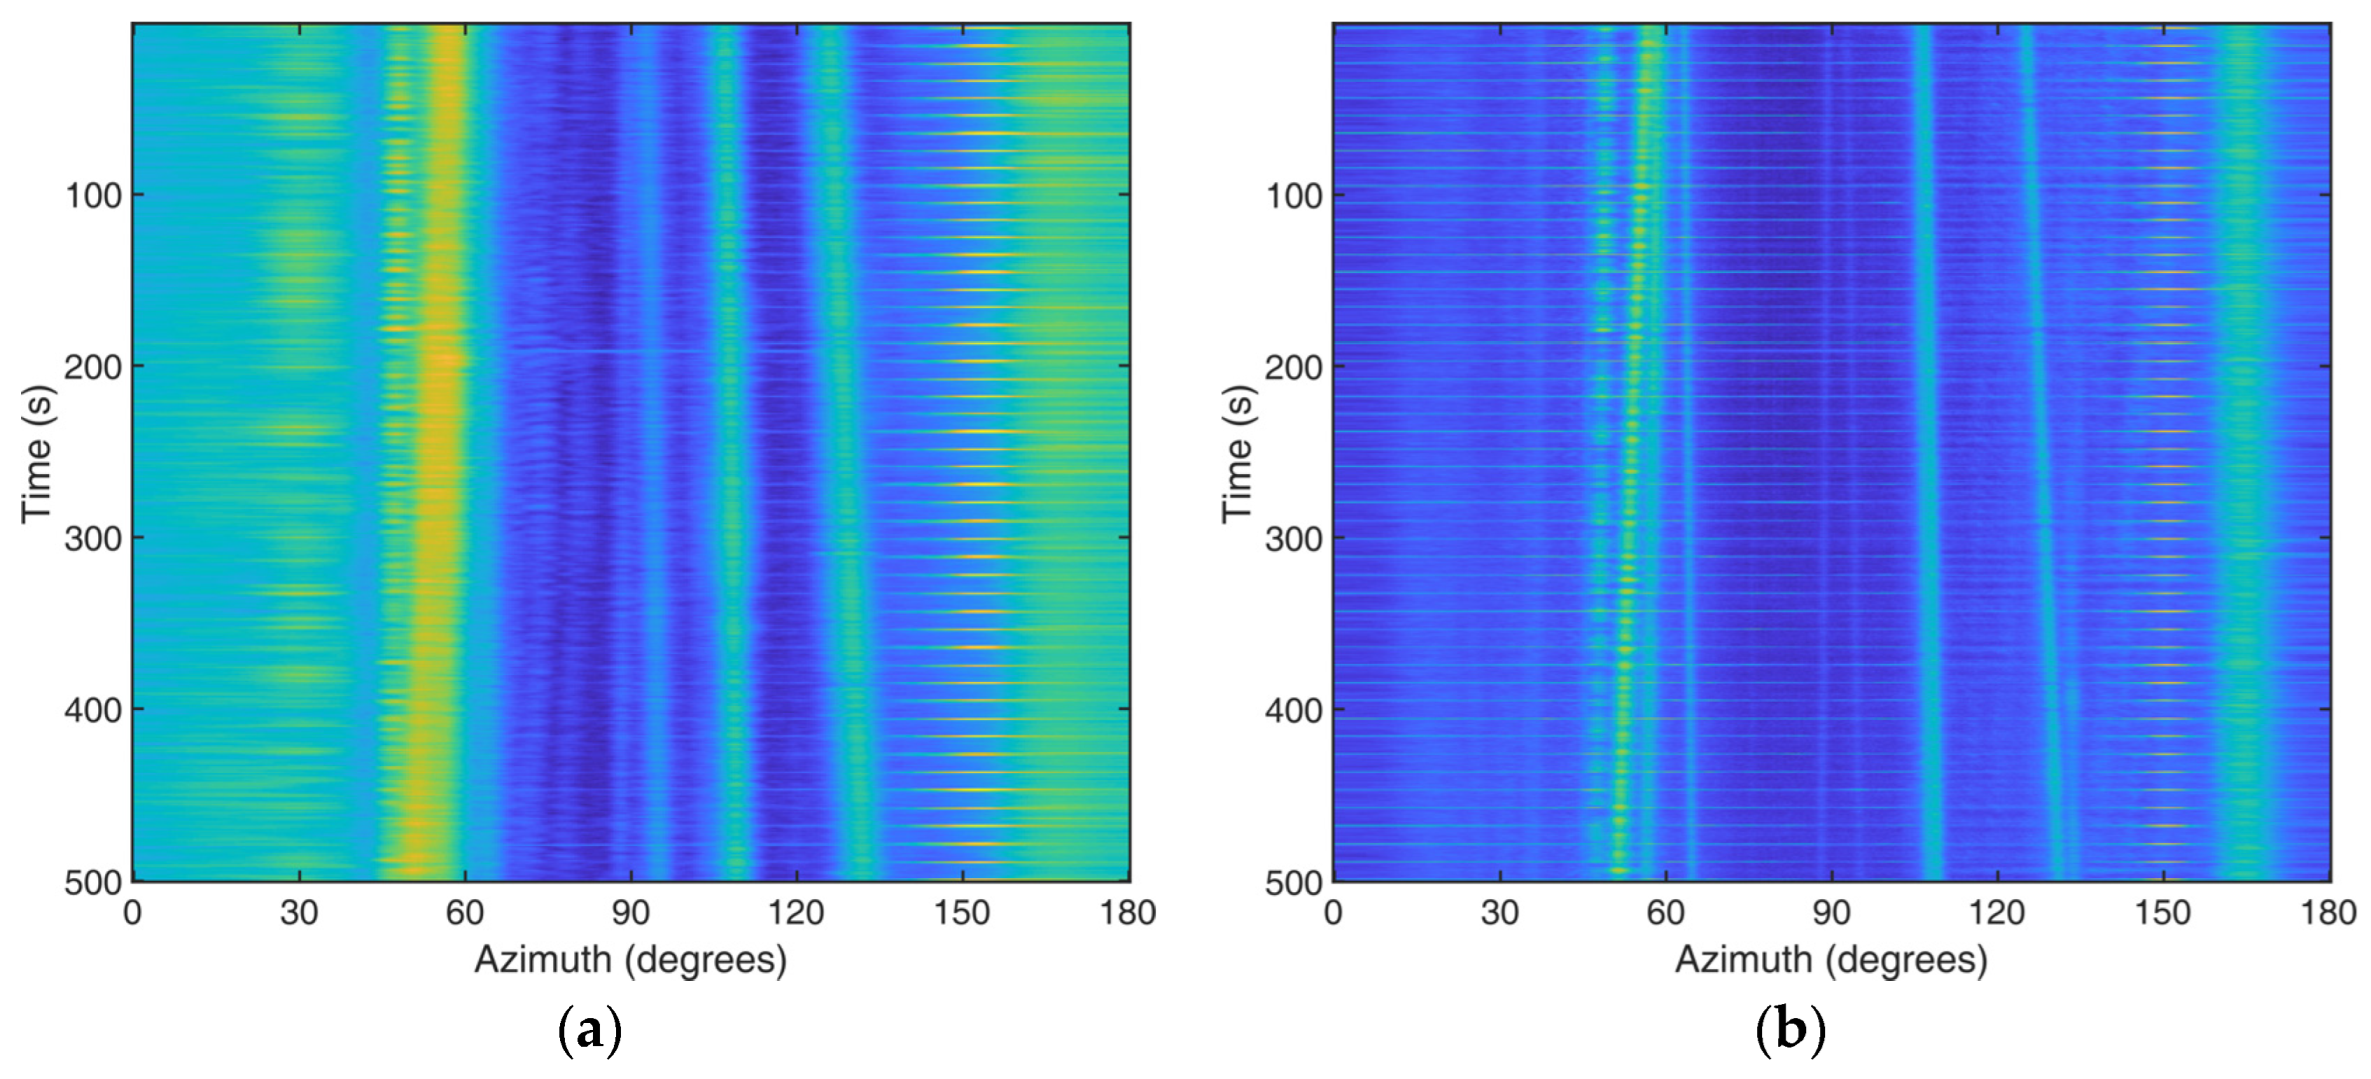
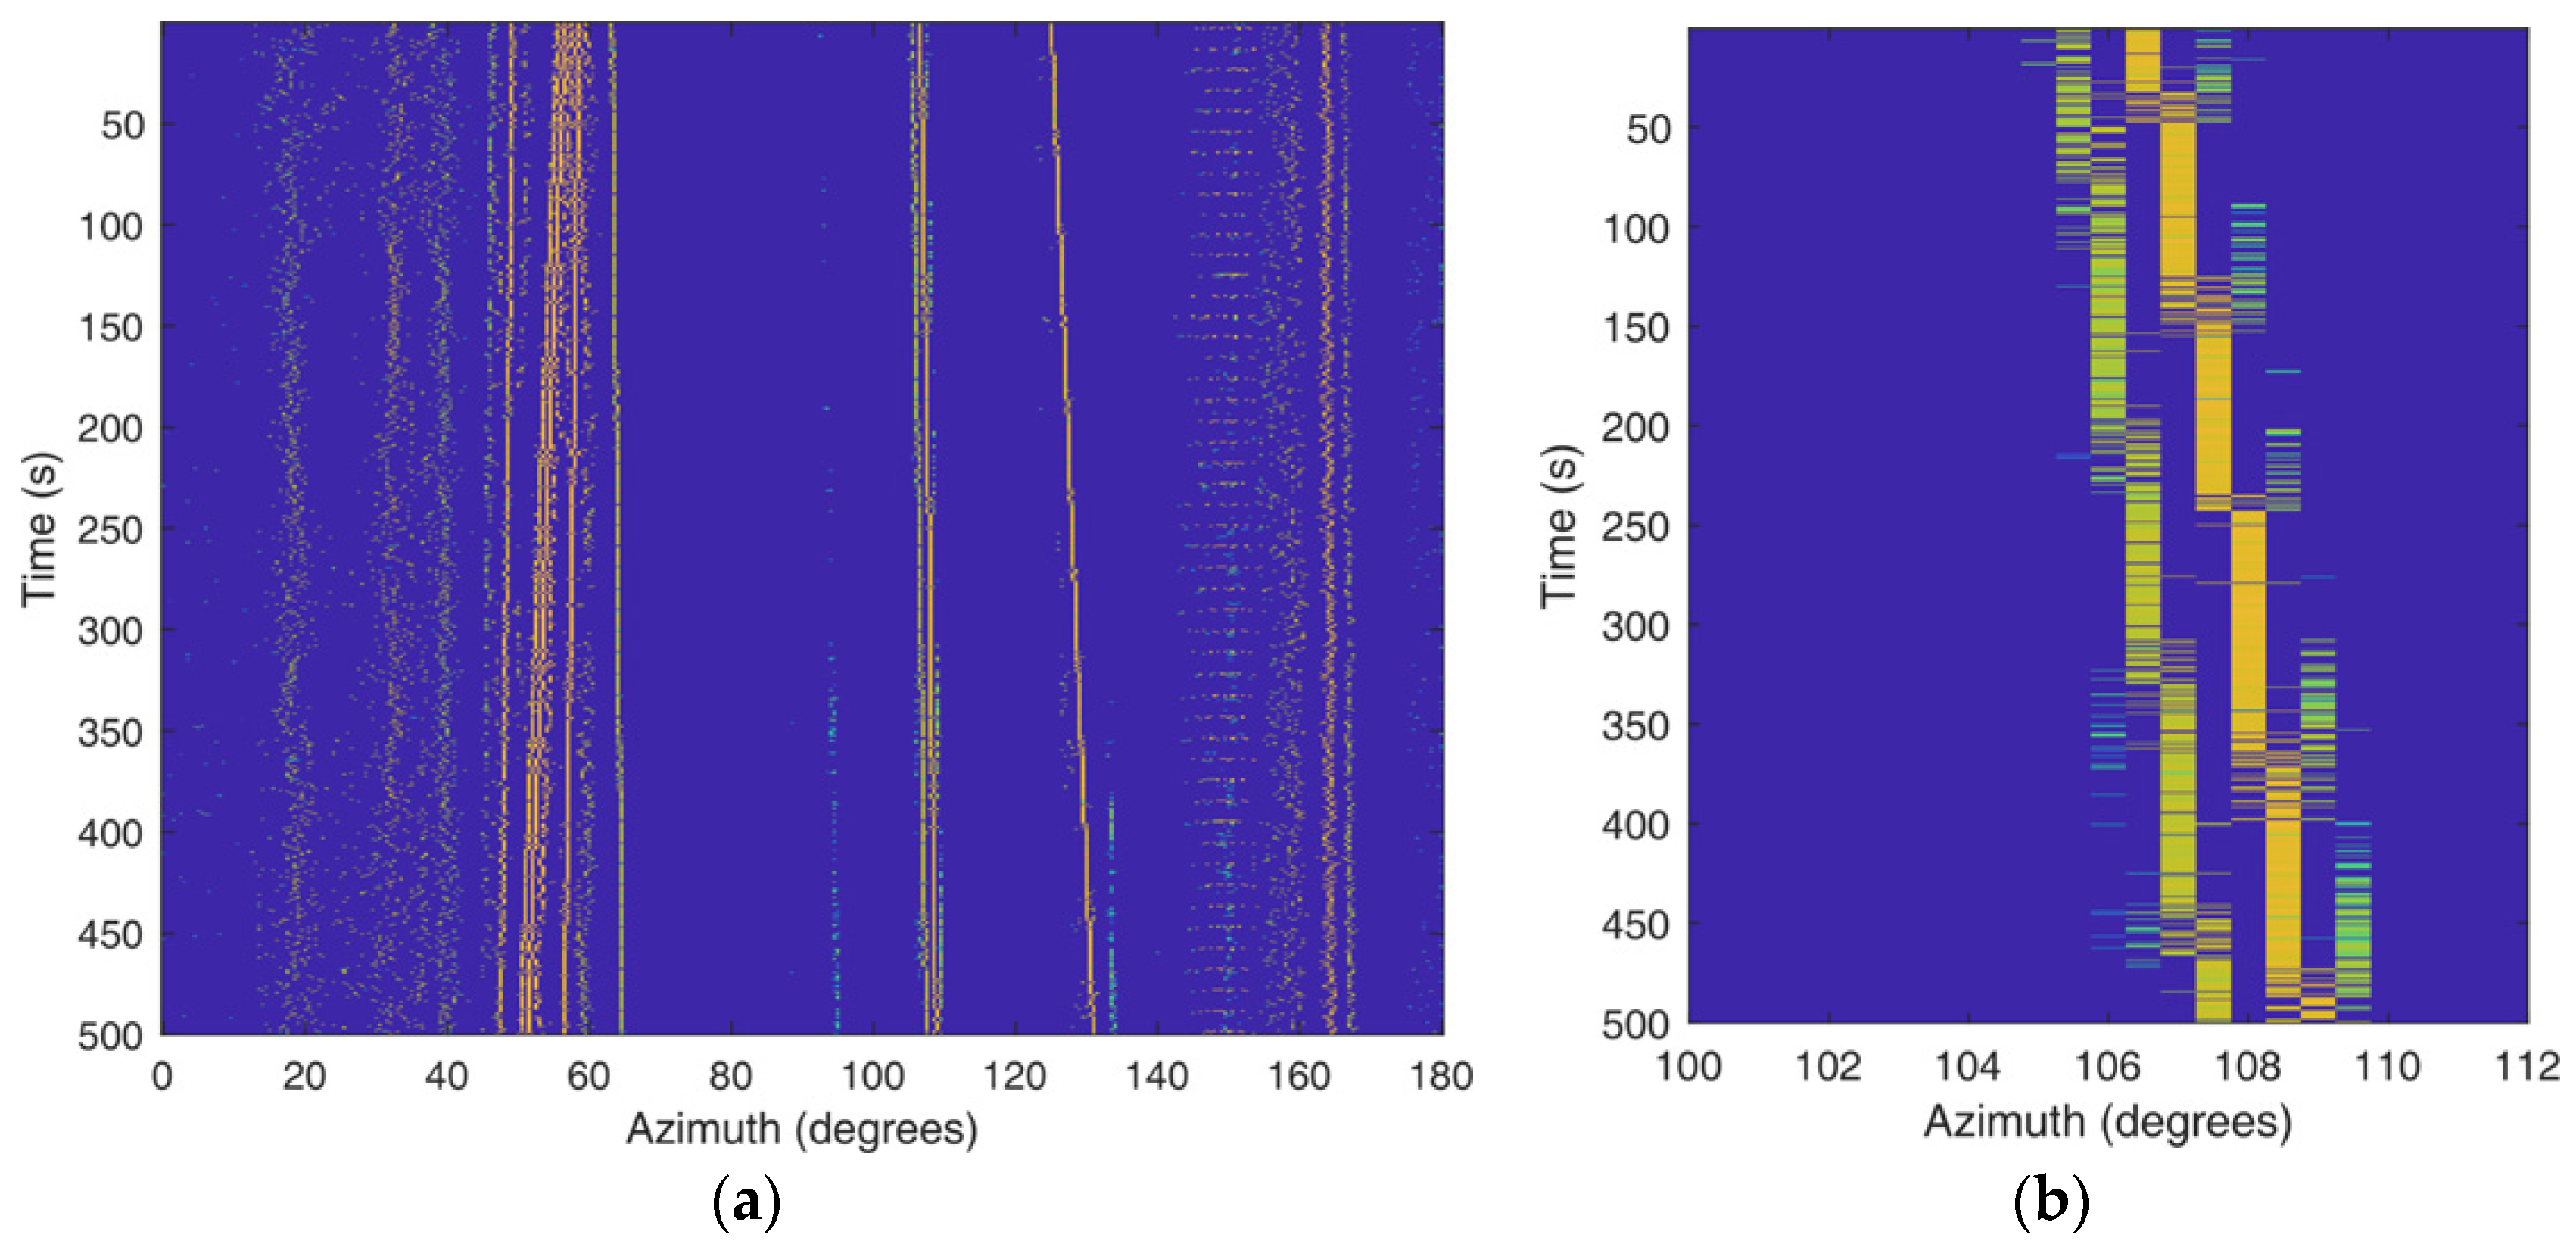
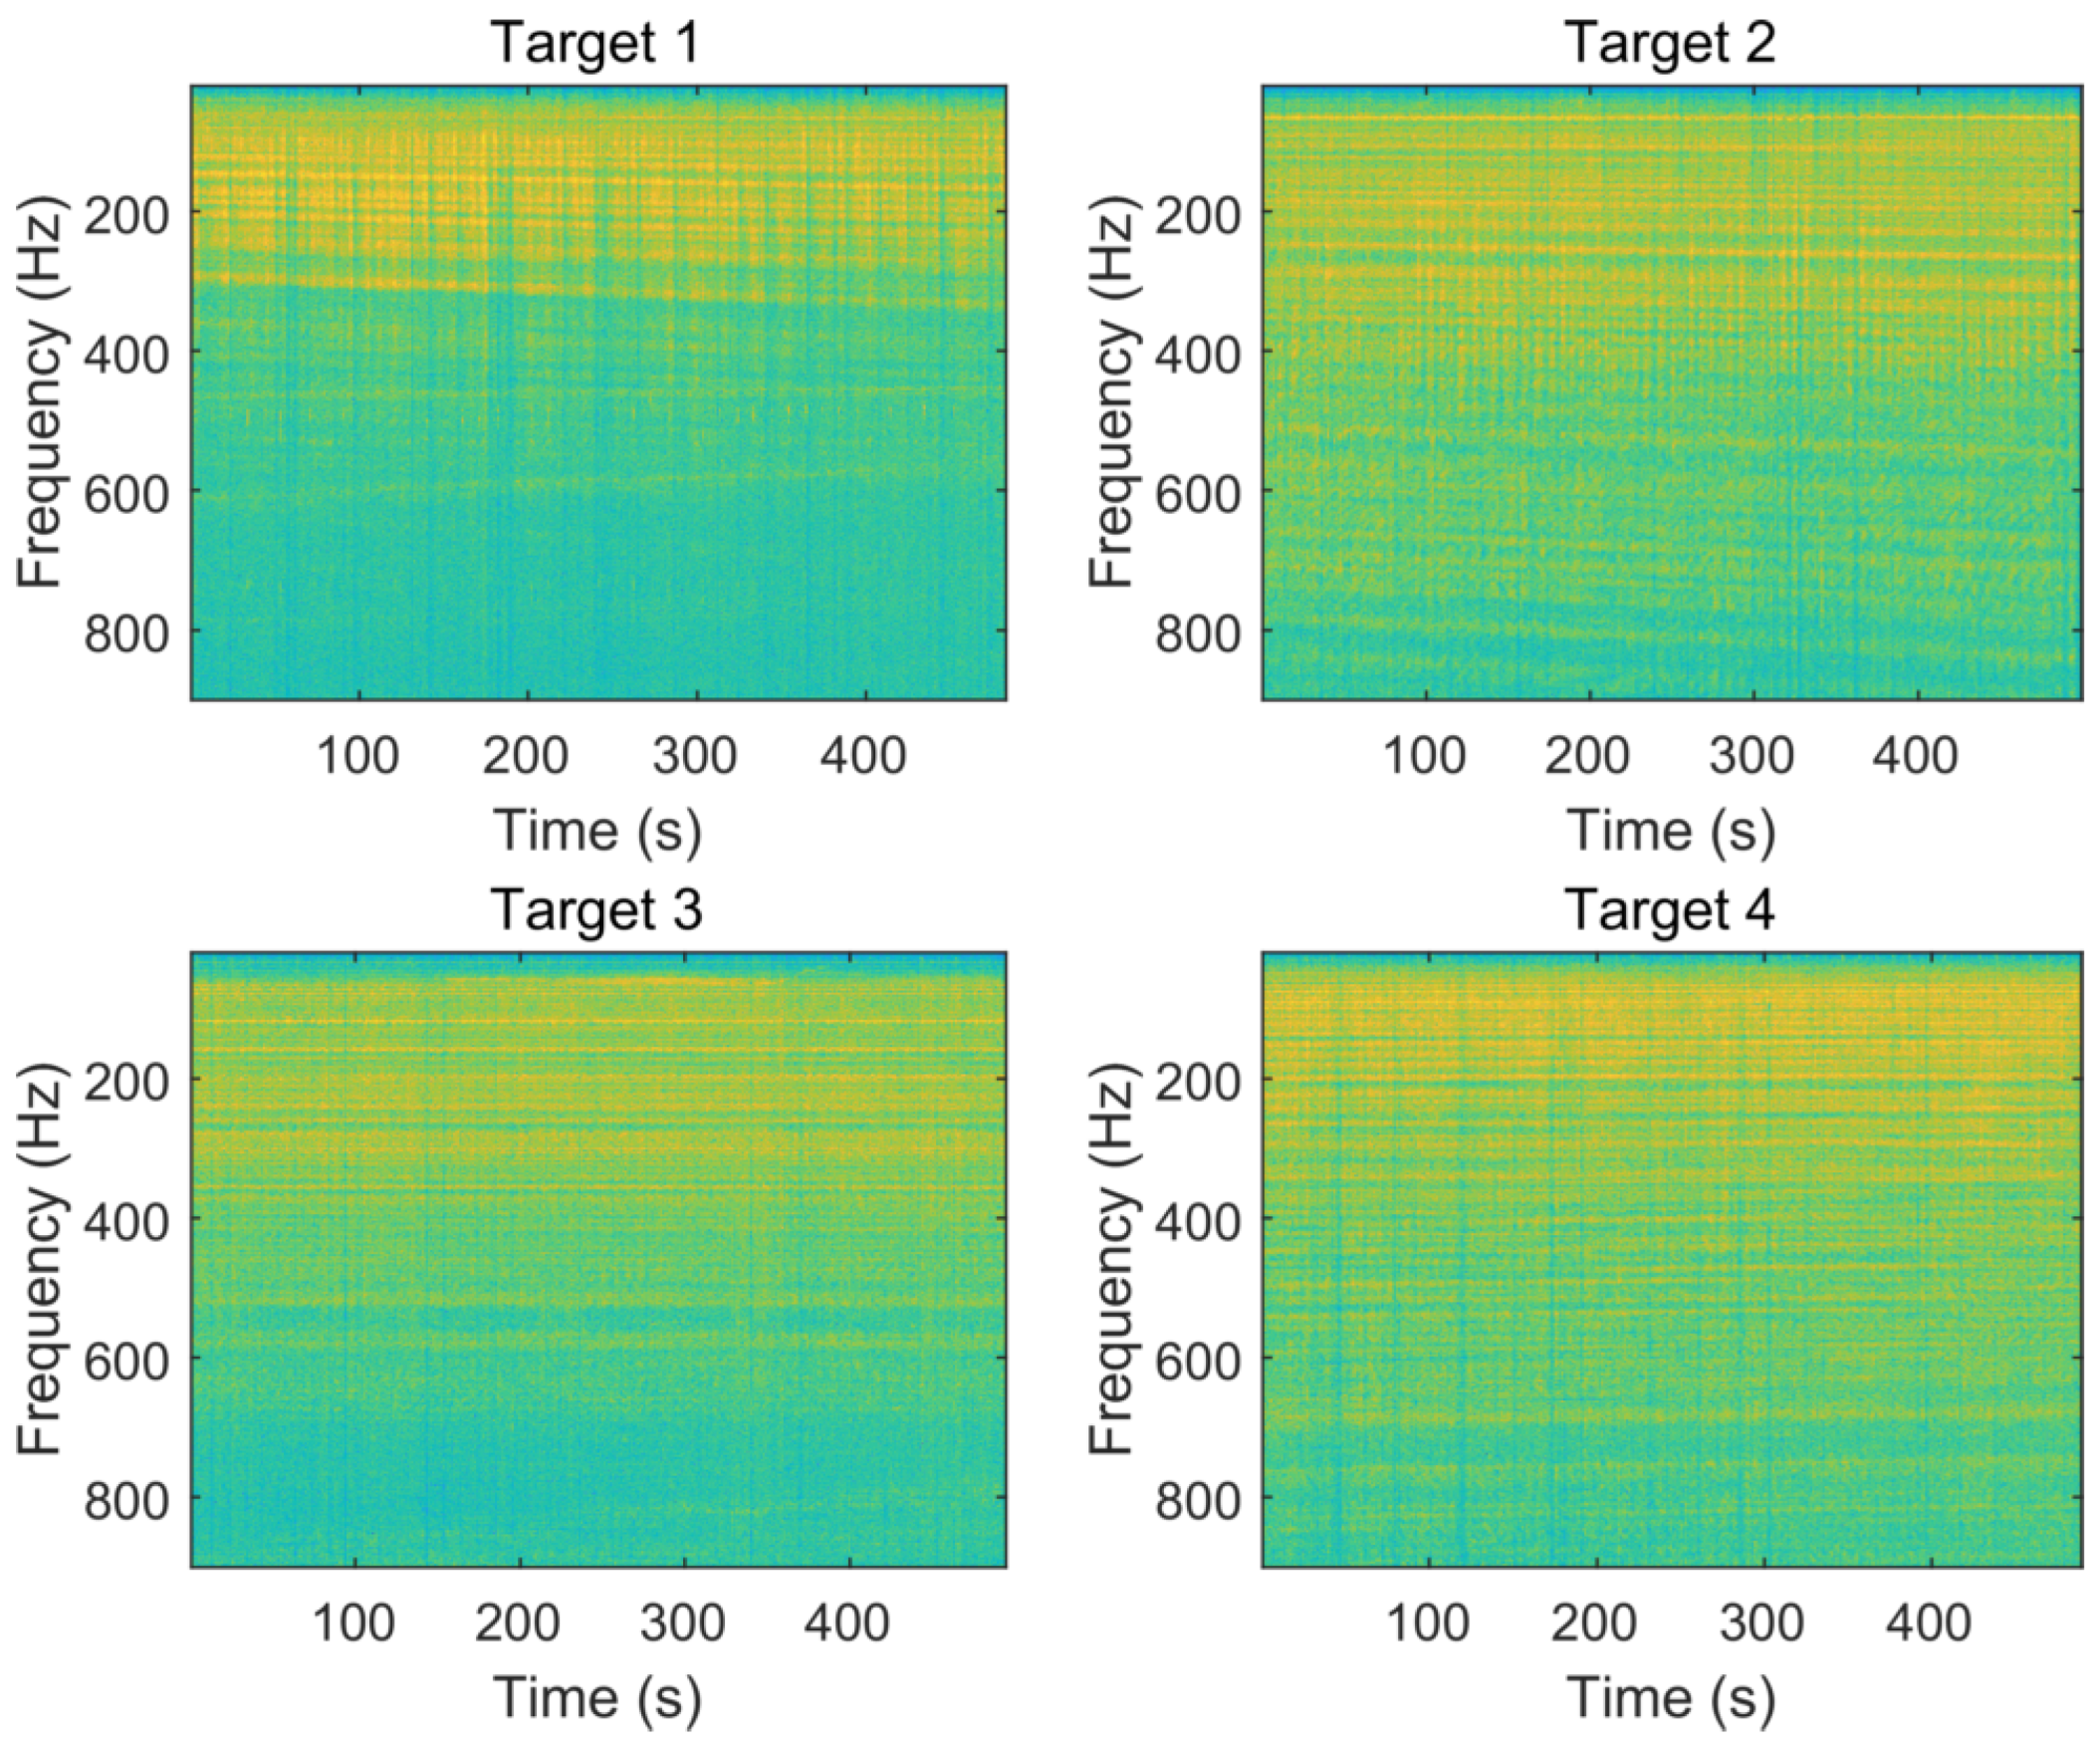
3.2. Experiments on Target Spectrum Reconstruction

Figure 7 shows BTRs produced by the CBF beam scan method using real measured data from hydrophone arrays at 20–200 Hz (left) and 200–800 Hz (right), respectively. We can find that DOA estimation has higher angular resolution with the growth of the analytic frequency. This means close targets that are separable at high frequencies can be aliased at low frequencies, which leads to inconsistent spectrum reconstruction over different frequencies.
Figure 8 shows BTRs produced by our proposed joint sparse method. Bright vertical lines in the figure represent the trace of targets from different directions during the 500 s. Figure 8b is the enlarged view within the azimuth range from 100° to 112°. In Figure 8a, two close targets at around 110° are not separable, which further leads to spatial aliasing, while in Figure 8b, targets apart from 0.5° are still separable via the joint sparse method, which means our proposed method can achieve high-resolution DOA estimation and reduce spatial aliasing to make the reconstructed target spectrum more consistent and robust to interference.
Figure 9 shows the reconstructed time-frequency spectrogram of one target at around 58.5° via the CBF (upper) and joint sparse method (lower), respectively. The power spectrogram is generated by estimating the target frequency spectrum at each time and merging them along the time axis. The horizontal axis represents time, and the vertical axis represents frequency.
In Figure 9, we can see that the spectrograms reconstructed by the CBF method (above) and the joint sparse method (bottom) are basically consistent overall. However, the joint sparse reconstruction method has recovered more detailed information on the spectrum and is more robust to interference signal energy leaking from other directions. Firstly, the spectral energy within the frequency range 200–400 Hz on the spectrogram is not well recovered by the CBF method. This is because the main lobe is narrower at higher frequencies in the CBF method, and a slight DOA estimation bias can lead to obvious energy attenuation of the spectrum at higher frequencies. Our proposed joint sparse reconstructed method is capable of achieving high-resolution DOA estimation while at the same time attaining beamwidth constancy by imposing underlying joint sparsity priors. These advantages make the proposed reconstruction method capable of recovering the target spectrum more accurately, especially prominent line components in the spectrogram. For example, some prominent line components within 200–400 Hz that are missing via the CBF method are preserved by our proposed method. These prominent line components are important target representative characteristics and can be vital for target classification, which should not be discarded. Secondly, we can see in Figure 9 that the energy of a strong periodic instant interfering signal from other directions is leaked into the target spectrogram within 250–280 Hz by the CBF method. The interfering energy is irrelevant information that is harmful to target recognition. In contrast, the spectrogram reconstructed by our proposed method is not subject to the strong periodic instant interfering signal from other directions. This demonstrated that our proposed method is robust to interference and more suitable for target recognition tasks.

3.3. Experiments on Underwater Target Classification

Figure 10 shows the reconstructed spectrogram of the four targets using our proposed joint sparse reconstruction method. The frequency shift of prominent spectral line components due to the Doppler effect can be observed from the spectrograms of four targets and is especially obvious for targets 1, 2, and 3.
We used the proposed triangular filter banks in the logarithmic frequency scale to turn frequency shifts into frequency-invariant offsets to extract frequency shift-invariant cepstral features. The effect of the types of filter banks and the number of triangular filter banks on classification performance is discussed. Finally, the classification performance is compared between our proposed spectrum reconstruction method and the CBF method.

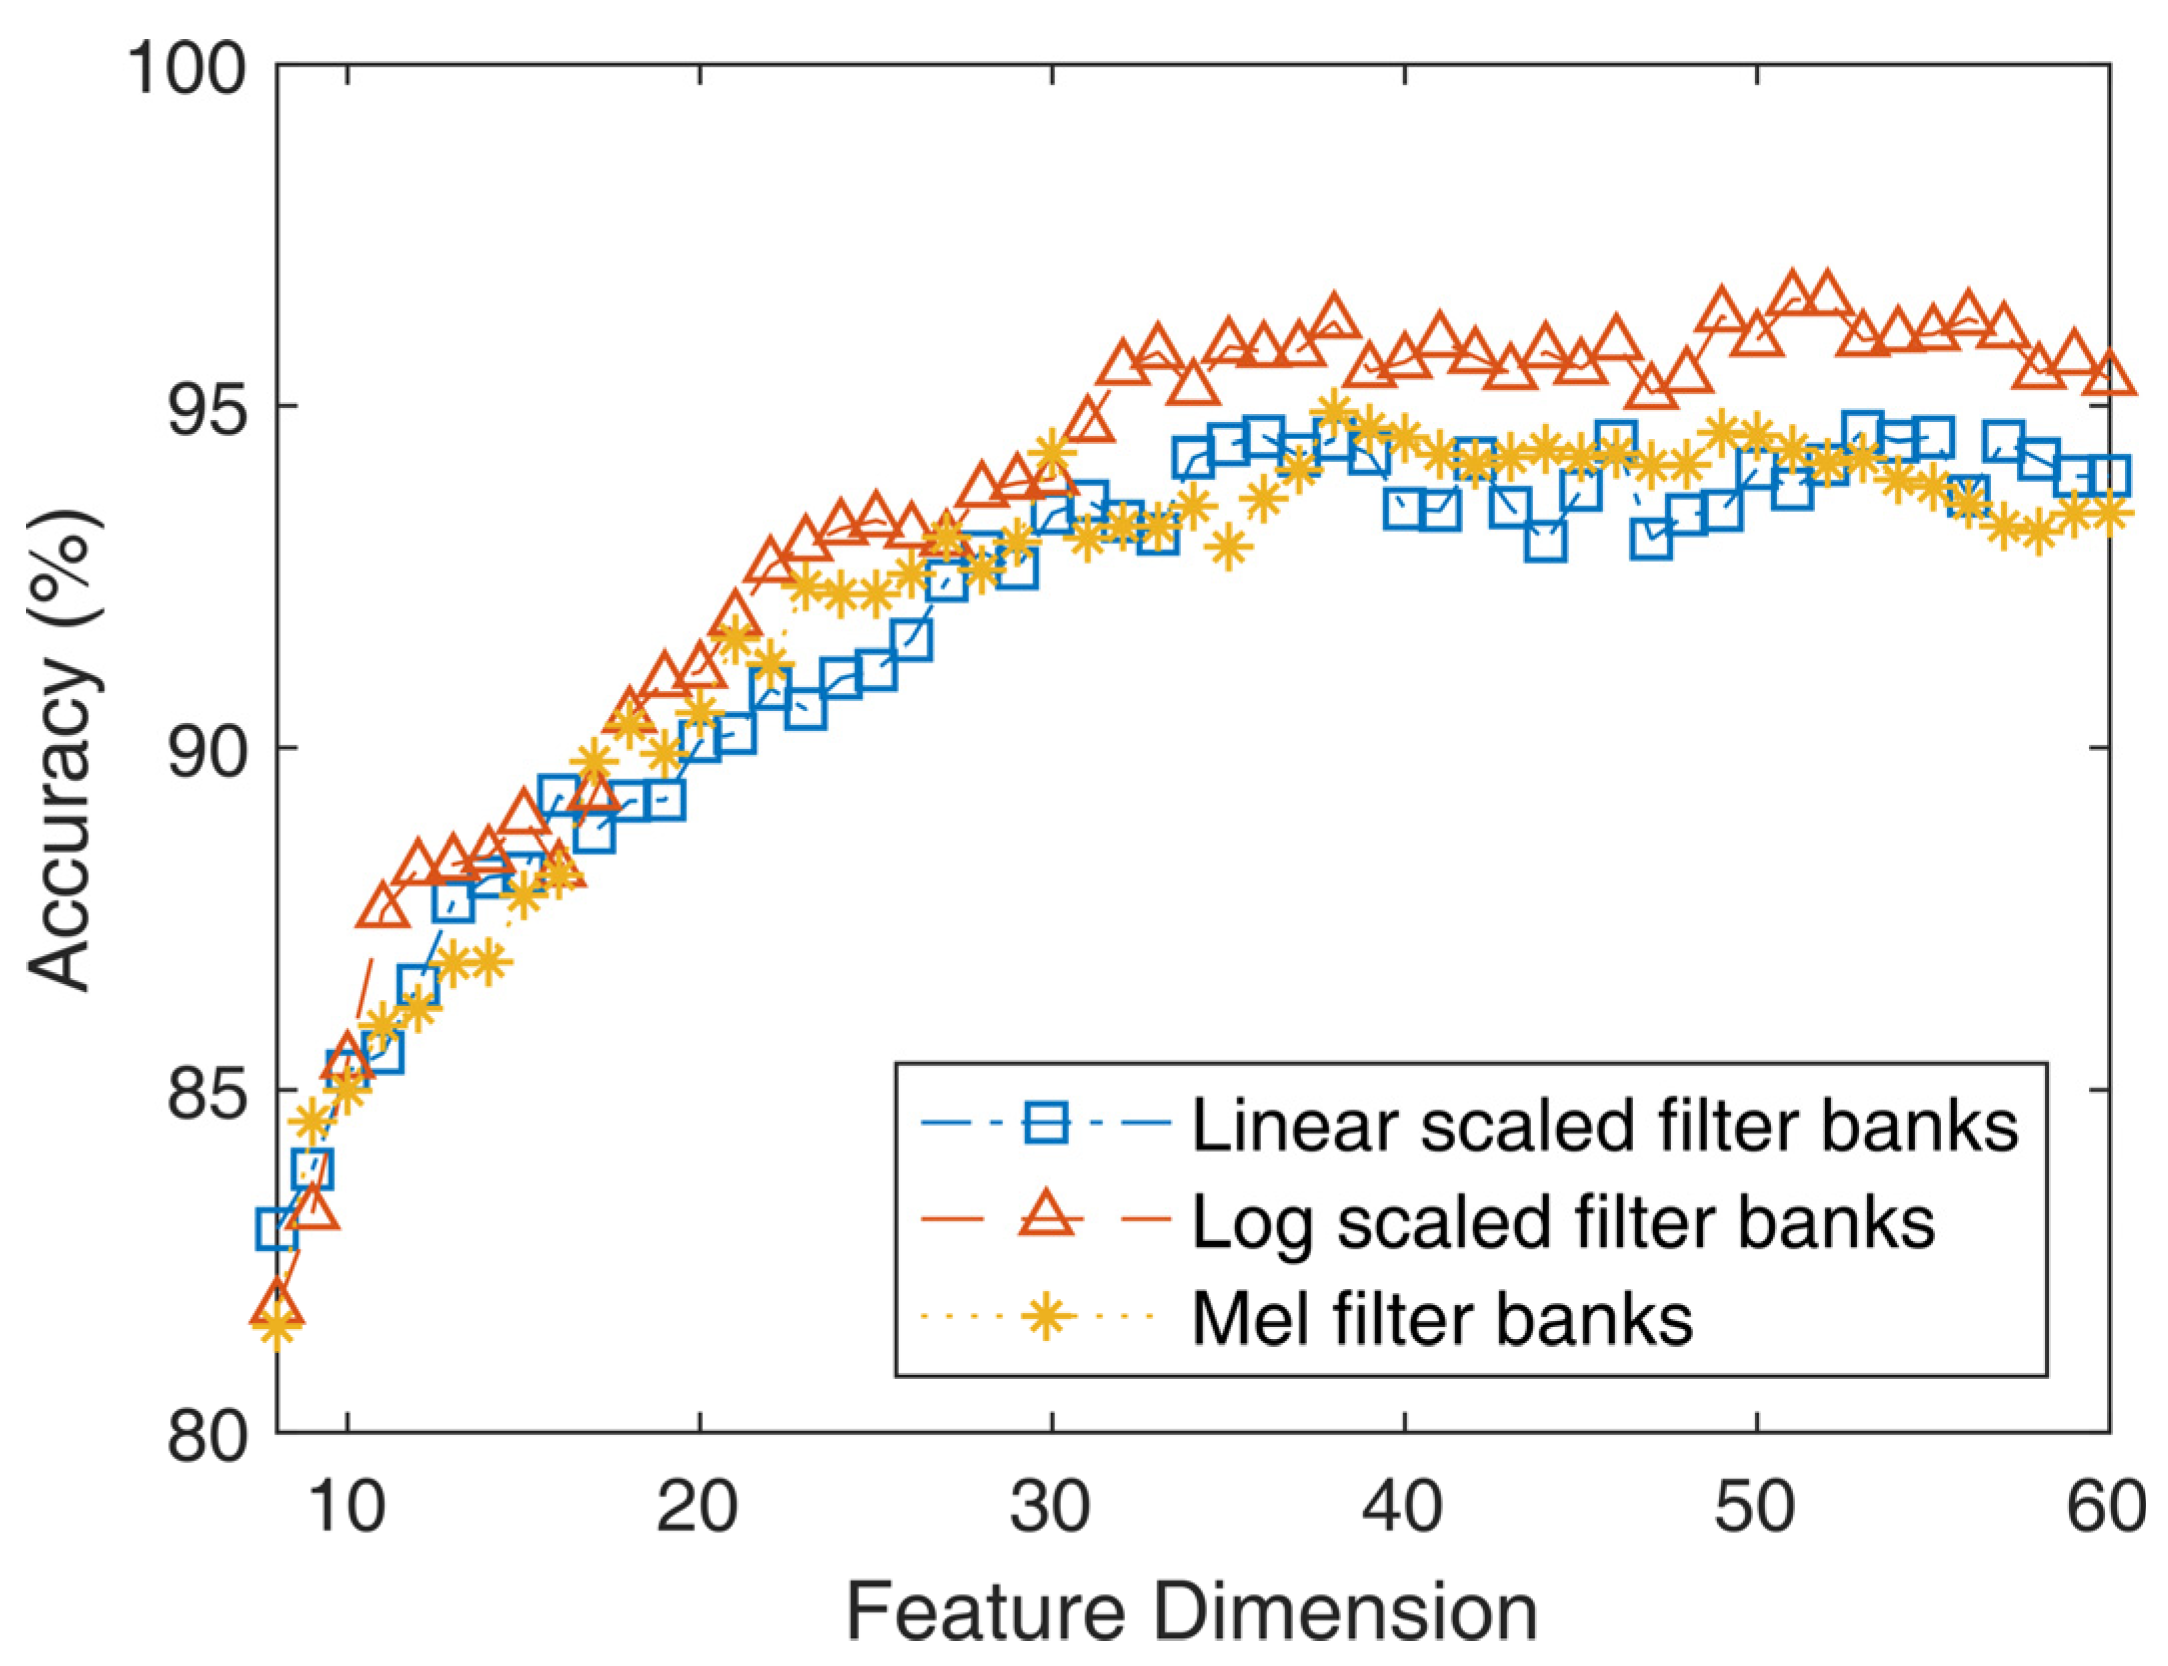
3.3.1. The Effect of Filter Bank Type on Classification Performance

In our test, an equivalent rectangular filter bank and Mel-frequency filter bank were chosen to compare to our proposed triangular filter banks. An equivalent rectangular filter bank is linear in frequency, and a Mel-Frequency filter bank approximates a linear scale at low frequencies while approximating a triangular filter at frequencies above around 700 Hz [32].
In Figure 11, we can see that the proposed triangular filter bank has the best classification accuracy among the three types of filter banks, and the classification accuracy difference between the Mel-Frequency filter bank and the equivalent rectangular filter bank is not significant. This is because the amplitude-frequency response of the Mel-frequency filter bank and the equivalent rectangular filter bank are very close. In Figure 10, we can see that the prominent frequency shift of the four targets mainly appears below 700 Hz. Our proposed filter banks, which are in the logarithmic frequency scale at low frequencies, have higher classification accuracy than the other two filter banks, which are in the linear frequency scale below 700 Hz. This indicates our proposed frequency shift-invariant filter banks, which are superior in dealing with spectrum distortions, can be helpful to improve classification performance. This also suggests that, in an application, a reasonable filter bank design adapted to underwater signal characteristics is important for achieving higher classification performance.

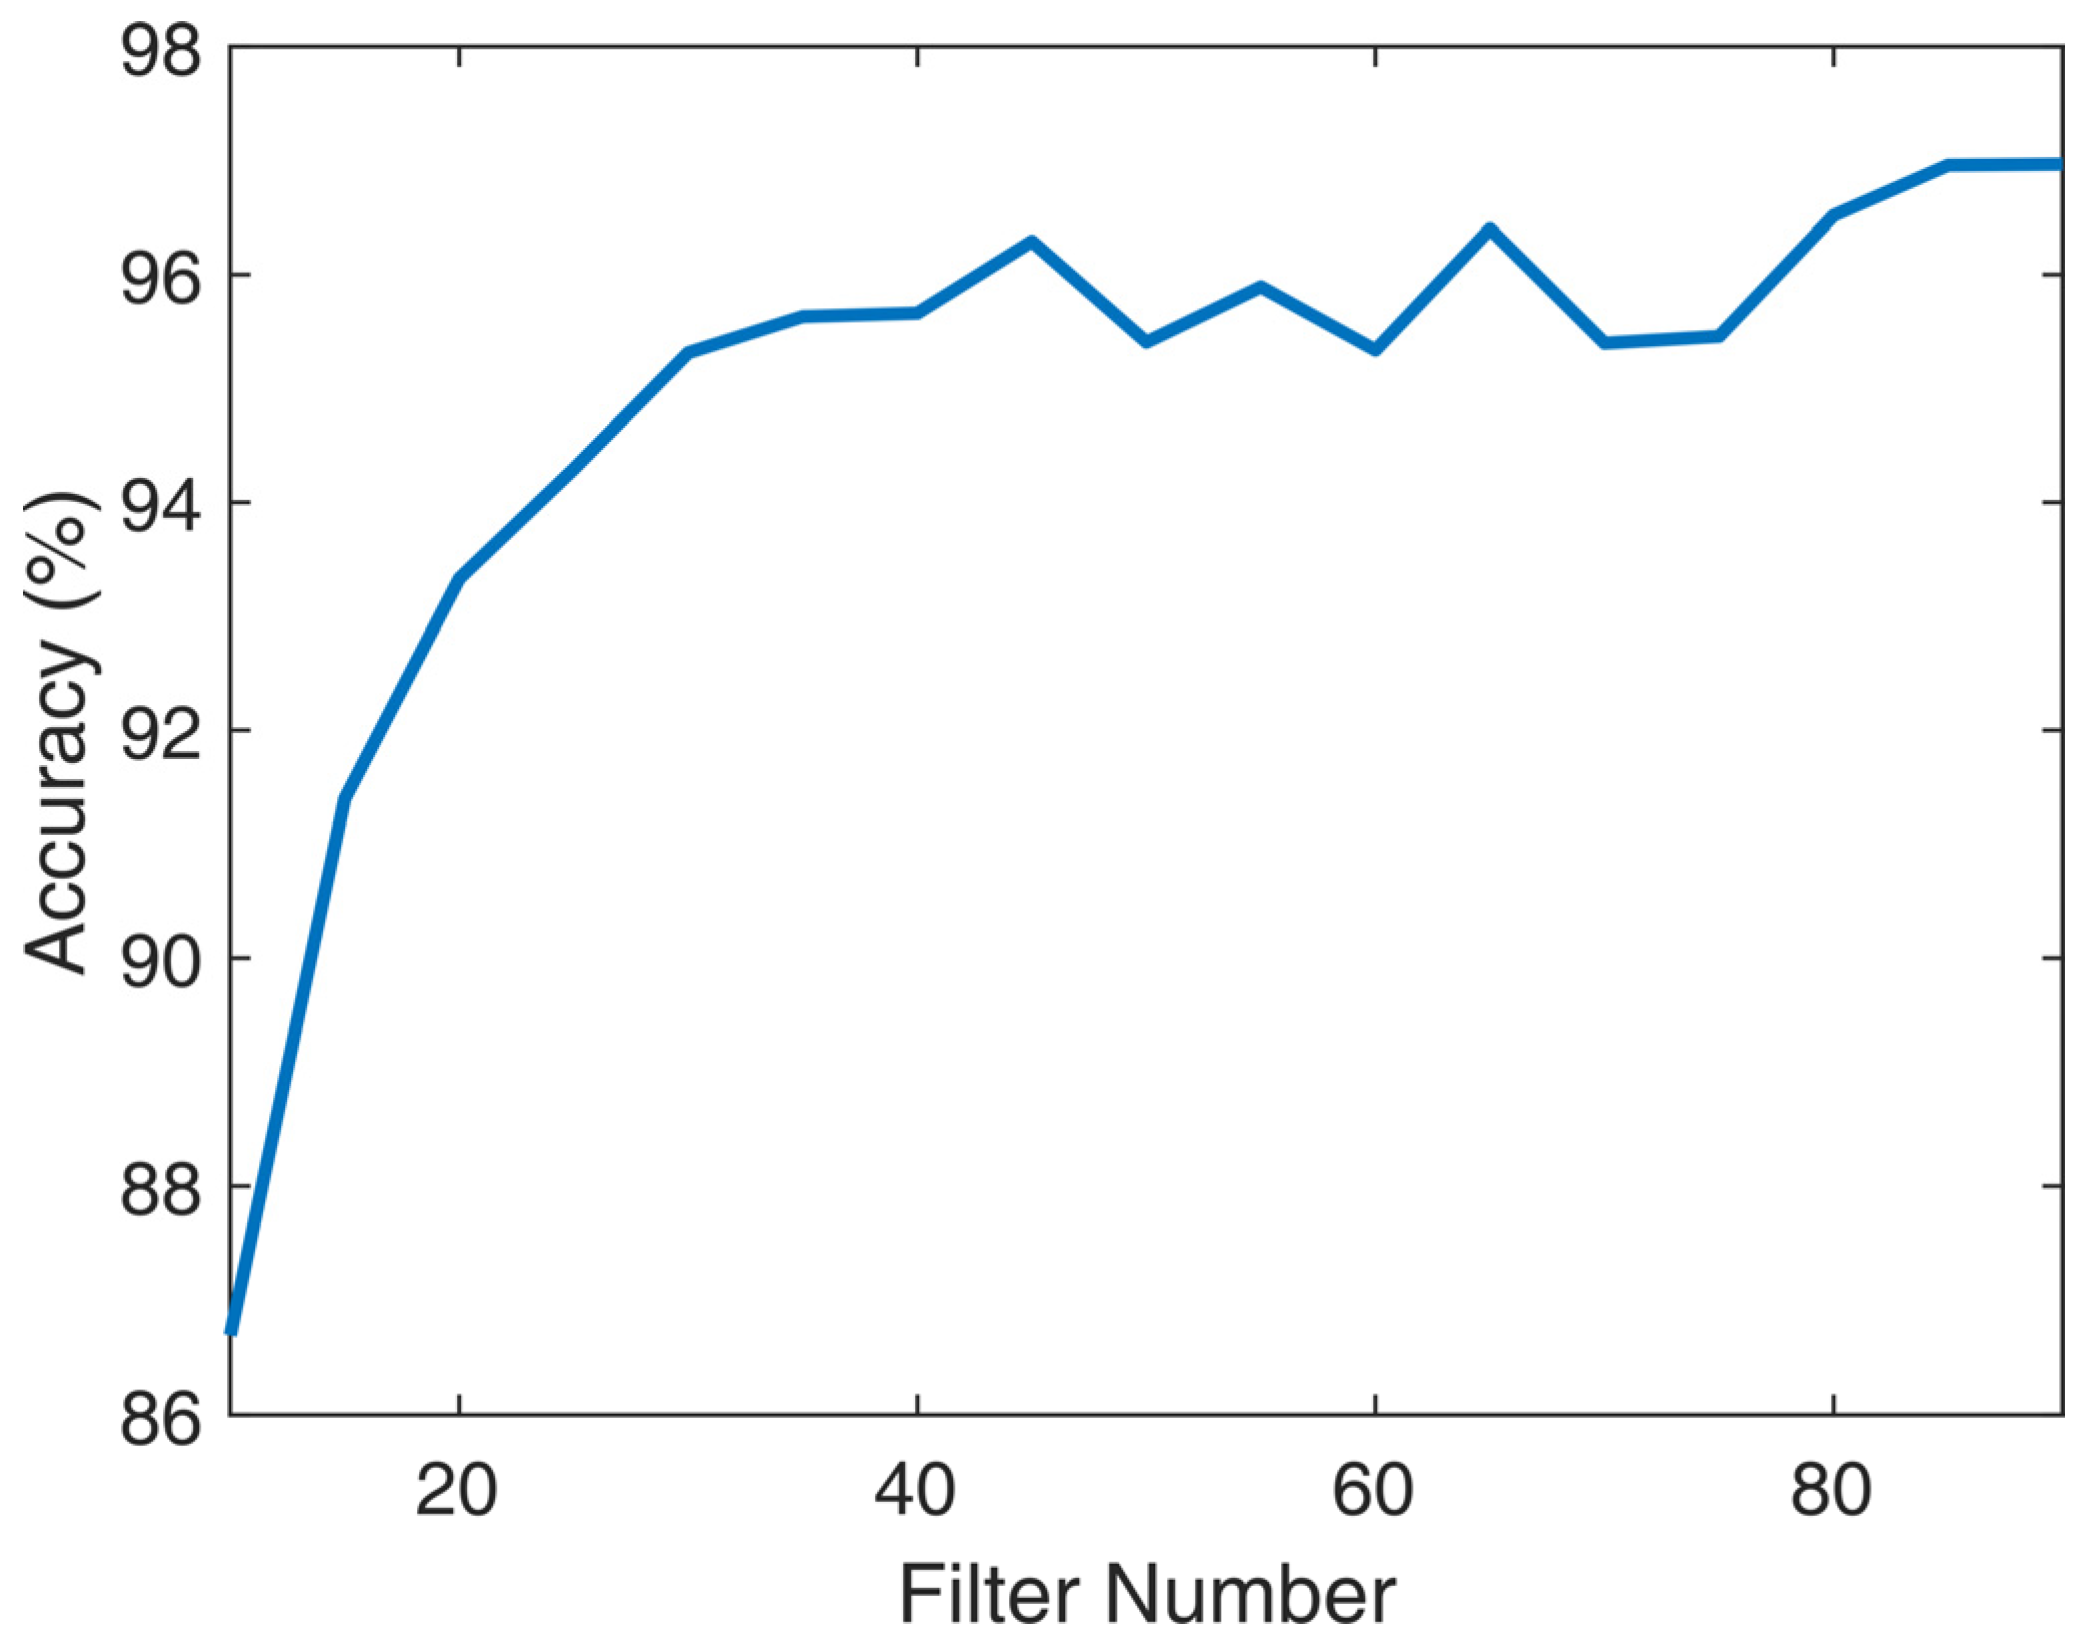
3.3.2. The Effect of Filter Number on Classification Performance

In the case of our proposed triangular filter banks, the relation between filter number and classification performance is discussed. Figure 12 shows that with the growth of the filter number from 10 to 90, the classification accuracy increases as well. When the filter number is greater than 50, the accuracy has some fluctuation, but the change is not significant. Overall, the accuracy increases as the filter number increases. This indicates that a more detailed frequency division is helpful to achieve better classification performance.

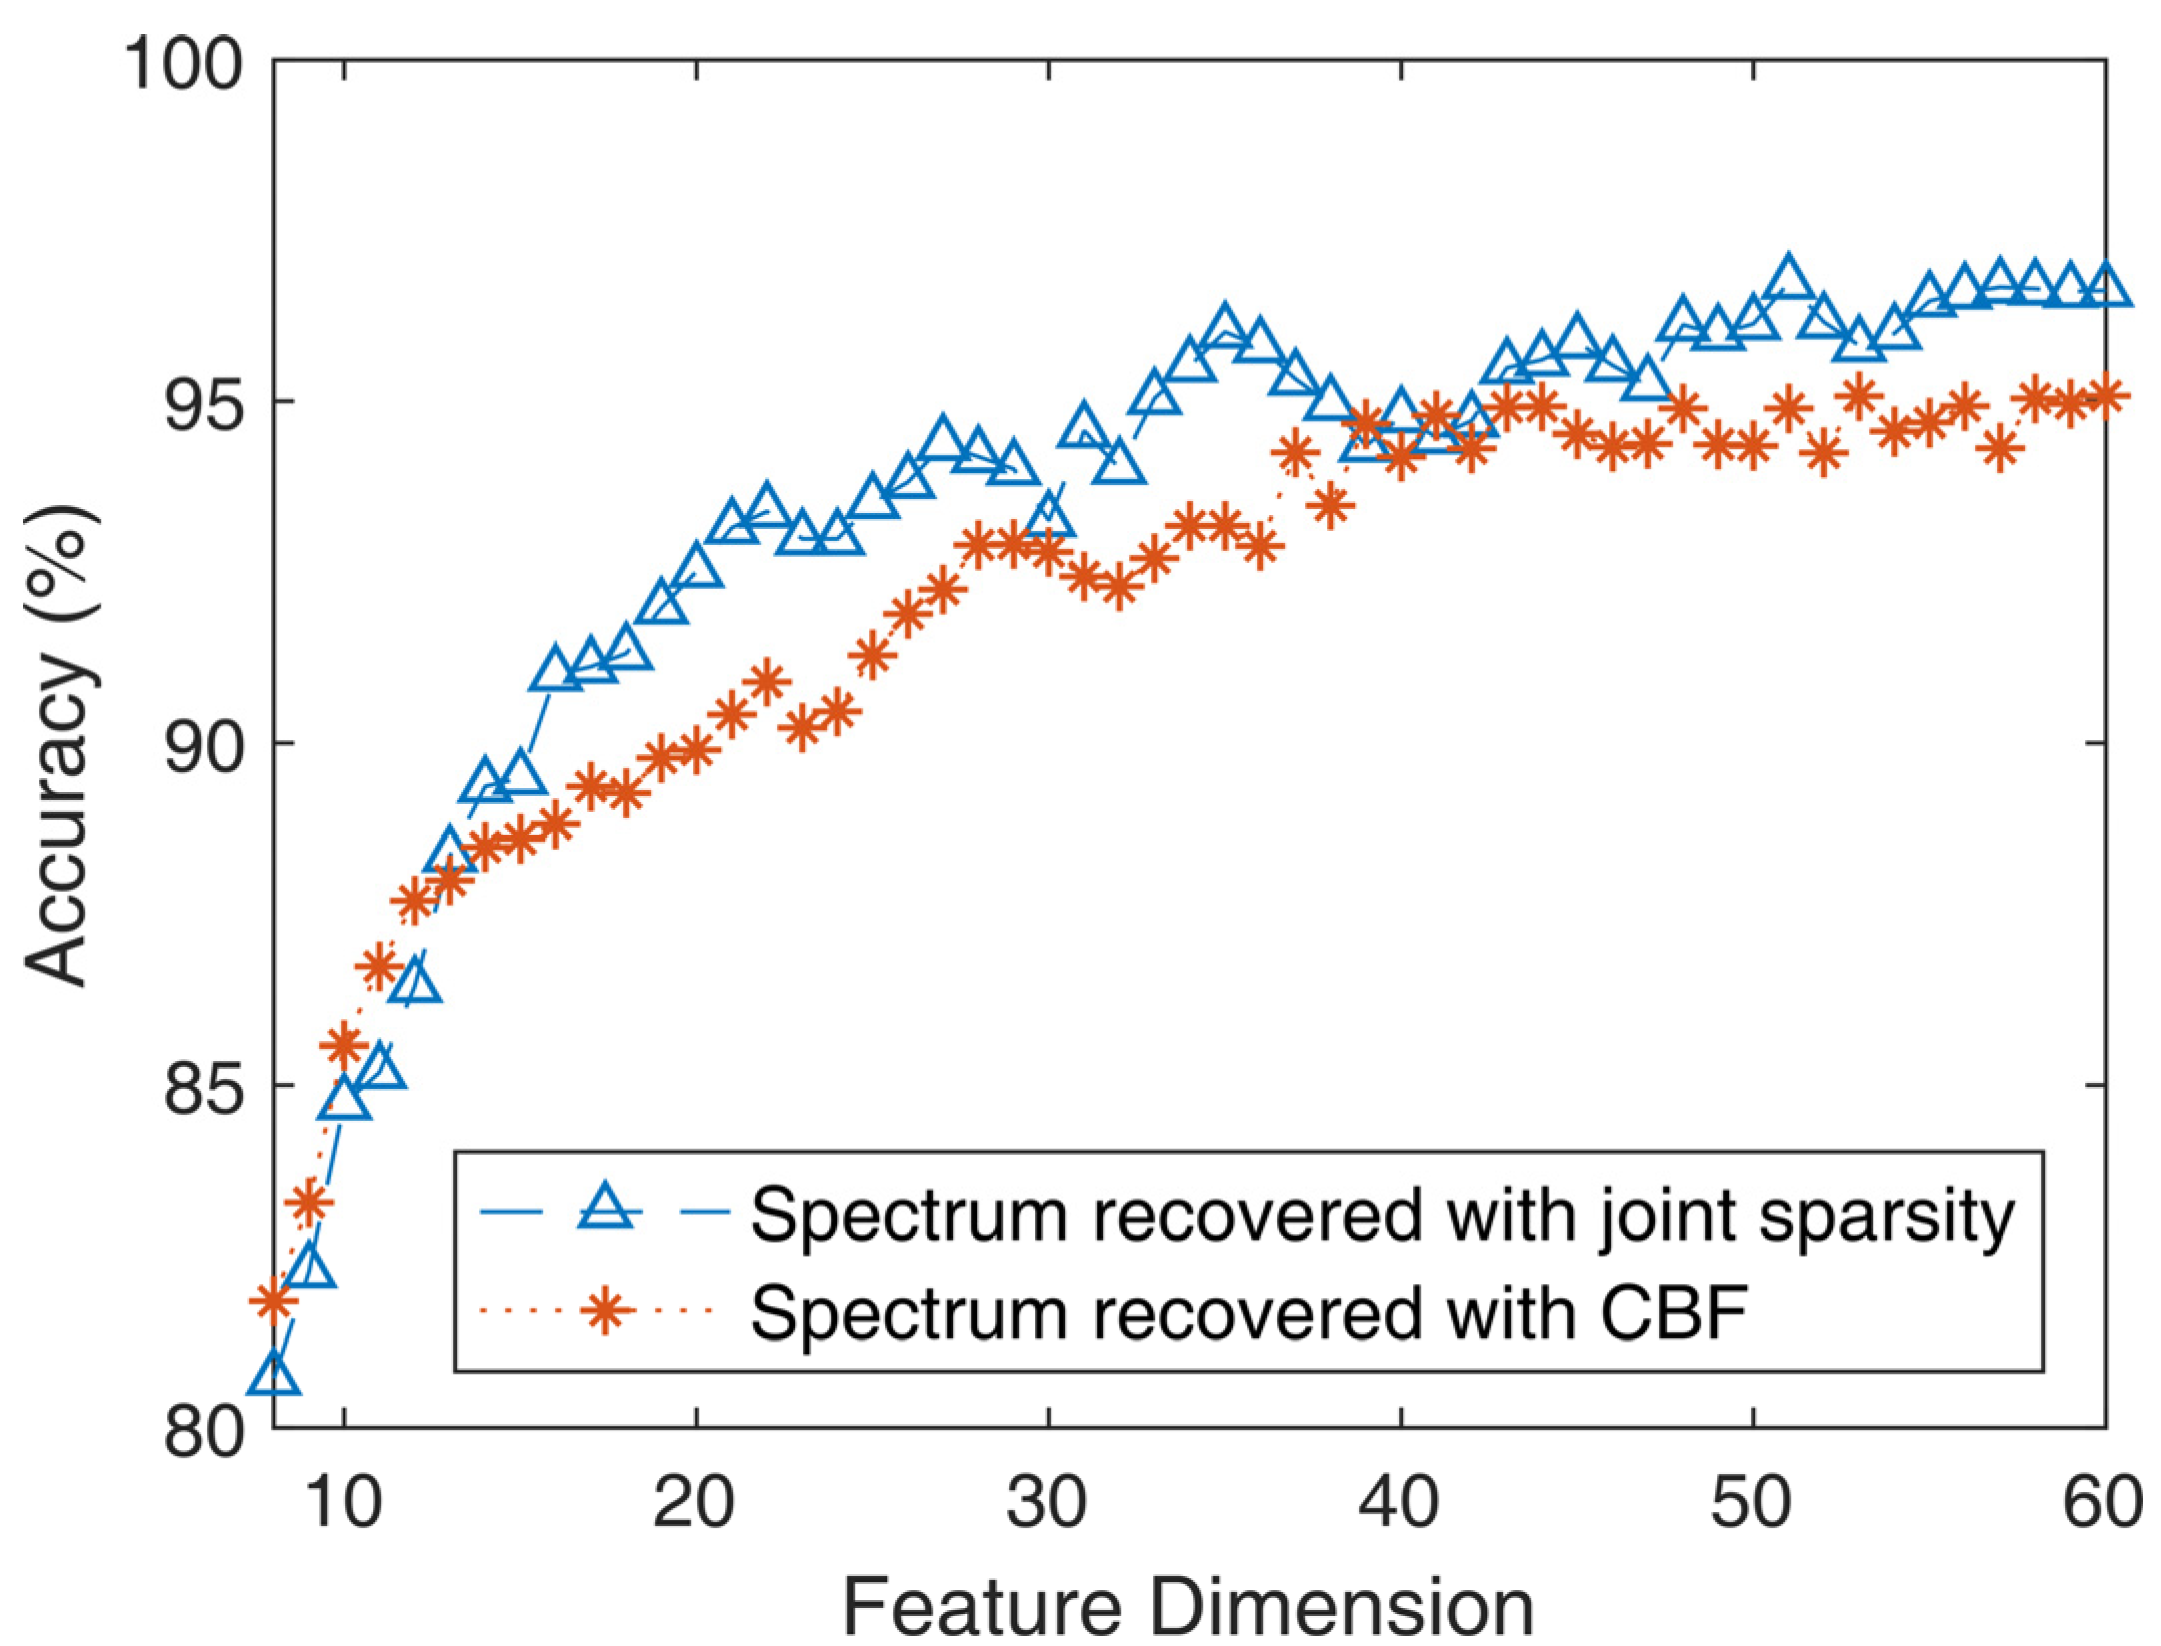
3.3.3. Comparison of Spectrum Reconstruction Methods on Classification Performance

In this chapter, the recognition performance of the CBF-reconstructed spectrum and the spectrum reconstructed via the joint sparse method is compared. In the tests, our proposed frequency shift-invariant cepstral feature is extracted from the reconstructed target spectrum. The filer number is set to 90, and the upper and lower frequencies of the filter banks are set to 20 and 1000, respectively. The training and testing settings are the same as the previous settings. Figure 13 shows the relation between the classification accuracy and the feature dimension by using the CBF-reconstructed spectrum and the spectrum reconstructed via the joint sparse method, respectively. We can find that the proposed spectrum reconstruction method outperforms the CBF method in terms of classification accuracy in most cases. This indicates that our proposed spectrum reconstruction method can be beneficial to preserve more target representative and discriminative characteristics, which are more suitable for target classification tasks.

4. Conclusions

In this paper, considering the difference between the source and hydrophone array collected signal can have a non-negligible impact on underwater target recognition systems, we propose an array-based joint sparse spectrum reconstruction method to enhance target spectrum and a frequency shift-invariant cepstral feature extraction method to resist spectrum distortion caused by underwater acoustic channels and Doppler frequency shift. Sparse Bayesian learning frameworks and joint sparsity are introduced to recover the target spectrum at higher SNR with array gain and attain constant beamwidth over different frequencies at no cost of reducing angular resolution. The experiment results on real measured hydrophone array data demonstrate that, compared to the CBF method, our proposed spectrum reconstruction method can preserve more detailed spectral structures and achieve higher classification performance. On the basis of a similar framework of MFCC features, frequency shift-invariant filter banks are designed to suppress the frequency shift of prominent spectral line components. In the classification experiment, the effect of filter bank types and filter number on classification performance was analyzed, and the results showed that triangular filter banks with more detailed frequency division could achieve higher classification performance than traditional Mel filter banks. To sum up, our proposed methods can be beneficial in improving the performance of underwater target recognition systems. In future work, joint sparsity on both frequency and time can be exploited to improve our proposed method.

Author Contributions

Conceptualization, C.L.; methodology, C.L.; software, L.W.; validation, Q.W.; formal analysis, C.L.; investigation, C.L.; resources, A.J.; data curation, C.L.; writing—original draft preparation, C.L.; writing—review and editing, X.Z.; visualization, C.L.; supervision, X.Z.; project administration, X.Z.; funding acquisition, X.Z. All authors have read and agreed to the published version of the manuscript.

Funding

This research was funded by the National Natural Science Foundation of China under grant number 52271351.

Institutional Review Board Statement

Not applicable.

Informed Consent Statement

Not applicable.

Data Availability Statement

Not applicable.

Conflicts of Interest

The authors declare that they have no known competing financial interests or personal relationships that could appear to have influenced the work reported in this paper.

References

  1. Lei, Z.; Lei, X.; Wang, N. Present status and challenges of underwater acoustic target recognition technology: A review. Front. Phys. 2022, 10, 1018. [Google Scholar] [CrossRef]
  2. Fang, S.; Du, S.; Luo, X.; Han, N.; Xu, X. Development of underwater acoustic target feature analysis and recognition technology. Bull. Chin. Acad. Sci. 2019, 34, 297–305. [Google Scholar]
  3. Erol-Kantarci, M.; Mouftah, H.T.; Oktug, S. A survey of architectures and localization techniques for underwater acoustic sensor networks. IEEE Commun. Surv. Tutor. 2011, 13, 487–502. [Google Scholar] [CrossRef]
  4. Johnson, D.H.; Dudgeon, D.E. Array Signal Processing: Concepts and Techniques; Prentice Hall: Hoboken, NJ, USA, 1993. [Google Scholar]
  5. Nielsen, R.O. Sonar Signal Processing; Artech House, Inc.: Norwood, MA, USA, 1991. [Google Scholar]
  6. Lurton, X. An Introduction to Underwater Acoustics: Principles and Applications (Vol. 2); Springer: London, UK, 2002. [Google Scholar]
  7. Liu, W.; Weiss, S. Wideband Beamforming: Concepts and Techniques; Wiley: Chichester, UK, 2010. [Google Scholar] [CrossRef]
  8. Sun, S.; Wang, T.; Chu, F. A generalized minimax-concave penalty based compressive beamforming method for acoustic source identification. J. Sound Vib. 2021, 500, 116017. [Google Scholar] [CrossRef]
  9. Frank, A.; Ben-Kish, A.; Cohen, I. Constant-beamwidth linearly constrained minimum variance beamformer. In Proceedings of the 30th European Signal Processing Conference (EUSIPCO), Belgrade, Serbia 29 August–2 September 2022; IEEE: New York, NY, USA, 2022; pp. 50–54. [Google Scholar] [CrossRef]
  10. Feng, L.; Cui, G.; Yu, X.; Liu, R.; Lu, Q. Wideband frequency-invariant beamforming with dynamic range ratio constraints. Signal Process. 2021, 181, 107908. [Google Scholar] [CrossRef]
  11. Rosen, O.; Cohen, I.; Malah, D. FIR-based symmetrical acoustic beamformer with a constant beamwidth. Signal Process. 2017, 130, 365–376. [Google Scholar] [CrossRef]
  12. Liu, Z.; Huang, Z.; Zhou, Y. An efficient maximum likelihood method for direction-of-arrival estimation via sparse Bayesian learning. IEEE Trans. Wirel. Commun. 2012, 11, 1–11. [Google Scholar] [CrossRef]
  13. He, L.; Chen, H.; Carin, L. Tree-structured compressive sensing with variational Bayesian analysis. IEEE Signal Process. Lett. 2009, 17, 233–236. [Google Scholar] [CrossRef]
  14. Zhang, X.; Zheng, J.; Wang, D.; Tang, G.; Zhou, Z.; Lin, Z. Structured Sparsity Optimization with Non-Convex Surrogates of L20-Norm: A Unified Algorithmic Framework. IEEE Trans. Pattern Anal. Mach. Intell. 2023, 45, 6386–6402. [Google Scholar] [CrossRef]
  15. Yu, L.; Hong, S.; Jean-Pierre, B.; Gang, Z. Bayesian compressive sensing for cluster structured sparse signals. Signal Process. 2012, 92, 259–269. [Google Scholar] [CrossRef]
  16. Wang, L.; Zhao, L.; Bi, G.; Wan, C.; Zhang, L.; Zhang, H. Novel wideband doa estimation based on sparse bayesian learning with dirichlet process priors. IEEE Trans. Signal Process. 2015, 64, 275–289. [Google Scholar] [CrossRef]
  17. Hu, N.; Sun, B.; Wang, J.; Yang, J. Covariance-based DOA estimation for wideband signals using joint sparse Bayesian learning. In Proceedings of the IEEE International Conference on Signal Processing, Communications and Computing (ICSPCC), Xiamen, China, 22–25 October 2017; pp. 1–5. [Google Scholar] [CrossRef]
  18. Gemba, K.L.; Nannuru, S.; Gerstoft, P. Robust Ocean Acoustic Localization with Sparse Bayesian Learning. IEEE J. Sel. Top. Signal Process. 2019, 13, 49–60. [Google Scholar] [CrossRef]
  19. Zhao, L.; Li, X.; Wang, L.; Bi, G. Computationally efficient wide-band DOA estimation methods based on sparse Bayesian framework. IEEE Trans. Veh. Technol. 2017, 66, 11108–11121. [Google Scholar] [CrossRef]
  20. Zhang, Z. Photoplethysmography-based heart rate monitoring in physical activities via joint sparse spectrum reconstruction. IEEE Trans. Biomed. Eng. 2015, 62, 1902–1910. [Google Scholar] [CrossRef] [PubMed]
  21. Xenaki, A.; Jesper, B.B.; Mads, G.C. Sound source localization and speech enhancement with sparse Bayesian learning beamforming. J. Acoust. Soc. Am. 2018, 143, 3912–3921. [Google Scholar] [CrossRef]
  22. Ahmed, I.; Khan, A.; Ahmad, N. Speech signal recovery using block sparse Bayesian learning. Arab. J. Sci. Eng. 2020, 45, 1567–1579. [Google Scholar] [CrossRef]
  23. Wang, L.; Zhao, L.; Yu, L.; Wang, J.; Bi, G. Structured Bayesian learning for recovery of clustered sparse signal. Signal Process. 2020, 166, 107255. [Google Scholar] [CrossRef]
  24. Wang, Q.; Zeng, X.; Wang, L. Passive moving target classification via spectra multiplication method. IEEE Signal Process. Lett. 2017, 24, 451–455. [Google Scholar] [CrossRef]
  25. Cipli, G.; Sattar, F.; Driessen, P.F. Multi-class acoustic event classification of hydrophone data. In Proceedings of the IEEE Pacific Rim Conference on Communications, Computers and Signal Processing (PACRIM), Victoria, BC, Canada, 24–26 August 2015; pp. 473–478. [Google Scholar] [CrossRef]
  26. Zhang, L.; Wu, D.; Han, X.; Zhu, Z. Feature extraction of underwater target signal using mel frequency cepstrum coefficients based on acoustic vector sensor. J. Sensors 2016, 2016, 7864213. [Google Scholar] [CrossRef]
  27. Das, A.; Kumar, A.; Bahl, R. Marine vessel classification based on passive sonar data: The cepstrum-based approach. IET Radar Sonar Navig. 2013, 7, 87–93. [Google Scholar] [CrossRef]
  28. Beal, M.J. Variational Algorithms for Approximate Bayesian Inference; University of London, University College London: London, UK, 2003. [Google Scholar]
  29. Nakagawa, S.; Wang, L.; Ohtsuka, S. Speaker Identification and Verification by Combining MFCC and Phase Information. Audio, Speech, and Language Processing. IEEE Trans. 2012, 20, 1085–1095. [Google Scholar] [CrossRef]
  30. South, H.M.; Cronin, D.C.; Gordon, S.L.; Magnani, T.P. Technologies for sonar processing. Johns Hopkins APL Tech. Dig. 1998, 19, 459–469. [Google Scholar]
  31. Chang, C.C.; Lin, C.J. LIBSVM: A library for support vector machines. ACM Trans. Intell. Syst. Technol. (TIST) 2011, 2, 1–27. [Google Scholar] [CrossRef]
  32. Mak, B. A mathematical relationship between full-band and multiband mel-frequency cepstral coefficients. IEEE Signal Process. Lett. 2002, 9, 241–244. [Google Scholar] [CrossRef]
Figure 1. The spatial response of CBF at different frequency bins.
Jmse 11 01101 g001
Figure 2. Relationship between estimated incident angle and signal frequency. (a) DOA estimation via joint sparsity, (b) DOA estimation via CBF. Black squares indicate estimated incident angles over different frequencies and each oval indicates a specific target.
Jmse 11 01101 g002
Figure 3. Illustration of spectral line frequency shift.
Jmse 11 01101 g003
Figure 4. Doppler frequency shift on the frequency spectrum. Blue lines indicate the signal frequency and blue circles indicate the amplitude of the signal frequency accordingly.
Jmse 11 01101 g004
Figure 5. Doppler frequency shift in logarithmic frequency scale.
Jmse 11 01101 g005
Figure 6. Amplitude-Frequency response of triangular filter banks. Each color corresponds to one triangular filter.
Jmse 11 01101 g006
Figure 7. BTR (Bearing Time Record) via CBF. (a) BTR via CBF (20–200 Hz); (b) BTR via CBF (200–800 Hz).
Jmse 11 01101 g007
Figure 8. BTR via joint sparse method. (a) Full view; (b) Enlarged view.
Jmse 11 01101 g008
Figure 9. Reconstructed spectrogram via CBF method and joint sparse method.
Jmse 11 01101 g009
Figure 10. Reconstructed power spectrogram of four targets via the joint sparse method.
Jmse 11 01101 g010
Figure 11. The relationship between classification accuracy and three types of filter banks.
Jmse 11 01101 g011
Figure 12. The relationship between filter number and classification accuracy.
Jmse 11 01101 g012
Figure 13. Classification accuracy of the CBF method and joint sparse method.
Jmse 11 01101 g013
Disclaimer/Publisher’s Note: The statements, opinions and data contained in all publications are solely those of the individual author(s) and contributor(s) and not of MDPI and/or the editor(s). MDPI and/or the editor(s) disclaim responsibility for any injury to people or property resulting from any ideas, methods, instructions or products referred to in the content.

