
Improving Aquaculture Water Quality Using Dual-Input Fuzzy Logic Control for Ammonia Nitrogen Management

 ,
,  , , ,
, , ,
Abstract
:1. Introduction
- (1)
- In our past reviews about the applications of aquaculture management, we found that few results can be implemented and validated successfully. In this paper, an intelligent control system is proposed which can automatically monitor and adjust water quality to optimize aquaculture production and reduce costs.
- (2)
- Fuzzy logic control has been proposed as a promising approach for water quality control in aquaculture. The proposed results using nonlinear fuzzy logic control can be applied directly rather than the trial-and-error method in the traditional PID control.
- (3)
- In this paper, we use the Mamdani method for the fuzzy inference system (FIS). The Mamdani fuzzy inference method is presented by some linguistic variables and fuzzy sets, which makes them very similar to the natural language descriptions and easier to understand and implement.
- (4)
- For more reliable results, multiprogramming, and networked applications, the Raspberry Pi is used instead of a controller with lower power consumption. The RS485 function is a reliable protocol which is used by the developer of ammonia nitrogen sensors.
2. Theoretical Foundations and Problem Formulation
2.1. Total Ammonia Nitrogen
2.2. Effects of NH3 on Fish Health and Survival Rate
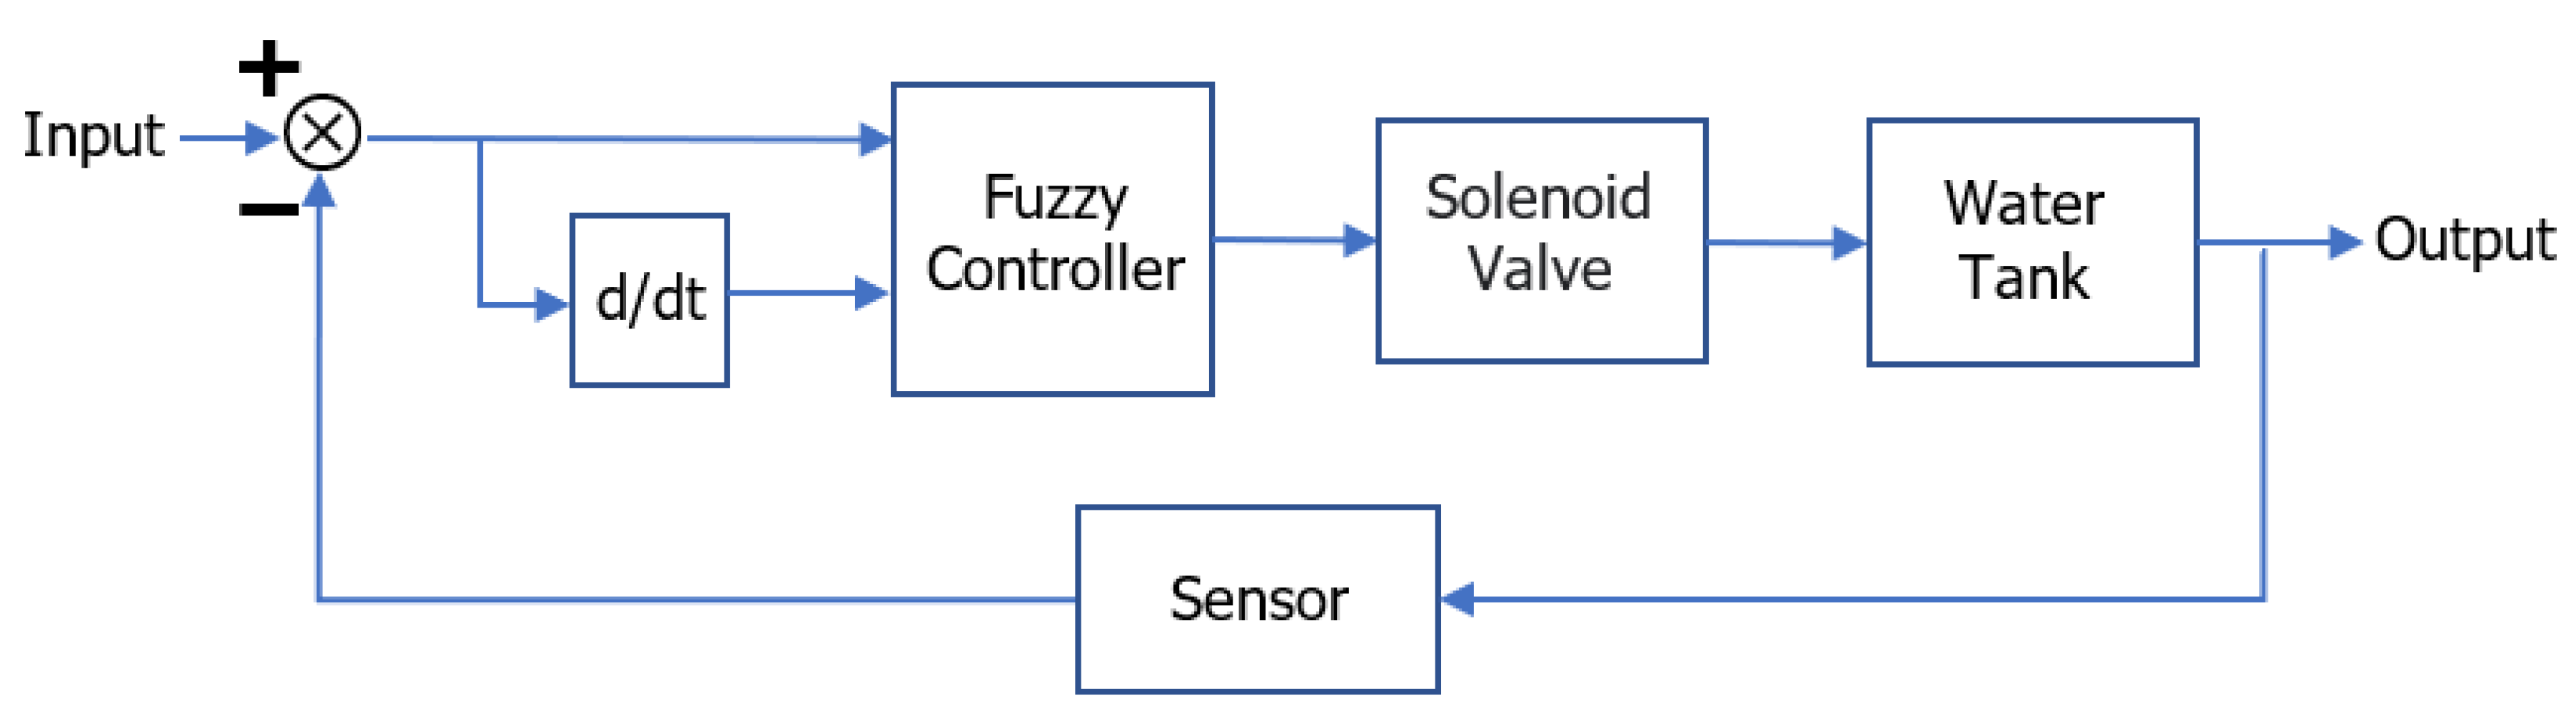
2.3. The Closed-Loop Control System with Disturbance Term
2.4. Fuzzy Theory
2.4.1. Establishing the Structure of the Fuzzy System
- (1)
- Input values
- <1>
- NH3, with the units of ppm;
- <2>
- d(NH3)/dt, with the units of ppm/sec.
- (2)
- Output variable change water (CW): The amount of water that can be changed is proportional to the number of fresh water inlet pipes. The more water pipes that are available, the greater the amount of water change that can be provided.
2.4.2. Defining the Fuzzy Sets of Input and Output
- Input 1: (NH3), NH3 = {High, Medium, Low};
- Input 2: (d(NH3)/dt), NH3 rate of change = {up, no change, down};
- Output: (CW), the number of water pipes = {4 p, 3 p, 2 p, 1 p, 0 p}.
2.4.3. Setting the Membership Function
2.4.4. Establishing the Fuzzy Rules
- (1)
- If (NH3 is low) and (d(NH3)/dt is down) then (CW is P0).
- (2)
- If (NH3 is low) and (d(NH3)/dt is no) then (CW is P1).
- (3)
- If (NH3 is low) and (d(NH3)/dt is up) then (CW is P2).
- (4)
- If (NH3 is med) and (d(NH3)/dt is down) then (CW is P1).
- (5)
- If (NH3 is med) and (d(NH3)/dt is no) then (CW is P2).
- (6)
- If (NH3 is med) and (d(NH3)/dt is up) then (CW is P3).
- (7)
- If (NH3 is high) and (d(NH3)/dt is down) then (CW is P2).
- (8)
- If (NH3 is high) and (d(NH3)/dt is no) then (CW is P3).
- (9)
- If (NH3 is high) and (d(NH3)/dt is up) then (CW is P4).
2.4.5. The Fuzzy Rule Table
2.4.6. Defuzzification, Calculating the Number of CW Water Change Pipes (Pip) [20]
- (1)
- Defuzzification results in −5.00 ≦ OUTPUT < −3.50,triggering 0 sets of water pipe changes (P0);
- (2)
- Defuzzification results in −3.50 ≦ OUTPUT < −0.33,triggering a group of water pipe changes (P1);
- (3)
- Defuzzification results in −0.33 ≦ OUTPUT < 0.66,triggering two sets of water pipe changes (P2);
- (4)
- Defuzzification results in 0.66 ≦ OUTPUT < 3.50,triggering three sets of water pipe changes (P3);
- (5)
- Defuzzification results in 3.50 ≦ OUTPUT ≦ 5.00,triggering four sets of water pipe changes (P4);
2.5. Embedded Systems
2.5.1. Adapting the Raspberry Pi Platform
- (1)
- The experiment utilized a Raspberry Pi 4B with a 4GB LPDDR4-3200 SDRAM, an external 128 GB SSD, and installed with Berry Boot v2.0 multi-boot. We also used the built-in Raspberry Pi OS operating system to protect the Raspberry Pi from power failure, accidents, or other disturbances during operation. It is crucial to note that the Pi OS operating system was necessary for the experiment to run smoothly, avoid unnecessary troubles, and protect the research results from destruction or loss.
- (2)
- To avoid errors caused by network interruptions, rather than setting up a judgment program in the cloud, we directly connected the Raspberry Pi to relays for real-time situation processing.
2.5.2. Adapting Python
- (1)
- The Python programming language was installed in the Raspberry Pi OS operating system and the Visual Studio Code editing software was used to write the program codes. This enabled easy modification and error reminders while writing the program codes.
- (2)
- The following modules and functions were imported and set up to execute the main code:
- <1>
- Mamdani fuzzy logic module;
- <2>
- RS485 reading module;
- <3>
- Database upload function;
- <4>
- Relay driver function;
- <5>
- Time function;
- <6>
- Random number module.
2.5.3. Database
3. Methods and Experiments
3.1. Research Methods
3.1.1. Ammonia Nitrogen Sensor Experiment
- (1)
- 1.89 ppm NH3 was added to the experimental tank and the FLC’s removal performance was observed and recorded.
- (2)
- NH3 was randomly dropped into the experimental tank to simulate fish excretion and the FLC’s removal performance was observed and recorded.
3.1.2. Simulation Test
- (1)
- The water tank’s capacity was set at 20 L, 40 L, 60 L, 80 L, and 100 L.
- (2)
- Data was collected from the sensors at different time intervals: one, two, three, five, and seven minutes.
- (3)
- The maximum number of fish that the tank can accommodate without exceeding the NH3 concentration limit was explored (i.e., the maximum allowable population density).
3.1.3. Discussion on Power and Water Consumption
- (1)
- Power Consumption: Different fish species, body sizes, weights, and other factors will affect ammonia nitrogen excretion. This study used spotted groupers, each weighing 50 g, as an example. The experimental conditions of the water and power consumption between FLC and ordinary pumps were compared:
- <1>
- A general control pump with only an electrical switch and no ammonia nitrogen was defined as the test control.
- <2>
- The general control pumps used a set of in-water and out-water pumps. These two sets were used to change the water at the rate of about 400 L/h for 24 h.
- <3>
- The water and power consumption using FLC was recorded after each fish feeding. Subsequent research can use this model to set up different parameters to obtain the desired information.
- (2)
- Water Consumption: The water consumption was measured during the experiment, and the water use of the FLC was compared with the results using ordinary pumps.
3.2. Experimental Equipment
4. Results
4.1. Ammonia Nitrogen Sensor Experiment
4.1.1. Standard FLC Test with a Concentration of 1.89 ppm NH3
- (1)
- In the beginning of the experiment when the initial NH3 concentration was high, the FLC used four sets of solenoid valves to change the water. As the concentration decreased, the water flow necessary to continue reducing the concentration decreased, so the number of solenoid valves that were used decreased until the NH3 concentration reached 0.
- (2)
- In the sixth cycle (from left to right), the concentration of NH3 was 0.04 ppm, which is below the critical concentration of 0.05 ppm at which harm to fish occurs. At this point, only one solenoid valve remained open and the amount of water flow was relatively low. From then on, the water exchange continued at a slower rate until the contamination was completely cleared, thus allowing water to be conserved.
4.1.2. Randomly Adding Ammonia Nitrogen Solution to Imitate the Excretion of Fish
4.2. Simulation Test
4.2.1. Performance Using a Varying Water Tank Capacity
- (1)
- For the 20 L water tank, it took 20 min and 38 s to reduce the concentration of NH3 from 1.89 ppm to 0.0 ppm, which was exactly the same time as the previous experiment’s 20 min and 38 s, indicating that the simulation program’s parameters have a certain reliability. The relationship of NH3, d(NH3)/dt, and the number of pipe sets is shown in Figure 14.
- (2)
- For the 40 L water tank, it took 52 min and 59 s to reduce the concentration of NH3 from 1.89 ppm to 0.0 ppm. The relationship of NH3, d(NH3)/dt, and the number of pipe sets is shown in Figure 15.
- (3)
- For the 60 L water tank, it took 83 min and 35 s to reduce the concentration of NH3 from 1.89 ppm to 0.0 ppm. The relationship of NH3, d(NH3)/dt, and the number of pipe sets is shown in Figure 16.
- (4)
- For the 80 L water tank, it took 111 min and 59 s to reduce the concentration of NH3 from 1.89 ppm to 0.0 ppm. The relationship of NH3, d(NH3)/dt, and the number of pipe sets is shown in Figure 17.
- (5)
- For the 100 L water tank, it took 139 min and 51 s to reduce the concentration of NH3 from 1.89 ppm to 0.0 ppm. The relationship of NH3, d(NH3)/dt, and the number of pipe sets is shown in Figure 18.
4.2.2. Observing the Efficacy of FLC Using Different Data Acquisition Intervals
4.2.3. Aquaculture Density
4.3. Power and Water Consumption Comparison
5. Discussion
5.1. Tests with No Disturbance Variable
5.2. Tests with Disturbance Variables
5.3. Aquaculture Density Estimation
- where
- V = The water tank capacity (in L);
- P = The number of irrigation pipes and solenoid valve sets (calculated by four sets);
- S = The water flow rate of the valves (in mL/sec);
- t = The sensor data acquisition time (in seconds).
5.3.1. Determination of Aquaculture Density Based on a Known Fish Excretion Rate
- The deduced breeding density formula can be written as:
- T × V = f NH3 × F.
- The variables for the above equations are defined as:
- T = The tolerance of fish to NH3 (in ppm).
- V = The capacity of the water tank (in L).
- f NH3 = The value of fish excretion converted into NH3 (in ppm).
- F = The number of fish (an integer).
5.3.2. Determination of Aquaculture Density Based on an Unknown Fish Excretion Rate
5.4. Assessment of Electric Power Consumption and Water Consumption
6. Conclusions
7. Patents
Author Contributions
Funding
Institutional Review Board Statement
Informed Consent Statement
Data Availability Statement
Conflicts of Interest
References
- Chen, Y.; Song, L.; Liu, Y.; Yang, L.; Li, D. A Review of the Artificial Neural Network Models for Water Quality Prediction. Appl. Sci. 2020, 10, 5776. [Google Scholar] [CrossRef]
- Zhou, X.; Wang, J.; Huang, L.; Li, D.; Duan, Q. Modelling and controlling dissolved oxygen in recirculating aquaculture systems based on mechanism analysis and an adaptive PID controller. Comput. Electron. Agric. 2022, 192, 106583. [Google Scholar] [CrossRef]
- Lawson, T.B. Recirculating Aquaculture Systems. In Fundamentals of Aquacultural Engineering; Springer: Boston, MA, USA, 1995; pp. 192–247. [Google Scholar]
- Nagothu, S.K. Intelligent Control of Aerator and Water Pump in Aquaculture Using Fuzzy Logic; Springer: Singapore, 2021; pp. 160–171. [Google Scholar]
- Hu, Z.; Li, R.; Xia, X.; Yu, C.; Fan, X.; Zhao, Y. A method overview in smart aquaculture. Environ. Monit. Assess. 2020, 192, 493. [Google Scholar] [CrossRef] [PubMed]
- Ebeling, J.M.; Timmons, M.B. Recirculating Aquaculture; Ithaca Publishing Company, LLC: Ithaca, NY, USA, 2013. [Google Scholar]
- Boyd, C.E. Bottom Soils, Sediment, and Pond Aquaculture; Springer: Berlin/Heidelberg, Germany, 1995. [Google Scholar]
- Martins, C.I.M.; Eding, E.H.; Verdegem, M.C.J.; Heinsbroek, L.T.N.; Schneider, O.; Blancheton, J.P.; d’Orbcastel, E.R.; Verreth, J.A.J. New developments in recirculating aquaculture systems in Europe: A perspective on environmental sustainability. Aquac. Eng. 2010, 43, 83–93. [Google Scholar] [CrossRef]
- Hua, M.; Zhao, D.; Xia, W.; Zhu, Y.; Liu, X. The Design of Intelligent Monitor and Control System of Aquaculture Based on Wireless Sensor Networks. In Proceedings of the 2010 3rd International Conference on Computer Science and Information Technology, Wuxi, China, 9–11 July 2010; pp. 9–12. [Google Scholar]
- Nouraki, A.; Alavi, M.; Golabi, M.; Albaji, M. Prediction of water quality parameters using machine learning models: A case study of the Karun River, Iran. Environ. Sci. Pollut. Res. 2021, 28, 57060–57072. [Google Scholar] [CrossRef] [PubMed]
- Francis-Floyd, R.; Watson, C.; Petty, D.; Pouder, D.B. Ammonia in aquatic systems. Inst. Food Agric. Sci. IFAS FA 2009, 16, 1–4. [Google Scholar] [CrossRef]
- Cai, Z.J. Study on Nitrogen Emission Rate of Grouper and Gentian Grouper; National Taiwan University: Taipei, Taiwan, 2013. [Google Scholar]
- Wu, F.C.; Ye, S.L. Feed vitamin E requirement and immune response of juvenile gentian grouper. J. Taiwan Fish. Res. 2008, 16, 77–85. [Google Scholar]
- Zhang, W.Q.; Zhu, Y. Advances on the Research of the Hazard of Ammonia Nitrogen in Aquaculture Water and its Determination Method. J. Environ. Hyg. 2012, 2, 324–327. [Google Scholar]
- Golnaraghi, M.F.; Kuo, B.C. Automatic Control Systems; Wiley: Hoboken, NJ, USA, 2010; p. 7. [Google Scholar]
- Zadeh, L.A. Fuzzy Sets. Inf. Control. 1965, 8, 338–353. [Google Scholar] [CrossRef]
- Mamdani, E.H. Advances in the linguistic synthesis of fuzzy controllers. Int. J. Man-Mach. Stud. 1976, 8, 669–678. [Google Scholar] [CrossRef]
- Qiao, W.Z.; Masaharu, M. PID type fuzzy controller and parameters adaptive method. Fuzzy Sets Syst. 1996, 78, 23–35. [Google Scholar] [CrossRef]
- Lewis, F.L.; Liu, K.; Selmic, R.; Wang, L.-X. Adaptive fuzzy logic compensation of actuator deadzones. J. Robot. Syst. 1997, 14, 501–511. [Google Scholar] [CrossRef]
- Lien, C.H.; Li, H.C.; Lin, C. A Method of Intelligent Control of Ammonia Nitrogen Value in Aquaculture Water and Its Equipment. Taiwan Patent TWI785737 B, 1 December 2022. [Google Scholar]
- Marwedel, P. Embedded System Design; Springer: Cham, Switzerland, 2021. [Google Scholar]
- Xiong, Y.; Zhu, H.; Pan, L.; Wang, J. Research on intelligent trajectory control method of water quality testing unmanned surface vessel. J. Mar. Sci. Eng. 2022, 10, 1252. [Google Scholar] [CrossRef]
- Wang, S.W.; Fan, C. Challenges of water quality management for agricultural development. Water 2023, 15, 1816. [Google Scholar] [CrossRef]


| CW | NH3 | |||
|---|---|---|---|---|
| Low | Med | High | ||
| d(NH3)/dt | down | P0 | P1 | P2 |
| no | P1 | P2 | P3 | |
| up | P2 | P3 | P4 | |
| Item | Name | Model | Main Specifications | Maker | Function |
|---|---|---|---|---|---|
| 1 | Raspberry Pi 4 | Raspberry Pi 4 Model B | ARM v8, 64-bit SoC @ 1.5 GHz, 2 GB, 4 GB LPDDR4-3200 SDRAM, full-throughput gigabit ethernet, dual-band 802.11 ac wireless networking, Bluetooth 5.0, BLE, 2 × USB 3.0 ports, 2 × USB 2.0 ports, and 2 × micro-HDMI ports | Raspberry Pi Foundation | Controller |
| 2 | Ammonia Sensor set | N18Smart NH3/NH4+ | Sensor—range: 0~20,000 mg/L, temp. range: 0~80 °C, pressure: 0~3 bar, Pt1000ATC, PPT main liquid, liquid connector: PTFE.Sensor controller—measuring range: 014~14,000 ppm, Compensation range, refresh time: 2 min −10.0~130.0 °C, resolution: 0.1 degrees C, measurement accuracy: ±0.2 °C, current signal output. Signal output: 4~20 mA, current accuracy: ±0.05 mA | REMOND AOTO | Detect the concentration of NH3 |
| 3 | Relay set | 4-way/5 V | 5 mA is needed to drive the relay, 10 A to pull in | iCshop | Switch the solenoid valve |
| 4 | SSD | msata-128 G | 128 GB, mSATA, Dimensions: 50 × 30 × 3 mm, Read speed: 455 MB/s, Write speed: 407 MB/s | Kingstone | Data storage |
| 5 | Solenoid Valve | Zero pressure/NC A05 12 V | Working pressure: 0~0.006 MPa Working voltage: 12 V Water pressure: 0~0.06 kg | YISHEN ELECTRICS | Switch valve |
| 6 | Pipe | 1/2 inch | PVC, pressure 450 psi | NAN TA Plastics Corporation | Transpose the water |
| 7 | Tank | KT-24L | H 235 mm, UID: 406 × 285 mm, UOD: 460 × 340 mm, LOD: 390 × 270 mm | Tianying Plastic | Experiment plant |
| No. | Data Collection Interval | Cleaning Time | Total Time (s) | ||
|---|---|---|---|---|---|
| 1 | 2 min | 1 h | 48 min | 11 s | 6491 |
| 2 | 4 min | 1 h | 39 min | 37 s | 5977 |
| 3 | 6 min | 1 h | 26 min | 39 s | 5199 |
| 4 | 8 min | 0 h | 48 min | 47 s | 2927 |
| FLC | Pump | |||
|---|---|---|---|---|
| Power Consumption | 10.6 | W/day | 216.0 | W/day |
| FLC: Pump Ratio = 4.9% | ||||
| Power Savings = 95.1% | ||||
| Water Consumption | 211.2 | L/day | 4800.0 | L/day |
| FLC: Pump Ratio = 4.4% | ||||
| Water Savings = 95.6% | ||||
| Feeding Times/Day | Power Savings | Water Savings |
|---|---|---|
| 1 | 95.10% | 95.60% |
| 2 | 90.20% | 91.20% |
| 4 | 80.40% | 82.40% |
| 6 | 70.70% | 73.60% |
Disclaimer/Publisher’s Note: The statements, opinions and data contained in all publications are solely those of the individual author(s) and contributor(s) and not of MDPI and/or the editor(s). MDPI and/or the editor(s) disclaim responsibility for any injury to people or property resulting from any ideas, methods, instructions or products referred to in the content. |
© 2023 by the authors. Licensee MDPI, Basel, Switzerland. This article is an open access article distributed under the terms and conditions of the Creative Commons Attribution (CC BY) license (https://creativecommons.org/licenses/by/4.0/).
Share and Cite
Li, H.-C.; Yu, K.-W.; Lien, C.-H.; Lin, C.; Yu, C.-R.; Vaidyanathan, S. Improving Aquaculture Water Quality Using Dual-Input Fuzzy Logic Control for Ammonia Nitrogen Management. J. Mar. Sci. Eng. 2023, 11, 1109. https://doi.org/10.3390/jmse11061109
Li H-C, Yu K-W, Lien C-H, Lin C, Yu C-R, Vaidyanathan S. Improving Aquaculture Water Quality Using Dual-Input Fuzzy Logic Control for Ammonia Nitrogen Management. Journal of Marine Science and Engineering. 2023; 11(6):1109. https://doi.org/10.3390/jmse11061109
Chicago/Turabian StyleLi, Hung-Chih, Ker-Wei Yu, Chang-Hua Lien, Chitsan Lin, Cheng-Ruei Yu, and Sundarapandian Vaidyanathan. 2023. "Improving Aquaculture Water Quality Using Dual-Input Fuzzy Logic Control for Ammonia Nitrogen Management" Journal of Marine Science and Engineering 11, no. 6: 1109. https://doi.org/10.3390/jmse11061109